the Creative Commons Attribution 4.0 License.
the Creative Commons Attribution 4.0 License.
 | 18 Aug 2020
Ocean acidification reduces growth and grazing impact of Antarctic heterotrophic nanoflagellates
Kai G. Schulz
Alyce Hancock
Penelope Pascoe
John McKinlay
Andrew Davidson
High-latitude oceans have been identified as particularly vulnerable to ocean acidification if anthropogenic CO2 emissions continue. Marine microbes are an essential part of the marine food web and are a critical link in biogeochemical processes in the ocean, such as the cycling of nutrients and carbon. Despite this, the response of Antarctic marine microbial communities to ocean acidification is poorly understood. We investigated the effect of increasing fCO2 on the growth of heterotrophic nanoflagellates (HNFs), nano- and picophytoplankton, and prokaryotes (heterotrophic Bacteria and Archaea) in a natural coastal Antarctic marine microbial community from Prydz Bay, East Antarctica. At CO2 levels ≥634 µatm, HNF abundance was reduced, coinciding with increased abundance of picophytoplankton and prokaryotes. This increase in picophytoplankton and prokaryote abundance was likely due to a reduction in top-down control of grazing HNFs. Nanophytoplankton abundance was elevated in the 634 µatm treatment, suggesting that moderate increases in CO2 may stimulate growth. The taxonomic and morphological differences in CO2 tolerance we observed are likely to favour dominance of microbial communities by prokaryotes, nanophytoplankton, and picophytoplankton. Such changes in predator–prey interactions with ocean acidification could have a significant effect on the food web and biogeochemistry in the Southern Ocean, intensifying organic-matter recycling in surface waters; reducing vertical carbon flux; and reducing the quality, quantity, and availability of food for higher trophic levels.
- Article
(3542 KB) - Companion paper 1
- Companion paper 2
-
Supplement
(248 KB) - BibTeX
- EndNote


Oceanic uptake of anthropogenic CO2 has caused a ∼0.1 unit decline in oceanic pH since pre-industrial times (Sabine, 2004; Raven et al., 2005), with ∼40 % of this uptake occurring in the Southern Ocean (Takahashi et al., 2012; Frölicher et al., 2015). In addition, the low overall water temperature and naturally low CaCO3 saturation state of the Southern Ocean make it particularly vulnerable to ocean acidification (Orr et al., 2005; McNeil and Matear, 2008). Close to the Antarctic continent, Southern Ocean waters are regions of high productivity that provide an essential food source for the abundance of life in Antarctica (Arrigo et al., 2008). In recent decades, these waters have seen reductions in pH (Roden et al., 2013), and it is crucial that we understand the impact of ocean acidification projections on the base of this essential food web. While large phytoplankton, such as diatoms and dinoflagellates, are often believed to be responsible for most of the energy transfer to higher trophic levels in this region, picophytoplankton, prokaryotes, mixotrophic phytoflagellates, microheterotrophs, and heterotrophic nanoflagellates (HNFs) also play important roles in grazing and biogeochemical element cycling (Azam et al., 1991; Sherr and Sherr, 2002; Smetacek et al., 2004).
Marine microbes are a fundamental part of the marine food web and are a critical link in biogeochemical processes, such as the cycling of nutrients and carbon (Azam and Malfatti, 2007). Globally, it is estimated that ∼80 %–100 % of daily primary production is either consumed by grazers or lost via processes such as cell lysis and sinking (Behrenfeld, 2014). Grazing can profoundly affect phytoplankton abundance in marine ecosystems, with microzooplankton consuming on average 60 %–75 % of daily primary production (Landry and Calbet, 2004) and HNF grazing between 20 % and 100 % of daily bacterial production (Safi et al., 2007; Pearce et al., 2010). Prokaryotes salvage dissolved organic matter released from phytoplankton primary production, which is returned to the food web upon grazing by HNFs (Pearce et al., 2010; Buchan et al., 2014). Prokaryotes also produce essential micronutrients and vitamins required for phytoplankton growth (Azam and Malfatti, 2007; Buchan et al., 2014; Bertrand et al., 2015) and are important in the supply of nutrients to microzooplankton in Antarctic waters over winter, when primary productivity is low (Azam et al., 1991). This transfer of organic matter between primary producers, prokaryotes, and protozoa forms the microbial loop, upon which all life in the ocean relies (Azam et al., 1983; Fenchel, 2008).
In Antarctic waters, heterotrophic flagellates make a significant contribution to the top-down control of phytoplankton and prokaryote productivity. Their growth rates can exceed that of their prey, and their grazing can significantly alter the microbial-community composition (Bjørnsen and Kuparinen, 1991; Archer et al., 1996; Pearce et al., 2010). Despite their importance in marine ecosystems, their response to ocean acidification remains largely unstudied (Caron and Hutchins, 2013). Of the few studies that have included heterotrophic flagellates, most have focused on the larger microzooplankton community (20–200 µm), reporting no changes in abundance or grazing rates with elevated CO2 (Suffrian et al., 2008; Aberle et al., 2013; Davidson et al., 2016). However, indirect effects of ocean acidification on microzooplankton have been observed through changes in the abundance and composition of their prey (Rose et al., 2009b). Difficulties in identification of HNFs in natural seawater samples have no doubt contributed to the scarcity of published studies on this group (Rose et al., 2004). A negative effect of increased CO2 on HNF abundance was observed in a previous Antarctic mesocosm study, which the authors suggest led to a reduction in grazing mortality of picophytoplankton and prokaryotes (Thomson et al., 2016). In the present mesocosm study, Hancock et al. (2018a) reported species-specific responses to ocean acidification amongst choanoflagellate species (bacterivorous HNFs), exposing a hitherto unrecognised layer of complexity to predicting the effects of ocean acidification on microbial communities.
A global assessment of ocean acidification studies by Schulz et al. (2017) reported a general trend toward increased abundance of picophytoplankton with declining ocean pH. The cyanobacterium Synechococcus and picoeukaryotes in the prasinophyte class were identified as the key beneficiaries of increased CO2, possibly through downregulation of energetically costly CO2 and transporters (carbon concentrating mechanisms, CCMs) as CO2 concentration increased in the relatively small diffusive boundary layer of these small cells (Beardall and Giordano, 2002). Unlike temperate oligotrophic ecosystems, cyanobacteria are very rare in Antarctic waters, so the picophytoplankton community south of the polar front is composed largely of eukaryotes (Wright et al., 2009; Lin et al., 2012; Flombaum et al., 2013; Liang et al., 2016). In this region, picophytoplankton can comprise up to 33 % of total phytoplankton biomass (Wright et al., 2009; Lin et al., 2012). In coastal Antarctic waters, the abundance of picoeukaryotes was found to increase with elevated CO2 concentration (Thomson et al., 2016). However, the authors suggested that this was likely due to a reduction in top-down control of the HNF community rather than direct promotion of their growth. In a companion paper to the present study, Deppeler et al. (2018a) reported a downregulation of extracellular CCM activity in phytoplankton cells <10 µm in size at high CO2 levels, but it is not known whether this resulted in a concurrent increase in productivity for this size group as primary productivity measurements were performed on the whole community. Overall, primary productivity rates were significantly reduced in high-CO2 treatments (≥1140 µatm), suggesting that CO2 was not beneficial for phytoplankton growth at these levels.
Studies investigating natural marine microbial communities have shown that prokaryotes are tolerant to ocean acidification and have found little CO2-induced effect on their abundance or productivity (Grossart et al., 2006; Allgaier et al., 2008; Paulino et al., 2008; Wang et al., 2016). Prokaryote abundance and production are generally linked to increased primary production, with peaks in abundance often occurring immediately after the peak of a phytoplankton bloom (Pearce et al., 2007; Buchan et al., 2014). This is likely due to an increase in availability of dissolved organic matter, released by phytoplankton during growth, viral lysis, or bacterial degradation of dead cells (Azam and Malfatti, 2007). A CO2-induced increase in the production of organic matter and the formation of transparent exopolymer particles by phytoplankton were reported in a mesocosm study in a Norwegian fjord (Endres et al., 2014). This promoted bacterial abundance and stimulated enzyme production for organic-matter degradation, suggesting that ocean acidification may increase the flow of carbon through the microbial loop in surface waters. Shifts in prokaryote community composition have also been reported, although with no significant change in total prokaryote abundance (Roy et al., 2013; Zhang et al., 2013; Bergen et al., 2016). Despite the apparent resilience of prokaryotes to ocean acidification, several authors suggest they may be indirectly affected by changes in substrate availability due to changes in phytoplankton composition and abundance (e.g. Piontek et al., 2010; Celussi et al., 2017). Given the critical role of heterotrophic prokaryotes in remineralisation and carbon flux, it is vital to better understand the direct and indirect effects of ocean acidification on their communities.
A natural community of marine microbes from Prydz Bay, East Antarctica, was exposed to fCO2 levels up to 1641 µatm in 650 L minicosms during the 2014/2015 austral summer. In the present study, the abundance of HNFs, nanophytoplankton (2–20 µm), picophytoplankton (0.2–2 µm), and heterotrophic prokaryotes was measured by flow cytometry to determine whether CO2 had an effect on the growth rate and abundance of each of these microbial groups and whether predator–prey interactions between these communities could be inferred. A range of additional measurements were also taken during this 18 d study, of which many findings have been published elsewhere (Deppeler et al., 2018a; Hancock et al., 2018a; Petrou et al., 2019). These studies reported that high CO2 levels caused reductions in photosynthetic performance, primary productivity, and particulate organic-matter production (Deppeler et al., 2018a); decreased abundance of microplanktonic diatoms (>20 µm) and Phaeocystis antarctica (Hancock et al., 2018a); and reduced diatom silicification (Petrou et al., 2019). In contrast, there was no CO2-induced effect on bacterial productivity (Deppeler et al., 2018a) or the abundance of nano-sized diatoms, which were dominated by Fragilariopsis sp. (≤20 µm; Hancock et al., 2018a). Henceforth, these studies will be referred to as “coincident studies”. A previous minicosm study took place at the same location over the 2008/2009 austral summer (henceforth referred to as “complementary studies”; Davidson et al., 2016; Thomson et al., 2016; Westwood et al., 2018). We utilised a similar experimental design to this previous minicosm study but added an initial CO2 acclimation period at low light to determine whether this acclimation would alter the response previously reported.
2.1 Minicosm
A natural microbial assemblage from Prydz Bay, East Antarctica, was incubated in six 650 L polythene tanks (minicosms) and exposed to six CO2 treatments: ambient (343 µatm) as well as 506, 634, 953, 1140, and 1641 µatm. Before commencement of the experiment, all minicosms were acid-washed with 10 % vol : vol HCl (AR grade, Sigma Aldrich), rinsed thoroughly with Milli-Q water, and finally rinsed with seawater from the sampling site. Seawater to fill the minicosms was collected from amongst the decomposing fast ice in Prydz Bay at Davis Station, Antarctica (68∘35′ S, 77∘58′ E), on 19 November 2014. A 7000 L polypropylene reservoir tank was filled by helicopter, using multiple collections in a thoroughly rinsed 720 L Bambi Bucket. The seawater was then gravity-fed from the reservoir to the minicosms through a Teflon-lined hose fitted with a 200 µm pore-size Arkal filter to exclude metazooplankton that would significantly graze the microbial community. Microscopic analysis showed that very few metazooplankton and nauplii passed through the pre-filter, and they were seldom observed throughout the experiment (see Hancock et al., 2018a). Thus, it is unlikely that their grazing affected the CO2-induced trends in community composition in our study. All minicosms were filled simultaneously to ensure uniform distribution of microbes.
The six minicosms were housed in a temperature-controlled shipping container, with the water temperature in each minicosm maintained at 0.0±0.5 ∘C. The temperature in each minicosm was maintained by offsetting the cooling of the shipping container against warming of the tank water with two 300 W Fluval aquarium heaters connected via CAREL temperature controllers and a temperature control program. Each minicosm was sealed with an acrylic lid, and the water was gently mixed by a shielded high-density polyethylene auger, rotating at 15 rpm.
Minicosms were illuminated by two 150 W HQI-TS (Osram) metal halide lamps on a 19:5 h light : dark cycle. Low-intensity light (0.9±0.22 µmol photons m−2 s−1) was provided for the first 5 d to slow phytoplankton growth while the CO2 levels were gradually raised to the target concentration for each minicosm (see below). Following this 5 d CO2 acclimation period, light was progressively increased over 2 d to a final light intensity of 90.5 ± 21.5 µmol photons m−2 s−1. The microbial assemblages were then incubated for 10 d, with samples taken at regular intervals (see below) and no further addition of nutrients or seawater (except for the small volume required for carbonate chemistry modification; see below). For further details on minicosm setup see Deppeler et al. (2018a).
2.2 Carbonate chemistry calculation and manipulation
Carbonate chemistry was measured throughout the experiment, allowing the fugacity of CO2 (fCO2) to be manipulated to the desired values over the first 5 d of acclimation and then maintained for the remainder of the experiment. Samples were taken daily from each minicosm in 500 mL glass-stoppered bottles (Schott Duran) following the guidelines of Dickson et al. (2007), with subsamples for dissolved inorganic carbon (DIC; 50 mL glass-stoppered bottles) and pH on the total scale (pHT; 100 mL glass stoppered bottles) gently pressure-filtered (0.2 µm) following Bockmon and Dickson (2014). For each minicosm, DIC was measured in triplicate by infrared absorption on an Apollo SciTech AS-C3 analyser equipped with a LI-COR LI-7000 detector calibrated with five prepared sodium carbonate standards (Merck Suprapur) and daily measurements of a certified reference material batch CRM127 (Dickson, 2010). DIC measurements were converted to micromoles per kilogram using calculated density from known sample temperature and salinity.
Measurements of pHT were performed using the pH indicator dye m-cresol purple (Acros Organics) following Dickson et al. (2007) and measured by a GBC UV–vis 916 spectrophotometer at 25 ∘C in a 10 cm thermostated cuvette. A syringe pump (Tecan Cavro XLP 6000) was used for sample delivery, dye addition, and mixing to minimise contact with air. An offset for dye impurities and instrument performance (+0.003 pH units) was determined through measurement of pHT of CRM127 and comparison with the calculated pHT from known DIC and total alkalinity (TA), including silicate and phosphate. Salinity was measured in situ using a WTW197 conductivity meter and used with measured DIC and pHT to calculate practical alkalinity (PA) at 25 ∘C, using the dissociation constants for carbonic acid determined by Mehrbach et al. (1973) and Lueker et al. (2000). Total carbonate chemistry speciation was then calculated for in situ temperature conditions from measured DIC and calculated PA.
During the acclimation period, the fCO2 in each minicosm was adjusted daily in increments until the target level was reached, after which fCO2 was kept as constant as possible for the remainder of the experiment. Measurements of pH were performed twice daily – in the morning (before sampling) and the afternoon – using a portable, NBS-calibrated probe (METTLER TOLEDO) to determine the amount of DIC to be added to the minicosm. Adjustment of the fCO2 in each minicosm was performed by addition of a calculated volume of 0.2 µm filtered CO2-saturated natural seawater to 1000 mL infusion bags and drip-feeding into the minicosms at ∼50 mL min−1. One minicosm was maintained close to the fCO2 of the initial (ambient) seawater (343 µatm) and was used as the control treatment, against which the effects of elevated fCO2 were measured. The mean fCO2 levels in the other five minicosms were 506, 634, 953, 1140, and 1641 µatm. For further details of the carbonate chemistry sampling methods, calculations, and manipulation see Deppeler et al. (2018a).
2.3 Nutrient analysis
Concentrations of the macronutrients nitrate plus nitrite (NOx), soluble reactive phosphorus (SRP), and molybdate reactive silica (silicate) were measured in each minicosm during the experiment. Samples were taken on days 1, 3, and 5 during the CO2 acclimation period and every 2 d for the remainder of the experiment (days 8–18). Samples were obtained following the protocol of Davidson et al. (2016). Seawater samples were filtered through 0.45 µm Sartorius filters into 50 mL Falcon tubes and frozen at −80 ∘C for analysis in Australia. Determination of the concentration of NOx, SRP, and silicate was performed by Analytical Services Tasmania using flow injection analysis.
2.4 Flow cytometry
Flow cytometric analyses were performed daily to determine the abundance of small protists (HNFs, pico- and nanophytoplankton, and prokaryotes) in each minicosm during the experiment. Samples were pre-filtered through a 50 µm mesh (NITEX), stored in the dark at 4 ∘C, and analysed within 6 h of collection following Thomson et al. (2016). Samples were analysed using a Becton Dickinson FACScan flow cytometer until day 15, after which the instrument broke down, and analysis was performed on a Becton Dickinson FACSCalibur. Both instruments were fitted with a 488 nm laser, and Milli-Q water was used as sheath fluid for all analyses. PeakFlow Green 2.5 µm beads (Invitrogen) were added to samples as an internal fluorescence and size standard. Final cell numbers were calculated from event counts on bivariate scatter plots divided by the analysed volume.
The analysed volume for each flow cytometer was calibrated by measuring the weight change of 1 mL seawater run for 1, 2, 3, 4, 5, and 10 min at high and low flow settings on each instrument. This weight change was converted to millilitres by dividing by 1.027, the density of seawater at 4 ∘C with a salinity of 34.3 PSU (Table S1 in the Supplement). A linear regression was fitted to each data set, and the analysed sample volume was determined by entering the sample run time (x) into the equations (Table S2). Average flow rates in millilitres per minute for each instrument at both flow settings were determined by dividing each analysed volume by the run time. The standard deviation for all mean flow rates on both instruments was <0.004. Details of instrument flow rates and equations for flow cytometry counts can be found in Table S2.
2.4.1 Pico- and nanophytoplankton abundance
Three pseudo-replicate 1 mL samples for pico- and nanophytoplankton abundance were prepared from each minicosm seawater sample. Each sample was placed in a beaker of ice and run for 3 min at a high flow rate of 36.5 µL min−1 for the FACScan and 67.2 µL min−1 for the FACSCalibur, resulting in an analysed volume of 0.1140 and 0.2036 mL, respectively. Phytoplankton populations were separated into regions based on their chlorophyll autofluorescence in bivariate scatter plots of red (FL3) versus orange fluorescence (FL2; Fig. 1a). The pico- and nanophytoplankton communities were determined from relative cell size in side scatter (SSC) versus FL3 fluorescence bivariate scatter plots (Fig. 1b). Cyanobacteria, which have high orange and low red fluorescence due to the presence of phycoerythrin, were not evident in FL3 versus FL2 scatter plots and were deemed absent in this study. Final cell counts in cells per litre were calculated from event counts in the phytoplankton regions and analysed volume.

Figure 1Nano- and picophytoplankton regions identified by flow cytometry. (a) Two separate regions identified based on red (FL3) versus orange (FL2) fluorescence scatter plots. (b) Picophytoplankton (R1) and nanophytoplankton (R2) communities determined from side scatter (SSC) versus FL3 fluorescence scatter plots. PeakFlow Green 2.5 µm beads (R3) were used as fluorescence and as a size standard.
2.4.2 Heterotrophic nanoflagellate abundance
Heterotrophic nanoflagellate (HNF) abundance was determined using LysoTracker Green (Invitrogen) staining following the protocol of Thomson et al. (2016). A 1:10 working solution of LysoTracker Green was prepared daily by diluting the commercial stock into 0.22 µm filtered seawater. For each minicosm sample, 10 mL of seawater was stained with 7.5 µL of working solution to a final stain concentration of 75 nM. Stained samples were then incubated in the dark on ice for 10 min. Triplicate 1 mL subsamples were taken from the stained sample and run for 10 min at a high flow rate of 36.5 µL min−1 for the FACScan and 67.2 µL min−1 for the FACSCalibur, resulting in an analysed volume of 0.4043 and 0.7006 mL, respectively.
LysoTracker-Green-stained HNF abundances were determined in green fluorescence (FL1) versus forward-scatter (FSC) plots after removal of phytoplankton and detritus particles following Rose et al. (2004) and Thomson et al. (2016) and shown in Fig. 2. Phytoplankton were identified by high chlorophyll autofluorescence in bivariate scatter plots of FL3 versus FSC fluorescence (Fig. 2a), and detritus was identified by high SSC in FL1 fluorescence versus SSC plots (Fig. 2b). HNF abundance was then determined in a bivariate plot of FL1 fluorescence versus FSC, with phytoplankton and detritus particles removed. Mixotrophic species would have been excluded from HNF counts due to their chlorophyll fluorescence in FL3 versus FSC plots. Remaining particles larger than the 2.5 µm PeakFlow Green beads were counted as HNFs (Fig. 2d). Final cell counts in cells per litre were calculated from event counts and analysed volume.
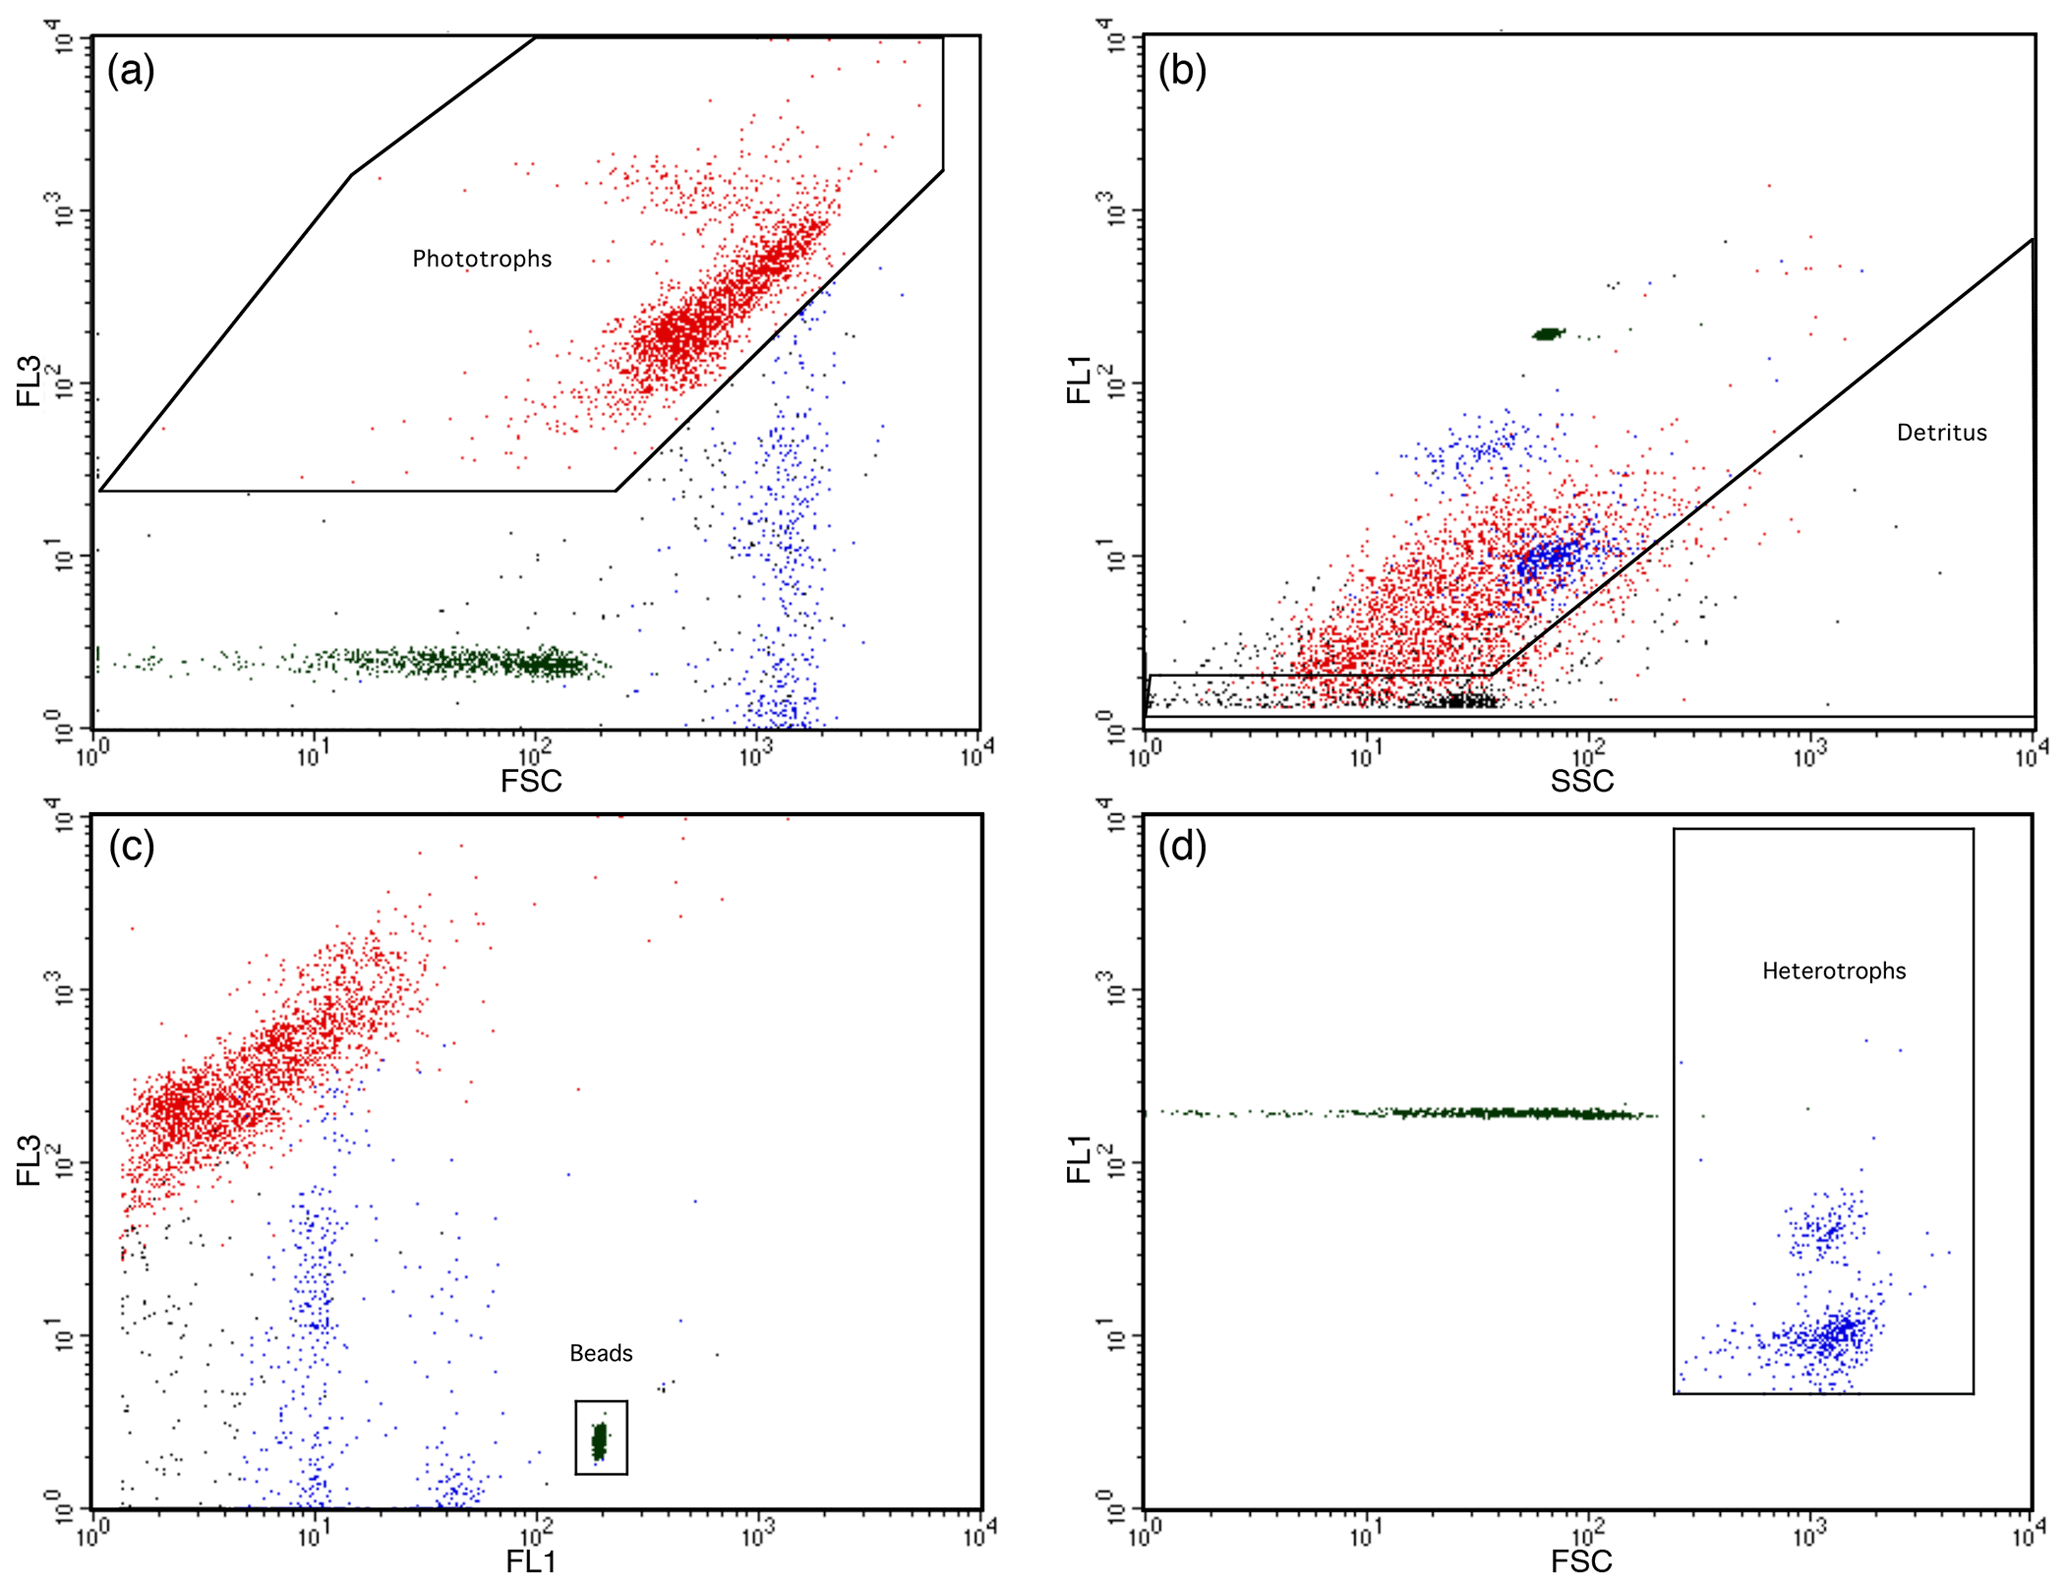
Figure 2LysoTracker-Green-stained heterotrophic nanoflagellates identified by flow cytometry. (a) Phytoplankton identified based on red (FL3) versus forward-scatter (FSC) fluorescence scatter plots. (b) Detritus particles identified from high side scatter (SSC) versus LysoTracker Green fluorescence (FL1). (c) PeakFlow Green 2.5 µm beads identified from high FL1 versus FL3 fluorescence. (d) Phytoplankton and detritus from panels (a) and (b) removed from the FL1 and FSC plots and remaining LysoTracker-Green-stained particles >2.5 µm were counted as heterotrophic nanoflagellates.
2.4.3 Prokaryote abundance
Prokaryote abundance measurements related to heterotrophic prokaryotes only as autotrophic prokaryotes were not present in the minicosms (see above). Samples for prokaryote abundance were stained for 20 min with 1:10 000 dilution of SYBR Green I (Invitrogen) following Marie et al. (2005). Three pseudo-replicate 1 mL samples were prepared from each minicosm seawater sample and were run for 3 min at a low flow rate of 7.5 µL min−1 for the FACScan and 15.6 µL min−1 for the FACSCalibur, resulting in an analysed volume of 0.0254 and 0.0478 mL, respectively. Prokaryote abundance was determined from SSC versus FL1 fluorescence bivariate scatter plots (Fig. 3). Final cell counts in cells per litre were calculated from event counts and analysed volume. High background noise was observed on the flow cytometer on day 1, likely due to suspended detritus from when the minicosm tanks were filled, which obscured cell counts at this time. Background interference had cleared on day 2, allowing analysis to start from this day.
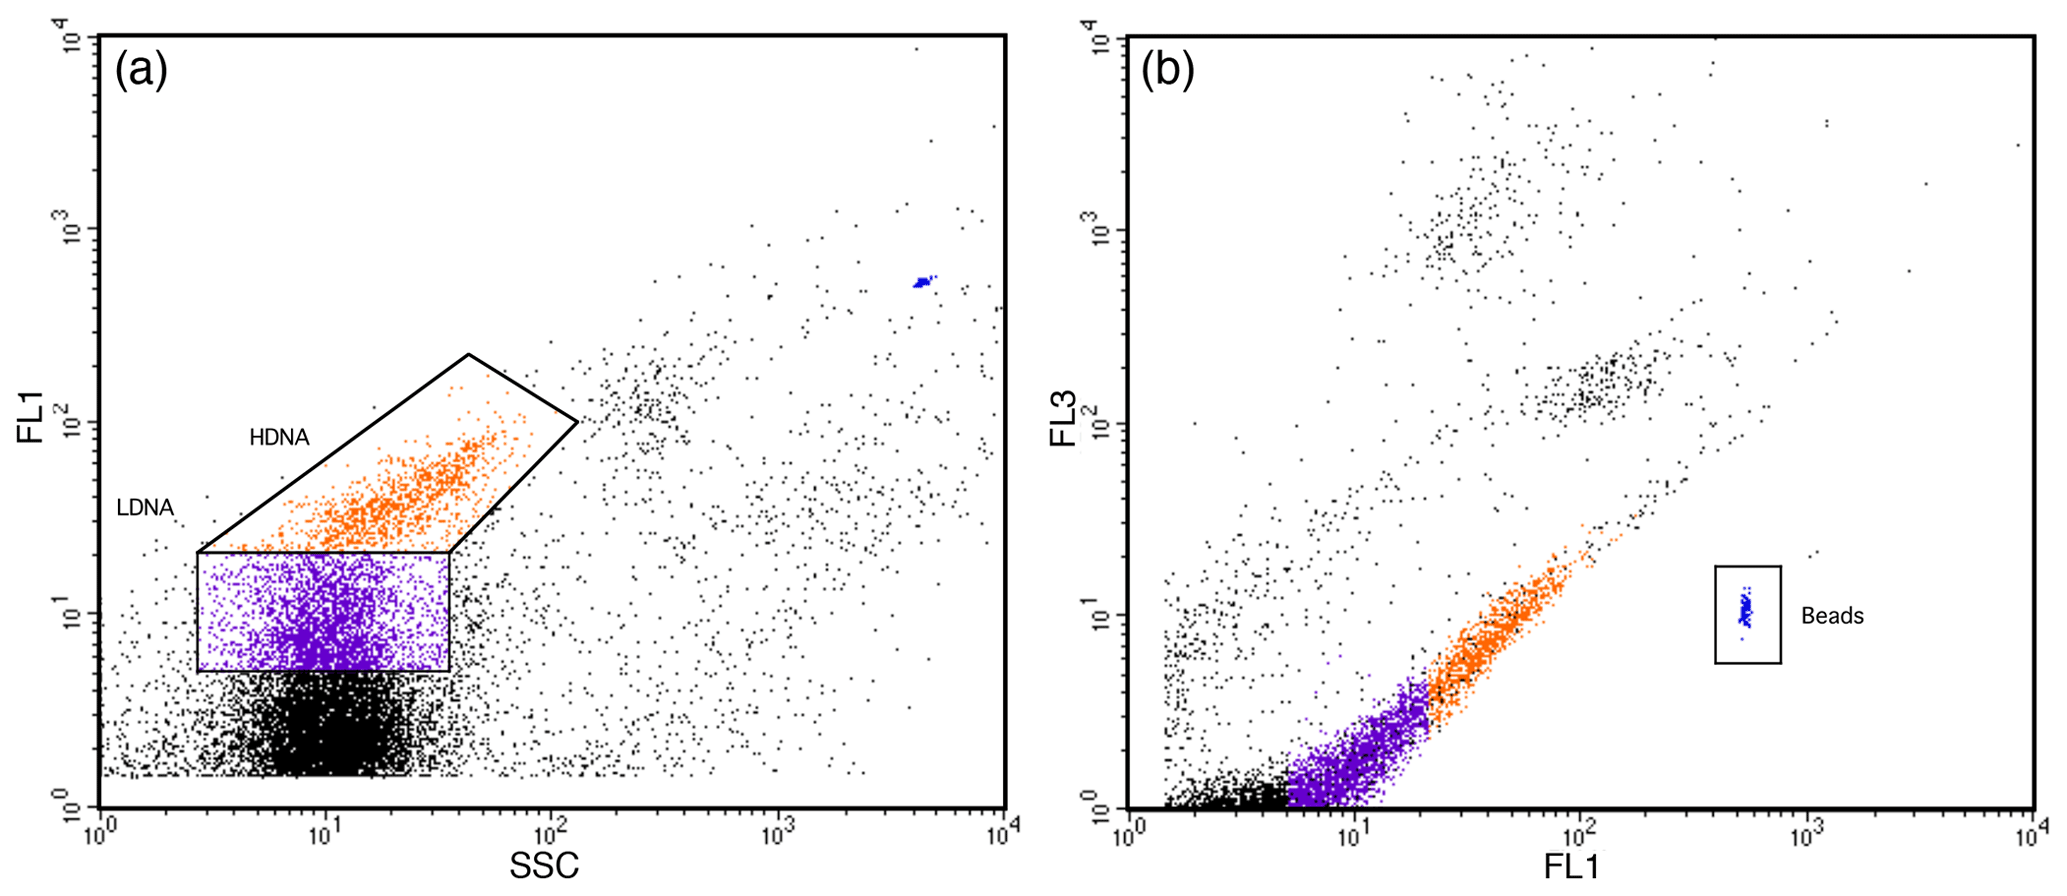
Figure 3Prokaryote regions identified by flow cytometry. (a) SYBR-Green I-stained high-DNA (HDNA) and low-DNA (LDNA) prokaryote regions identified from side scatter (SSC) versus green fluorescence (FL1) scatter plots. (b) Prokaryote cells determined from high FL1 versus low red (FL3) fluorescence. PeakFlow Green 2.5 µm beads were used as fluorescence and as a size standard.
2.5 Statistical analysis
Microbial-community growth in the minicosms was measured in six unreplicated CO2 treatments, and thus triplicate subsamples from individual minicosms represent within-treatment pseudo-replicates. Therefore, means and standard error of these pseudo-replicate samples only provide the within-treatment sampling variability for each procedure. For the purpose of analysis, we treated pseudo-replicates as independent to provide an informal assessment of the difference among treatments.
A generalised additive model (GAM) was fitted to each CO2 treatment over time to visually assess temporal changes in the abundance of each microbial group using the mgcv and ggplot2 packages in R (Wood, 2011; R Core Team, 2019; Wickham, 2016). Taking into account the pseudo-replicated sampling method, further statistical analysis of these curves was not performed. For growth rate analysis, a linear regression model was fitted on natural log-transformed data for each CO2 treatment over the incubation period, during which each microbial group sustained steady-state logarithmic growth. Growth rates for each treatment were determined from the slope estimate of the linear model. An omnibus test of differences between the linear models for each CO2 treatment was assessed by ANOVA to determine significant differences between the growth trends for each microbial group. The lack of replication in our study and limited number of time points at which each minicosm was sampled mean that the trends within treatments are indicative, and the statistical differences among treatments should be interpreted conservatively. The significance level for all tests was set at <0.05.
3.1 Carbonate chemistry
The carbonate chemistry of the initial seawater was measured as a pHT and DIC of 8.08 and 2187 µmol kg−1, respectively, resulting in a calculated fCO2 of 356 µatm and a PA of 2317 µmol kg−1 (Figs. 4, S1 in the Supplement; Table S1). Measurements of carbonate chemistry during the acclimation period showed a stepwise increase in fCO2, after which the CO2 level remained largely constant, with treatments ranging from 343 to 1641 µatm and a pHT range from 8.10 to 7.45 (Fig. 4; Table 1). Some decline in fCO2 was observed in the high-CO2 treatments towards the end of the experiment, indicating that the addition of CO2-saturated seawater was insufficient to fully compensate for its out-gassing into the headspace and drawdown by phytoplankton photosynthesis.
Table 1Mean carbonate chemistry conditions in minicosms.
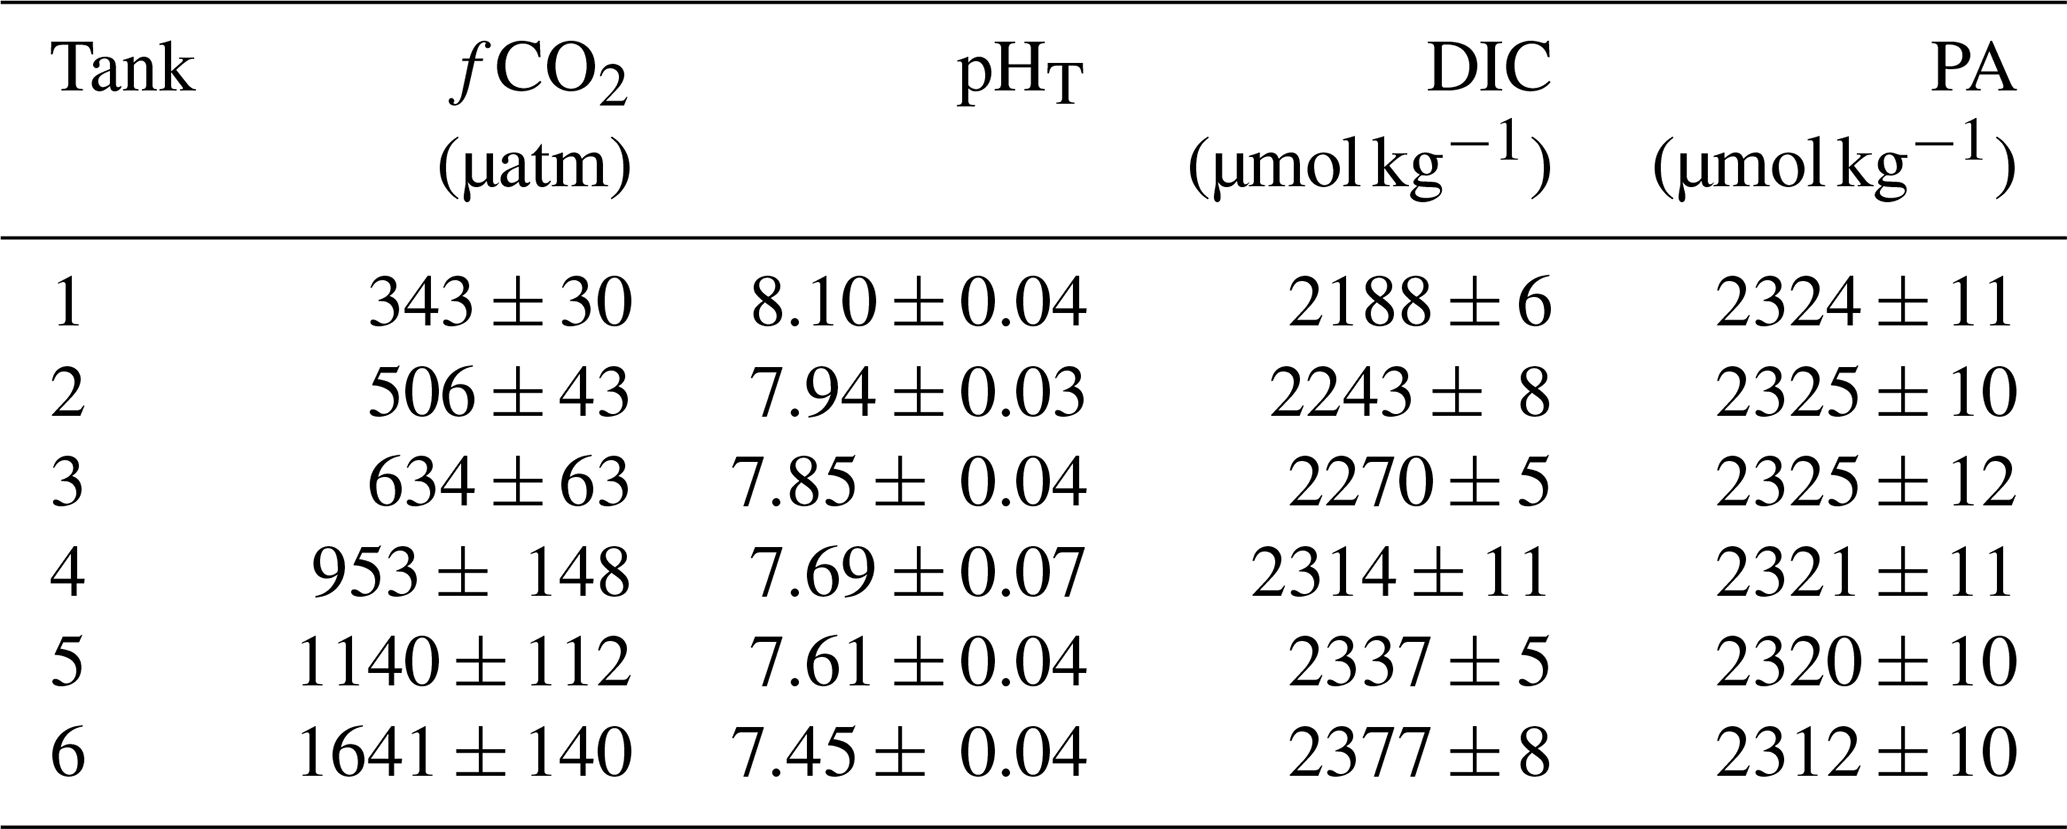
Data are mean ± 1 standard deviation of triplicate pseudo-replicate measurements. fCO2: fugacity of CO2; pHT: pH on the total scale; DIC: dissolved inorganic carbon; PA: practical alkalinity.
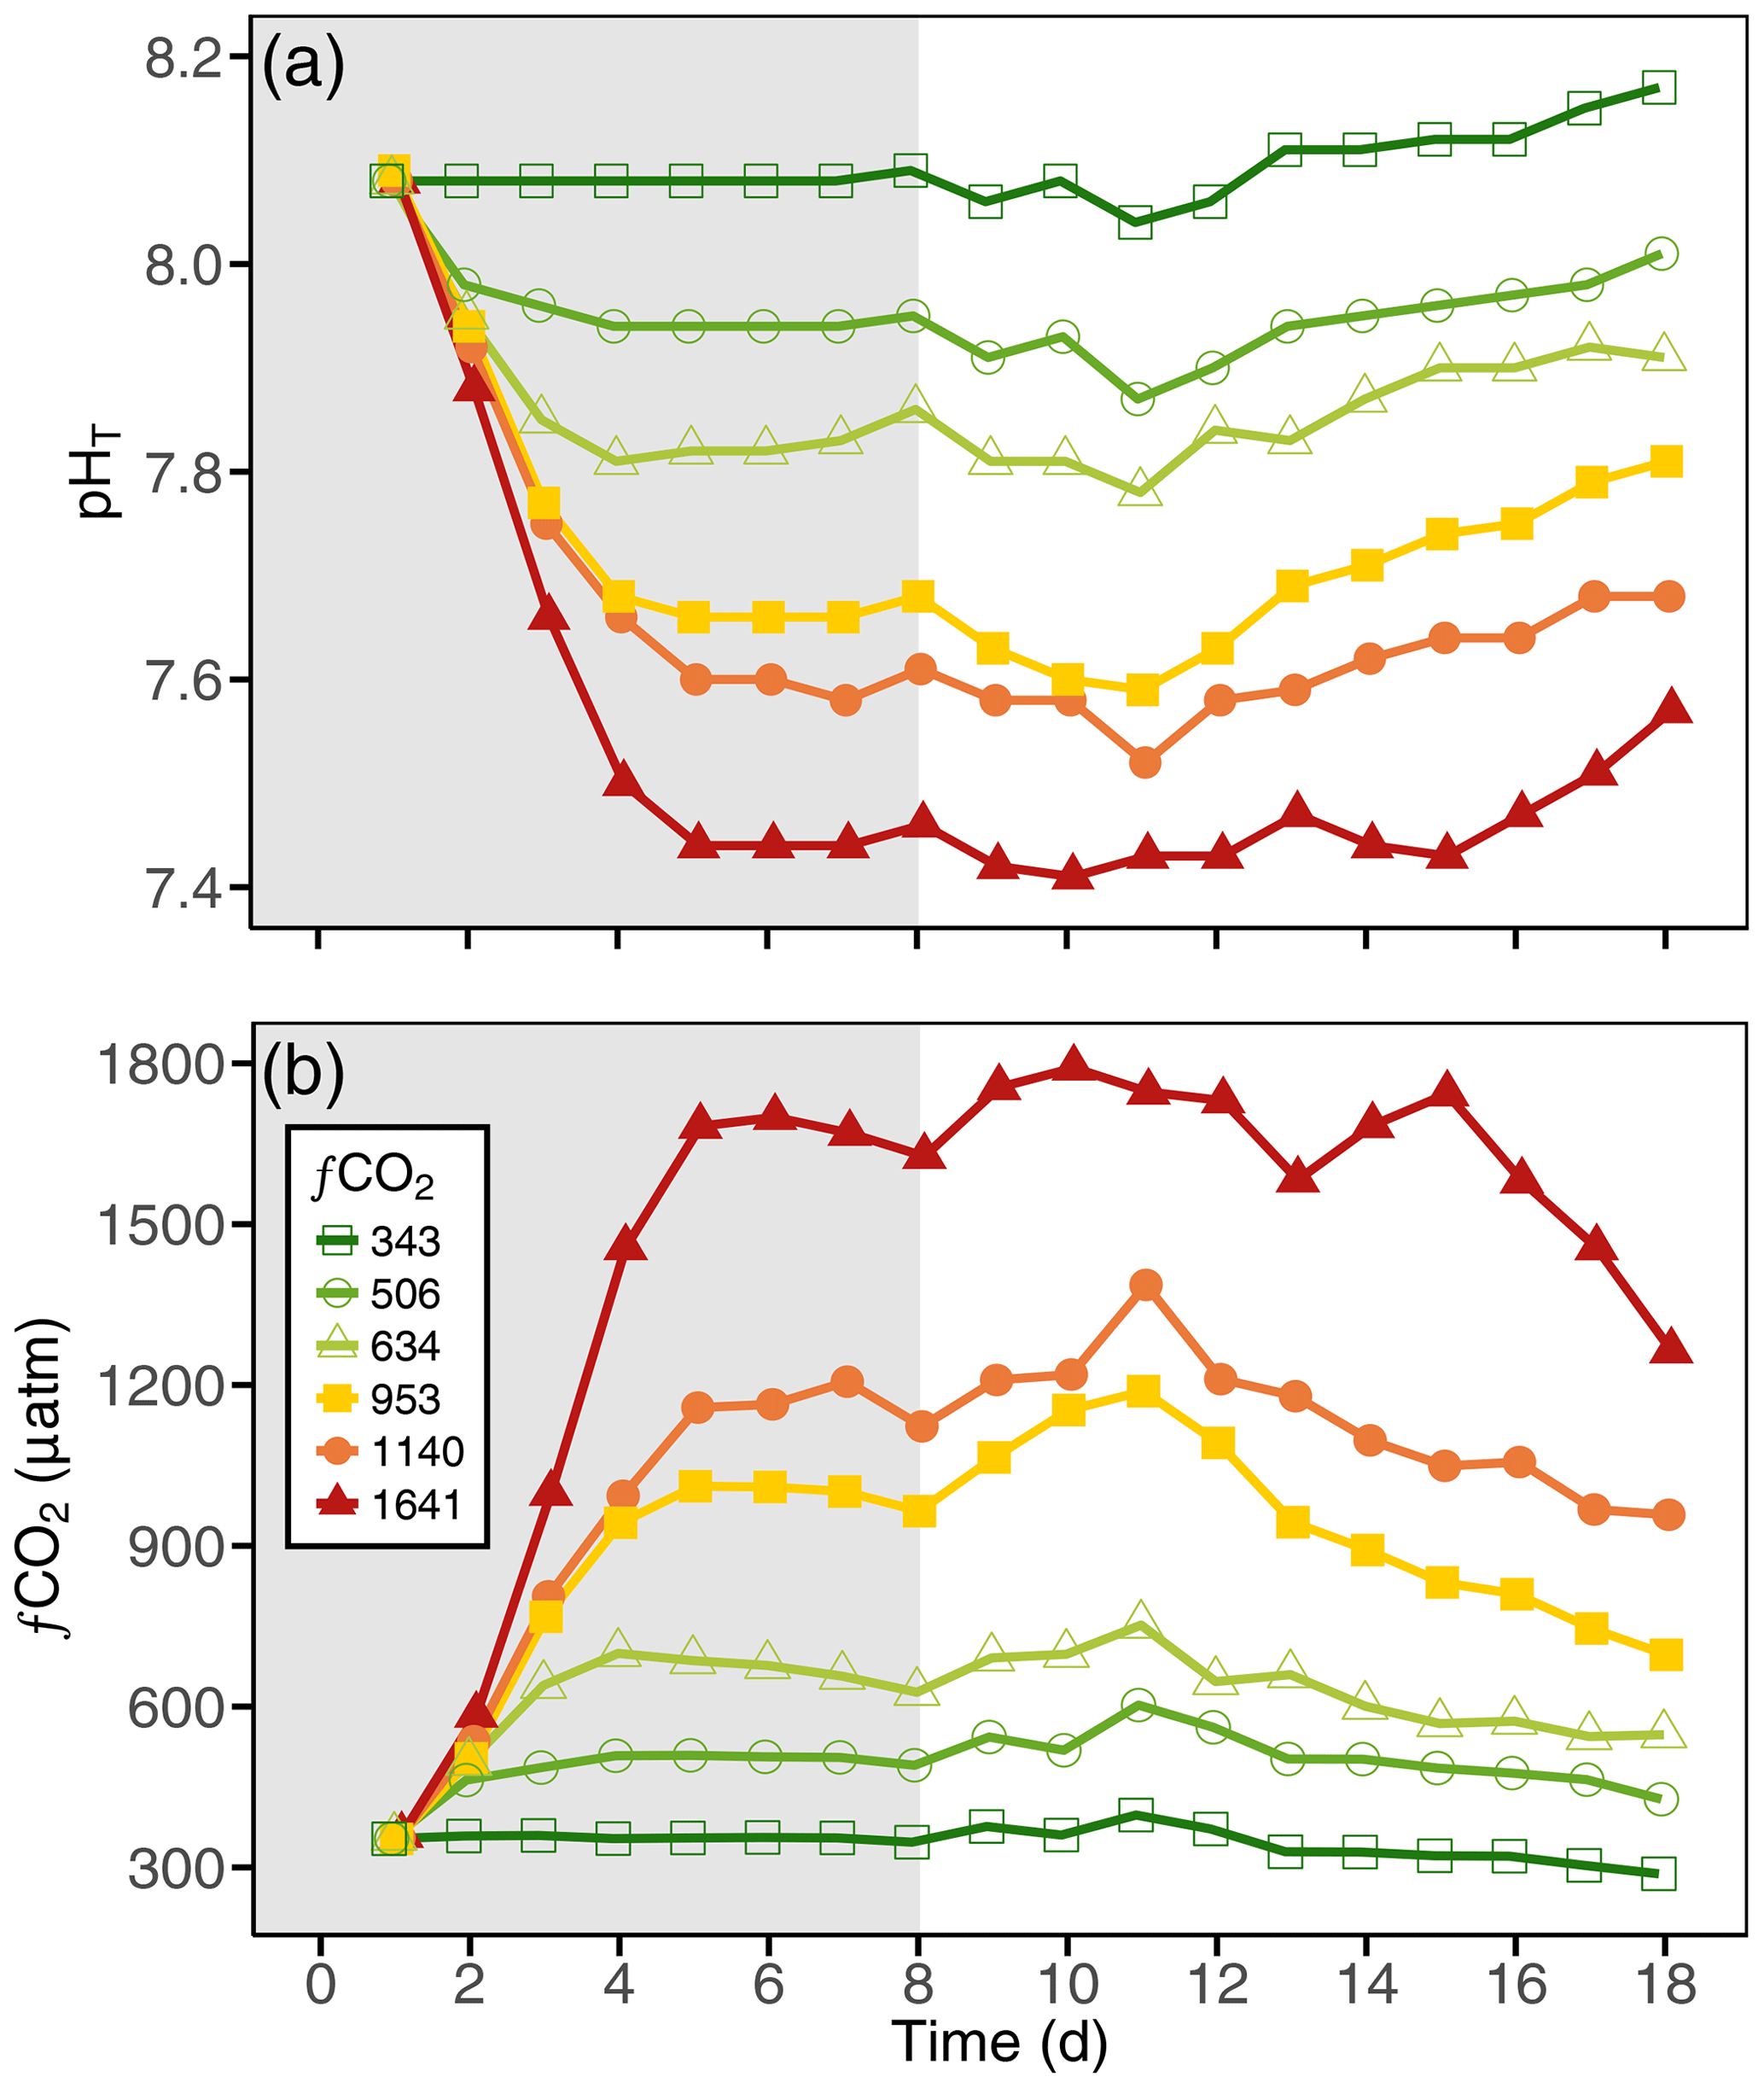
Figure 4The (a) pH on the total scale (pHT) and (b) fugacity of CO2 (fCO2) carbonate chemistry conditions in each of the minicosm treatments over time. Grey shading indicates CO2 and light acclimation period.
3.2 Nutrients
There was little variance in nutrient concentrations among all treatments at the start of the experiment (Table S1). Concentrations of NOx fell from 26.2±0.74 µM on day 8 to below detection limits on day 18 (Fig. 5a), with the 1641 µatm treatment being drawn down the slowest. SRP concentrations were drawn down in a similar manner as NOx, falling from 1.74±0.02 to 0.13±0.03 µM on day 18 in all treatments (Fig. 5b). Silicate was replete throughout the experiment in all treatments, with initial concentrations of 60.0±0.91 µM falling to 43.6±2.45 µM (Fig. 5c). Silicate drawdown was highest in the 634 µatm and lowest in the 1641 µatm treatment.

Figure 5Nutrient concentration in each of the minicosm treatments over time. (a) Nitrate + nitrite (NOx), (b) soluble reactive phosphorus (SRP), and (c) molybdate reactive silica (silicate). Grey shading indicates CO2 and light acclimation period.
3.3 Picophytoplankton abundance
Picophytoplankton abundance did not change during the CO2 acclimation period, remaining at cells L−1. Cell numbers increased in all treatments from day 8, with treatments ≤506 µatm peaking on day 12 and all higher-CO2 treatments continuing to grow until day 13 (Fig. 6a). Steady-state logarithmic growth rates were calculated between days 8 and 12 (Fig. S2) and are presented in Table 2. The omnibus test of trends in fCO2 treatment over time for picophytoplankton steady-state growth indicated that there was a significant difference between treatments (, p<0.01; Table S3). Examining the significance of the individual linear model terms indicated that only the 953 µatm growth rate was significantly different to the control (p<0.01; Table 3), with a higher growth rate of 0.32 d−1 (Table 2). Despite the similarity in growth rates among treatments, there was a difference between peak abundances. The highest were observed in the 953 and 1641 µatm treatments, which reached cells L−1 (Fig. 6a). The 634 and 1140 µatm treatments peaked slightly lower, at cells L−1, and following this, the control (343 µatm) and 506 µatm treatments peaked at and cells L−1, respectively. After reaching their peak, cell numbers rapidly declined in all treatments until day 18, falling to cells L−1. The 506 µatm treatment was excluded from analysis on day 18 due to high background noise on the flow cytometer, which caused artificially elevated counts.
Table 2Steady-state logarithmic growth rates in fCO2 treatments.
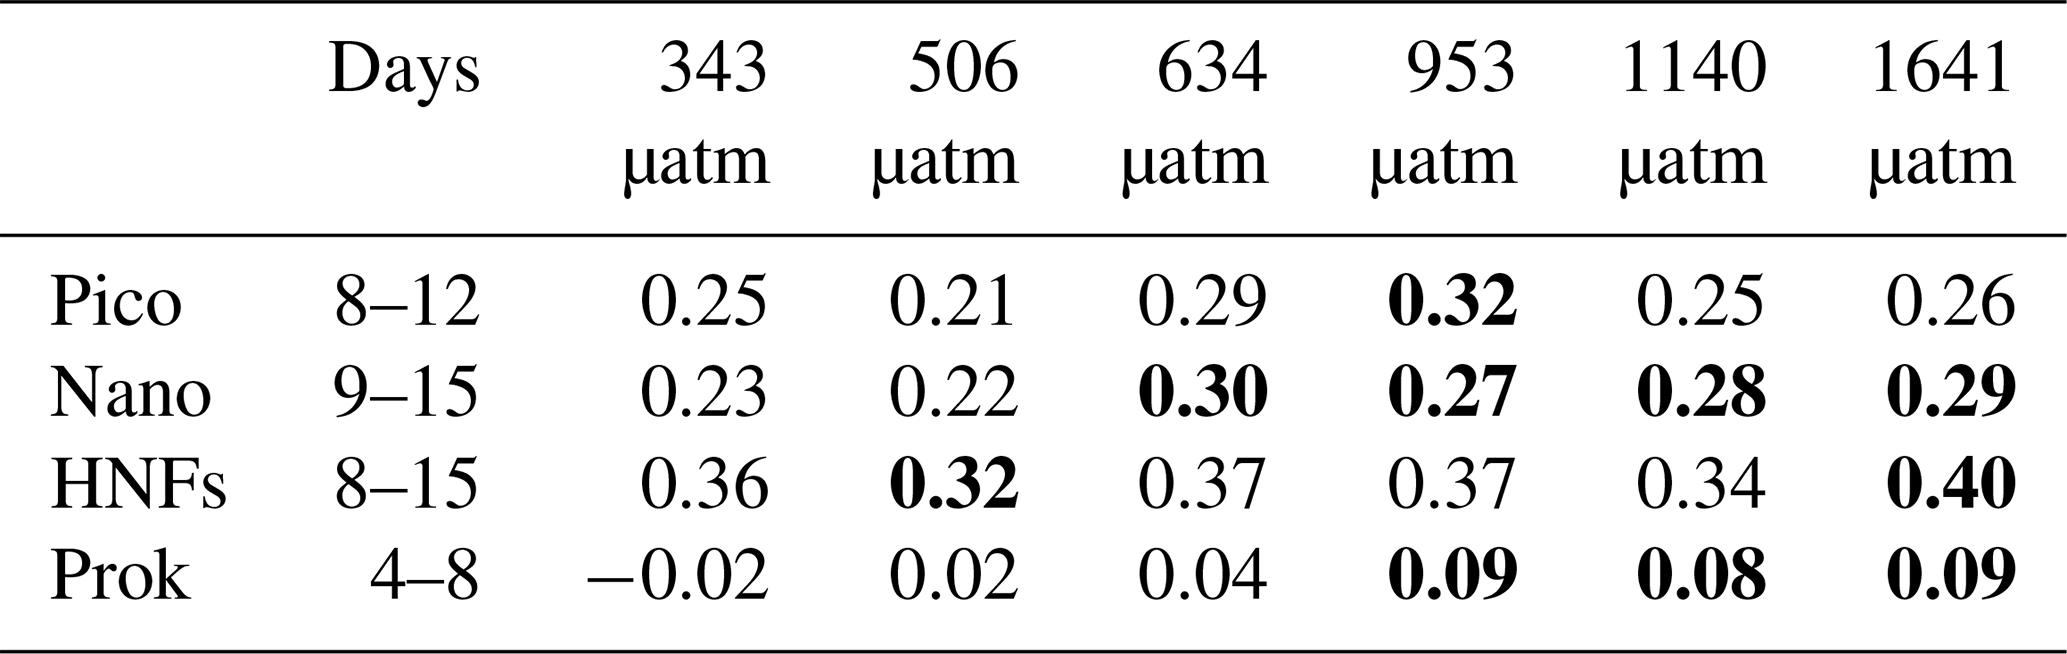
Bold text denotes treatments with trends in steady-state logarithmic growth significantly different to the control (343 µatm, p<0.05; shown in Table 3). Days: days from which the linear regression for growth rates was modelled (shown in Fig. S2); pico: picophytoplankton; nano: nanophytoplankton; HNFs: heterotrophic nanoflagellates; prok: prokaryotes.
Table 3ANOVA results comparing trends in steady-state logarithmic growth for each fCO2 treatment over time against the control.
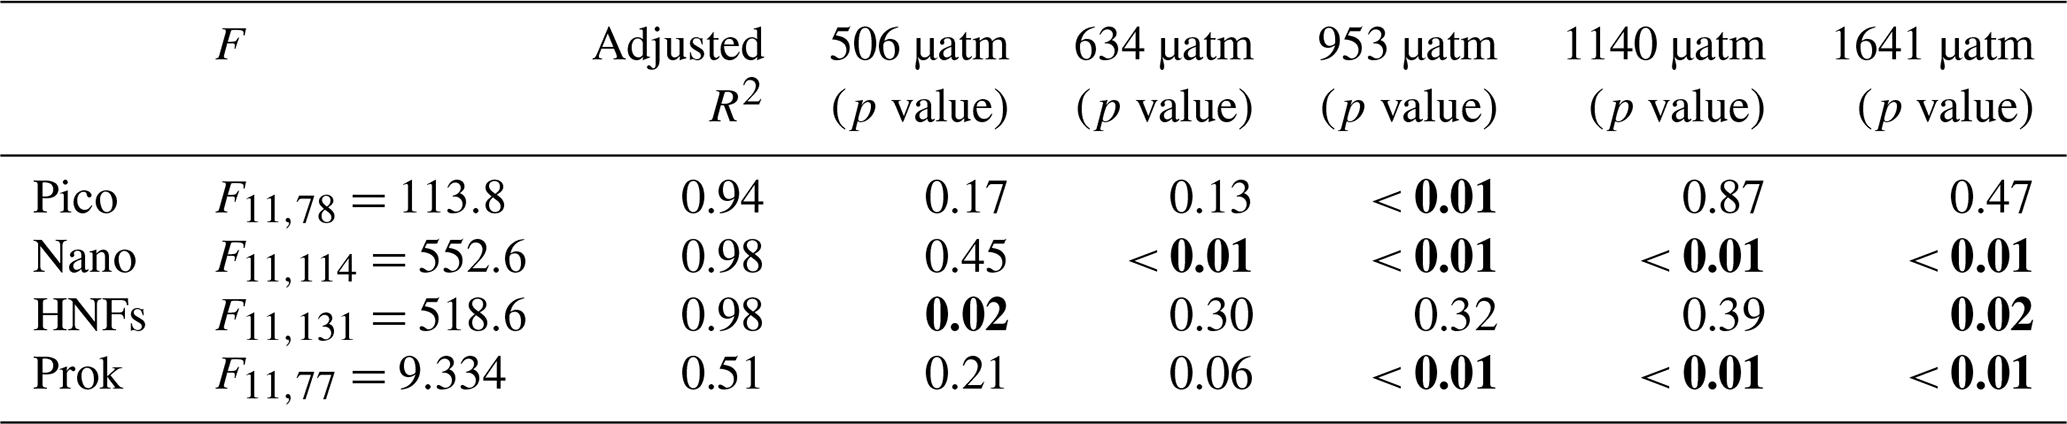
Bold text denotes significant p values (<0.05). Pico: picophytoplankton; nano: nanophytoplankton; HNFs: heterotrophic nanoflagellates; prok: prokaryotes.
3.4 Nanophytoplankton abundance
Nanophytoplankton abundance declined during the CO2 acclimation period in all treatments, falling from a mean initial abundance of to cells L−1 on day 7. Following acclimation, nanophytoplankton abundance increased in all treatments until day 15, after which growth plateaued (Fig. 6b). Steady-state logarithmic growth rates were calculated between days 9 and 15 (Fig. S2) and are presented in Table 2. There was a significant difference between growth trends among CO2 treatments (, p<0.01; Table S4), with significance due to enhanced growth rates in treatments ≥634 µatm (Table 3). In the 634 µatm treatment, cell numbers were substantially higher than all other treatments from day 12 through day 18, reaching a final abundance of cells L−1 (Fig. 6b). Enhanced growth rates in treatments ≥953 µatm also led to cell numbers exceeding the control by day 15, averaging cells L−1. Between days 15 and 18, abundance in treatments ≥953 µatm dipped and then recovered, with a final abundance of cells L−1. It is uncertain whether the large dip in abundance on day 16 was due to a reduction in cell numbers in the tanks or associated with the change in flow cytometer on this day. Growth rates in the control and 506 µatm treatments were the slowest (0.22–0.23; Table 2), displaying less of a plateau in growth between days 15 and 18 and reaching a final abundance of cells L−1, only slightly less than the ≥953 µatm treatments.
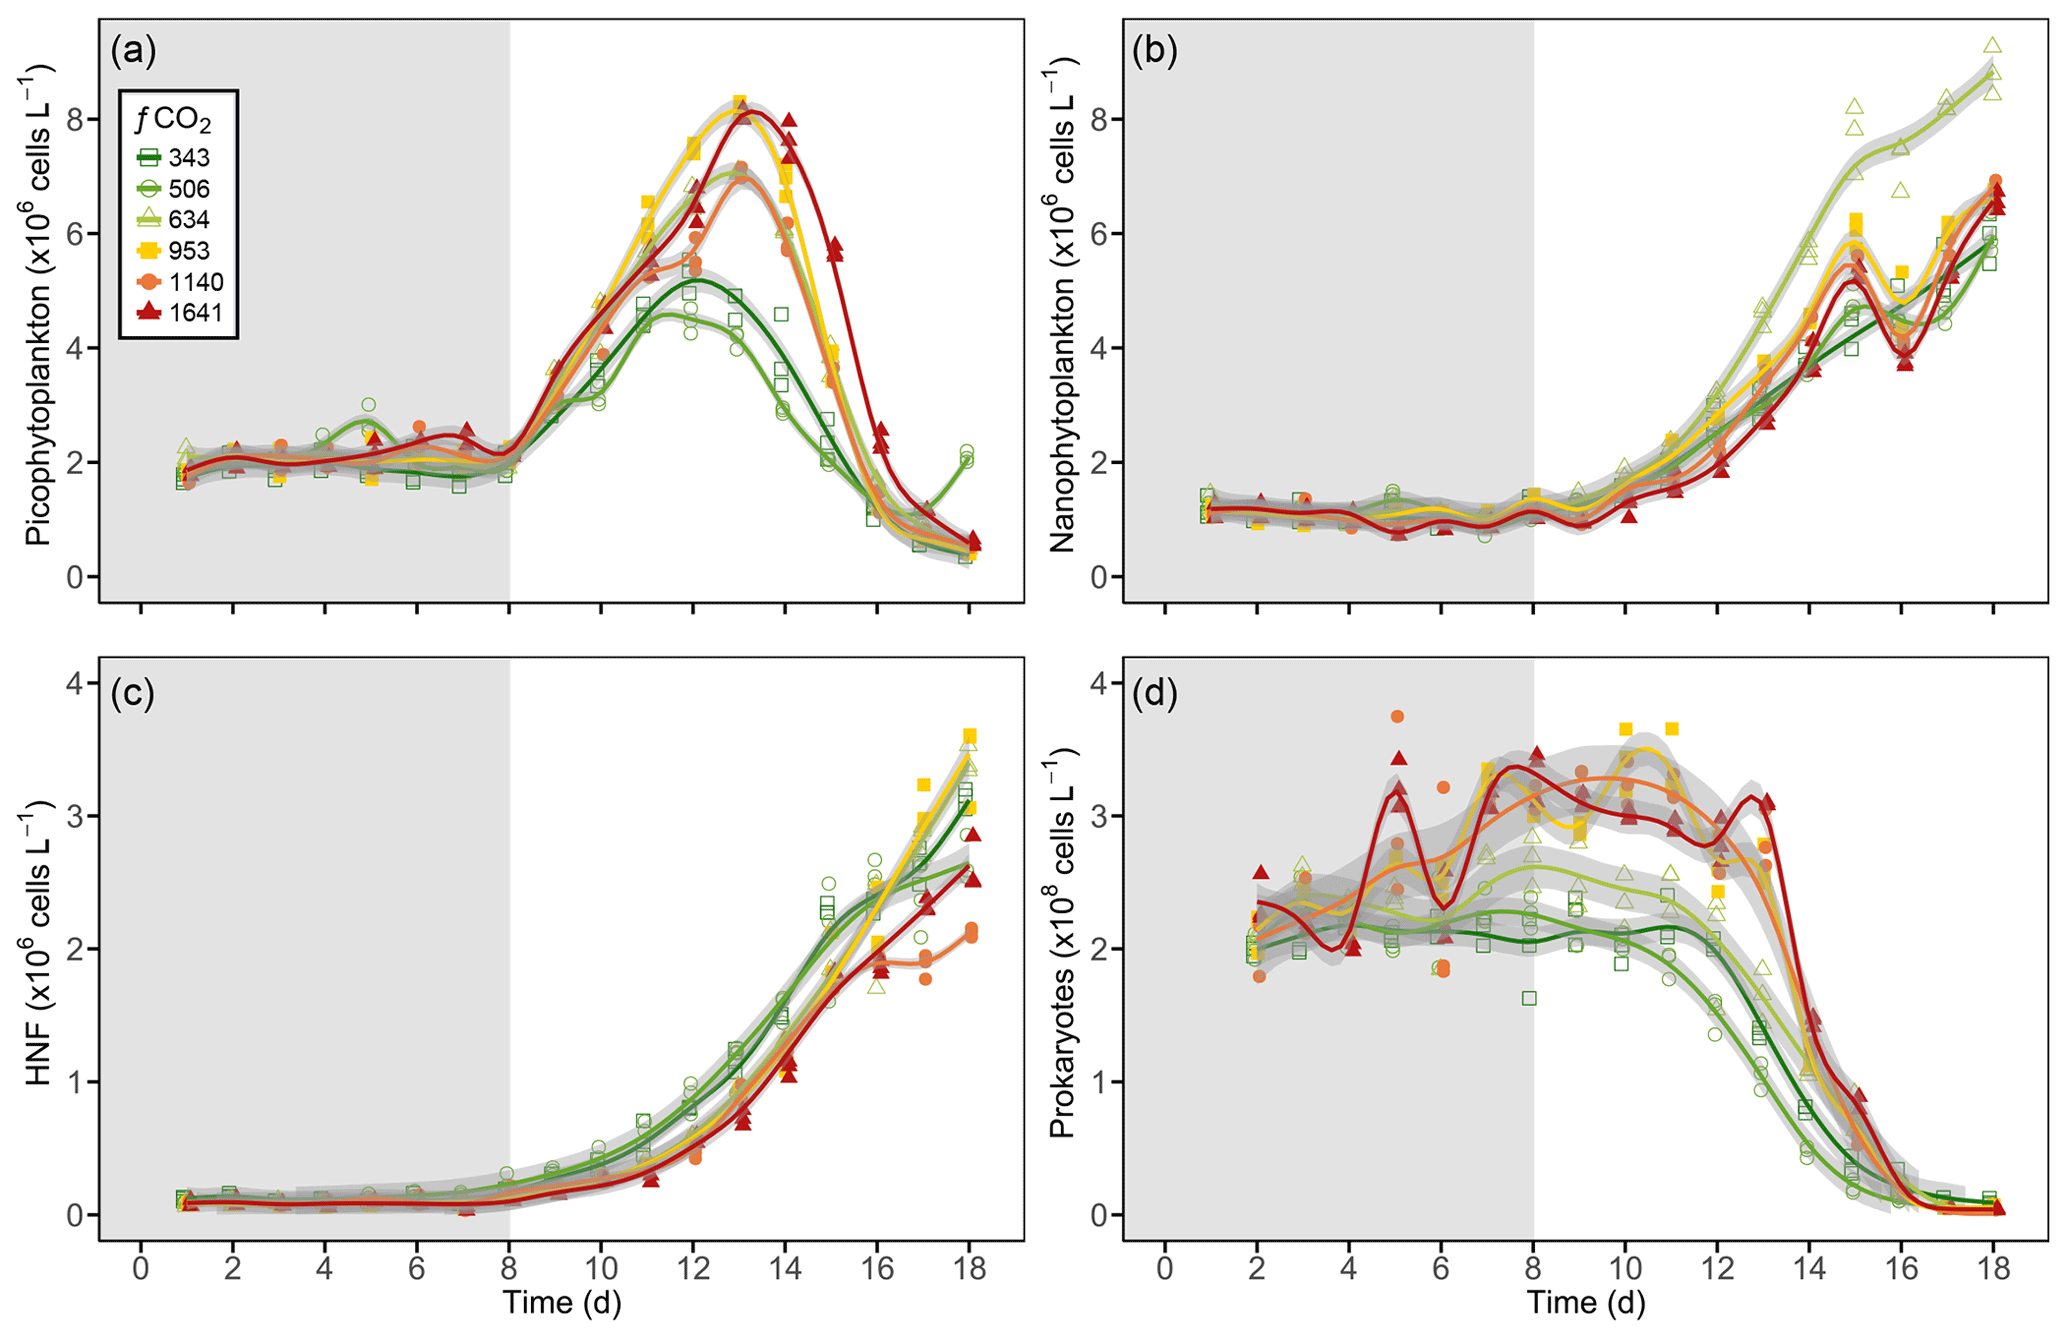
Figure 6Generalised additive model fits for (a) picophytoplankton, (b) nanophytoplankton, (c) heterotrophic nanoflagellates (HNFs), and (d) prokaryotes in each of the minicosm treatments over time. Shading above and below fitted lines (grey) displays the 95 % confidence interval for model predictions. Grey shading on the plot background indicates CO2 and light acclimation period.
3.5 Heterotrophic nanoflagellate abundance
HNF abundance was initially low ( cells L−1) and remained steady throughout the CO2 acclimation period (Fig. 6c), with a small dip in cell numbers observed in the treatments ≥953 µatm on day 7 (Fig. S2). From day 8, HNF abundance increased in all treatments until day 15, with cell numbers in the control and 506 µatm treatments consistently higher than all other treatments (≥634 µatm; Fig. 6c). From day 15 to 18, the control treatment and the 634, 953, and 1641 µatm treatments continued to rise, while abundance in the 506 and 1140 µatm treatments stabilised. Steady-state logarithmic growth rates were calculated between days 8 and 15 (Fig. S2) and are presented in Table 2. The omnibus test of trends in fCO2 treatment over time showed that there was a significant difference between the treatments (, p<0.01; Table S5) due to significant differences in growth trends of the 506 and 1641 µatm treatments (Table 3). Examining the growth rates of each of these treatments revealed that the 506 µatm treatment was slower than the control (0.32, p=0.02), while the 1641 µatm treatment was faster (0.40, p=0.02; Tables 2, 3). The slower growth rate of the 506 µatm treatment appears to be due to a higher initial abundance on day 8 ( cells L−1) than the control ( cells L−1). Despite a higher growth rate in the 1641 µatm treatment, cell numbers in the highest-CO2 treatments, 1140 and 1641 µatm, remained consistently lower than the control throughout the entire growth period (between days 8 and 18), reaching abundances on day 18 of only and cells L−1, respectively (Fig. 6c). The 506 µatm treatment plateaued after day 16, with a final abundance similar to the 1641 µatm treatment, at 2.66±0.02 cells L−1. In contrast, the 634 and 953 µatm treatments continued to rise, exceeding the control after day 16 and reaching cells L−1 on day 18, with the control treatment slightly lower, at cells L−1.
3.6 Prokaryote abundance
Prokaryote abundance was similar in all fCO2 treatments at the start of the acclimation period ( cells L−1) and increased after day 4 in treatments ≥634 µatm, while abundance in treatments ≤506 µatm remained unchanged (Fig. 6d). Due to the large fluctuation in cell numbers between days 4 and 7 in treatments ≥634 µatm, steady-state logarithmic growth was not observed (Fig. S2). However, prokaryote growth rates were calculated from linear regression between days 4 and 8 to assess differences in prokaryote growth among treatments during the CO2 acclimation period (Table 2). There was a significant difference between growth trends among CO2 treatments (, p<0.01; Table S6). Treatments ≥953 µatm all displayed significant differences in growth trends and were faster than the control (Tables 2, 3). Between days 7 and 11, prokaryote cell numbers remained steady in all treatments, with abundance higher than the control in treatments ≥634 µatm (Fig. 6d). During this time, abundance was highest in treatments ≥953 µatm, with an average abundance of cells L−1, followed by the 634 µatm treatment, at cells L−1. The control and 506 µatm treatments had similar abundances, averaging cells L−1. From day 12, prokaryote cell numbers declined rapidly in all treatments, falling to cells L−1 by day 18.
3.7 Microbial-community interaction
Although grazing experiments were not performed, interactions between HNFs and their phytoplankton and prokaryote prey were assessed visually. There appeared to be no correlation between HNF and nanophytoplankton abundance as nanophytoplankton only displayed higher cell numbers than the control in the 634 µatm treatment, which showed no relationship to the CO2-induced reduction in HNF abundance at levels ≥634 µatm. In contrast, the co-occurrence of slowed HNF growth with increased picophytoplankton abundance between days 8 and 13 in CO2 treatments ≥634 µatm suggested that the picophytoplankton communities may have been released from grazing pressure. This hypothesis of a reduction in grazing pressure by HNFs at increased CO2 was further supported by the observation that above a threshold HNF abundance there was a rapid decline in both the picophytoplankton and prokaryote abundance, irrespective of treatment and the duration of incubation. For picophytoplankton, cell numbers rapidly declined when HNF abundance reached cells L−1 (Fig. 7a), and for prokaryotes this occurred once HNF abundance reached cells L−1 (Fig. 7b). Interestingly, the rate of decline in picophytoplankton and prokaryote abundances in the fCO2 treatments ≥634 µatm was greater than the control and 506 µatm treatments. Despite this, only HNFs in the 634 and 953 µatm treatments reached abundances as high as the control at the conclusion of the experiment, suggesting that high CO2 (≥1140 µatm) continued to have a negative effect on HNF growth (Fig. 6c).
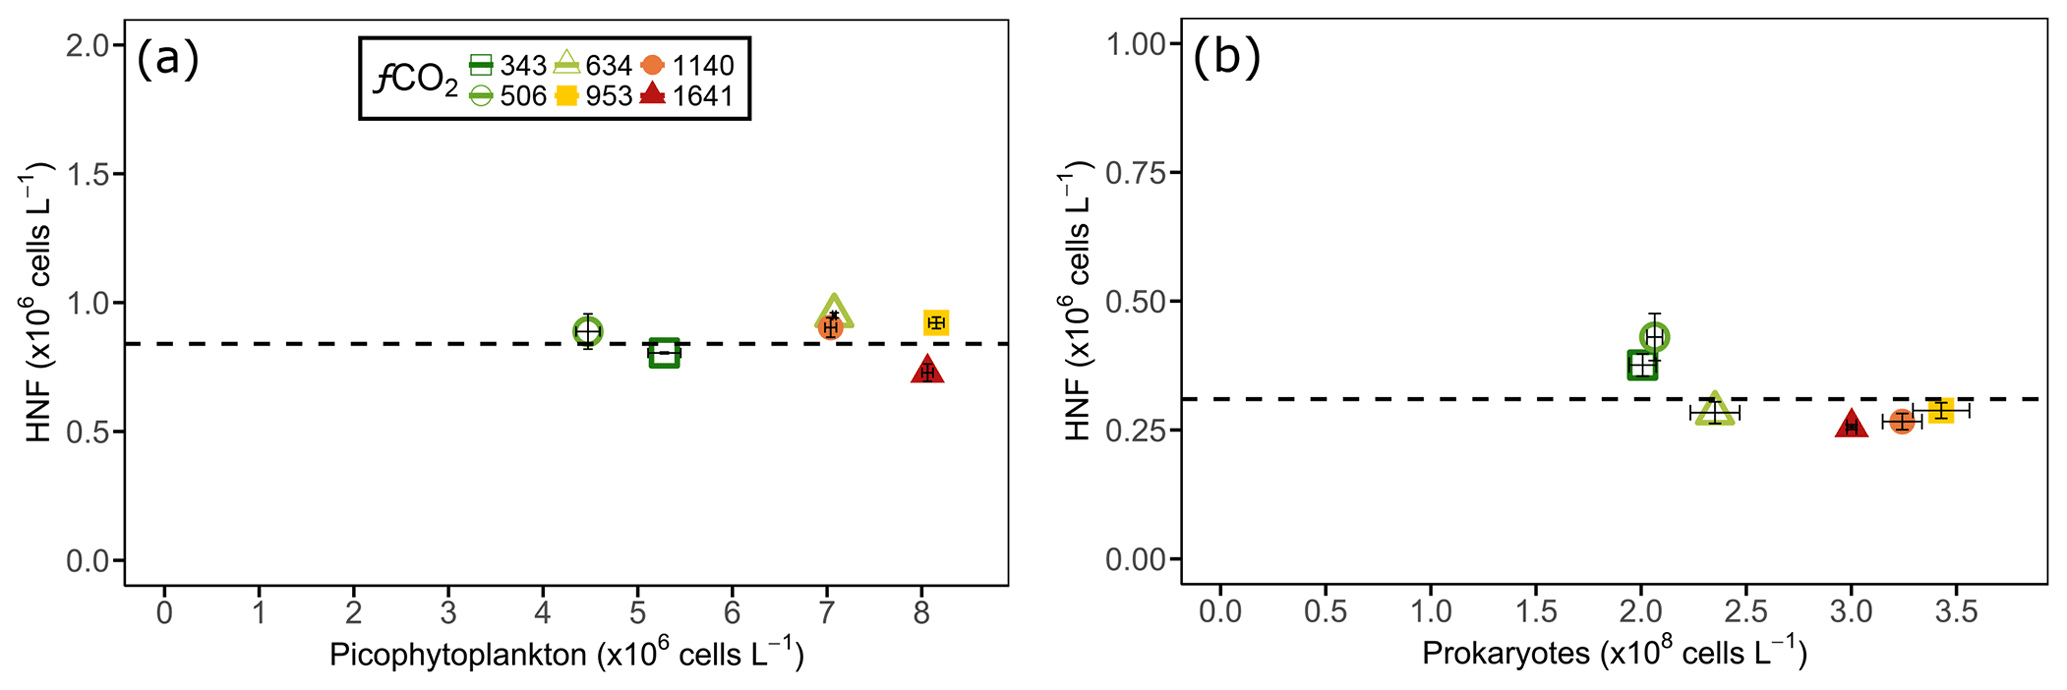
Figure 7Heterotrophic nanoflagellate (HNF) abundance (y axis) on the day before (a) picophytoplankton and (b) prokaryote abundance declined (shown on x axis) in each of the minicosm treatments. The error bars display standard error of pseudo-replicate samples of HNFs (vertical) as well as picophytoplankton and prokaryotes (horizontal). The dotted line indicates a threshold heterotrophic nanoflagellate abundance of (a) and (b) cells L−1.
Mesocosm experiments are useful in assessing the effects of environmental perturbations on multiple trophic levels of a marine ecosystem (Riebesell et al., 2008). Our results suggest that there are both direct effects of elevated CO2 on nanophytoplankton and indirect effects of trophic interactions occurring between HNFs and their prokaryotic and picoplanktonic prey that can significantly alter the composition and abundance of organisms at the base of the food web.
Exposing cells to a gradual change in CO2 during an acclimation period allows cells an opportunity to adjust their physiology to environmental change and may alleviate some of the stress experienced when changes are imposed rapidly (Dason and Colman, 2004). However, little is known about the timescales required for the changes in physiology to optimise cellular tolerance of CO2-induced stress. In addition, acclimating and adapting microbial communities over the years to decades anticipated for anthropogenic ocean acidification whilst retaining similar taxonomic composition to natural communities cannot be achieved in current experimental designs. Acknowledging these limitations, a gradual increase in fCO2 over 5 d was included in this study to assess whether acclimation would moderate the previously observed response of Antarctic microbial communities that were exposed to rapid changes in CO2 (Davidson et al., 2016; Thomson et al., 2016; Westwood et al., 2018).
The results of the current study are similar to those in the complementary studies that lacked acclimation (Davidson et al., 2016; Thomson et al., 2016; Westwood et al., 2018). Thus, it appears that an acclimation period had no discernible effect on the response of the community to enhanced CO2. Hancock et al. (2018a), in their coincident study on microbial-community composition, did observe a significant change in the community composition between days 1 and 3, but no difference was found between individual treatments. Therefore, this initial change was attributed to acclimation of the community to the minicosm tanks and not a response to increasing CO2. This lack of community-level acclimation through the selection of CO2-tolerant species in high-CO2 treatments may be due an ineffective acclimation or, alternatively, may be indicative of a community already adapted to the highly variable CO2 at the study site. Here, CO2 levels have been measured to vary by ∼450 µatm throughout the year, with the highest CO2 levels experienced at the end of winter and low CO2 levels experienced during the austral summer, when there is strong CO2 drawdown due to high primary productivity (Gibson and Trull, 1999; Roden et al., 2013). Marine organisms exposed to highly variable environments such as this have been shown to be more tolerant of changes in CO2 (Boyd et al., 2016).
It is also possible that the acclimation under low-light conditions did not allow the cells to adjust their physiology effectively and that much of the acclimation occurred after the light levels were increased. Indeed, in our coincident study measuring phytoplankton productivity and photophysiology, phytoplankton cell health (measured by photochemical quantum yield, Fv∕Fm) was high during the low-light acclimation period, and a CO2-induced decline in health was observed when light intensity was increased between days 5 and 8 (Deppeler et al., 2018a). Synergistic effects of CO2 and light stress have been observed in a number of phytoplankton studies, with declines in growth, productivity, and Fv∕Fm reported under combined high-CO2 and high-light-intensity conditions (e.g. Gao et al., 2012a, b; Li et al., 2015; Trimborn et al., 2017). Deppeler et al. (2018a) did note that the phytoplankton community appeared to acclimate to this light and CO2 stress over time, with Fv∕Fm increasing in all treatments after day 12. HNFs and prokaryotes are not reliant on light for growth, but they displayed similar growth patterns to the complementary study of Thomson et al. (2016) with no acclimation. With increasing CO2 levels, prokaryote abundance increased, and HNF growth was limited. Consequently, it is likely that cellular physiology did not change in any microbial group during the acclimation period. Despite this, the similarity of our results with those previously reported does allow us to gain a more comprehensive understanding of the seasonal and temporal effects of ocean acidification on the marine microbial community in this region.
Top-down grazing pressure on the microbial community is an important dynamic in the growth and composition of the microbial community in the Southern Ocean (Smetacek et al., 2004). Our experimental design included prescreening of the natural seawater community through a 200 µm mesh, which may have modified trophic dynamics by removing macrozooplankton grazers and thus reduced top-down grazing pressure on microheterotrophs. We chose to exclude macrozooplankton in order to remove an environmental factor that could differentially alter the mortality of microbes among CO2 treatments. Small differences in the abundance of large grazers among the tanks could have greatly affected the growth and composition of the microbial community to the point of removing all protists from the tanks, masking any CO2-induced effects. We recognise that removing higher trophic levels is a limitation of minicosm experiments to simulate the full dynamics of in situ communities. However, prescreening by <200 µm allowed for greater control of our experiment by allowing us to vary only one environmental factor so we could focus on the effect of CO2 on microbial-community dynamics.
4.1 Heterotrophic nanoflagellates
Our study indicates that HNF abundance is negatively affected by elevated CO2. HNF abundance was reduced when CO2 levels were ≥634 µatm and remained lower than the ambient treatment at levels ≥1140 µatm. These observations are consistent with complementary studies in Prydz Bay, East Antarctica, that reported a reduction in HNF abundance when CO2 was ≥750 µatm in both high- and low-nutrient conditions (Davidson et al., 2016; Thomson et al., 2016). These results contrast with those reported for a Baltic Sea mesocosm study by Moustaka-Gouni et al. (2016), who found that high CO2 concentration (1040 ppm) had little effect on the HNF community. Interestingly, they also demonstrated that HNF communities form complex food webs, and trophic interactions between species can change with environmental conditions and prey availability. We were unable to determine whether species-specific sensitivities led to the reduction in HNF abundance with high CO2. However, Hancock et al. (2018a) reported a CO2-related change in the relative abundances of choanoflagellate species at CO2 levels ≥634 µatm (see Sect. 4.4 below). Therefore, it is possible that other CO2-induced changes to the HNF community composition may have occurred. The consistency of reduced abundance of HNFs with increased CO2 over the austral summer and between years indicates that ocean acidification alone may significantly alter the HNF growth and community structure by 2050 (following RCP8.5 projections; IPCC, 2013). However, it must be acknowledged that a number of environmental factors will influence microbial communities with the onset of climate change (see Deppeler and Davidson, 2017), and the sequence and severity of these additional stressors will be important in determining the nature and magnitude of the effect of ocean acidification on this community.
Increased top-down control of the HNF community by heterotrophic dinoflagellates and ciliates may have led to the lower abundance of HNFs in the high-CO2 treatments. Hancock et al. (2018a) saw no effect of CO2 on the composition or abundance of the microheterotrophic community in their coincident study. However, they did acknowledge that microheterotroph abundance was low in all treatments (∼1 % of all cells), and therefore any CO2 response might not have been apparent. Low abundances of heterotrophic dinoflagellates and ciliates in all treatments would suggest that grazing pressure on HNFs was low, and thus any reduction in HNF abundance at higher CO2 levels was not likely caused by increased grazing from larger taxa. Few other studies have investigated the effect of ocean acidification on heterotrophic protists, and as yet there are no reports of direct effects of elevated CO2 on microheterotrophic grazing rates, abundance, or taxonomic composition (Suffrian et al., 2008; Aberle et al., 2013). One study by Rose et al. (2009a) did report an increase in microzooplankton abundance when a natural North Atlantic microbial community was exposed to high CO2 (690 ppm). However, this increased abundance was believed to be an indirect effect of CO2-induced promotion of phytoplankton abundance and a change in the phytoplankton community composition as opposed to a direct effect of ocean acidification on microzooplankton physiology. A shift in the dominant nanophytoplankton taxa was reported by Hancock et al. (2018a), with a threshold in this change appearing between 634 and 953 µatm (see Sect. 4.2 below). The prymnesiophyte Phaeocystis antarctica was dominant in treatments ≤634 µatm, whilst in higher-CO2 treatments P. antarctica was considerably reduced, resulting in a shift in dominance to the diatom Fragilariopsis sp. (<20 µm size). Low microzooplankton grazing rates have been reported in Antarctic waters dominated by colonial P. antarctica (Safi et al., 2007; Caron et al., 2000; Pearce et al., 2010), suggesting that a shift in dominance to more palatable small diatom species with increasing CO2 may lead to a concurrent increase in microzooplankton and subsequent increase in HNF grazing.
It is difficult to evaluate the potential reasons for reduced abundance of the HNF community in high-CO2 treatments as the mechanism(s) responsible for CO2 sensitivity in HNFs is unstudied (Caron and Hutchins, 2013). Heterotrophs do not require CO2 for growth; thus increased [H+] from lowered pH is likely the dominant driver of the effects observed (Sommer et al., 2015). The CO2 sensitivity of heterotrophic flagellates may be governed by the effectiveness of the mechanism(s) they possess to regulate intracellular pH (Pörtner, 2008). However, little is known about the pH sensitivities of heterotrophic flagellates. Among the few studies on flagellates, a decline in pH influenced the swimming behaviour of a harmful algal bloom, causing raphidophyte (Kim et al., 2013), and an inability to control intracellular pH disrupted the growth of the autotrophic dinoflagellates Amphidinium carterae and Heterocapsa oceanica (Dason and Colman, 2004). Disruption of flagella motility has also been observed in marine invertebrate sperm due to inhibition of the internal pH gradients required to activate signalling pathways (Nakajima, 2005; Morita et al., 2010; Nakamura and Morita, 2012). Whilst these examples do not provide evidence for direct inhibition of HNF growth, they do highlight the diverse sensitivities of flagellates to changes in pH that require further investigation. Size may also play a part in CO2 sensitivity, with size-related declines in the external pH boundary layer meaning small cells are likely to be more affected by lower ocean pH (Flynn et al., 2012). As heterotrophs respire CO2 and do not photosynthesise, it is likely that pH would be even lower at the cell surface than for autotrophs. This may explain why HNFs showed reduced growth rates in our study, while the larger microheterotrophs may have been unaffected (see Hancock et al., 2018a).
4.2 Nano- and picophytoplankton
An increase in picophytoplankton abundance was observed in our study when CO2 levels were ≥634 µatm (Fig. 6a), agreeing with other ocean acidification studies globally that have reported an increase in abundance of picophytoplankton at elevated CO2 levels (e.g. Brussaard et al., 2013; Schulz et al., 2013; Biswas et al., 2015; Crawfurd et al., 2017). However, studies on phytoplankton communities in other Antarctic regions have reported shifts towards larger diatom species (Ross Sea; Feng et al., 2010; Tortell et al., 2008) or no change (Antarctic Peninsula; Young et al., 2015). This variability in response among sites in Antarctic waters may be due to factors such as differences in microbial-community seasonal succession or study methods that excluded picophytoplankton analysis. The increase in picophytoplankton abundance at CO2 levels ≥634 µatm reported here is similar to the findings of Thomson et al. (2016) in their complementary study at the same site, indicating that this response is consistent across seasons and between years. It has been suggested that increased abundance of picophytoplankton may be due to increases in productivity derived from more readily available CO2 at the cell surface, allowing for more passive diffusion of CO2 into the cell and thus reduced requirements for energy-intensive carbon concentrating mechanisms (CCMs; Riebesell et al., 1993; Paulino et al., 2008; Schulz et al., 2013; Calbet et al., 2014). Downregulation of CCMs in the high-CO2 treatment (1641 µatm) in small cells (<10 µm) was reported in our coincident study (Deppeler et al., 2018a). However, it is uncertain whether this resulted in increased primary productivity for this size group as primary productivity measurements were performed on the whole community. Instead, primary productivity was significantly reduced when CO2 levels were ≥1140 µatm, suggesting CCM downregulation did not have a significant positive effect on growth.
The larger ratio of cell surface area to volume in small cells, allowing increased nutrient utilisation in nutrient-limited environments, has also been invoked to explain the increased abundance of picophytoplankton with elevated CO2 (Schulz et al., 2013). Size-related differences in growth rates may allow picophytoplankton to establish a bloom faster than larger phytoplankton species (e.g. Newbold et al., 2012). However, this is not seen in nutrient-replete East Antarctic waters, where early summer blooms are dominated by large diatoms, such as Thalassiosira sp. and Fragilariopsis sp. (>20 µm) as well as the prymnesiophyte P. antarctica in its colonial life stage (Davidson et al., 2010). It was also not observed in this study, where only the 953 µatm treatment displayed a significantly enhanced picophytoplankton growth rate (Table 3). Increased rates of nutrient drawdown were observed in the 634–953 µatm CO2 treatments (Fig. 5), suggesting that moderate increases in CO2 may stimulate phytoplankton growth, but further increases in CO2 (≥1140 µatm) led to significant reductions in primary productivity (Deppeler et al., 2018a).
Nanophytoplankton abundance was highest in the 643 µatm treatment, with significantly increased growth rates in treatments ≥634 µatm (Fig. 6b; Table 3). This was likely due to favourable conditions, including the inhibition of growth of larger phytoplankton species, that allowed nano-sized phytoplankton to thrive at higher CO2 levels (Hancock et al., 2018a). The initial decline in nanophytoplankton abundance in all treatments between days 1 and 7 may have been due to acclimation of the community to the minicosms or grazing by microzooplankton. Increasing light intensity had a temporary inhibitory effect on growth at CO2 levels ≥1140 µatm between days 8 and 9 (Fig. S2), suggesting that the significantly enhanced growth rates in these treatments between days 9 and 15 may have been caused by an increase in relative abundance of more tolerant species. Interestingly, whilst no negative effect of CO2 was observed on the overall nanophytoplankton abundance, there were very strong species-specific responses to increasing CO2, resulting in a significant change in community structure. In their coincident study, Hancock et al. (2018a) identified the most abundant nanophytoplankton species present in the minicosms as Fragilariopsis sp. (<20 µm) and P. antarctica in its colonial form. These species displayed a CO2-related dominance threshold around 634 µatm, with a shift from P. antarctica to Fragilariopsis sp. in the high-CO2 treatments. Thus, it is likely that the relative fitness of both of these species was increased with a moderate increase in CO2 level, explaining the higher abundance observed at 634 µatm CO2. Increased abundance of Fragilariopsis sp. with elevated CO2 has also been observed in other ocean acidification studies on natural Antarctic microbial communities (Hoppe et al., 2013; Davidson et al., 2016). Therefore, increasing CO2 might not result in a change in total nanophytoplankton abundance but may instead result in a shift in the summer nanophytoplankton community composition, with increased abundance of small diatoms over P. antarctica colonies.
There is an increased understanding of the prevalence of mixotrophy in the marine microbial community (Mitra et al., 2014; Stoecker et al., 2017; Gast et al., 2018). Therefore, it is possible that mixotrophic nanoflagellates were included in our nanophytoplankton counts due to the presence of chlorophyll in their cells. Mixotrophs are able to utilise both autotrophic and heterotrophic methods of energy production and consumption, although the range methods employed can be diverse (Stoecker et al., 2017). It is currently unknown how mixotrophic phytoflagellates will respond to ocean acidification. Caron and Hutchins (2013) speculated that autotrophic energy production may be more efficient with increasing levels of CO2, owing to increased availability of dissolved inorganic carbon species, an essential substrate for photosynthesis, with lower pH. However, the simultaneous increase in [H+] may have negative effects on both heterotrophic and autotrophic cellular mechanisms, causing multiple stresses to mixotrophic physiology. As molecular methods allow for better identification of mixotrophic species, further research into how these species respond to increasing CO2 may now be possible (Gast et al., 2018).
4.3 Prokaryotes
The prokaryote community responded favourably to increasing CO2, displaying increased abundance when CO2 levels were ≥634 µatm (Fig. 6d). This increase in prokaryote abundance with elevated CO2 was also observed in complementary studies at Prydz Bay, which reported consistent increases in prokaryote abundance and production with CO2 levels ≥780 µatm in high- and low-nutrient conditions spanning early to late summer (Thomson et al., 2016; Westwood et al., 2018). An increase in prokaryote abundance with increasing CO2 has also been reported in Arctic mesocosms (Endres et al., 2014; Engel et al., 2014), although in other studies CO2 had no influence on the prokaryote community (Grossart et al., 2006; Allgaier et al., 2008; Paulino et al., 2008; Newbold et al., 2012). Thus, it is anticipated that heterotrophic prokaryotes will tolerate increasing CO2 levels and, in some instances, may thrive (reviewed in Hutchins and Fu, 2017). Like HNFs, prokaryotes do not require CO2 for growth, although it appears they may be more resistant to large variations in pH. Despite this, there is evidence that CO2 may induce changes in community composition, selecting for more tolerant or rare species (Krause et al., 2012; Roy et al., 2013; Zhang et al., 2013; Bergen et al., 2016). This may be related to differential responses of phylogenetic groups to maintaining pH homeostasis in either acid or alkaline conditions (Padan et al., 2005; Bunse et al., 2016). The mechanisms for transporting H+ out of the cell are energetically demanding and may reduce the energy available for growth. Whether these energy demands are increased or decreased with ocean acidification depends upon the different strategies for pH homeostasis employed by individual prokaryote species (Teira et al., 2012). In addition to this, significant increases in growth efficiency with elevated CO2 might not result in an increase in productivity or abundance (Teira et al., 2012). Instead, these changes may affect dissolved organic carbon consumption, with potential impacts on organic-matter cycles (Endres et al., 2014).
4.4 Community interactions
The coincidence of the increase in picophytoplankton and prokaryote abundances with reduced HNFs suggests that these communities were being released from grazing pressure at CO2 levels ≥634 µatm. Grazing rates in East Antarctica are on average 62 % of primary production per day and can reach a maximum of 220 % (Pearce et al., 2010). In addition, >100 % of prokaryote production can be removed by micro- and nanoheterotrophs when chlorophyll a concentration and prokaryote abundance is high (Pearce et al., 2010). The rapid decline in abundance we observed in picophytoplankton and prokaryotes after 12 d of incubation is entirely consistent with the rapid rates of grazing observed in other Antarctic marine microbial communities in this region. In relation to fCO2, it is reasonable to hypothesise that the lower abundances of these prey in the control and 506 µatm treatments may have been due to stronger top-down control of the community as opposed to a reduction in growth rate. Grazing control of the picophytoplankton community has been proposed in other mesocosm studies to explain both positive (Paulino et al., 2008; Rose et al., 2009a) and negative (Meakin and Wyman, 2011; Newbold et al., 2012) changes in picophytoplankton abundance, although they were not confirmed by HNF counts. In our minicosm study, the rapid decline in prokaryote abundance coincided with a dramatic increase in choanoflagellate abundance – bacterivorous eukaryotes – between days 14 and 16 (Hancock et al., 2018a). Furthermore, both picophytoplankton and prokaryotes in all CO2 treatments declined after HNF abundance appeared to reach a critical threshold (Fig. 7), suggesting that at this point their growth was unable to exceed the top-down control of grazing. Thomson et al. (2016) and Westwood et al. (2018), in their complementary studies, also noted that higher numbers of prokaryotes coincided with reduced HNF abundance across differing microbial-community compositions and nutrient availabilities in Prydz Bay, suggesting that this response is likely to be consistent on both seasonal and temporal scales.
Species-specific differences in the sensitivity of HNFs to CO2 may lead to significant changes in the composition of the picophytoplankton and prokaryote communities. HNF food webs are complex, and successional changes in taxa occur during phytoplankton blooms (Moustaka-Gouni et al., 2016). In their coincident study, Hancock et al. (2018a) observed species-specific differences in the CO2 tolerances of choanoflagellate species, where Bicosta antennigera displayed significant CO2 sensitivity at levels ≥634 µatm, while other choanoflagellate species (principally Diaphanoeca multiannulata) were unaffected. This change in HNF community composition with increased CO2 did not affect the total prokaryote abundance but may have implications for the prokaryotic community composition through selective grazing. Changes in prokaryote community composition have been observed in other mesocosm studies (Roy et al., 2013; Zhang et al., 2013; Bergen et al., 2016). There is also evidence that different prokaryote phylogenetic groups have preferences for organic substrates produced by different phytoplankton taxa (Sarmento and Gasol, 2012), leading to the possibility that future changes in prokaryote community composition could impact organic-matter recycling.
As viral abundance was not determined in our study, we cannot exclude viral lysis as an explanation for the rapid decline in picophytoplankton and prokaryote abundance. Viral lysis can account for up to 25 % of daily production, although grazing by micro- and nanoheterotrophs can be twice as high (Evans et al., 2003; Pearce et al., 2010). In an Arctic mesocosm study, the decline in a picophytoplankton bloom coincided with a large increase in viral abundance (Brussaard et al., 2013). However, later in the study, picophytoplankton were also heavily grazed by microzooplankton. Bacteriophages are the dominant viruses in the Prydz Bay area (Pearce et al., 2007; Thomson et al., 2010; Liang et al., 2016), with viral abundance displaying no correlation to picophytoplankton (Liang et al., 2016). This suggests that viral lysis was unlikely to be the main cause of the decline in picophytoplankton numbers but may have affected the prokaryotes.
The results of this study show how ocean acidification can exert both direct and indirect influences on the interactions among trophic levels within the microbial loop. Our study reinforces findings in nearshore waters off East Antarctica that HNF abundance is reduced when CO2 is ≥634 µatm, irrespective of temporal changes in the physical and biological environment among seasons and years (Davidson et al., 2016; Thomson et al., 2016; Westwood et al., 2018). This likely resulted in a decline in grazing mortality of picophytoplankton and prokaryotes, allowing these communities to increase in abundance. HNFs are an important link in carbon transfer to higher trophic levels as they are grazed upon by microzooplankton and thereafter by higher trophic organisms (Azam et al., 1991; Sherr and Sherr, 2002). Grazing is also a critical determinant of phytoplankton community composition and standing stocks (Sherr and Sherr, 2002). Therefore, the changes in predator–prey interactions with ocean acidification we observed in this study could have significant effects on the food web and biogeochemistry in coastal Antarctic waters.
Our results, together with those of the coincident studies by Deppeler et al. (2018a) and Hancock et al. (2018a), indicate that it is likely that increasing CO2 will cause a shift away from blooms dominated by large diatoms and P. antarctica towards communities increasingly dominated by prokaryotes, nano-sized diatoms, and picophytoplankton. Large phytoplankton cells contribute significantly to deep-ocean carbon sequestration (Tréguer et al., 2018). They are also the preferred food source for higher trophic organisms, especially the Antarctic krill Euphausia superba (Haberman et al., 2003; Meyer et al., 2003; Schmidt et al., 2006). E. superba have been found to graze less efficiently on phytoplankton cells <10 µm (Quetin and Ross, 1985; Kawaguchi et al., 1999; Haberman et al., 2003). Thus, a shift to smaller-celled communities will likely alter the structure of the Antarctic food web. Furthermore, increases in prokaryote abundance will likely intensify the breakdown of organic matter in surface waters, further contributing to a decline in the sequestration of carbon from summer phytoplankton blooms into the deep ocean.
Experimental data used for analysis are available via the Australian Antarctic Data Centre: environmental data (https://doi.org/10.4225/15/599a7dfe9470a, Deppeler et al., 2017), flow cytometry data (https://doi.org/10.4225/15/5b234e4bb9313, Deppeler et al., 2018b), and microscopy data (https://doi.org/10.4225/15/592b83a5c7506, Hancock et al., 2018b).
The supplement related to this article is available online at: https://doi.org/10.5194/bg-17-4153-2020-supplement.
AD conceived and designed the experiments. AD led and oversaw the minicosm experiment, and PP, SD, and AH performed the experiments. SD and AD performed the data analysis. KGS performed the carbonate system measurements and manipulation. JM provided statistical guidance. SD wrote the manuscript, with all other authors providing contributions and critical review.
The authors declare that they have no conflict of interest.
We would like to thank Dave Hutchins, Scarlett Trimborn, and the two anonymous referees for valuable comments on an earlier version of this paper. We gratefully acknowledge the assistance of AAD technical support in designing and equipping the minicosms and Davis Station expeditioners in the summer of 2014/2015 for their support and assistance.
This research has been supported by the Australian Antarctic Division (grant no. AAS4026) and the Elite Research Scholarship from the Institute for Marine and Antarctic Studies, University of Tasmania.
This paper was edited by Carol Robinson and reviewed by two anonymous referees.
Aberle, N., Schulz, K. G., Stuhr, A., Malzahn, A. M., Ludwig, A., and Riebesell, U.: High tolerance of microzooplankton to ocean acidification in an Arctic coastal plankton community, Biogeosciences, 10, 1471–1481, https://doi.org/10.5194/bg-10-1471-2013, 2013. a, b
Allgaier, M., Riebesell, U., Vogt, M., Thyrhaug, R., and Grossart, H.-P.: Coupling of heterotrophic bacteria to phytoplankton bloom development at different pCO2 levels: a mesocosm study, Biogeosciences, 5, 1007–1022, https://doi.org/10.5194/bg-5-1007-2008, 2008. a, b
Archer, S. D., Leakey, R. J. G., Burkill, P. H., and Sleigh, M. A.: Microbial dynamics in coastal waters of East Antarctica: Herbivory by heterotrophic dinoflagellates, Mar. Ecol. Prog. Ser., 139, 239–255, https://doi.org/10.3354/meps139239, 1996. a
Arrigo, K. R., van Dijken, G. L., and Bushinsky, S.: Primary production in the Southern Ocean, 1997–2006, J. Geophys. Res.-Ocean., 113, C08004, https://doi.org/10.1029/2007JC004551, 2008. a
Azam, F. and Malfatti, F.: Microbial structuring of marine ecosystems, Nat. Rev. Microbiol., 5, 782–791, https://doi.org/10.1038/nrmicro1747, 2007. a, b, c
Azam, F., Fenchel, T., Field, J. G., Gray, J. C., Meyer-Reil, L. A., and Thingstad, F.: The ecological role of water-column microbes in the sea, Mar. Ecol. Prog. Ser., 10, 257–264, https://doi.org/10.3354/meps010257, 1983. a
Azam, F., Smith, D. C., and Hollibaugh, J. T.: The role of the microbial loop in Antarctic pelagic ecosystems, Polar Res., 10, 239–243, https://doi.org/10.1111/j.1751-8369.1991.tb00649.x, 1991. a, b, c
Beardall, J. and Giordano, M.: Ecological implications of microalgal and cyanobacterial CO2 concentrating mechanisms, and their regulation, Funct. Plant Biol., 29, 335–347, 2002. a
Behrenfeld, M. J.: Climate-mediated dance of the plankton, Nat. Clim. Change, 4, 880–887, https://doi.org/10.1038/nclimate2349, 2014. a
Bergen, B., Endres, S., Engel, A., Zark, M., Dittmar, T., Sommer, U., and Jürgens, K.: Acidification and warming affect prominent bacteria in two seasonal phytoplankton bloom mesocosms, Environ. Microbiol., 18, 4579–4595, https://doi.org/10.1111/1462-2920.13549, 2016. a, b, c
Bertrand, E. M., McCrow, J. P., Moustafa, A., Zheng, H., McQuaid, J. B., Delmont, T. O., Post, A. F., Sipler, R. E., Spackeen, J. L., Xu, K., Bronk, D. a., Hutchins, D. A., and Allen, A. E.: Phytoplankton–bacterial interactions mediate micronutrient colimitation at the coastal Antarctic sea ice edge, P. Natl. Acade. Sci. USA, 112, 9938–9943, https://doi.org/10.1073/pnas.1501615112, 2015. a
Biswas, H., Jie, J., Li, Y., Zhang, G., Zhu, Z. Y., Wu, Y., Zhang, G. L., Li, Y. W., Liu, S. M., and Zhang, J.: Response of a natural phytoplankton community from the Qingdao coast (Yellow Sea, China) to variable CO2 levels over a short-term incubation experiment, Curr. Sci., 108, 1901–1909, 2015. a
Bjørnsen, P. K. and Kuparinen, J.: Growth and herbivory by heterotrophic dinoflagellates in the Southern Ocean, studied by microcosm experiments, Mar. Biol., 109, 397–405, https://doi.org/10.1007/BF01313505, 1991. a
Bockmon, E. E. and Dickson, A. G.: A seawater filtration method suitable for total dissolved inorganic carbon and pH analyses, Limnol. Oceanogr.-Method., 12, 191–195, https://doi.org/10.4319/lom.2014.12.191, 2014. a
Boyd, P. W., Cornwall, C. E., Davison, A., Doney, S. C., Fourquez, M., Hurd, C. L., Lima, I. D., and McMinn, A.: Biological responses to environmental heterogeneity under future ocean conditions, Glob. Change Biol., 22, 2633–2650, https://doi.org/10.1111/gcb.13287, 2016. a
Brussaard, C. P. D., Noordeloos, A. A. M., Witte, H., Collenteur, M. C. J., Schulz, K., Ludwig, A., and Riebesell, U.: Arctic microbial community dynamics influenced by elevated CO2 levels, Biogeosciences, 10, 719–731, https://doi.org/10.5194/bg-10-719-2013, 2013. a, b
Buchan, A., LeCleir, G. R., Gulvik, C. A., and González, J. M.: Master recyclers: features and functions of bacteria associated with phytoplankton blooms, Nat. Rev. Microbiol., 12, 686–698, https://doi.org/10.1038/nrmicro3326, 2014. a, b, c
Bunse, C., Lundin, D., Karlsson, C. M. G., Vila-Costa, M., Palovaara, J., Akram, N., Svensson, L., Holmfeldt, K., González, J. M., Calvo, E., Pelejero, C., Marrasé, C., Dopson, M., Gasol, J. M., and Pinhassi, J.: Response of marine bacterioplankton pH homeostasis gene expression to elevated CO2, Nat. Clim. Change, 1, 1–7, https://doi.org/10.1038/nclimate2914, 2016. a
Calbet, A., Sazhin, A. F., Nejstgaard, J. C., Berger, S. A., Tait, Z. S., Olmos, L., Sousoni, D., Isari, S., Martínez, R. A., Bouquet, J.-M., Thompson, E. M., Båmstedt, U., and Jakobsen, H. H.: Future Climate Scenarios for a Coastal Productive Planktonic Food Web Resulting in Microplankton Phenology Changes and Decreased Trophic Transfer Efficiency, PLoS ONE, 9, e94388, https://doi.org/10.1371/journal.pone.0094388, 2014. a
Caron, D. A. and Hutchins, D. A.: The effects of changing climate on microzooplankton grazing and community structure: drivers, predictions and knowledge gaps, J. Plank. Res., 35, 235–252, https://doi.org/10.1093/plankt/fbs091, 2013. a, b, c
Caron, D. A., Dennett, M. R., Lonsdale, D. J., Moran, D. M., and Shalapyonok, L.: Microzooplankton herbivory in the Ross Sea, Antarctica, Deep-Sea Res. Pt. II, 47, 3249–3272, https://doi.org/10.1016/S0967-0645(00)00067-9, 2000. a
Celussi, M., Malfatti, F., Annalisa, F., Gazeau, F., Giannakourou, A., Pitta, P., Tsiola, A., and Del Negro, P.: Ocean acidification effect on prokaryotic metabolism tested in two diverse trophic regimes in the Mediterranean Sea, Estuar. Coast. Shelf Sci., 186, 125–138, https://doi.org/10.1016/j.ecss.2015.08.015, 2017. a
Crawfurd, K. J., Alvarez-Fernandez, S., Mojica, K. D. A., Riebesell, U., and Brussaard, C. P. D.: Alterations in microbial community composition with increasing fCO2: a mesocosm study in the eastern Baltic Sea, Biogeosciences, 14, 3831–3849, https://doi.org/10.5194/bg-14-3831-2017, 2017. a
Dason, J. S. and Colman, B.: Inhibition of growth in two dinoflagellates by rapid changes in external pH, Can. J. Botany, 82, 515–520, https://doi.org/10.1139/b04-023, 2004. a, b
Davidson, A., McKinlay, J., Westwood, K., Thomson, P., van den Enden, R., de Salas, M., Wright, S., Johnson, R., and Berry, K.: Enhanced CO2 concentrations change the structure of Antarctic marine microbial communities, Mar. Ecol. Prog. Ser., 552, 93–113, https://doi.org/10.3354/meps11742, 2016. a, b, c, d, e, f, g, h
Davidson, A. T., Scott, F. J., Nash, G. V., Wright, S. W., and Raymond, B.: Physical and biological control of protistan community composition, distribution and abundance in the seasonal ice zone of the Southern Ocean between 30 and 80∘ E, Deep-Sea Res. Pt. II, 57, 828–848, https://doi.org/10.1016/j.dsr2.2009.02.011, 2010. a
Deppeler, S. L. and Davidson, A. T.: Southern Ocean Phytoplankton in a Changing Climate, Front. Mar. Sci., 4, 1–18, https://doi.org/10.3389/fmars.2017.00040, 2017. a
Deppeler, S. L., Davidson, A. T., and Schulz, K.: Environmental data for Davis 14/15 ocean acidification minicosm experiment, Australian Antarctic Data Centre, https://doi.org/10.4225/15/599a7dfe9470a, 2017. a
Deppeler, S., Petrou, K., Schulz, K. G., Westwood, K., Pearce, I., McKinlay, J., and Davidson, A.: Ocean acidification of a coastal Antarctic marine microbial community reveals a critical threshold for CO2 tolerance in phytoplankton productivity, Biogeosciences, 15, 209–231, https://doi.org/10.5194/bg-15-209-2018, 2018a. a, b, c, d, e, f, g, h, i, j, k
Deppeler, S. L., Schulz, K. G., Hancock, A., Pascoe, P., Mckinlay, J., and Davidson, A. T.: Flow cytometry data, Data for manuscript “Ocean acidification reduces growth and grazing of Antarctic heterotrophic nanoflagellates”, Australian Antarctic Data Centre, https://doi.org/10.4225/15/5b234e4bb9313, 2018b. a
Dickson, A.: Standards for Ocean Measurements, Oceanography, 23, 34–47, https://doi.org/10.5670/oceanog.2010.22, 2010. a
Dickson, A., Sabine, C., and Christian, J. (Eds.): Guide to Best Practices for Ocean CO2 Measurements, North Pacific Marine Science Organization, Sidney, British Columbia, 2007. a, b
Endres, S., Galgani, L., Riebesell, U., Schulz, K.-G., and Engel, A.: Stimulated Bacterial Growth under Elevated pCO2: Results from an Off-Shore Mesocosm Study, PLoS ONE, 9, e99228, https://doi.org/10.1371/journal.pone.0099228, 2014. a, b, c
Engel, A., Piontek, J., Grossart, H.-P., Riebesell, U., Schulz, K. G., and Sperling, M.: Impact of CO2 enrichment on organic matter dynamics during nutrient induced coastal phytoplankton blooms, J. Plank. Res., 36, 641–657, https://doi.org/10.1093/plankt/fbt125, 2014. a
Evans, C., Archer, S. D., Jacquet, S., and Wilson, W. H.: Direct estimates of the contribution of viral lysis and microzooplankton grazing to the decline of a Micromonas spp. population, Aquat. Microb. Ecol., 30, 207–219, https://doi.org/10.3354/ame030207, 2003. a
Fenchel, T.: The microbial loop – 25 years later, J. Exp. Mar. Biol. Ecol., 366, 99–103, https://doi.org/10.1016/j.jembe.2008.07.013, 2008. a
Feng, Y., Hare, C., Rose, J., Handy, S., DiTullio, G., Lee, P., Smith, W., Peloquin, J., Tozzi, S., Sun, J., Zhang, Y., Dunbar, R., Long, M., Sohst, B., Lohan, M., and Hutchins, D.: Interactive effects of iron, irradiance and CO2 on Ross Sea phytoplankton, Deep-Sea Res. Pt. I, 57, 368–383, https://doi.org/10.1016/j.dsr.2009.10.013, 2010. a
Flombaum, P., Gallegos, J. L., Gordillo, R. a., Rincon, J., Zabala, L. L., Jiao, N., Karl, D. M., Li, W. K. W., Lomas, M. W., Veneziano, D., Vera, C. S., Vrugt, J. A., and Martiny, A. C.: Present and future global distributions of the marine Cyanobacteria Prochlorococcus and Synechococcus, P Natl. Acad. Sci. USA, 110, 9824–9829, https://doi.org/10.1073/pnas.1307701110, 2013. a
Flynn, K. J., Blackford, J. C., Baird, M. E., Raven, J. A., Clark, D. R., Beardall, J., Brownlee, C., Fabian, H., and Wheeler, G. L.: Changes in pH at the exterior surface of plankton with ocean acidification, Nat. Clim. Change, 2, 510–513, https://doi.org/10.1038/nclimate1489, 2012. a
Frölicher, T. L., Sarmiento, J. L., Paynter, D. J., Dunne, J. P., Krasting, J. P., and Winton, M.: Dominance of the Southern Ocean in Anthropogenic Carbon and Heat Uptake in CMIP5 Models, J. Clim., 28, 862–886, https://doi.org/10.1175/JCLI-D-14-00117.1, 2015. a
Gao, K., Helbling, E. W., Häder, D. P., and Hutchins, D. A.: Responses of marine primary producers to interactions between ocean acidification, solar radiation, and warming, Mar. Ecol. Prog. Ser., 470, 167–189, https://doi.org/10.3354/meps10043, 2012a. a
Gao, K., Xu, J., Gao, G., Li, Y., Hutchins, D. A., Huang, B., Wang, L., Zheng, Y., Jin, P., Cai, X., Häder, D.-p., Li, W., Xu, K., Liu, N., and Riebesell, U.: Rising CO2 and increased light exposure synergistically reduce marine primary productivity, Nat. Clim.Change, 2, 519–523, https://doi.org/10.1038/nclimate1507, 2012b. a
Gast, R. J., Fay, S. A., and Sanders, R. W.: Mixotrophic Activity and Diversity of Antarctic Marine Protists in Austral Summer, Front. Mar. Sci., 5, 1–12, https://doi.org/10.3389/fmars.2018.00013, 2018. a, b
Gibson, J. A. E. and Trull, T. W.: Annual cycle of fCO2 under sea-ice and in open water in Prydz Bay, East Antarctica, Mar. Chem., 66, 187–200, https://doi.org/10.1016/S0304-4203(99)00040-7, 1999. a
Grossart, H.-p., Allgaier, M., Passow, U., and Riebesell, U.: Testing the effect of CO2 concentration on the dynamics of marine heterotrophic bacterioplankton, Limnol. Oceanogr., 51, 1–11, https://doi.org/10.4319/lo.2006.51.1.0001, 2006. a, b
Haberman, K. L., Quetin, L. B., and Ross, R. M.: Diet of the Antarctic krill (Euphausia superba Dana), J. Exp. Mar. Biol. Ecol., 283, 79–95, https://doi.org/10.1016/S0022-0981(02)00466-5, 2003. a, b
Hancock, A. M., Davidson, A. T., McKinlay, J., McMinn, A., Schulz, K. G., and van den Enden, R. L.: Ocean acidification changes the structure of an Antarctic coastal protistan community, Biogeosciences, 15, 2393–2410, https://doi.org/10.5194/bg-15-2393-2018, 2018a. a, b, c, d, e, f, g, h, i, j, k, l, m, n, o
Hancock, A. M., Davidson, A. T., McKinlay, J., McMinn, A., Schulz, K., and van den Enden, R. L.: Ocean acidification changes the structure of an Antarctic coastal protistan community, Ver. 2, Australian Antarctic Data Centre, https://doi.org/10.4225/15/592b83a5c7506, 2018b. a
Hoppe, C. J. M., Hassler, C. S., Payne, C. D., Tortell, P. D., Rost, B., and Trimborn, S.: Iron Limitation Modulates Ocean Acidification Effects on Southern Ocean Phytoplankton Communities, PLoS ONE, 8, e79890, https://doi.org/10.1371/journal.pone.0079890, 2013. a
Hutchins, D. A. and Fu, F.: Microorganisms and ocean global change, Nat. Microbiol., 2, 1–11, https://doi.org/10.1038/nmicrobiol.2017.58, 2017. a
IPCC: Climate Change 2013: The Physical Science Basis, Contribution of Working Group I to the Fifth Assessment Report of the Intergovernmental Panel on Climate Change, Cambridge University Press, Cambridge, United Kingdom and New York, NY, USA, https://doi.org/10.1017/CBO9781107415324, 2013. a
Kawaguchi, S., Ichii, T., and Naganobu, M.: Green krill, the indicator of micro- and nano-size phytoplankton availability to krill, Polar Biol., 22, 133–136, https://doi.org/10.1007/s003000050400, 1999. a
Kim, H., Spivack, A. J., and Menden-Deuer, S.: pH alters the swimming behaviors of the raphidophyte Heterosigma akashiwo: Implications for bloom formation in an acidified ocean, Harmful Algae, 26, 1–11, https://doi.org/10.1016/j.hal.2013.03.004, 2013. a
Krause, E., Wichels, A., Giménez, L., Lunau, M., Schilhabel, M. B., and Gerdts, G.: Small Changes in pH Have Direct Effects on Marine Bacterial Community Composition: A Microcosm Approach, PLoS ONE, 7, e47035, https://doi.org/10.1371/journal.pone.0047035, 2012. a
Landry, M. R. and Calbet, A.: Microzooplankton production in the oceans, ICES J. Mar. Sci., 61, 501–507, https://doi.org/10.1016/j.icesjms.2004.03.011, 2004. a
Li, G., Brown, C. M., Jeans, J. A., Donaher, N. A., McCarthy, A., and Campbell, D. A.: The nitrogen costs of photosynthesis in a diatom under current and future pCO2, New Phytol., 205, 533–543, https://doi.org/10.1111/nph.13037, 2015. a
Liang, Y., Bai, X., Jiang, Y., Wang, M., He, J., and McMinn, A.: Distribution of marine viruses and their potential hosts in Prydz Bay and adjacent Southern Ocean, Antarctic, Polar Biol., 39, 365–378, https://doi.org/10.1007/s00300-015-1787-8, 2016. a, b, c
Lin, L., He, J., Zhao, Y., Zhang, F., and Cai, M.: Flow cytometry investigation of picoplankton across latitudes and along the circum Antarctic Ocean, Acta Oceanol. Sin., 31, 134–142, https://doi.org/10.1007/s13131-012-0185-0, 2012. a, b
Lueker, T. J., Dickson, A. G., and Keeling, C. D.: Ocean pCO2 calculated from dissolved inorganic carbon, alkalinity, and equations for K1 and K2: validation based on laboratory measurements of CO2 in gas and seawater at equilibrium, Mar. Chem., 70, 105–119, https://doi.org/10.1016/S0304-4203(00)00022-0, 2000. a
Marie, D., Simon, N., and Vaulot, D.: Phytoplankton Cell Counting by Flow Cytometry, in: Algal Culturing Techniques, edited by: Anderson, R. A., chap. 17, Academic Press, San Diego, CA, USA, 253–267, https://doi.org/10.1016/B978-012088426-1/50018-4, 2005. a
McNeil, B. I. and Matear, R. J.: Southern Ocean acidification: A tipping point at 450-ppm atmospheric CO2, P. Natl. Acad. Sci. USA, 105, 18860–18864, https://doi.org/10.1073/pnas.0806318105, 2008. a
Meakin, N. G. and Wyman, M.: Rapid shifts in picoeukaryote community structure in response to ocean acidification, ISME J., 5, 1397–1405, https://doi.org/10.1038/ismej.2011.18, 2011. a
Mehrbach, C., Culberson, C. H., Hawley, J. E., and Pytkowicx, R. M.: Measurement of the Apparent Dissociation Constants of Carbonic Acid in Seawater At Atmospheric Pressure, Limnol. Oceanogr., 18, 897–907, https://doi.org/10.4319/lo.1973.18.6.0897, 1973. a
Meyer, B., Atkinson, A., Blume, B., and Bathmann, U. V.: Feeding and energy budgets of larval antarctic krill Euphausia superba in summer, Mar. Ecol. Prog. Ser., 257, 167–177, https://doi.org/10.3354/meps257167, 2003. a
Mitra, A., Flynn, K. J., Burkholder, J. M., Berge, T., Calbet, A., Raven, J. A., Granéli, E., Glibert, P. M., Hansen, P. J., Stoecker, D. K., Thingstad, F., Tillmann, U., Väge, S., Wilken, S., and Zubkov, M. V.: The role of mixotrophic protists in the biological carbon pump, Biogeosciences, 11, 995–1005, https://doi.org/10.5194/bg-11-995-2014, 2014. a
Morita, M., Suwa, R., Iguchi, A., Nakamura, M., Shimada, K., Sakai, K., and Suzuki, A.: Ocean acidification reduces sperm flagellar motility in broadcast spawning reef invertebrates, Zygote, 18, 103–107, https://doi.org/10.1017/S0967199409990177, 2010. a
Moustaka-Gouni, M., Kormas, K. A., Scotti, M., Vardaka, E., and Sommer, U.: Warming and Acidification Effects on Planktonic Heterotrophic Pico- and Nanoflagellates in a Mesocosm Experiment, Protist, 167, 389–410, https://doi.org/10.1016/j.protis.2016.06.004, 2016. a, b
Nakajima, A.: Increase in intracellular pH induces phosphorylation of axonemal proteins for activation of flagellar motility in starfish sperm, J. Exp. Biol., 208, 4411–4418, https://doi.org/10.1242/jeb.01906, 2005. a
Nakamura, M. and Morita, M.: Sperm motility of the scleractinian coral Acropora digitifera under preindustrial, current, and predicted ocean acidification regimes, Aquat. Biol., 15, 299–302, https://doi.org/10.3354/ab00436, 2012. a
Newbold, L. K., Oliver, A. E., Booth, T., Tiwari, B., DeSantis, T., Maguire, M., Andersen, G., van der Gast, C. J., and Whiteley, A. S.: The response of marine picoplankton to ocean acidification, Environ. Microbiol., 14, 2293–2307, https://doi.org/10.1111/j.1462-2920.2012.02762.x, 2012. a, b, c
Orr, J. C., Fabry, V. J., Aumont, O., Bopp, L., Doney, S. C., Feely, R. A., Gnanadesikan, A., Gruber, N., Ishida, A., Joos, F., Key, R. M., Lindsay, K., Maier-Reimer, E., Matear, R., Monfray, P., Mouchet, A., Najjar, R. G., Plattner, G.-K., Rodgers, K. B., Sabine, C. L., Sarmiento, J. L., Schlitzer, R., Slater, R. D., Totterdell, I. J., Weirig, M.-F., Yamanaka, Y., and Yool, A.: Anthropogenic ocean acidification over the twenty-first century and its impact on calcifying organisms, Nature, 437, 681–6, https://doi.org/10.1038/nature04095, 2005. a
Padan, E., Bibi, E., Ito, M., and Krulwich, T. A.: Alkaline pH homeostasis in bacteria: New insights, Biochim. Biophys. Acta, 1717, 67–88, https://doi.org/10.1016/j.bbamem.2005.09.010, 2005. a
Paulino, A. I., Egge, J. K., and Larsen, A.: Effects of increased atmospheric CO2 on small and intermediate sized osmotrophs during a nutrient induced phytoplankton bloom, Biogeosciences, 5, 739–748, https://doi.org/10.5194/bg-5-739-2008, 2008. a, b, c, d
Pearce, I., Davidson, A., Bell, E., and Wright, S.: Seasonal changes in the concentration and metabolic activity of bacteria and viruses at an Antarctic coastal site, Aquat. Microb. Ecol., 47, 11–23, https://doi.org/10.3354/ame047011, 2007. a, b
Pearce, I., Davidson, A. T., Thomson, P. G., Wright, S., and van den Enden, R.: Marine microbial ecology off East Antarctica (30–80∘ E): Rates of bacterial and phytoplankton growth and grazing by heterotrophic protists, Deep-Sea Res. Pt. II, 57, 849–862, https://doi.org/10.1016/j.dsr2.2008.04.039, 2010. a, b, c, d, e, f, g
Petrou, K., Baker, K. G., Nielsen, D. A., Hancock, A. M., Schulz, K. G., and Davidson, A. T.: Acidification diminishes diatom silica production in the Southern Ocean, Nat. Clim. Change, 9, 781–786, https://doi.org/10.1038/s41558-019-0557-y, 2019. a, b
Piontek, J., Lunau, M., Händel, N., Borchard, C., Wurst, M., and Engel, A.: Acidification increases microbial polysaccharide degradation in the ocean, Biogeosciences, 7, 1615–1624, https://doi.org/10.5194/bg-7-1615-2010, 2010. a
Pörtner, H. O.: Ecosystem effects of ocean acidification in times of ocean warming: A physiologist's view, Mar. Ecol. Prog. Ser., 373, 203–217, https://doi.org/10.3354/meps07768, 2008. a
Quetin, L. B. and Ross, R. M.: Feeding by Antarctic Krill, Euphausia superba: Does Size Matter?, in: Antarctic Nutrient Cycles and Food Webs, edited by: Siegfried, W., Condy, P., and Laws, R., Springer Berlin Heidelberg, Berlin, Heidelberg, 372–377, https://doi.org/10.1007/978-3-642-82275-9_52, 1985. a
R Core Team: R: A language and environment for statistical computing, R Foundation for Statistical Computing, Vienna, Austria, available at: https://www.R-project.org/ (last access: 2 August 2020), 2019. a
Raven, J., Caldeira, K., Elderfield, H., Hoegh-Guldberg, O., Liss, P., Riebesell, U., Shepherd, J., Turley, C., and Watson, A.: Ocean acidification due to increasing atmospheric carbon dioxide, Tech. Rep. June, Royal Society, UK, 2005. a
Riebesell, U., Wolf-Gladrow, D. A., and Smetacek, V.: Carbon dioxide limitation of marine phytoplankton growth rates, Nature, 361, 249–251, https://doi.org/10.1038/361249a0, 1993. a
Riebesell, U., Bellerby, R. G. J., Grossart, H.-P., and Thingstad, F.: Mesocosm CO2 perturbation studies: from organism to community level, Biogeosciences, 5, 1157–1164, https://doi.org/10.5194/bg-5-1157-2008, 2008. a
Roden, N. P., Shadwick, E. H., Tilbrook, B., and Trull, T. W.: Annual cycle of carbonate chemistry and decadal change in coastal Prydz Bay, East Antarctica, Mar. Chem., 155, 135–147, https://doi.org/10.1016/j.marchem.2013.06.006, 2013. a, b
Rose, J., Feng, Y., Gobler, C., Gutierrez, R., Hare, C., Leblanc, K., and Hutchins, D.: Effects of increased pCO2 and temperature on the North Atlantic spring bloom. II. Microzooplankton abundance and grazing, Mar. Ecol. Prog. Ser., 388, 27–40, https://doi.org/10.3354/meps08134, 2009a. a, b
Rose, J. M., Feng, Y., DiTullio, G. R., Dunbar, R. B., Hare, C. E., Lee, P. a., Lohan, M., Long, M., Smith, W. O. J., Sohst, B., Tozzi, S., Zhang, Y., and Hutchins, D. a.: Synergistic effects of iron and temperature on Antarctic phytoplankton and microzooplankton assemblages, Biogeosciences, 6, 3131–3147, https://doi.org/10.5194/bg-6-3131-2009, 2009b. a
Rose, J. M., Caron, D. A., Sieracki, M. E., and Poulton, N.: Counting heterotrophic nanoplanktonic protists in cultures and aquatic communities by flow cytometry, Aquat. Microb. Ecol., 34, 263–277, https://doi.org/10.3354/ame034263, 2004. a, b
Roy, A.-S., Gibbons, S. M., Schunck, H., Owens, S., Caporaso, J. G., Sperling, M., Nissimov, J. I., Romac, S., Bittner, L., Mühling, M., Riebesell, U., LaRoche, J., and Gilbert, J. A.: Ocean acidification shows negligible impacts on high-latitude bacterial community structure in coastal pelagic mesocosms, Biogeosciences, 10, 555–566, https://doi.org/10.5194/bg-10-555-2013, 2013. a, b, c
Sabine, C. L.: The Oceanic Sink for Anthropogenic CO2, Science, 305, 367–371, https://doi.org/10.1126/science.1097403, 2004. a
Safi, K. A., Griffiths, F. B., and Hall, J. A.: Microzooplankton composition, biomass and grazing rates along the WOCE SR3 line between Tasmania and Antarctica, Deep-Sea Res. Pt. I, 54, 1025–1041, https://doi.org/10.1016/j.dsr.2007.05.003, 2007. a, b
Sarmento, H. and Gasol, J. M.: Use of phytoplankton-derived dissolved organic carbon by different types of bacterioplankton, Environ. Microbiol., 14, 2348–2360, https://doi.org/10.1111/j.1462-2920.2012.02787.x, 2012. a
Schmidt, K., Atkinson, A., Petzke, K.-J., Voss, M., and Pond, D. W.: Protozoans as a food source for Antarctic krill, Euphausia superba: Complementary insights from stomach content, fatty acids, and stable isotopes, Limnol. Oceanogr., 51, 2409–2427, https://doi.org/10.4319/lo.2006.51.5.2409, 2006. a
Schulz, K. G., Bellerby, R. G. J., Brussaard, C. P. D., Büdenbender, J., Czerny, J., Engel, A., Fischer, M., Koch-Klavsen, S., Krug, S. A., Lischka, S., Ludwig, A., Meyerhöfer, M., Nondal, G., Silyakova, A., Stuhr, A., and Riebesell, U.: Temporal biomass dynamics of an Arctic plankton bloom in response to increasing levels of atmospheric carbon dioxide, Biogeosciences, 10, 161–180, https://doi.org/10.5194/bg-10-161-2013, 2013. a, b, c
Schulz, K. G., Bach, L. T., Bellerby, R. G. J., Bermúdez, R., Büdenbender, J., Boxhammer, T., Czerny, J., Engel, A., Ludwig, A., Meyerhöfer, M., Larsen, A., Paul, A. J., Sswat, M., and Riebesell, U.: Phytoplankton Blooms at Increasing Levels of Atmospheric Carbon Dioxide: Experimental Evidence for Negative Effects on Prymnesiophytes and Positive on Small Picoeukaryotes, Front. Mar. Sci., 4, 1–18, https://doi.org/10.3389/fmars.2017.00064, 2017. a
Sherr, E. B. and Sherr, B. F.: Significance of predation by protists, Anton. Leeuw., 81, 293–308, https://doi.org/10.1023/A:1020591307260, 2002. a, b, c
Smetacek, V., Assmy, P., and Henjes, J.: The role of grazing in structuring Southern Ocean pelagic ecosystems and biogeochemical cycles, Antarctic Sci., 16, 541–558, https://doi.org/10.1017/S0954102004002317, 2004. a, b
Sommer, U., Paul, C., and Moustaka-Gouni, M.: Warming and Ocean Acidification Effects on Phytoplankton – From Species Shifts to Size Shifts within Species in a Mesocosm Experiment, PLOS ONE, 10, e0125239, https://doi.org/10.1371/journal.pone.0125239, 2015. a
Stoecker, D. K., Hansen, P. J., Caron, D. A., and Mitra, A.: Mixotrophy in the Marine Plankton, Annu. Rev. Mar. Sci., 9, 311–335, https://doi.org/10.1146/annurev-marine-010816-060617, 2017. a, b
Suffrian, K., Simonelli, P., Nejstgaard, J. C., Putzeys, S., Carotenuto, Y., and Antia, A. N.: Microzooplankton grazing and phytoplankton growth in marine mesocosms with increased CO2 levels, Biogeosciences, 5, 1145–1156, https://doi.org/10.5194/bg-5-1145-2008, 2008. a, b
Takahashi, T., Sweeney, C., Hales, B., Chipman, D., Newberger, T., Goddard, J., Iannuzzi, R., and Sutherland, S.: The Changing Carbon Cycle in the Southern Ocean, Oceanography, 25, 26–37, https://doi.org/10.5670/oceanog.2012.71, 2012. a
Teira, E., Fernández, A., Álvarez-Salgado, X. A., García-Martín, E. E., Serret, P., and Sobrino, C.: Response of two marine bacterial isolates to high CO2 concentration, Mar. Ecol. Prog. Ser., 453, 27–36, https://doi.org/10.3354/meps09644, 2012. a, b
Thomson, P., Davidson, A., and Maher, L.: Increasing CO2 changes community composition of pico- and nano-sized protists and prokaryotes at a coastal Antarctic site, Mar. Ecol. Prog. Ser., 554, 51–69, https://doi.org/10.3354/meps11803, 2016. a, b, c, d, e, f, g, h, i, j, k, l, m, n
Thomson, P. G., Davidson, A. T., van den Enden, R., Pearce, I., Seuront, L., Paterson, J. S., and Williams, G. D.: Distribution and abundance of marine microbes in the Southern Ocean between 30 and 80∘ E, Deep-Sea Res. Pt. II, 57, 815–827, https://doi.org/10.1016/j.dsr2.2008.10.040, 2010. a
Tortell, P. D., Payne, C. D., Li, Y., Trimborn, S., Rost, B., Smith, W. O., Riesselman, C., Dunbar, R. B., Sedwick, P., and DiTullio, G. R.: CO2 sensitivity of Southern Ocean phytoplankton, Geophys. Res. Lett., 35, L04605, https://doi.org/10.1029/2007GL032583, 2008. a
Tréguer, P., Bowler, C., Moriceau, B., Dutkiewicz, S., Gehlen, M., Aumont, O., Bittner, L., Dugdale, R., Finkel, Z., Iudicone, D., Jahn, O., Guidi, L., Lasbleiz, M., Leblanc, K., Levy, M., and Pondaven, P.: Influence of diatom diversity on the ocean biological carbon pump, Nat. Geosci., 11, 27–37, https://doi.org/10.1038/s41561-017-0028-x, 2018. a
Trimborn, S., Thoms, S., Brenneis, T., Heiden, J. P., Beszteri, S., and Bischof, K.: Two Southern Ocean diatoms are more sensitive to ocean acidification and changes in irradiance than the prymnesiophyte Phaeocystis antarctica, Physiol. Plantarum, 160, 155–170, https://doi.org/10.1111/ppl.12539, 2017. a
Wang, Y., Zhang, R., Zheng, Q., Deng, Y., Van Nostrand, J. D., Zhou, J., and Jiao, N.: Bacterioplankton community resilience to ocean acidification: evidence from microbial network analysis, ICES J. Mar. Sci., 73, 865–875, https://doi.org/10.1093/icesjms/fsv187, 2016. a
Westwood, K. J., Thomson, P. G., van den Enden, R. L., Maher, L. E., Wright, S. W., and Davidson, A. T.: Ocean acidification impacts primary and bacterial production in Antarctic coastal waters during austral summer, J. Exp. Mar. Biol. Ecol., 498, 46–60, https://doi.org/10.1016/j.jembe.2017.11.003, 2018. a, b, c, d, e, f
Wickham, H.: ggplot2: Elegant Graphics for Data Analysis, Springer-Verlag New York, available at: https://ggplot2.tidyverse.org (last access: 10 June 2020), 2016. a
Wood, S. N.: Fast stable restricted maximum likelihood and marginal likelihood estimation of semiparametric generalized linear models, J. Roy. Stat. Soc. B, 73, 3–36, 2011. a
Wright, S. W., Ishikawa, A., Marchant, H. J., Davidson, A. T., van den Enden, R. L., and Nash, G. V.: Composition and significance of picophytoplankton in Antarctic waters, Polar Biol., 32, 797–808, https://doi.org/10.1007/s00300-009-0582-9, 2009. a, b
Young, J., Kranz, S., Goldman, J., Tortell, P., and Morel, F.: Antarctic phytoplankton down-regulate their carbon-concentrating mechanisms under high CO2 with no change in growth rates, Mar. Ecol. Prog. Ser., 532, 13–28, https://doi.org/10.3354/meps11336, 2015. a
Zhang, R., Xia, X., Lau, S. C. K., Motegi, C., Weinbauer, M. G., and Jiao, N.: Response of bacterioplankton community structure to an artificial gradient of pCO2 in the Arctic Ocean, Biogeosciences, 10, 3679–3689, https://doi.org/10.5194/bg-10-3679-2013, 2013. a, b, c
- Article
(3542 KB) - Full-text XML