the Creative Commons Attribution 4.0 License.
the Creative Commons Attribution 4.0 License.
 | 16 May 2024
Factors controlling spatiotemporal variability of soil carbon accumulation and stock estimates in a tidal salt marsh
Sean Fettrow
Andrew Wozniak
Holly A. Michael
Tidal salt marshes are important contributors to soil carbon (C) stocks despite their relatively small land surface area. Although it is well understood that salt marshes have soil C burial rates orders of magnitude greater than those of terrestrial ecosystems, there is a wide range in accrual rates among spatially distributed marshes. In addition, wide ranges in C accrual rates also exist within a single marsh ecosystem. Tidal marshes often contain multiple species of cordgrass due to variations in hydrology and soil biogeochemistry caused by microtopography and distance from tidal creeks, creating distinct subsites. Our overarching objective was to observe how soil C concentration and dissolved organic carbon (DOC) vary across four plant phenophases and across three subsites categorized by unique vegetation and hydrology. We also investigated the dominant biogeochemical controls on the spatiotemporal variability of soil C and DOC concentrations. We hypothesized that subsite biogeochemistry drives spatial heterogeneity in soil C concentration, and this causes variability in total soil C and DOC concentrations at the marsh scale. In addition, we hypothesized that soil C concentration and porewater biogeochemistry vary temporally across the four plant phenophases (i.e., senescence, dormancy, green-up, maturity). To test these interrelated hypotheses, we quantified soil C and DOC concentrations in 12 cm sections of soil cores (0–48 cm depth) across time (i.e., phenophase) and space (i.e., subsite), alongside several other porewater biogeochemical variables. Soil C concentration varied significantly (p < 0.05) among the three subsites and was significantly greater during plant dormancy. Soil S, porewater sulfide, redox potential, and depth predicted 44 % of the variability in soil C concentration. There were also significant spatial differences in the optical characterization properties of DOC across subsites. Our results show that soil C varied spatially across a marsh ecosystem by up to 63 % and across plant phenophase by 26 %, causing variability in soil C accrual rates and stocks depending on where and when samples are taken. This shows that hydrology, biogeochemistry, and plant phenology are major controls on salt marsh C content. It is critical to consider spatiotemporal heterogeneity in soil C concentration and porewater biogeochemistry to account for these sources of uncertainty in C stock estimates. We recommend that multiple locations and sampling time points are sampled when conducting blue C assessments to account for ecosystem-scale variability.
- Article
(2619 KB) - Full-text XML
-
Supplement
(530 KB) - BibTeX
- EndNote


Coastal blue carbon (C) cycled in tidal salt marshes is critically important for global soil C sequestration despite the small relative land area (Mcowen et al., 2017). High primary productivity coupled with high sedimentation rates and slowed organic C decomposition due to flooded anoxic soils allow salt marshes to rapidly accrete and preserve soil C (Arias-Ortiz et al., 2018). Soils in such ecosystems retain approximately 15 % of their yearly primary productivity in soils compared to just 1 % for tropical rainforests (Duarte, 2017). Restoring, protecting, and artificially creating salt marshes can facilitate removal of CO2 from the atmosphere and storage in soils on timescales conducive to climate change mitigation goals. These ecosystems should therefore be included in climate mitigation policy (Ewers Lewis et al., 2019; Serrano et al., 2019). However, a wide range of global salt marsh soil C sequestration rates of ∼ 1 to > 1100 has been reported (Wang et al., 2021). The inclusion of salt marshes in improved climate mitigation policy is, in part, contingent upon improving our understanding of the environmental variables causing wide ranges in marsh soil C concentration and thus soil sequestration rates (Saintilan et al., 2013; Macreadie et al., 2019). Understanding key controls on salt marsh soil C variability will also decrease uncertainty in Earth system models and inform new policy aimed at protecting these valuable ecosystems.
Soil C concentrations in salt marsh ecosystems vary spatially across the globe. Part of this variation is explained by regional environmental controls such as average annual air temperature (Chmura et al., 2003); geomorphic setting (van Ardenne et al., 2018); salinity gradients; inundation frequency (Van de Broek et al., 2016; Baustian et al., 2017; Luo et al., 2019); rainfall patterns (Sanders et al., 2016; Negandhi et al., 2019); soil controls such as pH, soil moisture, and soil type; and plant controls such as the dominant plant species (Bai et al., 2016; Ford et al., 2019). Soil C accumulation rates also vary based on the age of the marsh and tend to be highest in newly expanding marsh edges (Miller et al., 2022). Other logistical factors contributing to variability and heterogeneity in salt marsh blue C estimates include the type of corer used (Smeaton et al., 2020) and the depth of soil that is integrated into soil C accrual rates (Bai et al., 2016; Van de Broek et al., 2016; Mueller et al., 2019). While understanding global and regional controls on soil C is important for reducing uncertainty in C estimates, understanding site-level factors is also critical because ecosystem-level variability can be just as high as regional- to global-level variability (Ewers Lewis et al., 2018). Belowground biogeochemical heterogeneity can be attributed to the aboveground vegetation and plant controls due to striking zonation of marsh grass species across the marsh platform. This is often associated with small spatial-scale changes in hydrologic patterns (Guimond et al., 2020a, b) based on proximity to the tidal channel that drives unique subsite biogeochemistry (Seyfferth et al., 2020), which subsequently determines the type of vegetation that can survive within a given tidal zone (Davy et al., 2011). While tidal zonation alters vegetation and belowground biogeochemistry, it remains unclear if soil C concentrations are directly or indirectly altered by these coupled plant and soil biogeochemical controls.
Primary production rates may partially control soil C concentration and may vary among vegetative zones. For example, the short form of Spartina alterniflora has a lower primary production rate than the tall form (Roman and Daiber, 1984), and Phragmites australis has above- and belowground production rates 2 times that of the shorter Spartina patens (Windham, 2001). Belowground production of dissolved organic carbon (DOC) can arise from root exudation (Luo et al., 2018) and influence soil C concentration because belowground productivity often exceeds aboveground productivity in these ecosystems (Frasco and Good, 1982). Even though DOC exudates are considered to be labile (Yousefi Lalimi et al., 2018), they may contribute to soil C accumulation over time due to microbial transformation (Valle et al., 2018) and association with soil minerals such as Fe oxides (Chen et al., 2014; Chen and Sparks, 2015; Sowers et al., 2018a, b, 2019). The optical characterization of DOC of chromophoric dissolved organic carbon (CDOM) can also affect degradability (Clark et al., 2014) and may differ across the marsh platform as a result of differing plant species.
Vegetation zones or subsites can have unique biogeochemical signatures based on soil redox conditions and inundation extent and frequency. For example, high marsh areas and areas near tidal channels have soils which are at least periodically oxic to sub-oxic and are dominated by iron (III) reduction, whereas low marsh areas have continuously inundated soils and are dominated by sulfate () reduction (Seyfferth et al., 2020). While these biogeochemical characteristics can directly influence vegetation (Moffett and Gorelick, 2016) and thus indirectly influence soil C concentrations, these heterogeneous biogeochemical characteristics may also directly affect soil C through the interactions of soil C cycling with soil minerals. Fe oxides have an intimate role in the C cycle and C stabilization in soils experiencing dynamic redox fluctuation (Sodano et al., 2017), as previous work has shown that 99 % of the dissolved Fe in the ocean is complexed with organic ligands (Whitby et al., 2020), and ∼ 21 % of all organic C in marine sediments is bound to reactive Fe species (Lalonde et al., 2012). Fe oxides may play an important role in C stabilization in soils experiencing dynamic redox fluctuation. Fe oxides can protect DOC against microbial degradation through physiochemical protection (Blair and Aller, 2012; Chen and Sparks, 2015; Sodano et al., 2017; Sowers et al., 2018a; Dorau et al., 2019; Wordofa et al., 2019), but these organomineral assemblages can be dissociated under reducing conditions (Riedel et al., 2013; Wordofa et al., 2019; Lacroix et al., 2022; Fettrow et al., 2023a). Therefore, examining the spatial variability in soil biogeochemistry and relating those variables to soil C concentration may elucidate important mechanisms that cause the wide range in salt marsh soil C concentrations.
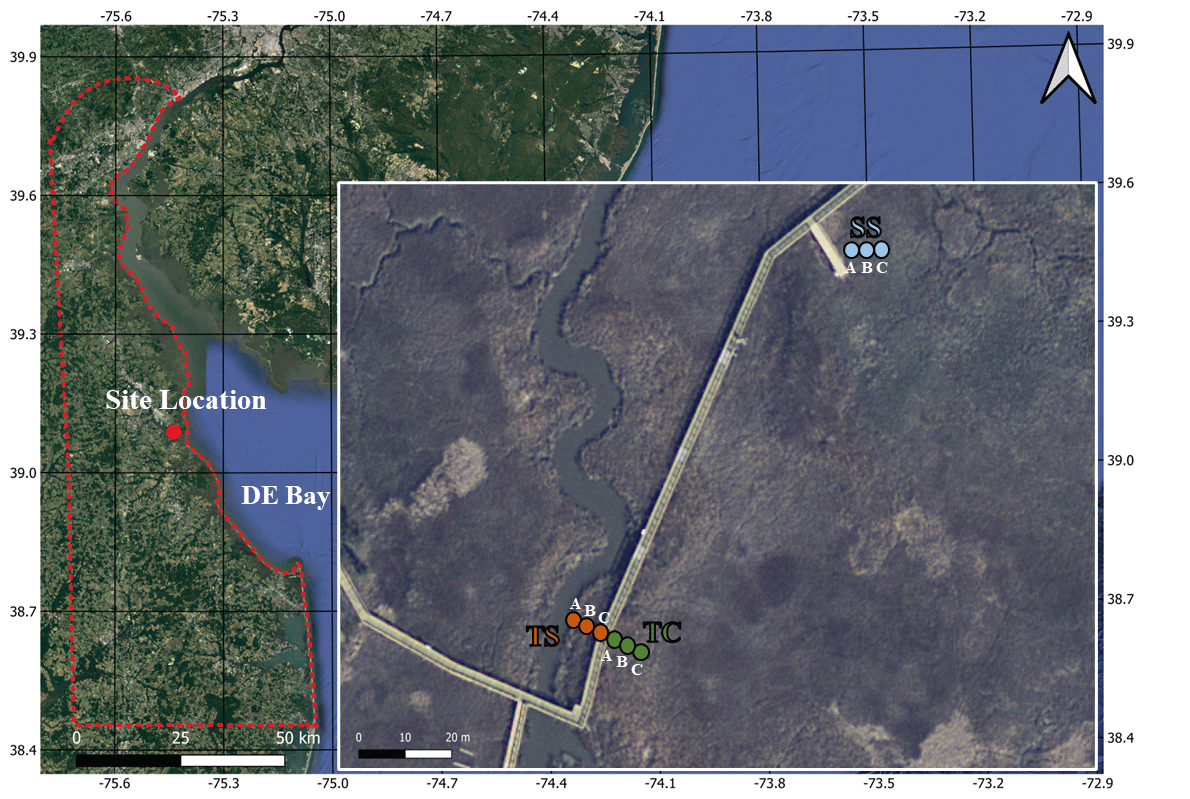
Figure 1Map of the field site located at the St. Jones Reserve near Dover, DE. Three unique subsites (TS, TC, and SS) have been characterized based on previous studies at this field site showing subsite-specific hydrology, vegetation, and biogeochemistry based on distance from the tidal creek (Guimond et al., 2020a; Seyfferth et al., 2020). The coring locations were sampled in triplicate (cores A, B, and C), with core A starting closest to the creek and each subsequent core in each subsite being ∼ 30 cm from one another. The base layer for the map was obtained from public base layers in QGIS (©Google Maps).
While it is critical to assess spatial heterogeneity in soil C concentration, it is also important to assess temporal variability. The temporal assessment of soil C in salt marshes often considers long-term trends in historic C burial rates (Cusack et al., 2018; McTigue et al., 2019; Breithaupt et al., 2020; Cuellar-Martinez et al., 2020), but variability of salt marsh soil C concentrations may also occur on shorter timescales such as across a single year. Several studies suggest salt marsh soil C does not significantly change across seasons throughout the year (Yu et al., 2014; Zhao et al., 2016), even though major changes in soil biogeochemical variables occur on this timescale (Koretsky et al., 2005; Negrin et al., 2011; Seyfferth et al., 2020; Trifunovic et al., 2020; Zhu et al., 2021). While soil C concentration may be stable across seasons, it is unclear if soil C concentration changes based on site-specific plant phenology. The phenophase of a marsh is associated with the greenness index of vegetation (Trifunovic et al., 2020) and is strongly associated with C dynamics in wetland systems (Desai, 2010; Kang et al., 2016). Soil C concentration should be measured across plant phenophase to determine if temporal changes in phenology alter soil C concentration, adding to variability in blue C estimates.
To address these knowledge gaps, we conducted a year-long study of a temperate tidal salt marsh to assess how soil C concentration and porewater biogeochemistry change in space (subsite) and time (phenophase). Our overarching research objectives were to understand how soil C and porewater DOC concentration and properties change across spatial and temporal scales and to investigate key biogeochemical drivers of these C concentrations at the ecosystem level. We hypothesized that subsites would contain significantly different concentrations of soil C due to differences in soil biogeochemistry across the marsh platform. We further hypothesized that soil C concentration and associated porewater DOC and biogeochemistry would significantly differ across plant phenophase. Our results improve understanding of mechanistic controls on salt marsh soil C with implications for characterizing and reducing uncertainty in C sequestration estimates, while also adding to the body of literature that shows tidal salt marshes are critical reservoirs of sequestered C.
2.1 Field site
This study was conducted at the St. Jones National Estuarine Research Reserve located in Dover, Delaware (Fig. 1). The ecosystem is classified as a temperate mesohaline tidal salt marsh with a tidal creek salinity ranging from 5 to 18 ppt (Capooci et al., 2019). Three separate subsites were previously identified at this site, each with a different vegetation type and hydrology (Guimond et al., 2020a; Seyfferth et al., 2020). The subsite nearest the channel is primarily colonized by the tall form of Spartina alterniflora and has semidiurnal tidal oscillation. This subsite is hereafter referred to as tall Spartina (TS). Farther from the tidal channel, the elevation is slightly higher due to a natural levee, and flooding of the upper 25 cm of soil occurs only during spring tides; this location has the larger cordgrass S. cynosuroides and is hereafter referred to as tall cordgrass (TC). The third subsite is the farthest from the tidal channel, the lowest in elevation, and is primarily colonized by the short form of S. alterniflora due to near-continuous inundation; this subsite is hereafter referred to as short Spartina (SS). These subsites have distinct hydro-biogeochemistry and vegetation that vary across small spatial scales and thus provide an ideal setting to understand site-level variability in soil C concentration and porewater biogeochemistry as well as their relationships.
2.2 Soil sampling and analysis
Soil cores were obtained from each of the three subsites (TS, TC, SS) in triplicate during each sampling event. Replicates were taken approximately 30 cm from one another and are labeled cores A, B, and C based on distance to the tidal channel, with A being closest to the channel and C the farthest (Fig. 1). Sampling events occurred at four separate times of the year to coincide with each of the phenophases (i.e., senescence on 3 October 2019, dormancy on 3 December 2019, green-up on 29 April 2020, maturity on 13 August 2020), which were previously determined using the Greenness Index (Trifunovic et al., 2020). Cores were obtained at the same tidal inundation cycle each season to ensure consistent saturation during each campaign. Each sampling campaign resulted in 36 total cores (or 144 core sections; see below) that we used to understand spatiotemporal variability; unfortunately, we could not obtain more cores due to conditions of the strict soil coring permit at the estuarine preserve. Soil cores (6 cm × 48 cm) were extracted using a gouge auger that has been shown to be an effective coring technique for reducing compaction in soft marsh soils (Smeaton et al., 2020). Soil cores were quickly sectioned in the field into 12 cm increments (0–12, 12–24, 24–36, and 36–48 cm relative to the soil surface) and preserved under anoxic conditions following previous methods (Seyfferth et al., 2020). For reference, the rooting zone of Spartina grasses is between 8–20 cm (Muench and Elsey-Quirk, 2019), so the upper two sections likely include C from fresh root exudates. The 12 cm increments were chosen because many soil C stock papers use increments between 10–15 cm, and there tends to be little variation across the ∼ 10 cm increment in a variety of wetland soils (Baustian et al., 2017). Briefly, the soil sections were placed into 250 mL HDPE bottles which were left uncapped in gas-impermeable bags that contained oxygen scrubbers (AnaeroPack-Anero, Mitsubishi), and the bags were vacuum sealed in the field. The soil samples were placed on ice during transport back to the lab. Once back in the lab, the soil sections in the gas-impermeable bags were immediately placed inside an anoxic glove bag containing ∼ 5 % hydrogen and ∼ 95 % nitrogen. A subsample of soil was dried, ground, sieved (2 mm), and powdered for analysis of total C and S (vario EL cube, Elementar). We clarify that we did not separate inorganic versus organic soil C and report only total soil C. Soil C and S are reported as percent C (= 100 ) and percent S (= 100 ). We used soil C percent to calculate soil C stocks using previously obtained bulk density measurements at our field site (Wilson and Smith 2015), and we calculated soil C accrual rates using previously obtained sedimentation rate values (Tucker 2016). The remaining field-moist soil was left inside the HDPE vial, capped inside the glove bag and centrifuged for extraction of residual porewater. The amount of porewater we obtained was a function of soil saturation that was consistent during each campaign because we sampled at the same tidal cycle each season. After centrifugation, the remaining soil sample was further dried inside of the glove bag. While this drying procedure could have introduced artificial H2-fueled metabolism, this should be negligible because the soils were rapidly dried within the glove bag with freshly replaced desiccant and because the saturated sample was only minimally in contact with the H2 atmosphere.
2.3 Porewater extraction and analysis
Porewater was extracted from each 12 cm soil section by centrifugation for 2 min under an anoxic atmosphere at 2500 rpm. A portion of the porewater was filtered with 0.45 µm PTFE syringe filters, while the rest was vacuum filtered using glass fiber filters (0.7 µm). The 0.45 µm PTFE-filtered porewater was immediately analyzed for Fe2+ using the ferrozine colorimetric method (Stookey, 1970), S2− using the methylene blue method (Cline, 1969), redox potential with a 220 mV offset, pH, and conductivity using calibrated probes (Orion Ross ultra pH/ATC triode, Orion 9179E triode, Orion DuraProbe conductivity cell), and the remaining sample was acidified to 2 % HNO3 for elemental analysis using inductively coupled plasma optical emission spectroscopy (ICP–OES). The porewater filtered with glass fiber (0.7 µm) was acidified with HCl and analyzed for DOC (vario TOC analyzer, Elementar). To characterize the DOC, unacidified DOC samples from the plant maturity sampling event were analyzed via ultraviolet–visible (UV–VIS) and excitation–emission matrix spectroscopy (EEMS) (Aqualog spectrophotometer, Horiba). The Aqualog was zeroed with double-deionized water blanks, checked using the manufacturer's excitation check, corrected for inner filter effects, and applied with first- and second-order Rayleigh masking, and data were normalized using the average Raman area (Gao et al., 2011; Clark et al., 2014). Measurements were taken over the wavelengths of 200–730 nm with 2 nm steps. Fluorescence and absorbance peaks and indices were calculated using previously established equations (Table S1 in the Supplement).
2.4 Statistical analysis
A three-way analysis of variance (ANOVA) was performed to understand significant interactions between factors of subsite, depth, and phenophase on soil and porewater variables. Subsequently, statistical differences between subsites and phenophase were analyzed using repeated measures ANOVA with a post hoc Tukey honest significant difference (HSD) analysis to determine differences between individual subsites and phenophases. Assumptions of ANOVA were met by assessing for normality with Q–Q plots prior to analysis and transforming when necessary. Equal variance was tested to ensure homogeneity of variance between subgroups using Levene's test. Correlations with depth were analyzed using linear regression, and only the significant (p < 0.05) relationships are reported. Relationships among all measured variables were assessed using principal component analysis. In addition, a stepwise regression model was built to determine variables that significantly predict soil C concentration. This was done by maximizing the R2 value of the model while using the lowest number of variables to explain the variance. All statistical analyses were conducted in JMP (version 16.2).
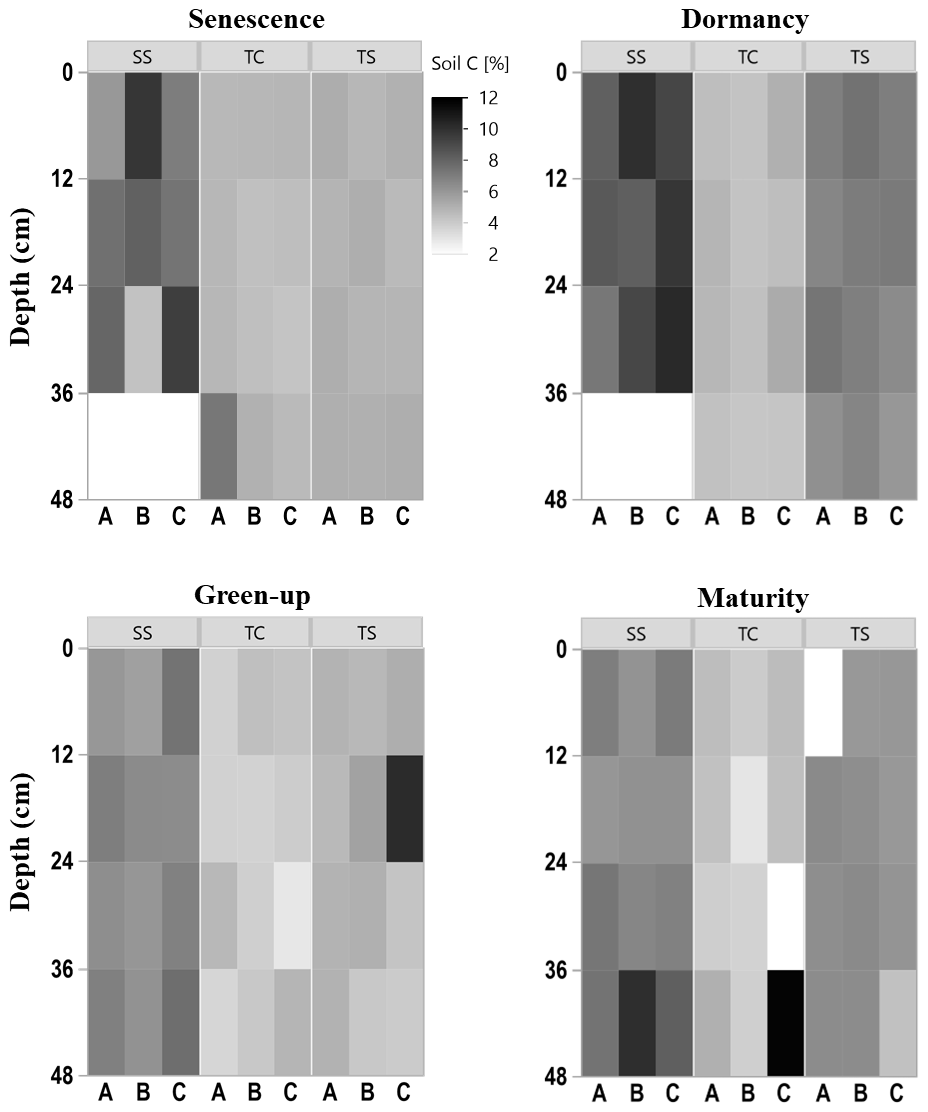
Figure 2Heat maps of soil C concentration with depth at the three subsites (SS, TC, and TS) at all four phenophases and for each replicate core (A, closest to channel; B; and C, farthest from channel). No measurement was able to be obtained for some 12 cm sections, as shown by the white rectangles.
3.1 Soil carbon and sulfur
To explore the spatiotemporal heterogeneity in soil carbon (C) and sulfur (S) at each subsite, subsamples of each collected soil increment were combusted for soil C and S concentration. Concentrations of soil C were highly variable among subsites, phenophase, depth, and replicate cores (Fig. 2), indicating several spatiotemporal sources of variability in marsh soil C estimates. SS appeared to have higher soil C concentrations, as illustrated by the darker colors in the heat map, compared to both TS and TC. Soil C also appeared higher at TS than at TC, illustrated by the relatively darker colors in the heat map. For all subsites, soil C concentrations changed throughout the year, appearing higher during plant dormancy and lower during green-up. However, variability across individual replicates, A, B, and C, and with depth complicated generalities across time and space. For example, at subsite SS from 24–36 cm during senescence, core A is ∼ 5 % soil C, while core C is ∼ 10 % soil C, a factor of 2 difference between replicates. Large ranges among replicates were also observed during green-up at TS from 12–24 cm and during maturity at TC from 36–48 cm. This exemplifies the high spatial and temporal heterogeneity inherent in marsh soils and indicates several sources of uncertainty in marsh soil C estimates.
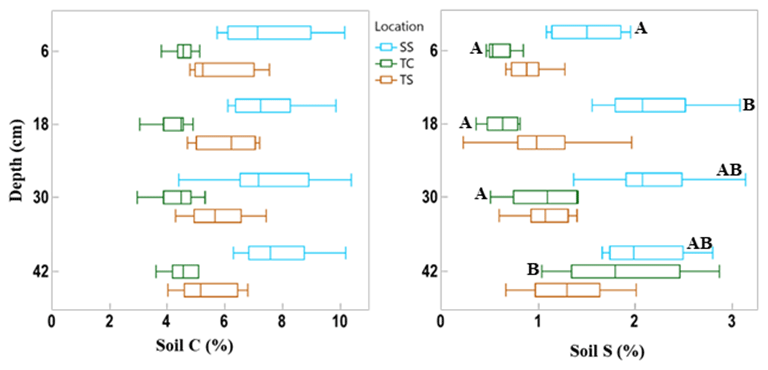
Figure 3Box and whisker plot of soil C and S concentrations across the three subsites and separated by the four sampling depths. This indicates the difference in soil C and S variability among subsites and with depth. The whiskers indicate the minimum and maximum values, and the box indicates the upper and lower quartiles. The line in the box indicates the median. Letters with significant differences (p < 0.05) with depth for each subsite are shown by different letters; subsites and depths with no letters are statistically similar.
There was also variability in soil C concentration with depth (Fig. 3). Subsite SS had the highest mean soil C concentration at all four depths, as well as the largest range in values. TS had the second highest mean soil C values at all four depths as well as the second largest range in values. TC had the lowest mean soil C at all four depths as well as the smallest range in values at each depth. It is clear from this graph that SS contains higher overall concentrations of soil C, followed by TS and then TC. When observing linear trends with depth, soil C at TS during dormancy significantly decreased with depth (R2 = 0.44, p = 0.02), and soil C at SS during maturity significantly increased with depth (R2 = 0.41, p = 0.02). No other linear correlations in soil C existed with depth.
We also assessed differences in soil C and S with depth by averaging by phenology and subsite replicates (Fig. 3). These results showed that there were no significant differences in soil C with depth. For soil S, only the first and second depths were significantly different from one another at site SS, and at TC, the deepest cores had significantly more soil S than all other depths.
SS had the highest mean soil S concentration at each depth, and the range of values initially increased with depth. TS had a higher mean concentration than TC at all depths except at the bottom core section. The range of soil S values increased with depth at TC, while the range was more consistent with depth at TS, except for the wide range of values measured at the 18 cm depth interval. Soil S at SS during maturity significantly increased with depth (R2 = 0.50, p = 0.01), as did TC during dormancy (R2 = 0.88, p < 0.0001), green-up (R2 = 0.51, p = 0.01), and senescence (R2 = 0.42, p = 0.02).
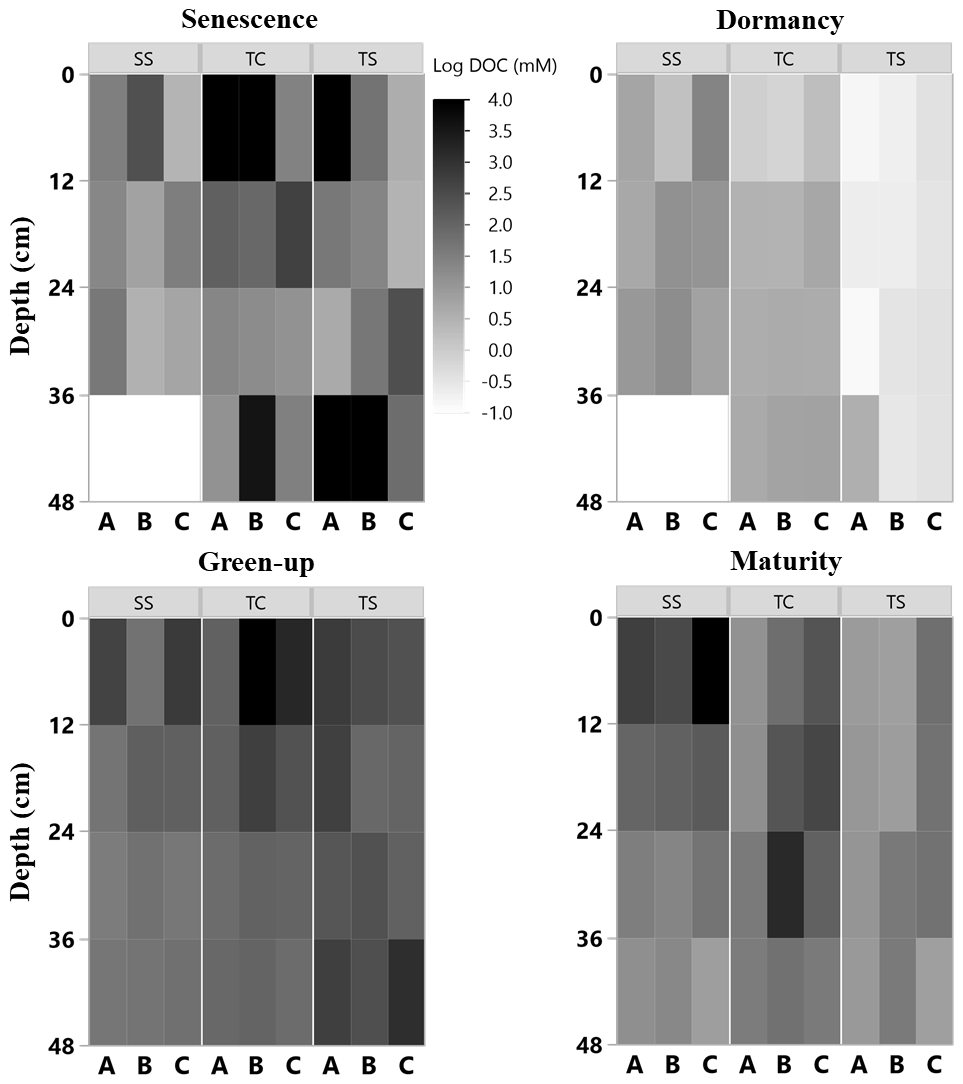
Figure 4Heat maps of porewater DOC (natural log) concentration with depth at the three subsites (SS, TC, and TS) at all four phenophases and for each replicate core (A, closest to channel; B; and C, farthest from channel). No measurement was able to be obtained for some 12 cm sections, as shown by the white rectangles.
3.2 Porewater data
3.2.1 Porewater DOC and characterization
Porewater DOC was highly variable across subsites, phenophase, depth, and replicate cores (Fig. 4). Note that the data in Fig. 4 have been log transformed (natural log) due to large ranges in values across the 1-year sampling campaign. Unlike soil C, which was relatively consistent with depth, DOC concentrations were highly variable with depth and even more so among replicate cores. Some of the highest individual concentrations of DOC were detected nearest the surface and rooting zone, which can extend to 20 cm below the surface (Muench and Elsey-Quirk, 2019), but also at depth at SS during senescence. DOC concentrations decreased with depth at SS during green-up (R2 = 0.44, p = 0.02) and maturity (R2 = 0.37, p = 0.03) and increased with depth at TC during dormancy (R2 = 0.76, p = 0.0002). These results indicate the highly variable nature of porewater DOC concentrations, possibly leading to additional uncertainty and complexity in marsh soil C estimates. In addition, we summarized DOC concentrations across depths and subsite (Fig. 5) to better understand variability with depth. The top depth increment at 6 cm appeared to contain the greatest variability, particularly at subsite TC. Variability at TC decreased with depth, as did variability at SS. This is apparent because the range tends to decrease with depth at both TC and SS. Overall, TC seems to contain the most variability followed by TS, and SS appears to contain the least amount of variability at each depth increment.
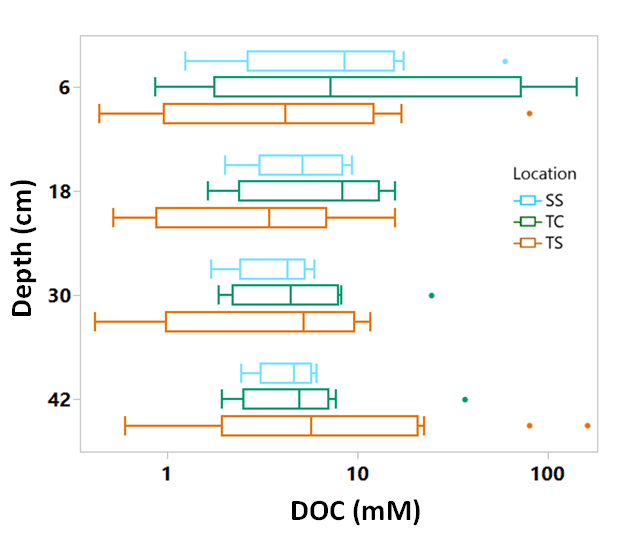
Figure 5Box and whisker plot of porewater DOC concentrations plotted on log scale across the three subsites at all phenophases and separated by the four sampling depths. The whiskers indicate the minimum and maximum values, and the box indicates the upper and lower quartiles. The points outside the boxes indicate outliers. Due to large variability present across depths, there are no statistically significant differences between depths.
Porewater ultraviolet–visible (UV–VIS) and excitation–emission matrix (EEM) data were collected only from the maturity sampling event to further characterize DOC molecular properties (Fig. 5). Optical properties (i.e., peaks, indices) from spectroscopic data were calculated and interpreted following previous studies cited in the supplemental table (Table S1). These data show significant trends with depth at SS. At SS, coble peak intensities T (R2 = 0.55, p = 0.01), B (R2 = 0.49, p = 0.01), A (R2 = 0.57, p = 0.004), M (R2 = 0.55, p = 0.01), and C (R2 = 0.49, p = 0.01) all significantly decreased with depth, as did the fluorescence index (FI) (R2 = 0.79, p = 0.0001), the biological index (BIX) (R2 = 0.50, p < 0.01), and absorbance at 254 nm (Abs254) (R2 = 0.36, p = 0.04), indicating decreases in CDOM with depth. To ensure the coble peaks represented changes in CDOM properties and not DOC concentration, they were normalized to DOC concentration, and the relationships remained significant (p < 0.05), except for the coble B peak (R2 = 0.11, p = 0.20). The E2:E3 (R2 = 0.50, p = 0.01) and SUVA254 (R2 = 0.53, p = 0.007) significantly increased with depth at SS, indicating a decrease in molecular weight and an increase in aromaticity with depth. No significant trends with depth were present at TC or TS. Differences in DOC molecular properties among subsites are apparent for many of the calculated indices and peaks.
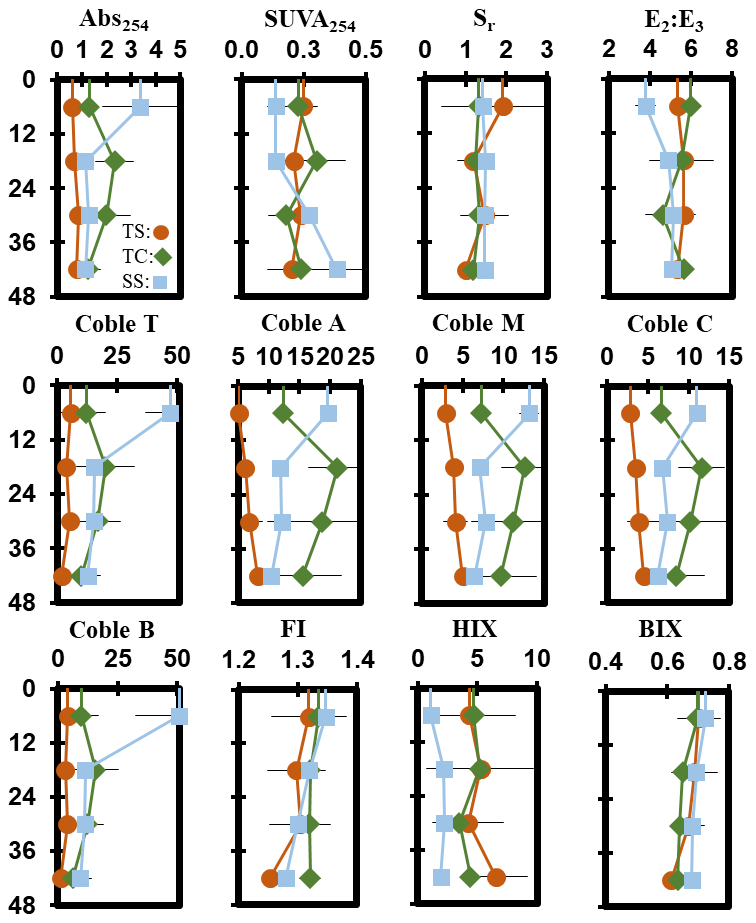
Figure 6Depth profiles of porewater EEM–UV–VIS peaks and indices down to 48 cm taken during the maturity sampling event. Each point represents the mean between replicates (n=3), with error lines indicating the standard deviation (± 1 SD).
3.2.2 Porewater chemistry
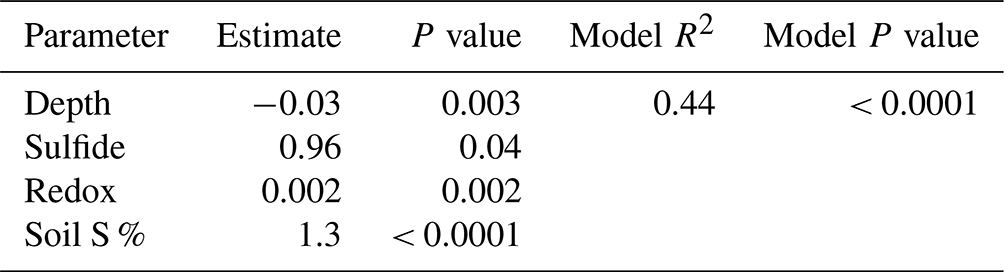
Measured porewater biogeochemistry was variable across subsites, phenophase, and depth (Fig. 6). Porewater redox potentials showed minimal trends with depth, except for a significant decrease with depth at SS during maturity (R2 = 0.58, p = 0.004), though redox showed variability between replicates (Fig. S1 in the Supplement). The pH was relatively consistent with depth, except for a significant increase with depth at TC during dormancy (R2 = 0.42, p = 0.02) and a significant decrease with depth at TS during dormancy (R2 = 0.56, p = 0.005). Redox potential and pH formed a significant but weak negative correlation (R2 = 0.12, p < 0.0001) across the entire 1-year dataset.
Porewater S2− varied significantly with depth. S2− increased significantly with depth across the entire 1-year dataset (R2 = 0.04, p = 0.03). S2− increased significantly with depth at SS during green-up (R2 = 0.51, p = 0.01) and maturity (R2 = 0.86, p < 0.0001). TS S2− increased significantly during green-up (R2 = 0.46, p = 0.02), while TC S2− increased significantly during maturity (R2 = 0.36, p = 0.04). Porewater Fe2+ trended negatively with S2− (R2 = 0.06, p = 0.004) and decreased with depth (p = 0.01, R2 = 0.05) across the entire 1-year dataset. Significant decreases were observed at TS during green-up (R2 = 0.68, p = 0.001) and at SS during maturity (R2 = 0.41, p = 0.02). Total Fe concentration followed similar depth trends to Fe2+, with a significant decrease with depth across the entire 1-year experiment (R2 = 0.06, p = 0.01). Total Fe decreased with depth at TS during senescence (R2 = 0.41, p = 0.03) and green-up (R2 = 0.58, p = 0.004) and at SS during maturity (R2 = 0.57, p = 0.01).
Porewater salinity formed varying relationships with depth. Salinity significantly decreased with depth at TC during senescence (R2 = 0.52, p = 0.01) and at SS during maturity (R2 = 0.62, p = 0.002), while salinity significantly increased with depth at TC during green-up (R2 = 0.69, p = 0.001) and at TS during maturity (R2 = 0.87, p < 0.0001). Salinity and total Ca generally increased together (p > 0.0001, R2 = 0.42) across the entire 1-year experiment. Total Ca increased significantly with depth at TC during green-up (R2 = 0.86, p < 0.0001) and at TS (R2 = 0.80, p < 0.0001) and TC (R2 = 0.47, p = 0.01) during maturity. SS total Ca significantly decreased with depth during maturity (R2 = 0.60, p = 0.005).
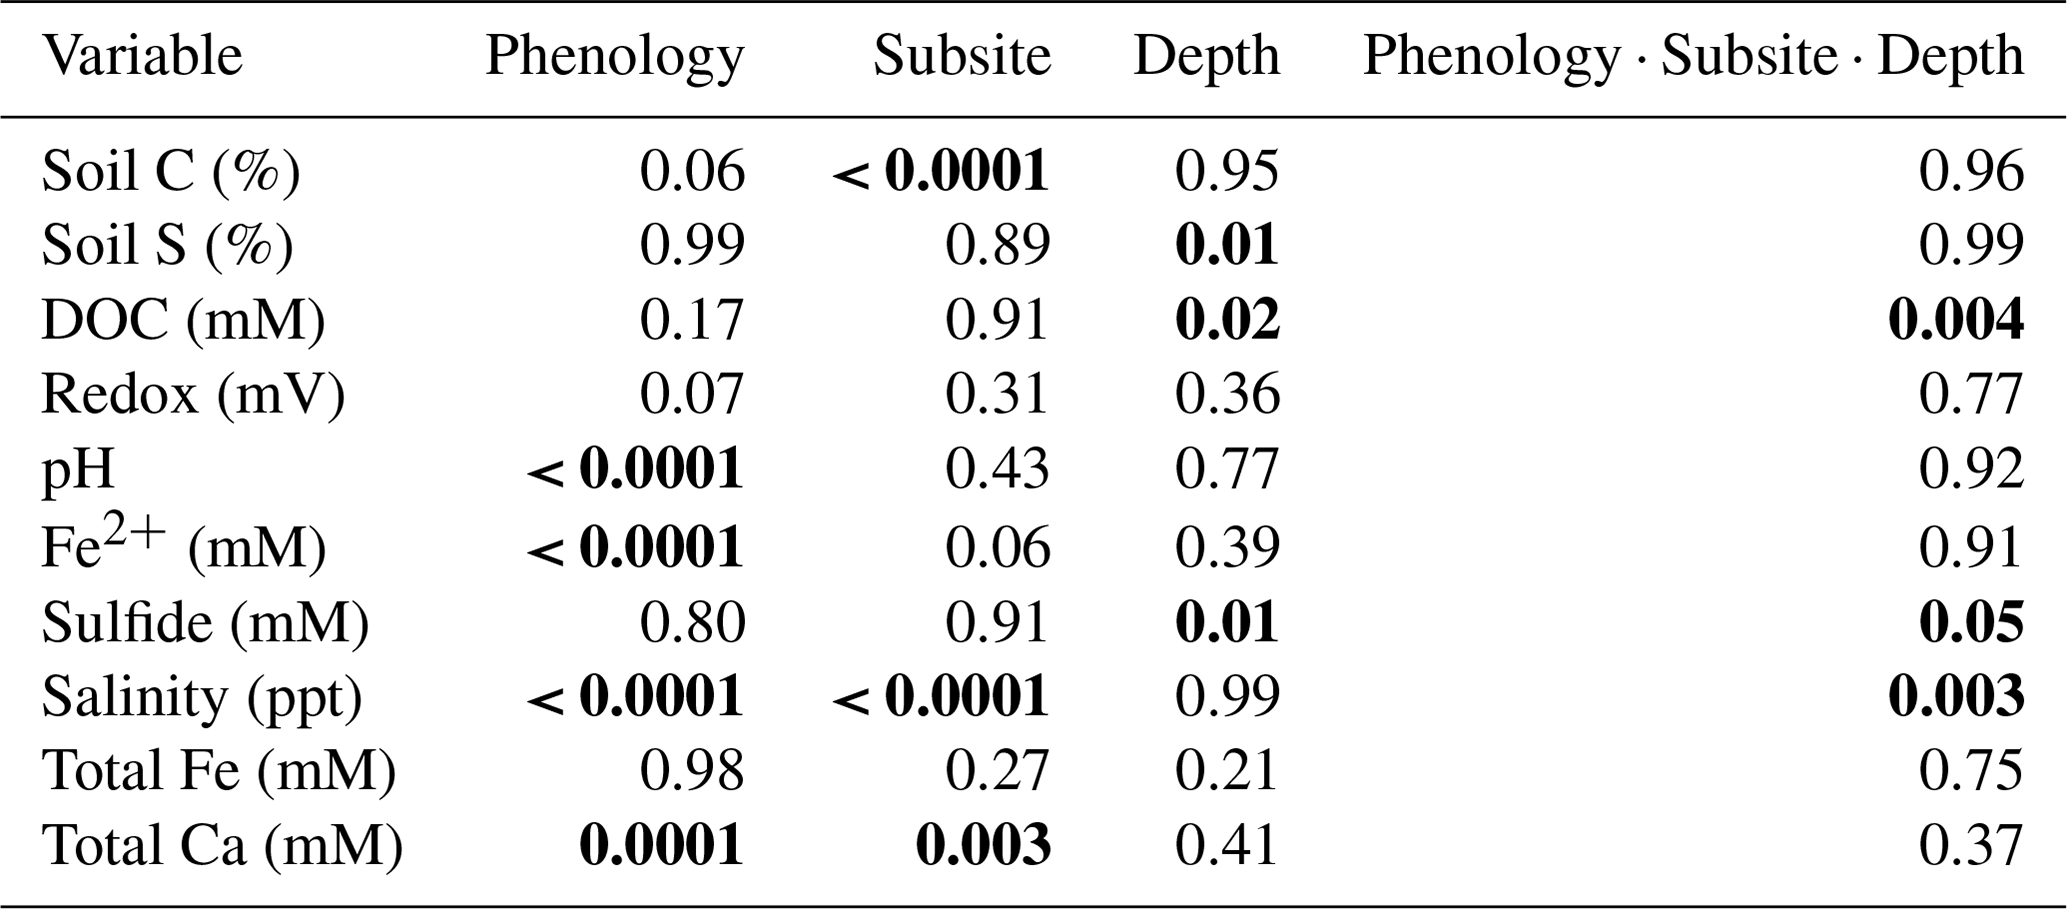
Table 1Three-way ANOVA results for all variables, with interaction results of subsite, phenology, and depth. Bolded p values indicate significance (p ≤ 0.05).
3.2.3 Analysis of variance (ANOVA) among subsite, depth, and phenophase
A three-way ANOVA was run to assess the interaction between the three factors of phenology, subsite, and depth and to understand which factors are the most predictive for each variable (Table 1). Of the measured variables, only porewater DOC, sulfide, and salinity had significant interactions between all three factors; for these, one-way ANOVAs were performed. These analyses showed that DOC was significantly higher during senescence at TS and TC in the surface than the other depths, subsites, and phenophases and that salinity was the highest in the surface at all three subsites during senescence. In contrast, sulfide was the highest during maturity at SS in the deepest core section compared to the other depths, subsites, and phenophases. For the variables without significant interaction, the three-way ANOVA showed that subsite was highly significant for soil C, while phenology and depth were not significant. In contrast, phenology was only significant for porewater pH and Fe(II), while depth and subsite were not significant, and depth was only significant for soil S and sulfide (Table 1).
Table 2ANOVA and post hoc Tukey results for all assessed soil and porewater biogeochemical variables. Mean values represent average values for each subsite for subsamples from all depths and phenophases. The mean is reported (± SD) along with a connecting letter report. Means with letters that differ are significantly (p < 0.05) different.
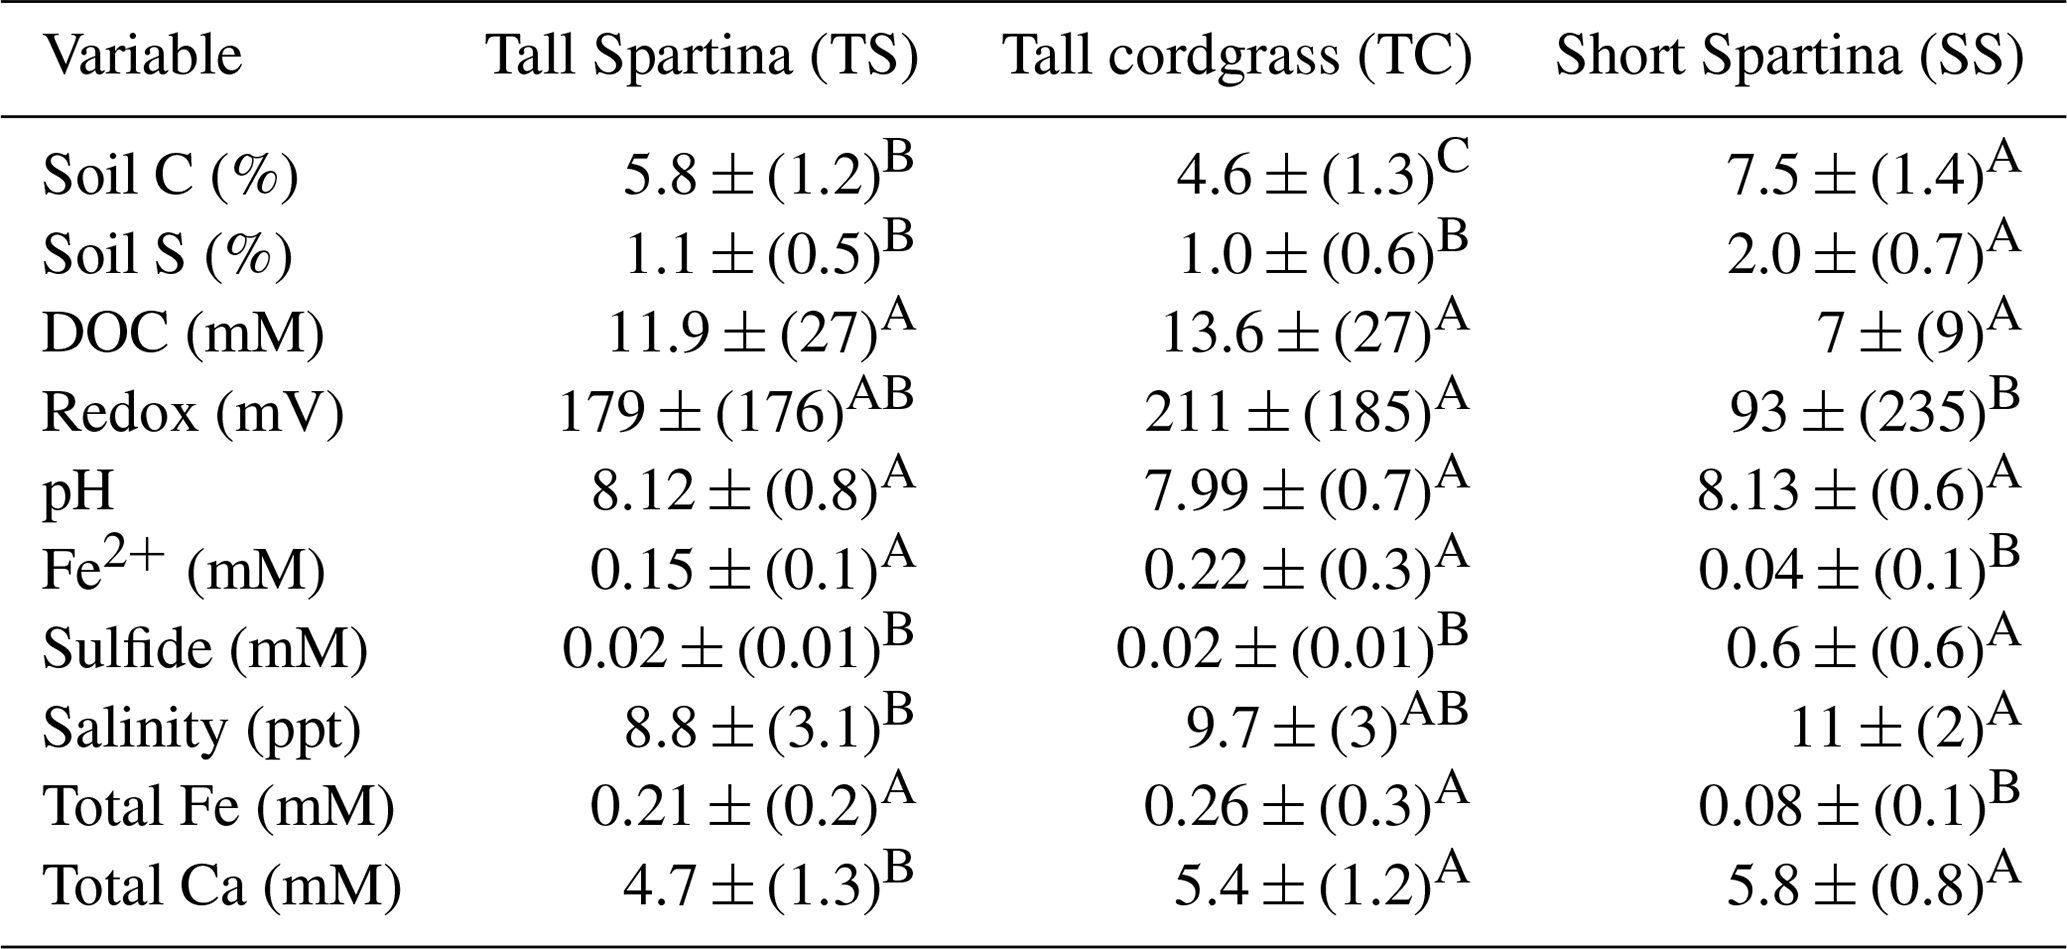
Table 3ANOVA and post hoc Tukey results for all assessed soil and porewater biogeochemical variables. Mean values represent average values for each phenophase for subsamples from all depths and subsites. The mean is reported (± SD) along with a connecting letter report. Means with letters that differ are significantly (p < 0.05) different.
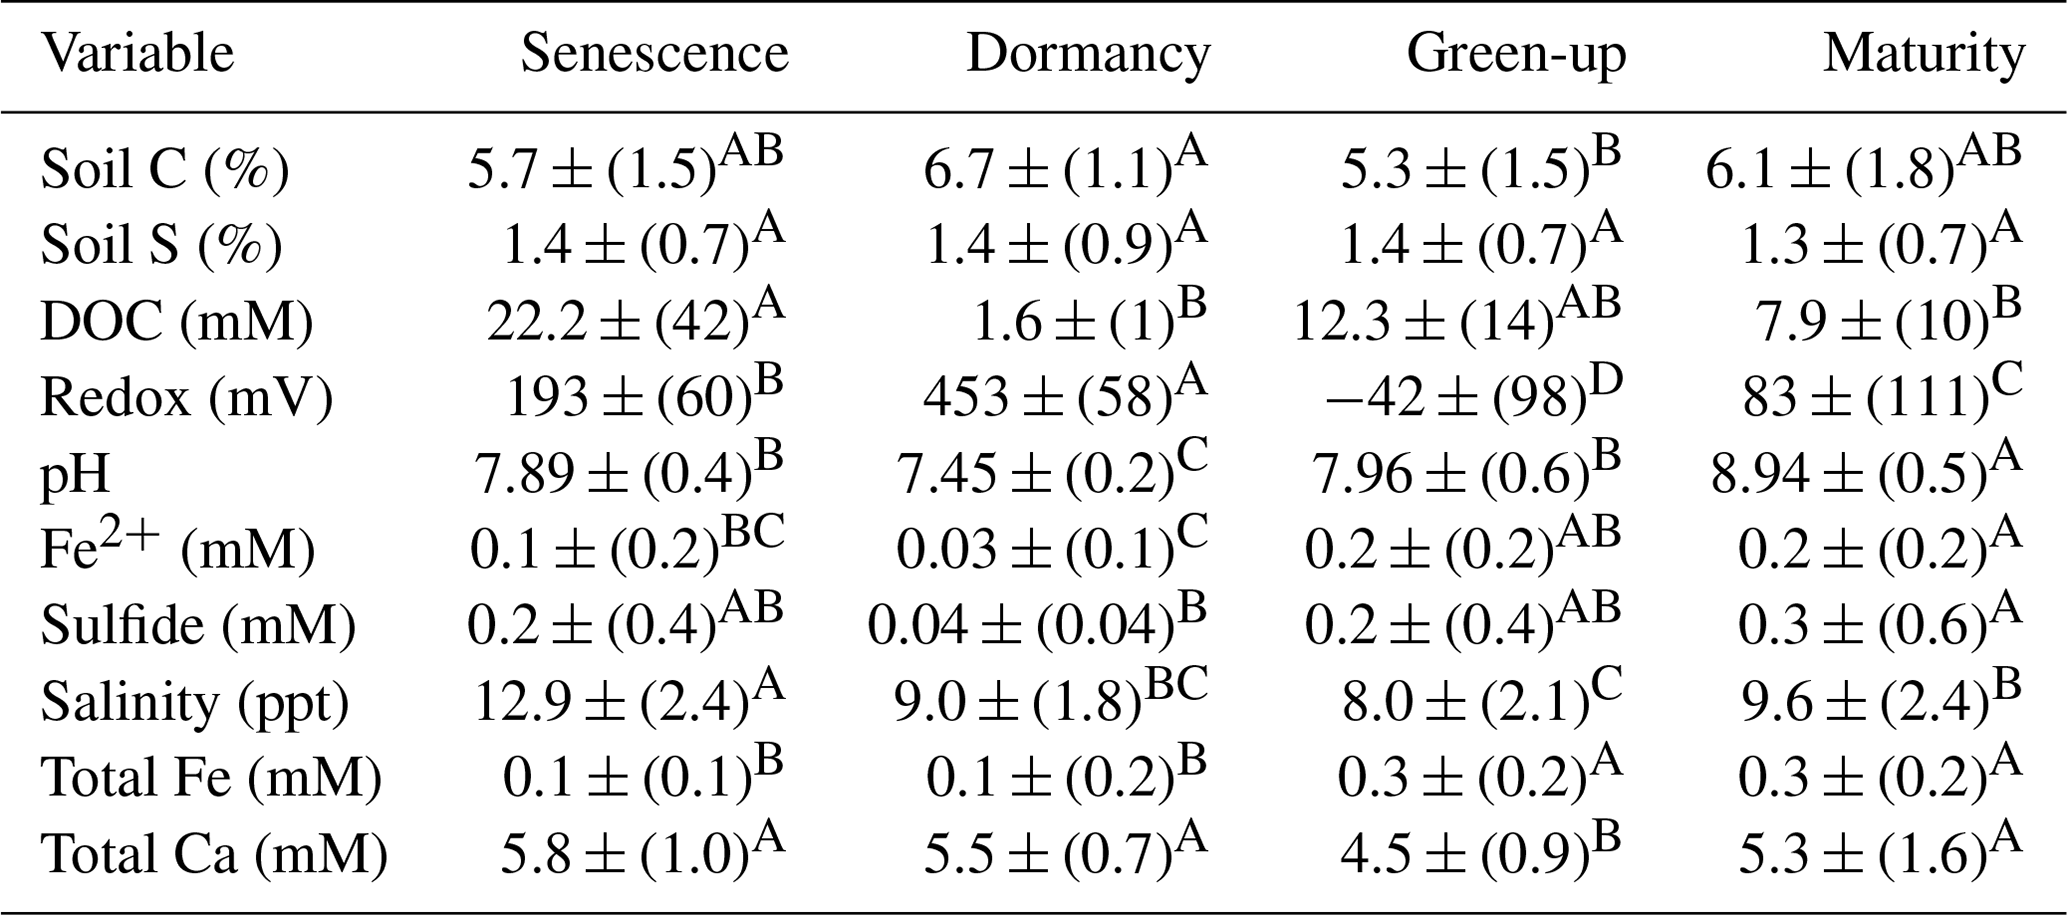
In addition to the three-way ANOVA, we also averaged variables by phenophase, subsite, or depth and performed one-way ANOVAs with post hoc Tukey tests (Tables 2, 3, and S2). When averaged by subsite, all subsites contained significantly different average concentrations of soil C, with SS having the highest average (7.5 % C), followed by TS (5.8 % C) and TC (4.6 % C) (Table 2). This indicates that on average, subsite SS contains ∼ 29 % more soil C than TS and 63 % more soil C than TC. Site SS also had higher soil S, sulfide, and salinity and lower redox potential and Fe(II) than the other subsites. When grouped by phenophase, plant dormancy contained significantly more soil C than plant green-up (Table 3). In addition, plant dormancy had significantly higher redox potential and the lowest Fe(II) and DOC compared to the other plant phenophases (Table 3). When averaged by depth, soil S was nearly 2× higher at the deepest depth (36–48 cm) than the surface (0–12 cm) (Table S2).
Table 4One-way ANOVA results for UV–VIS–EEM during the plant maturity phenophase. Mean values represent average values for each subsite for subsamples from all depths. The mean is reported (± SD) along with a connecting letter report. Means with letters that differ are significantly (p < 0.05) different.
DOC concentration also varied among subsites (Table 2) and phenology (Table 3). The average DOC concentration at SS was approximately half of that found at TS and TC, but these results are not statistically significant due to large variability and ranges in concentration observed across the 1-year experiment. This large variability is exemplified by standard deviations that are larger than the means. In addition, DOC also varied across phenophases. Dormancy had the lowest mean DOC concentration and was significantly lower than senescence by an order of magnitude. Maturity and green-up did not have statistically different DOC concentrations. The EEM–UV–VIS dataset from plant maturity was analyzed based on subsites (Table 4). There were significant differences in peaks and indices between subsites. The coble peaks T, A, M, and C as well as Abs254 were significantly lower at TS than at both TC and SS by at least a factor of 2, which is in line with the lower DOC concentrations observed for TS at maturity. Subsite SS had a significantly lower humification index (HIX) and E2:E3 than both TS and TC, suggesting that it has DOM with less relative humic content and higher average molecule weight. These results indicate significantly different DOC molecular characteristics across subsites. EEM–UV–VIS data could not be assessed across phenology since these data were collected only during plant maturity.
Differences in porewater chemistry among subsites (Table 2) and phenophase (Table 3) were also significant. SS had the lowest average redox potential and was significantly different from TC, which had the highest, while TS was not significantly different from either SS or TC. Redox potentials were even more variable between phenophase, where all four phases had significantly different means. The highest mean was measured during dormancy and decreased significantly in the order senescence, maturity, and green-up. The pH was not significantly different across any of the subsites but did change significantly with phenology. Dormancy had the lowest pH, which was significantly different from all other phenophases. Senescence and green-up had statistically similar mean pH values that were higher than dormancy, and the porewater pH during maturity was statistically higher than all other phenophases.
S2− also varied significantly among subsites. SS contained on average more than an order of magnitude greater S2− than both TS and TC. S2− is the lowest during dormancy but is only significantly different from maturity, which has the highest S2− mean. Variability in Fe2+ between subsites was the opposite of S2−. While TS and TC had low concentrations of S2−, they had high concentrations of Fe2+, which were more than double and significantly higher than Fe2+ at SS. Fe2+ concentrations varied with phenology, similar to S2− where dormancy had the lowest mean, which was significantly different only from maturity when the highest levels of Fe2+ were detected. Differences between subsite total Fe followed the same trend as Fe2+, where SS was significantly lower than both TS and TC. Total Fe was the lowest during dormancy and senescence, which were both statistically similar but different from green-up and maturity.
SS had the highest mean salinity and was significantly different only from TS, which had the lowest mean salinity. Green-up had a significantly lower mean salinity than all other phenophases except dormancy. Dormancy was only significantly different from senescence, which had the highest mean salinity. Subsite differences in Ca were similar to salinity, where SS had a significantly higher mean Ca concentration than TS but not TC. Green-up had the lowest mean Ca concentration, which was significantly different from all other phenophases.
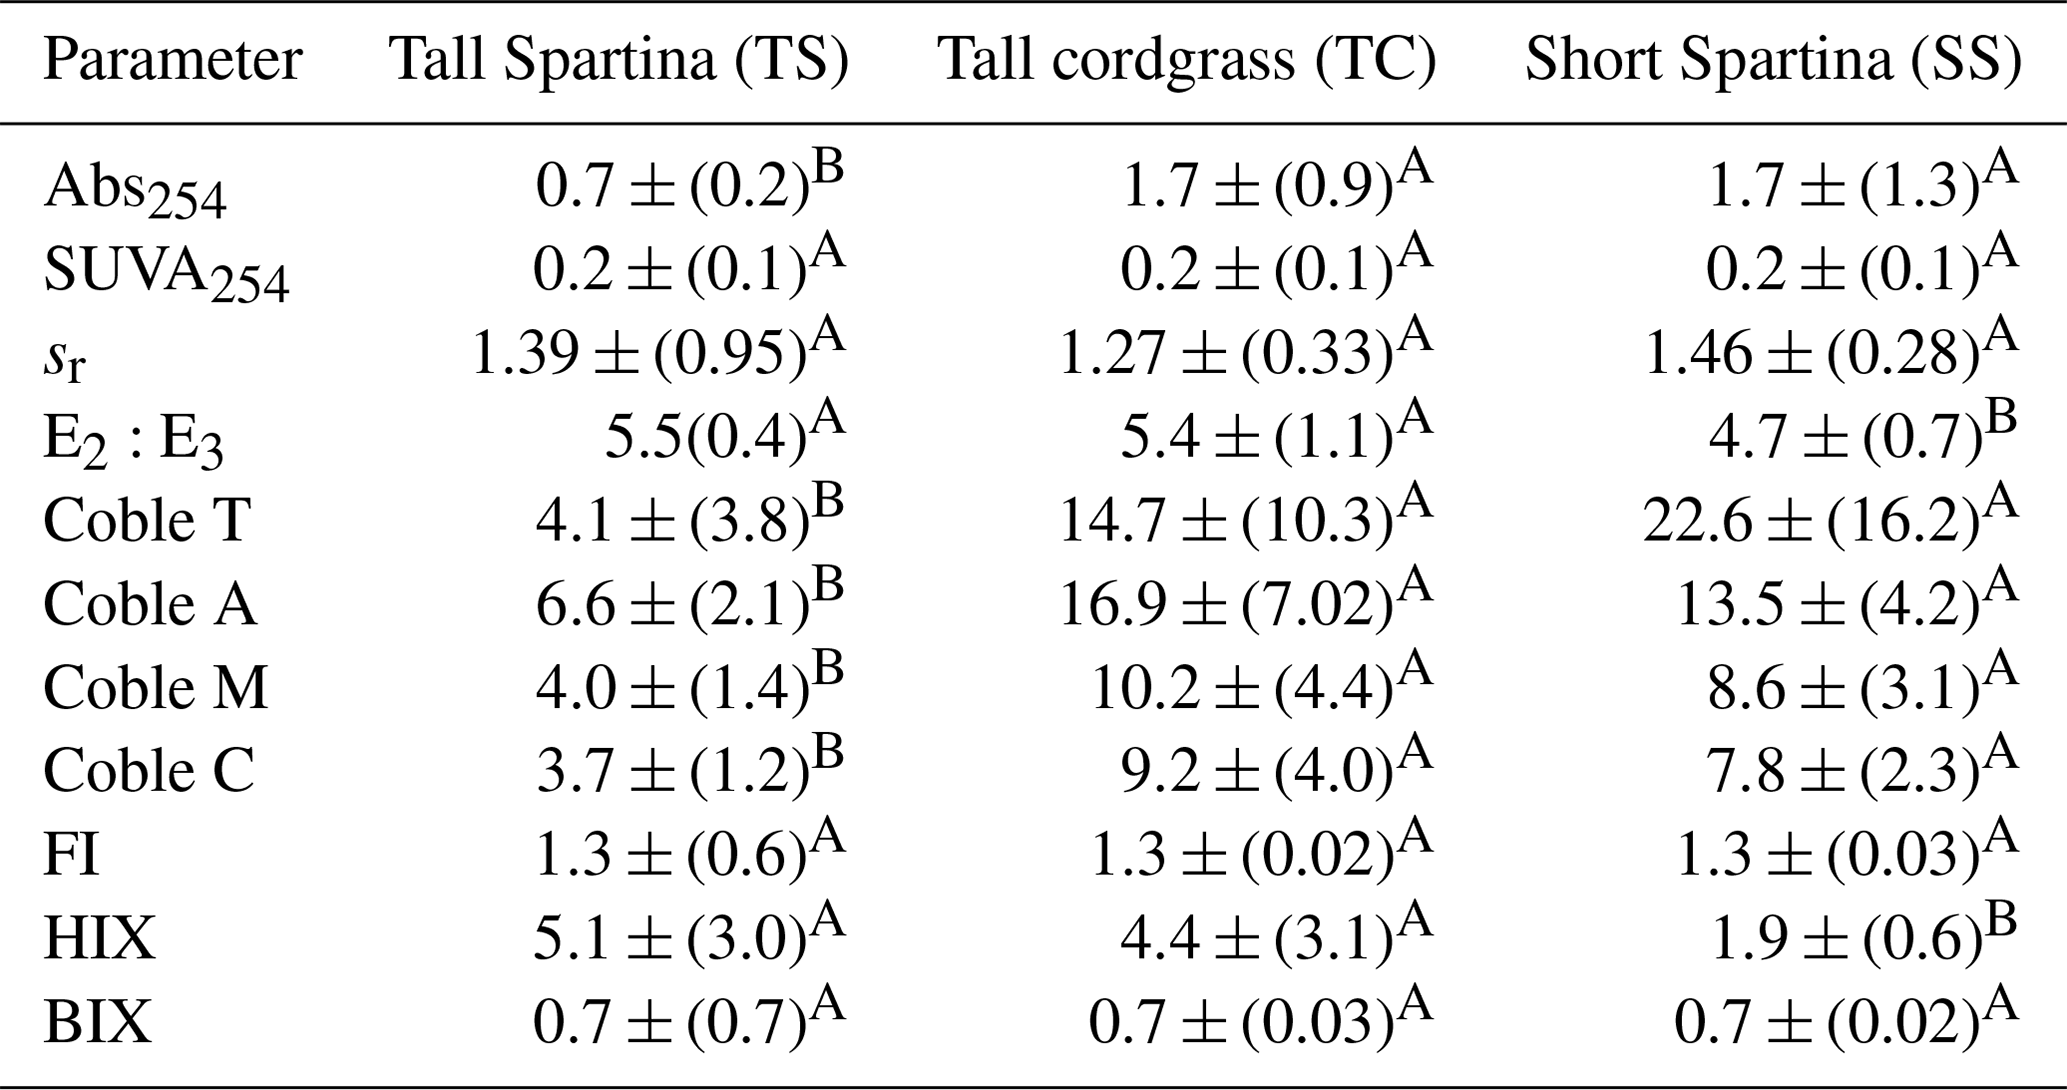
Table 5Stepwise regression results for predicting soil carbon.
3.3 Stepwise regression model results
A stepwise regression model was run across the entire 1-year experiment to determine the most important biogeochemical predictors of soil C concentration in our dataset (Table 5). The model results indicate that depth, redox potential, soil S, and sulfide are the best predictors of soil C concentration. The model R2 value of 0.44 indicates that these variables explain 44 % of the variability in our soil C concentration data, and the model is highly significant (p < 0.0001). Sulfide, redox potential, and soil S each have positive estimates, meaning that these variables increase as soil C increases, while depth had a negative estimate, meaning that soil C tends to decrease with depth across the entire dataset. Each individual predictor variable is also significant (p < 0.05).
4.1 Subsite differences in soil C and biogeochemistry
We hypothesized that soil C concentration and soil biogeochemistry would differ across our subsite locations. Our results support this hypothesis and suggest significant differences in both soil C concentration and porewater biogeochemistry among subsites, which is consistent with prior work at this field site (Seyfferth et al., 2020; Guimond et al., 2020a). This finding illustrates the importance of considering multiple sampling locations when conducting blue C assessments to account for ecosystem-scale variability. At SS, average soil C concentrations were 63 % higher than at TC and 29 % higher than at TS. Even though these subsites are several to tens of meters from one another, they each had statistically different mean soil C concentrations. Higher soil C at SS is not related to higher primary productivity because the Spartina alterniflora at SS are stunted. The short form of S. alterinflora is generally less productive than the tall form (Roman and Daiber, 1984) and likely exudes less DOC from the smaller root mass. This is supported by a lower average DOC concentration at SS. Moreover, the chromophoric dissolved organic matter (CDOM) properties at SS were different from those at the other subsites. SS CDOM had a significantly lower E2:E2 than TS and TC, indicative of higher-molecular-weight DOC at SS. In addition, the humification index (HIX) was significantly lower at SS, indicating that the DOC at SS has been reworked by microbes less than it has been at TS and TC. Furthermore, SS consistently had lower porewater redox potentials than the other subsites; while our data represent a snapshot in time for each phenophase and subsite location, they are consistent with prior work of higher-resolution porewater over time that shows SS being more strongly reducing than areas closer to the tidal channel (Guimond et al., 2020a; Seyfferth et al., 2020). Redox potentials at SS were low enough to support sulfate reduction. This is confirmed by our elevated S2− porewater concentrations measured at SS. Therefore, the greatest controls on soil C concentration at SS are slower microbial oxidation of C due to strongly reducing conditions caused by nearly constant inundation and limited flushing of oxygenated surface water (Guimond et al., 2020b, a; Seyfferth et al., 2020). These conditions lead to CDOM that is less affected by microbial degradation (i.e., low HIX, low E2:E3) and a less energetically favorable metabolism (i.e., sulfate reduction), resulting in more soil C accrual. This has important implications for soil C stock uncertainty because a greater part of the area at St. Jones is composed of subsite SS (Seyfferth et al., 2020). Sampling only near the tidal creek (TS and TC) could significantly underestimate soil C stocks, while sampling only in the marsh interior could lead to an oversimplification of soil biogeochemistry and DOC molecular properties in salt marsh ecosystems.
In contrast to SS, soil redox potentials were significantly higher at TC, and soil C was significantly lower. This is likely due to TC having a slightly higher elevation on a natural levee and less reducing surface soils (Seyfferth et al., 2020). The redox potential is not low enough to support sulfate reduction but is low enough to support Fe reduction. This is supported by the abundant amount of Fe2+ measured in the porewater at TC. A higher redox potential and more energetically favorable electron acceptor (Fe3+) likely lead to higher rates of C mineralization and explains the lower soil C concentration at TC. On the other hand, we found some of the highest concentrations of DOC at TC, particularly closer to the surface near the rooting zone. This can be explained by a greater root mass and correspondingly higher root exudation rate of the taller S. cynosuroides coupled with porewater flushing occurring only on a spring neap pattern, which allows DOC to build up in porewater over time (Guimond et al., 2020a, b). A higher concentration of freshly produced DOC and a lower concentration of soil C are also consistent with the priming effect, which posits that high concentrations of freshly produced and microbially labile DOC can stimulate microbial growth, leading to the degradation of older, more stable soil C (Textor et al., 2019; Zhang et al., 2021). In addition, TC CDOM fluorescence peaks (cobles A, M, C, T) were similar to SS, indicating that SS and TC have strong sources of fluorescent CDOM.
Although TS and TC are biogeochemically more similar than SS, TS had significantly higher soil C than TC, likely due to different dominant vegetation and hydrology. TS is lower in elevation and experiences diurnal tidal oscillations with slightly lower average porewater redox values than TC (Table 1), which experiences tidal oscillations on a spring neap cycle (Guimond et al., 2020a). These differences in hydrology may cause soil C to accumulate more so under slightly stronger reducing conditions at TS compared to TC. Another unique attribute of subsite TS is the CDOM signature. The coble peaks (A, T, C, and M) and Abs254 were significantly lower at TS than both TC and SS, which indicates a decreased concentration of terrestrially derived CDOM. This is likely because TS is nearest the tidal creek, and therefore porewater solutes are exported to the tidal channel twice daily during ebb tide (Fettrow et al., 2023b), decreasing the marsh-grass-derived terrestrial CDOM signature in the near-channel porewater.
4.2 Phenophase differences in soil C and biogeochemistry
We further hypothesized that soil C concentration and biogeochemistry would vary across plant phenophase, and our data support this hypothesis. Soil C was greatest during plant dormancy and was on average 26 % higher than green-up, 18 % higher than senescence, and 10 % higher than maturity. This highlights the importance of considering the time of year soil samples are taken when conducting a blue C assessment. Likewise, many of the biogeochemical variables also changed with phenophase. The redox potentials of all four phenophases were significantly different from one another, with the highest average redox potential occurring during dormancy. Higher redox potentials during dormancy are associated with significantly lower porewater Fe2+ and S2−, indicating that microbial reduction is likely suppressed during the winter months when labile DOC produced from root exudation is less available. Dormancy also had the highest soil C concentration. We suggest this may be related to a suppressed priming effect due to low porewater DOC concentrations and to Fe oxide formation during the high redox potential of dormancy, allowing any remaining porewater C to be pulled out of the solution and into the solid phase with oxidized Fe minerals (Riedel et al., 2013; Sodano et al., 2017; ThomasArrigo et al., 2019).
We found that DOC concentrations are higher during senescence and significantly lower during plant maturity. High porewater DOC during senescence agrees with previous work showing higher belowground allocation of biomass in Spartina before the winter (Crosby et al., 2015). Belowground allocation of C in S. alterniflora has been shown to increase late into the growing season (Lytle and Hull, 1980), while concentrations of soil organics have been shown to decrease during the summer months due to higher temperatures and higher rates of soil respiration (Caçador et al., 2004). Higher rates of belowground C allocation during senescence are further supported by the higher rates of soil respiration during senescence (Vázquez-Lule and Vargas, 2021) due to increased labile DOC availability and associated microbial activity previously reported at this field site.
Figure 7Depth profiles of porewater chemistry variables down to 48 cm for sampling events that occurred during plant (a) senescence, (b) dormancy, (c) green-up, and (d) maturity. Each point represents the mean between replicates (n=3), with error lines indicating the standard deviation (± 1 SD).
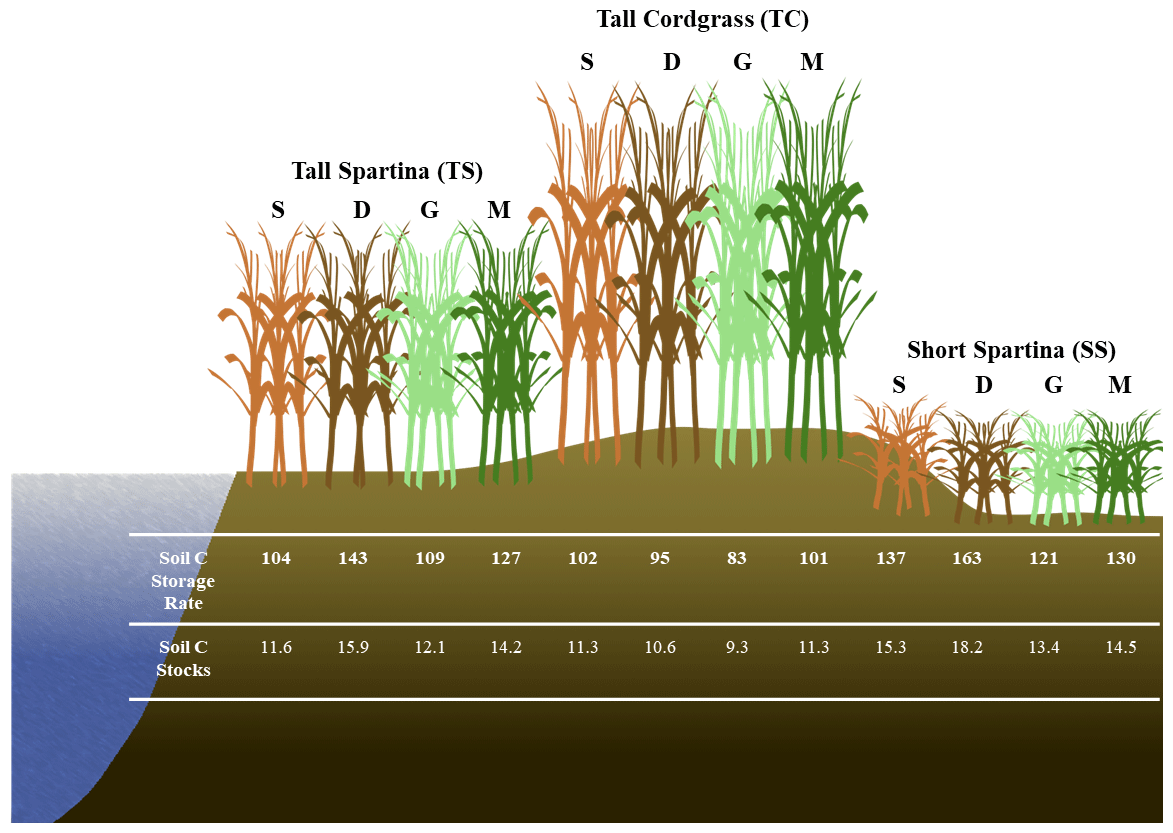
Figure 8Conceptual diagram illustrating the spatial and temporal variability of soil C accrual rates () and soil C stocks (kg C m−2) based on subsites by phenophase. Soil C stocks have a depth of 0 to 48 cm. S – senescence, D – dormancy, G – green-up, M – maturity.
4.3 Biogeochemical controls on soil C
Our data reveal important biogeochemical controls on soil C concentration across space and time. The results of the stepwise regression model suggest that soil C concentrations are predicted by sulfide, soil S, redox potential, and depth. Soil C increased significantly with increasing sulfide and soil S concentration, indicated by the positive model estimate (Table 5). This is likely associated with the lower elevation and redox potential and greater accumulation of sulfate at SS due to less tidal flushing. This may also be a result of sulfurization, where inorganic sulfur, namely sulfide, may interact with organic matter via abiotic reactions (Alperin et al., 1994). Evidence suggests that this interaction can help preserve and stabilize soil C (Tegelaar et al., 1989), though spectroscopic evidence would be required to determine if this is an important process at this study site.
Depth also has an important control on soil C concentration, and the estimate was negative, indicating that soil C decreases with depth. This is consistent with the literature suggesting higher soil C concentration at the surface and decreasing soil C concentration with depth in coastal salt marshes (Bai et al., 2016). While depth was an important predictor of soil C from the stepwise regression model, our depth profiles (Fig. 4) indicate only small changes with depth. This may be a result of only sampling to 48 cm and integrating across 12 cm increments, or it may be a result of our method design of extracting porewater from the soils and running porewater DOC as a separate fraction of C from the solid-phase soil C. Because our porewater DOC results indicate higher concentrations near the surface, the removal of porewater DOC prior to soil C analysis may lead to lower concentrations of soil C at the surface because in most studies, porewater DOC is typically incorporated into the bulk soil C measurements upon soil drying and not extracted as a separate fraction of C (i.e., porewater DOC). We suggest future studies consider porewater DOC to be a separate component of the overall soil C concentration, particularly because the variability with depth is much higher for porewater DOC than soil C, and porewater DOC is presumed to be more labile and mobile than particulate OC. Therefore, when porewater is extracted from the soil, the measured soil C concentration may appear less variable with depth and time, leading to more consistent estimates of the more stable solid-phase soil C.
Redox potential was the final significant predictor in the stepwise regression model and increased significantly with soil C. We expected to see a negative relationship between soil C and redox potential due to higher C preservation under reducing conditions, but an overall positive relationship between redox potential and soil C in the model indicates an additional and possibly more important mechanism related to shifting biogeochemistry throughout the year. We observed more oxic conditions at all subsites during plant dormancy in the winter, probably due to the cold winter conditions that allow for the higher dissolved oxygen concentrations in water and porewaters observed previously (Trifunovic et al., 2020). Despite more oxygenated conditions and higher redox potentials in winter, the microbial activity likely decreased during winter, allowing elevated soil C during the winter months when plants were dormant. In addition, the less reducing and more oxygenated conditions in winter likely promoted the formation of Fe oxides that incorporated solution-phase C into the solid phase via coprecipitation. While there is an abundance of evidence showing the importance of Fe oxides in soil C storage in non-wetland ecosystems (Lalonde et al., 2012; Riedel et al., 2013; Sowers et al., 2018a, b, 2019; Adhikari et al., 2019), recent studies have shown the important role of Fe oxides in C cycling in tidal salt marshes (Seyfferth et al., 2020; Fettrow et al., 2023a), but few studies track C cycling during the cool winter months. Variations in Fe oxide complexation with C due to phenological phase should be further investigated.
4.4 Variability in soil C accrual rates and soil C stocks
Based on soil accretion rates obtained from a previous study near our core locations (Tucker, 2016), bulk density at each of the three subsites previously obtained (Wilson and Smith, 2015), and our mean soil C concentrations averaged across depth for each subsite within phenophases, we calculated the soil C accumulation rates and soil C stocks at each of the three subsites within each of the four phenophases (Fig. 7). These accumulation rates are in the range of previously reported values for mesohaline tidal salt marshes (Chmura et al., 2003; Lovelock et al., 2014; Ye et al., 2015; Mcleod et al., 2011; Macreadie et al., 2017, 2020), as are the soil C stock estimates (Zhao et al., 2016; Ewers Lewis et al., 2018; van Ardenne et al., 2018; Ouyang and Lee, 2020; Gorham et al., 2021). These results further illustrate that soil C accrual rates and soil C stocks are highly dynamic and change based on time and space within a single ecosystem. The largest difference between rates and stocks occurred between SS dormancy and TC green-up, in which the average accrual rates varied by 75 %, and the average stocks varied by 96 %. Therefore, within the same ecosystem and between phenophases, soil C accrual rates and stocks can vary substantially, leading to variability and uncertainty. To account for spatial and temporal heterogeneity in soil C accrual rates and stocks, we suggest taking soil cores across multiple vegetation zones (if they exist) and across both the growing and non-growing seasons. Our recommendation follows Howard et al. (2014), who suggest linear plot selection when an obvious feature (i.e., tidal creek) is present and a feature that likely has a strong control on local environmental conditions based on distance from this feature. But we also point out that selecting plot locations based on variation in vegetation is also important, since changing aboveground vegetation is often a sign of changing belowground biogeochemical conditions in tidal systems. This way, the source of variability can be accounted for, leading to less uncertainty in blue C estimates.
Our results highlight the variability in soil C in time and space at the site level. We found that some level of uncertainty in estimates of stocks and accumulation rates is likely related to spatial and temporal variability of soil C and biogeochemistry at the marsh scale. Subsites that were only a few meters from one another contained significantly different soil C concentrations, likely using different metabolic pathways for C mineralization; contained significantly different porewater CDOM molecular properties; and led to considerable variation in soil C accrual rates and soil C stock estimates. The biogeochemical controls that were best correlated with soil C concentration were redox potential, soil S, sulfide, and depth, indicating that the redox potential and sulfur content of the soils are critical in controlling how much soil C accumulates in coastal marsh ecosystems. We also found that soil C concentration and thus soil C accrual rates and soil C stock estimates vary significantly across the phenophases of the marsh grasses. Plant dormancy contained the highest mean soil C concentration, possibly a result of high redox potential during winter months that causes remaining porewater DOC to be incorporated into the solid phase with oxidized minerals such as Fe oxides and lower microbial activity. These results demonstrate the importance of considering marsh-scale spatial and temporal heterogeneity when conducting a blue C assessment. Based on these results, we suggest taking soil cores from multiple locations within a marsh and in replicate, particularly if multiple vegetation types are present, and in different seasons to account for both spatial and temporal variability. These recommendations may help lead to less uncertainty in blue C estimates.
Data are available on Figshare (https://doi.org/10.6084/m9.figshare.24274417, Fettrow, 2023).
The supplement related to this article is available online at: https://doi.org/10.5194/bg-21-2367-2024-supplement.
All authors contributed to the study conception and design. Material preparation, data collection, and analysis were performed by SF. The first draft of the manuscript was written by SF and ALS with edits by HAM and AW. All authors commented on previous versions of the manuscript. All authors read and approved the final paper.
The contact author has declared that none of the authors has any competing interests.
This article has been authored by ORNL through UT-Battelle, LLC, under contract no. DE-AC05-00OR22725 with the U.S. Department of Energy. The United States Government retains and the publisher, by accepting the article for publication, acknowledges that the United States Government retains a non-exclusive, paid-up, irrevocable, worldwide license to publish or reproduce the published form of this article, or allow others to do so, for United States Government purposes. The Department of Energy will provide public access to these results of federally sponsored research in accordance with the DOE Public Access Plan (http://energy.gov/downloads/doe-public-access-plan).
Publisher's note: Copernicus Publications remains neutral with regard to jurisdictional claims made in the text, published maps, institutional affiliations, or any other geographical representation in this paper. While Copernicus Publications makes every effort to include appropriate place names, the final responsibility lies with the authors.
We thank Chloe Kroll for laboratory assistance, the UD Soil Testing Laboratory and the Advanced Materials Characterization Lab (AMCL) for analytical assistance, and the staff of the Delaware National Estuarine Research Reserve (DNERR). Angelia L. Seyfferth. and Holly A. Michael acknowledge support from the National Science Foundation (grant nos. 1759879 and 2012484). Sean Fettrow acknowledges support from the Delaware Environmental Institute. The authors acknowledge the land on which they conducted this study is the traditional home of the Lenni Lenape tribal nation (Delaware nation). The authors report no conflict of interest.
This research was supported by the National Science Foundation Directorate for Geosciences (grant nos. 1759879 and 2012484) and the Delaware Environmental Institute, University of Delaware (grant no. DENIN_FELLOW).
This paper was edited by Sebastian Naeher and reviewed by two anonymous referees.
Adhikari, D., Sowers, T., Stuckey, J. W., Wang, X., Sparks, D. L., and Yang, Y.: Formation and redox reactivity of ferrihydrite-organic carbon-calcium co-precipitates, Geochim. Cosmochim. Ac., 244, 86–98, https://doi.org/10.1016/j.gca.2018.09.026, 2019.
Alperin, M. J., Albert, D. B., and Martens, C. S.: Seasonal variations in production and consumption rates of dissolved organic carbon in an organic-rich coastal sediment, Geochim. Cosmochim. Ac., 58, 4909–4930, https://doi.org/10.1016/0016-7037(94)90221-6, 1994.
Arias-Ortiz, A., Masqué, P., Garcia-Orellana, J., Serrano, O., Mazarrasa, I., Marbà, N., Lovelock, C. E., Lavery, P. S., and Duarte, C. M.: Reviews and syntheses: 210Pb-derived sediment and carbon accumulation rates in vegetated coastal ecosystems – setting the record straight, Biogeosciences, 15, 6791–6818, https://doi.org/10.5194/bg-15-6791-2018, 2018.
Bai, J., Zhang, G., Zhao, Q., Lu, Q., Jia, J., Cui, B., and Liu, X.: Depth-distribution patterns and control of soil organic carbon in coastal salt marshes with different plant covers, Sci. Rep.-UK, 6, 34835, https://doi.org/10.1038/srep34835, 2016.
Baustian, M. M., Stagg, C. L., Perry, C. L., Moss, L. C., Carruthers, T. J. B., and Allison, M.: Relationships Between Salinity and Short-Term Soil Carbon Accumulation Rates from Marsh Types Across a Landscape in the Mississippi River Delta, Wetlands, 37, 313–324, https://doi.org/10.1007/s13157-016-0871-3, 2017.
Blair, N. E. and Aller, R. C.: The fate of terrestrial organic carbon in the Marine environment, Annu. Rev. Mar, Sci., 4, 401–423, https://doi.org/10.1146/annurev-marine-120709-142717, 2012.
Breithaupt, J. L., Smoak, J. M., Bianchi, T. S., Vaughn, D. R., Sanders, C. J., Radabaugh, K. R., Osland, M. J., Feher, L. C., Lynch, J. C., Cahoon, D. R., Anderson, G. H., Whelan, K. R. T., Rosenheim, B. E., Moyer, R. P., and Chambers, L. G.: Increasing Rates of Carbon Burial in Southwest Florida Coastal Wetlands, J. Geophys. Res. Biogeo., 125, 1–25, https://doi.org/10.1029/2019JG005349, 2020.
Caçador, I., Costa, A. L., and Vale, C.: Carbon storage in tagus salt marsh sediments, Water Air Soil Poll. Focus, 4, 701–714, https://doi.org/10.1023/B:WAFO.0000028388.84544.ce, 2004.
Capooci, M., Barba, J., Seyfferth, A. L., and Vargas, R.: Experimental influence of storm-surge salinity on soil greenhouse gas emissions from a tidal salt marsh, Sci. Total Environ., 686, 1164–1172, https://doi.org/10.1016/j.scitotenv.2019.06.032, 2019.
Chen, C. and Sparks, D. L.: Multi-elemental scanning transmission X-ray microscopy-near edge X-ray absorption fine structure spectroscopy assessment of organo-mineral associations in soils from reduced environments, Environ. Chem., 12, 64–73, https://doi.org/10.1071/EN14042, 2015.
Chen, C., Dynes, J. J., Wang, J., and Sparks, D. L.: Properties of Fe-organic matter associations via coprecipitation versus adsorption, Environ. Sci. Technol., 48, 13751–13759, https://doi.org/10.1021/es503669u, 2014.
Chmura, G. L., Anisfeld, S. C., Cahoon, D. R., and Lynch, J. C.: Global carbon sequestration in tidal, saline wetland soils, Global Biogeochem. Cy., 17, 1111, https://doi.org/10.1029/2002GB001917, 2003.
Clark, C. D., Aiona, P., Keller, J. K., and de Bruyn, W. J.: Optical characterization and distribution of chromophoric dissolved organic matter (CDOM) in soil porewater from a salt marsh ecosystem, Mar. Ecol. Prog. Ser., 516, 71–83, https://doi.org/10.3354/meps10833, 2014.
Cline, J. D.: Spectrophotometric determination of hydrogen sulfide in natural waters, Limnol. Oceanogr., 14, 454–458, https://doi.org/10.4319/lo.1969.14.3.0454, 1969.
Crosby, S. C., Ivens-Duran, M., Bertness, M. D., Davey, E., Deegan, L. A., and Leslie, H. M.: Flowering and biomass allocation in U. S. Atlantic coast Spartina alterniflora, Am. J. Bot., 102, 669–676, https://doi.org/10.3732/ajb.1400534, 2015.
Cuellar-Martinez, T., Ruiz-Fernández, A. C., Sanchez-Cabeza, J. A., Pérez-Bernal, L., López-Mendoza, P. G., Carnero-Bravo, V., Agraz-Hernández, C. M., van Tussenbroek, B. I., Sandoval-Gil, J., Cardoso-Mohedano, J. G., Vázquez-Molina, Y., and Aldana-Gutiérrez, G.: Temporal records of organic carbon stocks and burial rates in Mexican blue carbon coastal ecosystems throughout the Anthropocene, Global Planet. Change, 192, 103215, https://doi.org/10.1016/j.gloplacha.2020.103215, 2020.
Cusack, M., Saderne, V., Arias-Ortiz, A., Masqué, P., Krishnakumar, P. K., Rabaoui, L., Qurban, M. A., Qasem, A. M., Prihartato, P., Loughland, R. A., Elyas, A. A., and Duarte, C. M.: Organic carbon sequestration and storage in vegetated coastal habitats along the western coast of the Arabian Gulf, Environ. Res. Lett., 13, 074007, https://doi.org/10.1088/1748-9326/aac899, 2018.
Davy, A. J., Brown, M. J. H., Mossman, H. L., and Grant, A.: Colonization of a newly developing salt marsh: disentangling independent effects of elevation and redox potential on halophytes, J. Ecol., 99, 1350–1357, https://doi.org/10.1111/j.1365-2745.2011.01870.x, 2011.
Desai, A. R.: Climatic and phenological controls on coherent regional interannual variability of carbon dioxide flux in a heterogeneous landscape, J. Geophys. Res., 115, G00J02, https://doi.org/10.1029/2010JG001423, 2010.
Dorau, K., Pohl, L., Just, C., Höschen, C., Ufer, K., Mansfeldt, T., and Mueller, C. W.: Soil Organic Matter and Phosphate Sorption on Natural and Synthetic Fe Oxides under in Situ Conditions, Environ. Sci. Technol., 53, 13081–13087, https://doi.org/10.1021/acs.est.9b03260, 2019.
Duarte, C. M.: Reviews and syntheses: Hidden forests, the role of vegetated coastal habitats in the ocean carbon budget, Biogeosciences, 14, 301–310, https://doi.org/10.5194/bg-14-301-2017, 2017.
Ewers Lewis, C. J., Carnell, P. E., Sanderman, J., Baldock, J. A., and Macreadie, P. I.: Variability and Vulnerability of Coastal `Blue Carbon' Stocks: A Case Study from Southeast Australia, Ecosystems, 21, 263–279, https://doi.org/10.1007/s10021-017-0150-z, 2018.
Ewers Lewis, C. J., Baldock, J. A., Hawke, B., Gadd, P. S., Zawadzki, A., Heijnis, H., Jacobsen, G. E., Rogers, K., and Macreadie, P. I.: Impacts of land reclamation on tidal marsh `blue carbon' stocks, Sci. Total Environ., 672, 427–437, https://doi.org/10.1016/j.scitotenv.2019.03.345, 2019.
Fettrow, S.: Soil Data from St. Jones, Figshare [data set], https://doi.org/10.6084/m9.figshare.24274417, 2023.
Fettrow, S., Vargas, R., and Seyfferth, A. L.: Experimentally simulated sea level rise destabilizes carbon-mineral associations in temperate tidal marsh soil, Biogeochemistry, 163, 103–120, https://doi.org/10.1007/s10533-023-01024-z, 2023a.
Fettrow, S., Jeppi, V., Wozniak, A., Vargas, R., Michael, H., and Seyfferth, A. L.: Physiochemical Controls on the Horizontal Exchange of Blue Carbon Across the Salt Marsh-Tidal Channel Interface, J. Geophys. Res. Biogeo., 128, e2023JG007404, https://doi.org/10.1029/2023JG007404, 2023b.
Ford, H., Garbutt, A., Duggan-Edwards, M., Pagès, J. F., Harvey, R., Ladd, C., and Skov, M. W.: Large-scale predictions of salt-marsh carbon stock based on simple observations of plant community and soil type, Biogeosciences, 16, 425–436, https://doi.org/10.5194/bg-16-425-2019, 2019.
Frasco, B. A. and Good, R. E.: Decomposition Dynamics of Spartina alterniflora and Spartina patens in a New Jersey Salt Marsh, Am. J. Bot., 69, 402, https://doi.org/10.2307/2443145, 1982.
Gao, L., Fan, D., Sun, C., Li, D., and Cai, J.: Optical characterization of CDOM in a marsh-influenced environment in the Changjiang (Yangtze River) Estuary, Environ. Earth Sci., 64, 643–658, https://doi.org/10.1007/s12665-010-0885-8, 2011.
Gorham, C., Lavery, P., Kelleway, J. J., Salinas, C., and Serrano, O.: Soil Carbon Stocks Vary Across Geomorphic Settings in Australian Temperate Tidal Marsh Ecosystems, Ecosystems, 24, 319–334, https://doi.org/10.1007/s10021-020-00520-9, 2021.
Guimond, J. A., Seyfferth, A. L., Moffett, K. B., and Michael, H. A.: A physical-biogeochemical mechanism for negative feedback between marsh crabs and carbon storage, Environ. Res. Lett., 15, 034024, https://doi.org/10.1088/1748-9326/ab60e2, 2020a.
Guimond, J. A., Yu, X., Seyfferth, A. L., and Michael, H. A.: Using Hydrological–Biogeochemical Linkages to Elucidate Carbon Dynamics in Coastal Marshes Subject to Relative Sea Level Rise, Water Resour. Res., 56, 1–16, https://doi.org/10.1029/2019WR026302, 2020b.
Howard, J., Hoyt, S., Isensee, K., Telszewski, M., Pidgeon, E. (Eds.): Coastal Blue Carbon: Methods for assessing carbon stocks and emissions factors in mangroves, tidal salt marshes, and seagrasses, Conservation International, Intergovernmental Oceanographic Commission of UNESCO, International Union for Conservation of Nature, Arlington, Virginia, USA, 2014.
Kang, X., Hao, Y., Cui, X., Chen, H., Huang, S., Du, Y., Li, W., Kardol, P., Xiao, X., and Cui, L.: Variability and Changes in Climate, Phenology, and Gross Primary Production of an Alpine Wetland Ecosystem, Remote Sens.-Basel, 8, 391, https://doi.org/10.3390/rs8050391, 2016.
Koretsky, C. M., Van Cappellen, P., Dichristina, T. J., Kostka, J. E., Lowe, K. L., Moore, C. M., Roychoudhury, A. N., and Viollier, E.: Salt marsh pore water geochemistry does not correlate with microbial community structure, Estuar. Coast. Shelf S., 62, 233–251, https://doi.org/10.1016/j.ecss.2004.09.001, 2005.
Lacroix, E. M., Mendillo, J., Gomes, A., Dekas, A., and Fendorf, S.: Contributions of anoxic microsites to soil carbon protection across soil textures, Geoderma, 425, 116050, https://doi.org/10.1016/j.geoderma.2022.116050, 2022.
Lalonde, K., Mucci, A., Ouellet, A., and Gélinas, Y.: Preservation of organic matter in sediments promoted by iron, Nature, 483, 198–200, https://doi.org/10.1038/nature10855, 2012.
Lovelock, C. E., Adame, M. F., Bennion, V., Hayes, M., O'Mara, J., Reef, R., and Santini, N. S.: Contemporary rates of carbon sequestration through vertical accretion of sediments in mangrove forests and saltmarshes of South East Queensland, Australia, Estuar. Coast., 37, 763–771, https://doi.org/10.1007/s12237-013-9702-4, 2014.
Luo, M., Liu, Y., Huang, J., Xiao, L., Zhu, W., Duan, X., and Tong, C.: Rhizosphere processes induce changes in dissimilatory iron reduction in a tidal marsh soil: a rhizobox study, Plant Soil, 433, 83–100, https://doi.org/10.1007/s11104-018-3827-y, 2018.
Luo, M., Huang, J.-F., Zhu, W.-F., and Tong, C.: Impacts of increasing salinity and inundation on rates and pathways of organic carbon mineralization in tidal wetlands: a review, Hydrobiologia, 827, 31–49, https://doi.org/10.1007/s10750-017-3416-8, 2019.
Lytle, R. W. and Hull, R. J.: Annual Carbohydrate Variation in Culms and Rhizomes of Smooth Cordgrass (Spartina alterniflora Loisel.), Agron. J., 72, 942–946, https://doi.org/10.2134/agronj1980.00021962007200060019x, 1980.
Macreadie, P. I., Ollivier, Q. R., Kelleway, J. J., Serrano, O., Carnell, P. E., Ewers Lewis, C. J., Atwood, T. B., Sanderman, J., Baldock, J., Connolly, R. M., Duarte, C. M., Lavery, P. S., Steven, A., and Lovelock, C. E.: Carbon sequestration by Australian tidal marshes, Sci. Rep.-UK, 7, 44071, https://doi.org/10.1038/srep44071, 2017.
Macreadie, P. I., Anton, A., Raven, J. A., Beaumont, N., Connolly, R. M., Friess, D. A., Kelleway, J. J., Kennedy, H., Kuwae, T., Lavery, P. S., Lovelock, C. E., Smale, D. A., Apostolaki, E. T., Atwood, T. B., Baldock, J., Bianchi, T. S., Chmura, G. L., Eyre, B. D., Fourqurean, J. W., Hall-Spencer, J. M., Huxham, M., Hendriks, I. E., Krause-Jensen, D., Laffoley, D., Luisetti, T., Marbà, N., Masque, P., McGlathery, K. J., Megonigal, J. P., Murdiyarso, D., Russell, B. D., Santos, R., Serrano, O., Silliman, B. R., Watanabe, K., and Duarte, C. M.: The future of Blue Carbon science, Nat. Commun., 10, 3998, https://doi.org/10.1038/s41467-019-11693-w, 2019.
Macreadie, P. I., Nielsen, D. A., Kelleway, J. J., Atwood, T. B., Seymour, J. R., Petrou, K., Connolly, R. M., Thomson, A. C. G., Stacey, M., and Ralph, P. J.: Can we manage coastal ecosystems to sequestor more blue carbon?, Front. Ecol. Environ., 15, 206–213, 2020.
Mcleod, E., Chmura, G. L., Bouillon, S., Salm, R., Björk, M., Duarte, C. M., Lovelock, C. E., Schlesinger, W. H., and Silliman, B. R.: A blueprint for blue carbon: toward an improved understanding of the role of vegetated coastal habitats in sequestering CO2, Front. Ecol. Environ., 9, 552–560, https://www.jstor.org/stable/41479959, 2011.
Mcowen, C., Weatherdon, L., Bochove, J.-W., Sullivan, E., Blyth, S., Zockler, C., Stanwell-Smith, D., Kingston, N., Martin, C., Spalding, M., and Fletcher, S.: A global map of saltmarshes, Biodivers. Data J., 5, e11764, https://doi.org/10.3897/BDJ.5.e11764, 2017.
McTigue, N., Davis, J., Rodriguez, A. B., McKee, B., Atencio, A., and Currin, C.: Sea Level Rise Explains Changing Carbon Accumulation Rates in a Salt Marsh Over the Past Two Millennia, J. Geophys. Res. Biogeo., 124, 2945–2957, https://doi.org/10.1029/2019JG005207, 2019.
Miller, C. B., Rodriguez, A. B., Bost, M. C., McKee, B. A., and McTigue, N. D.: Carbon accumulation rates are highest at young and expanding salt marsh edges, Commun. Earth Environ., 3, 173, https://doi.org/10.1038/s43247-022-00501-x, 2022.
Moffett, K. and Gorlick, S.: Relating salt marsh pore water geochemistry patterns to vegetation zones and hydrologic influences, J. Am. Water Resour. As., 52, 1729–1745, https://doi.org/10.1111/j.1752-1688.1969.tb04897.x, 2016.
Mueller, P., Ladiges, N., Jack, A., Schmiedl, G., Kutzbach, L., Jensen, K., and Nolte, S.: Assessing the long-term carbon-sequestration potential of the semi-natural salt marshes in the European Wadden Sea, Ecosphere, 10, e02556, https://doi.org/10.1002/ecs2.2556, 2019.
Muench, A. and Elsey-Quirk, T.: Competitive reversal between plant species is driven by species-specific tolerance to flooding stress and nutrient acquisition during early marsh succession, J. Appl. Ecol., 56, 2236–2247, https://doi.org/10.1111/1365-2664.13458, 2019.
Negandhi, K., Edwards, G., Kelleway, J. J., Howard, D., Safari, D., and Saintilan, N.: Blue carbon potential of coastal wetland restoration varies with inundation and rainfall, Sci. Rep.-UK, 9, 4368, https://doi.org/10.1038/s41598-019-40763-8, 2019.
Negrin, V. L., Spetter, C. V., Asteasuain, R. O., Perillo, G. M. E., and Marcovecchio, J. E.: Influence of flooding and vegetation on carbon, nitrogen, and phosphorus dynamics in the pore water of a Spartina alterniflora salt marsh, J. Environ. Sci., 23, 212–221, https://doi.org/10.1016/S1001-0742(10)60395-6, 2011.
Ouyang, X. and Lee, S. Y.: Improved estimates on global carbon stock and carbon pools in tidal wetlands, Nat. Commun., 11, 317, https://doi.org/10.1038/s41467-019-14120-2, 2020.
Riedel, T., Zak, D., Biester, H., and Dittmar, T.: Iron traps terrestrially derived dissolved organic matter at redox interfaces, P. Natl. Acad. Sci. USA, 110, 10101–10105, https://doi.org/10.1073/pnas.1221487110, 2013.
Roman, C. T. and Daiber, F. C.: Aboveground and Belowground Primary Production Dynamics of Two Delaware Bay Tidal Marshes, B. Torrey Bot. Club, 111, 34–41, https://www.jstor.org/stable/2996208, 1984.
Saintilan, N., Rogers, K., Mazumder, D., and Woodroffe, C.: Allochthonous and autochthonous contributions to carbon accumulation and carbon store in southeastern Australian coastal wetlands, Estuar. Coast. Shelf S., 128, 84–92, https://doi.org/10.1016/j.ecss.2013.05.010, 2013.
Sanders, C. J., Maher, D. T., Tait, D. R., Williams, D., Holloway, C., Sippo, J. Z., and Santos, I. R.: Are global mangrove carbon stocks driven by rainfall?, J. Geophys. Res. Biogeo., 121, 2600–2609, https://doi.org/10.1002/2016JG003510, 2016.
Serrano, O., Lovelock, C. E., B. Atwood, T., Macreadie, P. I., Canto, R., Phinn, S., Arias-Ortiz, A., Bai, L., Baldock, J., Bedulli, C., Carnell, P., Connolly, R. M., Donaldson, P., Esteban, A., Ewers Lewis, C. J., Eyre, B. D., Hayes, M. A., Horwitz, P., Hutley, L. B., Kavazos, C. R. J., Kelleway, J. J., Kendrick, G. A., Kilminster, K., Lafratta, A., Lee, S., Lavery, P. S., Maher, D. T., Marbà, N., Masque, P., Mateo, M. A., Mount, R., Ralph, P. J., Roelfsema, C., Rozaimi, M., Ruhon, R., Salinas, C., Samper-Villarreal, J., Sanderman, J., J. Sanders, C., Santos, I., Sharples, C., Steven, A. D. L., Cannard, T., Trevathan-Tackett, S. M., and Duarte, C. M.: Australian vegetated coastal ecosystems as global hotspots for climate change mitigation, Nat. Commun., 10, 4313, https://doi.org/10.1038/s41467-019-12176-8, 2019.
Seyfferth, A. L., Bothfeld, F., Vargas, R., Stuckey, J. W., Wang, J., Kearns, K., Michael, H. A., Guimond, J., Yu, X., and Sparks, D. L.: Spatial and temporal heterogeneity of geochemical controls on carbon cycling in a tidal salt marsh, Geochim. Cosmochim. Ac., 282, 1–18, https://doi.org/10.1016/j.gca.2020.05.013, 2020.
Smeaton, C., Barlow, N. L. M., and Austin, W. E. N.: Coring and compaction: Best practice in blue carbon stock and burial estimations, Geoderma, 364, 114180, https://doi.org/10.1016/j.geoderma.2020.114180, 2020.
Sodano, M., Lerda, C., Nisticò, R., Martin, M., Magnacca, G., Celi, L., and Said-Pullicino, D.: Dissolved organic carbon retention by coprecipitation during the oxidation of ferrous iron, Geoderma, 307, 19–29, https://doi.org/10.1016/j.geoderma.2017.07.022, 2017.
Sowers, T. D., Adhikari, D., Wang, J., Yang, Y., and Sparks, D. L.: Spatial Associations and Chemical Composition of Organic Carbon Sequestered in Fe, Ca, and Organic Carbon Ternary Systems, Environ. Sci. Technol., 52, 6936–6944, https://doi.org/10.1021/acs.est.8b01158, 2018a.
Sowers, T. D., Stuckey, J. W., and Sparks, D. L.: The synergistic effect of calcium on organic carbon sequestration to ferrihydrite, Geochem. T., 19, 22–26, https://doi.org/10.1186/s12932-018-0049-4, 2018b.
Sowers, T. D., Holden, K. L., Coward, E. K., and Sparks, D. L.: Dissolved Organic Matter Sorption and Molecular Fractionation by Naturally Occurring Bacteriogenic Iron (Oxyhydr)oxides, Environ. Sci. Technol., 53, 4295–4304, https://doi.org/10.1021/acs.est.9b00540, 2019.
Stookey, L. L.: Ferrozine-A New Spectrophotometric Reagent for Iron, Anal. Chem., 42, 779–781, https://doi.org/10.1021/ac60289a016, 1970.
Tegelaar, E. W., de Leeuw, J. W., Derenne, S., and Largeau, C.: A reappraisal of kerogen formation, Geochim. Cosmochim. Ac., 53, 3103–3106, https://doi.org/10.1016/0016-7037(89)90191-9, 1989.
Textor, S. R., Wickland, K. P., Podgorski, D. C., Johnston, S. E., and Spencer, R. G. M.: Dissolved Organic Carbon Turnover in Permafrost-Influenced Watersheds of Interior Alaska: Molecular Insights and the Priming Effect, Front. Earth Sci. (Lausanne), 7, 275, https://doi.org/10.3389/feart.2019.00275, 2019.
ThomasArrigo, L. K., Kaegi, R., and Kretzschmar, R.: Ferrihydrite Growth and Transformation in the Presence of Ferrous Iron and Model Organic Ligands, Environ. Sci. Technol., 53, 13636–13647, https://doi.org/10.1021/acs.est.9b03952, 2019.
Trifunovic, B., Vázquez-Lule, A., Capooci, M., Seyfferth, A. L., Moffat, C., and Vargas, R.: Carbon Dioxide and Methane Emissions From A Temperate Salt Marsh Tidal Creek, J. Geophys. Res. Biogeo., 125, e2019JG005558, https://doi.org/10.1029/2019JG005558, 2020.
Tucker, K. J.: Variability of organic carbon accumulation on a tidal wetland coast, Dissertation, University of Delaware, http://udspace.udel.edu/handle/19716/17729 (last access: 14 May 2024), 2016.
Valle, J., Gonsior, M., Harir, M., Enrich-Prast, A., Schmitt-Kopplin, P., Bastviken, D., Conrad, R., and Hertkorn, N.: Extensive processing of sediment pore water dissolved organic matter during anoxic incubation as observed by high-field mass spectrometry (FTICR-MS), Water Res., 129, 252–263, https://doi.org/10.1016/j.watres.2017.11.015, 2018.
van Ardenne, L. B., Jolicouer, S., Bérubé, D., Burdick, D., and Chmura, G. L.: The importance of geomorphic context for estimating the carbon stock of salt marshes, Geoderma, 330, 264–275, https://doi.org/10.1016/j.geoderma.2018.06.003, 2018.
Van de Broek, M., Temmerman, S., Merckx, R., and Govers, G.: Controls on soil organic carbon stocks in tidal marshes along an estuarine salinity gradient, Biogeosciences, 13, 6611–6624, https://doi.org/10.5194/bg-13-6611-2016, 2016.
Vázquez-Lule, A. and Vargas, R.: Biophysical drivers of net ecosystem and methane exchange across phenological phases in a tidal salt marsh, Agr. Forest Meteorol., 300, 108309, https://doi.org/10.1016/j.agrformet.2020.108309, 2021.
Wang, F., Sanders, C. J., Santos, I. R., Tang, J., Schuerch, M., Kirwan, M. L., Kopp, R. E., Zhu, K., Li, X., Yuan, J., Liu, W., and Li, Z.: Global blue carbon accumulation in tidal wetlands increases with climate change, Natl. Sci. Rev., 8, nwaa296, https://doi.org/10.1093/nsr/nwaa296, 2021.
Whitby, H., Planquette, H., Cassar, N., Bucciarelli, E., Osburn, C. L., Janssen, D. J., Cullen, J. T., González, A. G., Völker, C., and Sarthou, G.: A call for refining the role of humic-like substances in the oceanic iron cycle, Sci. Rep.-UK, 10, 6144, https://doi.org/10.1038/s41598-020-62266-7, 2020.
Wilson, K. and Smith, E.: Marsh Carbon Storage in the National Estuarine Research Reserves, USA, Commission for Environmental Cooperation, cec.org, 2015.
Windham, L.: Comparison of biomass production and decomposition between Phragmites australis (common reed) and spartina patens (salt hay grass) in brackish tidal marshes of New Jersey, USA, Wetlands, 21, 179–188, https://doi.org/10.1672/0277-5212(2001)021[0179:COBPAD]2.0.CO;2, 2001.
Wordofa, D. N., Adhikari, D., Dunham-Cheatham, S. M., Zhao, Q., Poulson, S. R., Tang, Y., and Yang, Y.: Biogeochemical fate of ferrihydrite-model organic compound complexes during anaerobic microbial reduction, Sci. Total Environ., 668, 216–223, https://doi.org/10.1016/j.scitotenv.2019.02.441, 2019.
Ye, S., Laws, E. A., Yuknis, N., Ding, X., Yuan, H., Zhao, G., Wang, J., Yu, X., Pei, S., and DeLaune, R. D.: Carbon Sequestration and Soil Accretion in Coastal Wetland Communities of the Yellow River Delta and Liaohe Delta, China, Estuar. Coast., 38, 1885–1897, https://doi.org/10.1007/s12237-014-9927-x, 2015.
Yousefi Lalimi, F., Silvestri, S., D'Alpaos, A., Roner, M., and Marani, M.: The Spatial Variability of Organic Matter and Decomposition Processes at the Marsh Scale, J. Geophys. Res. Biogeo., 123, 3713–3727, https://doi.org/10.1029/2017JG004211, 2018.
Yu, J., Dong, H., Li, Y., Wu, H., Guan, B., Gao, Y., Zhou, D., and Wang, Y.: Spatiotemporal Distribution Characteristics of Soil Organic Carbon in Newborn Coastal Wetlands of the Yellow River Delta Estuary, Clean (Weinh), 42, 311–318, https://doi.org/10.1002/clen.201100511, 2014.
Zhang, D., Gong, C., Zhang, W., Zhang, H., Zhang, J., and Song, C.: Labile carbon addition alters soil organic carbon mineralization but not its temperature sensitivity in a freshwater marsh of Northeast China, Appl. Soil Ecol., 160, 103844, https://doi.org/10.1016/j.apsoil.2020.103844, 2021.
Zhao, Q., Bai, J., Liu, Q., Lu, Q., Gao, Z., and Wang, J.: Spatial and Seasonal Variations of Soil Carbon and Nitrogen Content and Stock in a Tidal Salt Marsh with Tamarix chinensis, China, Wetlands, 36, 145–152, https://doi.org/10.1007/s13157-015-0647-1, 2016.
Zhu, Q., Cochran, J. K., Heilbrun, C., Yin, H., Feng, H., Tamborski, J. J., Fitzgerald, P., and Cong, W.: Small-Scale Geochemical Heterogeneities and Seasonal Variation of Iron and Sulfide in Salt Marshes Revealed by Two-Dimensional Sensors, Front. Earth Sci. (Lausanne), 9, 653698, https://doi.org/10.3389/feart.2021.653698, 2021.