the Creative Commons Attribution 4.0 License.
the Creative Commons Attribution 4.0 License.
 | 30 Jul 2024
Dissolved nitric oxide in the lower Elbe Estuary and the Port of Hamburg area
Riel Carlo O. Ingeniero
Gesa Schulz
Hermann W. Bange
Nitric oxide (NO) is an intermediate of various microbial nitrogen cycle processes, and the open-ocean and coastal areas are generally a source of NO to the atmosphere. However, our knowledge about its distribution and the main production processes in coastal areas and estuaries is rudimentary at best. To this end, dissolved NO concentrations were measured for the first time in surface waters along the lower Elbe Estuary and Port of Hamburg area in July 2021. The discrete surface water samples were analyzed using a chemiluminescence NO analyzer connected to a stripping unit. The NO concentrations ranged from below the limit of detection (9.1 pM) to 17.7 pM, averaging 12.5 pM, and were supersaturated in the surface layer of both the lower Elbe Estuary and the Port of Hamburg area, indicating that the study site was a source of NO to the atmosphere during the study period. On the basis of a comprehensive comparison of NO concentrations with parallel nutrient, oxygen, and nitrous oxide concentration measurements, we conclude that the observed distribution of dissolved NO most likely resulted from nitrification. In the Port of Hamburg, however, nitrifier denitrification and/or denitrification might also affect the NO distribution.
- Article
(4932 KB) - Full-text XML
-
Supplement
(4139 KB) - BibTeX
- EndNote


Nitric oxide (NO) is an atmospheric trace gas that is rapidly oxidized to atmospheric nitrogen dioxide (NO2). NOx () is a significant contributor to photochemical smog (Haagen-Smit and Fox, 1954), a cause of acid rain (Likens et al., 1979; Fanning, 1989), and affects tropospheric ozone (O3) (Haagen-Smit and Fox, 1954). Atmospheric NOx has an atmospheric lifetime ranging from hours to days (IPCC, 2021). Because its atmospheric reactions yield O3, methane, and nitrate aerosols, it is an indirect greenhouse gas with an overall negative efficient radiative forcing (IPCC, 2021).
The major sources of atmospheric NOx are emissions from fossil fuel combustion and soils (Jaeglé et al., 2005). Currently, little is known about the distribution or the production and consumption processes of NO in the marine environment. Two known primary sources of NO in the ocean are NO photolysis from nitrite and NO production from phytoplankton, macroalgae, and the microbial nitrogen cycle. Bange et al. (2023) noted that the consumption mechanisms of NO in the marine environment are still unresolved.
Zafiriou et al. (1980) measured the dissolved NO concentration in seawater for the first time in the central equatorial Pacific Ocean. They noted that the ocean could be a source of NO to the atmosphere due to its photochemical production from dissolved nitrite (). NO is also an important intermediate of microbial nitrogen cycle processes, such as denitrification, nitrification, and anammox (Schreiber et al., 2012; Kuypers et al., 2018). Moreover, NO was identified as a signal molecule on a cellular level in many marine organisms and between bacteria and algae (see Abada et al., 2023).
The determination of the dissolved NO concentration is challenging because of its reactivity, which results in a very short lifetime in (sea)water (Lancaster, 1997), ranging from 3 to 100 s (Zafiriou and McFarland, 1981; Olasehinde et al., 2010). Nevertheless, measurements of dissolved NO in aquatic environments, such as open and coastal oceans and rivers, have received increasing attention during the last decade. Examples of recent NO measurement campaigns include those in the Kurose River in Japan (Anifowose et al., 2015), the Seto Inland Sea in Japan (Olasehinde et al., 2010), the tropical northwestern Pacific Ocean (Tian et al., 2019), the oxygen minimum zone off the coast of Peru (Lutterbeck and Bange, 2015; Lutterbeck et al., 2018), and the coastal seas off Qingdao (Tian et al., 2021).
These studies, performed during different periods, have indicated that both open and coastal seas are a source of atmospheric NO, with fluxes ranging from (Anifowose and Sakugawa, 2017) to as high as (Gong et al., 2023). Global estimates of oceanic NO emissions are still lacking, and studies on the temporal (i.e., diurnal, seasonal, and interannual) and spatial variability in NO emissions are not available. To address these gaps, expanded measurements of the NO distribution in open-ocean and coastal waters are essential to enhance our understanding and provide a more accurate assessment of sea-to-air flux densities.
A recent paper by Gong et al. (2023) argued that dissolved inorganic nitrogen (DIN) plays an important role in NO distribution: a high level of DIN establishes the necessary conditions for NO production. Other studies (e.g., Olasehinde et al., 2010; Anifowose et al., 2015; Anifowose and Sakugawa, 2017; Ayeni et al., 2021) have also observed a positive correlation between NO concentrations or photoproduction rates with dissolved concentrations. To our knowledge, dissolved NO measurements and the magnitude of flux density in estuaries, which have relatively high DIN concentrations (Howarth et al., 2011), have not yet been reported.
This paper presents the first measurement of dissolved NO concentrations in the lower Elbe Estuary and Port of Hamburg basins during a ship campaign in July 2021. The overarching objectives of our study were (i) to determine the distribution of dissolved NO along the salinity gradient, (ii) to estimate the flux density of NO across the water–atmosphere interface, and (iii) to identify the potential production pathways and controlling factors affecting the NO distribution in the lower Elbe Estuary and Port of Hamburg area.
2.1 Study site
Originating from the Karkonosze Mountains in the northern region of the Czech Republic, the Elbe River basin is the fourth largest catchment area (148 268 km2) in central Europe (Amann et al., 2012), with an average long-term freshwater runoff of about 720 m3 s−1 (Kerner, 2007). In this study, the given stream distance (i.e., Elbe-km, where km is kilometers) refers to the distance from the point where the Elbe passes the border from the Czech Republic to Germany.
The Elbe River estuary stretches about 140 km from the weir in Geesthacht to the coastal city of Cuxhaven in Lower Saxony, Germany. It is considered the most significant riverine nitrogen source in the German Bight of the North Sea (Dähnke et al., 2008). It is a turbid and well-mixed estuarine system with a maximum turbidity zone near Brunsbüttel at Elbe-km 698 (Burchard et al., 2017; Kappenberg and Grabemann, 2001). It has semidiurnal tidal ranges of 2 to 4 m, and its wind conditions are dominated by westerly winds (Hein et al., 2021). Generally, the Elbe Estuary is deepened and dredged to maintain a water depth of 15 to 20 m and grant access to large container ships entering the Port of Hamburg (Kerner, 2007).
The estuary's water residence time is estimated to range between 3 and 22 d (Geerts et al., 2012), with longer residence times during summer when the river discharge is low (Hein et al., 2014). The dissolved NO concentration in the surface water of the Elbe Estuary was measured at various sampling points from the mouth of the estuary to the Port of Hamburg area, as shown in Fig. 1. Sampling was performed upstream against the outgoing tide to prevent tidal effects on our measurements.
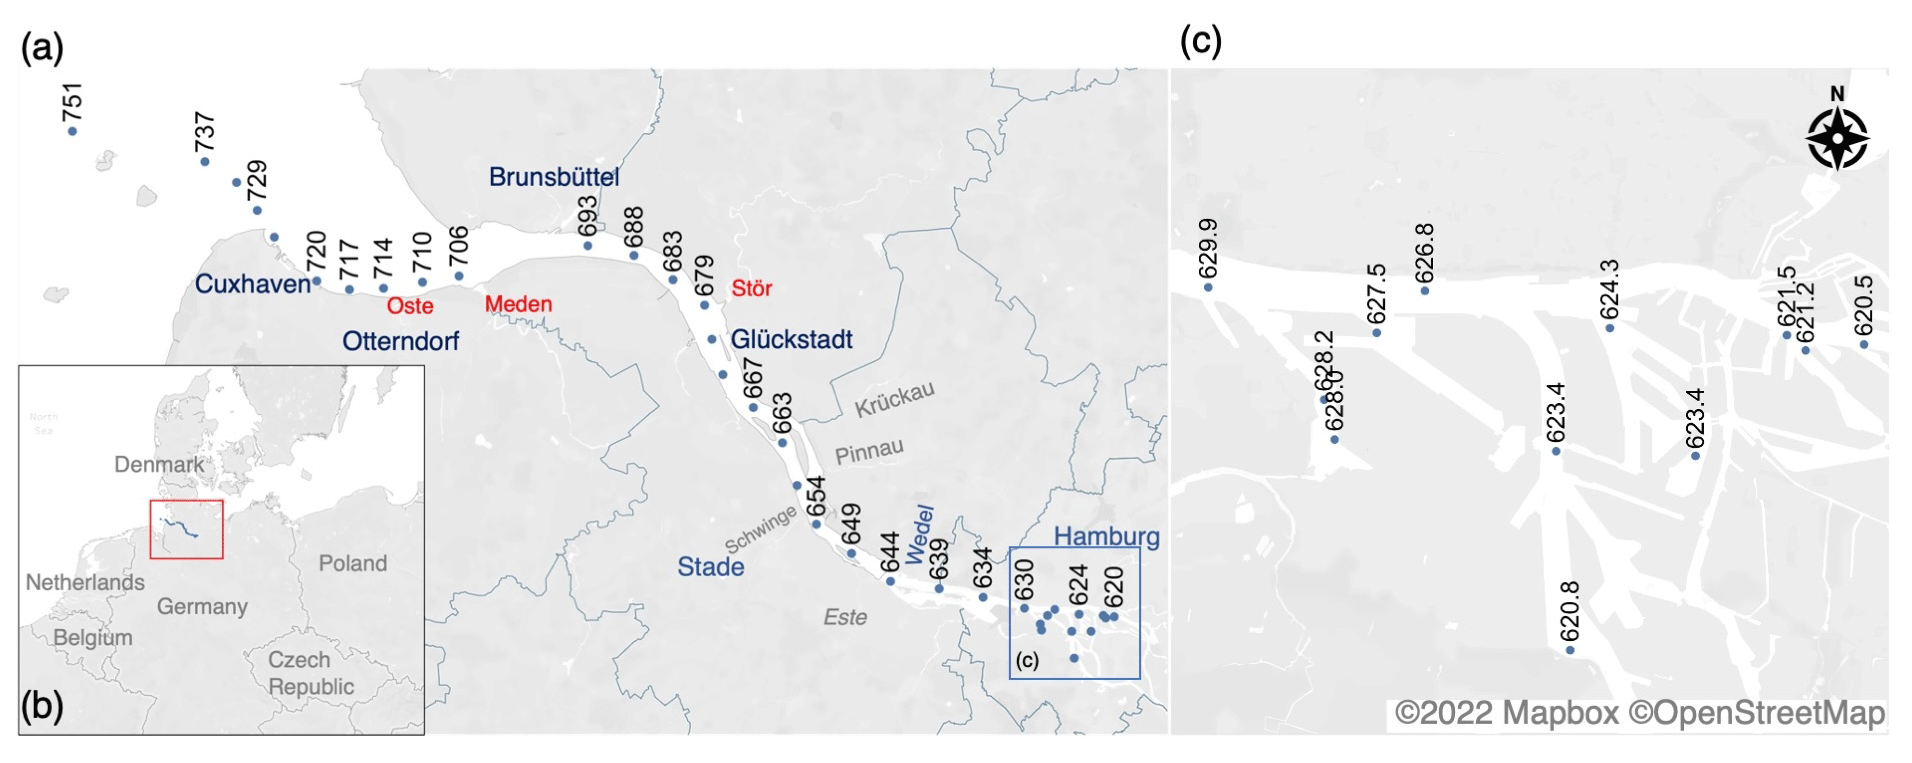
Figure 1(a) Map of the sampling locations with the corresponding stream kilometers and (b) the relative position of the sampling area in northern Europe. (c) A higher-resolution map of the sampling points in the Port of Hamburg area from Elbe-km 620 to 630. Note that we used the following salinity zoning in this study: the brackish–coastal zone downstream of Elbe-km 690, the limnic zone from Elbe-km 630 to 690, and the Port of Hamburg area located from Elbe-km 620 to 630. We indicated the Oste, Meden, and Stör tributaries on the map. Background map: © OpenStreetMap 2022, distributed under the Open Data Commons Open Database License (ODbL) v1.0.2.
2.2 Sampling
Surface water was sampled on board the RV Ludwig Prandtl during a campaign from 27 to 29 July 2021, using a FerryBox flow-through system (Petersen, 2014). The system drew water from approximately 1.2 m below the water surface through a membrane pump. The FerryBox continuously measured in situ biogeochemical parameters, such as dissolved oxygen (O2), pH, salinity, and water temperature. The sensors in the FerryBox system were routinely calibrated or compared to established standard methods. For instance, the optode measurements were compared with the Winkler titration method, leading to an O2 (in µM) correction of (R2=0.97), and the salinity measurements were compared with the OPTIMARE Precision Salinometer (Bremerhaven, Germany).
Discrete water samples were collected for the analysis of nutrients, chlorophyll a, and dissolved NO every 20 min from the FerryBox system bypass using field sampling collection, preservation, and storage methods described in detail in earlier related publications (Schulz et al., 2022; Norbisrath et al., 2022).
Nitrous oxide (N2O) concentrations were measured continuously from a bypass of the FerryBox system using laser-based off-axis integrated cavity output absorption spectroscopy (OA-ICOS; Model 914-0022, Los Gatos Res. Inc., San Jose, CA, USA) coupled with a (sea)water–gas equilibrator. The method had a relative average standard error of 1.28 %; details are described in Schulz et al. (2023) and Brase et al. (2017). Furthermore, wind speeds at 10 m height were measured aboard the vessel using a MaxiMet GMX600 (Gill Instruments, Ltd., Saltash, UK) weather station.
2.3 Measurement of dissolved NO
Because of the short lifetime of NO, triplicate NO samples were measured within 20 min of sampling following the method described by Lutterbeck and Bange (2015). During this campaign, we used a portable NO calibration source (2BTech Model 714 Calibration Source™) to calibrate the NO detector (Birks et al., 2020). The resulting gas output from the calibrator covered the detection range of the NO detector from 0 to 1000 ppb NO. A schematic diagram of the minor update to the components in the analytical method described in Lutterbeck and Bange (2015) is shown in Fig. S1 in the Supplement.
NO signal outputs by the NO detector were recorded using PuTTY 0.78, a free and open-source client application for Windows. To determine NO mole fractions, the Riemann integrals of the signal peaks were calculated using the MATLAB (2022b) trapezoidal numerical integration function trapz. After applying a linear calibration curve of aqueous NO standard solutions prepared according to Lutterbeck and Bange (2015), the final concentrations of dissolved NO (Cw in mol L−1) were computed with Eq. (1):
where x′ is the measured mole fraction of NO from the water sample, P is the atmospheric pressure, and KH is the Henry law constant for NO ( ) (see Zacharia and Deen, 2005).
The instrument limit of detection (LOD) was computed as 3 times the standard deviation (σ) of the blank or zero calibration point. During this campaign, the instrument limit of detection was 9.1 pM, while the average relative standard error was approximately ±26 %. NO concentrations <LOD were omitted from further calculations.
2.4 Estimation of NO flux density and saturation ratios
The flux of NO at the water–air boundary (FNO, in ) was estimated using Eq. (2) from Anifowose and Sakugawa (2017):
where kw is the liquid-phase transfer velocity (m s−1) and pNO is the partial NO pressure (atm) in the overlying atmosphere. The value of kw (expressed in m s−1) was determined according to Borges et al. (2004) (see also Brase et al., 2017):
Here, U is the wind speed at 10 m height (m s−1), Sc is the Schmidt number, νsw is the kinematic viscosity of surface water, and D is the diffusion coefficient of NO in water. U measured aboard the vessel ranged from 1.76 to 8.86 m s−1, with a mean ± standard deviation (SD) wind speed at the sampling stations of 5.78 ± 2.12 m s−1. The kinematic viscosity (vsw, in m2 s−1) was calculated using the following equation:
where the dynamic viscosity of surface water (μsw, in ), a function of temperature (T) and salinity (S), was estimated using Eqs. (6)–(9) from Sharqawy et al. (2010), while density (ρ, in kg m−3) was determined using a MATLAB (2022b) function from Ruiz-Martinez (2021) derived from Gill (1982).
The NO diffusion coefficient (D, m2 s−1) was calculated according to Wise and Houghton (1968):
Furthermore, the NO saturation ratio (NOsat) was calculated based on the measured NO concentration in surface water (NOsw) and the NO concentration (NOeq) in equilibrium with the mole fraction of NO () in the overlying atmosphere:
Here, P is the total ambient pressure set to 1 atm. In this study, it is important to note that the flux density is a rough approximation, as the atmospheric NO mole fraction () was not measured aboard the vessel but, rather, estimated from the air monitoring data available from https://luft.hamburg.de/ (Hamburger Luftmessnetz, 2023). The mean hourly atmospheric NO concentrations (mole fractions) measured at seven air monitoring stations in the Port of Hamburg area during the study period (see Fig. S2 in the Supplement) ranged from 2.00 µg m−3 (1.60 ppb) to 8.25 µg m−3 (6.60 ppb), with a mean ± SD concentration of 4.30 ± 1.76 µg m−3 (3.40 ± 1.41 ppb). The mean atmospheric NO mole fraction of 3.40 ± 1.41 ppb was used to estimate Ceq with Henry's law constant (Eq. 12).
2.5 Measurement of ancillary biogeochemical parameters
Nitrate (), nitrite (), and ammonium () concentrations were measured spectrophotometrically (Dafner, 2015) using air-segmented flow analysis techniques (SEAL AutoAnalyzer 3, SEAL Analytical, Germany). The total dissolved inorganic nitrogen (DIN) was calculated from the sum of , , and concentrations. The limits of detection were as follows: 0.05 µmol L−1 for , 0.05 µmol L−1 for , and 0.07 µmol L−1 for .
Chlorophyll a was extracted in 90 % acetone overnight, measured photometrically (UV–Vis spectrophotometer DR-6000, HACH Lange GmbH, Germany), and calculated using the parameterization by Jeffrey and Humphrey (1975).
2.6 Data analysis
Calculations for apparent oxygen utilization (AOU), N2O saturation, N2O sea(water)-to-air flux density, and excess N2O (ΔN2O) are discussed in Schulz et al. (2023). The data in this study were visualized using Origin 10.5.117 and MATLAB (2022b). Statistical analyses, including mean, median, standard deviation (SD), and Pearson's correlation (R), were performed with MATLAB (2022b). Results with p values<0.05 were considered statistically significant at a 95 % confidence level.
3.1 Biogeochemical setting along the estuary
Figure 2 presents a scatterplot of various near-surface biogeochemical parameters measured from the North Sea to the Port of Hamburg area during the campaign (see also Fig. S3 in the Supplement). As seen in Fig. 2, we can generally observe the mixing of warmer, less-oxygenated, more-acidic, and nutrient-rich waters of the Elbe Estuary with North Sea waters.
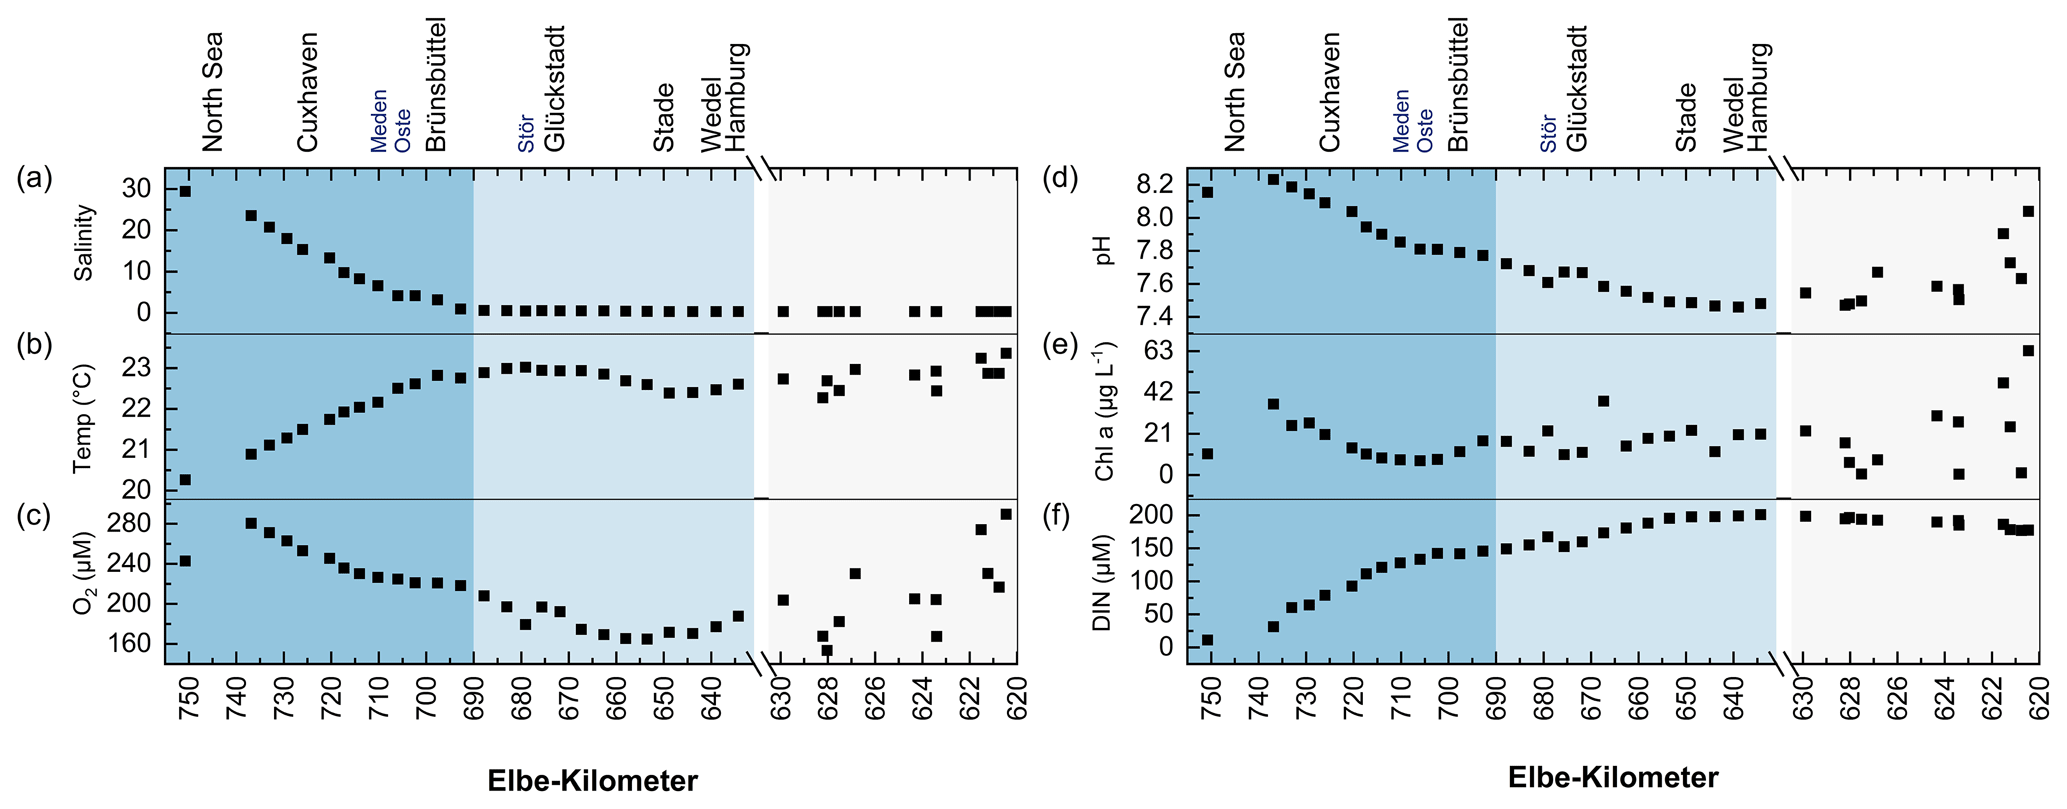
Figure 2Distribution of various surface biogeochemical parameters – (a) salinity, (b) temperature (°C), (c) O2 concentration (µM), (d) pH, (e) chlorophyll-a concentration (µg L−1), and (f) dissolved inorganic nitrogen (µM) – along the Elbe Estuary from the North Sea to Port of Hamburg area. Note that we divided the graph into three distinct salinity zones: the brackish–coastal zone downstream of Elbe-km 690, the limnic zone from Elbe-km 630 to 690, and the Port of Hamburg area located from Elbe-km 620 to 630. The zones can be distinguished using the blue gradient, indicating a decrease in salinity. We included the relative position of selected localities and tributaries along the Elbe Estuary, such as the Meden, Oste, and Stör rivers.
Surface salinity (Fig. 2a) ranged from 0.31 (Port of Hamburg area) to 29.43 (North Sea, Elbe-km 751). A pronounced salinity difference of 6.0 was observed between the North Sea's surface waters (Elbe-km 751) and the estuary's mouth near Cuxhaven (Elbe-km 737). From Elbe-km 737, salinity decreased linearly (0.54 km−1, ) until Elbe-km 693 (near Brunsbüttel). From Elbe-km 693, salinity gradually declined to about 0.31, approaching the Port of Hamburg area. Based on these salinity values, we divided the study site into three distinct zones: the brackish–coastal zone downstream of Elbe-km 690, the limnic zone from Elbe-km 630 to Elbe-km 690, and the Port of Hamburg area from Elbe-km 620 to 630.
The surface temperature (Fig. 2b) steadily increased upstream due to the warmer outflow water from the Elbe River in summer. From 20.26 °C in the North Sea (Elbe-km 751), the temperature increased to 23.03 °C near Glückstadt (Elbe-km 679). Upstream of Elbe-km 679, the water temperature ranged from 22.27 to 23.37 °C, with the highest surface water temperature of 23.37 °C recorded in the Port of Hamburg area at Elbe-km 620.46. This site also had the highest chlorophyll-a and O2 concentrations of 63.3 µg L−1 and 289.6 µM (saturation: 109.2 %), respectively.
The O2 concentration (Fig. 2c) in the North Sea was 242.8 µM (102.3 % saturation) and, thus, slightly lower than the O2 concentration of 280.6 µM (115.6 % saturation) at Elbe-km 737. Upstream of Elbe-km 737, the O2 concentration decreased to 179.5 µM (67.3 % saturation) near Glückstadt. From Glückstadt to near Wedel, the O2 concentration generally declined, ranging from 170.5 µM (63.1 % saturation) to 179.5 µM (67.3 % saturation). In the Port of Hamburg area, the O2 concentration was highly dynamic, ranging from 153.5 µM (57.1 % saturation) to 289.6 µM (109.2 % saturation), following the pH and chlorophyll-a concentration trend. The minimum O2 concentrations in the campaign were also measured at this location, near Elbe-km 628 and Elbe-km 623.
The trend in pH (Fig. 2d) was analogous to the trend in the O2 concentrations (Fig. 2c), likely due to the influence of primary production. At Elbe-km 751 in the North Sea, the measured pH value was 8.15, which is also slightly lower than that at Elbe-km 737 (pH 8.23). From Elbe-km 737, the pH decreased to the lowest measured pH during the entire field campaign (pH 7.46) near Wedel.
Furthermore, the chlorophyll-a concentrations ranged from 0.46 to 46.9 µg L−1 (Fig. 2e). Notably, the minimum and maximum chlorophyll-a concentrations were measured in the Port of Hamburg area at Elbe-km 623 and 622, respectively. No distinguishable spatial pattern in the chlorophyll-a concentration was observed, except that a distinct peak in the chlorophyll-a concentration coincided with the maximum suspended particulate matter (SPM) concentration (not shown) of 412.5 mg L−1 at Elbe-km 667.4 near Glückstadt.
Overall, the DIN concentrations (Fig. 2f) increased from the mouth of the estuary upstream, with the highest concentrations (201 µM) recorded just before the Port of Hamburg area (see also Fig. S3). Further details on the concentration of the DIN substrates are presented in the next section.
In the Supplement, we provided a table presenting the summary statistics (Table S1) and box plots (Fig. S3) of the biogeochemical parameters measured in this study.
3.2 Distribution of N2O and dissolved inorganic nitrogen (DIN) concentrations
Figure 3 shows the distribution of the N2O and DIN components in the study area, while Fig. 4 presents box plots of the data in each salinity zone. The N2O concentrations (Fig. 3a) ranged from 9.1 nM (Elbe-km 737) to 38.0 nM (Elbe-km 628.04), with a mean ± SD concentration of 18.0 ± 6.5 nM and a median concentration of 16.6 nM (see also Schulz et al., 2023).
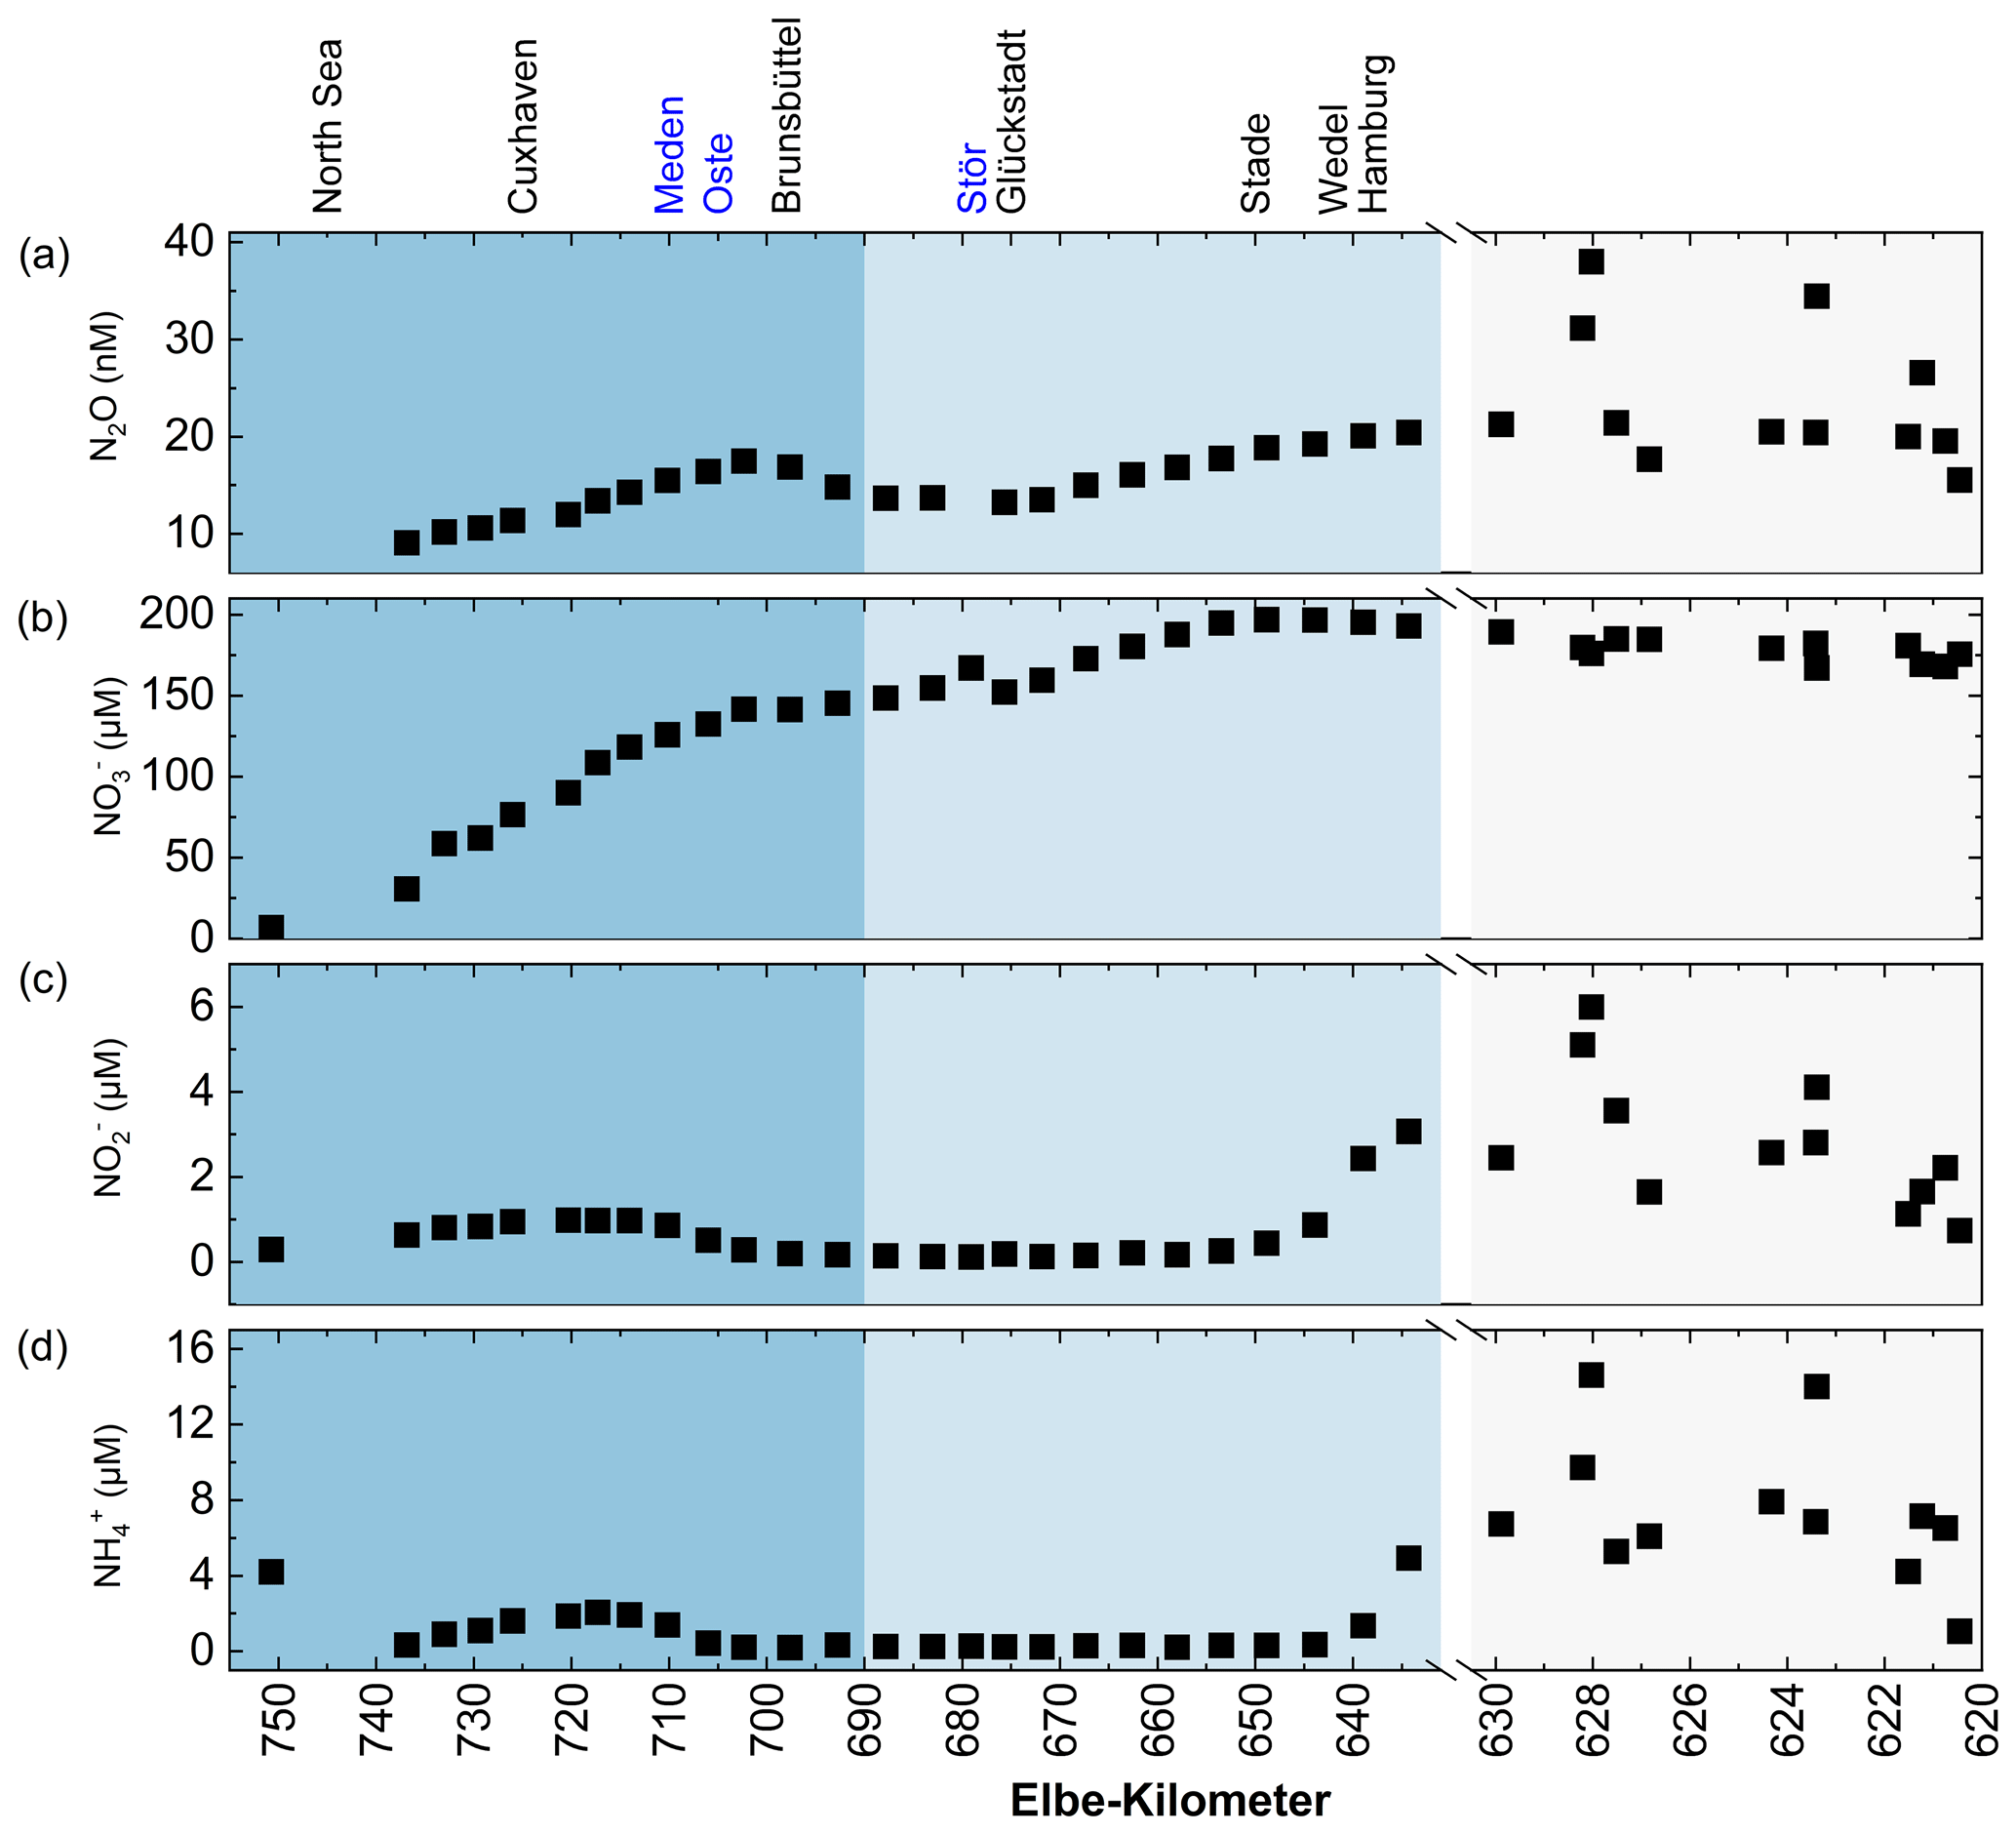
Figure 3Scatterplot of concentrations of (a) N2O, (b) , (c) , and (d) along the Elbe Estuary. We included the relative position of selected localities and tributaries along the Elbe Estuary, such as the Meden, Oste, and Stör rivers.
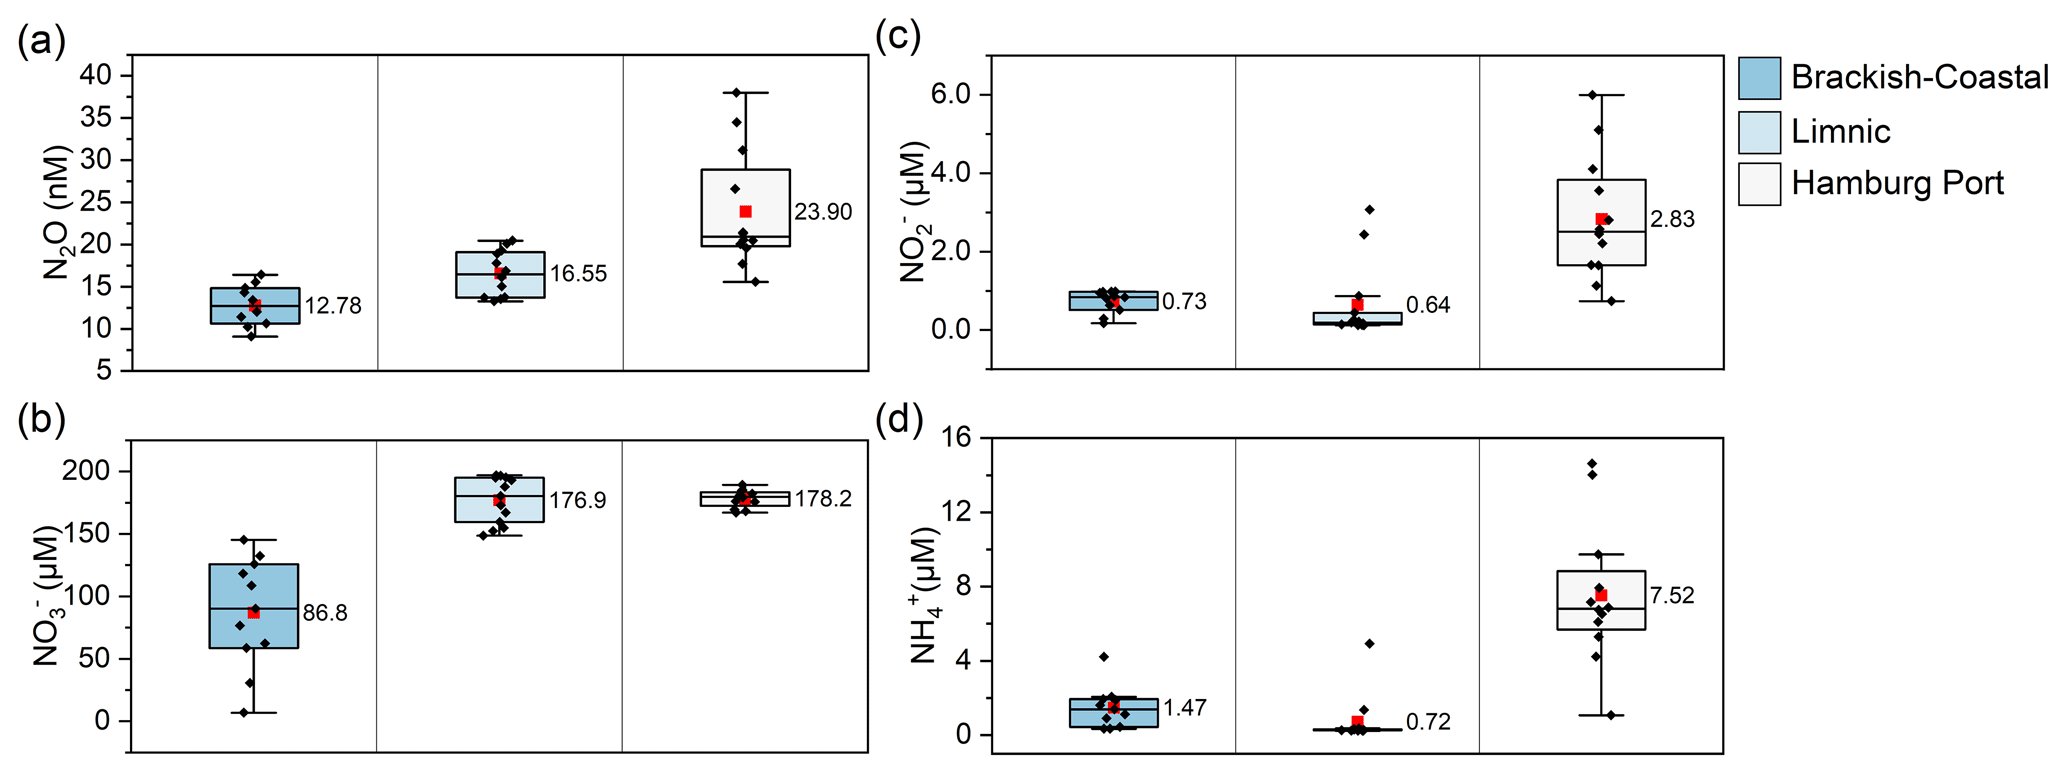
Figure 4Box plot of the concentration of (a) N2O, (b) , (c) , and (d) in each salinity zone along the Elbe Estuary. The boxes represent the interquartile range (IQR), with the lower and upper whiskers extending to the 25th and 75th percentiles, respectively. The median line is shown in the center of each box, while the mean is represented by a red square.
Enhanced N2O concentrations (mean: 23.9 ± 7.1 nM) were measured in the Port of Hamburg area (Fig. 4a). Notably higher N2O concentrations were observed in the Port of Hamburg area at Elbe-km 628.04, 628.21, and 623.40 (Fig. 3a) where the minimum O2 concentrations were measured (Fig. 2c). At these locations, dissolved N2O concentrations exceeded 30 nM. N2O was supersaturated at 440 %, 361 %, and 401 %, respectively, with corresponding fluxes of 131, 116, and 133 (data were taken from Schulz et al., 2023).
The DIN (Fig. 2f) generally increased from the mouth of the estuary upstream until it reached around 200 µM in the Port of Hamburg area. The trend was driven by its primary component, , which reached its maximum of 196.89 µM in the limnic zone at Elbe-km 649 before entering the Port of Hamburg area (Fig. 3b). Upstream of this point, the concentrations were lower.
and concentrations closely followed similar trends (Fig. 3c and d), with slightly higher mean concentrations in the brackish–coastal zone than in the limnic zone (Fig. 4c and d). An increase in and concentrations was also observed downstream of the maximum turbidity zone (Dähnke et al., 2022) at the confluence of the Oste and Meden rivers.
and concentrations increased from Elbe-km 650 to the Port of Hamburg area, where significant variability in their concentrations was observed. The spikes in the and concentrations coincided with those in the N2O concentration in the Port of Hamburg basin at Elbe-km 623.40, 628.04, and 628.21 (Fig. 3).
3.3 Dissolved NO concentrations, saturation ratios, and flux densities
NO concentrations in surface water of the Elbe Estuary (from Elbe-km 737 to Elbe-km 620, n=35) ranged from <LOD to 17.7 pM, with a mean ± SD concentration of 12.5 ± 1.9 pM and a median concentration of 12.1 pM (Fig. 5a). Near the mouth of the estuary, the NO concentrations of five samples were below the detection limit. Concentrations started to increase slightly above the detection limit at the outflow of the Meden River near Otterndorf at Elbe-km 710 and 714. The measured NO concentration remained steady at around 12.0–13.0 pM in the limnic zone of the estuary, with a slightly enhanced concentration at Elbe-km 676 (13.7 pM), a sampling site in the port of Glückstadt.
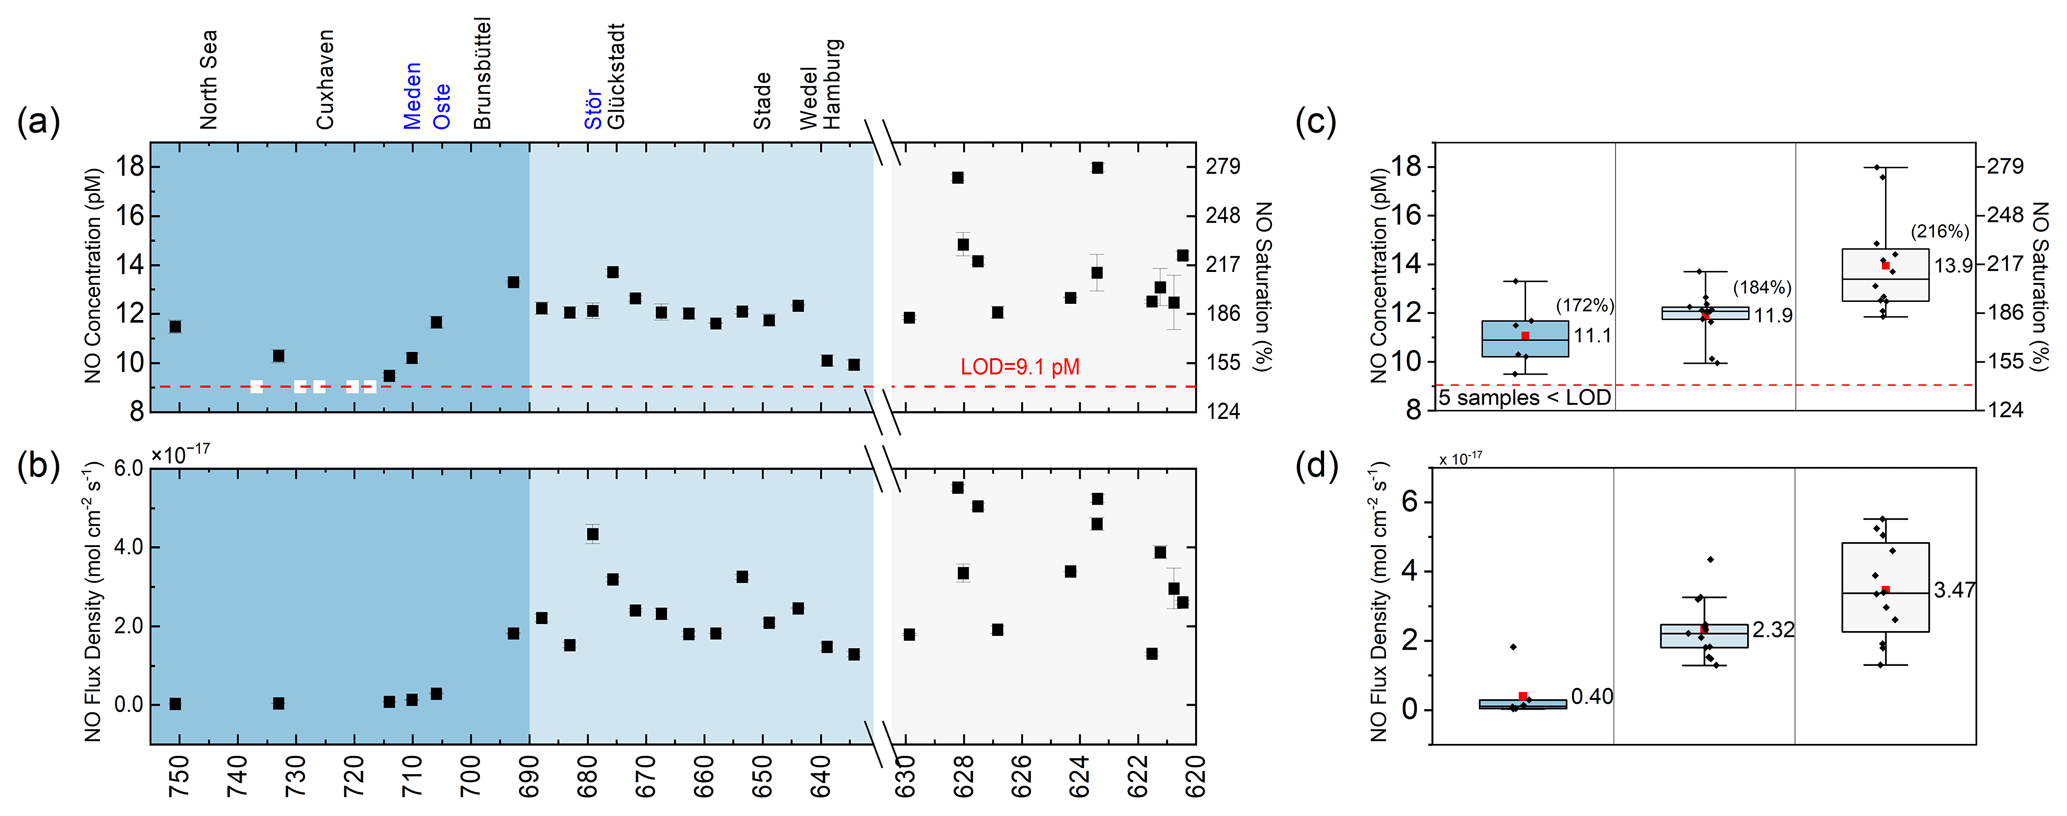
Figure 5Scatterplot of (a) dissolved NO concentration (pM) and saturation (%) and (b) sea–to–air flux density () estimates along the Elbe Estuary. Box plot of (c) dissolved NO concentration (pM) and saturation (%) and (d) sea–to–air flux density estimates along the Elbe Estuary. Note that the mean atmospheric NO concentration of 4.30 µg m−3 at seven background air monitoring stations in Hamburg located in close proximity to the Elbe Estuary was used to estimate the flux density. We included the relative position of selected localities and tributaries along the Elbe Estuary, such as the Meden, Oste, and Stör rivers. The error bars indicate the standard deviation of the replicates for panels (a) and (b) and the samples for panels (c) and (d).
Further upstream, high NO concentrations in the Port of Hamburg area were observed, with peaks of 17.7 pM at Elbe-km 623.40 and 17.6 pM at Elbe-km 628.21. Generally, average NO concentrations increased as salinity decreased (Fig. 5c), with a mean ± SD concentration of 11.1 ± 1.4 pM in the brackish–coastal zone, 11.9 ± 1.1 pM in the limnic zone, and 13.9 ± 2.0 pM in the Port of Hamburg area (Fig. 5c).
The NO saturation values (excluding <LOD) ranged from 147 % to 274 %, with mean saturation values of 172 %, 184 %, and 216 % in the brackish–coastal zone, limnic zone, and the Port of Hamburg area, respectively (Fig. 5c). The overall mean ± SD and median NO saturations in the surface layer of the Elbe Estuary were 194 ± 29 % and 189 %, respectively.
Moreover, the NO flux density (excluding <LOD) ranged from to , with overall mean ± SD and median flux densities of and , respectively (Fig. 5b). The mean NO flux densities also generally increased as salinity decreased (Fig. 5d).
4.1 NO concentrations, saturations, and flux densities
Figure 6 shows a compilation of average dissolved NO concentrations and estimated flux densities from previous studies. The measured concentrations from the previous studies were highly variable and ranged between 5.9 and 260 pM. Previous studies have suggested that the ocean could potentially act as a significant source of NO to the atmosphere. Early studies by Zafiriou and McFarland (1981) reported supersaturation of up to a factor of 104 in the central equatorial Pacific Ocean. More recent studies performed since 2010 have reported supersaturation from 100 to 10 000 %. To date, the majority of the literature reports that NO production causes supersaturation in the surface water and a positive sea-to-air flux density, indicating emissions as a major sink; however, regional exceptions, such as one measurement in the Shandong Peninsula (Gong et al., 2023), indicate that generalizations should be made cautiously. The values vary greatly both temporally and spatially across the studied sites; however, no distinct spatiotemporal pattern or variability has been established yet.
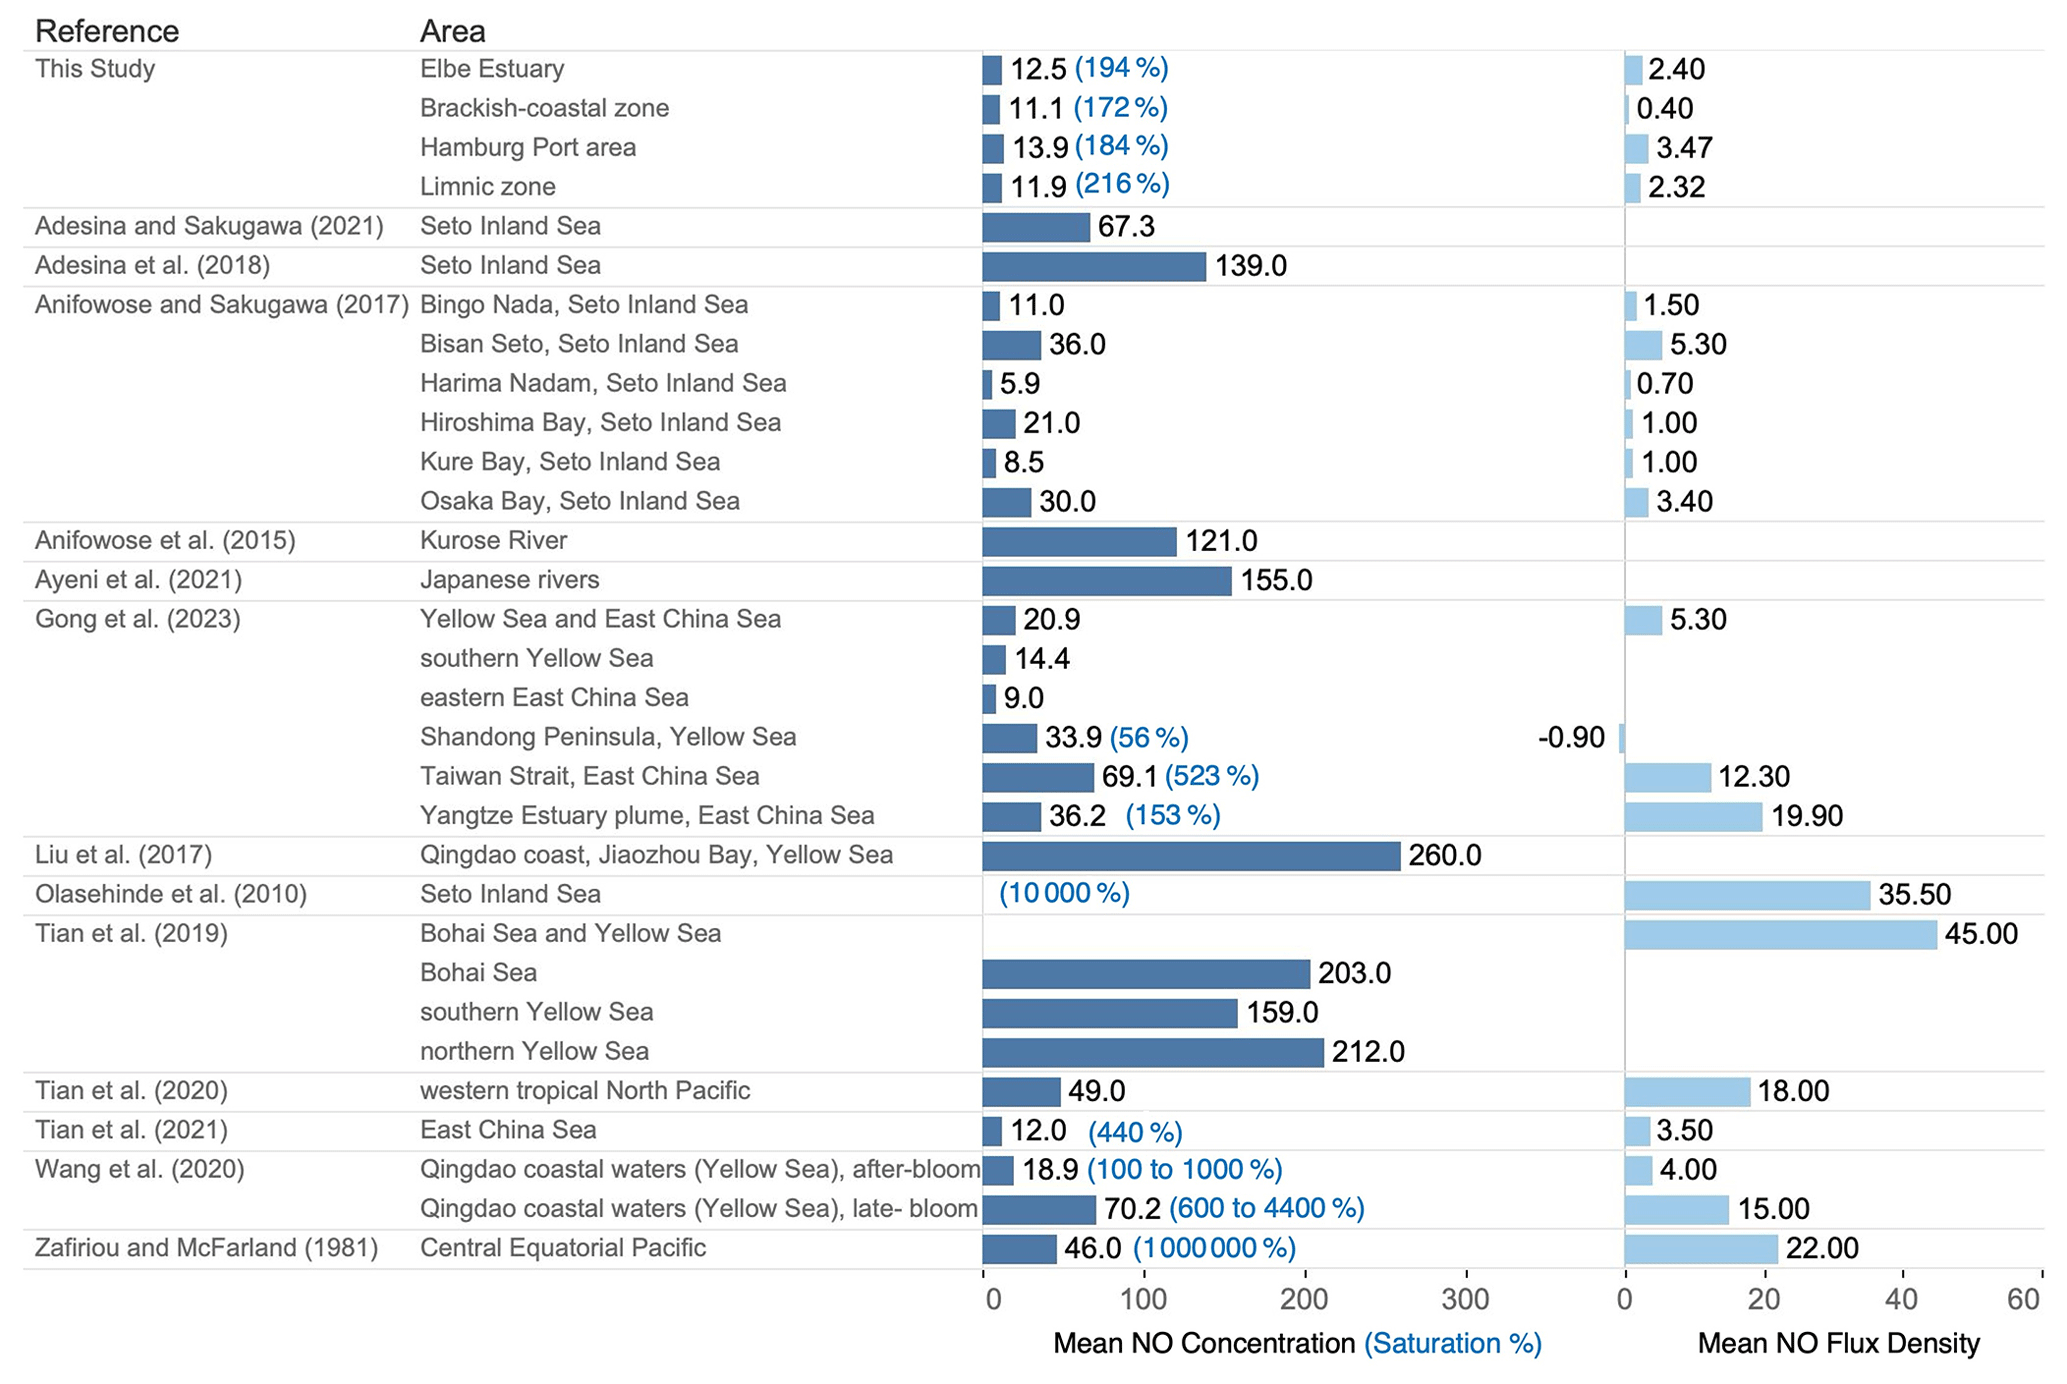
Figure 6Comparison of the mean dissolved NO concentration (pM), saturation values (%), and estimated sea–to–air flux density ( ) from previous studies and the present study.
In our study, the mean NO concentration was 12.5 ± 1.9 pM, which is at the lower end of the range of previously published measurements from the marine environment. Despite these low concentrations, NO was supersaturated in the surface layer of the Elbe Estuary (see Sect. 3.3), indicating that the Elbe Estuary, particularly the Port of Hamburg area, was a source of NO to the atmosphere during the study period. The mean estimated flux density in this study is close to the average flux density from the Kurose River reported by Anifowose and Sakugawa (2017) but at the lower end of flux densities reported from shelf and open-ocean waters.
Our result is consistent with previous studies that reported strong supersaturation of NO in surface seawater (Fig. 6). Olasehinde et al. (2010) and Adesina and Sakugawa (2021) have demonstrated that, even at an extremely low NO concentration, NO production in surface seawater is sufficient to cause strong supersaturation. Both studies, citing Jacobi and Hilker (2007), discussed that NO can be transferred to the gas phase due to the low solubility of NO in (sea)water or aqueous solution.
The observed variations in NO concentrations and flux densities along the salinity gradient indicate potential changes in NO production pathways and controlling factors that influence NO distribution in the entire Elbe Estuary and in each salinity zone, which we discuss in the following sections. The correlation analysis between NO and various biogeochemical parameters is presented in Table S3 in the Supplement.
4.2 Influence of salinity and freshwater input on NO concentrations
Along the salinity gradient, the average NO concentrations tended to increase from the North Sea towards the Elbe River (Sect. 3.3). Although this negative correlation is not statistically significant (Table S3), the negative slope suggests a potential inverse relationship, in which a decrease in salinity appears to coincide with an increase in NO concentration, which could potentially be attributed to DIN input from the Elbe River. This finding has been observed in prior studies by Gong et al. (2023), Adesina and Sakugawa (2021), and Tian et al. (2019), who identified a similar negative trend between dissolved NO concentrations and salinity. Nonetheless, salinity alone is insufficient to explain the uneven distribution of NO at our study site, indicating that other parameters influence NO concentrations along the Elbe Estuary.
4.3 Influence of dissolved inorganic nitrogen on NO concentrations
There are two widely known sources of NO in surface seawater: photolysis and biological production. It is well reported that is the primary source of NO in seawater through photolysis (Treinin and Hayon, 1970; Zafiriou et al., 1980; Anifowose et al., 2015), as shown in Reaction (R1) below:
However, the mechanism of how nitrogen-containing nutrients (, , and ) and their cycling affect the dissolved NO distribution in aquatic environments remains unresolved. Gong et al. (2023) argued that nitrogen-containing nutrients may serve as the substrate or intermediate for photochemical and microbial NO production; thus, high concentrations of , , and ensure that the necessary conditions for NO production are met. In this study, the , , and concentrations were higher than those found in previous studies in the river and coastal areas (e.g., Ayeni et al., 2021; Gong et al., 2023; Liu et al., 2017); however, the elevated nitrogenous nutrient concentrations did not correspond to a higher average dissolved NO concentration in the Elbe Estuary.
Our observation challenges the assumption that higher concentrations of nitrogen nutrients automatically lead to an increased dissolved NO concentration, indicating that other factors may play significant roles in regulating NO concentrations in coastal and estuarine environments. Some studies (e.g., Olasehinde et al., 2010; Anifowose et al., 2015; Anifowose and Sakugawa, 2017; Ayeni et al., 2021; Gong et al., 2023) observed positive correlations between NO concentrations or photoproduction rates and concentrations. In contrast, other studies (Tian et al., 2020, 2021) did not observe any relationship between surface NO distribution and concentrations of , , and .
While Gong et al. (2023) argued that nitrogen-containing nutrients may serve as the substrate or intermediate for photochemical and microbial NO production, they also noted areas in their study site (i.e., the nearshore region of the Shandong Peninsula) where the DIN concentrations were significantly lower but the surface dissolved NO concentration was high, attributing this to the uptake of atmospheric NO into the surface layer. Likewise, Ayeni et al. (2021) also noted that some rivers in Japan with higher concentrations had lower rates of photoproduction of NO and vice versa, attributing these imbalances to nitrogen-cycling processes (nitrification, denitrification, and anammox), which could produce or consume NO, or the photochemical transformation of organic nitrogen from dissolved organic matter producing to form NO in areas with low .
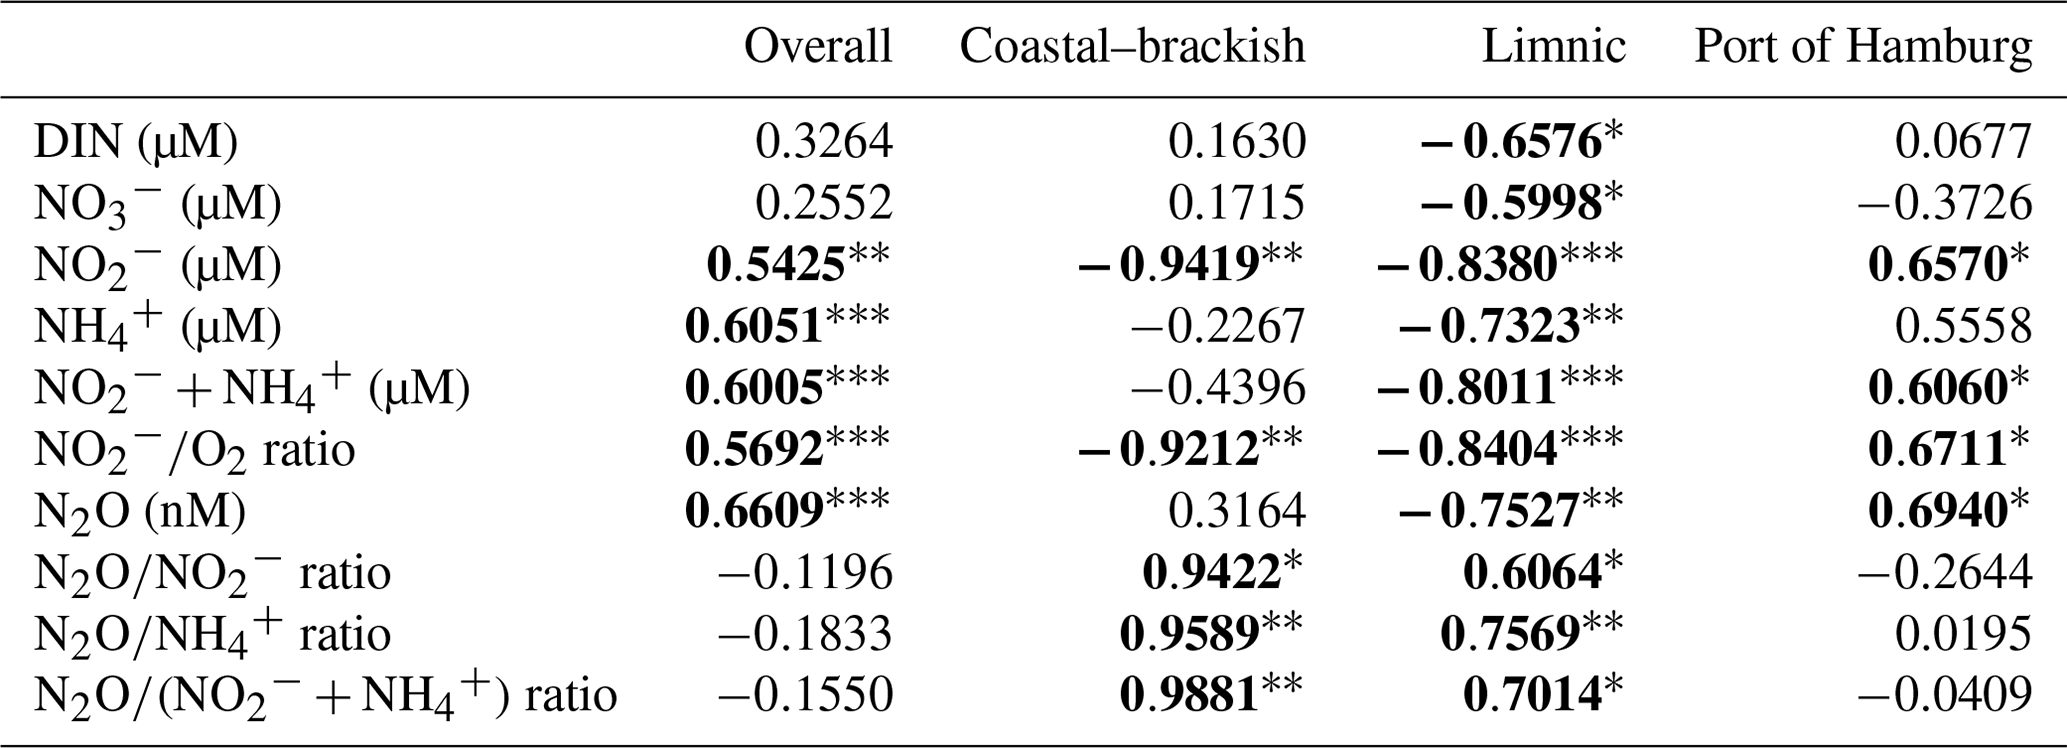
Shown in Table 1 is a correlation analysis between NO and the DIN substrates. Using the entire data set (i.e., “Overall”), we observed a significant positive correlation between NO and , , the sum of and , N2O, and the ratio. Drawing solely from these findings, one might infer that elevated concentrations of and invariably lead to an increase in the NO concentration. However, this is not a consistent observation across all salinity zones. We found that there is a significant negative relationship (p<0.05) between the concentrations of NO and DIN, , , , the sum of and , and N2O in the limnic zone, while there is there is a significant negative relationship between NO and in the coastal–brackish zone. In contrast, there is a significant positive correlation (p<0.05) between concentrations of NO and , N2O, and the sum of and in the Port of Hamburg area (Table 1). In the next section, we will try to explain the different processes that may have contributed to this trend.
Table 1The Pearson correlation coefficient (R) values between NO and some nitrogen parameters in each salinity zone. Significant correlations are denoted using bold font. Note that the superscripts after the R values indicate a significant correlation at p<0.001, p<0.01, and ∗ p<0.05.
4.4 Biological production of NO
We explored the possibility of NO production from phytoplankton (e.g., Wang et al., 2020; Kim et al., 2006) as NO may be generally consumed or produced by phytoplankton while they bloom and/or in response to environmental stress and pollution (Burlacot et al., 2020; Estevez and Puntarulo, 2005; Mallick et al., 2002; Zhang et al., 2006). However, we noted that chlorophyll-a concentrations (a proxy for phytoplankton biomass) were minimal (<6.50 µg L−1) in areas where the NO concentration peaked (i.e., Elbe 623.40 and 628.04), suggesting that phytoplankton bloom may not be a major factor contributing to the higher dissolved NO concentration at our study site. Similar to the findings of Tian et al. (2021), the NO distribution in the Elbe Estuary is not directly related to the distribution of chlorophyll a (p>0.05; Table S3).
As discussed earlier, Ayeni et al. (2021) suggested that nitrogen-cycling processes (nitrification, denitrification, and anammox) may influence NO distribution in river systems. These processes are simplified in Reactions (R2) to (R4) (see Kuypers et al., 2018). Note that Reaction (R2) pertains to ammonia-oxidizing bacteria; the specific pathway and enzymology of archaeal nitrification remain the subject of ongoing research and debate. In the following sections, we investigate how these various nitrogen-cycling processes may have influenced NO concentrations in the Elbe Estuary. The nitrification reaction proceeds as follows:
The denitrification process proceeds as follows:
The anammox process proceeds as follows:
4.4.1 Nitrification in the Elbe Estuary
Recently, Gong et al. (2023) noted nitrification as the major contributor to the microbial production of NO in the coastal sea regions of the Yellow and East China seas. Nitrification is an aerobic two-step process in which is oxidized to nitrate (Reaction R2). In this process, N2O is assumed to be a byproduct and NO is reported to be an obligate intermediate of bacterial nitrification produced by hydroxylamine oxidoreductase (Caranto and Lancaster, 2017).
In the Elbe Estuary, nitrification is reported to be the main production pathway of N2O (Brase et al., 2017; Schulz et al., 2023). As shown in Fig. 7b, AOU had a significant positive linear relationship with ΔN2O in the entire stretch of the Elbe Estuary – in the brackish–coastal zone (R=0.95, p<0.001), limnic zone (R=0.65, p<0.05), and in the Port of Hamburg area (R=0.75, p<0.01). Additionally, a significant positive linear correlation was noted between N2O and (Fig. S5b in the Supplement; see Walter et al., 2006) in the brackish coastal zone (R=0.96, p<0.001) and in the limnic zone (R=0.94, p<0.001). Previous studies (Yoshinari, 1976; Yoshida et al., 1989; Nevison et al., 2003; Walter et al., 2006) established that a significant positive linear relationship between AOU and ΔN2O, as well as N2O and , indicates N2O production from nitrification; Brase et al. (2017) and Schulz et al. (2023) also observed these linear correlations in the Elbe Estuary.
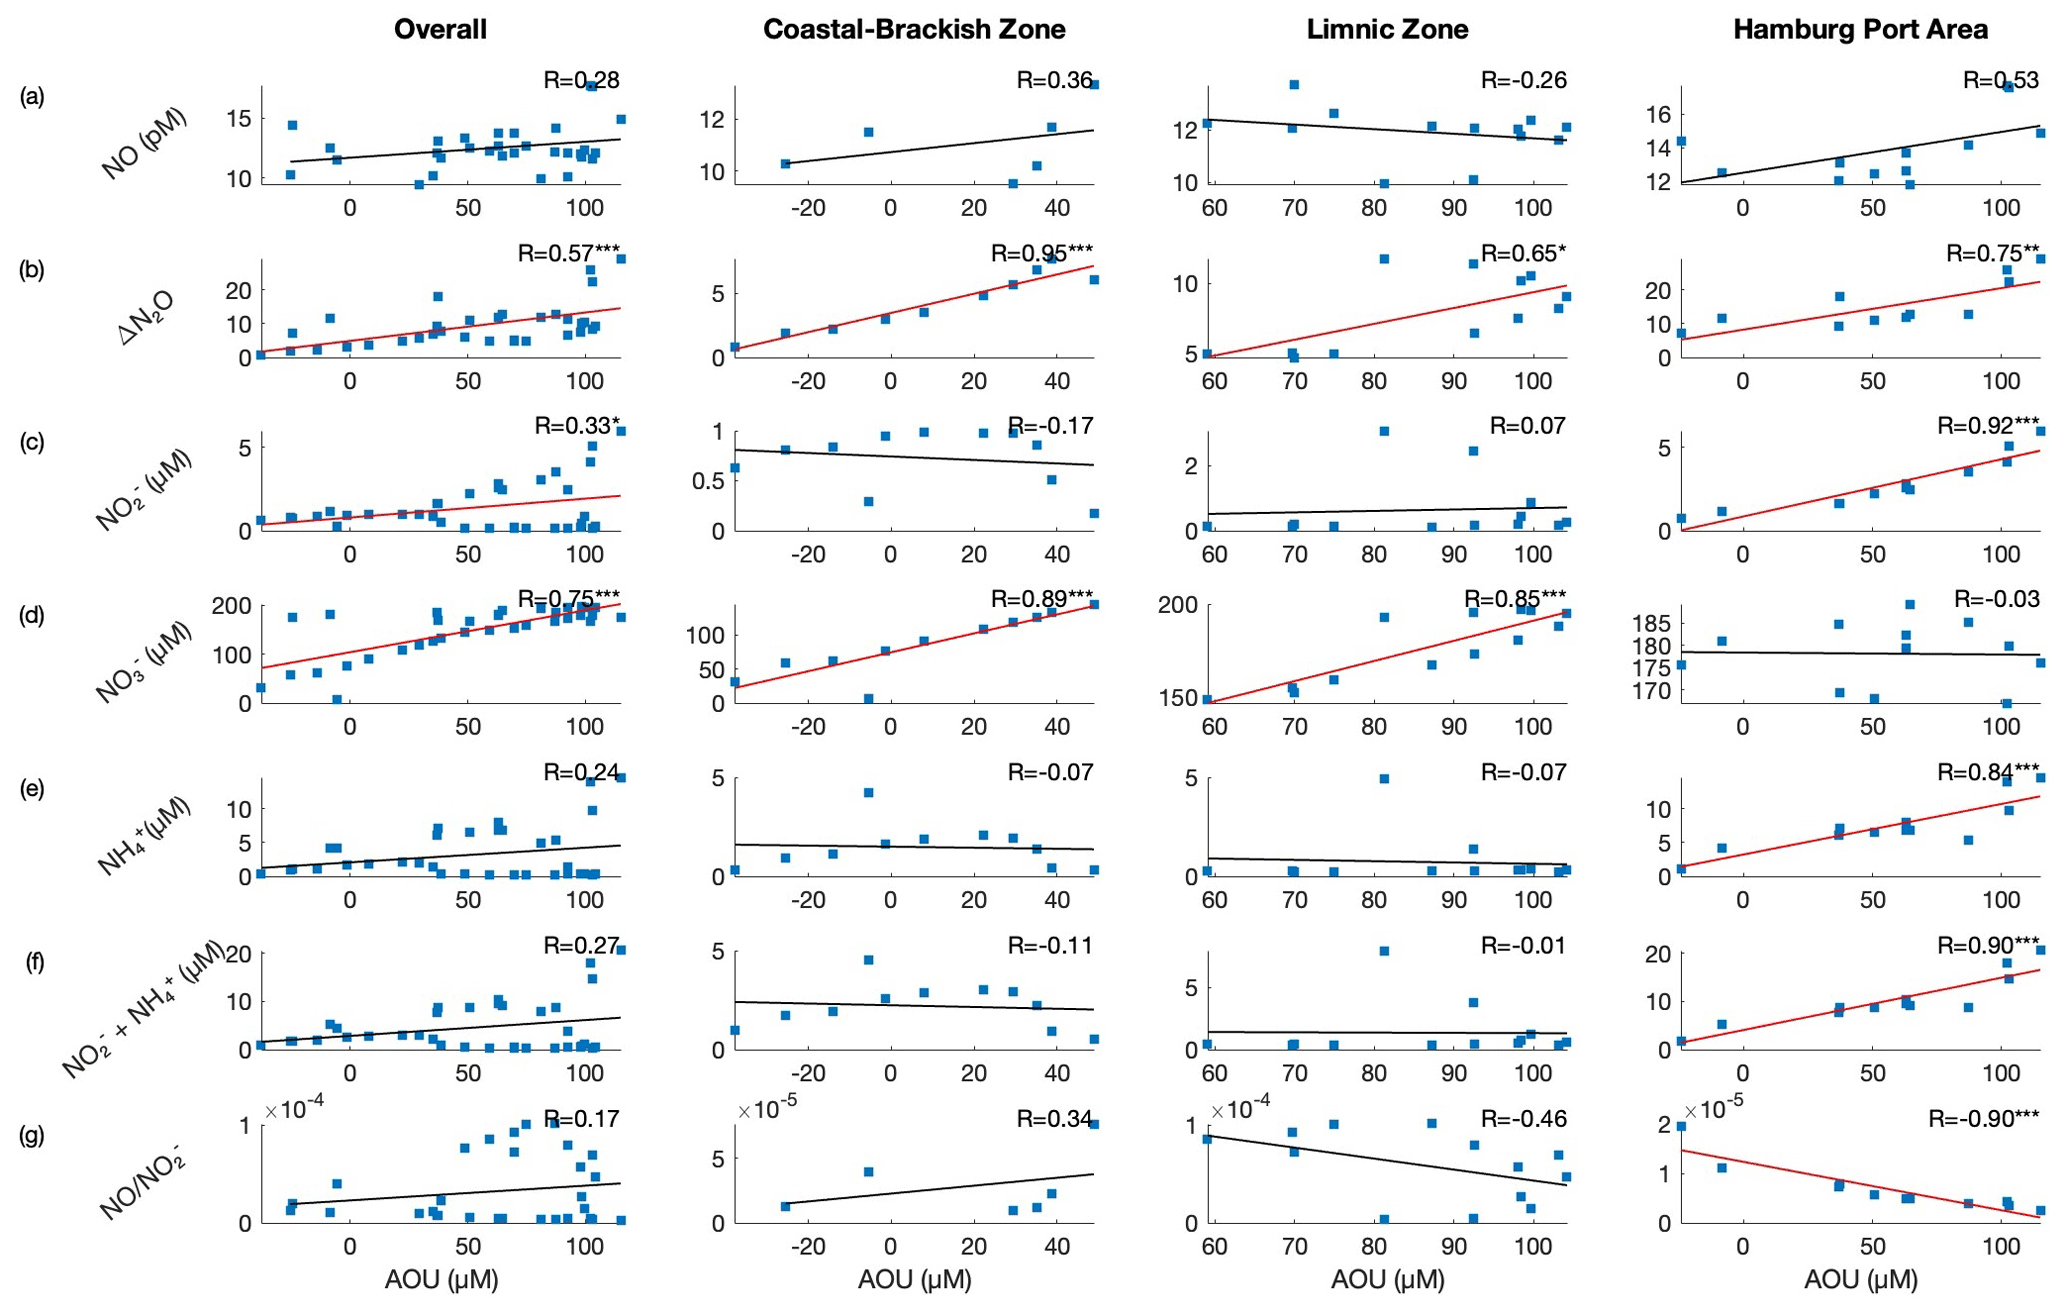
Figure 7Scatterplots between AOU (µmol L−1) and (a) NO (pM), (b) ΔN2O, (c) (µM), (d) (µM), (e) (µM), (f) (µM), and (g) ratio. Note that the superscripts on the R value indicate a significant correlation at p<0.001, p<0.01, and ∗ p<0.05. Significant correlations are denoted using a red regression line. We observed significant correlations between AOU and in the coastal–brackish and limnic zones, indicating nitrification as a dominant process.
If N2O levels rise with levels, it could indicate active nitrification (see Schulz et al., 2023), during which NO is produced as an intermediate (Caranto and Lancaster, 2017). The nitrification process can be observed in the brackish–coastal and limnic zones of the Elbe Estuary; we also observed significant inverse correlations in these two zones – the significant inverse relationship between NO vs. and NO vs. (Fig. 8c and f). We speculate that this could be partly attributed to limitation (see Fig. 4) and a high O2 concentration. The well-oxygenated conditions in the coastal–brackish and limnic zones facilitate the aerobic process of nitrification. In the nitrification process (Reaction R2), serves as the initial substrate. In the limnic zone, we observed that the NO concentration was higher when was low (Fig. 8d); is consumed as it is oxidized to NO. As NO underwent further oxidation to produce , the NO concentration decreased while increased. This plausibly explains the negative correlation between NO vs. and the ratio that we observed in our study. Furthermore, we observed that the NO concentration can also be explained by the ratio of N2O, the byproduct of nitrification, with , the initial reactant of nitrification, and with , the oxidized product of NO, as shown in Fig. 8h and i.
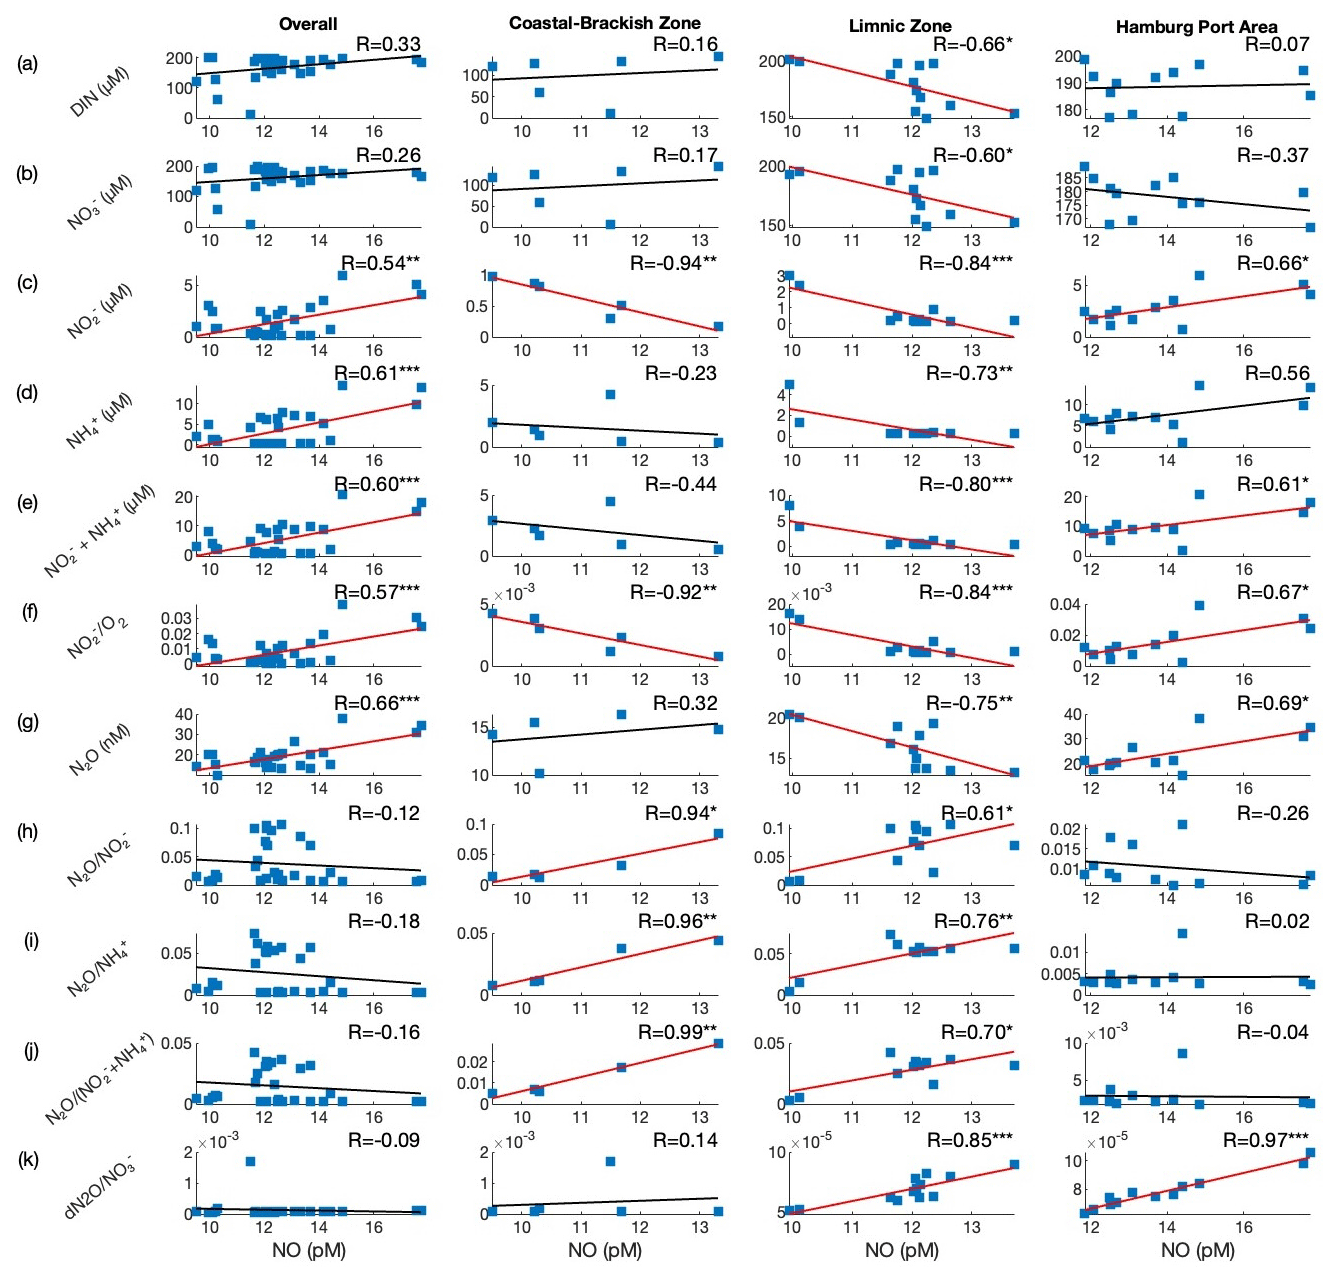
Figure 8Scatterplots between NO (pM) and (a) DIN (µM), (b) (µM), (c) (µM), (d) (µM), (e) (µM), (f) ratio, (g) N2O, (h) ratio, (i) ratio, (j) , and (k) ratio. Note that the superscripts on the R value indicate a significant correlation at p<0.001, p<0.01, and ∗ p<0.05. Significant correlations are denoted using a red regression line.
4.4.2 Nitrogen transformation processes in the Port of Hamburg area
In contrast to the brackish–coastal and limnic zones, where and concentrations are low (see Sect. 3.2), the concentrations of and (>1 µM) in the Port of Hamburg area were elevated (Fig. 4c and d). and may primarily come from anthropogenic sources, like wastewater discharge, agricultural runoff, industrial effluents, and remineralization of suspended particulate matter or organic matter (Wolfstein and Kies, 1999; Kerner, 2000). Sanders et al. (2018) reported that the phytoplankton growth in the upstream section of the Elbe Estuary, which produces degradable organic matter, plays an important role in the remineralization and nitrification processes in the upper part of the Elbe Estuary (i.e., Port of Hamburg area). The study noted that remineralization provides the substrate necessary for nitrification. If is not limited or has a continuous supply in the nitrification Reaction (R2), one would expect a direct relationship between NO and . Indeed, we noted a significant correlation between the concentrations of NO vs. and NO vs. (Table 1; see also Fig. 8c and f). Aside from a correlation with and NO vs. , we also noted a significant correlation between NO and the sum of and , N2O, and . This means that the distribution of NO concentration in the Port of Hamburg area can be partly explained by processes involving these factors.
Despite the strong correlation between AOU and ΔN2O in the Port of Hamburg area, we observed no significant correlation between AOU and . We think that this lack of correlation between AOU and may be due to other nitrogen transformation processes that influence the concentration or that affect oxidation, such as nitrifier denitrification, denitrification (Reaction R3), anammox (Reaction R4), and/or primary production. Previous studies have reported that the Port of Hamburg area is a hotspot for N2O production, attributed to nitrification and nitrifier-denitrification processes (Brase et al., 2017). Prior studies have confirmed the highest denitrification rates in the sediments (Deek et al., 2013) and the highest nitrification rates in the water column at this section of the Elbe Estuary (Sanders et al., 2018). During this study, we did not have the tools to distinguish the exact process involved. However, future studies are recommended to utilize dual stable isotope techniques and molecular or genetic tools to detect marker genes specific to nitrogen-cycling microorganisms.
4.5 Influence of dissolved oxygen on NO
Dissolved oxygen, which was mainly influenced by primary productivity and respiration (see Fig. 2c–e), played a significant role in the distribution of nitrogen compounds. In this study, we noted significant negative correlations (p<0.0001) between O2 and , , and N2O (Fig. S6 in the Supplement). Moreover, distinct peaks in (>4 µM) and (>9.5 µM) were measured at the sampling sites in the Port of Hamburg area at Elbe-km 628.04, 628.21, and 623.40, with the lowest O2 concentrations (<150 µM) (Fig. 3). In these sampling locations, relatively higher concentrations of NO (>14 pM) and N2O (>30 µM) were also measured. At these sampling stations, the N2O and NO saturations were exceedingly high, reaching values of over 360 % and 270 %, respectively. These high NO and N2O saturations are notable, as they suggest a significant level of production.
The measured O2 concentrations in the Port of Hamburg area could inhibit anaerobic nitrogen processes, such as denitrification or anammox in the water column. Nevertheless, oxygen-limited conditions often found in sediments (Schroeder et al., 1991; Deek et al., 2013) and within biofilms or anoxic microsites on suspended particles (Liu et al., 2013; Xia et al., 2017) in estuaries provide suitable microenvironments for anaerobic processes to occur. For instance, nitrifying bacteria may switch from nitrification to nitrifier denitrification (see Schulz et al., 2022; Dai et al., 2008) in these environments. We noted that both NO and N2O concentrations started to increase downstream of the maximum turbidity zone near the confluence of the Meden and Stör rivers.
Moreover, previous studies (Schroeder, 1997; Sanders et al., 2018; van Beusekom et al., 2021; Brase et al., 2017) have indicated that low-O2 conditions may develop in the Port of Hamburg area due to its geomorphological features and high nutrient content, particularly from runoff and remineralization process (Kerner and Spitzy, 2001). During eutrophication, increased nutrient availability stimulates algal growth, leading to O2 depletion at night or daybreak, as algae consume O2 through respiration. As the algal blooms eventually die off and decompose (Goosen et al., 1995), microbial processes like nitrifier denitrification and denitrification thrive under low-O2 conditions, potentially releasing NO and N2O. These biological processes are important in shaping the biogeochemical profile of the estuary, with photosynthesis contributing to peaks in O2 and chlorophyll a during daylight hours and respiration leading to O2 depletion and potentially creating favorable conditions for N2O and NO production during nighttime or in less-oxygenated microenvironments such as suspended sediments or particulate matter (Schulz et al., 2022). Future studies on the influence of primary productivity and respiration on O2 conditions and the NO production or consumption processes in estuaries are recommended.
Further investigation is necessary to elucidate the potential seasonal variability in NO concentrations within the Elbe Estuary. Seasonal fluctuations significantly influence and loading (Malinowski et al., 2020), particularly during the spring and summer when agricultural practices intensify, and nitrogen-based fertilizers are used extensively (Pastuszak et al., 2018). These factors contribute to increased and concentrations in the estuary, primarily due to heightened surface runoff and leaching from agricultural areas. Additionally, in the Port of Hamburg area, the decomposition of phytoplankton coming from the upstream Elbe River may contribute to increased and concentrations due to remineralization. Sanders et al. (2018) reported that nitrification varied seasonally and was linked to the remineralization of this organic matter. This could subsequently lead to O2 depletion, especially during the warmer summer months, coinciding with increased microbial activity that could intensify nitrogen transformation processes (Schulz et al., 2023; Sanders et al., 2018). To date, no comprehensive study has examined the seasonal dynamics of NO concentrations in such contexts.
Our study provides the first measurement of dissolved NO in the Elbe Estuary, shedding light on the potential sources and processes driving NO production in this area. We observed variations in NO concentrations and flux densities along the salinity gradient, with elevated levels in the Port of Hamburg area. During this campaign, the surface water of the lower Elbe Estuary and Port of Hamburg area was supersaturated. During the time of sampling, the Elbe Estuary was a source of NO to the atmosphere with a mean flux density (± SD) of . Notably, the Port of Hamburg area showed a higher mean flux density of .
Excess nutrients may result in algal blooms that can lower the O2 concentration and favor processes that produce NO and N2O. Moreover, despite nitrogen-containing nutrient concentrations in the Elbe Estuary being higher than those reported in previous studies in other regions, the NO concentrations remained low. This observation prompts further investigation into how nitrogen transformation processes could influence the NO distribution in the Elbe Estuary. It is recommended that future research adopt a more comprehensive approach, incorporating both higher-temporal-resolution (covering diurnal and seasonal cycles) and spatially diverse sampling strategies, including stable isotope techniques, measurement of process rates through isotope tracers, and use of molecular or genetic tools to detect marker genes specific to nitrogen-cycling microorganisms. This combined approach will enable a more nuanced understanding of the dynamic interplay between various controlling factors influencing the NO concentration in the coastal and estuarine environments.
The data sets generated and/or analyzed in this study can be accessed by contacting the corresponding author. The data are also publicly available from the Coastal Observing System for Northern and Arctic Seas (COSYNA) data portal (https://codm.hzg.de/codm/, last access: 1 June 2024) and are archived at https://doi.org/10.5281/zenodo.11548798 (Ingeniero, 2024).
The supplement related to this article is available online at: https://doi.org/10.5194/bg-21-3425-2024-supplement.
RCOI conceptualized and designed the study, carried out field sampling and analysis, and authored the manuscript. GS managed the research cruise, performed laboratory analyses of supplementary biogeochemical parameters, and contributed a critical review of the manuscript. HWB assisted with study conceptualization, supervision, and a critical review of the manuscript.
At least one of the (co-)authors is a member of the editorial board of Biogeosciences. The peer-review process was guided by an independent editor, and the authors also have no other competing interests to declare.
Publisher's note: Copernicus Publications remains neutral with regard to jurisdictional claims made in the text, published maps, institutional affiliations, or any other geographical representation in this paper. While Copernicus Publications makes every effort to include appropriate place names, the final responsibility lies with the authors.
The authors would like to thank the captain and crew of the R/V Ludwig Prandtl for their assistance and support during the fieldwork. We would also like to express our gratitude to our colleagues at the Helmholtz-Zentrum Hereon, who participated in the sampling and invited our research group to join this field campaign. Moreover, we are grateful to Yoana Voynova and her working group for providing the FerryBox data. We would also like to acknowledge Annette Kock, who assisted in the logistics of this field campaign, and Estela Monteiro for providing helpful comments on the earlier version of the paper. Lastly, we gratefully acknowledge the anonymous reviewers for their insightful comments and suggestions, which significantly enhanced the quality of our paper and prepared it for publication.
This research has been supported by the Deutscher Akademischer Austauschdienst (grant no. 57440921). This study has also been partly funded by the Deutsche Forschungsgemeinschaft (DFG, German Research Foundation) under Germany's Excellence Strategy – EXC 2037 “CLICCS – Climate, Climatic Change, and Society” – project no. 390683824, contribution to the Center for Earth System Research and Sustainability (CEN) of Universität Hamburg.
The article processing charges for this open-access publication were covered by the GEOMAR Helmholtz Centre for Ocean Research Kiel.
This paper was edited by Yuan Shen and reviewed by three anonymous referees.
Abada, A., Beiralas, R., Narvaez, D., Sperfeld, M., Duchin-Rapp, Y., Lipsman, V., Yuda, L., Cohen, B., Carmieli, R., Ben-Dor, S., Rocha, J., Huang Zhang, I., Babbin, A. R., and Segev, E.: Aerobic bacteria produce nitric oxide via denitrification and promote algal population collapse, ISME J., 17, 1167–1183, https://doi.org/10.1038/s41396-023-01427-8, 2023.
Adesina, A. O. and Sakugawa, H.: Photochemically generated nitric oxide in seawater: The peroxynitrite sink and its implications for daytime air quality, Sci. Total Environ., 781, 146683, https://doi.org/10.1016/j.scitotenv.2021.146683, 2021.
Amann, T., Weiss, A., and Hartmann, J.: Carbon dynamics in the freshwater part of the Elbe estuary, Germany: Implications of improving water quality, Estuar. Coast Shelf S., 107, 112–121, https://doi.org/10.1016/j.ecss.2012.05.012, 2012.
Anifowose, A. J. and Sakugawa, H.: Determination of daytime flux of nitric oxide radical (NO•) at an inland sea–atmospheric boundary in japan, J. Aquat. Pollut. Toxicol., 1, 1–6, 2017.
Anifowose, A. J., Takeda, K., and Sakugawa, H.: Photoformation rate, steady-state concentration and lifetime of nitric oxide radical (NO) in a eutrophic river in Higashi-Hiroshima, Japan, Chemosphere, 119, 302–309, https://doi.org/10.1016/j.chemosphere.2014.06.063, 2015.
Ayeni, T. T., Jadoon, W. A., Adesina, A. O., Sunday, M. O., Anifowose, A. J., Takeda, K., and Sakugawa, H.: Measurements, sources and sinks of photoformed reactive oxygen species in Japanese rivers, Geochem. J., 55, 89–102, https://doi.org/10.2343/geochemj.2.0620, 2021.
Bange, H. W., Mongwe, P., Shutler, J. D., Arévalo-Martínez, D. M., Bianchi, D., Lauvset, S. K., Liu, C., Löscher, C. R., Martins, H., Rosentreter, J. A., Schmale, O., Steinhoff, T., Upstill-Goddard, R. C., Wanninkhof, R., Wilson, S. T., and Xie, H.: Advances in understanding of air-sea exchange and cycling of greenhouse gases in the upper ocean, Elementa: Science of the Anthropocene, 12, 1–20, https://doi.org/10.1525/elementa.2023.00044, 2023.
Birks, J. W., Turnipseed, A. A., Andersen, P. C., Williford, C. J., Strunk, S., Carpenter, B., and Ennis, C. A.: Portable calibrator for NO based on the photolysis of N2O and a combined source for field calibrations of air pollution monitors, Atmos. Meas. Tech., 13, 1001–1018, https://doi.org/10.5194/amt-13-1001-2020, 2020.
Borges, A., Vanderborght, J.-P., Schiettecatte, L.-S., Gazeau, F., Ferrón-Smith, S., Delille, B., and Frankignoulle, M.: Variability of gas transfer velocity of CO2 in a macrotidal estuary (The Scheldt), Estuaries, 27, 593–603, https://doi.org/10.1007/BF02907647, 2004.
Brase, L., Bange, H. W., Lendt, R., Sanders, T., and Dähnke, K.: High Resolution Measurements of Nitrous Oxide (N2O) in the Elbe Estuary, Frontiers Mar. Sci., 4, 162, https://doi.org/10.3389/fmars.2017.00162, 2017.
Burchard, H., Schuttelaars, H. M., and Ralston, D. K.: Sediment Trapping in Estuaries, Annu. Rev. Mar. Sci., 10, 371–395, https://doi.org/10.1146/annurev-marine-010816-060535, 2017.
Burlacot, A., Richaud, P., Gosset, A., Li-Beisson, Y., and Peltier, G.: Algal photosynthesis converts nitric oxide into nitrous oxide, P. Natl. Acad. Sci. USA, 117, 2704–2709, https://doi.org/10.1073/pnas.1915276117, 2020.
Caranto, J. D. and Lancaster, K. M.: Nitric oxide is an obligate bacterial nitrification intermediate produced by hydroxylamine oxidoreductase, P. Natl. Acad. Sci. USA, 114, 8217–8222, https://doi.org/10.1073/pnas.1704504114, 2017.
Dafner, E. V.: Segmented continuous-flow analyses of nutrient in seawater: Intralaboratory comparison of Technicon AutoAnalyzer II and Bran + Luebbe Continuous Flow AutoAnalyzer III, Limnol. Oceanogr.-Meth., 13, 511–520, https://doi.org/10.1002/lom3.10035, 2015.
Dähnke, K., Bahlmann, E., and Emeis, K.: A nitrate sink in estuaries? An assessment by means of stable nitrate isotopes in the Elbe estuary, Limnol. Oceanogr., 53, 1504–1511, https://doi.org/10.4319/lo.2008.53.4.1504, 2008.
Dähnke, K., Sanders, T., Voynova, Y., and Wankel, S. D.: Nitrogen isotopes reveal a particulate-matter-driven biogeochemical reactor in a temperate estuary, Biogeosciences, 19, 5879–5891, https://doi.org/10.5194/bg-19-5879-2022, 2022.
Dai, M., Wang, L., Guo, X., Zhai, W., Li, Q., He, B., and Kao, S.-J.: Nitrification and inorganic nitrogen distribution in a large perturbed river/estuarine system: the Pearl River Estuary, China, Biogeosciences, 5, 1227–1244, https://doi.org/10.5194/bg-5-1227-2008, 2008.
Deek, A., Dähnke, K., van Beusekom, J., Meyer, S., Voss, M., and Emeis, K.: N2 fluxes in sediments of the Elbe Estuary and adjacent coastal zones, Mar. Ecol. Prog. Ser., 493, 9–21, https://doi.org/10.3354/meps10514, 2013.
Estevez, M. S. and Puntarulo, S.: Nitric oxide generation upon growth of Antarctic Chlorella sp. cells, Physiol. Plantarum, 125, 192–201, https://doi.org/10.1111/j.1399-3054.2005.00561.x, 2005.
Fanning, K. A.: Influence of atmospheric pollution on nutrient limitation in the ocean, Nature, 339, 460–463, https://doi.org/10.1038/339460a0, 1989.
Geerts, L., Wolfstein, K., Jacobs, S., van Damme, S., and Vandenbruwaene, W.: Zonation of the TIDE estuaries, Tide Report, http://www.tide-toolbox.eu/pdf/reports/Zonation_of_the_TIDE_estuaries (last access: 1 June 2024), 2012.
Gill, A. E.: Atmosphere-Ocean Dynamics, International Geophysics Series, Vol. 30, Academic Press, California, USA, 645 pp., ISBN 978-0122835223, 1982.
Gong, J.-C., Jin, H., Li, B.-H., Tian, Y., Liu, C.-Y., Li, P.-F., Liu, Q., Ingeniero, R. C. O., and Yang, G.-P.: Emissions of Nitric Oxide from Photochemical and Microbial Processes in Coastal Waters of the Yellow and East China Seas, Environ. Sci. Technol., 57, 4039–4049, https://doi.org/10.1021/acs.est.2c08978, 2023.
Goosen, N. K., van Rijswijk, P., and Brockmann, U.: Comparison of heterotrophic bacterial production rates in early spring in the turbid estuaries of the Scheldt and the Elbe, Hydrobiologia, 3111, 31–42, https://doi.org/10.1007/bf00008569, 1995.
Haagen-Smit, A. J. and Fox, M. M.: Photochemical Ozone Formation with Hydrocarbons and Automobile Exhaust, Air Repair, 4, 105–136, https://doi.org/10.1080/00966665.1954.10467649, 1954.
Hamburger Luftmessnetz: Hamburger Luftmessnetz – Infos, https://luft.hamburg.de/, last access: 2 May 2023.
Hein, H., Hein, B., Mai, S., and Barjenbruch, U.: The residence time in the Elbe River focusing on the estuary, in: ICHE 2014, edited by: Lehfeldt, R. and Kopmann, R., Proceedings of the 11th International Conference on Hydroscience & Engineering, 28 September–2 October 2014, Hamburg, Germany, Karlsruhe: Bundesanstalt für Wasserbau, 837–844, 2014.
Hein, S. S. V., Sohrt, V., Nehlsen, E., Strotmann, T., and Fröhle, P.: Tidal Oscillation and Resonance in Semi-Closed Estuaries – Empirical Analyses from the Elbe Estuary, North Sea, Water-SUI, 13, 848, https://doi.org/10.3390/w13060848, 2021.
Howarth, R., Chan, F., Conley, D. J., Garnier, J., Doney, S. C., Marino, R., and Billen, G.: Coupled biogeochemical cycles: eutrophication and hypoxia in temperate estuaries and coastal marine ecosystems, Front. Ecol. Environ., 9, 18–26, https://doi.org/10.1890/100008, 2011.
Ingeniero, R. C.: Dissolved nitric oxide concentrations and other parameters measured in the Lower Elbe Estuary and the Hamburg Port Area during the RV Ludwig Prandtl Cruise in July 2021, Zenodo [data set], https://doi.org/10.5281/zenodo.11548798, 2024.
IPCC: Climate Change 2021: The Physical Science Basis. Contribution of Working Group I to the Sixth Assessment Report of the Intergovernmental Panel on Climate Change, Cambridge University Press, Cambridge, United Kingdom and New York, NY, USA, https://doi.org/10.1017/9781009157896, 2021.
Jacobi, H.-W. and Hilker, B.: A mechanism for the photochemical transformation of nitrate in snow, J. Photoch. Photobio. A, 185, 371–382, https://doi.org/10.1016/j.jphotochem.2006.06.039, 2007.
Jaeglé, L., Steinberger, L., Martin, R. V., and Chance, K.: Global partitioning of NOx sources using satellite observations: Relative roles of fossil fuel combustion, biomass burning and soil emissions, Faraday Discuss., 130, 407–423, https://doi.org/10.1039/b502128f, 2005.
Jeffrey, S. W. and Humphrey, G. F.: New spectrophotometric equations for determining chlorophylls a, b, c1, and c2 in higher plants, algae, and natural phytoplankton, Biochem. Physiol. Pfl., 167, 191–197, https://doi.org/10.1016/S0015-3796(17)30778-3, 1975.
Kappenberg, J. and Grabemann, I.: Variability of the mixing zones and estuarine turbidity maxima in the Elbe and Weser estuaries, Estuaries, 24, 699–706, https://doi.org/10.2307/1352878, 2001.
Kerner, M.: Interactions between local oxygen deficiencies and heterotrophic microbial processes in the Elbe estuary, Limnologica, 30, 137–143, https://doi.org/10.1016/s0075-9511(00)80008-0, 2000.
Kerner, M.: Effects of deepening the Elbe Estuary on sediment regime and water quality, Estuar. Coast Shelf S., 75, 492–500, https://doi.org/10.1016/j.ecss.2007.05.033, 2007.
Kerner, M. and Spitzy, A.: Nitrate Regeneration Coupled to Degradation of Different Size Fractions of DON by the Picoplankton in the Elbe Estuary, Microb. Ecol., 41, 69–81, https://doi.org/10.1007/s002480000031, 2001.
Kim, D., Yamaguchi, K., and Oda, T.: Nitric oxide synthase-like enzyme mediated nitric oxide generation by harmful red tide phytoplankton, Chattonella marina, J. Plankton Res., 28, 613–620, https://doi.org/10.1093/plankt/fbi145, 2006.
Kuypers, M. M. M., Marchant, H. K., and Kartal, B.: The microbial nitrogen-cycling network, Nat. Rev. Microbiol., 16, 263–276, https://doi.org/10.1038/nrmicro.2018.9, 2018.
Lancaster, J. R.: A Tutorial on the Diffusibility and Reactivity of Free Nitric Oxide, Nato Sci. S. A Lif. Sci., 1, 18–30, https://doi.org/10.1006/niox.1996.0112, 1997.
Likens, G. E., Wright, R. F., Galloway, J. N., and Butler, T. J.: Acid Rain, Sci. Am., 241, 43–51, https://doi.org/10.1038/scientificamerican1079-43, 1979.
Liu, C.-Y., Feng, W.-H., Tian, Y., Yang, G.-P., Li, P.-F., and Bange, H. W.: Determination of dissolved nitric oxide in coastal waters of the Yellow Sea off Qingdao, Ocean Sci., 13, 623–632, https://doi.org/10.5194/os-13-623-2017, 2017.
Liu, T., Xia, X., Liu, S., Mou, X., and Qiu, Y.: Acceleration of denitrification in turbid rivers due to denitrification occurring on suspended sediment in oxic waters, Environ. Sci. Technol., 47, 4053–4061, https://doi.org/10.1021/es304504m, 2013.
Lutterbeck, H. E. and Bange, H. W.: An improved method for the determination of dissolved nitric oxide (NO) in seawater samples, Ocean Sci., 11, 937–946, https://doi.org/10.5194/os-11-937-2015, 2015.
Lutterbeck, H. E., Arévalo-Martínez, D. L., Löscher, C. R., and Bange, H. W.: Nitric oxide (NO) in the oxygen minimum zone off Peru, Deep-Sea Res. Pt. II, 156, 148–154, https://doi.org/10.1016/j.dsr2.2017.12.023, 2018.
Malinowski, M., Alawi, M., Krohn, I., Ruff, S., Indenbirken, D., Alawi, M., Karrasch, M., Lüschow, R., Streit, W. R., Timmermann, G., and Pommerening-Röser, A.: Deep amoA amplicon sequencing reveals community partitioning within ammonia-oxidizing bacteria in the environmentally dynamic estuary of the River Elbe, Sci. Rep.-UK, 10, 17165, https://doi.org/10.1038/s41598-020-74163-0, 2020.
Mallick, N., Mohn, F. H., Soeder, C. J., and Grobbelaar, J. U.: Ameliorative role of nitric oxide on H2O2 toxicity to a chlorophycean alga Scenedesmus obliquus, J. Gen. Appl. Microbiol., 48, 1–7, https://doi.org/10.2323/jgam.48.1, 2002.
Nevison, C., Butler, J. H., and Elkins, J. W.: Global distribution of N2O and the ΔN2O-AOU yield in the subsurface ocean, Global Biogeochem. Cy., 17, 1119, https://doi.org/10.1029/2003gb002068, 2003.
Norbisrath, M., Pätsch, J., Dähnke, K., Sanders, T., Schulz, G., van Beusekom, J. E. E., and Thomas, H.: Metabolic alkalinity release from large port facilities (Hamburg, Germany) and impact on coastal carbon storage, Biogeosciences, 19, 5151–5165, https://doi.org/10.5194/bg-19-5151-2022, 2022.
Olasehinde, E. F., Takeda, K., and Sakugawa, H.: Photochemical Production and Consumption Mechanisms of Nitric Oxide in Seawater, Environ. Sci. Technol., 44, 8403–8408, https://doi.org/10.1021/es101426x, 2010.
Pastuszak, M., Kowalkowski, T., Kopiński, J., Doroszewski, A., Jurga, B., and Buszewski, B.: Long-term changes in nitrogen and phosphorus emission into the Vistula and Oder catchments (Poland) – modeling (MONERIS) studies, Environ. Sci. Pollut. R., 25, 29734–29751, https://doi.org/10.1007/s11356-018-2945-7, 2018.
Petersen, W.: FerryBox systems: State-of-the-art in Europe and future development, J. Marine Syst., 140, 4–12, https://doi.org/10.1016/j.jmarsys.2014.07.003, 2014.
Ruiz-Martinez, G.: Seawater density from salinity, temperature and pressure, MATLAB Central File Exchange, https://www.mathworks.com/matlabcentral/fileexchange/85900-seawater-density-from-salinity-temperature-and-pressure (last access: 5 June 2023), 2021.
Sanders, T., Schöl, A., and Dähnke, K.: Hot Spots of Nitrification in the Elbe Estuary and Their Impact on Nitrate Regeneration, Estuar. Coast., 41, 128–138, https://doi.org/10.1007/s12237-017-0264-8, 2018.
Schreiber, F., Wunderlin, P., Udert, K. M., and Wells, G. F.: Nitric oxide and nitrous oxide turnover in natural and engineered microbial communities: biological pathways, chemical reactions, and novel technologies, Front. Microbiol., 3, 372, https://doi.org/10.3389/fmicb.2012.00372, 2012.
Schroeder, F.: Water quality in the Elbe estuary: Significance of different processes for the oxygen deficit at Hamburg, Environ. Model. Assess., 2, 73–82, https://doi.org/10.1023/a:1019032504922, 1997.
Schroeder, F., Klages, D., and Knauth, H. D.: Contributions of sediments to the nitrogen budget of the Elbe estuary, Int. Ver. Theor. Angew. Limnol.: Verh., 24, 3063–3066, https://doi.org/10.1080/03680770.1989.11899231, 1991.
Schulz, G., Sanders, T., van Beusekom, J. E. E., Voynova, Y. G., Schöl, A., and Dähnke, K.: Suspended particulate matter drives the spatial segregation of nitrogen turnover along the hyper-turbid Ems estuary, Biogeosciences, 19, 2007–2024, https://doi.org/10.5194/bg-19-2007-2022, 2022.
Schulz, G., Sanders, T., Voynova, Y. G., Bange, H. W., and Dähnke, K.: Seasonal variability of nitrous oxide concentrations and emissions in a temperate estuary, Biogeosciences, 20, 3229–3247, https://doi.org/10.5194/bg-20-3229-2023, 2023.
Sharqawy, M. H., Lienhard, J. H., and Zubair, S. M.: Thermophysical properties of seawater: a review of existing correlations and data, Desalination and Water Treatment, 16, 354—380, https://doi.org/10.5004/dwt.2010.1079, 2010.
Tian, Y., Xue, C., Liu, C.-Y., Yang, G.-P., Li, P.-F., Feng, W.-H., and Bange, H. W.: Nitric oxide (NO) in the Bohai Sea and the Yellow Sea, Biogeosciences, 16, 4485–4496, https://doi.org/10.5194/bg-16-4485-2019, 2019.
Tian, Y., Yang, G.-P., Liu, C.-Y., Li, P.-F., Chen, H.-T., and Bange, H. W.: Photoproduction of nitric oxide in seawater, Ocean Sci., 16, 135–148, https://doi.org/10.5194/os-16-135-2020, 2020.
Tian, Y., Wang, K.-K., Yang, G.-P., Li, P.-F., Liu, C.-Y., Ingeniero, R. C. O., and Bange, H. W.: Continuous Chemiluminescence Measurements of Dissolved Nitric Oxide (NO) and Nitrogen Dioxide (NO2) in the Ocean Surface Layer of the East China Sea, Environ. Sci. Technol., 55, 3668–3675, https://doi.org/10.1021/acs.est.0c06799, 2021.
Treinin, A. and Hayon, E.: Absorption spectra and reaction kinetics of NO2, N2O3, and N2O4 in aqueous solution, J. Am. Chem. Soc., 92, 5821–5828, https://doi.org/10.1021/ja00723a001, 1970.
van Beusekom, J. E. E., Fehling, D., Bold, S., and Sanders, T.: Pelagic oxygen consumption rates in the Elbe estuary: Proxies and spatial patterns, EGU General Assembly 2021, online, 19–30 Apr 2021, EGU21-8699, https://doi.org/10.5194/egusphere-egu21-8699, 2021.
Walter, S., Bange, H. W., Breitenbach, U., and Wallace, D. W. R.: Nitrous oxide in the North Atlantic Ocean, Biogeosciences, 3, 607–619, https://doi.org/10.5194/bg-3-607-2006, 2006.
Wang, K. K., Tian, Y., Li, P. F., Liu, C. Y., and Yang, G. P.: Sources of nitric oxide during the outbreak of Ulva prolifera in coastal waters of the Yellow Sea off Qingdao, Mar. Environ. Res., 162, 105177, https://doi.org/10.1016/j.marenvres.2020.105177, 2020.
Wise, D. L. and Houghton, G.: Diffusion coefficients of neon, krypton, xenon, carbon monoxide and nitric oxide in water at 10–60 °C, Chem. Eng. Sci., 23, 1211–1216, https://doi.org/10.1016/0009-2509(68)89029-3, 1968.
Wolfstein, K. and Kies, L.: Composition of suspended participate matter in the Elbe estuary: Implications for biological and transportation processes, Dtsch. Hydrogr. Z., 51, 453–463, https://doi.org/10.1007/bf02764166, 1999.
Xia, X., Liu, T., Yang, Z., Michalski, G., Liu, S., Jia, Z., and Zhang, S.: Enhanced nitrogen loss from rivers through coupled nitrification-denitrification caused by suspended sediment, Sci. Total Environ., 579, 602–612, https://doi.org/10.1016/j.scitotenv.2016.10.181, 2017.
Yoshida, N., Morimoto, H., Hirano, M., Koike, I., Matsuo, S., Wada, E., Saino, T., and Hattori, A.: Nitrification rates and 15N abundances of N2O and in the western North Pacific, Nature, 342, 895–897, https://doi.org/10.1038/342895a0, 1989.
Yoshinari, T.: Nitrous oxide in the sea, Mar. Chem., 4, 189–202, https://doi.org/10.1016/0304-4203(76)90007-4, 1976.
Zacharia, I. G. and Deen, W. M.: Diffusivity and Solubility of Nitric Oxide in Water and Saline, Ann. Biomed. Eng., 33, 214–222, https://doi.org/10.1007/s10439-005-8980-9, 2005.
Zafiriou, O. C. and McFarland, M.: Nitric oxide from nitrite photolysis in the central equatorial Pacific, J. Geophys. Res., 86, 3173, https://doi.org/10.1029/jc086ic04p03173, 1981.
Zafiriou, O. C., McFarland, M., and Bromund, R. H.: Nitric Oxide in Seawater, Science, 207, 637–639, https://doi.org/10.1126/science.207.4431.637, 1980.
Zhang, Z.-B., Liu, C.-Y., Wu, Z.-Z., Xing, L., and Li, P.-F.: Detection of nitric oxide in culture media and studies on nitric oxide formation by marine microalgae, Medical Sci. Monit. Int. Medical J. Exp. Clin. Res., 12, BR75–BR85, 2006.