the Creative Commons Attribution 4.0 License.
the Creative Commons Attribution 4.0 License.
 | 20 Aug 2024
Estimates of carbon sequestration potential in an expanding Arctic fjord (Hornsund, Svalbard) affected by dark plumes of glacial meltwater
Marlena Szeligowska
Déborah Benkort
Anna Przyborska
Mateusz Moskalik
Bernabé Moreno
Emilia Trudnowska
Katarzyna Błachowiak-Samołyk
In polar regions, glaciers are retreating onto land, gradually widening ice-free coastal waters, which are known to act as new sinks of atmospheric carbon. However, the increasing delivery of inorganic suspended particulate matter (iSPM) with meltwater might significantly impact their capacity to contribute to carbon sequestration. Here, we present an analysis of satellite, meteorological, and SPM data as well as results of a coupled physical–biogeochemical model (1D GOTM-ECOSMO-E2E-Polar) with a newly implemented iSPM group to show the impact of iSPM on the ecosystem dynamics in a warming polar fjord (Hornsund, European Arctic) with numerous shallow-grounded marine-terminating glaciers. Our results indicate that with a longer melt season (9 d per decade, 1979–2022), the loss of sea ice cover (44 d per decade, 1982–2021) and the formation of new marine habitats after the retreat of marine-terminating glaciers (around 100 km2 in 1976–2022, a 38 % increase in the total area), glacial meltwater has transported increasing loads of iSPM from land (3.7 g m−3 per decade, reconstructed for 1979–2022). The simulated light limitation induced by the iSPM input delayed and decreased the peaks in phytoplankton, zooplankton, and macrobenthos. The newly ice-free areas still markedly contributed to plankton primary and secondary production and carbon burial in sediments (5.1, 2.0, and 0.9 Gg C yr−1, respectively, on average for 2005–2009 in the iSPM scenario). However, these values would have been 5.0, 2.1, and 0.1 Gg C yr−1 higher, respectively, without the iSPM input. Since carbon burial was the least affected by iSPM (a decrease of around 16 %, in comparison to 50 % for plankton primary and secondary production), the impact of marine ice loss and enhanced land–ocean connectivity should be investigated further in the context of carbon fluxes in expanding polar fjords.
- Article
(7292 KB) - Full-text XML
-
Supplement
(1209 KB) - BibTeX
- EndNote


Organic carbon burial in marine sediments represents the dominant natural pathway toward long-term sequestration and hence plays a key role in controlling atmospheric O2 and CO2 concentrations (Berner, 1982; Hedges and Keil, 1995). While important carbon sinks at coastal wetlands (mangrove forests, salt marshes, and seagrass beds) are declining globally (Duarte et al., 2005; Howard et al., 2014), new marine habitats are opening up in the Arctic and West Antarctic due to retreating glaciers and giant iceberg calving (Ficetola et al., 2021). Within these coastal ecosystems, CO2 drawdown by phytoplankton and ice algae is supported by nutrient input from land, intensifying the cascade from carbon capture into storage and burial in sediments (Ardyna and Arrigo, 2020; Arrigo et al., 2008; Wadham et al., 2019). Due to the high sedimentation rates, emerging and expanding fjords play an important role as efficient carbon burial hot spots (Bianchi et al., 2020; Cui et al., 2022; Smith et al., 2015). Thus, the loss of marine ice in polar coastal waters might to some extent compensate for decreasing coastal carbon sinks elsewhere (Barnes, 2017; Peck et al., 2010; Zwerschke et al., 2022).
Despite recent increases in primary and secondary production due to, among other factors, the earlier break-up of seasonal sea ice, the polar regions' potential for long-term carbon burial in sediments is ultimately limited by multifarious mechanisms. Changes in the duration and composition of ice algae blooms weaken the sympagic–benthic coupling, consequently leaving more biomass that can be utilized and dispersed in the pelagic system (Fadeev et al., 2021; Lalande et al., 2019; Riser et al., 2008). Thus, warming induces the maturation of polar fjords, i.e. the transition to a more complex but effective pelagic food web consuming most of the available organic matter, and less carbon is deposited at the bottom (Węsławski et al., 2017; Zaborska et al., 2018). Furthermore, the delivery of inorganic suspended particulate matter (iSPM) with glacial meltwater dims the underwater light later in the productive season (summer and autumn) (Szeligowska et al., 2022) and results in a significant reduction in phytoplankton and phytobenthic biomass (Blain et al., 2021; Deregibus et al., 2016; Holt et al., 2016) that influences the carbon burial potential in glacial bays.
Further warming will likely exacerbate sediment inputs through increasing precipitation, storm activity (enhancing erosion), glacial melt, permafrost thaw, and sea-level rise (Syvitski et al., 2005, 2022). Moreover, in situ observations and numerical simulations from Arctic fjords suggest that after marine-terminating glaciers retreat onto land, subglacial discharge and nutrient upwelling cease, enhancing surface stratification, weakening vertical mixing, and thereby reducing the productivity in coastal zones (Hopwood et al., 2018; Meire et al., 2017). However, our understanding of the rapid transformations of polar marine ecosystems under climatic stressors remains insufficient due to, among other reasons, the scarcity of long-term standardized monitoring data (Schofield et al., 2010). While numerical models have been essential for filling knowledge gaps related to the mechanisms of nutrient supply with meltwater (Castelao et al., 2019; Oliver et al., 2020) and substantial effort has been put into incorporating modules representing biogeochemistry in sea ice (Steiner et al., 2016), only a few of them resolve inorganic particulate matter dynamics in glacier-fed basins (Neder et al., 2022). So far, these models do not typically represent the impact of the delivery of terrigenous material on biological production and carbon budgets.
This study aimed to assess the gains and losses in plankton primary and secondary production and carbon burial due to the transformations of European Arctic coastal waters. We investigated Hornsund (Svalbard, West Spitsbergen) as a model high-latitude fjord since it is among the best-studied fjords in the Arctic and represents an area of rapid regional warming, with many bays affected by the recession of glaciers. Thus, here we (1) map the extent of emerging habitat after the retreat of marine-terminating glaciers and (2) simulate how the ecosystem dynamics and carbon sequestration are affected by sediment discharge in these bays using a 1D coupled physical–biogeochemical model (GOTM-ECOSMO-E2E-Polar) with a newly implemented iSPM group. We present the results of our simulations for 2005–2009, i.e. a period with an exceptionally strong warming signal (Muckenhuber et al., 2016; Promińska et al., 2017), in the context of multidecadal (1976–2022) changes in the physical environment to discuss the potential of newly ice-free areas to act as emerging carbon sinks and their role in the global carbon cycle.
2.1 Study area
Hornsund is a glaciomarine fjord in Svalbard, with inner basins affected by glacial outflow (Fig. 1) (Błaszczyk et al., 2019). Since the strong polar front formed by the West Spitsbergen Current (saline and warm Atlantic Water) and the Sørkapp Current (cold and relatively fresh Arctic Water) reduces the advection of Atlantic Water into Hornsund in comparison to other West Spitsbergen fjords (Promińska et al., 2017), it is considered a less mature, highly productive cold-water fjord with an Arctic-type resident biota and relatively high sequestration of organic carbon (Węsławski et al., 2017; Zaborska et al., 2018). Characterized by dynamic paraglacial coastal systems with high sediment mobility, Brepollen is the most extensive bay in Hornsund, where > 85 km of new shoreline was formed in the last century after an ice retreat (Strzelecki et al., 2020). The area is known for exhibiting one of the fastest retreat rates of marine-terminating glaciers in the Svalbard archipelago; it has accelerated this century, reaching around 3 km2 yr−1 in 2001–2010 (Błaszczyk et al., 2013). Importantly, the ice bridge between Brepollen and Hambergbukta (Fig. 1b; currently < 5 km wide) is predicted to break up in the coming decades (Grabiec et al., 2018; Osika et al., 2022), thus reopening a direct connection to the Barents Sea and changing the hydrodynamic conditions for biological production and carbon burial by either stronger sea ice or Atlantic Water advection.
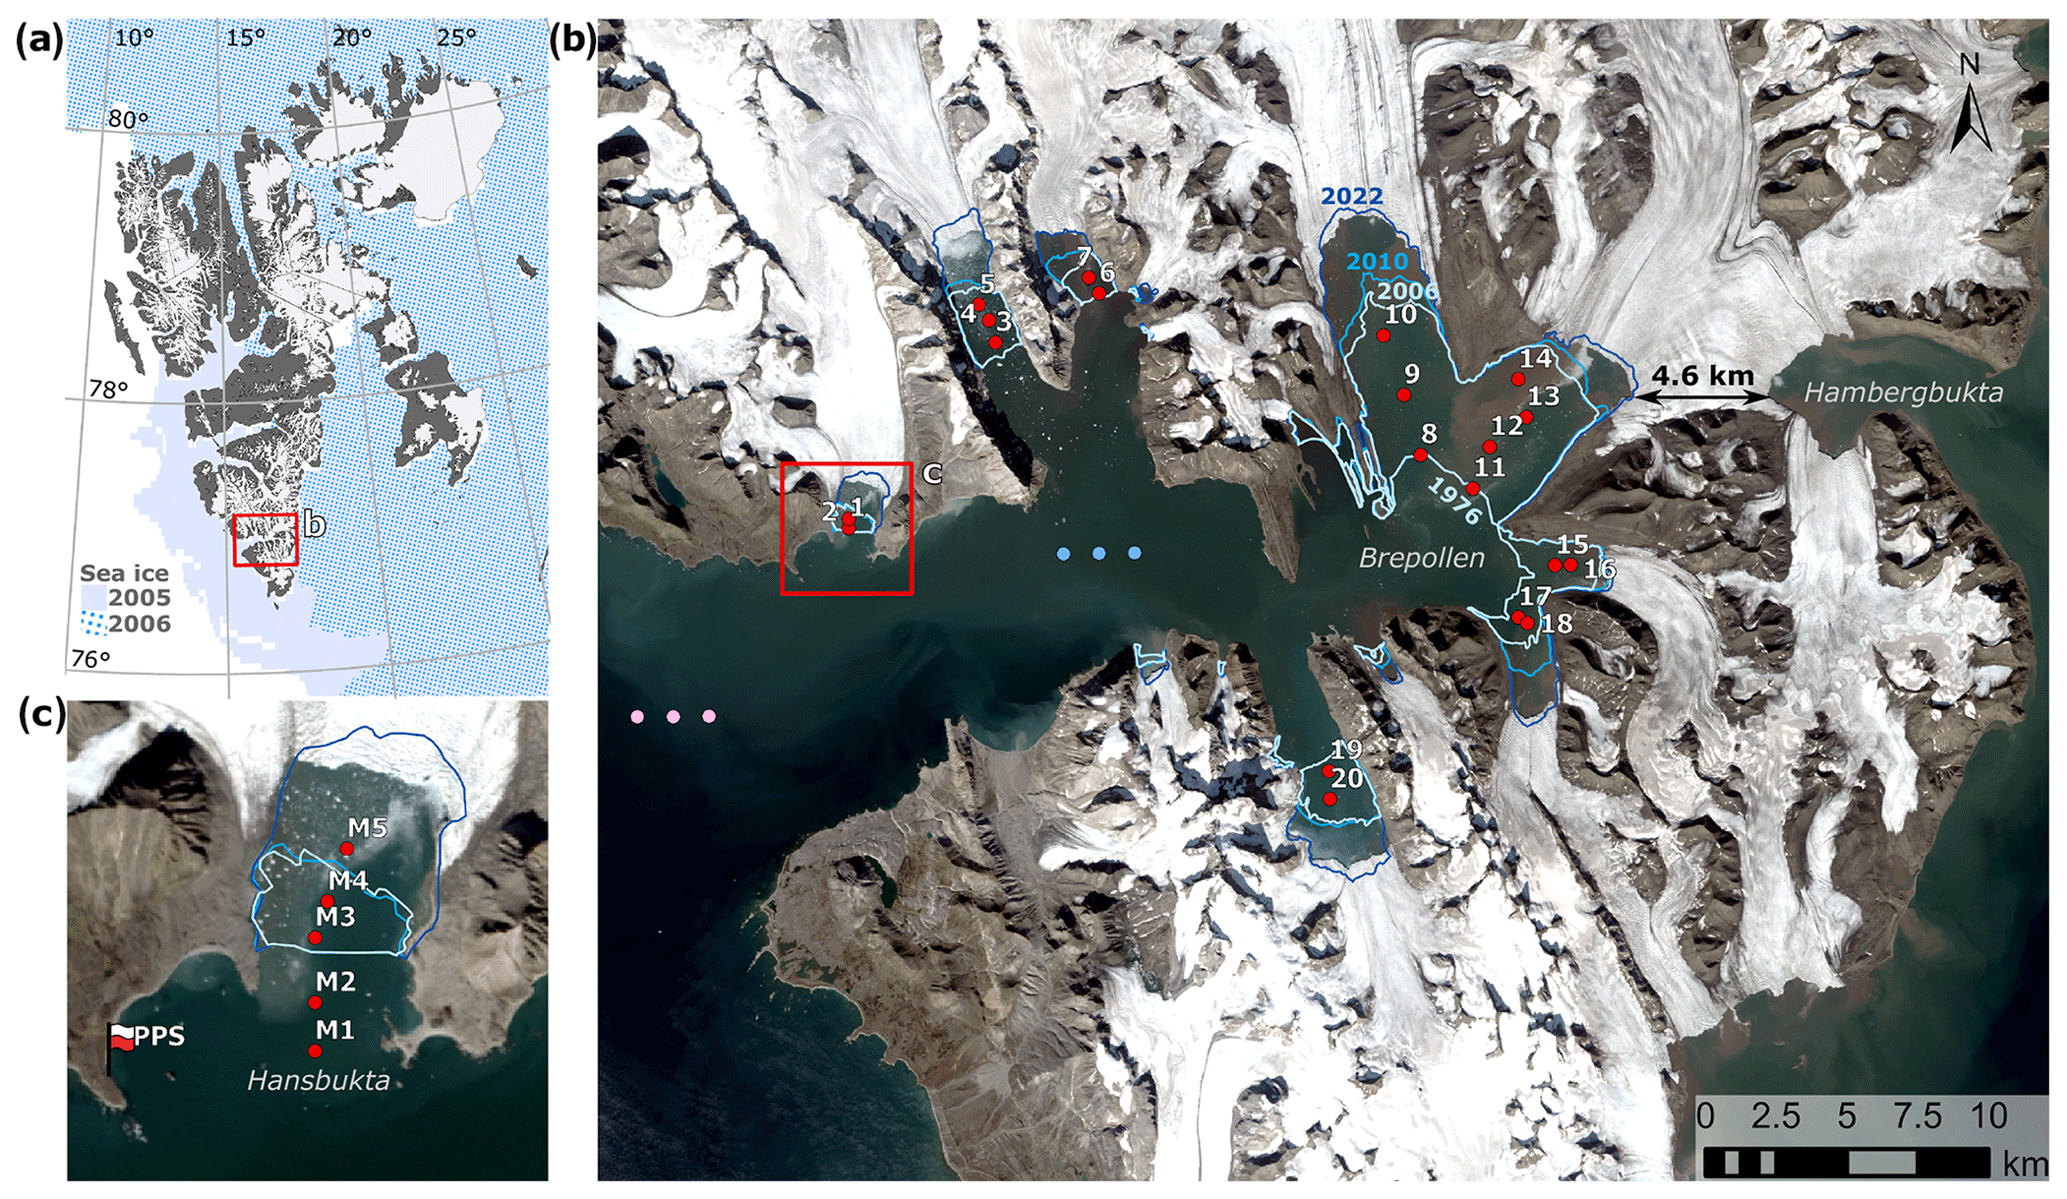
Figure 1(a) The Svalbard archipelago, showing the monthly mean sea ice concentration > 15 % in March 2005 (plain colour) and 2006 (dotted). Land and glacier extents were downloaded from https://geodata.npolar.no/, last access: 10 September 2023. The red frame indicates the location of Hornsund. (b) Newly ice-free areas in Hornsund which have opened since 1976 (blue lines – the positions of the glacier front in 1976, 2006, 2010, and 2022) and the width of the ice bridge between Brepollen and Hambergbukta. The dots indicate modelled stations (1–20, red) and three data points each for the sea and ice surface temperature (SST, pink) and sea ice concentration (SIC; blue). The red frame indicates the location of Hansbukta. (c) Long-term SPM and sediment flux monitoring stations in Hansbukta (M1–M5, red dots) and Polish Polar Station Hornsund (PPS). The Landsat 8 satellite image (4 April 2020) was downloaded from https://glovis.usgs.gov/app, last access: 27 January 2023.
2.2 Datasets
2.2.1 The area and volume of newly ice-free marine habitats
Summertime Landsat images of Hornsund were downloaded from https://glovis.usgs.gov/app, last access: 3 October 2022 (Table S1 in the Supplement). Only cloud-free images with no sea ice cover (from July to early September) were used. When present, the 4–3–2 and 3–2–1 spectral bands (Landsat 8 and Landsat 1–7, respectively) were used to prepare RGB composites, and a panchromatic band (8) was used to enhance the resolution. Newly ice-free areas were manually delineated, with the position of the glacier front in 1976 used as a reference since this was the first year for which Landsat images taken during the summer were available (Fig. 1b). The same person (MS) repeated the procedure three times for each year to test the repeatability of manual digitization. The standard deviation was up to 0.23 km2. Importantly, the fronts of marine-terminating glaciers undergo seasonal fluctuations, which might increase the uncertainty (Błaszczyk et al., 2021, 2023). However, here we narrowed the analysis to the main melt season (from July to early September). Marine habitat volume was calculated based on digitized area and bathymetry data from Hornsund (grid size 100 m) (Moskalik et al., 2014) using the zonal statistics method in ArcGIS Pro 2.8.0. Marine habitat volume was calculated until 2010, since the bathymetric data were not available for the glacial bays that emerged after 2010.
2.2.2 Sea and ice surface temperature and sea ice concentration
Sea and ice surface temperature (SST) and sea ice concentration (SIC) were extracted from the Arctic Sea and Ice Surface Temperature dataset (L4, 5 km, daily). These data were provided by the Danish Meteorological Institute and the MyOcean regional data assembly centre and were created using multisensor satellite surface temperature observations. Since the dataset did not cover all the fjord, data were extracted from points in the outer/central parts (Fig. 1, Table S2), assuming that they reflect the SST/SIC conditions in the inner fjord. This assumption is supported by previous studies (Arntsen et al., 2019; Błaszczyk et al., 2021; Sutherland et al., 2013) and the fact that this analysis focuses on relative changes in melt season intensity rather than absolute values. The data were extracted for three adjacent cells (Table S2) and averaged. Sea-ice-free (SIF) days was defined as the fraction of the year with SIC < 15 %. The monthly mean extents of SIC > 15 % in March 2005 and 2006 are shown in Fig. 1a. The sum of all daily SST values > 0 °C (the positive degree day, PDD SST) was calculated for each year (annual) and each melt season (summertime, June–August) as a proxy for submarine melt potential (Hock, 2005; Rignot et al., 2008).
2.2.3 Air temperature and precipitation
Air temperature and precipitation datasets from Polish Polar Station Hornsund (PPS, Fig. 1c) were downloaded from Wawrzyniak and Osuch (2020) (1979–2018, https://doi.org/10.1594/PANGAEA.909042) and from SIOS – Svalbard Integrated Arctic Earth Observing System (Wawrzyniak and Osuch, 2020, 2018–2022). The daily average air temperature (AT) was used to calculate the sum of all daily AT values > 0 °C (PDD AT) for each year (annual) and each melt season (summertime, June–August) as a proxy for surface melt potential (Hock, 2005; Rignot et al., 2008). Annual and summertime (June–August) precipitation were calculated by summing the daily precipitation measurements (mm). The start of the melt season was defined as the start of the first period of 6 consecutive days with AT > 0 °C; similarly, the end of the melt season was defined as the first of 6 consecutive days with AT < 0 °C (modified from Błaszczyk et al., 2021). This takes into account the delays in meltwater and particulate matter delivery to the fjord, and the 6 d window was shown to be well correlated with sediment flux (in this study and D'Angelo et al., 2018). Melt season duration was calculated as the number of days between the end and the start of the melt season and provided as a fraction of the year.
2.2.4 Suspended particulate matter, sediment flux, and salinity
Datasets for suspended particulate matter (SPM), sediment flux, and salinity collected in Hansbukta (2015–2021) at long-term monitoring stations (Fig. 1c, Table S2) were downloaded from https://dataportal.igf.edu.pl/group/longhorn, last access: 4 November 2022 (see the detailed description in Moskalik et al., 2018). In this study, sediment flux data from sediment traps deployed for 1 day at 5, 10, 15, and 20 m depths were considered for analysis. Inorganic and organic SPM concentrations (g m−3) and the sediment flux (g m−2 d−1) were calculated based on the total SPM or sediment flux and the loss on ignition (Moskalik et al., 2018). The integrated iSPM concentration in the water column was averaged for the main melt season (June–August 2016–2021). The annual variability in the SPM levels was visualized using a kernel density estimate (KDE) plot prepared based on SPM data (2015–2021) from discrete depths. The sinking rate of SPM (m d−1) was calculated by dividing the sediment flux by the SPM concentration sampled at the corresponding depth layers (Mugford and Dowdeswell, 2011). Sediment flux and salinity datasets were used for model parametrization (see Sect. 2.3.1), whereas the SPM dataset was used for model assessment (see Sect. 2.4).
2.3 Numerical model
2.3.1 General setting
To study the dynamics of the West Spitsbergen coastal waters affected by the iSPM input, numerical experiments were designed using the polar version of the biogeochemical ECOSystem Model (ECOSMO-E2E-Polar) coupled with the General Ocean Turbulence Model (GOTM) (Burchard et al., 1999). ECOSMO-E2E-Polar represents the three main nutrient cycles (nitrogen, phosphorus, and silica) in the pelagic and sympagic systems, three functional groups of primary producers (ice algae, diatoms, and flagellates), two zooplankton groups (micro- and meso-), one macrobenthos group, and chlorophyll a as a prognostic variable, allowing a flexible chlorophyll-to-carbon ratio. The development of ECOSMO has been fully described by Benkort et al. (2020), Daewel et al. (2019), Daewel and Schrum (2013), and Yumruktepe et al. (2022). We extended the biogeochemical model to include iSPM in the model formulation (Fig. 2). The model was built with the Fortran-based Framework for Aquatic Biogeochemical Models (FABM) (Bruggeman and Bolding, 2014) to facilitate coupling with the physical model. In this first application, a 1D numerical framework was used, and physical processes in the water column were calculated by GOTM. Simulation resolved the profiles of the velocity, temperature, salinity, turbulent mixing, and transport of ecosystem state variables in 20 vertical layers with surface zooming of 1.5 and bottom zooming of 0.1. This approach neglects horizontal transport and considers vertical exchange processes only. This allows feasible parameterization, verification, and sensitivity tests to study processes with low computational effort, but it hinders the model's skill in representing advection and upwelling. However, Atlantic Water advection is considered to be limited in Hornsund in comparison to other West Spitsbergen fjords, in particular in the inner bays, whereas upwelling is most important up to a distance of 500 m from the glacier front (Pasculli et al., 2020).
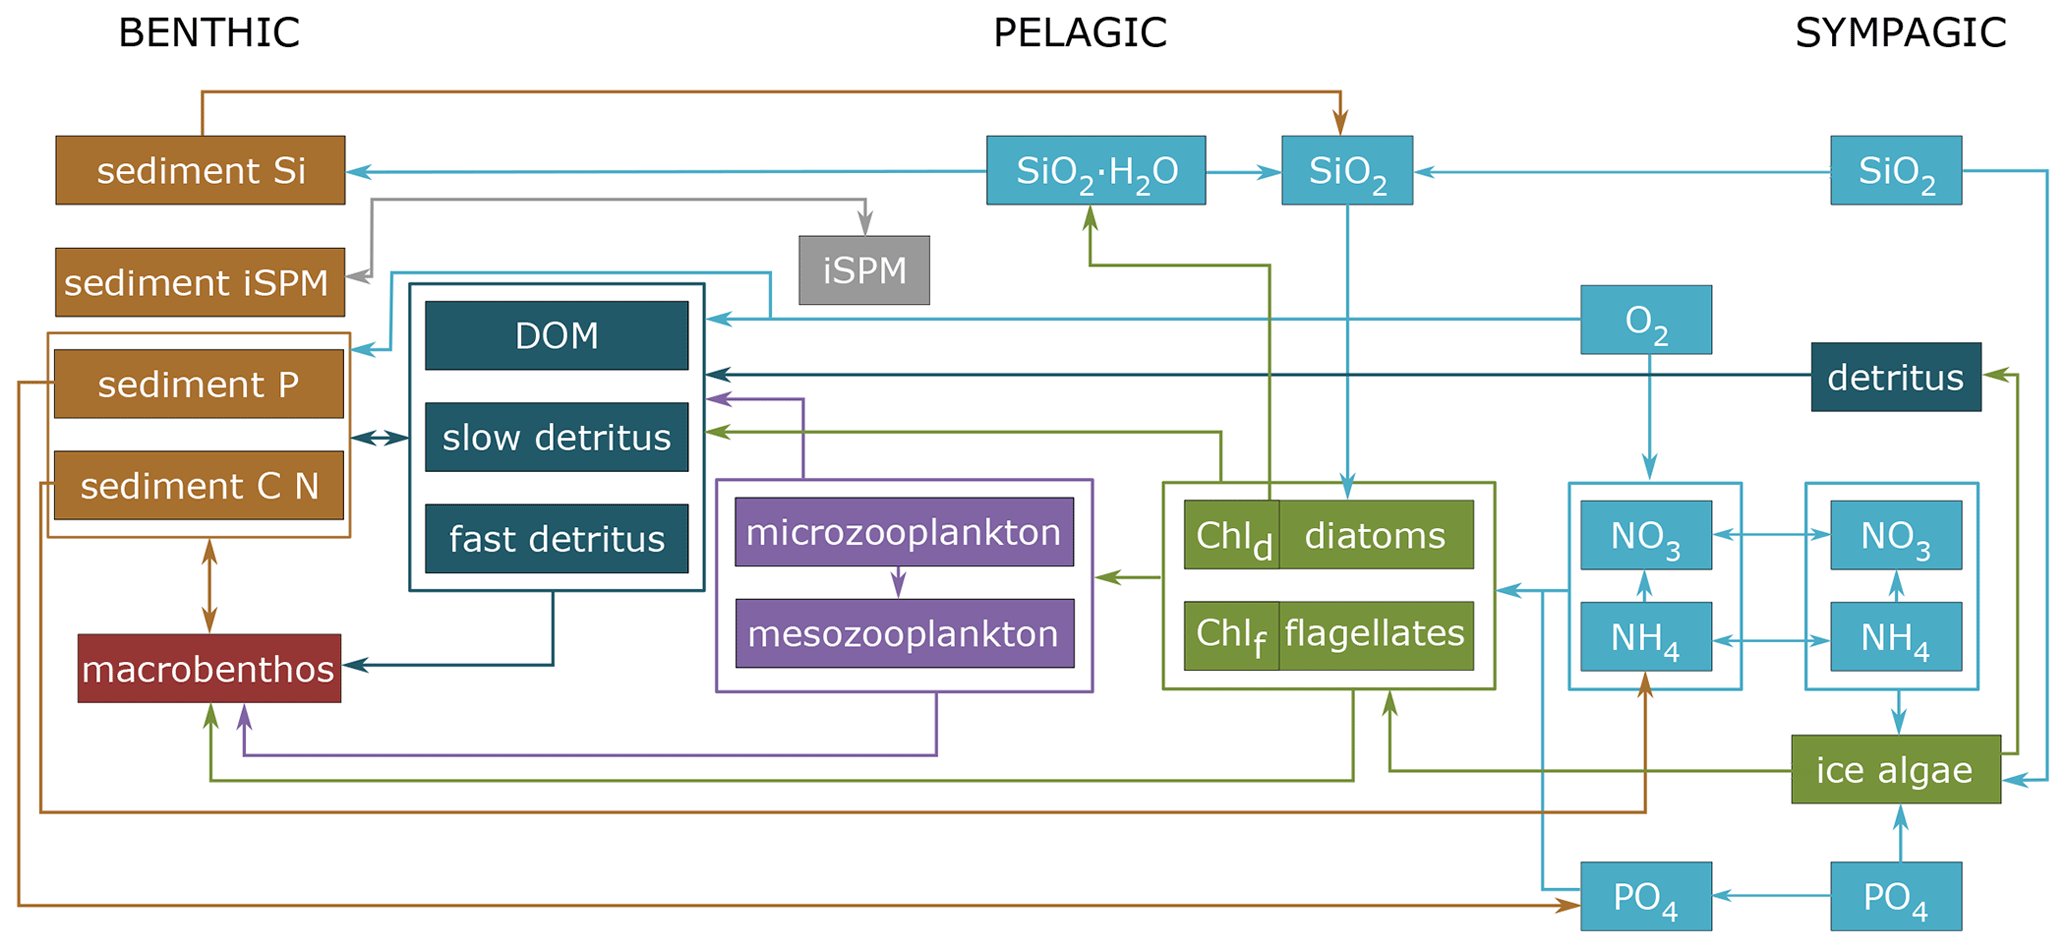
Figure 2Schematic diagram of the biogeochemical model ECOSMO-E2E-Polar with the new iSPM group. The three systems (benthic, pelagic, and sympagic) are included. Chld and Chlf stand for phytoplankton-type-specific chlorophyll a content for diatoms and flagellates, respectively.
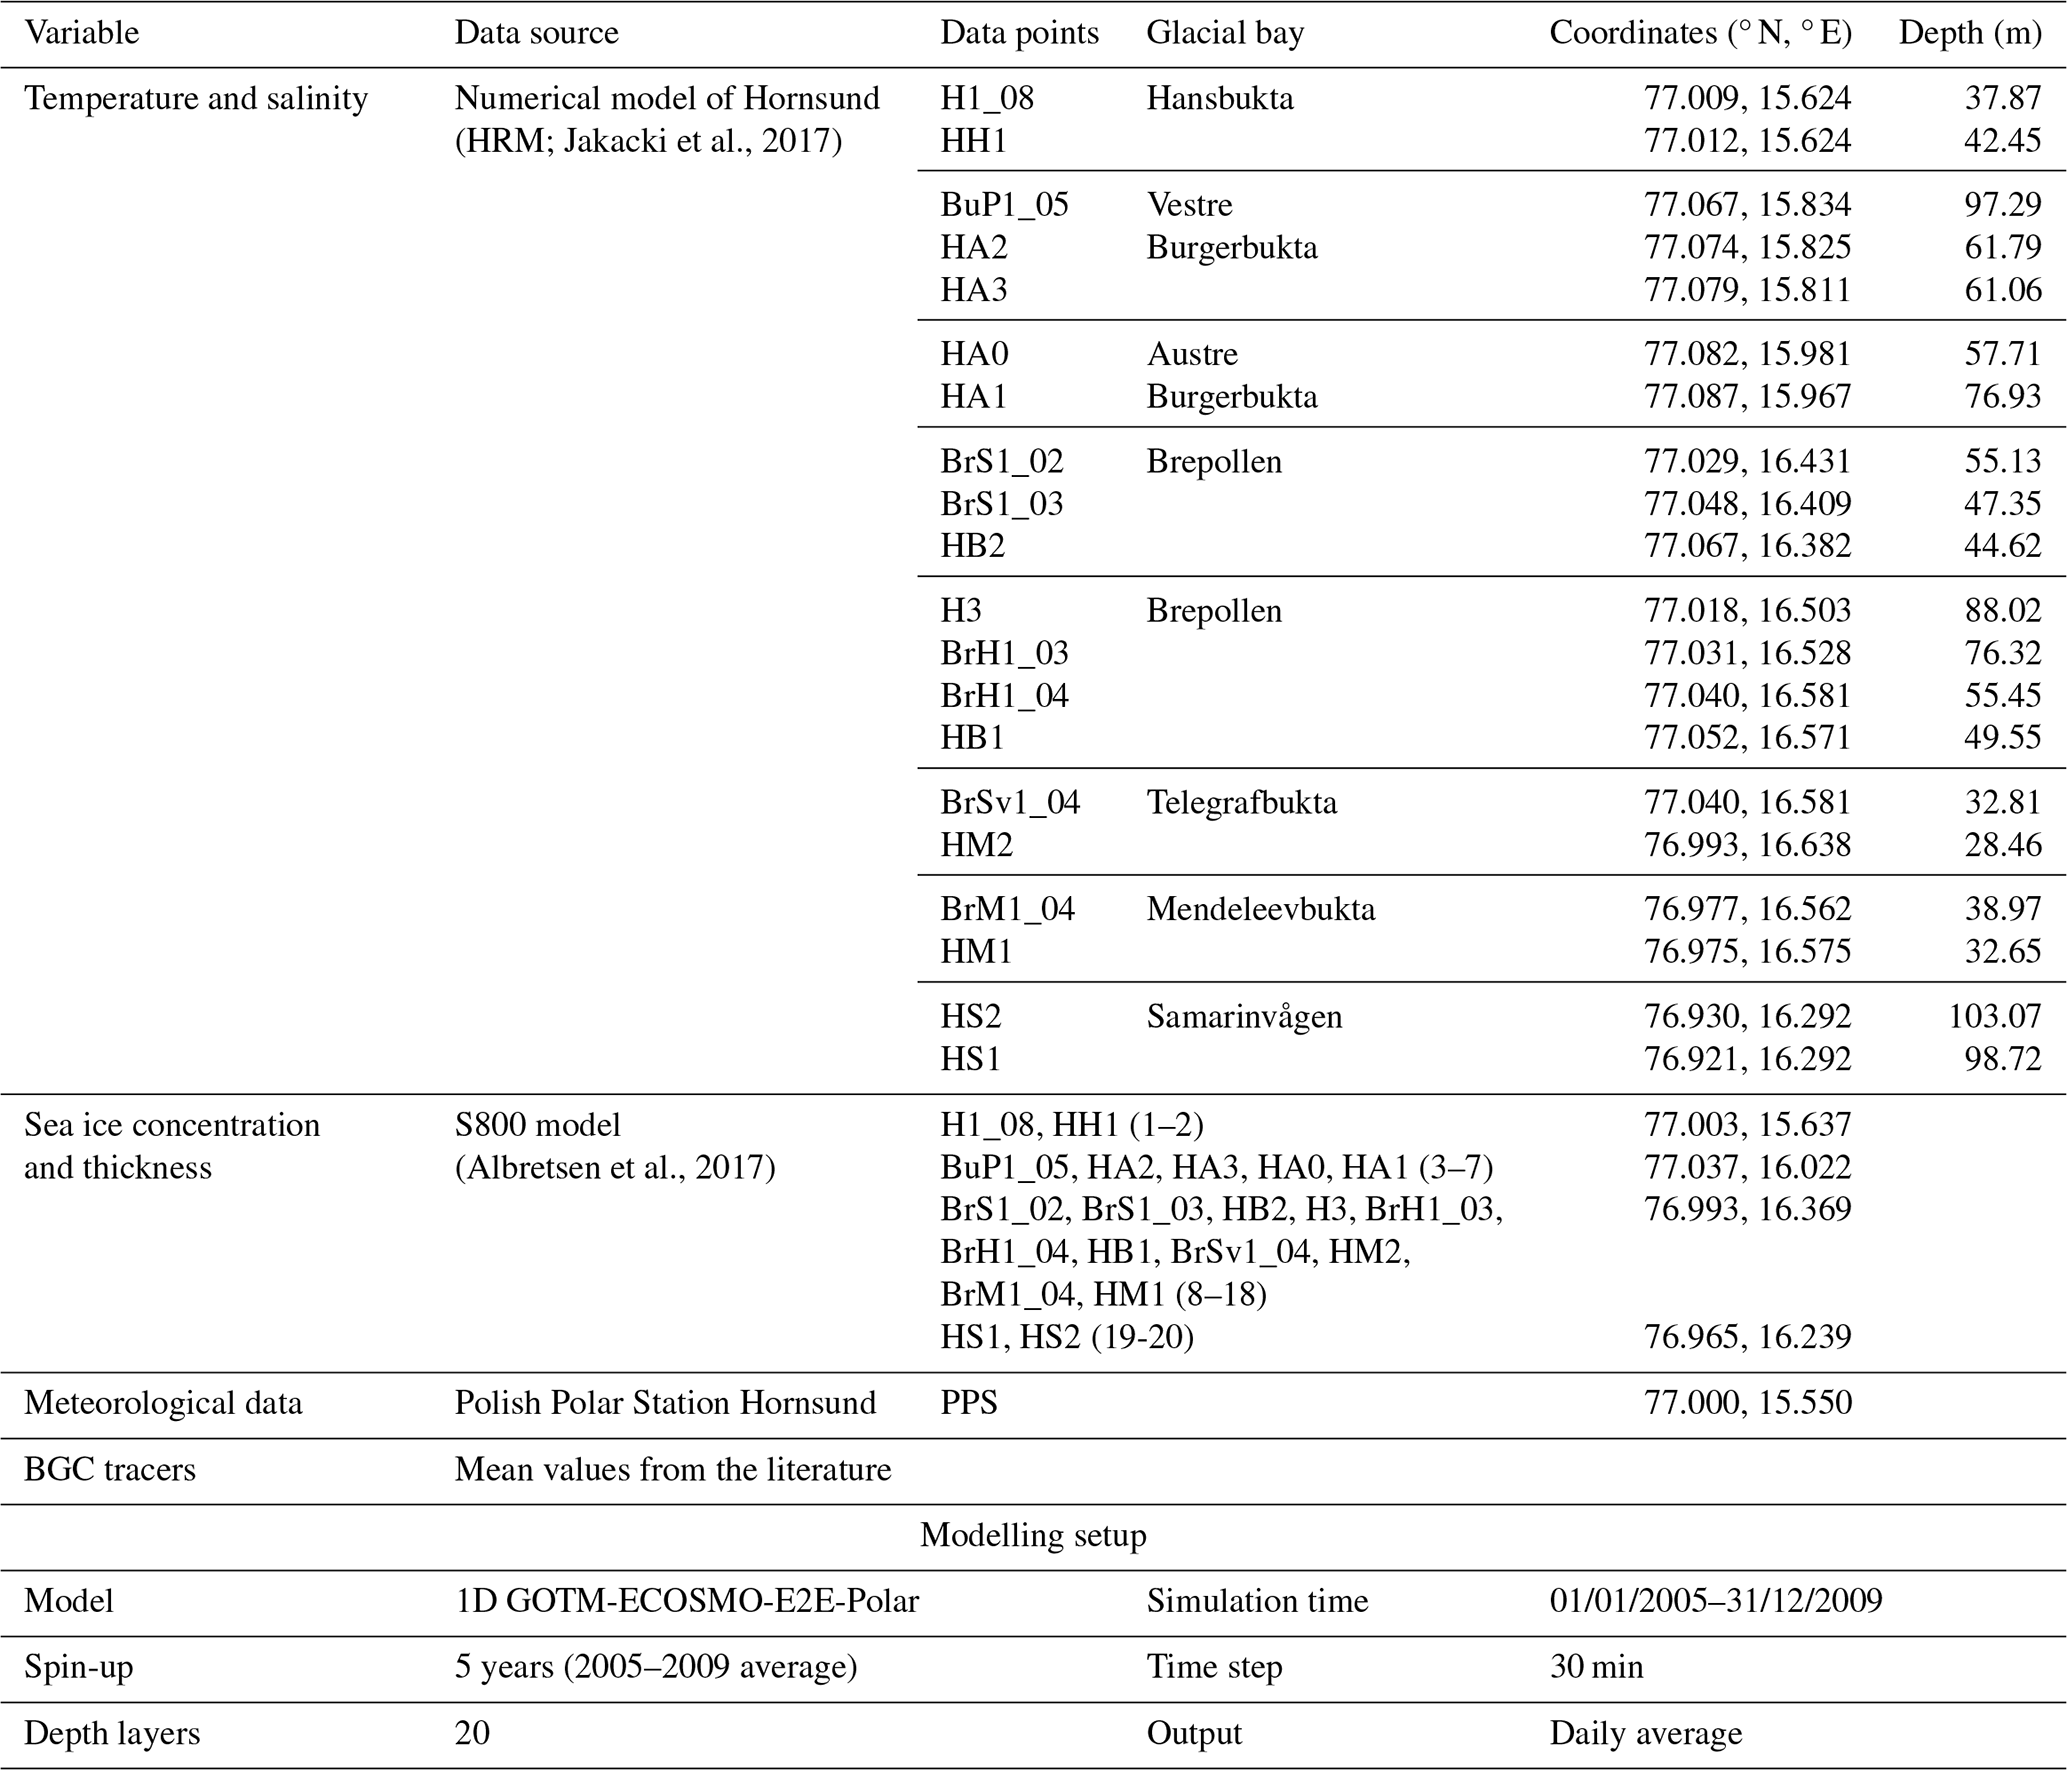
The model was implemented at 20 stations located within the newly ice-free areas in Hornsund (Fig. 1b, Table 1). The simulations were run from the beginning of 2005 to the end of 2009. Input data from 2005–2009 were averaged, repeated five times, and used as a spin-up to allow the model to reach equilibrium under the applied forcing. Temperature and salinity vertical forcing were used from the 3D hydrodynamic numerical model of Hornsund (HRM; Jakacki et al., 2017), which represents nine sources of freshwater input from the Hornsund drainage basin, including all components (ablation, precipitation, snow, and rivers). Sea ice thickness and concentration were extracted from the S800 model simulation at the closest grid cells (Albretsen et al., 2017); these are the same data as used for the HRM model. The sea ice input was smoothed using a 30 d rolling average, as the 1D setup does not represent advection and high variability of the thickness and concentration affects the performance of the ice algae module. The atmospheric conditions were prescribed from meteorological monitoring at Polish Polar Station Hornsund: i.e. the air temperature (2 m above the surface), eastward (u) and northward (v) wind speeds, cloudiness, relative humidity, and pressure. The model was run with a 30 min time step, and the daily average was saved as an output. Two sets of scenarios were performed to evaluate the gains in carbon sequestration potential due to the retreat of marine-terminating glaciers and to evaluate the losses due to the iSPM discharge by evaluating plankton primary and secondary production and carbon burial. The SPM scenario included the iSPM input prescribed to the model according to Eq. (1), and the noSPM scenario was a control run without iSPM input.
2.3.2 ECOSMO developments
Two state variables were added to the ECOSMO-E2E-Polar model framework to account for the iSPM and the iSPM sediment pool (sediSPM) (Fig. 2). The input of iSPM prescribed to the model was calculated based on the inorganic sediment flux (iSF) and its relationship with air temperature and salinity (Fig. S1 in the Supplement), as developed from field data, which takes the form of Eq. (1):
where 6accPDD AT is the accumulated daily air temperature for positive degree days for a 6 d window (°C), refS is a reference salinity for Atlantic Water (34.9) (Moskalik et al., 2018), and meanS is the mean salinity above the sediment trap. The ordinary least squares (OLS) function (in the statsmodels library in Python) was used to generate a linear model for iSF estimates. The root-mean-square deviation (RMSD) was used to measure the differences between the observed iSF and linear model. The iSF calculated for each depth layer was prescribed to the model as a daily input (CiSPMinpput) in mg m−3. While some runoff data are available for Hornsund (Van Pelt et al., 2019; Błaszczyk et al., 2019), it was not feasible to parametrize the iSPM input based on the meltwater discharge here due to the structure of the hydrodynamic model (1D in contrast to 3D) and the lack of data on sediment loads in glacial plumes. However, in this study, salinity depended on the discharge provided in the 3D hydrodynamic model that was a source of input data (HRM; Jakacki et al., 2017). Therefore, we used the salinity as a proxy for the inorganic sediment.
The state variables in ECOSMO (all the state variables are listed in Table S3) are solved using prognostic equations in the form of Eq. (2):
with , where x represents either time (t) or depth (z). This equation includes vertical turbulent subscale diffusion, sinking rates, and chemical and biological interactions. The vertical turbulent sub-scale diffusion coefficient (Av) is estimated by the hydrodynamic core of ECOSMO. The sinking rate (wd) is a constant that is only non-zero for detritus, opal, and iSPM. The sinking rate (wd) that allowed the dynamics of iSPM to be properly represented in the model was 0.8 m d−1, which is in the lower range of the sinking rates observed in the field (all parameters are listed in Table 2). Chemical and biological interactions are employed in the interaction term RC, which is different for each variable (C), based on relevant processes.
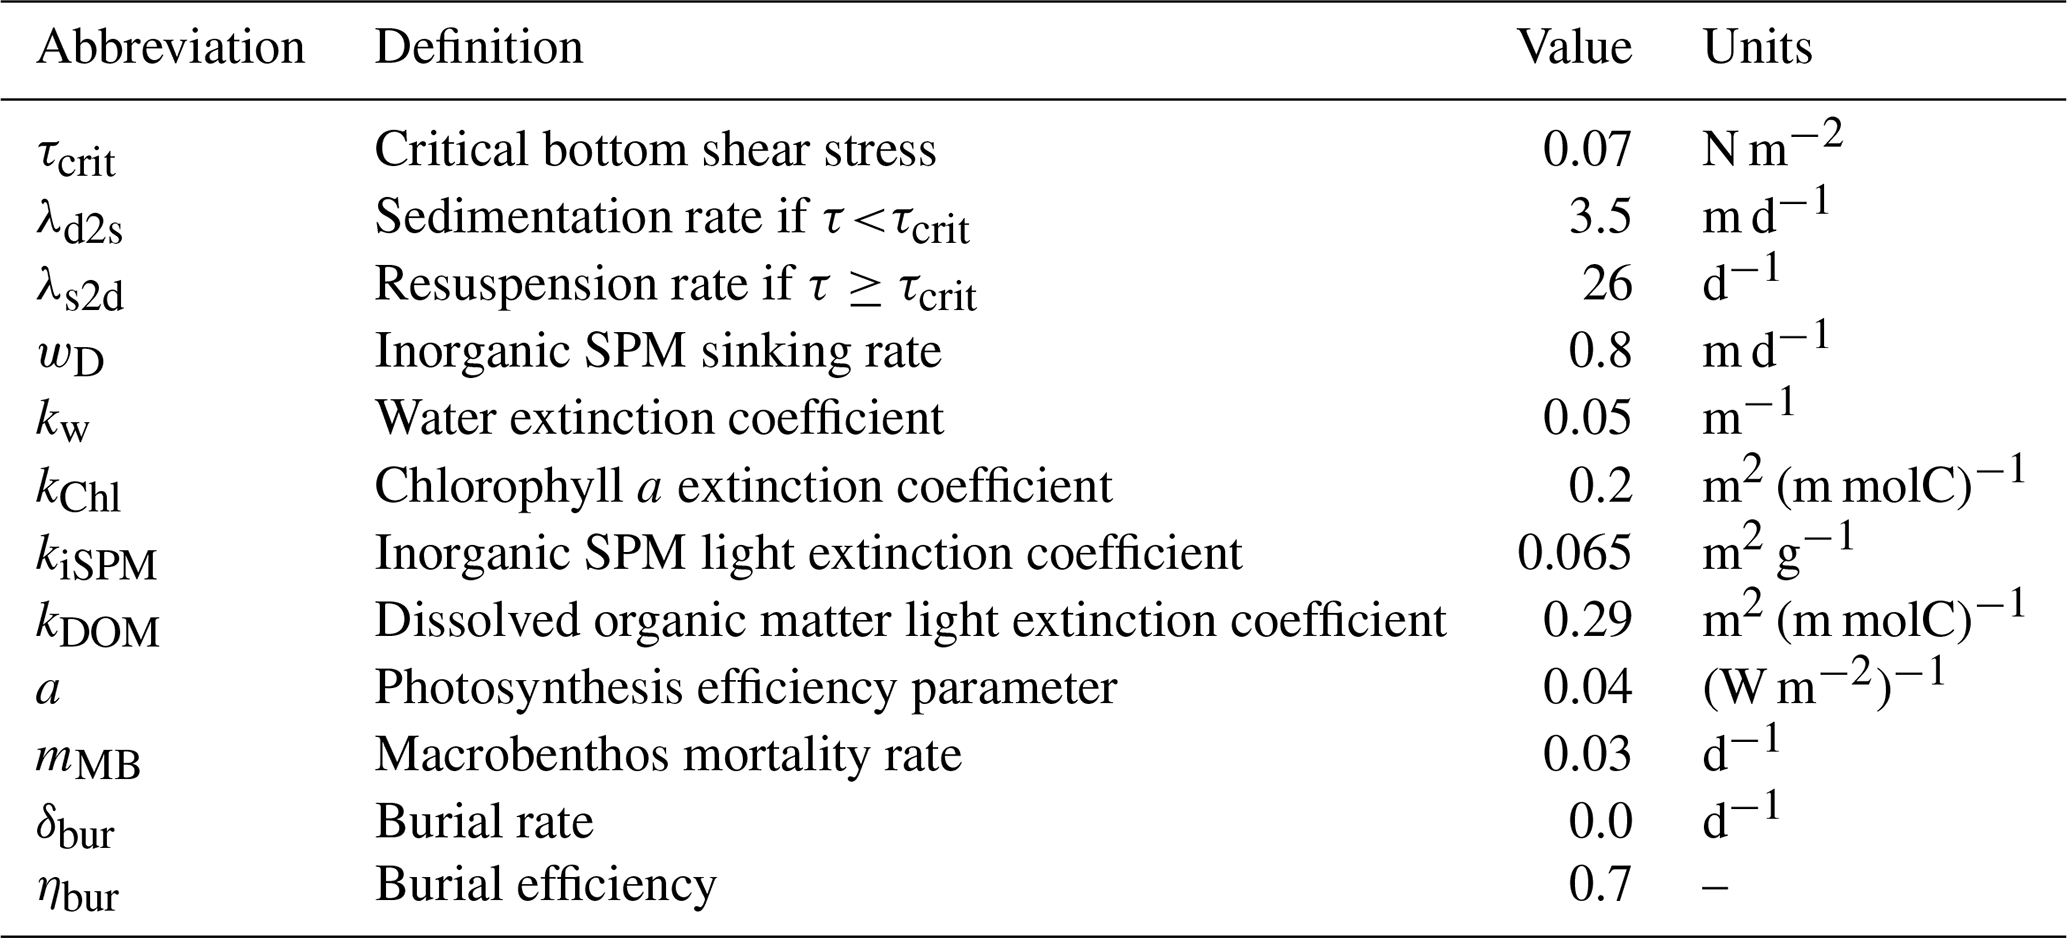
Table 2List of parameters, corresponding description, and units used in the model.
The rate of change in the iSPM concentration (Ct term) is calculated via Eq. (3):
The interaction term RC is calculated via Eq. (4):
iSPM enters a new sediment pool with a sedimentation rate (λd2s) of 3.5 m d−1 if the bottom stress is <τcrit or is resuspended with a resuspension rate (λs2d) of 26 d−1 if the bottom stress is >τcrit. The critical bottom shear stress (τcrit) was set to 0.07 N m−2, which is in the range reported by Wölfl et al. (2014).
As sediSPM exchanges occur locally at the bottom and the group is not exposed to mechanical displacement, Eq. (2) can be simplified to Eq. (5):
The interaction term RC is calculated via Eq. (6):
As the iSPM has an impact on light penetration, the photosynthetically active radiation in the water column had to be updated and is calculated via Eq. (7):
where Is(xy) is the short-wave radiation (W m−2) at the surface, x and y identify the horizontal grid points, z is the water depth in meters, and kx are extinction coefficients (Table 2).
In Hornsund, most of the variability in the optical properties in the summers of 2009 and 2010 was attributed to particles of mineral origin (Sagan and Darecki, 2018), and thus the input of organic particles with meltwater was considered negligible here. The attenuation coefficient for iSPM measured in another polar fjord in Greenland (0.13 m2 g−1) (Lund-Hansen et al., 2010) was high compared to other published values: 0.07 m2 g−1 (Christian and Sheng, 2003), 0.06 m2 g−1 (Pfannkuche and Schmidt, 2003), and 0.065 m2 g−1 (Oliver et al., 2020). Thus, here, a light extinction coefficient (kiSPM) of 0.065 m2 g−1 was prescribed for the model; this gave reasonable results in terms of the light limitation and is in the range of field measurements.
The light limitation also depends on the plankton photosynthesis efficiency parameter (a). Here, it was increased to 0.04 (W m−2)−1, which is within the range reported for Arctic coastal and shelf waters (Van De Poll et al., 2018; Stuart et al., 2000; Strom et al., 2016; Platt et al., 1982) and is in line with previous studies showing that fjord plankton communities are adapted to low light (Simo-Matchim et al., 2016; Holding et al., 2019). The light limitation is calculated as in Eq. (8):
In this 1D setup, we do not simulate fish due to their migration, which reduces the uncertainty of the current simulations. Thus, the macrobenthos loss term only consists of excretion (εMBCMB) and natural mortality (mMBCMB), as shown in Eq. (9):
Similarly, the reaction terms for zooplankton, detritus, and dissolved organic matter (DOM) were changed accordingly to remove fish grazing (Daewel et al., 2019). Predation mortality from the fish functional group was accounted for by increasing macrobenthos natural mortality (mMB) to 0.03 d−1.
We do not provide the nutrient input with meltwater due to the lack of data for parametrization and to disentangle it from the effect of the iSPM discharge; thus, the burial rates in the carbon and nitrogen sediment pool (sedCN; Eq. 10) and in the silicate sediment pool (sedSi; Eq. 11) are set to 0 to prevent decreasing nutrient concentrations over the simulation time. For the full description of the equations, the reader is referred to Daewel and Schrum (2013). We speculate that the bias introduced by not providing the nutrient input is relatively low, considering the characteristics of the discharge (see Sect. 4.5).
The carbon burial potential (CB; Eq. 12) was calculated as a 70 % burial efficiency of the carbon and nitrogen sediment accumulation rate, as previously reported for Hornsund (Koziorowska et al., 2018):
2.3.3 Model assessment
Satellite data products of suspended particulate matter were not available for the glacial bays, and analysis of the long-term trends and model validation (2005–2009) were not possible here. Thus, we performed the model assessment based on the available field data from 2015–2021. The summertime mean iSPM concentration for past conditions was reconstructed based on measurements of the iSPM concentration and PDD AT, and it showed a high correlation with the simulated iSPM concentration parametrized based on the complementary dataset of sediment flux measurements (Fig. S2, R2 = 0.928, p = 0.009). The iSPM concentrations at modelled station 2 (HH1) in 2006 and 2009 were also compared with the iSPM field data at monitoring stations M4 (H1_09) and M5 (H1_11) from 2019 (Fig. S3), which represented the closest environmental conditions (PDD SST, PDD AT, melt season duration, and precipitation in Fig. 3) to those in simulation period. Results showed that the model realistically simulated the seasonal pattern and vertical distribution of the iSPM (rho > 0.74, p<0.001 for Spearman's correlation; see Table S4). Despite the fact that the iSPM input was parametrized for Hansbukta (which was the only bay with sufficient data and is the most studied bay in Hornsund), and the iSPM load and discharge can differ between glaciers, the spatial patterns from measurements of iSPM at the surface conducted in all of Hornsund in summer 2017 were in line with the simulation results (Fig. S4). The literature data (Table S5) on the concentrations of all the nutrients and functional groups showed that the model performed well when compared to the current knowledge of the West Spitsbergen fjords.
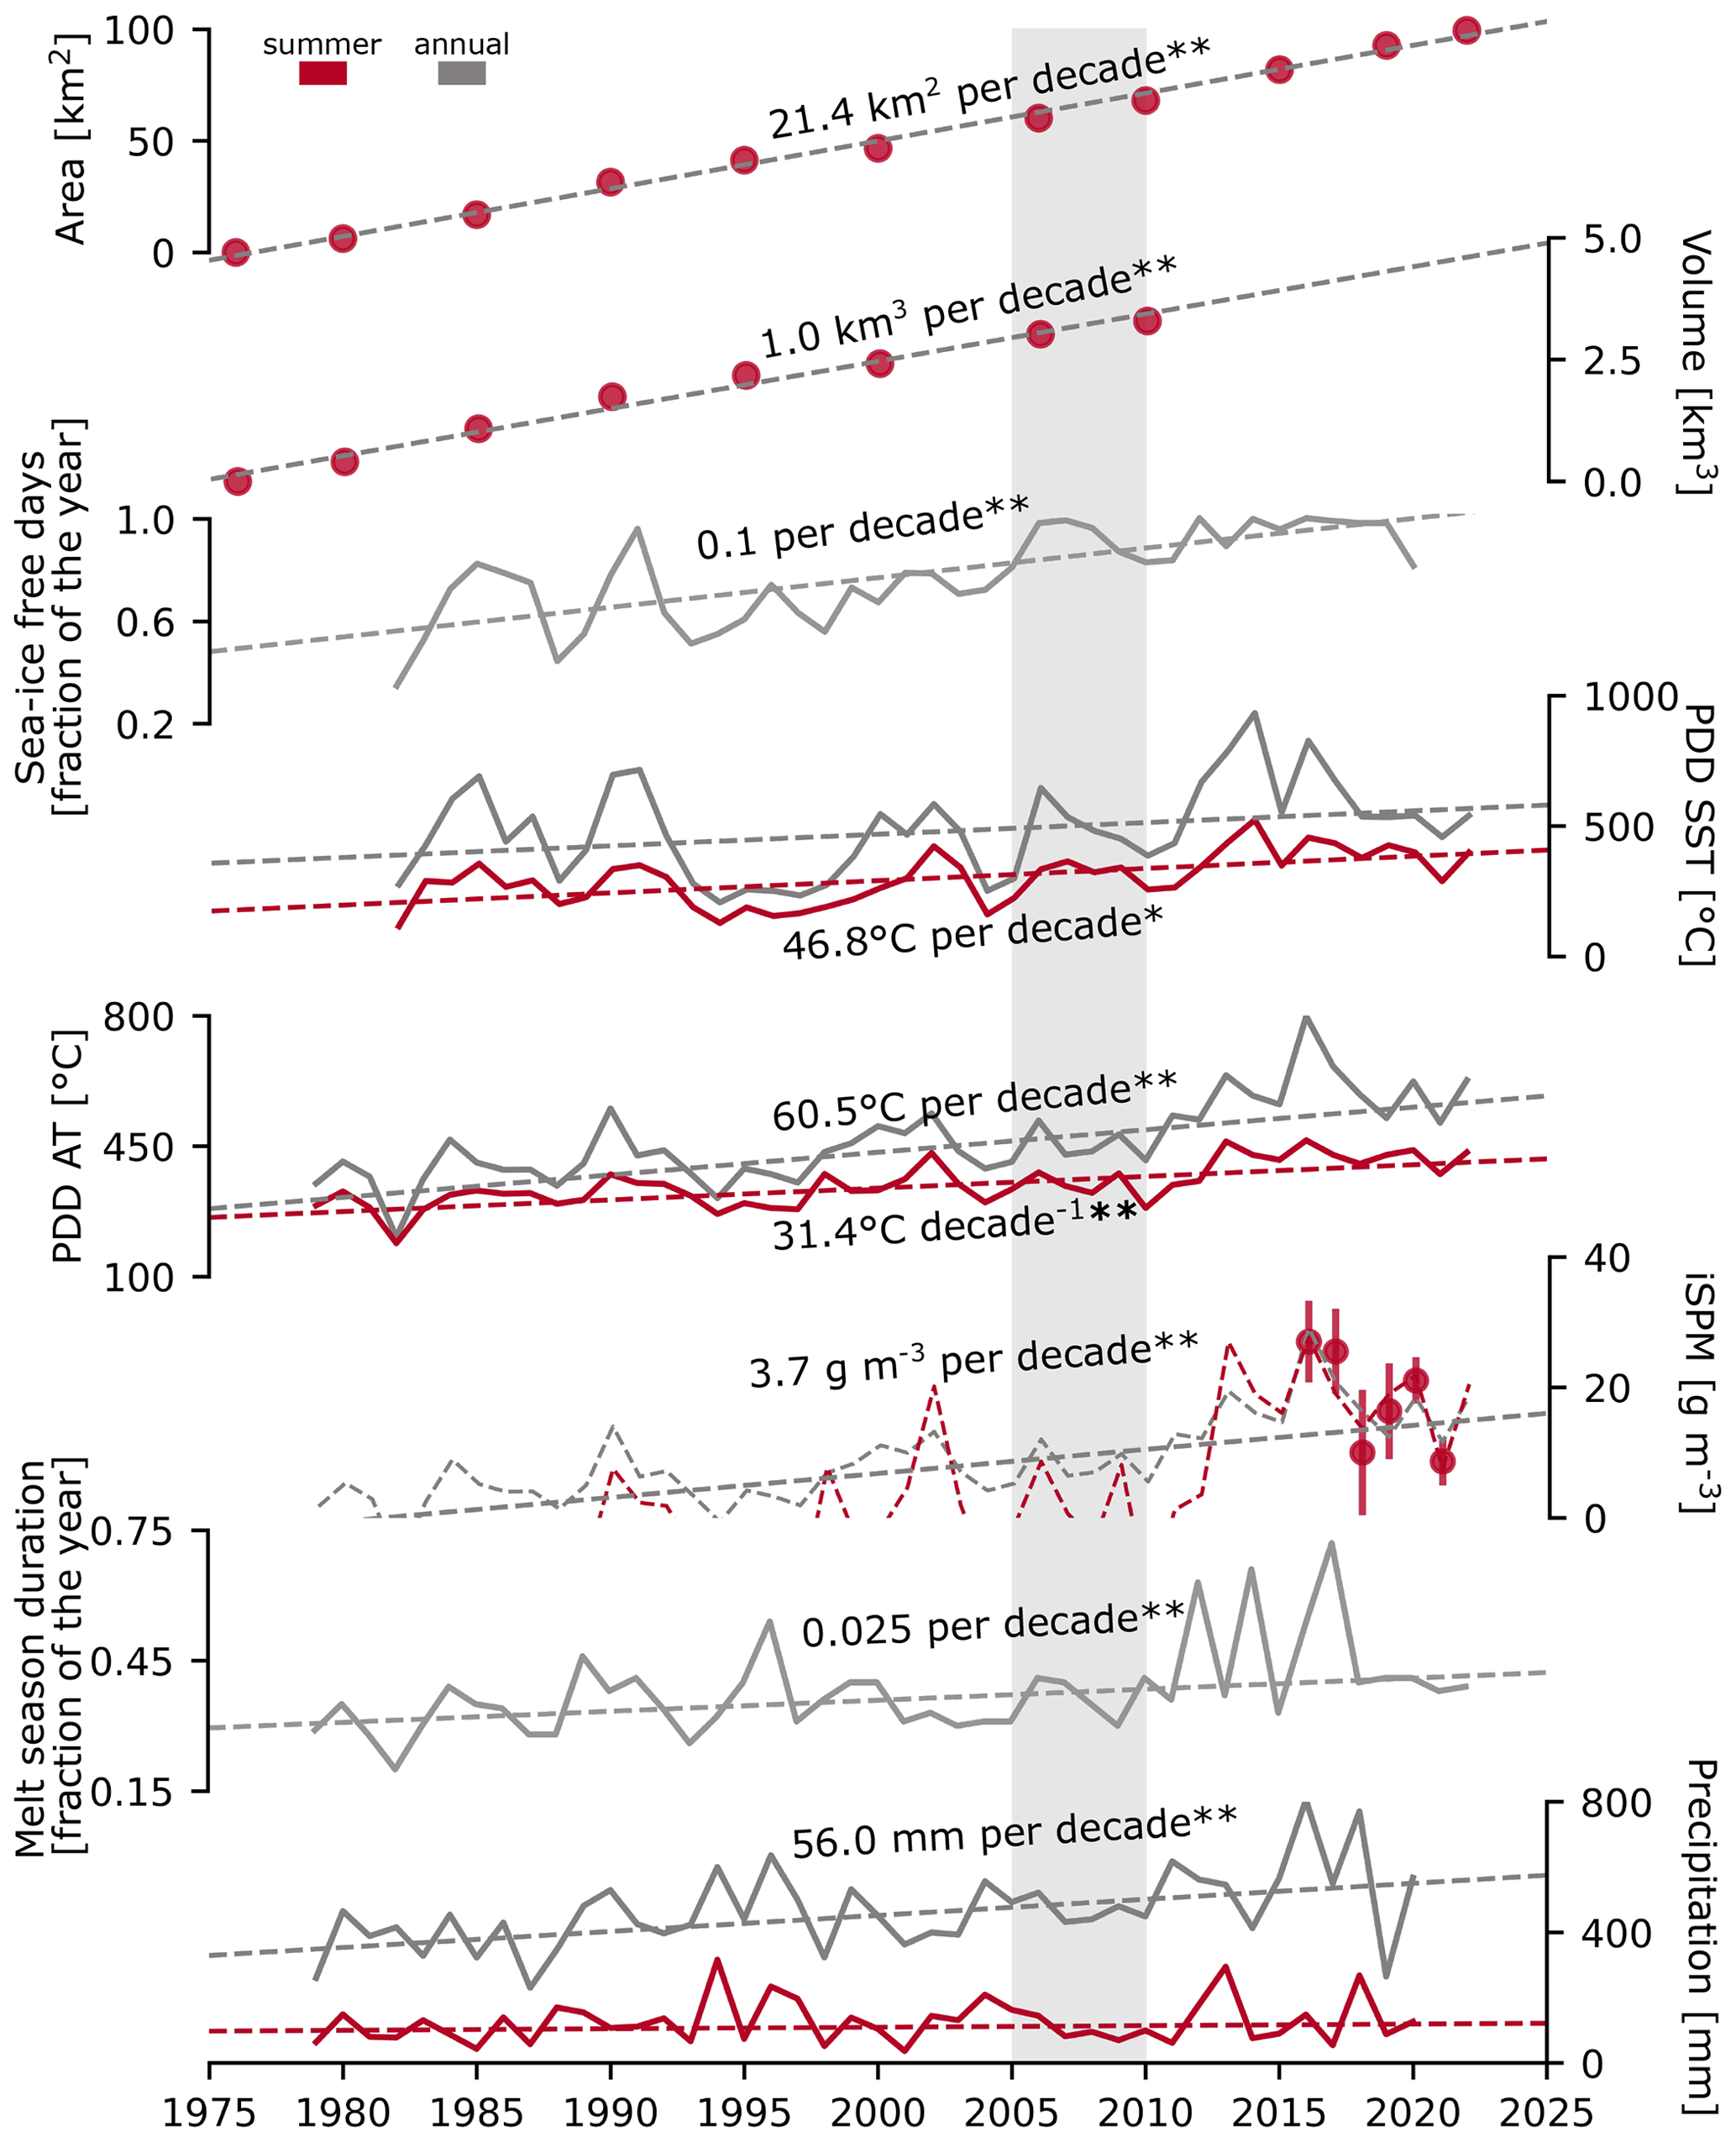
Figure 3Long-term trends in the newly ice-free marine habitat and the melt potential in Hornsund: area (km2) and volume (km3) of the newly ice-free marine habitat (assessed for summers between 1976 and 2022), sea-ice-free days (fraction of the year, 1982–2020), accumulated positive degree days for the sea surface temperature and air (PDD SST and PDD AT, °C, 1979–2022), inorganic SPM concentration reconstructed from 6 years of monitoring (g m−3, 1979–2022), melt season duration (fraction of the year, 1979–2022), and precipitation (mm, 1979–2020). * p<0.05, p<0.001 for the modified Mann–Kendall test. Grey shading indicates the modelling period (2005–2009).
2.4 Data analysis and visualization
The maps and satellite images were generated and processed in ArcGIS Pro 2.8.0. The plots were prepared in Python 3.7 (Van Rossum and Drake, 2009) using Matplotlib 3.1.1 (Caswell et al., 2019), Pandas 1.0.5 (Mckinney, 2010; Reback et al., 2020), and Seaborn 0.11.1, and they were arranged in Inkscape 0.92.4.
The Hamed and Rao modified Mann–Kendall (mMK) test was used to determine whether a trend existed in time series data (SIF, PDD SST, PDD AT, iSPM, and precipitation) with a significance level of 0.05 or 0.001 (Python library pymannkendall 1.4.2).
For each modelled station and each scenario, the 5-year (2005–2009) averages of SIC and SIT in May, the mean summertime integrated iSPM, and the rates of phytoplankton primary production (phyPP), zooplankton secondary production (zooSP), and carbon burial (CB) were calculated. Then, the average values of the phyPP, zooSP, and CB rates for all 20 stations were multiplied by the average newly ice-free area between 2006 and 2010 (64.21 km2). The resulting phyPP, zooSP, and CB under the SPM scenario were considered as gains in carbon sequestration potential due to the retreat of marine-terminating glaciers, whereas the differences between the noSPM and SPM scenarios were considered as losses due to the iSPM discharge with meltwater.
The influence of the iSPM discharge on the ecosystem dynamics was exemplified by presenting the biomasses of ice algae (IA) and macrobenthos (MB) as well as the biomasses of phytoplankton (PHY) and zooplankton (ZOO) and the silicate, phosphorus, nitrogen, and light limitation index (SIL, PLI, NLI, and LLI) integrated across the whole water column at three modelled stations (2, 9, and 14) that were comparable due to their similar depths (42.45–49.55 m) but presented low, intermediate, and high levels of summertime iSPM input. Also, 2 years with contrasting sea ice conditions (2008 and 2009) were displayed.
3.1 Newly ice-free marine habitats
The area of newly ice-free coastal waters due to the retreat of marine-terminating glaciers in Hornsund increased by ∼ 99.4 km2 between the summers of 1976 and 2022 (an increase in total area of around 38 %; see Figs. 1 and 3), whereas the volume gained by 2010 was ∼ 3.3 km3. The trends were linear (; R2=0.995 for the area and ; R2=0.984 for the volume; t-test p<0.001), with rates of ∼ 21.4 km2 per decade and 1.0 km3 per decade (Fig. 3). While advances of glacier fronts due to surge events were observed for some marine-terminating glaciers in Hornsund, these did not influence the overall increasing trends. Along with the glacial retreat, the number of SIF days (the fraction of the year with SIC < 15 %) increased significantly (∼ 0.1 per decade, i.e. by around 44 d; p<0.001, mMK test). Despite high interannual variability, the central part of Hornsund has become mostly devoid of sea ice since 2006, but there still is seasonal sea ice cover in the newly formed glacial bays (Fig. 6a).
3.2 Melt and SPM discharge potential
The annual sum of daily SST > 0 °C (PDD SST) showed no significant trend in outer Hornsund due to strong variability between years (p>0.1, mMK test) (Fig. 3), but it significantly increased for the summer months (June–August; 46.8 °C per decade; p<0.05, mMK test). The annual and summertime sums of positive daily air temperatures (PDD ATs) as well as the annual precipitation showed significant increases (60.5, 31.4, and 56.0 mm per decade, respectively; p<0.001, mMK test). Melt season duration increased significantly (p<0.001 mMK test) at a rate of ∼ 9 d per decade (2.5 % of the year). At the beginning of the measurements, the melt season started in June and ended in late September to mid-October, whereas it can currently start as early as February and ends mostly in October (Fig. S5).
The 6-year monitoring dataset of summertime SPM concentration in Hansbukta (Fig. 1c) was not sufficient to show long-term trends. However, average integrated iSPM levels were correlated with both the annual sum of PDD AT (, R2=0.68; p<0.05, t test) and the summertime sum of PDD AT (June–August) (, R2=0.78; p<0.05, t test). Even though the correlation was stronger for the summertime PDD AT, the estimates displayed numerous negative values. However, the annual sum of PDD AT allowed a coarse reconstruction of past conditions and revealed significant increases in iSPM concentration (3.7 g m−3 per decade in 1979–2022; p<0.001, mMK test). Importantly, within the modelled time range (2005–2009; Fig. 3, grey shading), both iSPM estimates gave similar results in 2006 and 2009 (8.6 and 12.0; 8.1 and 9.8 g m−3, respectively).
3.3 SPM dynamics
The concentration of iSPM varied between seasons, with the highest levels occurring in July–October (up to 150 g m−3) and the lowest between November and May (up to 50 g m−3), whereas the highest levels of organic SPM were observed between April and June (up to 20 g m−3) (Fig. 4a). Sediment flux observed for iSPM ranged between 1–6648 g m−2 d−1, while it was 0.9–333 g m−2 d−1 for organic SPM (Fig. 4b). The sinking rate of iSPM ranged between 0.6–265 m d−1 (mean 25.3, median 12.2 m d−1) (Fig. 4c), while the sinking rate of organic SPM was 1 order of magnitude lower, with a range of 0.3–28.9 m d−1 (mean 2.8, median 1.7 m d−1). The sediment flux of iSPM, which represents the temporary dynamics of the iSPM input, was dependent on the accumulated daily air temperature for positive degree days for a 6 d window (6accPDD AT) and mean salinity in the layer above (R2=0.662; p<0.001, t test; Fig. 4d). Within the range of frequently observed values of 6accPDD AT (0–40 °C) and salinity (30–35), the estimated inorganic sediment flux could reach 1860 g m−2 d−1 (Fig. S1). Importantly, the regression model (Eq. 1) performed well for an inorganic sediment flux of < 2000 g m−2 d−1 (RMSD = 290.1 g m−2 d−1), which corresponded to 95 % of the dataset, and mostly underestimated the highest inorganic sediment flux values (RMSD = 823.3 g m−2 d−1 for all the dataset).
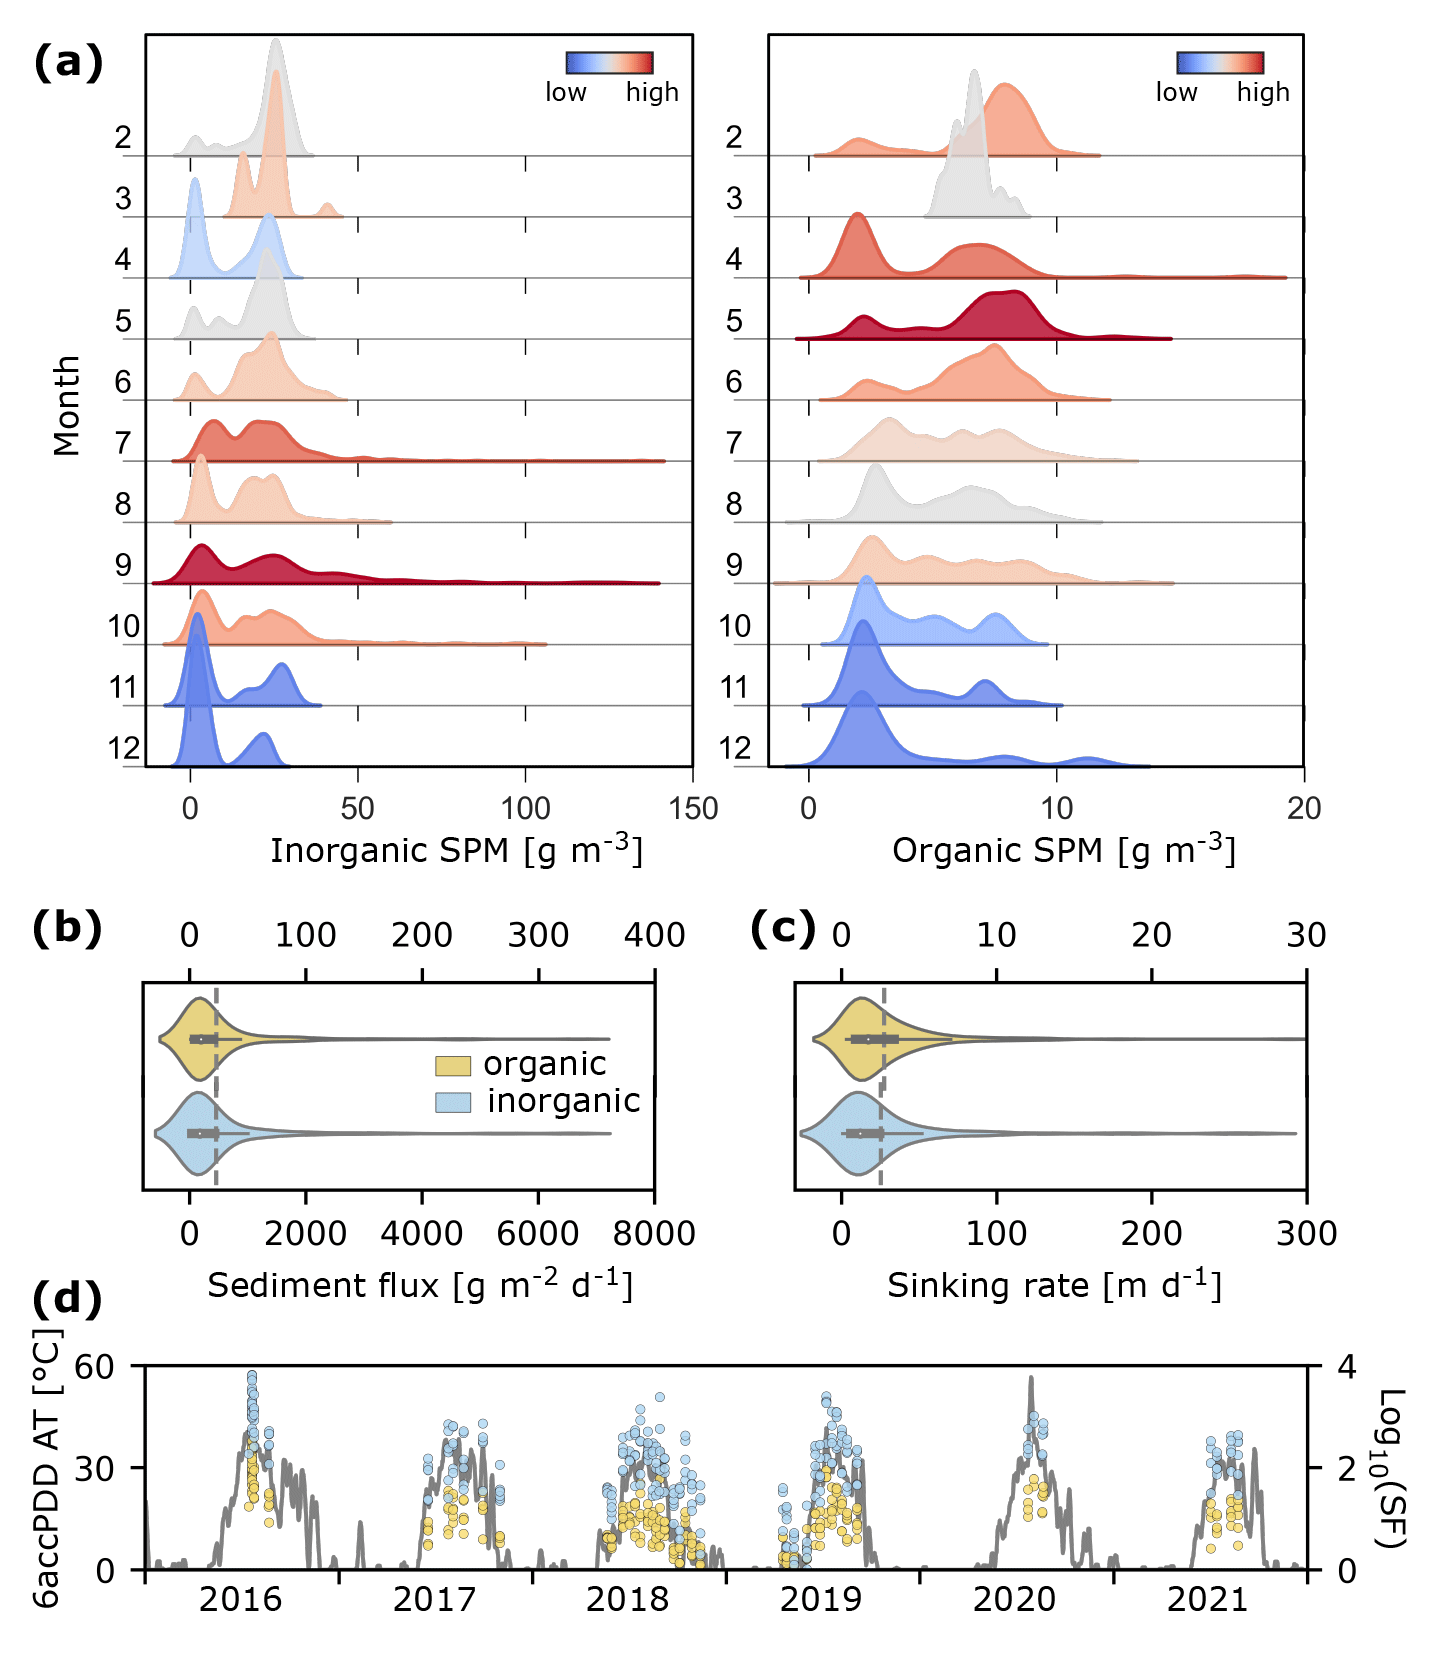
Figure 4SPM dynamics at monitoring stations in Hansbukta in 2016–2021. (a) Kernel density estimates of SPM concentration (g m−3; inorganic on the left and organic on the right). Colours indicate the distribution between months (high to low). (b) Inorganic (blue) and organic (yellow) sediment fluxes (g m−2 d−1; the dashed grey line is the mean value). (c) Inorganic and organic matter sinking rate (m d−1; the dashed grey line is the mean value). (d) Inorganic and organic sediment fluxes (SF; dots, log scale) and the accumulated daily air temperature for positive degree days for a 6 d window (°C; 6accPDD AT; line).
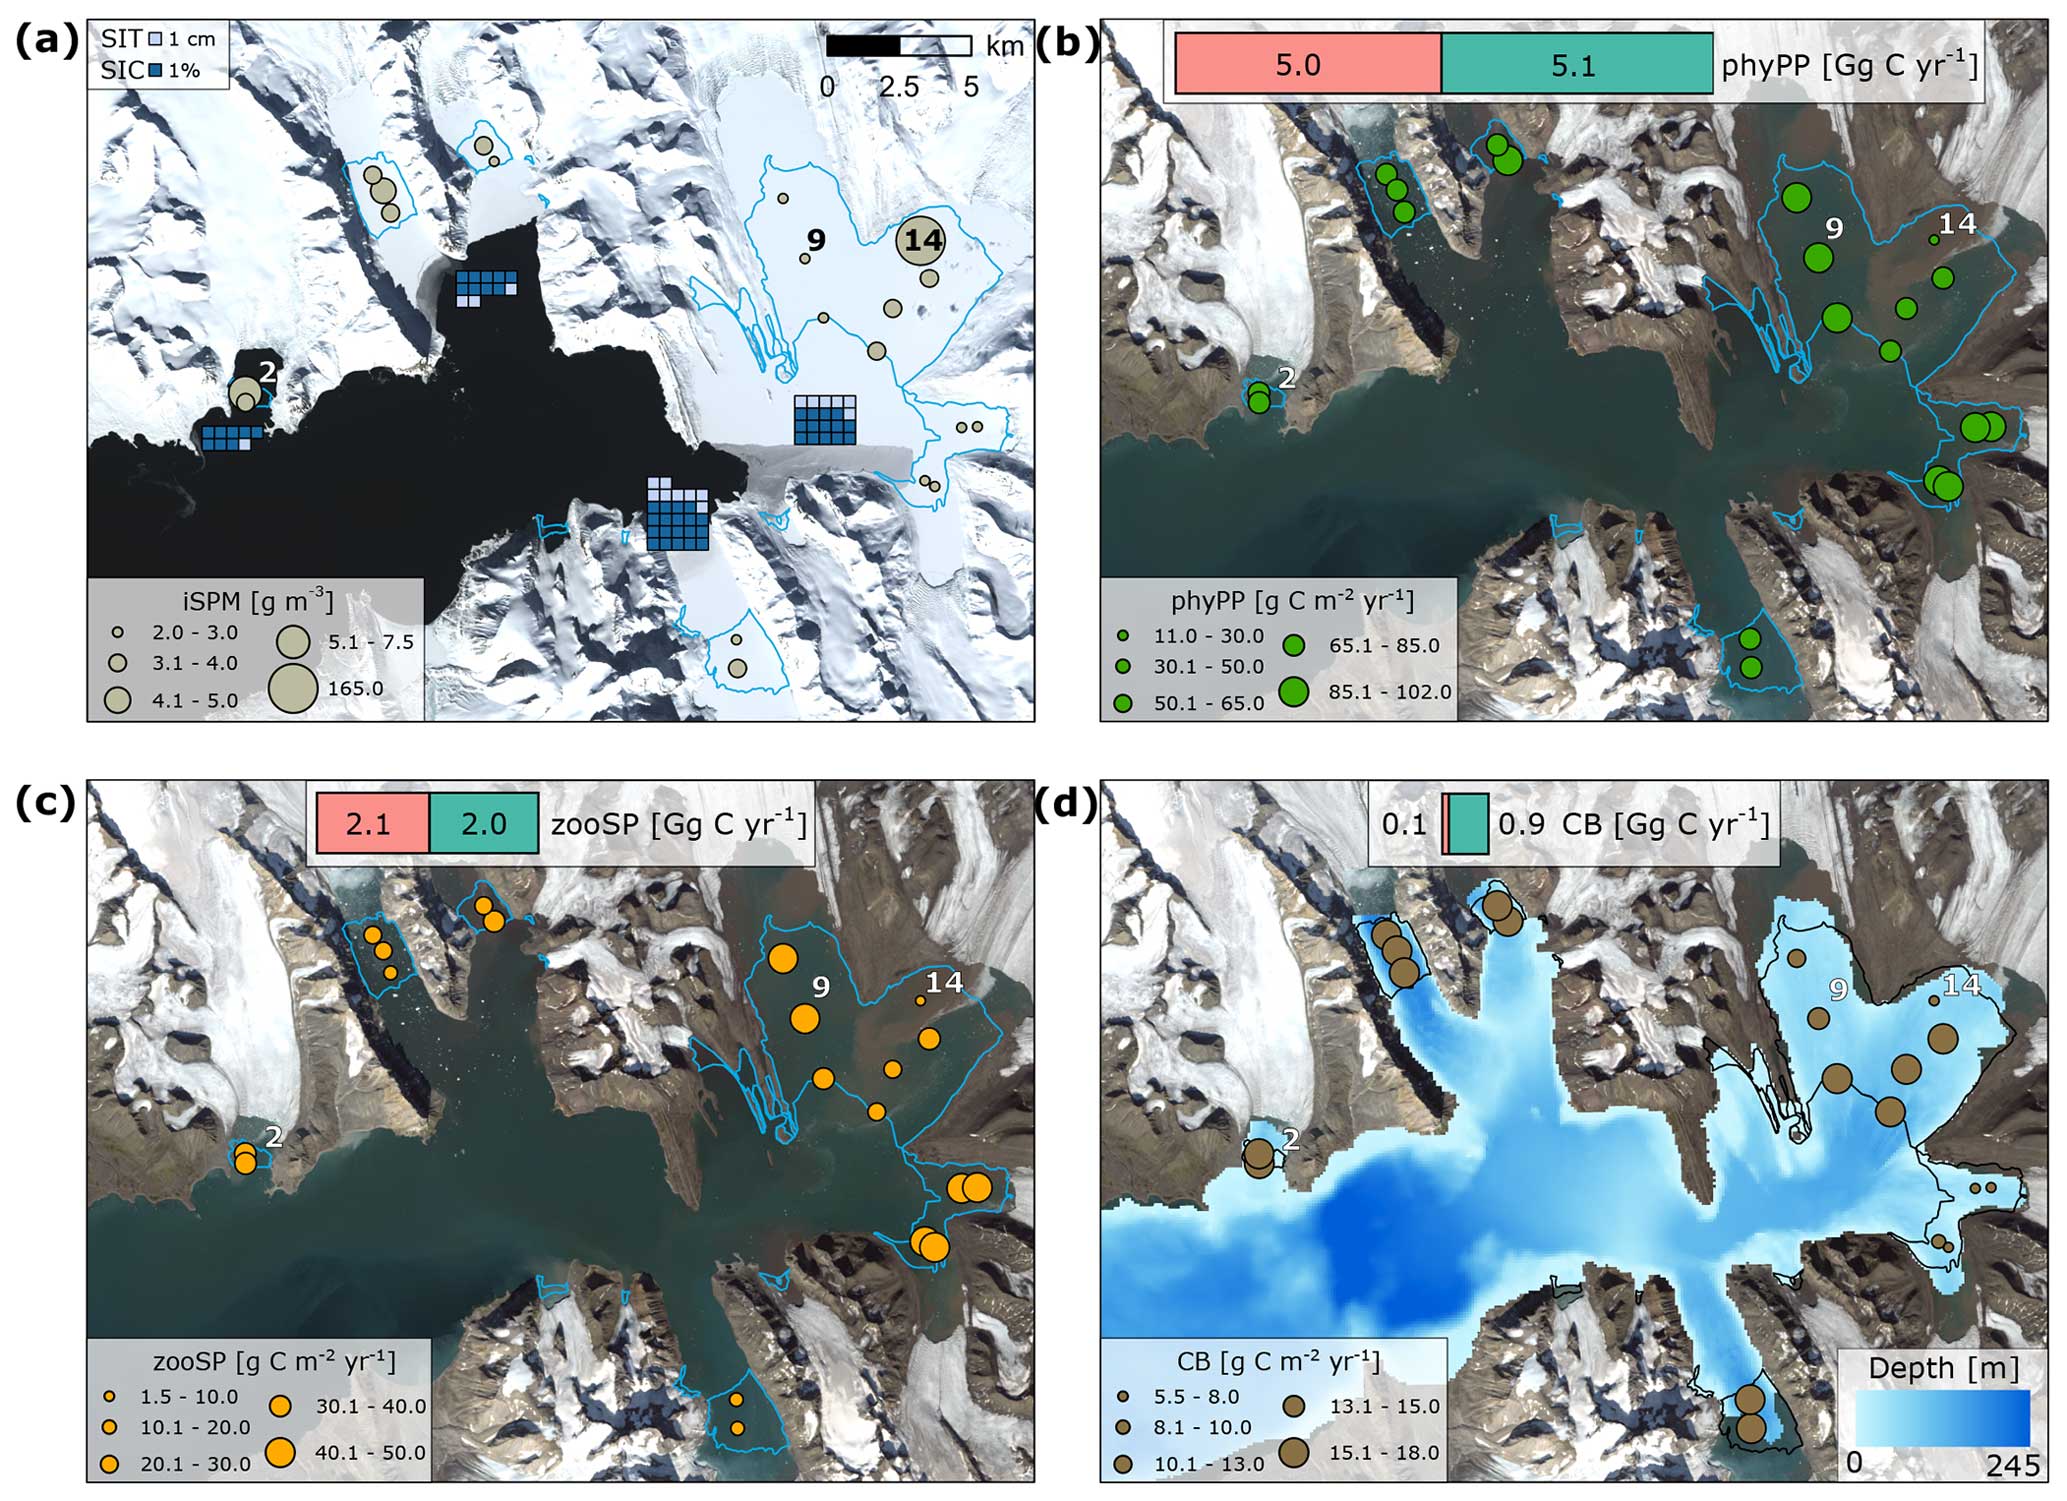
Figure 5Spatial patterns in (a) average sea ice thickness (SIT, cm) and concentration (SIC, %) in May and the summertime integrated inorganic SPM concentration (iSPM, g m−3), (b) plankton primary production (phyPP), (c) plankton secondary production (zooSP), and (d) carbon burial (CB) (g C m−2 yr−1), with carbon gains (in blue) due to the retreat of marine-terminating glaciers (in green; SPM scenario) and losses due to the inorganic SPM discharge with meltwater (in pink; noSPM−SPM scenario, Gg C yr−1, average for 2005–2009) also shown. The lines indicate the extent of newly ice-free areas in 2006. The ecosystem dynamics at stations 2, 9, and 14 are presented in Fig. 6. Landsat 8 satellite images (from 14 May 2022 for a and from 4 August 2020 for b, c, d) were downloaded from https://glovis.usgs.gov/app, last access: 29 March 2023.
3.4 Spatial patterns of sea ice, iSPM, plankton production, and carbon burial
The mean SIT and SIC in May were highest in the southern and inner parts of Hornsund (the 5-year average was up to 8 cm and 19.3 %, respectively) and lowest in the northern and outer parts (5-year average was 3 cm and 8.7 %, respectively) (Fig. 5a). The mean summertime integrated iSPM concentration was highest in the inner glacial bay (modelled station 14; 5-year average: 164.4 g m−3), where rates of plankton primary and secondary production and carbon burial were lowest (5-year average: 11.0, 1.5, and 5.5 g C m−2 yr−1, respectively; Fig. 5b, c, d). At other stations, the mean summertime integrated iSPM concentration was in the range between 2.1–7.1 g m−3, which allowed phyPP to reach rates between 66.3–100.7 g C m−2 yr−1 (versus 131.3–171.2 g C m−2 yr−1 under the noSPM scenario), whereas rates of zooSP were between 17.7–47.2 g C m−2 yr−1 (versus 48.7–75.7 g C m−2 yr−1 under the noSPM scenario), and the CB rate was in the range of 6.0–17.7 g C m−2 yr−1 (versus 6.5–23.0 g C m−2 yr−1 under noSPM). In the simulation period (2005–2009), the newly ice-free areas in Hornsund substantially contributed to phyPP, zooSP, and CB (on average 5.1, 2.0, and 0.9 Gg C yr−1, respectively; see the gains in carbon sequestration potential in the SPM scenario in Fig. 5, which are shown in green). However, the potential was hindered by 5.0, 2.1, and 0.1 Gg C yr−1, respectively, due to the iSPM input (see the losses due to the difference between the noSPM and SPM scenarios in Fig. 5, which are shown in pink). Thus, without the release of mineral particles, plankton primary and secondary production could have been around 2 times higher (10.1 and 4.1 Gg C yr−1, respectively, under the noSPM scenario), whereas carbon burial was less affected by iSPM input (1.0 Gg C yr−1 under the noSPM scenario – around 16.5 % higher than carbon burial under the SPM scenario).
3.5 Ecosystem dynamics
The ecosystem dynamics relating to the sea ice and iSPM in the newly ice-free areas are presented for three modelled stations with a low, intermediate, and high influence of iSPM (stations 9, 2, and 14; Fig. 6a, b, c, respectively) in 2 contrasting years (cold 2008 and warm 2009). The sea ice thickness and concentration (SIT and SIC) were lower in 2008 than in 2009 and in the outer than in the inner glacial bay. Thus, only in 2009 did the ice algae bloom reach a biomass of 0.16 g C m−2 in inner Hornsund (stations 9 and 14 in Fig. 6a and c, respectively), and the presence of sea ice (up to 0.5 m) delayed the phytoplankton bloom by around 10 d. Under a low or intermediate influence of iSPM (Fig. 6a, b), the light limitation index was slightly lowered before the main melt season (March to early June), whereas a significant effect of light limitation due to the iSPM input started around late June (up to 24 and 6 g m−3 at stations 9 and 2 in Fig. 6a and b, respectively). Due to the worsened underwater light conditions, the peaks in the spring and summer phytoplankton blooms were delayed by around 10–14 d and the summer peak reached a lower biomass (∼ 0.4–0.5 g C m−3 under the SPM scenario and 0.7 g C m−3 under the noSPM scenario), which also affected the zooplankton (the peak was delayed by ∼ 9 d and there was 0.1–0.2 g C m−3 less biomass) and macrobenthos (∼ 10 g C m−2 less biomass). At the highest levels of iSPM (up to 500 g m−3 at station 14; Fig. 6c), strong light limitation started early in March. Thus, phytoplankton, zooplankton, and macrobenthos reached very low biomasses (< 0.2 g C m−3, < 0.05 g C m−2, and < 5 g C m−2, respectively). The iSPM-related delays in phytoplankton blooms led to delays in silicate limitation and increases in the ice algae biomass in spring, particularly at the station with the highest levels of iSPM (the difference between the SPM and noSPM scenarios was up to 0.01 g C m−2).
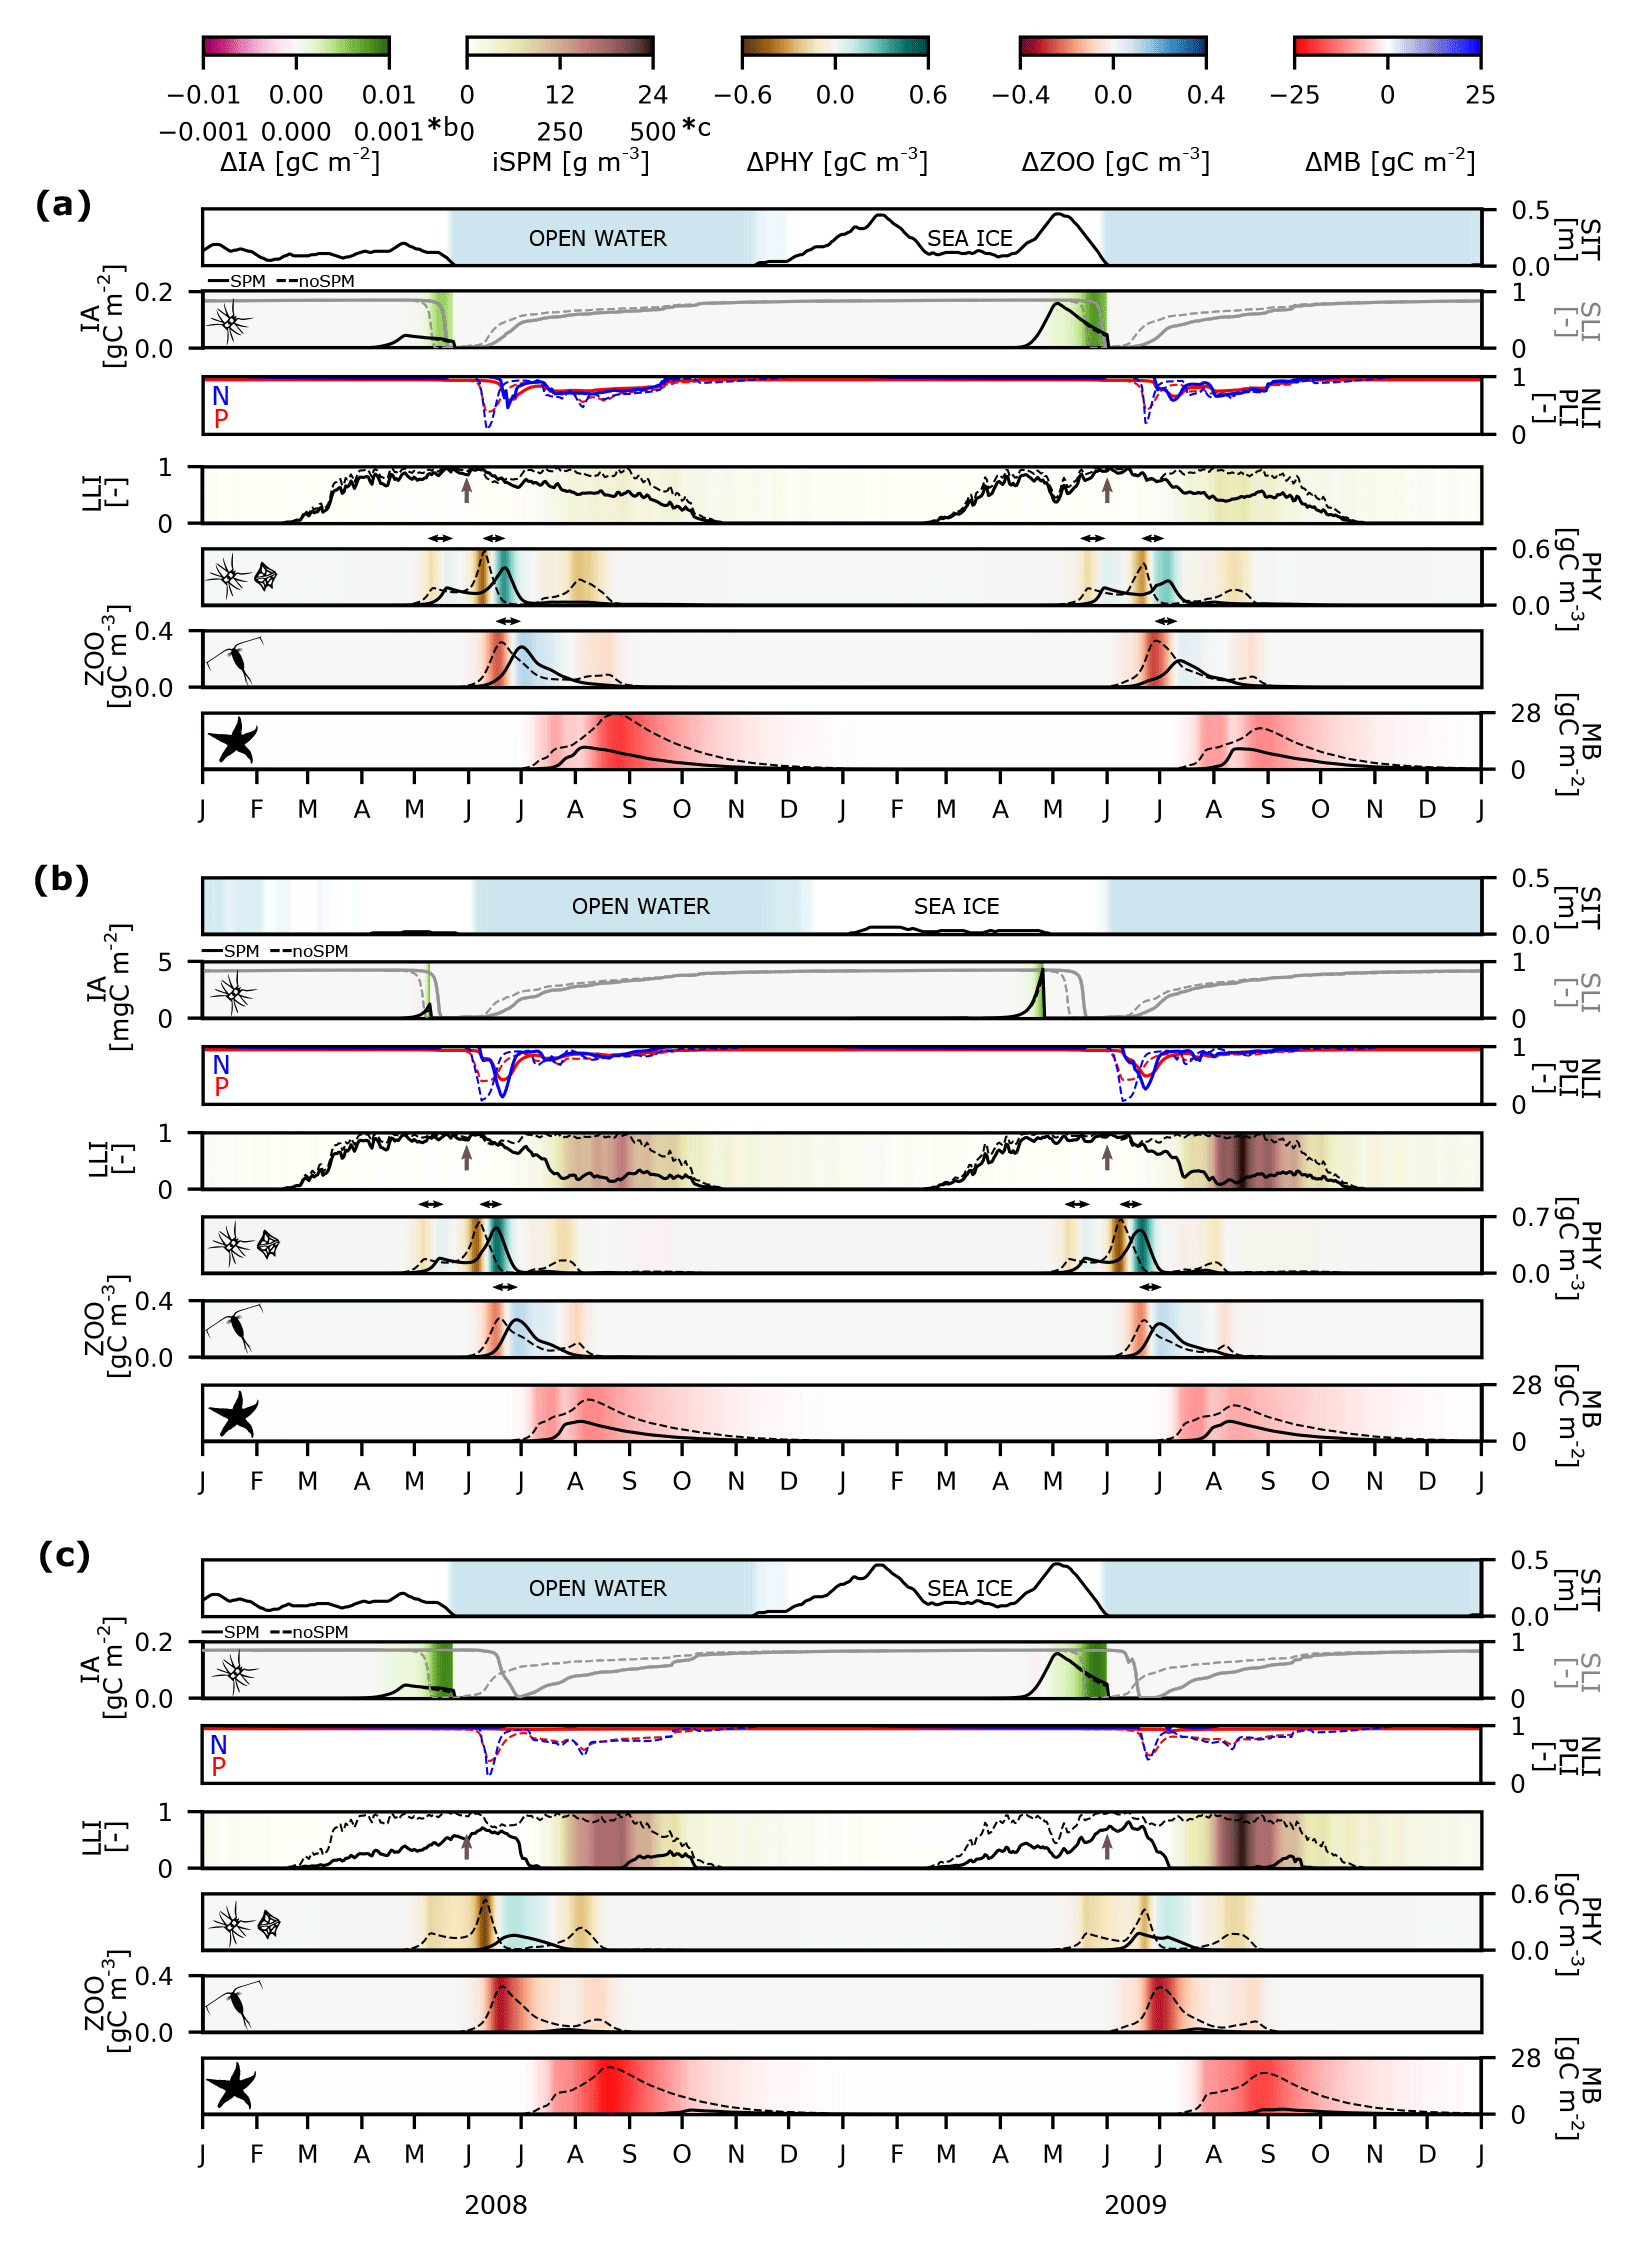
Figure 6Changes in ecosystem dynamics due to the iSPM input in 2008 and 2009 at three modelled stations: (a) station 9 (low iSPM influence), (b) station 2 (medium iSPM influence), and (c) station 14 (high iSPM influence). Line plots show the sea ice thickness (SIT; m), the biomass of ice algae (IA; g C m−2 or mg C m−2; black), the integrated silicate (grey), phosphorus (red), and nitrogen (blue) and the light limitation index (SLI, PLI, NLI, and LLI, respectively; all dimensionless), the integrated biomasses of phytoplankton and zooplankton (PHY and ZOO, respectively; g C m−3), and the macrobenthos biomass (MB; g C m−2). Full line – SPM scenario; dashed line – noSPM scenario. SLI and LLI values equal to 1 indicate that phytoplankton is not limited by either silicate or light. Colour plots indicate where SIC < 15 % (blue: open water), differences in the ice algae, phytoplankton, zooplankton, and macrobenthos biomasses between the SPM and noSPM scenarios (SPM−noSPM), and the integrated inorganic SPM concentration in the SPM scenario (iSPM; g m−3). Brown arrows indicate the start of the melt season (30 May 2008 and 3 June 2009), and black arrows indicate delays in the peak abundances of phytoplankton and zooplankton. Note the different scales (*b for panel b and *c for panel c).
4.1 Newly ice-free marine habitats
We report significant increases in new marine habitat area (∼ 100 km2) and volume (> 3.3 km3) between 1976 and 2022 in Hornsund (Figs. 1b, 3, 7a) due to the retreat of marine-terminating glaciers. These results are in line with cryosphere studies in West Spitsbergen fjords (Błaszczyk et al., 2021, 2023; Grabiec et al., 2018; Strzelecki et al., 2020) and in polar regions in general (Kochtitzky et al., 2022; Pfeffer et al., 2014). In the coastal Arctic and Antarctic, glaciers and ice sheets have lost mass due to increased submarine (basal) melting and iceberg calving (dos Santos et al., 2021; Błaszczyk et al., 2013, 2023), and a doubling of ice mass loss in Svalbard by 2100 was predicted (Geyman et al., 2022). The retreat of many marine-terminating glaciers has already produced newly ice-free areas, and some of them have receded onto land (Błaszczyk et al., 2013; Jerosch et al., 2019; Kochtitzky et al., 2022). Recently, the rapid loss of numerous glaciers was related to both external forcing such as increases in atmospheric and oceanic temperatures and a lack of sea ice buttressing or internal dynamics such as surges (Błaszczyk et al., 2013, 2023; Strzelecki et al., 2020). Here, we show increasing trends in the length of the melt season (∼ 9 d per decade) and the sum of PDD (46.79 °C per decade for summer PDD SST and 60.54 °C per decade and 31.43 °C per decade for annual and summer PDD AT, respectively; Fig. 3). While the melting potential is rising, the annual runoff in Svalbard is expected to increase till 2060; then it will likely decrease towards 2100 due to the reduction in glacier storage as the glaciers shrink (Bliss et al., 2014; Van Pelt et al., 2021; Nowak et al., 2021).
Furthermore, we report a significant loss in sea ice duration in central Hornsund (∼ 44 d per decade) (Fig. 3). However, as glacial retreat opens new coastal areas, it also increases the potential for winter sea ice formation in the more protected inner bays (Fig. 5a). In contrast to the glaciers where mass loss cannot be stopped nor reversed once induced, sea ice was shown to be more responsive to variations in both ocean and air temperatures (Muckenhuber et al., 2016). Thus, there can still be land-fast ice (sea ice attached to the coastline) that covers the inner parts of West Spitsbergen fjords for a limited time during winter and spring. Moreover, the ice bridge in inner Hornsund (Figs. 1b, 7a) is predicted to vanish in the coming decades (2030–2055) (Grabiec et al., 2018; Osika et al., 2022), which will transform Hornsund from a fjord into a strait, enabling sea ice advection from the Barents Sea. However, the loss of the ice bridge could also result in the increased presence of warm Atlantic Water in the area and, therefore, further sea ice loss. These seemingly contrasting predictions highlight the importance of continuous evaluation of the changing Hornsund environment and its potential as a model area for studies on regime shifts.
4.2 SPM dynamics
Based on the coarse reconstruction and modelling results presented in this study, we suggest that the Hornsund bays have been under the strong influence of dark glacial plumes since the beginning of the simulation period (2005) (Figs. 3, 5a, b, 6). In this study, the reconstructed iSPM concentration increased after 2013, and further rises are expected (3.7 g m−3 per decade integrated for the water column in summer). We show that air temperature variability – specifically, the accumulated daily air temperature above the melting point for a 6 d window (6accPDD AT), which takes into account the delays in meltwater discharge – modulates the iSPM flux (Figs. 4d, S1), as was also suggested for a glacial bay in Kongsfjorden, another West Spitsbergen fjord (D'Angelo et al., 2018). Recent studies also indicated that sediment production and fluxes to the coastal zones in the polar regions have increased due to higher air temperatures (Overeem et al., 2017; Szczuciński et al., 2009). Thus, it is anticipated that even central fjords will receive high inputs of mineral particles in the future, as turbid glacial plumes will spread farther from the source (Fig. 7a) (Castelao et al., 2019; Kanna et al., 2018; Hudson et al., 2014), thereby extending the influence of meltwater discharge onto the shelf and considerably affecting marine systems downstream (Meire et al., 2015, 2017; Milner et al., 2017). The relationship between melting potential and sediment input might differ between catchments; in particular, it could change after glaciers retreat onto land.
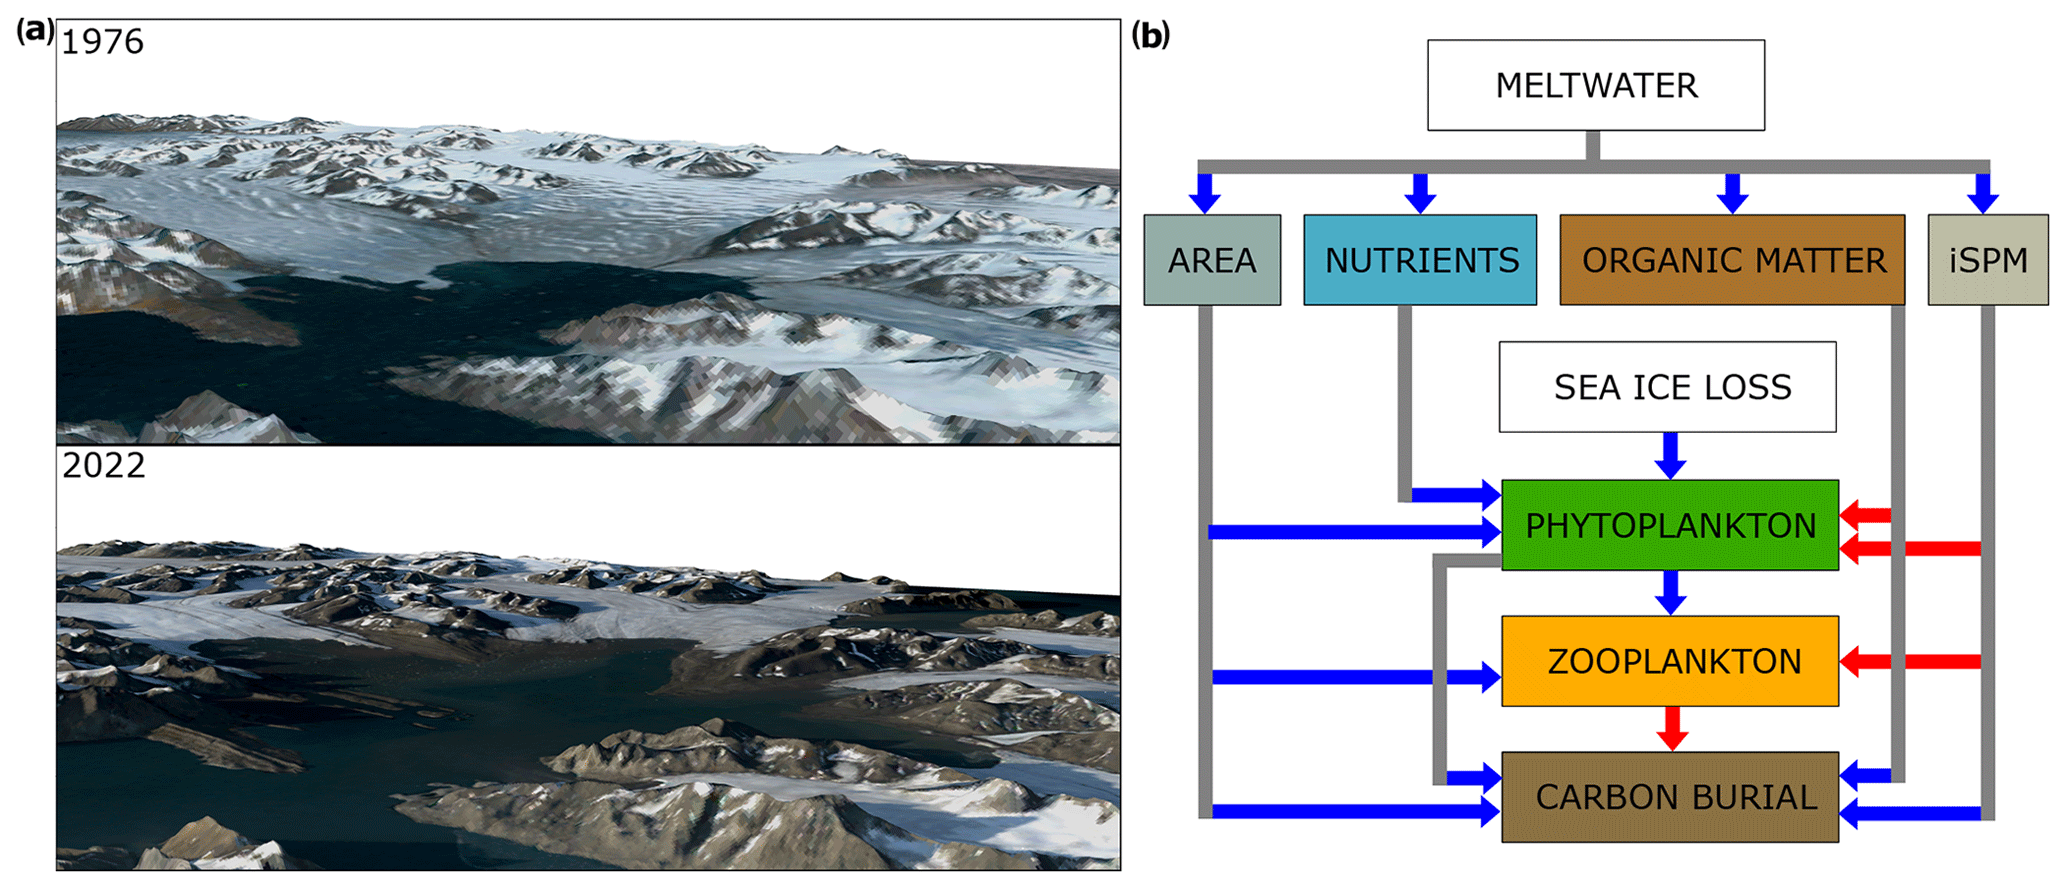
Figure 7(a) 3D representations of the inner Hornsund bay (Brepollen) in the summers of 1976 and 2022. Landsat satellite images (from 18 July 1976 and 15 August 2022) were downloaded from https://glovis.usgs.gov/app, last access: 3 October 2022. Digital elevation model data were downloaded from https://arcticdem.apps.pgc.umn.edu/, last access: 17 August 2023. (b) Schematic representation of the positive (blue arrows) and negative (red arrows) feedback mechanisms influencing biological production and carbon burial in the Arctic fjords.
The iSPM discharge was most extensive during summer (Fig. 4), although it could also be observed during autumn and winter, when it is intensified by tidal resuspension, resulting in a relatively high concentration of organic and inorganic suspended particles (Moskalik et al., 2018). In the future, more days with open-water conditions (no sea ice), which can increase wave action and particle removal from the beaches and tidal flats, as well as a longer melt season (Figs. 3, S5) could potentially lead to iSPM affecting a substantial part of the productive season, including not only summer and autumn but also spring. Here, we show high variability of the iSPM dynamics, with sinking rates between 0.6–265.9 m d−1 and sediment fluxes between 1.0–6647.7 g m−2 d−1 (Fig. 4b, c), which should be investigated further in the context of the driving mechanisms, such as flocculation (Moskalik et al., 2018).
4.3 Ecosystem dynamics
Observational data and previous modelling studies have shown that the continuing retreat of marine-terminating glaciers will negatively affect planktic and benthic communities, especially in enclosed shallow bays such as Brepollen (Fig. 7a) (Neder et al., 2022; Szeligowska et al., 2021, 2022; Torsvik et al., 2019). Indeed, we observed decreases in phytoplankton, zooplankton, and macrobenthos biomasses and delays in their peak occurrences close to the glacial fronts (by around 10–14 d as compared to the noSPM scenario; Fig. 5). These decreases were related to the input of particulate matter from land, which, even at a relatively low concentration in spring, can affect phytoplankton due to light attenuation (Fig. 7b). Under the SPM scenario, plankton primary production rates reached 66.3–100.7 g C m−2 yr−1 with a mean summertime integrated iSPM concentration of 2.1–7.1 g m−3, whereas it was around 2 times higher in the noSPM scenario (131.3–171.2 g C m−2 yr−1). Both ranges are comparable with the field measurements in inner and outer Hornsund and other West Spitsbergen fjords (Hodal et al., 2012; Iversen and Seuthe, 2011; Piwosz et al., 2009; Vonnahme et al., 2021) (Table S5, Fig. S6). Sea ice algae biomass was extremely low in most years (< 12 mg C m−2, except for 2009, when it was up to 160 mg C m−2) due to thin ice (< 50 cm) that disappeared before the main productive season. Ice algae did not seem to be negatively affected by iSPM and, as modelling results suggest, their biomass was slightly higher in the SPM scenario than in the noSPM scenario. Importantly, we suggest that sea ice loss leading to the earlier onset of spring pelagic production might become a compensation mechanism for the higher iSPM input in summer (Fig. 7b).
The modelled carbon burial rate was within the reported values (Koziorowska et al., 2018; Kuliński et al., 2014; Zaborska et al., 2018) and constituted around 10 %–20 % of the primary production, which is also in line with the current observations for polar and sub-polar fjords (Włodarska-Kowalczuk et al., 2019). Unfortunately, no field data for the assessment of plankton secondary production rates exist from this region. However, the values simulated here fell between the plankton primary production and carbon burial rates, as expected. Plankton secondary production was reduced due to the decreased food base (17.7–47.2 g C m−2 yr−1 versus 48.7–75.7 g C m−2 yr−1 under the SPM and noSPM scenarios, respectively). According to our simulations, carbon burial was the least affected by iSPM (6.0–17.7 g C m−2 yr−1 versus 6.5–23.0 g C m−2 yr−1 under the SPM and noSPM scenarios, respectively). Since the burial of accumulated material depends on the vertical flux of the organic matter originating from phytoplankton and zooplankton, food intake by benthic fauna, and rates of benthic mineralization, we hypothesize that the changes in the phytoplankton bloom timing might have shifted the carbon pathway from the zooplankton and macrobenthos pool to carbon burial in sediments, and thus carbon burial was still relatively high in the SPM scenario (∼ 16 % lower than under the noSPM scenario). Only the extremely high levels of iSPM (a mean summertime integrated iSPM concentration of 164.4 g m−3), which can be observed directly inside the turbid plumes, resulted in an almost complete absence of phyto- and zooplankton and macrobenthos and relatively low plankton production rates (11.0 and 1.5 g C m−2 yr−1 for phyPP and zooSP, respectively) but still considerable burial rates (5.5 g C m−2 yr−1). Thus, we speculate that sediment discharge to polar coastal zones might result in less complex food webs constituted by species that are better adapted to high iSPM concentrations and sedimentation rates, as shown for Antarctic benthos (Clark et al., 2013; Krzemińska and Kukliński, 2018; Sahade et al., 2015). This could reduce the biomass that is utilized in the pelagic and benthic system, leading to higher carbon burial in sediments (Fig. 7b).
4.4 Carbon gains and losses
Marine sediments in polar fjords have recently been recognized as efficient organic carbon sinks and incorporated into global carbon burial estimates (Bianchi et al., 2020; Cui et al., 2022; Smith et al., 2015), highlighting their societal importance as a climate-regulating ecosystem service (Barnes et al., 2021; Bax et al., 2021). They might become more efficient at the capture and long-term carbon storage due to high sedimentation rates and their restrictive nature compared to more open coastal environments, particularly with the expansion of shallow and isolated bays and increased land–ocean connectivity (Fig. 7b) (Smith et al., 2015). Here, we show that newly ice-free areas in Hornsund (∼ 64 km2 between 2006–2010) markedly contributed to plankton primary (5.1 Gg C yr−1) and secondary (2.0 Gg C yr−1) production and carbon burial (0.9 Gg C yr−1) (green in Fig. 6, indicating a carbon gain under the SPM scenario). This carbon burial constitutes only a small fraction of the globally estimated rates for the seafloor (2.9 × 10⁴–1.6 × 10⁵ Gg C yr−1; Bauer et al., 2013; Cai, 2011; Hedges and Keil, 1995). However, emerging marine habitats could gain more relevance considering that the organic carbon burial efficiency in fjords is 2 times higher than the global ocean average (Smith et al., 2015) and recognizing the scale of marine ice loss across the Arctic and Antarctic. Due to the anticipated negative effects of glacier ice loss (Hunter, 2022), here we show that part of the potential gains in carbon sequestration related to the newly ice-free areas turns into losses of plankton primary (−5.0 Gg C yr−1) and secondary (−2.1 Gg C yr−1) production and burial (−0.1 Gg C yr−1) under the SPM scenario (Fig. 6, red). Without the delivery of mineral particles from land, plankton primary and secondary production could be around 2 times higher (10.1 and 4.1 Gg C yr−1 under the noSPM scenario, respectively), whereas carbon burial is less affected by iSPM input (1.0 Gg C yr−1 under the noSPM scenario). Importantly, the carbon burial efficiency is highly variable and differs between fjords (Koziorowska et al., 2018), thus limiting direct generalizations.
4.5 Current limitations and future perspectives
While the coupled physical–biogeochemical model with the newly implemented iSPM input performed well according to our assessment, the field data for model parametrization and validation were not available for the simulated period (2005–2009), whereas remotely sensed products for iSPM concentration did not cover the inner fjords and were frequently limited by clouds. Despite that, reconstructions of previous conditions and an assessment based on two complementary datasets (SPM and sediment flux) collected in recent years (2015–2021) suggest that the simulated spatial and temporal dynamics of both inorganic and organic SPM are rather realistic and in line with the current knowledge of the West Spitsbergen marine ecosystem. While it should be considered that this reconstruction was based on a few years of measurements, which might limit its robustness, particularly towards the beginning of the AT measurements, the correlation with annual PDD AT seems to yield reasonable estimates. A recent multi-year study (2010–2016) of another West Spitsbergen fjord (Kongsfjorden) also indicated the relationship between particle fluxes and air temperature above the melting point (D'Angelo et al., 2018). Importantly, satellite data products calibrated for the glacial bays should become available (Klein et al., 2021; Walch et al., 2022) to verify the long-term trends in the iSPM discharge revealed in this study.
In this study, we used the meteorological forcing from observations performed at the Polish Polar Station located in the outer part of Hornsund for all the modelled stations, since there is no long-term weather monitoring in the inner fjord. A previous study showed that in summer, the air temperature in the inner fjord was lower by 0.6–1 °C than values reported for the Polish Polar Station, and the highest difference was observed during winter (around 2 °C) (Araźny et al., 2018). While the proper atmospheric representation is crucial and, in general, the spatial variations could affect the result, the differences in daily temperature (AT) and precipitation between the inner and outer fjord according to atmospheric fields derived from ERA-Interim reanalysis (Dee et al., 2011) were relatively low (Fig. S7). This could be related to the fact that Hornsund is a small fjord and its opening is mostly influenced by the Sørkapp Current, which transports Arctic Water from the Barents Sea. The polar front that exists there reduces the advection of warm Atlantic Water into Hornsund. Thus, the entire area retains Arctic character, in contrast to other West Spitsbergen fjords (Promińska et al., 2017; Cisek et al., 2017).
So far, only a few numerical models have been implemented in the polar and subpolar regions to study the dynamics of the SPM input from land. 3D models have indicated the areas with long residence times and high accumulation rates of iSPM (Neder et al., 2022) and considered a light limitation that led to a shallowing of the photic zone within the dark plumes (Le Fouest et al., 2010; Marín et al., 2013; Møller et al., 2023). Moreover, 2D models have been developed to simulate the sedimentation induced by ice-rafted debris (Mugford and Dowdeswell, 2010) and by glacial meltwater plumes emerging from marine-terminating glaciers (Dowdeswell et al., 2015; Mugford and Dowdeswell, 2011). However, they differ from each other and from our study in the parametrization and approach due to the various data used, processes represented, and numerical models available for the respective regions. To the best of our knowledge, this is one of the first attempts to implement the influence of iSPM in the coupled physical–biogeochemical model in polar coastal zones. While this 1D approach does not represent upwelling or spatial fluctuations in the glacial plumes (e.g. those implemented for Hansbukta in 2D; De Andrés et al., 2018, 2021) or the flocculation of the particles (Dowdeswell et al., 2015; Mugford and Dowdeswell, 2011), it is a first step in addressing the technical challenges related to the coupling between the sympagic, pelagic, and benthic systems and their responses to glacial discharge and retreat.
Even though Hornsund is amongst the most-studied Svalbard fjords, our study was limited to a 5-year period due to the lack of long-term input data for temperature and salinity (Jakacki et al., 2017; Torsvik et al., 2019), as most of the hydrodynamic models do not simulate coastal zones with sufficient horizontal resolution and do not consider changes in glacial bay extent. It should also be considered that the sea ice concentration and thickness were extracted from the closest data points available, and thus the sea ice conditions might have been different in the glacial bays. However, smoothing the data for more stable model runs could have resulted in more accurate forcing. Also, the advection of Atlantic Water is not represented in this 1D setup; however, due to the strong boundary in the form of the polar front and sills, most of the primary and secondary production in the glacial bays of Hornsund is assumed to be local, in contrast to other West Spitsbergen fjords, which experience high advection of plankton (Basedow et al., 2004; Gluchowska et al., 2016).
Here, we disentangled the effects of the iSPM input from those of other factors such as organic matter and nutrient delivery with meltwater. The influence of terrestrial organic matter on light attenuation was assumed to be negligible in Hornsund for the time covered by the simulation (Sagan and Darecki, 2018). Despite that, the release of large amounts of petrogenic organic carbon that has been isolated for millennia under the ice has recently emerged as an important component of carbon burial in fjords, and the fluxes of this carbon – as well as the transformations of it by microorganisms, leading to greenhouse gas emissions – should be better constrained for future model development (Fig. 7b) (Ruben et al., 2023). Moreover, several modelling and field studies in Arctic coastal waters have shown that the upwelling effect of submarine plumes and nutrient fluxes with meltwater supports primary production in the glacial bays and on the shelf (Castelao et al., 2019; Luo et al., 2016; McGovern et al., 2020; Oliver et al., 2020). However, the net effect depends on the lithology, the subglacial discharge rate, and the depth of the glacier grounding line as well as the seasonal dynamics of coastal currents, winds, and eddy activity, and it was not possible to represent these properly in this study. Studies in deep Greenland fjords indicate that macronutrients were primarily supplied to the surface waters by mixing and not through transport from land with glacial meltwater, as this was shown to have a relatively low nutrient load (Hopwood et al., 2020). However, the Svalbard fjords are relatively shallow, and thus the upwelling pump might not be as efficient as for Greenland fjords or the shallower, nutrient-deficient waters might be transported (Hopwood et al., 2018). Furthermore, while macronutrient concentrations can be higher in the Arctic rivers, most of the discharge in Hornsund comes from marine-terminating glaciers (Błaszczyk et al., 2019). Also, rivers were shown to deliver nutrients mostly in August (McGovern et al., 2020), when phytoplankton are already limited due to the light attenuation by iSPM. Even though nutrient input was not provided per se, setting the nutrient burial rate to 0 allowed nutrients that would otherwise be excluded to be kept in the system, and it could, to some degree, compensate for the lack of nutrient input with meltwater. Thus, the overall bias introduced by not providing nutrient input in our simulations might be relatively low.
The ecosystem dynamics are a result of the combined interaction of, inter alia, the dynamic coastline, hydrographic and sea ice conditions, nutrients, and sediment discharge, and thus this interdisciplinary work adds to the current understanding of the complex influence of glaciers on marine productivity and carbon fluxes (Hopwood et al., 2020). The presented numerical framework allows us to disentangle the effects of various processes and permits efficient hypothesis testing. Despite inherent weaknesses, it provides reliable results that are comparable with field measurements. The limitations of this study could be readily addressed by the further development and implementation of high-resolution general circulation models in polar regions (Szeligowska et al., 2024) and by coupling them with biogeochemical modules such as those presented here. Thus, skilful 3D fine-scale ecosystem models could arise from such work in the future.
In this study, we used Hornsund as a model high-latitude fjord that is particularly sensitive to a changing climate. We presented the accumulated effects of interactions between the atmosphere, ocean, cryosphere, and the dynamic coastline and explored how these affect the carbon sequestration potential. By combining the results of numerical modelling, remote sensing, and in situ observations, we provided a broad view of the periglacial environment and a framework for future simulations of ecosystem dynamics affected by terrigenous matter input with meltwater. Relatively well-studied areas adjacent to rapidly retreating marine-terminating glaciers in Hornsund are representative of similar coastal environments with shallow grounding line depths and, therefore, shed light on the formation and development of new marine habitats on not only a local but also a regional scale. Here, we show that despite the negative influence of iSPM input, the loss of marine ice in polar regions can be expected to ultimately lead to higher net productivity and the emergence of carbon sinks due to the formation of newly ice-free areas. Thus, glacial retreat and the terrigenous matter input should be implemented in current ocean models applied to such coastal systems to resolve carbon fluxes more accurately. However, the intertwined complexity of changes in High-Arctic coastal zones complicates the estimation of net effects on carbon burial in sediments. Considerable uncertainties remain, in particular those related to the petrogenic organic carbon release. Here, we also highlight the importance of maintaining long-term observations and implementing the FAIR (findability, accessibility, interoperability, and reusability) principles in data infrastructures to improve our understanding of the evolution of deglaciating coasts and subsequent influences on the marine ecosystem, which is one of the research priorities in the context of climate change impacts on polar regions.
The satellite images are available at https://glovis.usgs.gov/app (Wulder et al., 2022). Meteorological data from Hornsund were downloaded from https://doi.pangaea.de/10.1594/PANGAEA.909042 (Wawrzyniak and Osuch, 2019) and https://doi.org/10.5194/essd-12-805-2020 (Wawrzyniak and Osuch, 2020). Datasets for suspended particulate matter, sediment flux, and salinity were downloaded from https://dataportal.igf.edu.pl/group/longhorn (Moskalik et al., 2022a, b, c). The Arctic Sea and Ice Surface Temperature datasets were deposited at https://doi.org/10.6084/m9.figshare.24142965.v1 (Szeligowska, 2023), and the results of numerical simulations are stored at https://doi.org/10.6084/m9.figshare.24142992.v2 (Szeligowska et al., 2023a) and https://doi.org/10.6084/m9.figshare.24143013.v5 (Szeligowska et al., 2023b).
The supplement related to this article is available online at: https://doi.org/10.5194/bg-21-3617-2024-supplement.
Contributed to conception and design: MS, DB, and BM. Contributed to the acquisition of data: MS, AP, DB, and MM. Contributed to the analysis and interpretation of data: MS, DB, MM, and BM. Drafted the article: MS. Revised the article: MS, DB, AP, BM, MM, ET, and KBS. Approved the submitted version for publication: MS, DB, AP, BM, MM, ET, and KBS.
The contact author has declared that none of the authors has any competing interests.
Publisher’s note: Copernicus Publications remains neutral with regard to jurisdictional claims made in the text, published maps, institutional affiliations, or any other geographical representation in this paper. While Copernicus Publications makes every effort to include appropriate place names, the final responsibility lies with the authors.
Marlena Szeligowska, Emilia Trudnowska, and Katarzyna Błachowiak-Samołyk were funded by a Polish National Science Centre project (NCN, CoastDark grant no. 2018/29/B/NZ8/02463). Marlena Szeligowska, Mateusz Moskalik, and Emilia Trudnowska were supported by a project financed within the GRIEG competition and funded by the Norwegian Financial Mechanism 2014–2021 (grant no. UMO-2019/34/H/ST10/00504). Marlena Szeligowska was additionally funded by a DAAD short-term research grant for 2020 (grant no. 57507441) and the NAWA Bekker programme (grant no. BPN/BEK/2021/1/00258). Déborah Benkort was supported by the Changing Arctic Ocean project MiMeMo (grant no. NE/R012679/1), which is jointly funded by the UKRI Natural Environment Research Council (NERC) and the German Federal Ministry of Education and Research (grant no. BMBF/03F0801A). Data were collected as part of LONGHORN – oceanographical monitoring realized at the Polish Polar Station Hornsund.
This research has been supported by the Narodowe Centrum Nauki (grant no. 2018/29/B/NZ8/02463), the Deutscher Akademischer Austauschdienst (grant no. 57507441), the Narodowa Agencja Wymiany Akademickiej (grant no. BPN/BEK/2021/1/00258), the Bundesministerium für Bildung und Forschung (grant no. BMBF/03F0801A), and the Natural Environment Research Council.
This paper was edited by Tyler Cyronak and reviewed by one anonymous referee.
Albretsen, J., Hattermann, T., and Sundfjord, A.: Ocean and sea ice circulation model results from Svalbard area (ROMS) [v3.5], Norwegian Polar Institute, 2017.
Araźny, A., Przybylak, R., Wyszyński, P., Wawrzyniak, T., Nawrot, A., and Budzik, T.: Spatial variations in air temperature and humidity over Hornsund fjord (Spitsbergen) from 1 July 2014 to 30 June 2015, Geogr. Annal. Ser. A, 100, 27–43, 2018.
Ardyna, M. and Arrigo, K. R.: Phytoplankton dynamics in a changing Arctic Ocean, Nat. Clim. Chang. 10, 892–903, https://doi.org/10.1038/s41558-020-0905-y, 2020.
Arntsen, M., Sundfjord, A., Skogseth, R., Błaszczyk, M., and Promińska, A.: Inflow of Warm Water to the Inner Hornsund Fjord, Svalbard: Exchange Mechanisms and Influence on Local Sea Ice Cover and Glacier Front Melting, J. Geophys. Res.-Ocean., 124, 1915–1931, https://doi.org/10.1029/2018JC014315, 2019.
Arrigo, K. R., van Dijken, G., and Pabi, S.: Impact of a shrinking Arctic ice cover on marine primary production, Geophys. Res. Lett., 35, L19603, https://doi.org/10.1029/2008GL035028, 2008.
Barnes, D. K. A.: Polar zoobenthos blue carbon storage increases with sea ice losses, because across-shelf growth gains from longer algal blooms outweigh ice scour mortality in the shallows, Glob. Chang Biol., 23, 5083–5091, https://doi.org/10.1111/gcb.13772, 2017.
Barnes, D. K. A., Sands, C. J., Paulsen, M. L., Moreno, B., Moreau, C., Held, C., Downey, R., Bax, N., Stark, J., and Zwerschke, N.: Societal importance of Antarctic negative feedbacks on climate change: blue carbon gains from sea ice, ice shelf and glacier losses, Sci. Nat., 108, 43, https://doi.org/10.1007/s00114-021-01748-8, 2021.
Basedow, S. L., Eiane, K., Tverberg, V., and Spindler, M.: Advection of zooplankton in an Arctic fjord (Kongsfjorden, Svalbard), Estuar. Coast Shelf Sci., 60, 113–124, https://doi.org/10.1016/j.ecss.2003.12.004, 2004.
Bauer, J. E., Cai, W. J., Raymond, P. A., Bianchi, T. S., Hopkinson, C. S., and Regnier, P. A. G.: The changing carbon cycle of the coastal ocean, Nature, 504, 61–70, https://doi.org/10.1038/nature12857, 2013.
Bax, N., Sands, C. J., Gogarty, B., Downey, R. V., Moreau, C. V. E., Moreno, B., Held, C., Paulsen, M. L., McGee, J., Haward, M., and Barnes, D. K. A.: Perspective: Increasing blue carbon around Antarctica is an ecosystem service of considerable societal and economic value worth protecting, Glob. Chang Biol., 27, 5–12, https://doi.org/10.1111/gcb.15392, 2021.
Benkort, D., Daewel, U., Heath, M., and Schrum, C.: On the Role of Biogeochemical Coupling Between Sympagic and Pelagic Ecosystem Compartments for Primary and Secondary Production in the Barents Sea, Front Environ Sci, 8, 548013, https://doi.org/10.3389/fenvs.2020.548013, 2020.
Berner, R. A.: Burial of organic carbon and pyrite sulfur in the modern ocean: Its geochemical and environmental significance, Am. J. Sci., 282, 451–473, https://doi.org/10.2475/ajs.282.4.451, 1982.
Bianchi, T. S., Arndt, S., Austin, W. E. N., Benn, D. I., Bertrand, S., Cui, X., Faust, J. C., Koziorowska-Makuch, K., Moy, C. M., Savage, C., Smeaton, C., Smith, R. W., and Syvitski, J.: Fjords as Aquatic Critical Zones (ACZs), Earth-Sci. Rev., 203, 103145, https://doi.org/10.1016/j.earscirev.2020.103145, 2020.
Blain, C. O., Hansen, S. C., and Shears, N. T.: Coastal darkening substantially limits the contribution of kelp to coastal carbon cycles, Glob. Chang Biol., 27, 5547–5563, https://doi.org/10.1111/gcb.15837, 2021.
Błaszczyk, M., Jania, J. A., and Kolondra, L.: Fluctuations of tidewater glaciers in Hornsund Fjord (Southern Svalbard) since the beginning of the 20th century, Polar Res., 34, 327–352, https://doi.org/10.2478/popore-2013-0024, 2013.
Błaszczyk, M., Ignatiuk, D., Uszczyk, A., Cielecka-Nowak, K., Grabiec, M., Jania, J. A., Moskalik, M., and Walczowski, W.: Freshwater input to the arctic fjord hornsund (Svalbard), Polar Res., 38, 1–18, https://doi.org/10.33265/polar.v38.3506, 2019.
Błaszczyk, M., Jania, J. A., Ciepły, M., Grabiec, M., Ignatiuk, D., Kolondra, L., Kruss, A., Luks, B., Moskalik, M., Pastusiak, T., Strzelewicz, A., Walczowski, W., and Wawrzyniak, T.: Factors Controlling Terminus Position of Hansbreen, a Tidewater Glacier in Svalbard, J. Geophys. Res.-Earth, 126, e2020JF005763, https://doi.org/10.1029/2020JF005763, 2021.
Błaszczyk, M., Moskalik, M., Grabiec, M., Jania, J., Walczowski, W., Wawrzyniak, T., Strzelewicz, A., Malnes, E., Lauknes, T. R., and Pfeffer, W. T.: The Response of Tidewater Glacier Termini Positions in Hornsund (Svalbard) to Climate Forcing, 1992–2020, J. Geophys. Res.-Earth, 128, e2022JF006911, https://doi.org/10.1029/2022JF006911, 2023.
Bliss, A., Hock, R., and Radić, V.: Global response of glacier runoff to twenty‐first century climate change, J. Geophys. Res.-Earth, 119, 717–730, 2014.
Bruggeman, J. and Bolding, K.: A general framework for aquatic biogeochemical models, Environ. Model. Softw., 61, 249–265, https://doi.org/10.1016/j.envsoft.2014.04.002, 2014.
Burchard, H., Bolding, K., and Villarreal, M. R.: GOTM – A general ocean turbulence model, Theory, Applications and test cases, Tech. Rep., Report EUR 18745, 103 pp., 1999.
Cai, W.-J.: Estuarine and Coastal Ocean Carbon Paradox: CO2 Sinks or Sites of Terrestrial Carbon Incineration?, Ann. Rev. Mar. Sci., 3, 123–145, https://doi.org/10.1146/annurev-marine-120709-142723, 2011.
Castelao, R. M., Luo, H., Oliver, H., Rennermalm, A. K., Tedesco, M., Bracco, A., Yager, P. L., Mote, T. L., and Medeiros, P. M.: Controls on the Transport of Meltwater From the Southern Greenland Ice Sheet in the Labrador Sea, J. Geophys. Res.-Ocean., 124, 3551–3560, https://doi.org/10.1029/2019JC015159, 2019.
Caswell, T. A., Droettboom, M., Hunter, J., Lee, A., Firing, E., Stansby, D., Klymak, J., Andrade, E. S. de, Nielsen, J. H., Varoquaux, N., Hoffmann, T., Root, B., Elson, P., May, R., Dale, D., Lee, J.-J., Seppänen, J. K., McDougall, D., Straw, A., Hobson, P., Gohlke, C., Yu, T. S., Ma, E., Vincent, A. F., Silvester, S., Moad, C., Katins, J., Kniazev, N., Ariza, F., and Ernest, E.: matplotlib/matplotlib: REL: v3.1.1, Zenodo, https://doi.org/10.5281/ZENODO.3264781, 2019.
Clark, G. F., Stark, J. S., Johnston, E. L., Runcie, J. W., Goldsworthy, P. M., Raymond, B., and Riddle, M. J.: Light‐driven tipping points in polar ecosystems, Glob. Change Biol., 19, 3749–3761, 2013.
Christian, D. and Sheng, Y. P.: Relative influence of various water quality parameters on light attenuation in Indian River Lagoon, Estuar. Coast Shelf Sci., 57, 961–971, https://doi.org/10.1016/S0272-7714(03)00002-7, 2003.
Cisek, M., Makuch, P., and Petelski, T.: Comparison of meteorological conditions in Svalbard fjords: Hornsund and Kongsfjorden, Oceanologia, 59, 413–421, 2017.
Cui, X., Mucci, A., Bianchi, T. S., He, D., Vaughn, D., Williams, E. K., Wang, C., Smeaton, C., Koziorowska-Makuch, K., Faust, J. C., Plante, A. F., and Rosenheim, B. E.: Global fjords as transitory reservoirs of labile organic carbon modulated by organo-mineral interactions, Sci. Adv., 8, eadd0610, https://doi.org/10.1126/sciadv.add0610, 2022.
Daewel, U. and Schrum, C.: Simulating long-term dynamics of the coupled North Sea and Baltic Sea ecosystem with ECOSMO II: Model description and validation, J. Mar. Syst., 119/120, 30–49, https://doi.org/10.1016/j.jmarsys.2013.03.008, 2013.
Daewel, U., Schrum, C., and Macdonald, J. I.: Towards end-to-end (E2E) modelling in a consistent NPZD-F modelling framework (ECOSMO E2E_v1.0): application to the North Sea and Baltic Sea, Geosci. Model Dev., 12, 1765–1789, https://doi.org/10.5194/gmd-12-1765-2019, 2019.
D'Angelo, A., Giglio, F., Miserocchi, S., Sanchez-Vidal, A., Aliani, S., Tesi, T., Viola, A., Mazzola, M., and Langone, L.: Multi-year particle fluxes in Kongsfjorden, Svalbard, Biogeosciences, 15, 5343–5363, https://doi.org/10.5194/bg-15-5343-2018, 2018.
De Andrés, E., Otero, J., Navarro, F., Promińska, A., Lapazaran, J., and Walczowski, W.: A two-dimensional glacier-fjord coupled model applied to estimate submarine melt rates and front position changes of Hansbreen, Svalbard, J. Glaciol., 64, 745–758, https://doi.org/10.1017/jog.2018.61, 2018.
De Andrés, E., Otero, J., Navarro, F. J., and Walczowski, W.: Glacier-plume or glacier-fjord circulation models? A 2-D comparison for Hansbreen-Hansbukta system, Svalbard, J. Glaciol., 67, 797–810, https://doi.org/10.1017/jog.2021.27, 2021.
Dee, D. P., Uppala, S. M., Simmons, A. J., Berrisford, P., Poli, P., Kobayashi, S., Andrae, U., Balmaseda, M. A., Balsamo, G., Bauer, D. P., and Bechtold, P.: The ERA‐Interim reanalysis: Configuration and performance of the data assimilation system, Q. J. Roy. Meteorol. Soc., 137, 553–597, 2011.
Deregibus, D., Quartino, M. L., Campana, G. L., Momo, F. R., Wiencke, C., and Zacher, K.: Photosynthetic light requirements and vertical distribution of macroalgae in newly ice-free areas in Potter Cove, South Shetland Islands, Antarctica, Polar Biol., 39, 153–166, https://doi.org/10.1007/s00300-015-1679-y, 2016.
dos Santos, T. D., Barnes, J. M., Goldberg, D. N., Gudmundsson, G. H., and Morlighem, M.: Drivers of Change of Thwaites Glacier, West Antarctica, Between 1995 and 2015, Geophys. Res. Lett., 48, e2021GL093102, https://doi.org/10.1029/2021GL093102, 2021.
Dowdeswell, J. A., Hogan, K. A., Arnold, N. S., Mugford, R. I., Wells, M., Hirst, J. P. P., and Decalf, C.: Sediment-rich meltwater plumes and ice-proximal fans at the margins of modern and ancient tidewater glaciers: Observations and modelling, Sedimentology, 62, 1665–1692, https://doi.org/10.1111/sed.12198, 2015.
Duarte, C. M., Middelburg, J. J., and Caraco, N.: Major role of marine vegetation on the oceanic carbon cycle, Biogeosciences, 2, 1–8, https://doi.org/10.5194/bg-2-1-2005, 2005.
Fadeev, E., Rogge, A., Ramondenc, S., Nöthig, E. M., Wekerle, C., Bienhold, C., Salter, I., Waite, A. M., Hehemann, L., Boetius, A., and Iversen, M. H.: Sea ice presence is linked to higher carbon export and vertical microbial connectivity in the Eurasian Arctic Ocean, Commun. Biol., 4, 1–13, https://doi.org/10.1038/s42003-021-02776-w, 2021.
Ficetola, G. F., Marta, S., Guerrieri, A., Gobbi, M., Ambrosini, R., Fontaneto, D., Zerboni, A., Poulenard, J., Caccianiga, M., and Thuiller, W.: Dynamics of Ecological Communities Following Current Retreat of Glaciers, Annu. Rev. Ecol. Evol. Syst., 52, 405–426, https://doi.org/10.1146/annurev-ecolsys-010521-040017, 2021.
Geyman, E. C., J. J. van Pelt, W., Maloof, A. C., Aas, H. F., and Kohler, J.: Historical glacier change on Svalbard predicts doubling of mass loss by 2100, Nature, 601, 374–379, https://doi.org/10.1038/s41586-021-04314-4, 2022.
Gluchowska, M., Kwasniewski, S., Prominska, A., Olszewska, A., Goszczko, I., Falk-Petersen, S., Hop, H., and Weslawski, J. M.: Zooplankton in Svalbard fjords on the Atlantic–Arctic boundary, Polar Biol., 39, 1785–1802, https://doi.org/10.1007/s00300-016-1991-1, 2016.
Grabiec, M., Ignatiuk, D., Jania, J. A., Moskalik, M., Głowacki, P., Błaszczyk, M., Budzik, T., and Walczowski, W.: Coast formation in an Arctic area due to glacier surge and retreat: The Hornbreen-Hambergbreen case from Spistbergen, Earth Surf. Process. Landf., 43, 387–400, https://doi.org/10.1002/esp.4251, 2018.
Hedges, J. I. and Keil, R. G.: Sedimentary organic matter preservation: an assessment and speculative synthesis, Mar. Chem., 49, 81–115, https://doi.org/10.1016/0304-4203(95)00008-F, 1995.
Hock, R.: Glacier melt: a review of processes and their modelling, Prog. Phys. Geogr. Earth Environ., 29, 362–391, https://doi.org/10.1191/0309133305pp453ra, 2005.
Hodal, H., Falk-Petersen, S., Hop, H., Kristiansen, S., and Reigstad, M.: Spring bloom dynamics in Kongsfjorden, Svalbard: Nutrients, phytoplankton, protozoans and primary production, Polar Biol., 35, 191–203, https://doi.org/10.1007/s00300-011-1053-7, 2012.
Holding, J. M., Markager, S., Juul-Pedersen, T., Paulsen, M. L., Møller, E. F., Meire, L., and Sejr, M. K.: Seasonal and spatial patterns of primary production in a high-latitude fjord affected by Greenland Ice Sheet run-off, Biogeosciences, 16, 3777–3792, https://doi.org/10.5194/bg-16-3777-2019, 2019.
Holt, J., Schrum, C., Cannaby, H., Daewel, U., Allen, I., Artioli, Y., Bopp, L., Butenschon, M., Fach, B. A., Harle, J., Pushpadas, D., Salihoglu, B., and Wakelin, S.: Potential impacts of climate change on the primary production of regional seas: A comparative analysis of five European seas, Prog. Oceanogr., 140, 91–115, https://doi.org/10.1016/j.pocean.2015.11.004, 2016.
Hopwood, M. J., Carroll, D., Browning, T. J., Meire, L., Mortensen, J., Krisch, S., and Achterberg, E. P.: Non-linear response of summertime marine productivity to increased meltwater discharge around Greenland, Nat. Commun., 9, 1–9, https://doi.org/10.1038/s41467-018-05488-8, 2018.
Hopwood, M. J., Carroll, D., Dunse, T., Hodson, A., Holding, J. M., Iriarte, J. L., Ribeiro, S., Achterberg, E. P., Cantoni, C., Carlson, D. F., Chierici, M., Clarke, J. S., Cozzi, S., Fransson, A., Juul-Pedersen, T., Winding, M. H. S., and Meire, L.: Review article: How does glacier discharge affect marine biogeochemistry and primary production in the Arctic?, The Cryosphere, 14, 1347–1383, https://doi.org/10.5194/tc-14-1347-2020, 2020.
Howard, J., Hoyt, S., Isensee, K., Telszewski, M., and Pidgeon, E.: Coastal Blue Carbon: Methods for assessing carbon stocks and emissions factors in mangroves, tidal salt marshes, and seagrasses, Conservation International, Intergovernmental Oceanographic Commission of UNESCO, International Union for Conservation of Nature, Arlington, Virginia, USA, https://www.cifor-icraf.org/publications/pdf_files/Books/BMurdiyarso1401.pdf (last access: 15 July 2024), 2014.
Hudson, B., Overeem, I., Mcgrath, D., Syvitski, J. P. M., Mikkelsen, A., and Hasholt, B.: MODIS observed increase in duration and spatial extent of sediment plumes in Greenland fjords, The Cryosphere, 8, 1161–1176, https://doi.org/10.5194/tc-8-1161-2014, 2014.
Hunter, W. R.: Can carbon storage in West Antarctic fjords have an impact on climate change, following glacier retreat?, Glob. Chang Biol., 28, 1703–1704, https://doi.org/10.1111/gcb.16047, 2022.
Iversen, K. R. and Seuthe, L.: Seasonal microbial processes in a high-latitude fjord (Kongsfjorden, Svalbard): I. Heterotrophic bacteria, picoplankton and nanoflagellates, Polar Biol., 34, 731–749, https://doi.org/10.1007/s00300-010-0929-2, 2011.
Jakacki, J., Przyborska, A., Kosecki, S., Sundfjord, A., and Albretsen, J.: Modelling of the Svalbard fjord Hornsund, Oceanologia, 59, 473–495, https://doi.org/10.1016/j.oceano.2017.04.004, 2017.
Jerosch, K., Scharf, F. K., Deregibus, D., Campana, G. L., Zacher, K., Pehlke, H., Falk, U., Christian Hass, H., Quartino, M. L., and Abele, D.: Ensemble modeling of Antarctic macroalgal habitats exposed to glacial melt in a polar fjord, Front. Ecol. Evol., 7, 207, https://doi.org/10.3389/fevo.2019.00207, 2019.
Kanna, N., Sugiyama, S., Ohashi, Y., Sakakibara, D., Fukamachi, Y., and Nomura, D.: Upwelling of Macronutrients and Dissolved Inorganic Carbon by a Subglacial Freshwater Driven Plume in Bowdoin Fjord, Northwestern Greenland, J. Geophys. Res.-Biogeo., 123, 1666–1682, https://doi.org/10.1029/2017JG004248, 2018.
Klein, K. P., Lantuit, H., Heim, B., Doxaran, D., Juhls, B., Nitze, I., Walch, D., Poste, A., and Søreide, J. E.: The Arctic Nearshore Turbidity Algorithm (ANTA) – A multi sensor turbidity algorithm for Arctic nearshore environments, Sci. Remote Sens., 4, 100036, https://doi.org/10.1016/J.SRS.2021.100036, 2021.
Kochtitzky, W., Copland, L., Van Wychen, W., Hugonnet, R., Hock, R., Dowdeswell, J. A., Benham, T., Strozzi, T., Glazovsky, A., Lavrentiev, I., Rounce, D. R., Millan, R., Cook, A., Dalton, A., Jiskoot, H., Cooley, J., Jania, J., and Navarro, F.: The unquantified mass loss of Northern Hemisphere marine-terminating glaciers from 2000–2020, Nat. Commun., 13, 1–10, https://doi.org/10.1038/s41467-022-33231-x, 2022.
Koziorowska, K., Kuliński, K., and Pempkowiak, J.: Comparison of the burial rate estimation methods of organic and inorganic carbon and quantification of carbon burial in two high Arctic fjords, Oceanologia, 60, 405–418, https://doi.org/10.1016/j.oceano.2018.02.005, 2018.
Krzeminska, M. and Kuklinski, P.: Biodiversity patterns of rock encrusting fauna from the shallow sublittoral of the Admiralty Bay, Mar. Environ. Res., 139, 169–181, 2018.
Kuliński, K., Kedra, M., Legezyńska, J., Gluchowska, M., and Zaborska, A.: Particulate organic matter sinks and sources in high Arctic fjord, J. Mar. Syst., 139, 27–37, https://doi.org/10.1016/j.jmarsys.2014.04.018, 2014.
Lalande, C., Nöthig, E., and Fortier, L.: Algal Export in the Arctic Ocean in Times of Global Warming, Geophys. Res. Lett., 46, 5959–5967, https://doi.org/10.1029/2019GL083167, 2019.
Le Fouest, V., Zakardjian, B., and Saucier, F. J.: Plankton ecosystem response to freshwater-associated bulk turbidity in the subarctic Gulf of St. Lawrence (Canada): A modelling study, J. Mar. Syst., 81, 75–85, https://doi.org/10.1016/j.jmarsys.2009.12.003, 2010.
Lund-Hansen, L. C., Andersen, T. J., Nielsen, M. H., and Pejrup, M.: Suspended Matter, Chl-a, CDOM, Grain Sizes, and Optical Properties in the Arctic Fjord-Type Estuary, Kangerlussuaq, West Greenland During Summer, Estuar. Coast., 33, 1442–1451, https://doi.org/10.1007/S12237-010-9300-7/FIGURES/5, 2010.
Luo, H., Castelao, R. M., Rennermalm, A. K., Tedesco, M., Bracco, A., Yager, P. L., and Mote, T. L.: Oceanic transport of surface meltwater from the southern Greenland ice sheet, Nat. Geosci., 9, 528–532, https://doi.org/10.1038/ngeo2708, 2016.
Marín, V. H., Tironi, A., Paredes, M. A., and Contreras, M.: Modeling suspended solids in a Northern Chilean Patagonia glacier-fed fjord: GLOF scenarios under climate change conditions, Ecol. Modell., 264, 7–16, https://doi.org/10.1016/j.ecolmodel.2012.06.017, 2013.
McGovern, M., Pavlov, A. K., Deininger, A., Granskog, M. A., Leu, E., Søreide, J. E., and Poste, A. E.: Terrestrial Inputs Drive Seasonality in Organic Matter and Nutrient Biogeochemistry in a High Arctic Fjord System (Isfjorden, Svalbard), Front. Mar. Sci., 7, 542563, https://doi.org/10.3389/fmars.2020.542563, 2020.
Mckinney, W.: Data Structures for Statistical Computing in Python, Proc. of the 9Th Python in Science Conference, SCIPY 2010, 51–56, 2010.
Meire, L., Søgaard, D. H., Mortensen, J., Meysman, F. J. R., Soetaert, K., Arendt, K. E., Juul-Pedersen, T., Blicher, M. E., and Rysgaard, S.: Glacial meltwater and primary production are drivers of strong CO2 uptake in fjord and coastal waters adjacent to the Greenland Ice Sheet, Biogeosciences, 12, 2347–2363, https://doi.org/10.5194/bg-12-2347-2015, 2015.
Meire, L., Mortensen, J., Meire, P., Juul-Pedersen, T., Sejr, M. K., Rysgaard, S., Nygaard, R., Huybrechts, P., and Meysman, F. J. R.: Marine-terminating glaciers sustain high productivity in Greenland fjords, Glob. Chang Biol., 23, 5344–5357, https://doi.org/10.1111/gcb.13801, 2017.
Milner, A. M., Khamis, K., Battin, T. J., Brittain, J. E., Barrand, N. E., Füreder, L., Cauvy-Fraunié, S., Gíslason, G. M., Jacobsen, D., Hannah, D. M., Hodson, A. J., Hood, E., Lencioni, V., Ólafsson, J. S., Robinson, C. T., Tranter, M., and Brown, L. E.: Glacier shrinkage driving global changes in downstream systems, P. Natl. Acad. Sci. USA, 114, 9770–9778, https://doi.org/10.1073/pnas.1619807114, 2017.
Møller, E. F., Christensen, A., Larsen, J., Mankoff, K. D., Ribergaard, M. H., Sejr, M., Wallhead, P., and Maar, M.: The sensitivity of primary productivity in Disko Bay, a coastal Arctic ecosystem, to changes in freshwater discharge and sea ice cover, Ocean Sci., 19, 403–420, https://doi.org/10.5194/os-19-403-2023, 2023.
Moskalik, M., Głowacki, O., and Korhonen, M.: Suspended Particulate Matter (SPM) concentration with the Loss on Ignition (LOI) in Hansbukta and other regions in Hornsund Fjord, IG PAS Data Portal [data set], https://dataportal.igf.edu.pl/dataset/spm-hornsund (last access: 4 November 2022), 2022a.
Moskalik, M., Głowacki, O., and Korhonen, M.: Sediment Flux (SedFlux) with the Loss on Ignition (LOI) in Hansbukta and other regions in Hornsund Fjord, IG PAS Data Portal [data set], https://dataportal.igf.edu.pl/dataset/sedflux-hornsund (last access: 4 November 2022), 2022b.
Moskalik, M., Głowacki, O., and Korhonen, M.: Inter-calibrated Temperature and Salinity in-depth profiles in Hornsund Fjord, IG PAS Data Portal [data set], https://dataportal.igf.edu.pl/dataset/inter-calibrated (last access: 4 November 2022), 2022c.
Moskalik, M., Tegowski, J., Grabowiecki, P., and Zulichowska, M.: Principal component and cluster analysis for determining diversification of bottom morphology based on bathymetric profiles from Brepollen (Hornsund, Spitsbergen), Oceanologia, 56, 59–84, https://doi.org/10.5697/oc.56-1.059, 2014.
Moskalik, M., Ćwiąkała, J., Szczuciński, W., Dominiczak, A., Głowacki, O., Wojtysiak, K., and Zagórski, P.: Spatiotemporal changes in the concentration and composition of suspended particulate matter in front of Hansbreen, a tidewater glacier in Svalbard, Oceanologia, 60, 446–463, https://doi.org/10.1016/j.oceano.2018.03.001, 2018.
Muckenhuber, S., Nilsen, F., Korosov, A., and Sandven, S.: Sea ice cover in Isfjorden and Hornsund, Svalbard (2000–2014) from remote sensing data, The Cryosphere, 10, 149–158, https://doi.org/10.5194/tc-10-149-2016, 2016.
Mugford, R. I. and Dowdeswell, J. A.: Modeling iceberg-rafted sedimentation in high-latitude fjord environments, J. Geophys. Res., 115, F03024, https://doi.org/10.1029/2009JF001564, 2010.
Mugford, R. I. and Dowdeswell, J. A.: Modeling glacial meltwater plume dynamics and sedimentation in high-latitude fjords, J. Geophys. Res.-Earth, 116, F01023, https://doi.org/10.1029/2010JF001735, 2011.
Neder, C., Fofonova, V., Androsov, A., Kuznetov, I., Abele, D., Falk, U., Schloss, I. R., Sahade, R., and Jerosch, K.: Modelling suspended particulate matter dynamics at an Antarctic fjord impacted by glacier melt, J. Mar. Syst., 231, 103734, https://doi.org/10.1016/j.jmarsys.2022.103734, 2022.
Nowak, A., Hodgkins, R., Nikulina, A., Osuch, M., Wawrzyniak, T., Kavan, J., Łepkowska, E., Majerska, M., Romashova, K., Vasilevich, I., Sobota, I., and Rachlewicz, G.: From land to fjords: The review of Svalbard hydrology from 1970 to 2019 (SvalHydro), in: SESS report 2020 – The State of Environmental Science in Svalbard – an annual report, 176–201, Svalbard Integrated Arctic Earth Observing System, Zenodo, https://doi.org/10.5281/zenodo.4294063, 2021.
Oliver, H., Castelao, R. M., Wang, C., and Yager, P. L.: Meltwater-Enhanced Nutrient Export From Greenland's Glacial Fjords: A Sensitivity Analysis, J. Geophys. Res.-Ocean., 125, e2020JC016185, https://doi.org/10.1029/2020JC016185, 2020.
Osika, A., Jania, J., and Szafraniec, J. E.: Holocene ice-free strait followed by dynamic Neoglacial fluctuations: Hornsund, Svalbard, Holocene, 32, 664–679, https://doi.org/10.1177/09596836221088232, 2022.
Overeem, I., Hudson, B. D., Syvitski, J. P. M., Mikkelsen, A. B., Hasholt, B., Van Den Broeke, M. R., Noel, B. P. Y., and Morlighem, M.: Substantial export of suspended sediment to the global oceans from glacial erosion in Greenland, Nat. Geosci., 10, 859–863, https://doi.org/10.1038/NGEO3046, 2017.
Pasculli, L., Piermattei, V., Madonia, A., Bruzzone, G., Caccia, M., Ferretti, R., Odetti, A., and Marcelli, M.: New Cost-Effective Technologies Applied to the Study of the Glacier Melting Influence on Physical and Biological Processes in Kongsfjorden Area (Svalbard), J. Mar. Sci. Eng., 8, 593, https://doi.org/10.3390/jmse8080593, 2020.
Peck, L. S., Barnes, D. K. A., Cook, A. J., Fleming, A. H., and Clarke, A.: Negative feedback in the cold: Ice retreat produces new carbon sinks in Antarctica, Glob. Chang Biol., 16, 2614–2623, https://doi.org/10.1111/j.1365-2486.2009.02071.x, 2010.
Van Pelt, W., Pohjola, V., Pettersson, R., Marchenko, S., Kohler, J., Luks, B., Ove Hagen, J., Schuler, T. V., Dunse, T., Noël, B., and Reijmer, C.: A long-term dataset of climatic mass balance, snow conditions, and runoff in Svalbard (1957–2018), The Cryosphere, 13, 2259–2280, https://doi.org/10.5194/tc-13-2259-2019, 2019.
Pfannkuche, J. and Schmidt, A.: Determination of suspended particulate matter concentration from turbidity measurements: particle size effects and calibration procedures, Hydrol. Process., 17, 1951–1963, https://doi.org/10.1002/HYP.1220, 2003.
Pfeffer, W. T., Arendt, A. A., Bliss, A., Bolch, T., Cogley, J. G., Gardner, A. S., Hagen, J. O., Hock, R., Kaser, G., Kienholz, C., Miles, E. S., Moholdt, G., Mölg, N., Paul, F., Radić, V., Rastner, P., Raup, B. H., Rich, J., Sharp, M. J., Andreassen, L. M., Bajracharya, S., Barrand, N. E., Beedle, M. J., Berthier, E., Bhambri, R., Brown, I., Burgess, D. O., Burgess, E. W., Cawkwell, F., Chinn, T., Copland, L., Cullen, N. J., Davies, B., De Angelis, H., Fountain, A. G., Frey, H., Giffen, B. A., Glasser, N. F., Gurney, S. D., Hagg, W., Hall, D. K., Haritashya, U. K., Hartmann, G., Herreid, S., Howat, I., Jiskoot, H., Khromova, T. E., Klein, A., Kohler, J., König, M., Kriegel, D., Kutuzov, S., Lavrentiev, I., Le Bris, R., Li, X., Manley, W. F., Mayer, C., Menounos, B., Mercer, A., Mool, P., Negrete, A., Nosenko, G., Nuth, C., Osmonov, A., Pettersson, R., Racoviteanu, A., Ranzi, R., Sarikaya, M. A., Schneider, C., Sigurdsson, O., Sirguey, P., Stokes, C. R., Wheate, R., Wolken, G. J., Wu, L. Z., and Wyatt, F. R.: The randolph glacier inventory: A globally complete inventory of glaciers, J. Glaciol., 60, 537–552, https://doi.org/10.3189/2014JoG13J176, 2014.
Piwosz, K., Walkusz, W., Hapter, R., Wieczorek, P., Hop, H., and Wiktor, J.: Comparison of productivity and phytoplankton in a warm (Kongsfjorden) and a cold (Hornsund) Spitsbergen fjord in mid-summer 2002, Polar Biol., 32, 549–559, https://doi.org/10.1007/s00300-008-0549-2, 2009.
Platt, T., Harrison, W. G., Irwin, B., Horne, E. P., and Gallegos, C. L.: Photosynthesis and photoadaptation of marine phytoplankton in the arctic, Deep-Sea Res. Pt. A, 29, 1159–1170, https://doi.org/10.1016/0198-0149(82)90087-5, 1982.
Promińska, A., Cisek, M., and Walczowski, W.: Kongsfjorden and Hornsund hydrography – comparative study based on a multiyear survey in fjords of west Spitsbergen, Oceanologia, 59, 397–412, https://doi.org/10.1016/j.oceano.2017.07.003, 2017.
Reback, J., McKinney, W., jbrockmendel, Bossche, J. Van den, Augspurger, T., Cloud, P., gfyoung, Sinhrks, Klein, A., Hawkins, S., Roeschke, M., Tratner, J., She, C., Ayd, W., Petersen, T., MomIsBestFriend, Garcia, M., Schendel, J., Hayden, A., Jancauskas, V., Battiston, P., Saxton, D., Seabold, S., alimcmaster1, chris-b1, h-vetinari, Hoyer, S., Dong, K., Overmeire, W., and Winkel, M.: pandas-dev/pandas: Pandas 1.0.5, Zenodo, https://doi.org/10.5281/ZENODO.3898987, 2020.
Rignot, E., Box, J. E., Burgess, E., and Hanna, E.: Mass balance of the Greenland ice sheet from 1958 to 2007, Geophys. Res. Lett., 35, L20502, https://doi.org/10.1029/2008GL035417, 2008.
Riser, C. W., Wassmann, P., Reigstad, M., and Seuthe, L.: Vertical flux regulation by zooplankton in the northern Barents Sea during Arctic spring, Deep-Sea Res. Pt. II, 55, 2320–2329, https://doi.org/10.1016/j.dsr2.2008.05.006, 2008.
Ruben, M., Hefter, J., Schubotz, F., Geibert, W., Butzin, M., Gentz, T., Grotheer, H., Forwick, M., Szczuciński, W., and Mollenhauer, G.: Fossil organic carbon utilization in marine Arctic fjord sediments by subsurface micro-organisms, Nat. Geosci., 16, 625–630, https://doi.org/10.1038/s41561-023-01198-z, 2023.
Sagan, S. and Darecki, M.: Inherent optical properties and particulate matter distribution in summer season in waters of Hornsund and Kongsfjordenen, Spitsbergen, Oceanologia, 60, 65–75, https://doi.org/10.1016/j.oceano.2017.07.006, 2018.
Sahade, R., Lagger, C., Torre, L., Momo, F., Monien, P., Schloss, I., Barnes, D. K., Servetto, N., Tarantelli, S., Tatián, M., and Zamboni, N.: Climate change and glacier retreat drive shifts in an Antarctic benthic ecosystem, Sci. Adv., 1, e1500050, https://doi.org/10.1126/sciadv.1500050, 2015.
Schofield, O., Ducklow, H. W., Martinson, D. G., Meredith, M. P., Moline, M. A., and Fraser, W. R.: How do polar marine ecosystems respond to rapid climate change?, Science, 328, 1520–1523, https://doi.org/10.1126/science.1185779, 2010.
Simo-Matchim, A. G., Gosselin, M., Blais, M., Gratton, Y., and Tremblay, J. É.: Seasonal variations of phytoplankton dynamics in Nunatsiavut fjords (Labrador, Canada) and their relationships with environmental conditions, J. Mar. Syst., 156, 56–75, https://doi.org/10.1016/J.JMARSYS.2015.11.007, 2016.
Smith, R. W., Bianchi, T. S., Allison, M., Savage, C., and Galy, V.: High rates of organic carbon burial in fjord sediments globally, Nat. Geosci., 8, 450–453, https://doi.org/10.1038/NGEO2421, 2015.
Steiner, N., Deal, C., Lannuzel, D., Lavoie, D., Massonnet, F., Miller, L. A., Moreau, S., Popova, E., Stefels, J., and Tedesco, L.: What sea-ice biogeochemical modellers need from observers, Elementa, 2016, 000084, https://online.ucpress.edu/elementa/article/doi/10.12952/journal.elementa.000084/112911/What-sea-ice-biogeochemical-modellers-need-from (last access: 15 July 2024), 2016.
Strom, S. L., Fredrickson, K. A., and Bright, K. J.: Spring phytoplankton in the eastern coastal Gulf of Alaska: Photosynthesis and production during high and low bloom years, Deep-Sea Res. Pt. II, 132, 107–121, https://doi.org/10.1016/J.DSR2.2015.05.003, 2016.
Strzelecki, M. C., Szczuciński, W., Dominiczak, A., Zagórski, P., Dudek, J., and Knight, J.: New fjords, new coasts, new landscapes: The geomorphology of paraglacial coasts formed after recent glacier retreat in Brepollen (Hornsund, southern Svalbard), Earth Surf. Process. Landf., 45, 1325–1334, https://doi.org/10.1002/esp.4819, 2020.
Stuart, V., Sathyendranath, S., Head, E. J. H., Platt, T., Irwin, B., and Maass, H.: Bio-optical characteristics of diatom and prymnesiophyte populations in the Labrador Sea, Mar. Ecol. Prog. Ser., 201, 91–106, https://doi.org/10.3354/MEPS201091, 2000.
Sutherland, D. A., Straneo, F., Stenson, G. B., Davidson, F. J. M., Hammill, M. O., and Rosing-Asvid, A.: Atlantic water variability on the SE Greenland continental shelf and its relationship to SST and bathymetry, J. Geophys. Res.-Ocean., 118, 847–855, https://doi.org/10.1029/2012JC008354, 2013.
Syvitski, J., Vörösmarty, C. J., Kettner, A. J., and Green, P.: Impact of Humans on the Flux of Terrestrial Sediment to the Global Coastal Ocean, Science, 308, 376–380, https://doi.org/10.1126/science.1109454, 2005.
Syvitski, J., Ángel, J. R., Saito, Y., Overeem, I., Vörösmarty, C. J., Wang, H., and Olago, D.: Earth's sediment cycle during the Anthropocene, Nat. Rev. Earth Environ., 3, 179–196, https://doi.org/10.1038/s43017-021-00253-w, 2022.
Szczuciński, W., Zajaczkowski, M., and Scholten, J.: Sediment accumulation rates in subpolar fjords – Impact of post-Little Ice Age glaciers retreat, Billefjorden, Svalbard, Estuar. Coast Shelf Sci., 85, 345–356, https://doi.org/10.1016/j.ecss.2009.08.021, 2009.
Szeligowska, M., Trudnowska, E., Boehnke, R., Dąbrowska, A. M., Dragańska-Deja, K., Deja, K., Darecki, M., and Błachowiak-Samołyk, K.: The interplay between plankton and particles in the Isfjorden waters influenced by marine- and land-terminating glaciers, Sci. Total Environ., 780, 146491, https://doi.org/10.1016/j.scitotenv.2021.146491, 2021.
Szeligowska, M., Trudnowska, E., Boehnke, R., and Błachowiak-Samołyk, K.: Dark plumes of glacial meltwater affect vertical distribution of zooplankton in the Arctic, Sci. Rep., 12, 17953, https://doi.org/10.1038/s41598-022-22475-8, 2022.
Szeligowska, M.: Arctic Sea and Ice Surface Temperature, figshare [data set], https://doi.org/10.6084/m9.figshare.24142965.v1, 2023.
Szeligowska, M., Déborah, B., Przyborska, A., Moskalik, M., Moreno, B., Trudnowska, E., et al.: Results of GOTM-ECOSMO-E2E-Polar in Hornsund (SPM scenario), figshare [data set], https://doi.org/10.6084/m9.figshare.24143013.v5, 2023a.
Szeligowska, M., Déborah, B., Przyborska, A., Moskalik, M., Moreno, B., Trudnowska, E., et al.: Results of GOTM-ECOSMO-E2E-Polar in Hornsund (noSPM scenario), figshare [data set], https://doi.org/10.6084/m9.figshare.24142992.v2, 2023b.
Torsvik, T., Albretsen, J., Sundfjord, A., Kohler, J., Sandvik, A. D., Skarðhamar, J., Lindbäck, K., and Everett, A.: Impact of tidewater glacier retreat on the fjord system: Modeling present and future circulation in Kongsfjorden, Svalbard, Estuar. Coast Shelf Sci., 220, 152–165, https://doi.org/10.1016/j.ecss.2019.02.005, 2019.
van De Poll, W. H., Kulk, G., Rozema, P. D., Brussaard, C. P. D., Visser, R. J. W., and Buma, A. G. J.: Contrasting glacial meltwater effects on post-bloom phytoplankton on temporal and spatial scales in Kongsfjorden, Spitsbergen, Elementa, 6, 50, https://doi.org/10.1525/ELEMENTA.307/112827, 2018.
Van Rossum, G. and Drake, F. L.: Python 3 Reference Manual, CreateSpace100 Enterprise Way, Suite A200Scotts ValleyCA, ISBN: 978-1-4414-1269-0, 242 pp., 2009.
Vonnahme, T. R., Persson, E., Dietrich, U., Hejdukova, E., Dybwad, C., Elster, J., Chierici, M., and Gradinger, R.: Early spring subglacial discharge plumes fuel under-ice primary production at a Svalbard tidewater glacier, The Cryosphere, 15, 2083–2107, https://doi.org/10.5194/tc-15-2083-2021, 2021.
Wadham, J. L., Hawkings, J. R., Tarasov, L., Gregoire, L. J., Spencer, R. G. M., Gutjahr, M., Ridgwell, A., and Kohfeld, K. E.: Ice sheets matter for the global carbon cycle, Nat. Commun., 10, 3567, https://doi.org/10.1038/s41467-019-11394-4, 2019.
Walch, D. M. R., Singh, R. K., Søreide, J. E., Lantuit, H., and Poste, A.: Spatio-Temporal Variability of Suspended Particulate Matter in a High-Arctic Estuary (Adventfjorden, Svalbard) Using Sentinel-2 Time-Series, Remote Sens., 14, 3123, https://doi.org/10.3390/rs14133123, 2022.
Wawrzyniak, T. and Osuch, M.: A consistent High Arctic climatological dataset (1979–2018) of the Polish Polar Station Hornsund (SW Spitsbergen, Svalbard), PANGAEA [data set], https://doi.org/10.1594/PANGAEA.909042, 2019.
Wawrzyniak, T. and Osuch, M.: A 40-year High Arctic climatological dataset of the Polish Polar Station Hornsund (SW Spitsbergen, Svalbard), Earth Syst. Sci. Data, 12, 805–815, https://doi.org/10.5194/essd-12-805-2020, 2020.
Węsławski, J. M., Buchholz, F., Głuchowska, M., and Weydmann, A.: Ecosystem maturation follows the warming of the Arctic fjords, Oceanologia, 59, 592–602, https://doi.org/10.1016/j.oceano.2017.02.002, 2017.
Włodarska-Kowalczuk, M., Mazurkiewicz, M., Górska, B., Michel, L. N., Jankowska, E., and Zaborska, A.: Organic Carbon Origin, Benthic Faunal Consumption, and Burial in Sediments of Northern Atlantic and Arctic Fjords (60–81° N), J. Geophys. Res.-Biogeo., 124, 3737–3751, https://doi.org/10.1029/2019JG005140, 2019.
Wölfl, A. C., Lim, C. H., Hass, H. C., Lindhorst, S., Tosonotto, G., Lettmann, K. A., Kuhn, G., Wolff, J. O., and Abele, D.: Distribution and characteristics of marine habitats in a subpolar bay based on hydroacoustics and bed shear stress estimates – Potter Cove, King George Island, Antarctica, Geo.-Mar. Lett., 34, 435–446, https://doi.org/10.1007/s00367-014-0375-1, 2014.
Wulder, M. A., Roy, D. P., Radeloff, V. C., Loveland, T. R., Anderson, M. C., Johnson, D. M., Healey, S., Zhu, Z., Scambos, T. A., Pahlevan, N., and Hansen, M.: Fifty years of Landsat science and impacts, Remote Sens. Environ., 280, 113195, 2022.
Yumruktepe, V. Ç., Samuelsen, A., and Daewel, U.: ECOSMO II(CHL): a marine biogeochemical model for the North Atlantic and the Arctic, Geosci. Model Dev., 15, 3901–3921, https://doi.org/10.5194/gmd-15-3901-2022, 2022.
Zaborska, A., Włodarska-Kowalczuk, M., Legeżyńska, J., Jankowska, E., Winogradow, A., and Deja, K.: Sedimentary organic matter sources, benthic consumption and burial in west Spitsbergen fjords – Signs of maturing of Arctic fjordic systems?, J. Mar. Syst., 180, 112–123, https://doi.org/10.1016/j.jmarsys.2016.11.005, 2018.
Zwerschke, N., Sands, C. J., Roman-Gonzalez, A., Barnes, D. K. A., Guzzi, A., Jenkins, S., Muñoz-Ramírez, C., and Scourse, J.: Quantification of blue carbon pathways contributing to negative feedback on climate change following glacier retreat in West Antarctic fjords, Glob. Chang Biol., 28, 8–20, https://doi.org/10.1111/gcb.15898, 2022.