the Creative Commons Attribution 4.0 License.
the Creative Commons Attribution 4.0 License.
 | 26 Aug 2024
Implications of climate and litter quality for simulations of litterbag decomposition at high latitudes
Inge Althuizen
Hui Tang
Sonya Geange
Eva Lieungh
Vigdis Vandvik
Terje Koren Berntsen
Litter decomposition is a vital part of the carbon cycle and is thoroughly studied both in the field and with models. Although temporally and spatially limited, litterbag decomposition experiments are often used to calibrate and evaluate soil models, coupled to land models, that are intended for use on large scales. We used the microbially explicit soil decomposition model MIMICS+ to replicate two high-latitude litterbag decomposition experiments of different spatial and temporal scales. We investigated how well the model represented observed mass loss in terms of the controlling factors of climate and litter quality and their relative importance with time. In addition to default model forcing, we used measured and site-specific model-derived microclimatic variables (soil moisture and temperature), hypothesizing that this would improve model results. We found that MIMICS+ represented mass loss after 1, 3, and 6 years well across a climatic gradient of Canadian sites but had more variable results for 1-year mass loss across a climate grid in southern Norway. In terms of litter quality, the litter metabolic fraction had more influence on modeled mass loss than the carbon-to-nitrogen ratio of the litter. Using alternative microclimate sources led to up to 23 % more mass remaining and down to 22 % less mass remaining compared to the simulations using default model inputs. None of the input alternatives significantly improved results compared to using the default model setup. We discuss possible causes for our findings and suggest measures to better utilize short-term field experiments to inform microbially explicit decomposition models.
- Article
(11265 KB) - Full-text XML
- BibTeX
- EndNote


During microbial decomposition of organic matter, carbon is distributed between soil reservoirs and the atmosphere, giving soil microbes a crucial role in the terrestrial carbon cycle. In a world with increasing atmospheric CO2 concentrations, net primary production and soil conditions will change, ultimately determining if soils act as a source or a sink of atmospheric carbon. The large amount of carbon stored in high-latitude and alpine soils (Sørensen et al., 2018; Crowther et al., 2019), together with rapidly increasing temperatures (Johannessen et al., 2016), makes it extra important to understand these relationships in these ecosystems (IPCC, 2023). Reducing uncertainties linked to the representation of decomposition processes in models is key to more confidently projecting future climate scenarios (Sulman et al., 2018).
Broadly speaking, decomposition rates are controlled by three main factors: substrate quality, microbial community properties, and the physical environment (Aerts, 1997). The relative importance of climate and litter quality to decomposition rates has recently been debated (Bradford et al., 2016). While macroclimate may generally appear to be the most influential mechanism, Joly et al. (2023) illustrated how macroclimate affects litter quality through plant composition, which can further influence decomposer communities and thus decomposition rates. It is therefore necessary to consider these factors in the context of each other and not as independent mechanisms. Decomposition processes take place in stages based on the chemical composition of the remaining substrate at any time (Chapin et al., 2011). Throughout these different stages, the importance of the above-mentioned controls varies, and the duration of observational experiments is therefore important to consider.
Litterbag experiments are the most commonly used technique to determine decomposition rates in the field (Kurz-Besson et al., 2005; Halbritter et al., 2020). Bags containing native or standard litter are either buried or placed on the soil surface and are collected at pre-determined time intervals. From the mass loss, one can estimate decomposition rates and investigate relationships related to climate and litter quality (Adair et al., 2008). Litterbag experiments often cover limited spatial and temporal scales and cannot be expected to cover all phases of decomposition. Some long-term (≥10 years) experiments exist (Trofymow and the CIDET Working Group, 1998; Harmon et al., 2009), and methods using standard litter have been proposed to overcome the aforementioned issues (Keuskamp et al., 2013; Sarneel et al., 2024). Findings from the Canadian Intersite Decomposition Experiment (CIDET) 3 and 6 years after burial suggest that large-scale climate (mean annual temperature and summer precipitation) and the ratio of recalcitrant organic compounds (acid-unhydrolyzable residue (AUR)) to nitrogen are dominating controls on decomposition rates for sites covering a broad climatic gradient in Canada (Moore et al., 1999; Trofymow et al., 2002). For first-year decomposition, the initial chemical composition of the added litter was a major controlling factor (Preston and Trofymow, 2000), indicating that the importance of climate increases, whereas the initial litter composition becomes less important with time. Generally, decomposition rates increase with temperature and precipitation in temperature-limited systems (Aerts, 2006). Yet, some studies have found negative correlations between precipitation and decomposition rates – for example, in very wet regions (Althuizen et al., 2018; Djukic et al., 2018; Sierra et al., 2017; Schuur, 2001). These contrasting findings from observational studies illustrate the dual role of soil moisture, where decomposition is limited in both wet (anaerobic) and dry (or freezing) conditions, with an optimum somewhere in between. To better understand these mechanisms, soil decomposition models are valuable tools.
The new generation of soil carbon models includes an explicit representation of microbial activity (Chandel et al., 2023). By incorporating the functions of separate microbial groups, it is possible to examine the influence of various factors on the decomposition rates and, ultimately, on the carbon budget. In these models, decomposition rates are usually represented as functions of temperature, moisture, and substrate properties (Sierra et al., 2015; Chandel et al., 2023). The representation of microclimate (soil temperature and moisture) in soil models can come directly from observations or be derived from other models. Microclimate simulated by land surface models depends on the representation of above-ground vegetation, soil properties, and atmospheric forcing. When using litterbag studies to validate and evaluate soil carbon models, the modeled microclimate should be representative of the actual environment in which the study takes place, especially for short-term experiments where local conditions may have a relatively larger influence compared to large-scale climatic patterns. Few studies have investigated variability related to the representation of soil microclimate, which is of interest as efforts are being made to incorporate microbially explicit soil models into land surface models for use in Earth system models (ESMs, Chandel et al., 2023).
Aas et al. (2024) presented the soil decomposition model MIMICS+, which provided reasonable carbon and nitrogen stock values compared to a database of Norwegian forest soil profiles. Here, we use MIMICS+ to investigate the mechanisms at play during litterbag decomposition using data from two experiments; CIDET (Trofymow and the CIDET Working Group, 1998) and a short-term experiment performed at the Vestland Climate Grid (VCG) in Norway (Vandvik et al., 2022; Telford et al., 2023). These experiments were chosen as they were found to be suitable for testing decomposition processes in high-latitude ecosystems. We test the following hypotheses: (1) MIMICS+ adequately captures observed patterns in mass loss in terms of climate and litter quality, (2) MIMICS+ includes the processes found to be governing litter mass loss on short (12 months) and longer (6 years) timescales and captures the evolution of dominating controls through the stages of decomposition, and (3) an improved microclimate from observations or site-specific land model configurations improves model predictions of litterbag mass loss.
2.1 The Canadian Intersite Decomposition Experiment
The CIDET study is a long-term litter decomposition experiment covering major ecoclimatic regions in Canada (Trofymow and the CIDET Working Group, 1998). A total of 11 litterbags (20×20 cm, with a mesh size of 0.25×0.5 mm), each containing 10 g of one native litter type (10 litter types and 1 wood block), were placed on the forest floor at 21 sites during autumn 1992. Information about the litter carbon : nitrogen (C:N) ratio and chemical recalcitrance was known. Litterbags were then collected yearly, dried, and analyzed for mass loss. In this study, we use reported mass loss across the 11 litter types after 3 (Moore et al., 1999) and 6 years (Trofymow et al., 2002) for nine of the sites (see Fig. A1b). In addition, we use reported 1-year mass loss across all 11 litter types for three sites (Gillam – GIL, Morgan Arb. – MAR, Port McNeill – PMC) from Moore et al. (2017) and 1-year mass loss across the 10 foliar litter types for all nine sites from the data set provided by Viskari et al. (2021). We chose sites categorized as subarctic or boreal and wet and mild sites in the cordilleran ecoclimatic region because of their large-scale climate resemblance to the VCG sites (Sect. 2.2). See Tables A1 and A2 for details about the CIDET sites and litter types, respectively. Data from the CIDET study are used to examine the overall model performance against a well-established, relatively long-term experiment (hypothesis 1).
2.2 The Vestland Climate Grid
The VCG is a set of 12 semi-natural grasslands in southern Norway that are situated along natural temperature and precipitation gradients (Klanderud et al., 2015; Vandvik et al., 2020). The grid covers three temperature levels, with growing-season (June–September) temperatures of 6.5 °C (alpine, ALP), 8.5 °C (sub-alpine, SUB), and 10.5 °C (boreal, BOR), and four annual precipitation levels (ca. 600, 1200, 2000, and 2700 mm); see Table A3 and Fig. A1c.
In this study, we use data from the control litterbags of a transplant study at the VCG (Telford et al., 2023; Vandvik et al., 2022). In the control treatment, native graminoid litter was collected from each site and analyzed for carbon and nitrogen content, following which it was put into litterbags (10×10 cm, mesh size 0.28 mm) and buried at approximately 10 cm depth at its place of origin in 2016. The bags were buried as soon as the snow had melted and were collected 1, 2, 3, and 12 months after burial. After collection, the bags were cleaned, dried, and analyzed for mass loss. As the bags were added in early summer and not in fall, the experiment does not intend to replicate a realistic litterfall event but rather aims to give more general insights into decomposition rates in semi-natural grasslands and into the effect of climatic conditions. Soil temperature and moisture were recorded with data loggers at approximately 5 cm depth throughout the experiment period (Vandvik et al., 2022; Telford et al., 2023). Unlike the CIDET sites, the sites in the VCG were not chosen to be ideal for litterbag experiments but rather to study a range of ecological processes across gradients in temperature and precipitation. Therefore, the VCG data provide a basis for a more experimental investigation into local conditions and their impact on decomposition mechanisms (hypotheses 2 and 3).
2.3 Description of the soil decomposition model MIMICS+
The litterbag experiments were replicated with the soil decomposition model MIMICS+ (Aas et al., 2024). MIMICS+ is a vertically resolved, microbially explicit model which represents the activity of saprotrophic bacteria and fungi (microbial decomposers) by means of temperature- and moisture-dependent reverse Michaelis–Menten kinetics (rMMK) (Moorhead and Weintraub, 2018). Vertical soil layers follow the same structure as the Community Land Model (CLM), with increasing layer thicknesses with depth (Lawrence et al., 2019). Litterfall, mycorrhizal carbon allocation, and nitrogen deposition, in addition to soil temperature, moisture, and clay content, are required to run MIMICS+. We used the CLM in single-site mode to produce this information (Sect. 2.4). For the VCG sites, we also used alternative representations of soil temperature and moisture for the years 2016–2017 when the litterbag experiment was performed (Sect. 2.5). Here, we provide an overview of processes and assumptions in MIMICS+ that are relevant for litter decomposition; a more detailed model description can be found in Aas et al. (2024), and an illustration of the model can be found in Appendix B. In this study, MIMICS+ v1.0 is used, which is calibrated and validated against a database of carbon and nitrogen stocks in soil profiles from forested sites in Norway (Strand et al., 2016).
In MIMICS+, decomposition rates are calculated based on biotic and abiotic conditions within each soil layer. The general form of the rMMK equation for soil layer j, where F is the decomposition rate () of the saprotrophic group SAP (bacteria or fungi) decomposing the substrate SUB (both prognostic variables with units gCm−3), is
where T and Θ represent soil temperature and moisture, respectively, and Vmax and Km are rMMK parameters, namely the maximum reaction rate and half-saturation constant, respectively. Vmax and Km are exponential functions of temperature following German et al. (2012), in the same manner as other MIMICS-based models (e.g., Wieder et al., 2015; Kyker-Snowman et al., 2020). Decomposition rates increase with temperature, but the effect is dampened by the fact that both Vmax (in the numerator) and Km (in the denominator) increase with temperature. Soil temperature also affects saprotrophic lifetimes by reducing turnover rates to a minimum when soil temperatures are below zero. The maximum reaction rate (Vmax) is also affected by soil moisture according to a bell-shaped scaling function (f(Θ)) with a value between 0.05–1 (Wieder et al., 2017; Sulman et al., 2014). This modifier limits decomposition under both very wet (oxygen limitation) and very dry conditions and has a maximum value (no moisture limitation on decomposition) when the fraction of soil water saturation is 0.55. In conditions where a high fraction of the soil water is present in ice form, the soil will be perceived as dry because the frozen water is unavailable for the microbes. See Appendix B for details about the decomposition equations and climatic modifiers.
The quality of the incoming litter affects model decomposition in two ways: through the C : N ratio and through the chemical recalcitrance. The C : N ratio determines how much of the carbon from the substrate the saprotrophs can use for growth and how much is respired to match the C : N requirement of the microbial pools (assumed to be CNb=5 for bacteria and CNf=8 for fungi). Saprotrophs decomposing substrates with high C : N ratios will build less biomass, in turn slowing down decomposition rates (see Eq. 1), compared to saprotrophs in low-C : N environments. The chemical recalcitrance of incoming litter determines the distribution between the two model litter pools, which have different base decomposition rates (see Fig. B1). The metabolic litter pool is assumed to be relatively labile and easily decomposable, while the structural litter pool is recalcitrant and rich in lignin and is therefore slower to decompose. The metabolic fraction, fmet, is a function of the lignin : N ratio of the incoming litter and determines the partitioning between the two pools. When using litter forcing from the CLM, the lignin : N ratio is derived based on the plant-functional-type (PFT) composition in the grid cell. For each PFT, there is a prescribed lignin : N ratio; hence, the PFT composition determines the overall lignin : N ratio of the litter (see Appendix B3). The PFT distributions used at the sites in this study are given in Appendix D.
According to Angst et al. (2021), a substantial portion of soil organic matter comes directly from plants, omitting the microbial pathway. Therefore, half of the incoming litter is directed to soil organic matter pools directly, some of which is meant to represent leaching of easily soluble compounds. Hence, leaching is implicitly represented in the model as a simplified process affecting the incoming litter and not as an explicit sink for the litter pools.
In addition to saprotrophic decomposers, MIMICS+ also includes two explicit mycorrhizal pools representing ectomycorrhiza and arbuscular mycorrhiza. In the model, none of the mycorrhizal pools interact directly with the litter pools (see Fig. B1). Therefore, the effect of mycorrhiza in the model simulations is mainly to act as a competitor for the same available nitrogen as the saprotrophs, possibly affecting the decomposition rates through reduced efficiency. Any direct interaction between mycorrhiza and the litterbags, e.g., ectomycorrhizal mining, will thus not be captured by the model.
2.4 Generation of forcing data with the CLM
The input to MIMICS+ was provided by running a series of different simulations with the CLM (tag: ctsm5.1.dev113-6-gd2cf309) and by reading monthly or daily records of variables from the CLM history files (Fig. 1). The main configuration used the CLM with fixed PFTs but with active biogeochemistry (BGC) and prognostic vegetation state variables (leaf area index and canopy height). These simulations represent a configuration typically used for global ESM simulations (Lawrence et al., 2019). To further explore the sensitivities of MIMICS+ to the uncertainties of its input data, an alternative configuration of the CLM with prescribed leaf area index based on satellite remote sensing data (satellite phenology, SP) and no active biogeochemistry is also adopted.
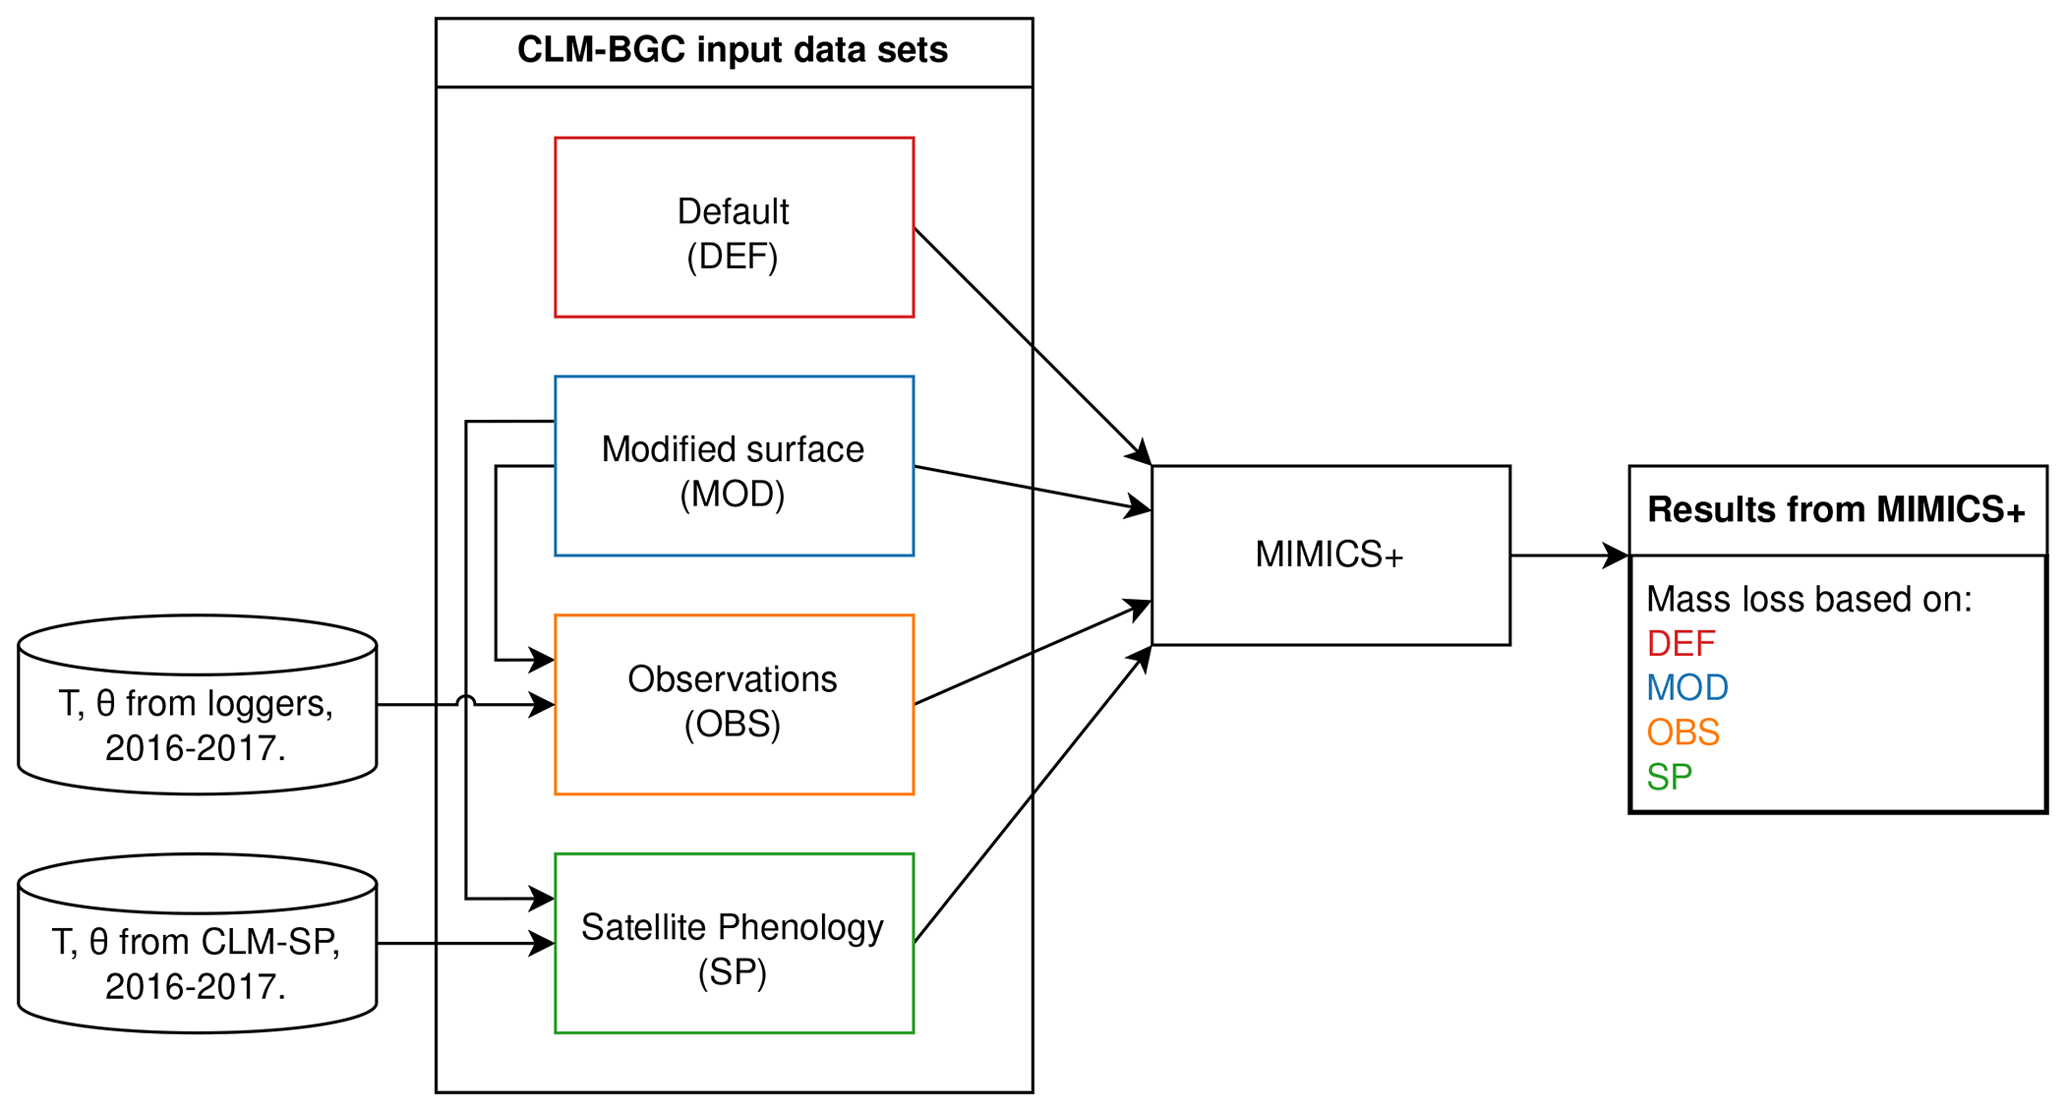
Figure 1Illustration of the simulation setup using different input data for the VCG sites. All input data sets are based on CLM–BGC simulations, with either default surface parameters (DEF) or modified surface parameters (MOD). In the OBS and SP data sets, soil temperature (T) and soil moisture (Θ) for the years 2016–2017 are replaced with data from loggers and a CLM–SP simulation, respectively. Further details about the data sets are found in the main text (Sect. 2.4, 2.5).
For all sites (9 CIDET sites and 12 VCG sites), the CLM was run in single-site mode using default surface data (PFT distribution, soil texture, slope, and depth; see details in Tables D1 and D2). Following the standard CLM spin-up protocol (Lawrence et al., 2019), the model was spun up by cycling 20 years (1901–1920) of atmospheric forcing based on the Global Soil Wetness Project v3 (GSWPv3, https://hydro.iis.u-tokyo.ac.jp/GSWP3, last access: 18 August 2024), with the first 300 years in “accelerated-spin-up” mode and then with regular spin-up until the change between two consecutive time cycles was less than 1 %, which took between 900–2000 years. The historical period was run with GSWPv3 forcing until the end of 2014 for the CIDET sites (with a sampling period of 1992–1998). For the VCG sites (sampled during 2016–2017), the historical period from 1850 to 1994 was run with GSWPv3 forcing, while the remaining historical period (1995–2018) was forced with the regional reanalysis data set COSMO-REA6 which has a resolution of 6 km (Bollmeyer et al., 2015). Since the COSMO-REA6 data were only available up to and including 2018, we could not extend the simulation further. These simulations will be referred to as DEF (red box in Fig. 1).
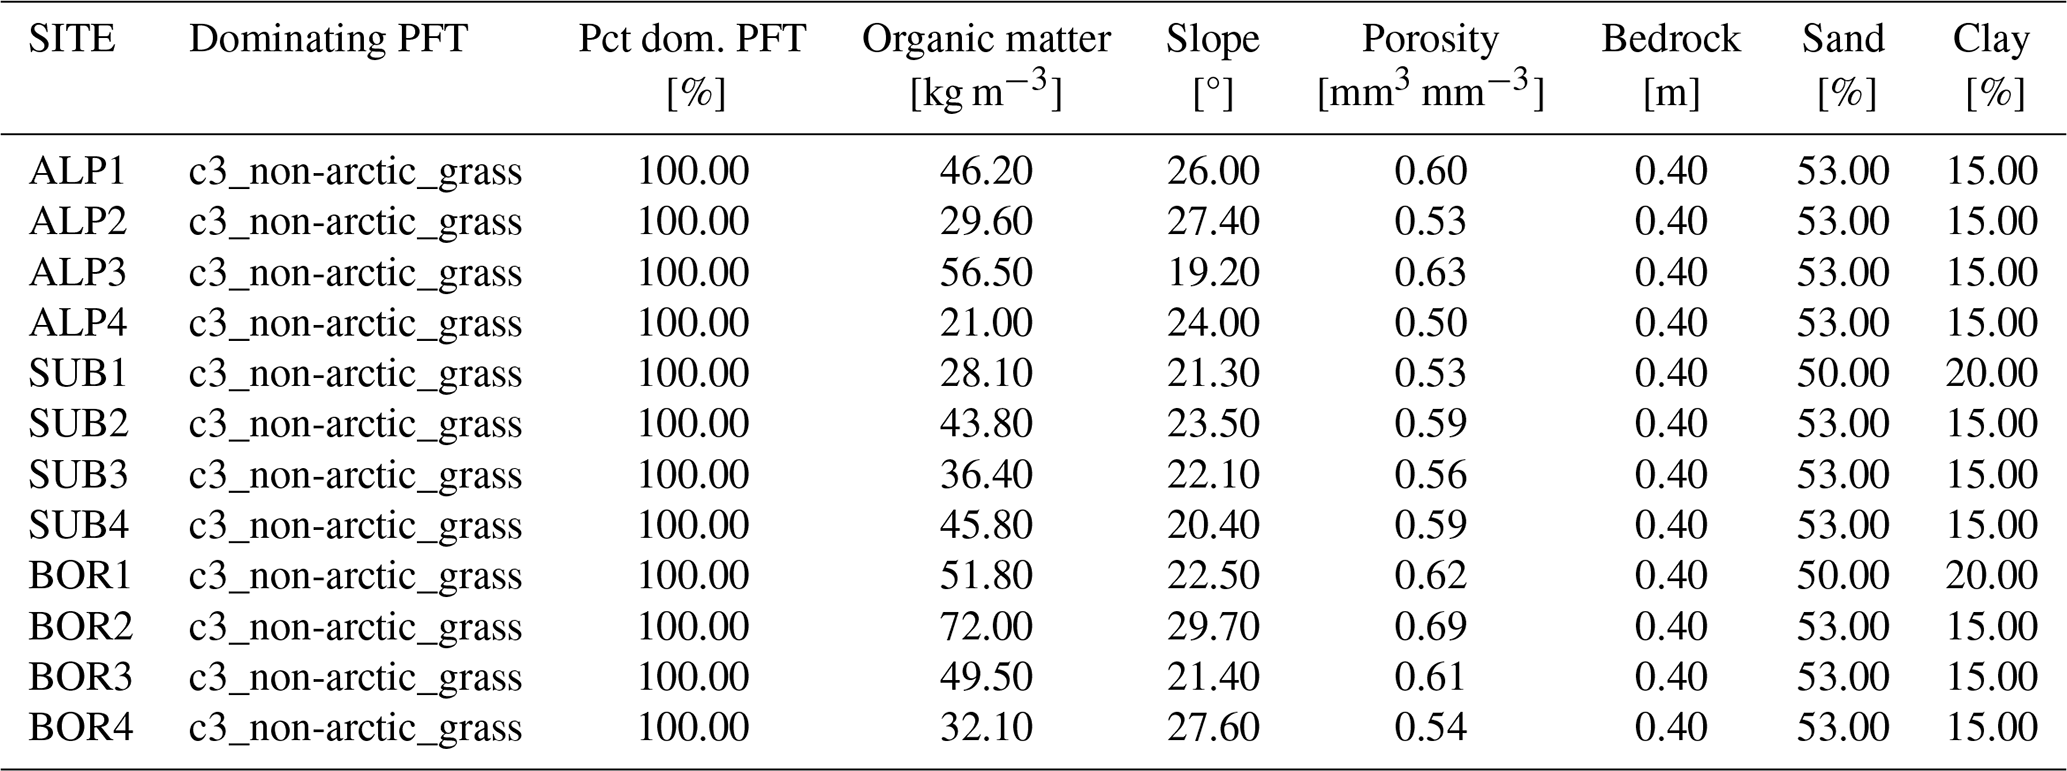
For the 12 VCG sites, we also ran simulations with surface data modified to match observations of soil properties from the sites. These runs used 100 % natural vegetation of the PFT type “C3 grass”, which was determined to best represent actual vegetation. As the measured soil depths were shallow at <20 cm, the minimum soil depth allowed by the CLM (40 cm) was used in all simulations. Based on available observations, we modified the organic fraction and surface slope parameters in the CLM. Using the locally observed slope is particularly important for accurate representation of soil water. Organic matter content affects soil thermal and hydrologic properties (for instance saturated water content). The CLM simulations using these modified, site-specific surface parameters will be referred to as MOD (blue box in Fig. 1, parameter values in Table D3).
2.5 Microclimate modifications
To test the effect of different sources of soil microclimate on decomposition, we modified the variables of soil temperature, soil liquid water, and soil ice water in the MOD files for the years 2016–2017, when the VCG experiment took place. The saturated water content (porosity) was kept the same as in the MOD simulations since we did not have suitable measurements. However, in the CLM, the saturated water content is determined by organic matter and sand content; thus, using the MOD simulations with observed organic matter content partly takes the local environment into consideration. The microclimate time series are presented along with the results in Sect. 3.4.
To create alternative forcing based on observations, soil temperature and moisture in the soil layer where the litter was added and in the layers directly above and below (three layers, covering soil depths 2–20 cm) were replaced by daily means of observed values from data loggers at approximately 5 cm depth. In the case of missing observations, the monthly mean (based on measurements between 2008–2023) of the relevant month was used. Observed soil moisture was reported as volumetric soil water content (m3 m−3), while the model moisture modifier requires a division between liquid water and ice water (see Appendix B). When the observed temperature was above freezing, we assumed all soil water to be in liquid form, while the fractions of liquid and frozen water from the original CLM simulations were used when observed temperature was below freezing. The CLM uses an algorithm from Niu and Yang (2006) to determine the super-cooled liquid fraction in soils with temperatures below zero. Input data using observed microclimate will be referred to as OBS (orange box in Fig. 1).
The CLM satellite phenology (SP) simulations were created in connection to a model study of mosses at the VCG sites (Tang et al., 2024). The soil depth, organic matter, and slope values for these simulations were modified in the same manner as described above, while the PFT was 100 % C3 arctic grass. The use of satellite phenology leads to different onsets of spring and fall conditions, and the prescribed leaf area index and canopy height affect insulation and, thereby, soil microclimate, making them different from the BGC simulations. For creating an alternative forcing based on the SP simulations, daily soil temperature and moisture from these history files were used (for the entire soil column). Note that, since we were interested in the isolated effect of soil microclimate, we did not change litter input, drainage, etc. for the alternative forcing. These input data will be referred to as SP (green box in Fig. 1).
The MIMICS+ results based on the four different input data sets (DEF, MOD, OBS, and SP) are used to investigate how microclimate representation affects modeled predictions of litterbag mass loss (hypothesis 3).
2.6 Litterbag experiments in MIMICS+
MIMICS+ was spun up to equilibrium from arbitrary initial conditions by recycling input from the CLM simulations (DEF or MOD) for the years 1850–1869 for 1000 years. Then, the historical period was run using forcing data from the CLM simulations described above. The MIMICS+ simulations using MOD, OBS, or SP input data were continued from the spin-up based on MOD, while the MIMICS+ simulations using DEF were continued from the DEF spin-up. This gave initial decomposer biomass values between 7–25 gCm−2 at the sites, accounting for 0.4 %–1.2 % of the total soil carbon in the layer at the time the litterbags were added.
The modeled litterbags consisted of 10 gC and were added as a pulse to the first soil layer (covering a depth of 0–2 cm) and to the third layer (covering a depth of 6–12 cm) of a soil column with an assumed area of 1 m2 for the CIDET simulations and for the VCG sites, respectively. This corresponds to an initial perturbation in the litter layer carbon concentration of 500 and 170 gCm−3, respectively. We assumed that the litterbag carbon stayed in the same soil layer throughout the experiment (except for what is lost through respiration) and calculated the carbon mass loss by subtracting litter values in a control simulation (without added litter) from litter values in the experiment simulations. Since the litterbags were cleaned and dried after collection and before weighing, we assume that there are minor contributions from soil organic matter and microbial biomass to the collected litterbags and therefore only consider mass in the model litter pools.
For the CIDET sites, simulations were run for all 11 litter types, which differed in terms of C : N ratio and metabolic fraction (see Table A2). The metabolic fraction (fmet) was calculated using published measurements of the lignin : N ratio with the same method as that used for regular input litter, described in Appendix B. The litterbags were added on 10 October 1992 at all CIDET sites. As the litter in the VCG experiment came from graminoid species only, it was assumed to be relatively labile. The modeled litterbags were therefore added to the metabolic litter pool only. The N content was determined using measured C : N ratios of the collected litter at each site (Table A3). The litterbags for the VCG sites were added on the dates reported in Telford et al. (2023), between 18 May and 30 June 2016 for the 12 sites.
3.1 CIDET site simulations
Generally, MIMICS+ replicated the mass loss of the different litter types well for the CIDET sites (Fig. C5), and these were within the observed standard deviations across all litter types for 19 of the 27 measurement points. The model replicates 1-year mass loss well for most sites but underestimates 1-year mass loss at the two warmest sites (PMC and Shawnigan Lake – SHL). Contrarily, the modeled mass losses after 3 and 6 years match better with the observations at the warmer sites while being overestimated at the colder sites. Compared to the standard deviation of the observations, the spread between model simulations is small. The spread between simulations at sites with different macroclimates is larger than the spread between simulations of different litter types, indicating that climatic conditions dominate mass loss rates compared to litter quality in the model simulations. Low-quality litter, both in terms of C : N ratio and chemical recalcitrance, generally decomposes slower than high-quality litter in the model, and the ranking among the litter types does not change throughout the simulations. The spread between simulations of different litter types tends to increase with temperature, indicating that litter quality is more important for litter mass loss in warmer regions.
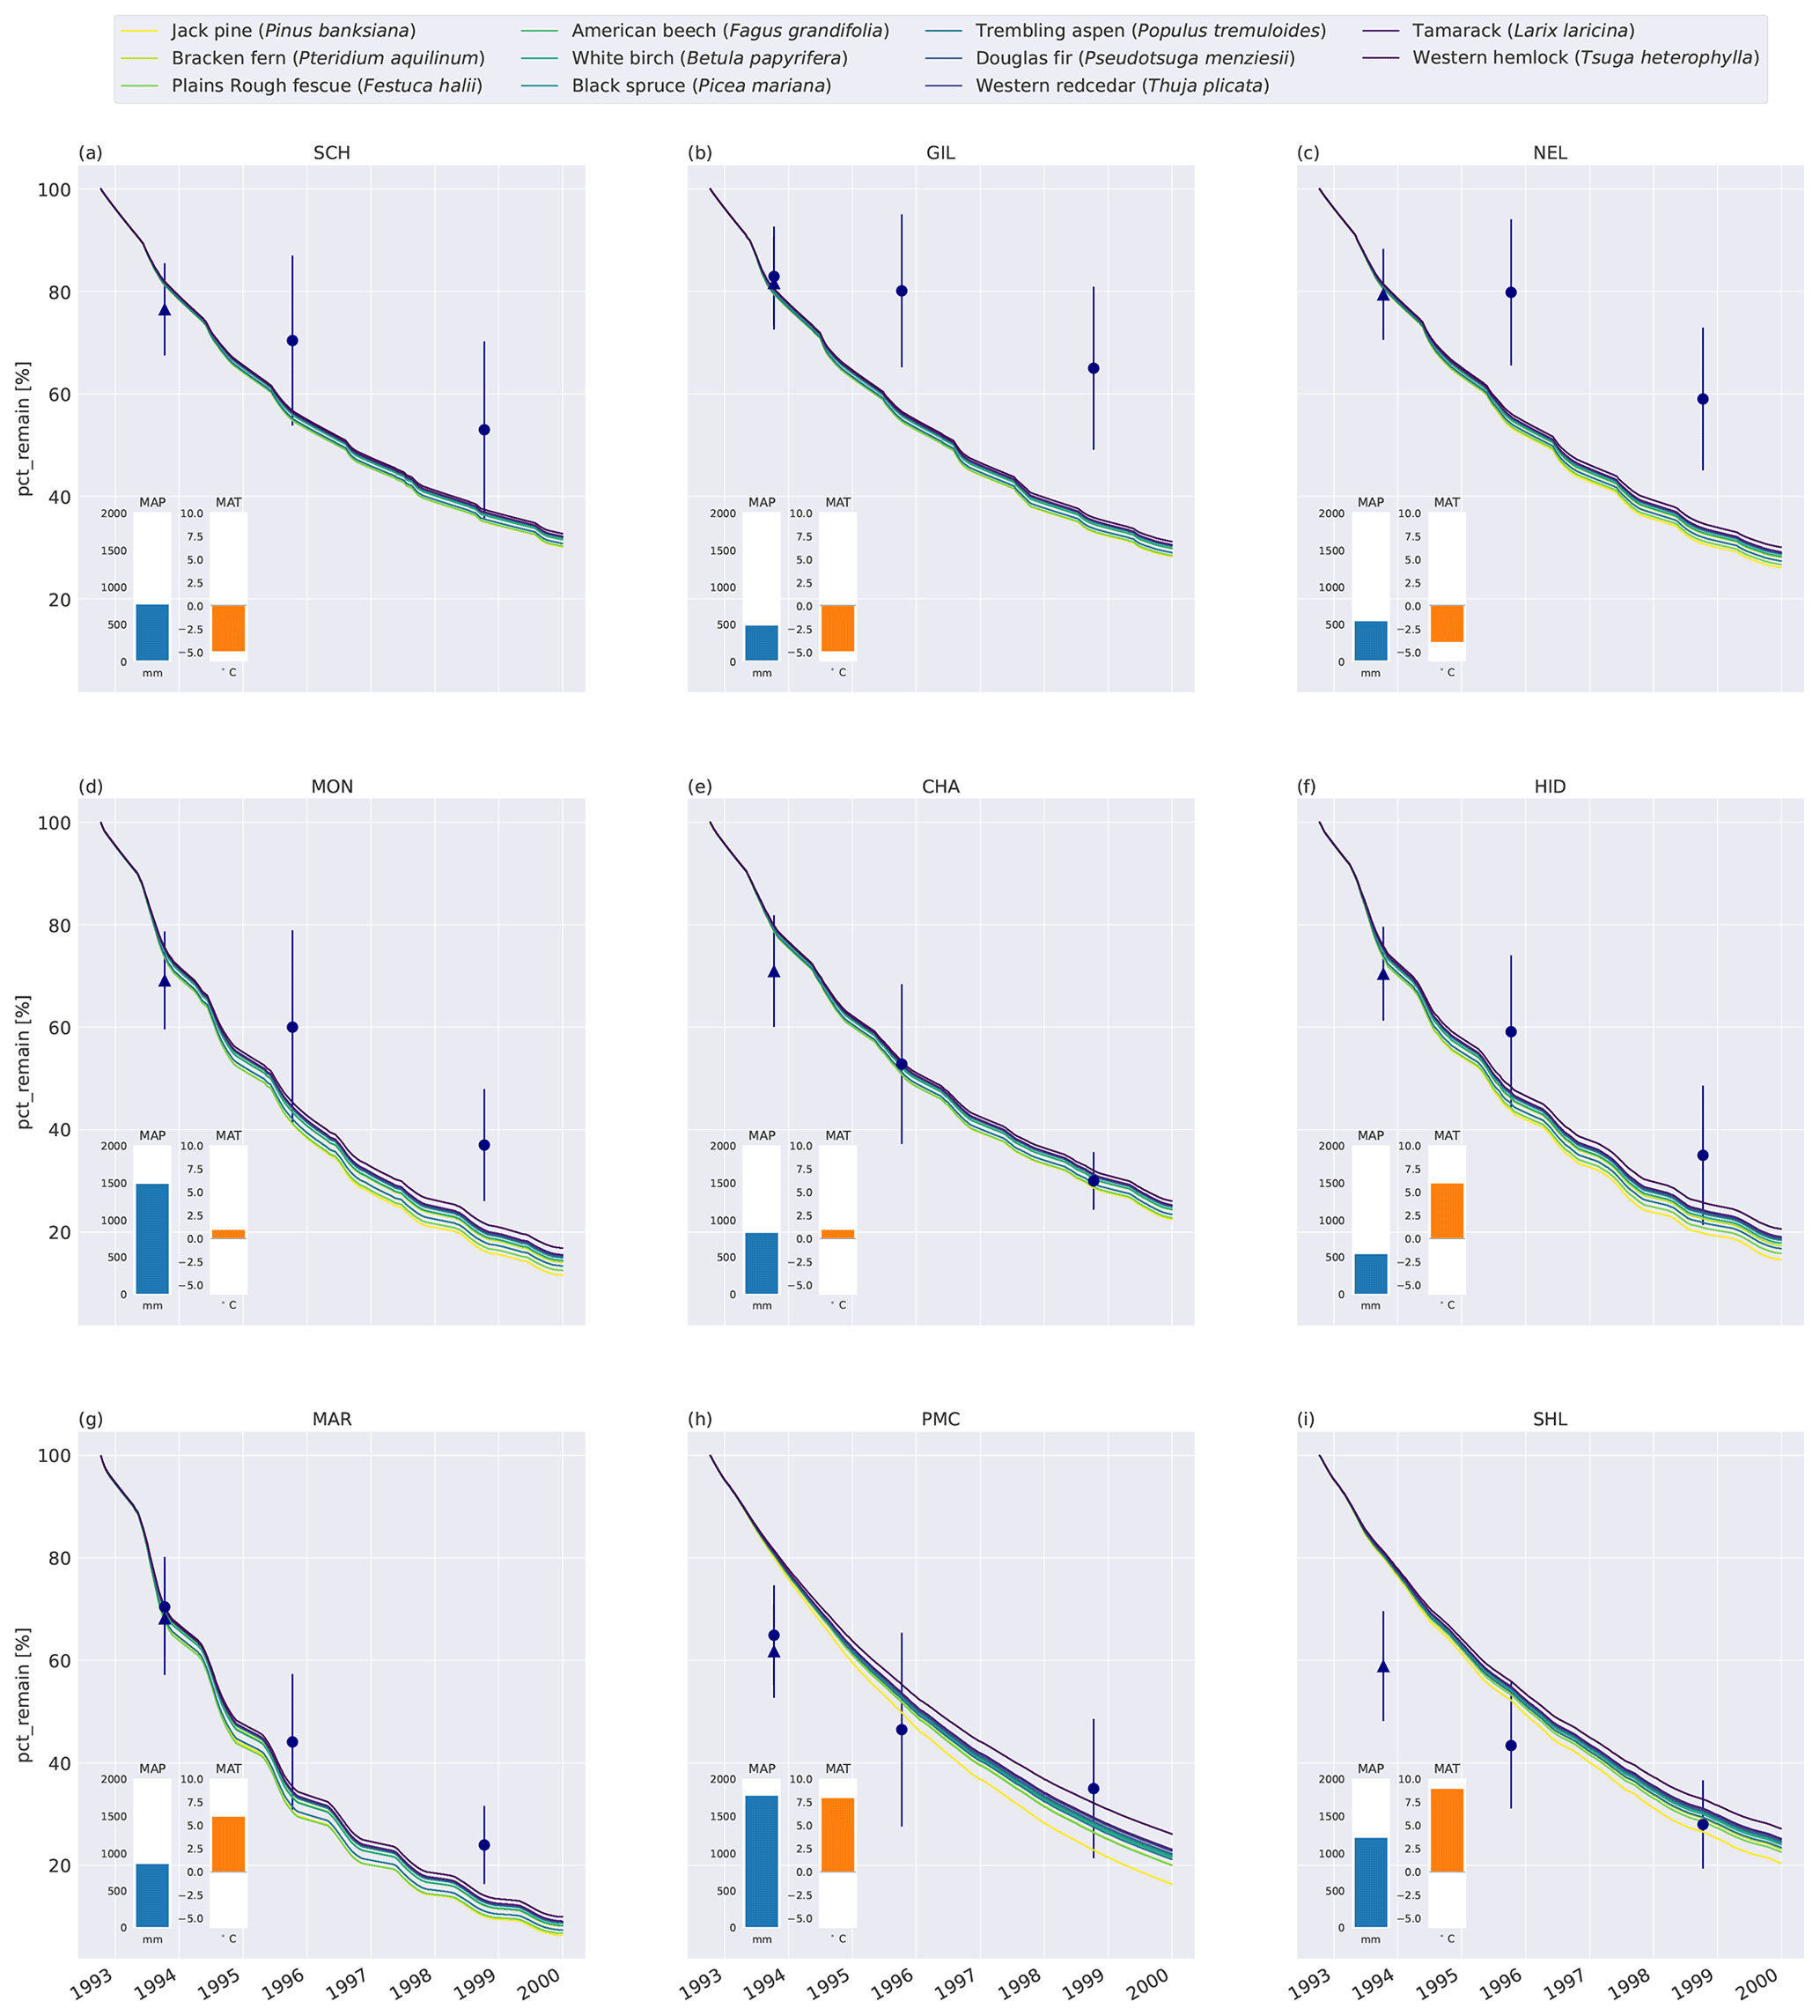
Figure 2Percent remaining mass in litterbags at CIDET sites. The lines show model simulations, with the color indicating the type of litter. The lighter the line color, the lower the C : N ratio (see Table A2). The blue dots show the observed mean mass loss of each site across all litter types after 3 and 6 years (Moore et al., 2017, 1999; Trofymow et al., 2002), while the triangles show observed mean mass loss after 1 year across the 10 foliar litter types (Viskari et al., 2021). The error bar shows the standard deviation (SD). The SD was calculated from the reported standard error of the mean with N=11. The inserted bars show the 1951–1980 average mean annual precipitation (MAP, blue) and mean annual temperature (MAT, orange) for each site (Trofymow and the CIDET Working Group, 1998).
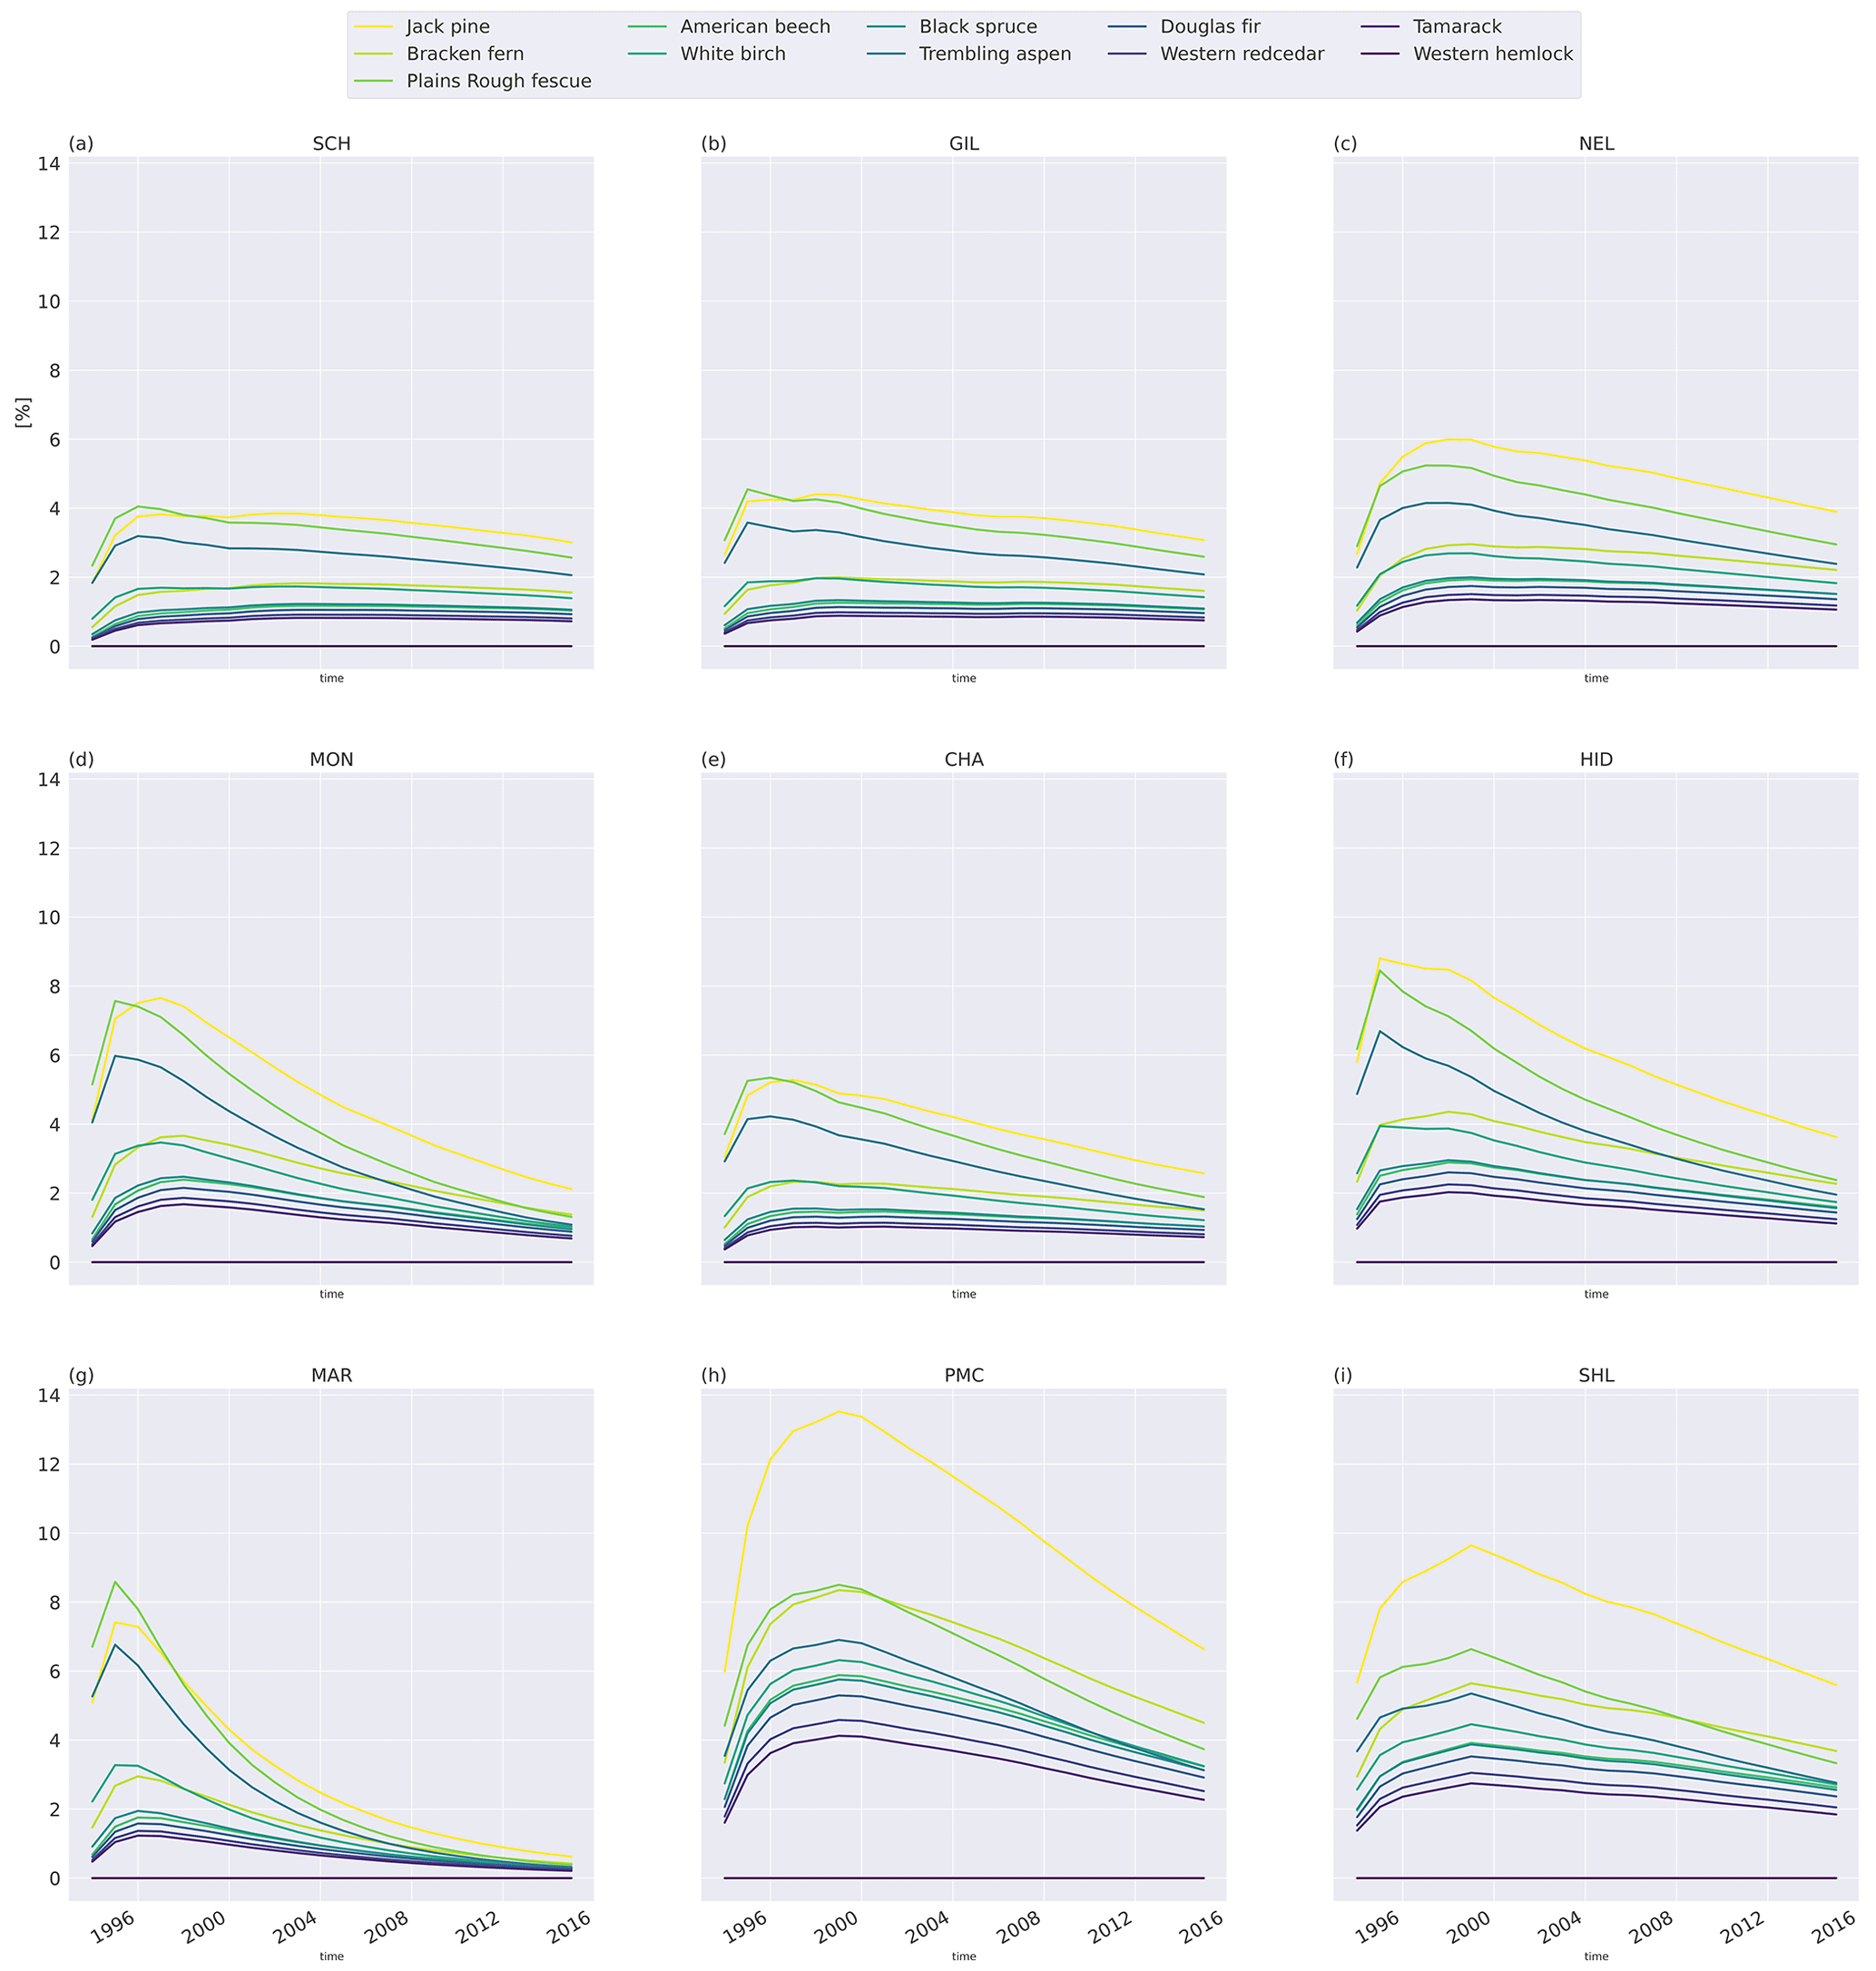
3.2 Relative litter mass loss at the CIDET sites
To investigate the relative difference between the litter types, we compare the cumulative mass loss of five litter types to the mass loss of the slowest-decomposing substrate, western hemlock (Fig. 3; see Fig. C6 for all litter types). The higher metabolic fraction of jack pine (Pinus banksiana, coniferous evergreen), plains rough fescue (Festuca hallii, grass), and trembling aspen (Populus tremuloides, broadleaf deciduous) litter leads to higher relative mass loss throughout the simulation compared to Douglas fir (Pseudotsuga menziesii, coniferous evergreen) and American beech (Fagus grandifolia, broadleaf deciduous) litter (Fig. 3). Initially, fescue is the fastest-decomposing litter for the two colder sites, Schefferville (SCH, ca. 6 years) and Chaplau (CHA, ca. 3 years); however, with time, jack pine, with the lowest C : N ratio, becomes the fastest-decomposing litter. At the warmest site, Shawnigan Lake (SHL), jack pine is the fastest-decomposing litter from the beginning. Douglas fir and American beech have C : N ratios comparable to trembling aspen, but these decompose slower due to the low metabolic fraction. The difference in C : N ratio between American beech and Douglas fir leads to slightly higher relative mass loss for American beech than for Douglas fir.
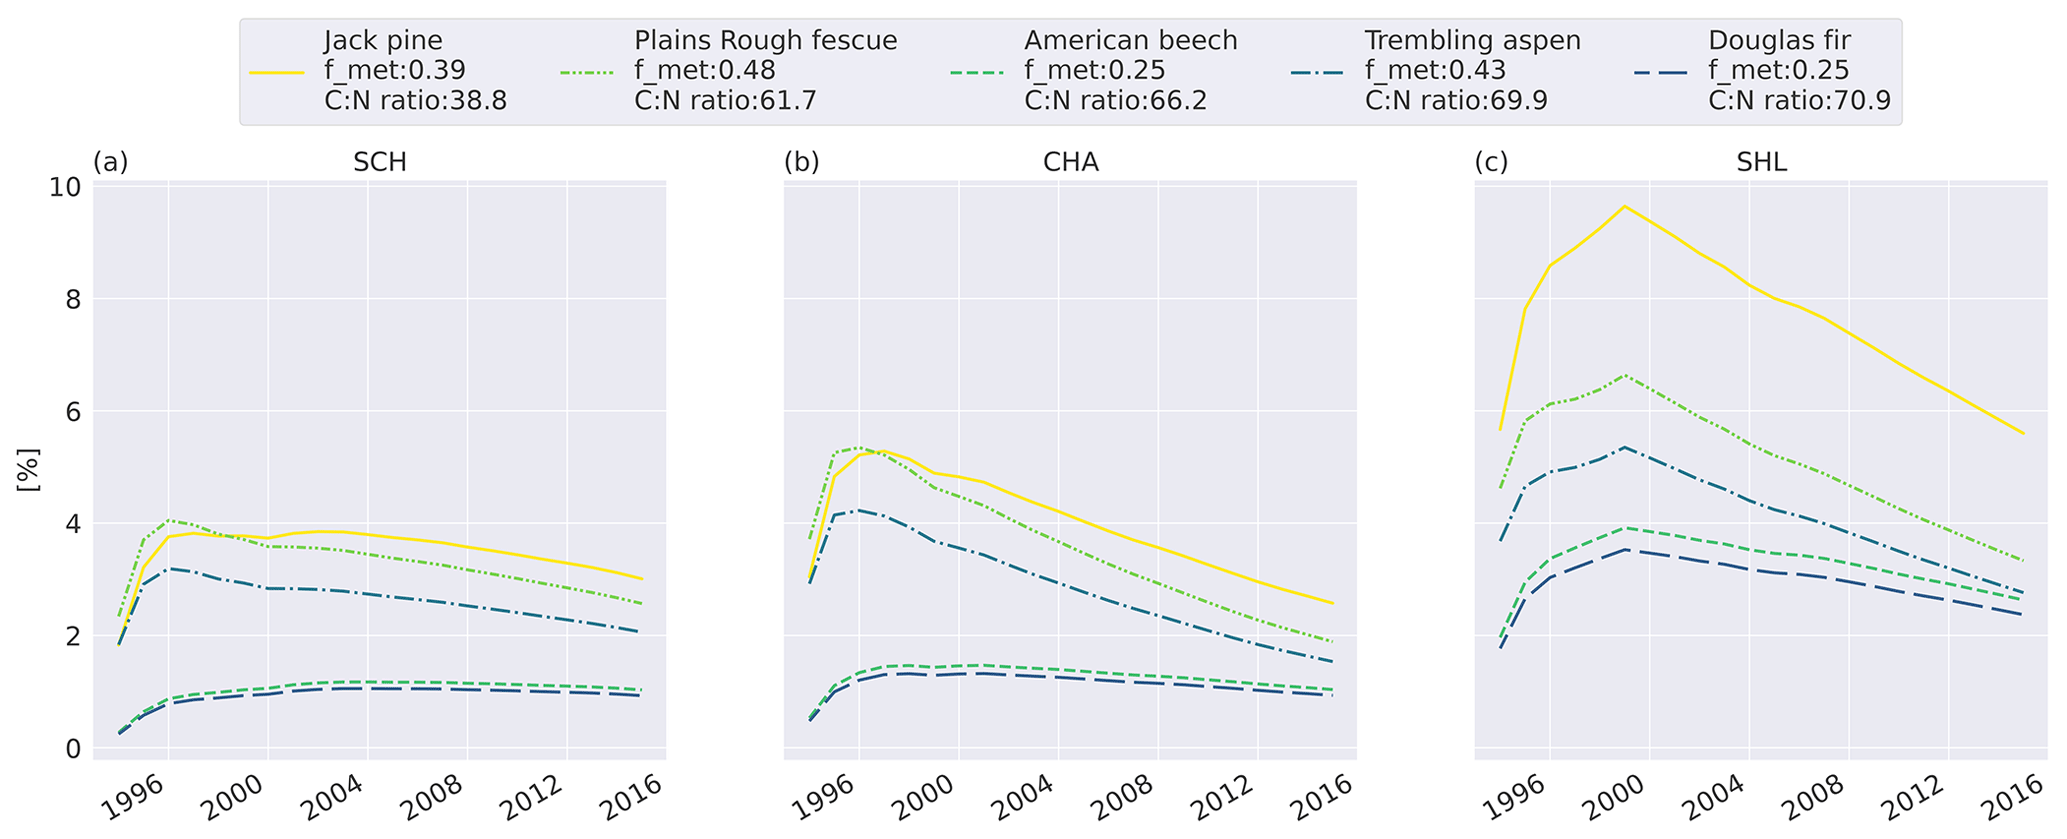
Figure 3Simulated difference in cumulative mass loss since start of litterbag experiment for five litter types compared to mass loss of the slowest-decomposing substrate, western hemlock (for western hemlock, fmet=0.25 and C : N =197.2). The values are normalized (%) to the cumulative mass loss of western hemlock. Results shown for the sites Schefferville (a, SCH), Chaplau (b, CHA), and Shawnigan Lake (c, SHL). Details about sites and litter types can be found in Appendix A. All sites and litter types are plotted in Fig. C6.
3.3 VCG simulations
The model simulations agree well with observations for the warmer and wetter sites, especially SUB3, SUB4, and BOR3 (Fig. 4g, h, k), and agree moderately well for the cold and drier sites, namely ALP1–3 (Fig. 4a–c), but they underestimate mass loss at the warm and dry sites (SUB1–2 and BOR1–2, Fig. 4e–f, i–j) and at the coldest and wettest site (ALP4, Fig. 4d). Modeled mass loss rates were relatively constant during the summer months and then decreased to nearly no loss during the winter months. For the sites where the model performs best, there was a similar pattern in the observations between the 3-month collection point and the 1-year collection point, while for the sites with the highest disagreement between the observations and the model (SUB1, SUB2, BOR1, and BOR2; Fig. 4e–f, i–j), the observed mass loss between these two collection points was substantial.
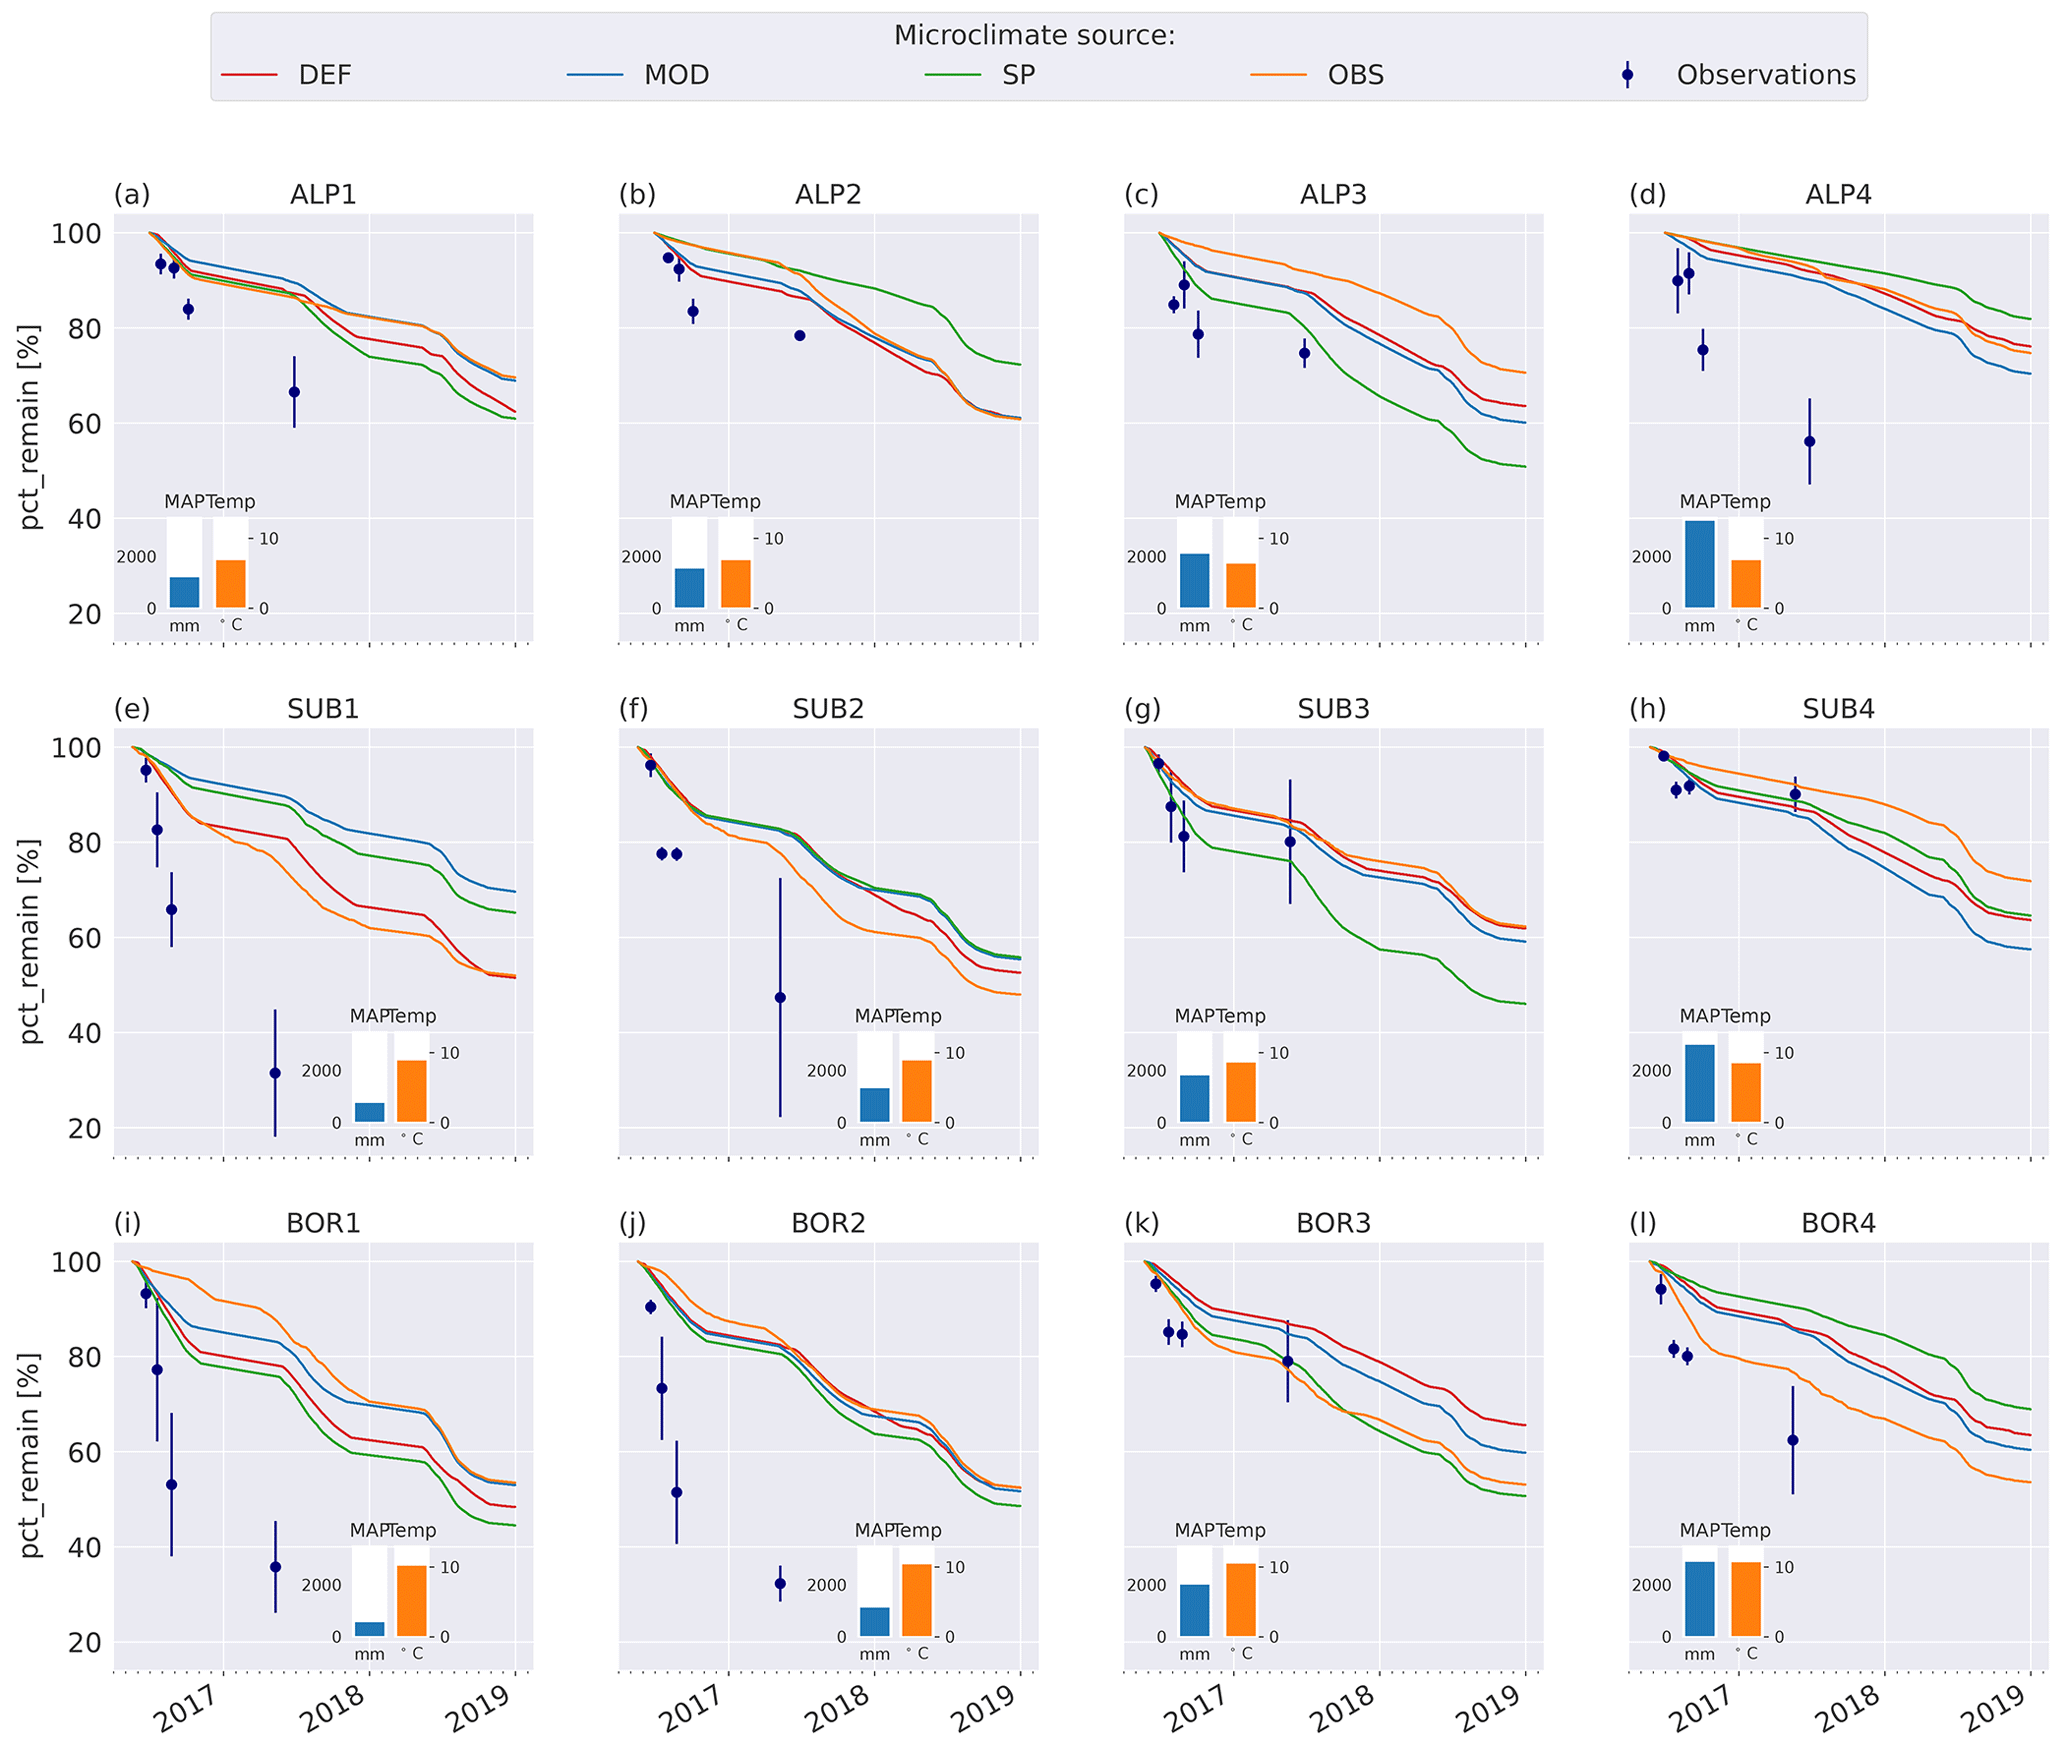
Figure 4Remaining mass (%) in litterbags at VCG sites (Vandvik et al., 2022) for MIMICS+ simulations (solid lines) and observations (dots). The inserted bars show MAP (blue) and June–September average temperatures (orange) for each site (1960–1990, climate normal).
3.4 Effect of microclimatic forcing at VCG sites
Figure 5 shows soil temperature in the model layer where the litterbag was added, together with the observed and modeled mass loss for the VCG sites. The general seasonal pattern is similar for all four microclimate sources, but the onset of spring and fall conditions differs markedly for some sites (e.g., SUB1, ALP4). The soil logger temperatures (OBS) are generally higher in fall and winter than the model-generated soil temperatures, often remaining above freezing for a large part of the winter season.
Soil moisture varied more between the microclimate data than temperature (Fig. 6). Generally, the observed soil moisture is lower than modeled, especially for the sites with less precipitation (denoted by 1 and 2; e.g., ALP1/2 compared to ALP3/4). Model-based summer moisture is generally similar, while there is a larger variability during winter.
Using alternative microclimate sources led to up to 23 % more mass remaining (MOD for SUB1) and down to 22 % less mass remaining (SP for SUB3) compared to the simulations using DEF input at the end of 2017 (when the alternative input data end). Generally, simulation of the warmer driest and wettest sites (SUB1, BOR1, SUB4, and BOR4) showed the largest spread among the simulated mass losses (Fig. 4). There was no clear trend among the predictions; for example, simulations using observed microclimate returned the lowest mass loss rates for five sites (covering all macroclimate levels in the climate grid) but among the highest mass loss rates for three sites (SUB1, SUB2, and BOR4). The predictions based on microclimate from DEF and MOD are generally similar, except for SUB1, where the DEF simulation shows markedly higher mass loss rates. For the sites with the highest disagreement between the model and observations (SUB1, SUB2, BOR1, and BOR2), even the simulations with the highest loss rate significantly underestimated mass loss.
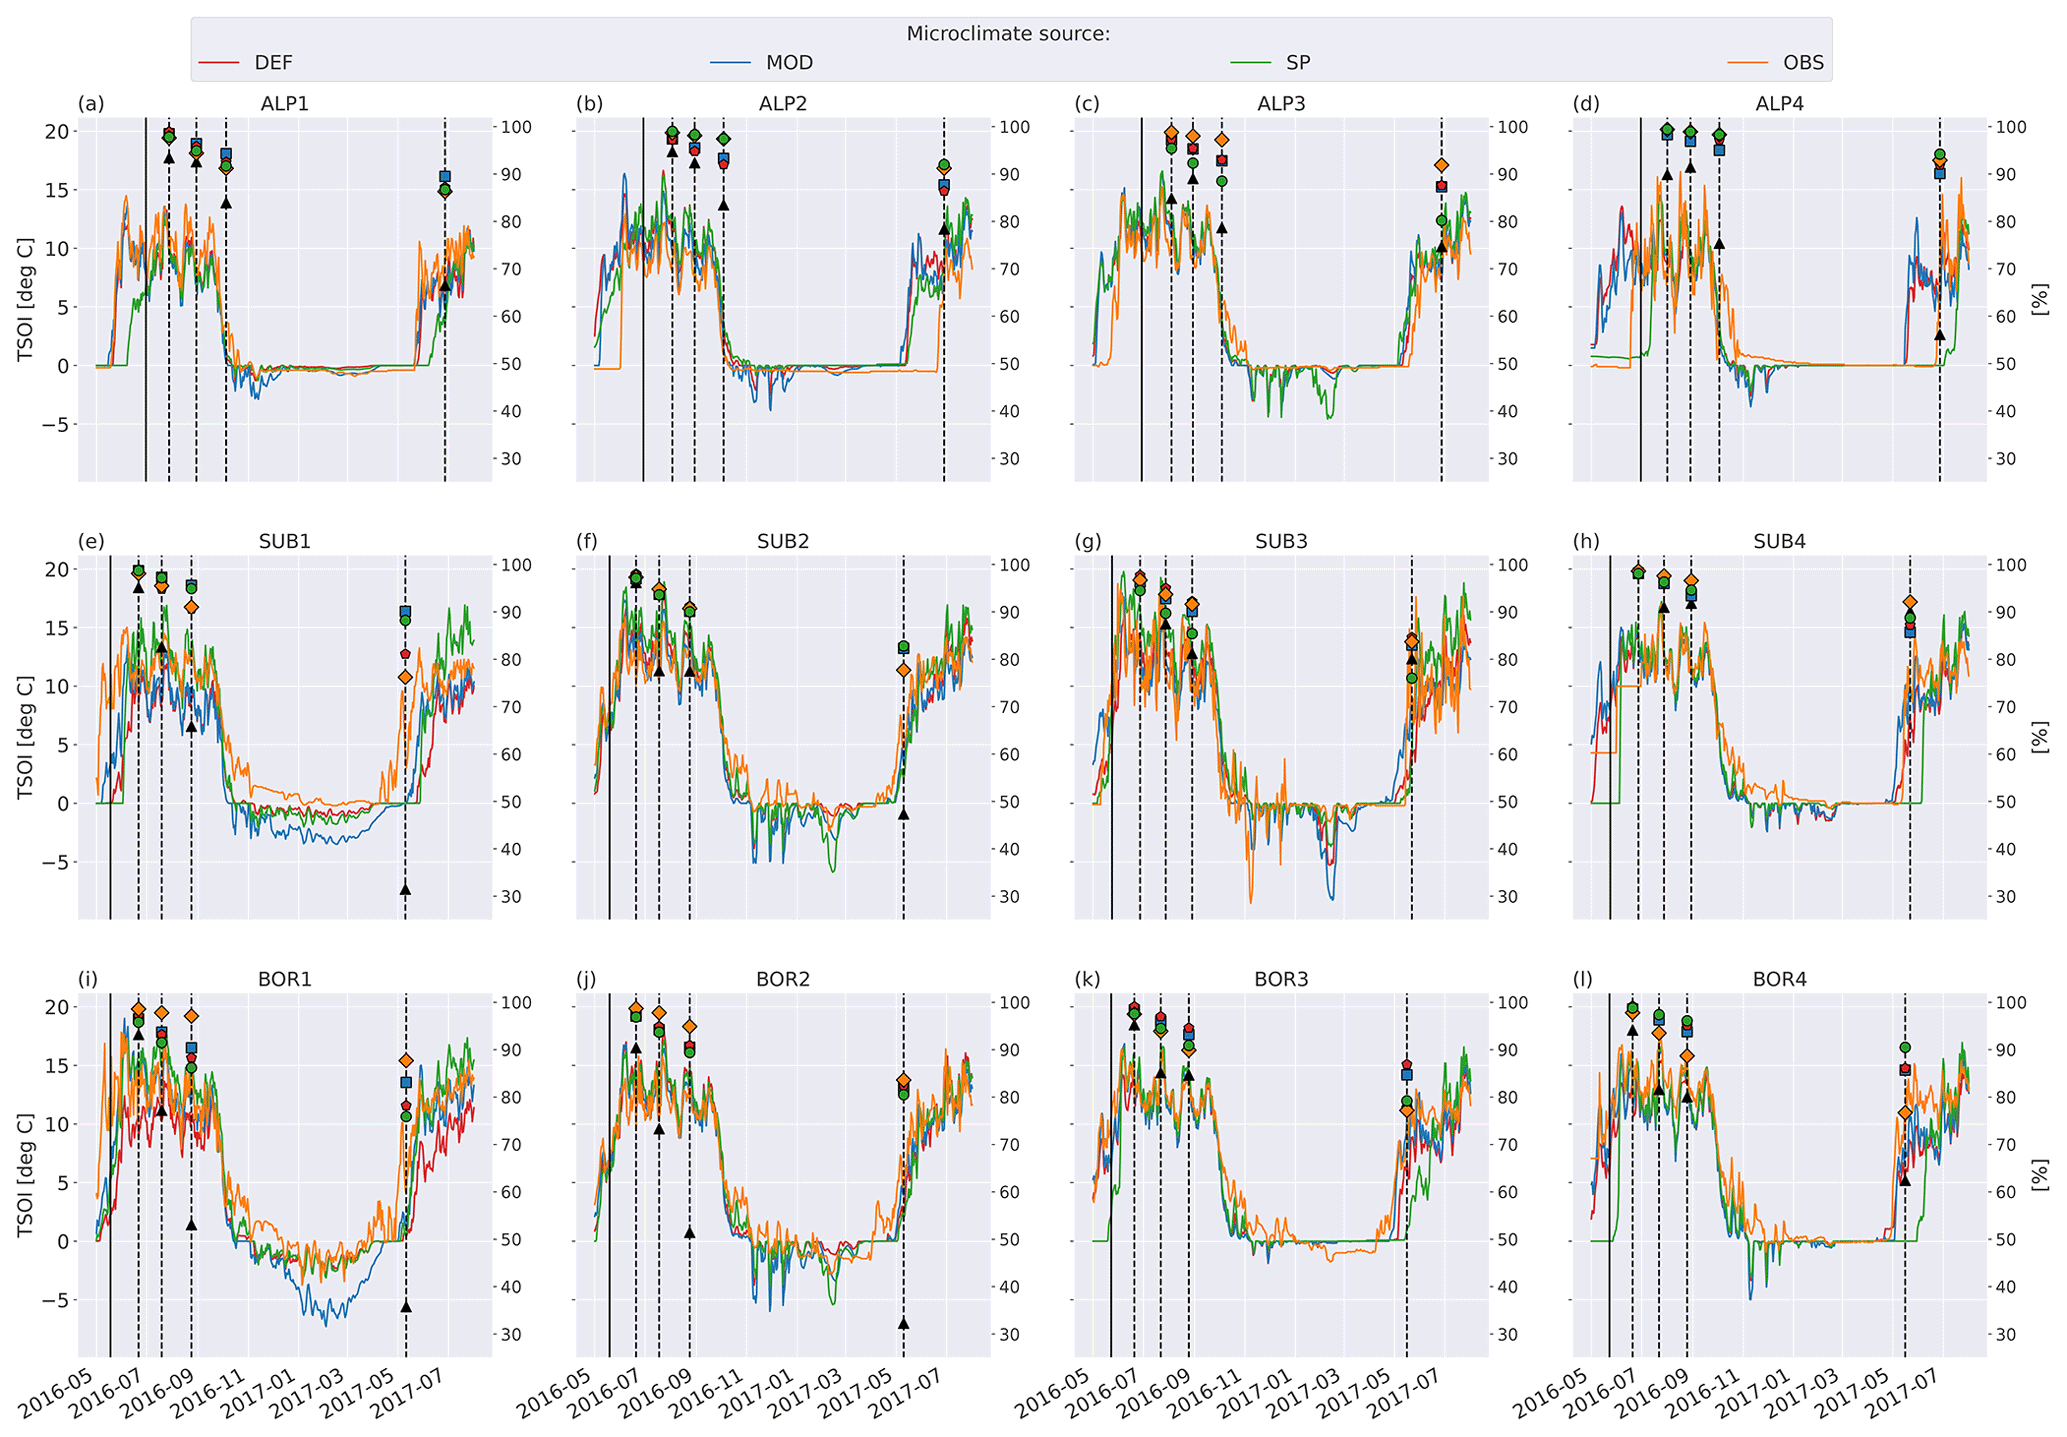
Figure 5Left axis: temperature in soil layer where litter is added from the four microclimate sources, namely MOD, DEF, SP, and OBS (see Fig. 1). Right axis: remaining litter from observations (black triangles, Vandvik et al., 2022) and simulations using DEF microclimate (red pentagons), MOD microclimate (blue squares), SP microclimate (green circles), and OBS microclimate (orange diamonds). The solid vertical lines mark the burial date of the litterbag, while the dotted vertical lines mark collection dates after 1, 2, 3, and 12 months.
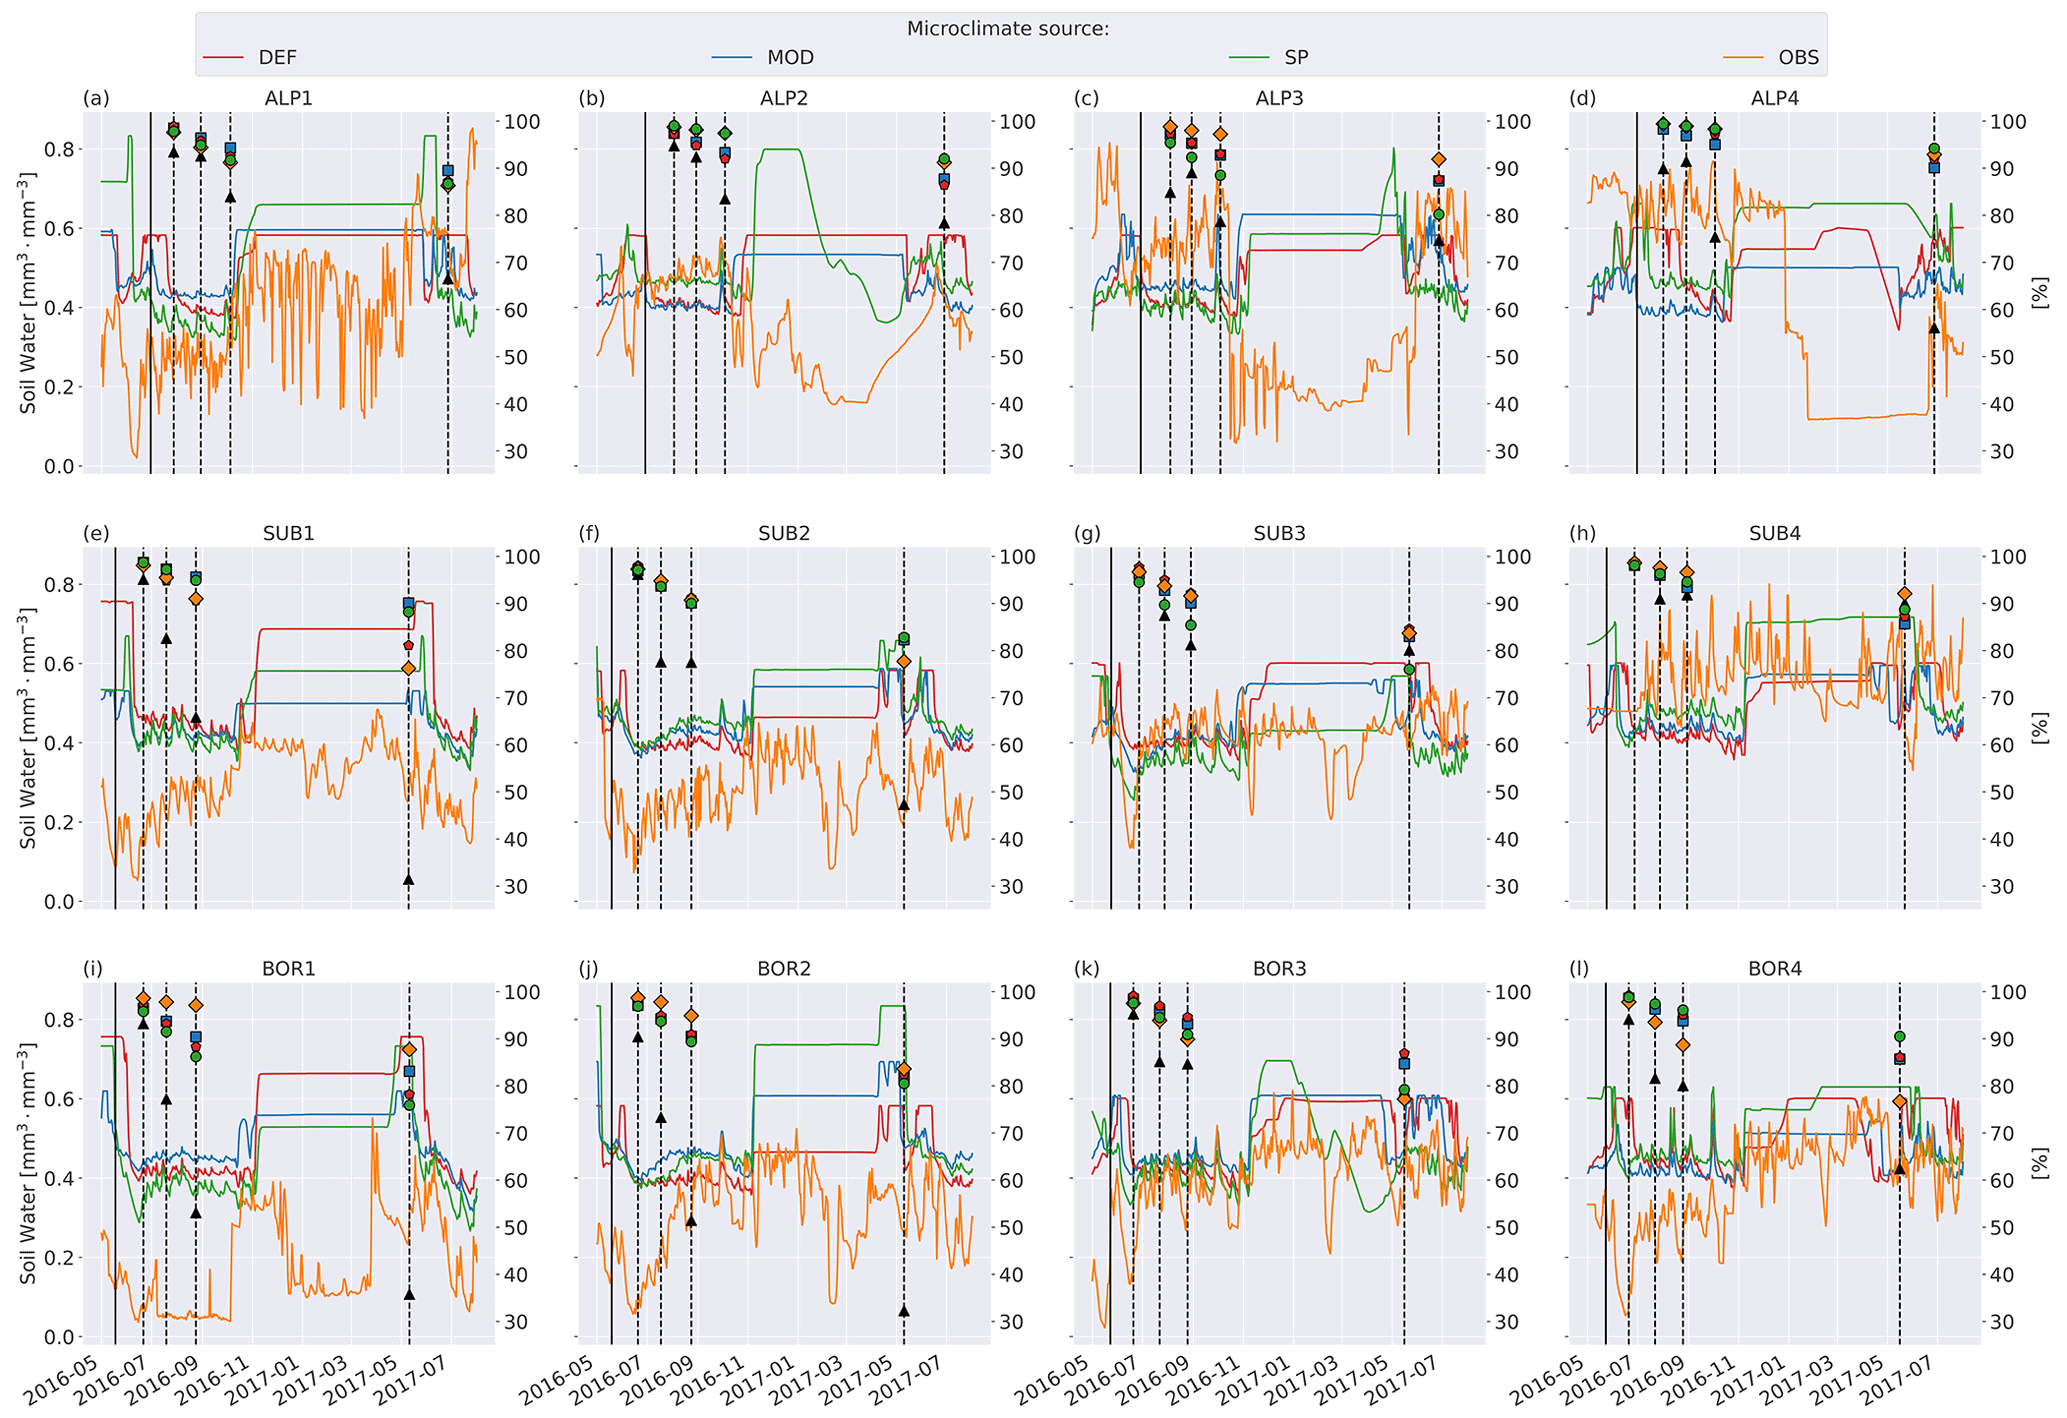
Figure 6Left axis: soil moisture in the layer where litter is added from the four microclimate sources, namely MOD, DEF, SP, and OBS (see Fig. 1). Right axis: remaining litter from observations (black triangles, Vandvik et al., 2022) and simulations using DEF microclimate (red pentagons), MOD microclimate (blue squares), SP microclimate (green circles), and OBS microclimate (orange diamonds). The solid vertical lines mark the burial date of the litterbag, while the dotted vertical lines mark collection dates after 1, 2, 3, and 12 months.
In this study, we used the soil model MIMICS+ to examine the representation of litter mass loss by replicating two litterbag experiments: the relatively long-term CIDET study and the short-term VCG study. Results from the CIDET simulations showed that the model structure and parameters of MIMICS+ are able to reproduce observed decomposition mass loss from litterbag experiments at high latitudes. We found higher mass loss at warmer sites than at colder sites, in line with observations. Modeled mass loss was more sensitive to site conditions than litter type, but the spread between different litter types increased with increasing temperature (Fig. C5). The metabolic fraction was the most important litter quality control initially, while the C : N ratio became more influential over time (Fig. 3). Using different microclimate input data in the VCG simulations yielded from 22 % less to 23 % more mass remaining at the end of 2017 (about 1.5 years after the litterbags were added) compared to the default (DEF) simulation. We found no clear trend or improvement among the simulations using different microclimates; however, the winter slowdown in decomposition was less pronounced when using soil microclimate based on observations (Fig. 4).
4.1 Climate and litter quality controls on decomposition
MIMICS+ generally predicted higher mass loss at warmer sites compared to colder CIDET sites. Macroclimate (difference between sites) had a larger effect on mass loss than litter quality, with faster decomposition at warmer and wetter sites. This is in line with Trofymow et al. (2002), who found that mean annual temperature and (summer) precipitation were the controlling factors for mass loss after 3 and 6 years. The relative difference in mass loss between litter types was smaller at the colder sites compared to at the warmer sites (Fig. 3).
In MIMICS+, litter quality in terms of metabolic fraction has an immediate effect on decomposition rates as the calculated metabolic fraction determines how much of the litter is treated as labile (LITm) and how much is treated as recalcitrant (LITs), which, in turn, affects the relative roles of saprotrophic bacteria and fungi. The C : N ratio affects modeled decomposition rates gradually by affecting saprotrophic CUE and, thereby, their growth rates. This separation is seen in Fig. 3, where the relative accumulated loss of the litter type jack pine, with a lower C : N ratio, eventually surpasses plains rough fescue, with the highest metabolic fraction for SCH and CHA. Generally, the metabolic fraction had a larger influence on modeled litter mass loss rates than the C : N ratio (Figs. 3 and C6).
The six litter types with the highest mass loss and the five types with the lowest mass loss were the same for the MIMICS+ simulations and the CIDET observations after 3 and 6 years. However, the internal ranking within these two groups was different. The litter type that differs the most from the observed ranking is jack pine, which had the highest modeled mass loss after 3 years but only ranks as the fifth highest mass loss based on observations (Preston and Trofymow, 2000). As jack pine is a common species across Canada (Moore et al., 1999), the slower observed decomposition is likely not due to the introduction of an unknown substrate to the decomposer communities, which have been shown to affect decomposition (Joly et al., 2023). This coniferous, evergreen litter type is rich in lignin, but, due to the high nitrogen content, the metabolic fraction used in the model is relatively high (see Table A2 and Eq. B4). This, together with the low C : N ratio, leads to fast decomposition of jack pine throughout the simulations. The discrepancy compared to the observations indicates that the litter nitrogen content might have a too-large influence on the estimated metabolic fraction in the model parameterization, where the metabolic fraction is a function of the lignin : N ratio.
As MIMICS+ reproduced mass loss variation with large-scale climate patterns for the CIDET sites within the variation for the majority of the observed data points and broadly captured the mass loss ranking among litter types, we conclude that MIMICS+ performs in line with hypothesis 1. This shows that the model framework is generally suited to capturing mechanisms governing mass loss during the initial and intermediate stages of litter decomposition (1–6 years).
4.2 Governing processes on different timescales
Trofymow et al. (2002) found that the chemical recalcitrance of litter (AUR and AUR : N ratio, comparable to lignin and lignin : N ratio) was more important for first-year mass loss than climatic variables. Although we see an immediate effect of chemical recalcitrance in the modeled results for the CIDET sites (Fig. 3), the absolute modeled mass loss was still controlled by climatic factors during the initial year. Mass losses at MAR (with the highest summer temperatures) were over 50 % higher than at the coldest site (SCH) during the initial year, while the initial mass loss of the fastest-decomposing litter type was about 6 % higher compared to the slowest in the model (Fig. 3c).
After 1 year at the CIDET sites, the model generally predicts mass loss well, except for an underestimation at the warmest sites. After 3 and 6 years, mass losses at the warmer sites match observations well, while the model tends to overestimate mass losses at the colder sites. This indicates that the observed decrease in mass loss rate over time is not always captured by the model.
The high observed mass loss at SUB1-2 and BOR1-2 in the VCG sites is likely to be related to favorable climatic conditions combined with low C : N ratio litter (high quality). Analyses (Althuizen et al., 2024) of data from the VCG sites (Telford et al., 2023; Vandvik et al., 2022) show a significant effect of litter C : N ratio on decomposition rates when litter was buried at warmer and wetter sites. As discussed for the CIDET sites, the effect of the litter C : N ratio was small compared to the effect of the metabolic fraction of the litter, especially during the first year (which is the timescale of the VCG experiment). Together, these results call for further studies on the effects of the litter C : N ratio in combination with microbial stoichiometry, which can also help our understanding of biogeochemical responses to global change (Rocci et al., 2024). In harsh ecosystems like the locations of the VCG sites, microbes might have to be adjusted to work efficiently with a higher C : N ratio (Mooshammer et al., 2014). The modeled resource imbalance between substrate and microbial stoichiometric demands might be inaccurate, leading to discrepancies between modeled and realistic decomposition rates. In addition, the VCG sites are subject to grazing by livestock, which might lead to increased nutrient availability in the soils, giving more favorable conditions for the microbial communities. As grazing processes are not included in the CLM or MIMICS+, the nutrient availability and, thus, the number of saprotrophic decomposers might be underestimated.
Although we assumed that all litter at the VCG sites was labile (fmet=1), MIMICS+ still underestimated mass loss at several VCG sites. The simplified representation by MIMICS+ of leaching only affects the incoming litter fluxes; thus, the experiments as they are set up in this study will not capture this mechanism as the litterbags were added directly into the model litter pools. Leaching processes could have contributed to the observed mass loss and might explain some of the discrepancies between modeled and observed values. Bokhorst et al. (2010) studied decomposition in Swedish sub-arctic heathland soils, which are comparable to the VCG sites. Their experiment suggested that the majority of the initial mass loss in fresh fall litter happened during the first few weeks, mainly due to leaching of organic compounds and not microbial decomposition. However, the extent of mass loss through leaching is hard to estimate. Therefore, for model information and evaluation purposes, a measure of how much of the mass loss can be attributed to leaching and how much can be attributed to actual microbial decomposition would be valuable. MIMICS+ (and other models) would benefit from representing leaching in a more refined way, also taking lateral flow of dissolved organic carbon (DOC) into account. This would be valuable when coupling to a larger land model as tracking of DOC is important for several reasons, e.g., correctly simulating responses to climate change and impacts on aquatic ecosystems.
Overall, MIMICS+ performs well on all timescales for the CIDET sites but shows more variable results for the short-term VCG sites. The effect of climate is the dominating control on litter mass loss. This is seen in the representation of mass loss at the CIDET sites, with a clear trend of higher mass loss at warmer sites. Although we see an initial effect of litter quality at the CIDET sites, climatic conditions were still the controlling factor. An observed effect of C : N ratio at the VCG sites was not found in the model predictions. Hypothesis 2 is therefore partly proven as we could identify the control of climate on longer scales, but the effect of litter quality on short scales was smaller than expected. A better representation of initial leaching, together with locally observed microbial stoichiometry, would be likely to improve model performance on shorter timescales. Additionally, as the decomposition process is sensitive to local conditions, good-quality measurements of microclimate are particularly important.
4.3 Implications of model microclimate representation
The way the modified microclimate simulations were performed in this study is quite simple. For the OBS and SP simulations, we only modified the variables during the decomposition experiment (after the litterbags were buried) so that any long-term effects of the different microclimates in terms of potential differences in, e.g., initial microbial biomass are not captured in these experiments. The DEF and MOD simulations were spun up from different conditions and therefore have different histories. Yet, the setup allowed us to isolate the immediate effect of soil climate on the decomposition process and to examine the effect of the real-time soil temperature and moisture during the experiment.
Local microtopography affects microclimate and, thus, decomposition rates. We therefore expected that input data based on locally measured values and/or improved surface characterization would improve model predictions at the VCG sites. To estimate the performance of the four simulation sets, we calculated the normalized root mean square error based on all observations (four sampling times) at all 12 sites (N=48; see Appendix E2) to be 0.29 (DEF and SP) and 0.30 (MOD and OBS). In other words, the model predictions from all simulation sets deviate from the observed values by 29 %–30 % of the total range of the data, and we are not able to conclude that customized input data improved model predictions of mass loss in line with hypothesis 3. Although not having the expected effect on model results, the use of different microclimate sources still demonstrates several temporal and spatial challenges that arise when connecting locally observed quantities to a model framework.
At some VCG sites, for one or more of the four simulation sets, the modeled mass loss rate during the high-activity summer season was similar to the observed mean annual loss rate (e.g., ALP1, SUB2, and BOR1), indicating that the modeled climatic inhibition of decomposition during the cold season is too strict, contributing to the underestimation of the annual loss rate. Using observed soil temperature to determine ice fraction (as described in Sect. 2.5) resulted in markedly lower ice content than predicted by the CLM simulations (Fig. C3), also hinting that the real sites might not have been as limited by freezing water and/or low temperatures as predicted by the CLM. For example, the high mass loss observed at the cold and wet site ALP4 may be due to snow insulation keeping the soil unfrozen (Rixen et al., 2022). It has been shown that accurately representing snow in the CLM is challenging, which can contribute to inaccurate representation of soil microclimate during winter (Aas et al., 2017). Contrarily to the above-mentioned sites, observations at SUB3 and BOR3 show a winter slow-down of decomposition more in line with the modeled predictions. This distinction between observed winter decompositions shows that local conditions may allow for or limit decomposition during winter, but even using locally measured temperature and moisture (OBS) did not improve the modeled result. Snow melt-out dates in alpine ecosystems can also vary significantly, even at small spatial scales (Pirk et al., 2023). This is likely to affect conditions at the VCG sites, where local features such as rock formations can be influential in relation to snow patterns.
To examine how much the moisture limitation affected modeled mass loss, we ran a set of simulations where f(θ)=1 at all times; that is, there is no moisture limitation on decomposition rates (Fig. C4). For the warmer and drier VCG sites (SUB1, SUB2, BOR1, and BOR2), this brought model predictions closer to observations, but there was still a substantial underestimation of mass loss. For the sites where the model initially performed well (SUB3, SUB4, and BOR3), the simulations with no moisture limitation generally overestimated mass loss after 1 year, indicating that local conditions not captured by model equations (and their dependency on temperature and moisture) play a dominant role at the sites on these timescales. The spread between simulations using different microclimates was smaller in experiments with no moisture limitation (Fig. C4), illustrating that the direct temperature effect on decomposition was generally similar in the different representations (Fig. 5), while the moisture representation was more variable (Fig. 6). However, the interacting effect between temperature and moisture around the freezing point has a large impact on decomposition rates, and differences in ice fraction caused large differences in decomposition limitation due to freezing. Observed soil temperature at the SUB2 site was above zero for long periods during winter (Fig. 5f), while modeled winter soil temperatures were mainly below zero. This resulted in less moisture limitation for the MIMICS+ simulations using the observed microclimate, which led to a significantly higher mass loss after 1 year (Fig. C1f). This example illustrates how decomposition in ecosystems that are experiencing cold seasons is extra sensitive not only to the isolated effects of temperature and moisture but also to the phase change of water (Sierra et al., 2015).
The generally higher soil moisture values from the model-derived microclimate compared to the observational data resulted in moisture limitations for different reasons. Decomposition in the simulations using observation-based microclimate was mostly limited due to dry conditions, while the simulations using model-based microclimate were often limited due to high soil moisture (Fig. C2). This demonstrates the chance of getting model results right for the wrong reasons based on inaccurate input data. The use of data loggers placed at the observational sites reduces this chance but also introduces their own uncertainties (Graae et al., 2012).
The VCG sites are open grasslands, while the CIDET sites are mostly forested. Microclimate at the CIDET sites is therefore likely to be modified by the temperature-buffering effect of forest canopies (De Frenne et al., 2019) more than at the VCG sites. The VCG sites are also dominated by fast-growing species with relatively high C : N ratios (see Table A3). Together, these factors could explain some of the differences in mass loss between the two observational data sets, where litterbags at some VCG sites lose more mass in 1 year than litterbags at the CIDET sites lose in 3 years. The model is calibrated to conditions that are more similar to the forested CIDET sites than the VCG grasslands (Strand et al., 2016), which might contribute to the better performance at the CIDET sites. Adjusting the model parameters to better suit the VCG grasslands might improve model performance at these sites. However, as MIMICS+ is intended to work within a large-scale land surface model, using a general set of parameters is of interest.
4.4 Limitations and outlook
The individual observed litterbags in the experiments are subject to local conditions not captured by the modeled grid cell averages. This is illustrated by the simulations of the CIDET sites and litter types, where modeled variability between simulations of different litter types was generally smaller than the variability indicated by the standard deviations of the observations. The main intention for MIMICS+ is to be incorporated into and used within a land model framework on large and long regional and temporal scales, for which general parameters representative of larger areas are desirable. However, for investigating processes and mechanisms on a local scale, efforts to gather site data suitable for informing model parameters and parameterizations, like microbial biomass and its chemical composition, should be prioritized.
Another local factor not considered in the model is the contribution of micro-, meso-, and macrofauna to the decomposition process. Litterbag mesh size has a significant effect on decomposition rates (Peng et al., 2022). The difference in the mesh sizes used at the CIDET and VCG sites makes it challenging to directly compare the results. In both studies, the mesh size allowed for microfauna, as well as some mesofauna, to enter the bags in addition to microorganisms. This likely contributes to the model underestimation of mass loss at the VCG sites, especially at the sites where biodiversity is expected to be higher due to favorable climatic conditions (BOR1-2, SUB1-2). Fauna interactions can also indirectly affect decomposition rates by shaping the environment surrounding the litterbags (Bradford et al., 2002). In addition to fauna, mycorrhizal fungi could interact with the litter bags, possibly affecting the decomposition rates (Lindahl and Tunlid, 2015). As the model structure only allows mycorrhiza to interact with soil organic matter pools and not the litter pools, such interactions are not captured by the model.
The effect of using local slope and organic content data to produce input data for MIMICS+ (MOD) had a small effect on modeled mass loss (Fig. 4) compared to using default values (DEF). Since the model soil columns are deeper (at least 40 cm) than the observed soils (<20 cm), hydrological processes could evolve quite differently in the model compared to the observations and could probably contribute to the discrepancy between modeled and observed mass loss. The CLM does not have explicit litter layers, meaning that all layers are treated as soil when soil temperature and moisture profiles are calculated (Lawrence et al., 2019). Therefore, the top model layer might not accurately represent the actual forest floor that the CIDET bags were placed on, which can be assumed to be warmer and drier than the model layer.
We assume that the litterbag stays in the same model soil layer throughout the simulation period (top layer and third layer for CIDET and VCG sites, respectively). In reality, the vertical position of the litterbag could change due to litterfall events or other disruptions, especially in the multiyear CIDET experiment. Due to vertical gradients in microclimate, nutrient availability, and microbial communities, the choice of layer affected the modeled mass loss. In test simulations where CIDET litter was added to the third layer (6–12 cm depth), mass loss was generally slower than when the litterbags were added to the top layer (Fig. 2) and showed a stronger seasonality.
The sensitivity of model results to terms in the moisture function highlights the challenges of parameterizing soil moisture effects on decomposition rates. Sierra et al. (2015) showed that biogeochemical models use a range of different functions to represent moisture limitation. They emphasized the importance of representing limitation due to both oxygen limitation and dry conditions, as well as the effect of water phase change on microbial activity and decomposition rates. The moisture function used in this study (Sulman et al., 2014; Wieder et al., 2017) is formulated in a way that can capture these effects; it includes one term representing liquid-water deficit and one term representing air-filled porosity in addition to separating between water in ice and liquid form. However, as our results show, it is highly dependent on good-quality data on soil texture and ice formation and melting and has a large influence on soil moisture and the decomposition rates in MIMICS+. The optimal soil moisture value likely varies with soil properties. Therefore, making the optimum a function of soil texture instead of a constant value (0.55; see Sect. 2.3) could improve the representation of moisture effects on decomposition in the model. Since snow cover has an important isolating effect and thereby affects soil-freezing processes, this is a further motivation to improve snow depth representation in the CLM and other land surface models. Our results highlight the importance of accurate site-level information on soil properties to the performance of MIMICS+ (and other soil models).
The litter decomposition process is a typical example of how relatively small-scale observational studies are used for model evaluation and validation purposes. As decomposition is a process that develops in temporal stages, different processes are in control on different timescales. Our results showed that MIMICS+ replicated the relatively long-term CIDET study well and represented the effects of climate and chemical recalcitrance adequately. However, results from the short-term VCG study were more variable and demonstrated how extra caution should be taken when using small-scale observations to inform soil models, especially in regions that experience regular freezing. Our results showed that locally observed input data did not significantly improve modeled results at the VCG sites. This is likely to be a combination of the quality of the locally observed data, the experiment design, and the model structure and equations. Bridging the gap between empirical field experiments and model development is therefore crucial to fully utilize the information that can be gathered from both scientific fields (Halbritter et al., 2020; Kyker-Snowman et al., 2022). To increase the usefulness of short-term litterbag experiments for the new generation of microbially explicit decomposition models, efforts should be made to include measurements of microbial biomass, stoichiometry, and potential abiotic-leaching loss during the experimental period. At the same time, improved representation of snow cover and, thereby, soil-freezing processes in land surface models would improve small-scale model representation of decomposition in cold regions. Together, these measures can advance our understanding of one of the most important processes in the carbon cycle: the decomposition process.
This appendix provides details about the sites and litter types from the CIDET and VCG experiments.
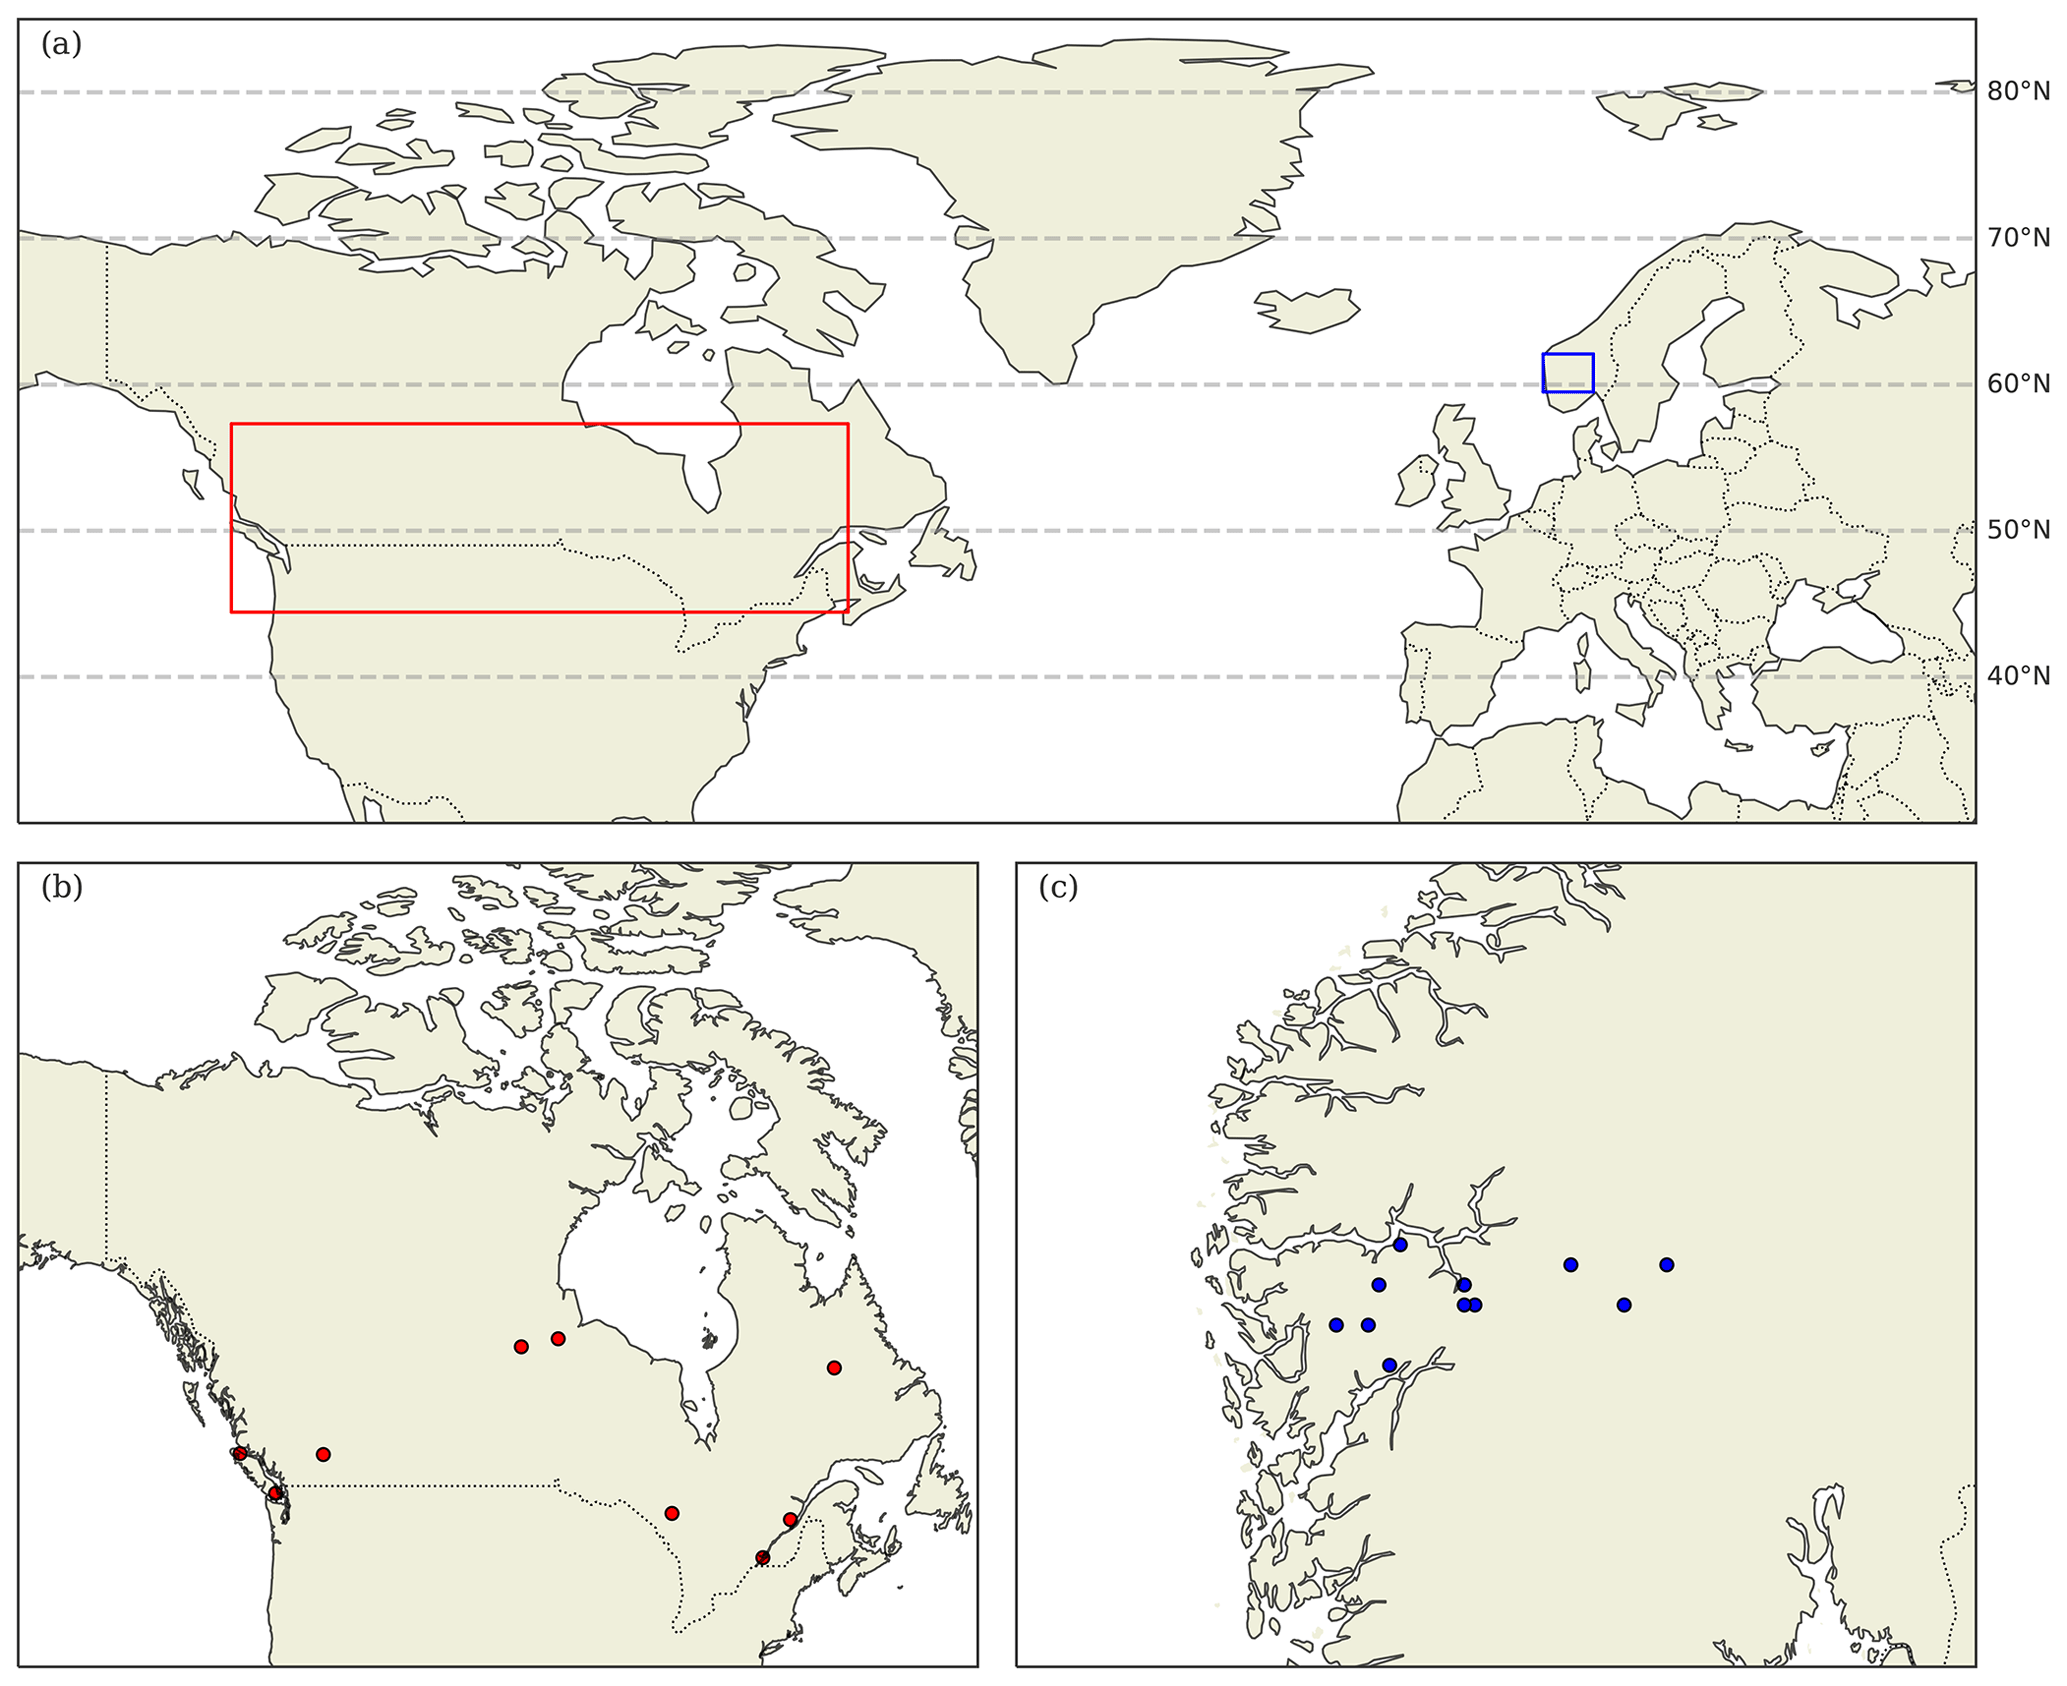
Table A1Information about sites from the CIDET study. Data are collected from Tables 1 and 4 in Trofymow and the CIDET Working Group (1998). The remaining mass and standard errors of the mean (in parentheses) averaged across all litter types after 3 and 6 years are from Moore et al. (1999) and Trofymow et al. (2002), respectively.
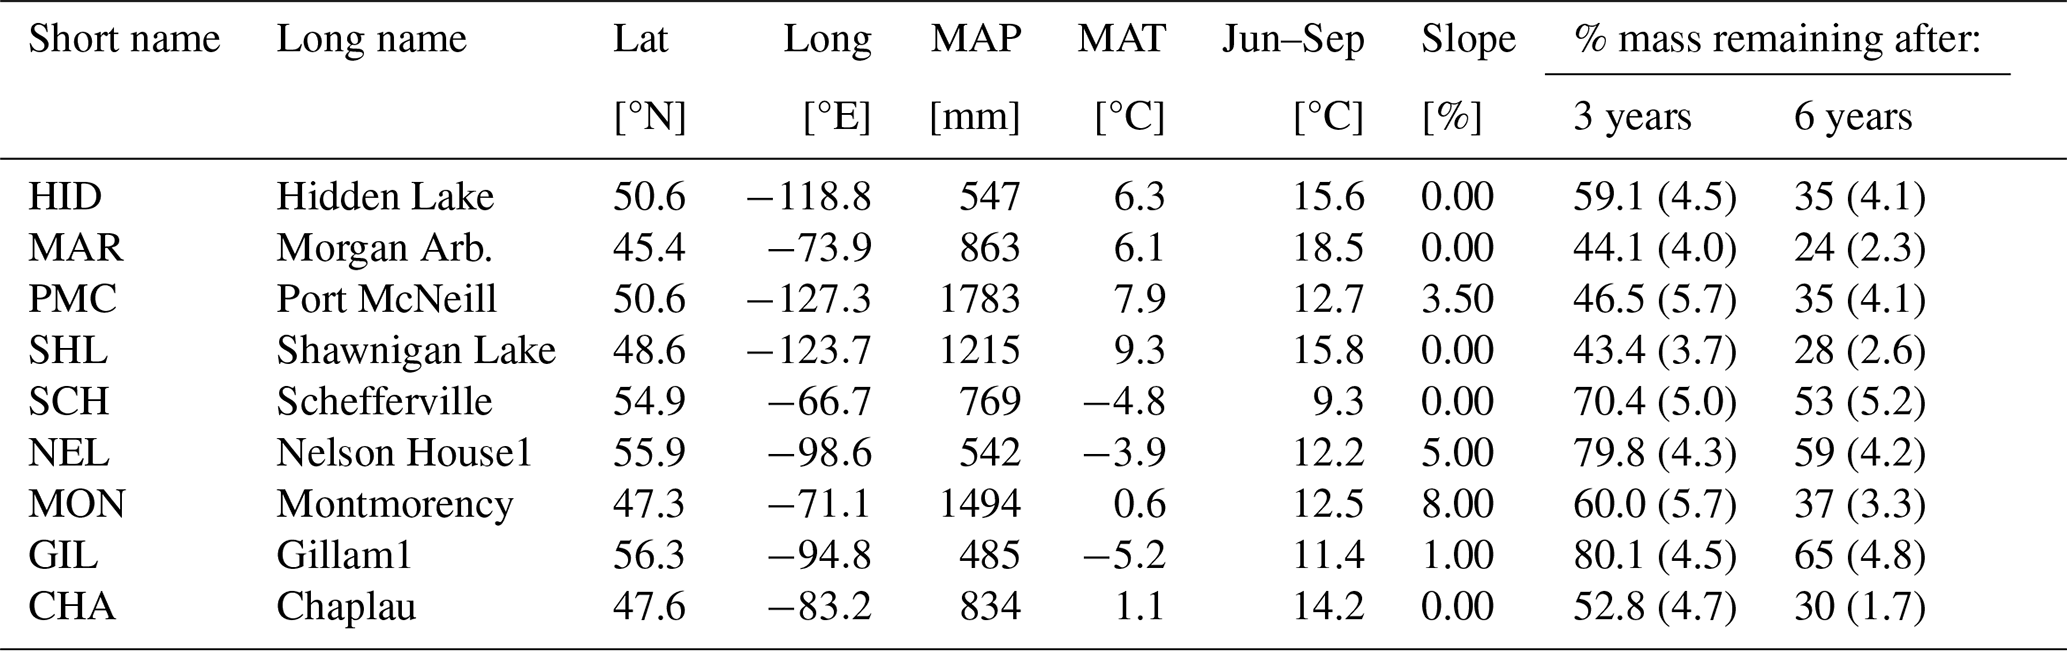
Table A2Information about litter types from the CIDET study. Data are collected from Table 3 in Trofymow and the CIDET Working Group (1998). The fmet values are calculated using the lignin : N data from this table in Eq. (B4) in Appendix B.
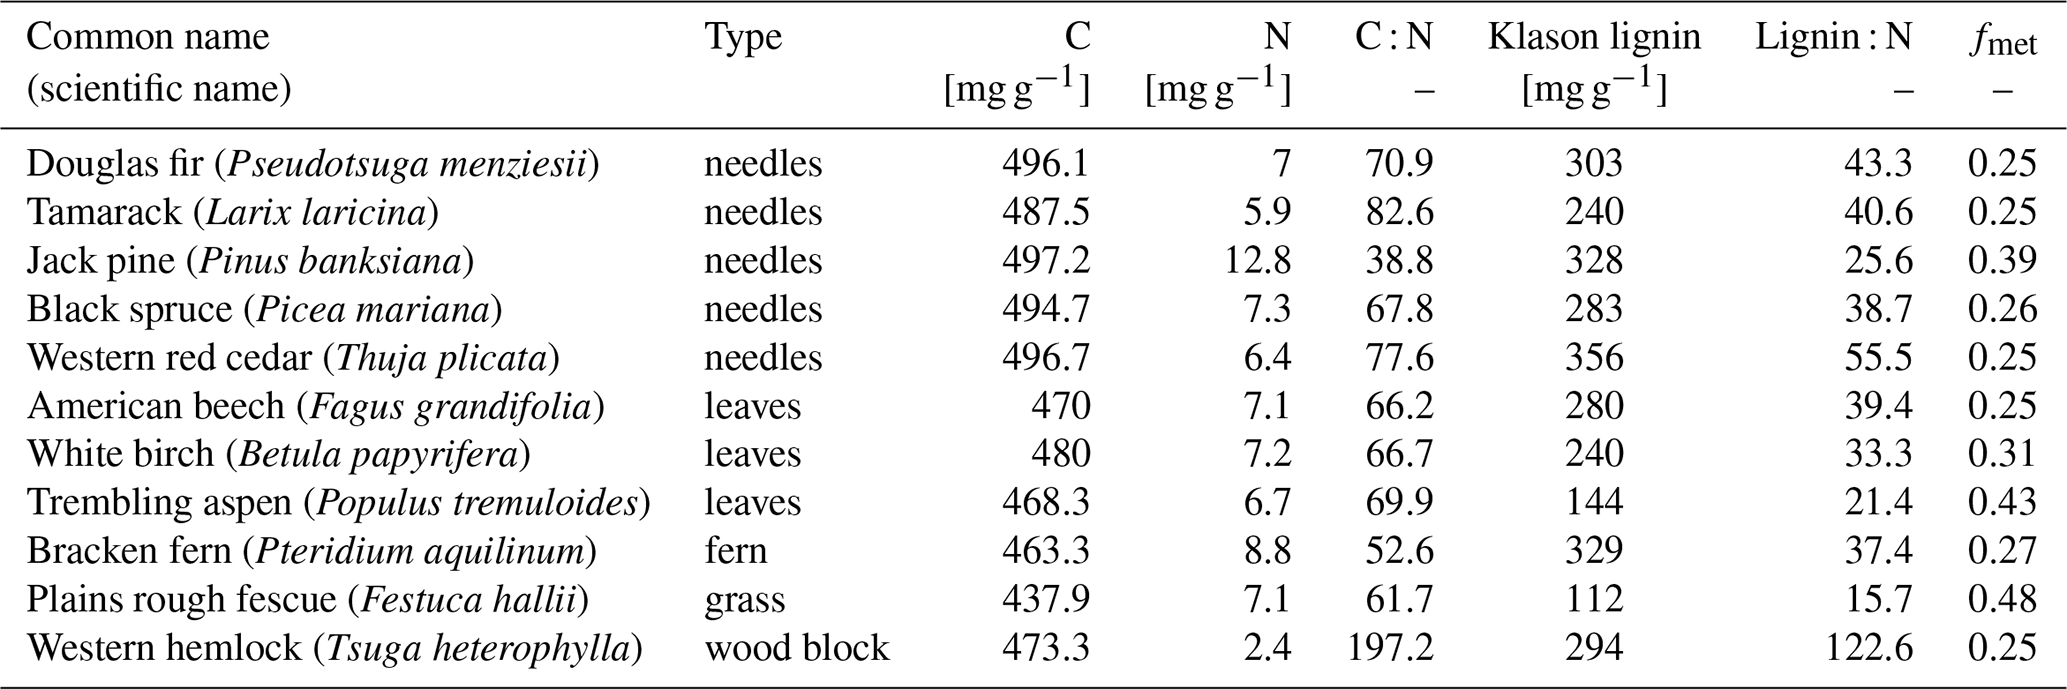
Table A3Information about the Vestland Climate Grid sites and litter decomposition experiment (Vandvik et al., 2022; Telford et al., 2023). The site names indicate temperature and precipitation levels – alpine, sub-alpine, and boreal – along a precipitation gradient from low (1) to high (4).
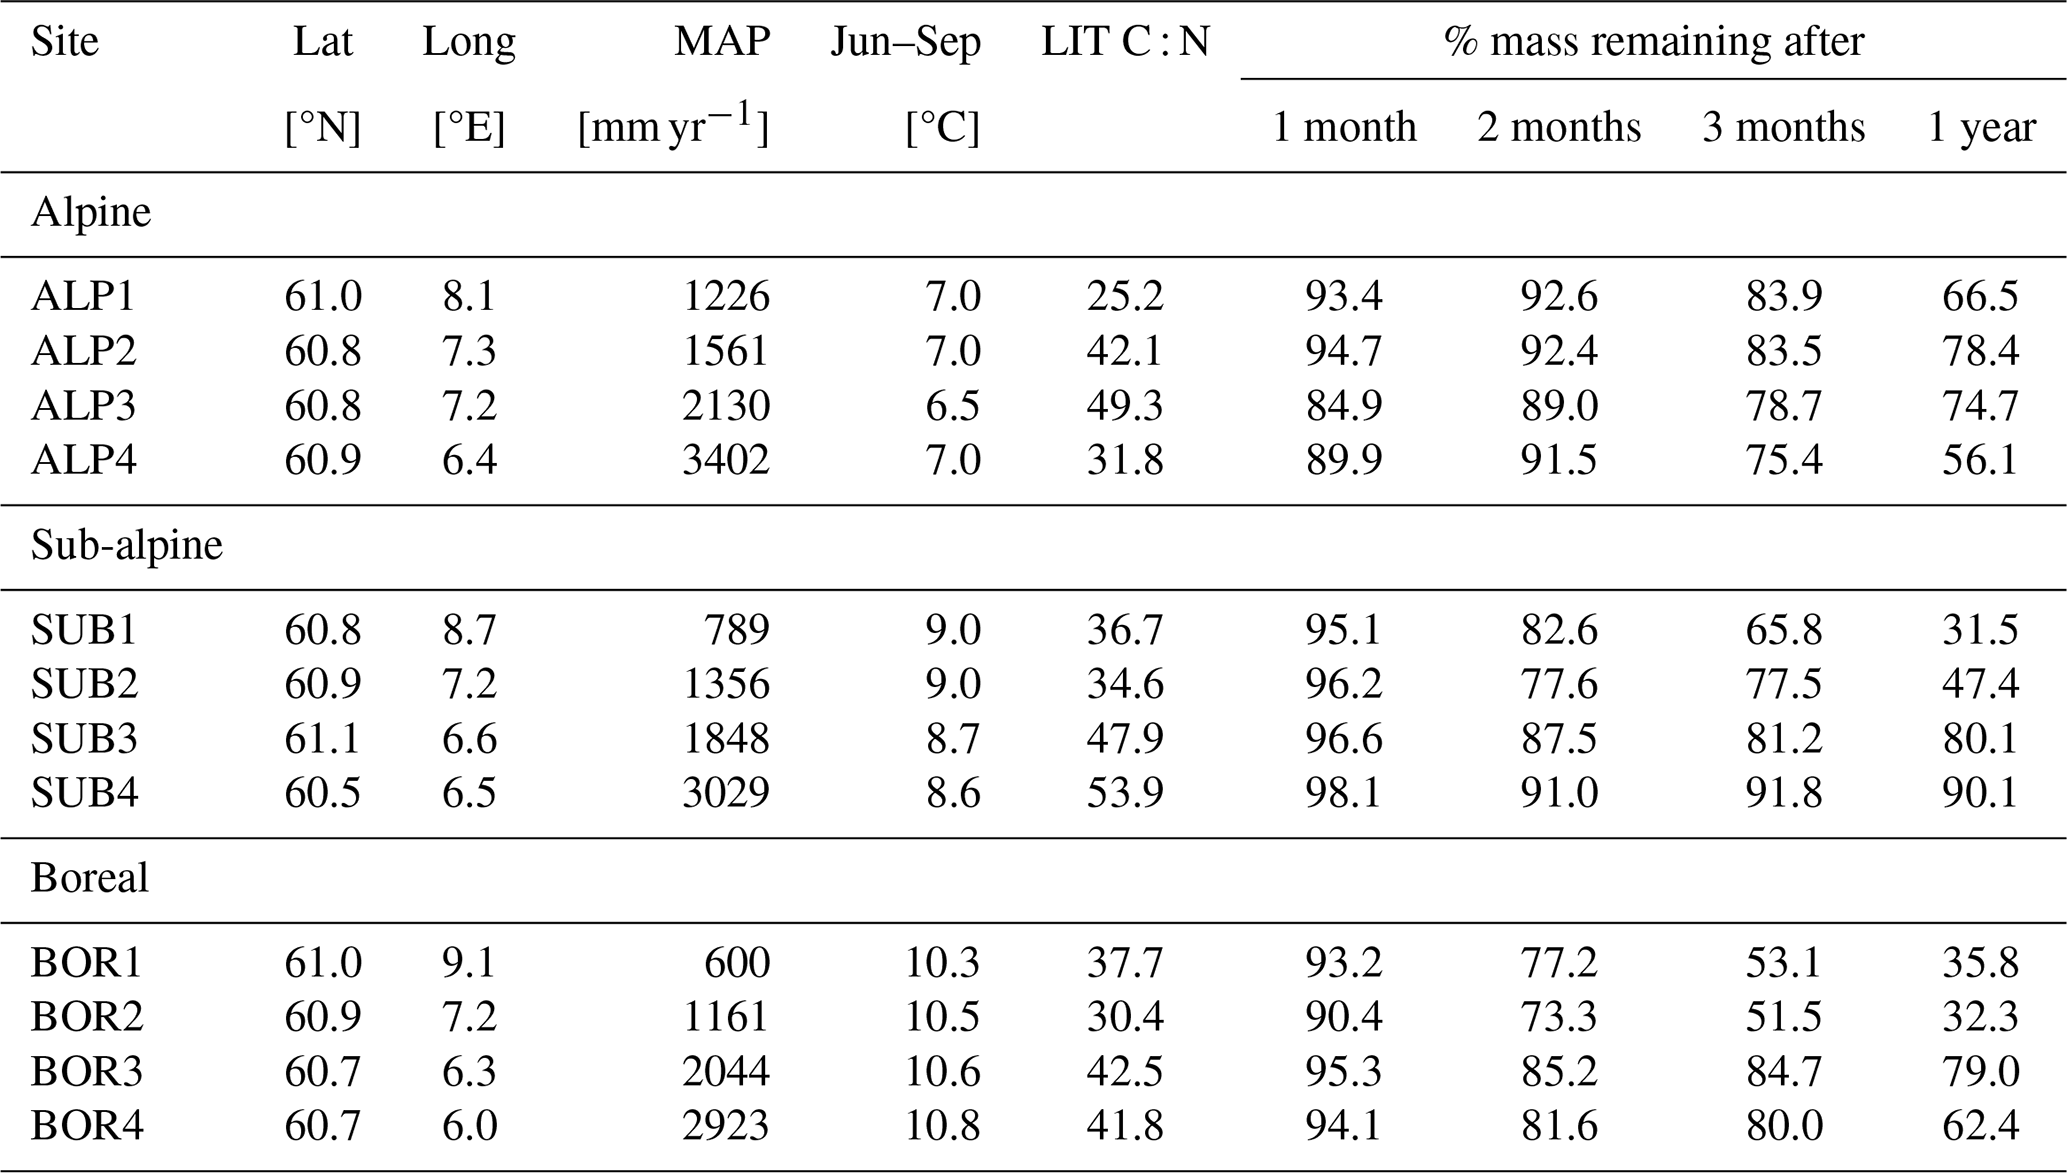
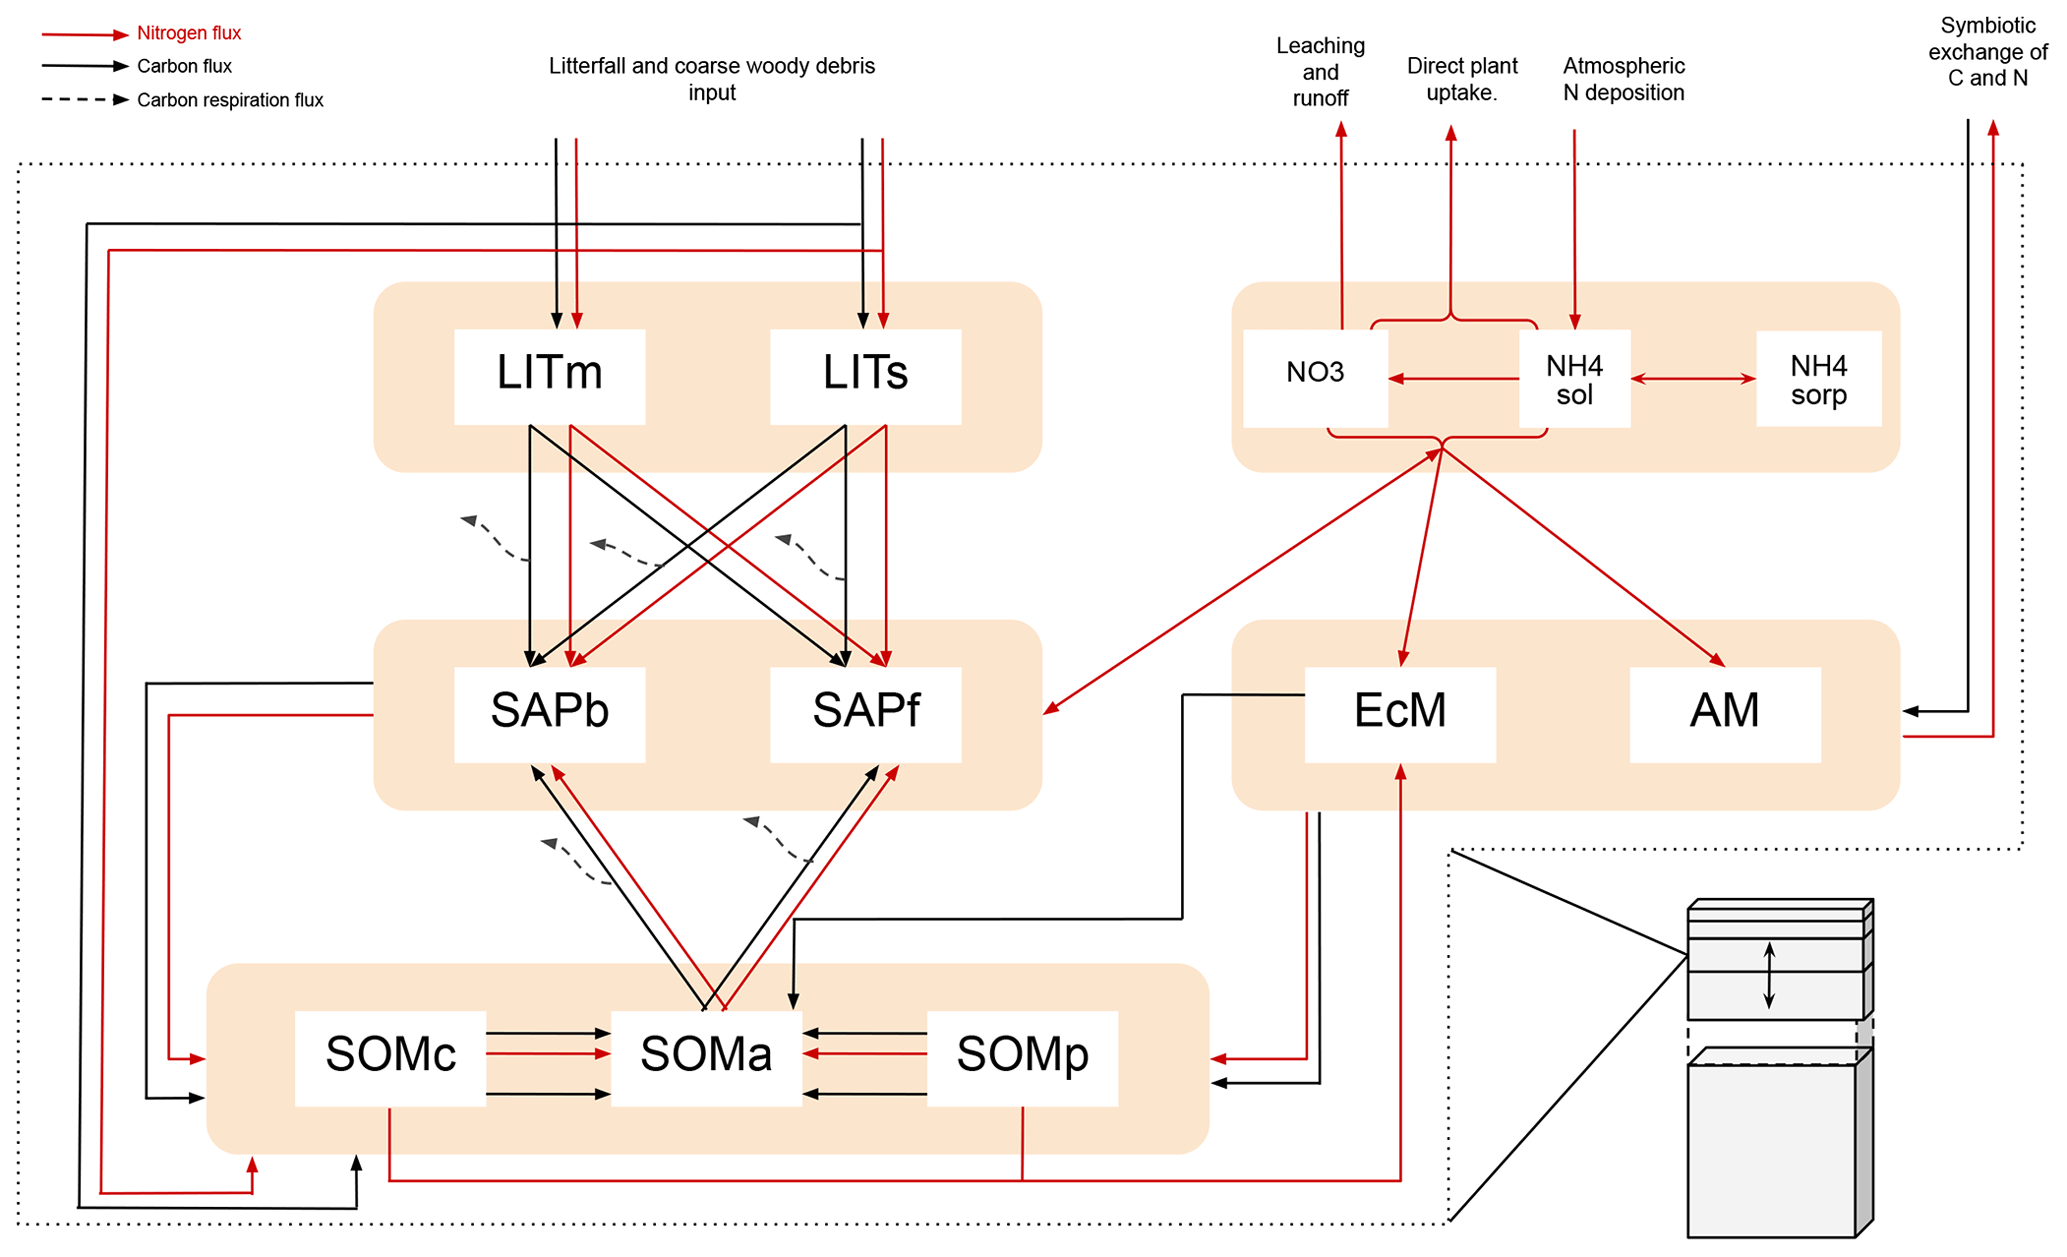
Figure B1Figure adopted from Aas et al. (2024). Schematic showing C and N flows within each layer of MIMICS+. Black arrows indicate carbon fluxes (gCm−3 h−1), while red arrows indicate nitrogen fluxes (gNm−3 h−1). The dashed black arrows symbolize C leaving the system as heterotrophic respiration. LITm, LITs: metabolic and structural litter. SAPb, SAPf: saprotrophic bacteria and fungi. EcM, AM: ecto- and arbuscular mycorrhizal fungi. SOMc, SOMa, SOMp: chemically protected, available, and physically protected soil organic matter. NO3, NH4sol, NH4sorb: inorganic N in the form of NO3, NH4 in solution, and NH4 sorbed to particles, respectively.
B1 Reverse Michaelis–Menten kinetic parameters
Vmax is the maximum reaction velocity (mg(mg)−1 h−1), T represents temperature, and Vslope and Vint are parameters determined in German et al. (2012). The parameters aV⋅Vmod can be modified depending on the type of substrate of a microbial group; see details and values in Aas et al. (2024). f(Θ) is the moisture modifier described below (Eq. B3).
Km is the half-saturation constant (mg C cm−3), and the other parameters served the same purpose as described for Vmax.
B2 Moisture function
Θliq is soil water in liquid form, Θice is soil water in ice form, and Θsat is saturated soil water content (porosity). f(Θ) has a minimum value of 0.05 and a maximum value of 1, and the P parameter normalizes the function. The first parentheses, raised to the power of 3, represent inhibition at low soil moisture, while the second parentheses represent the oxygen diffusivity limitation at high soil moisture values as a power-law function (2.5) of air-filled porosity (Sulman et al., 2014, Supplement).
B3 Calculation of metabolic fraction, fmet
The calculation and parameters used in the CLM are based on Wieder et al. (2015).
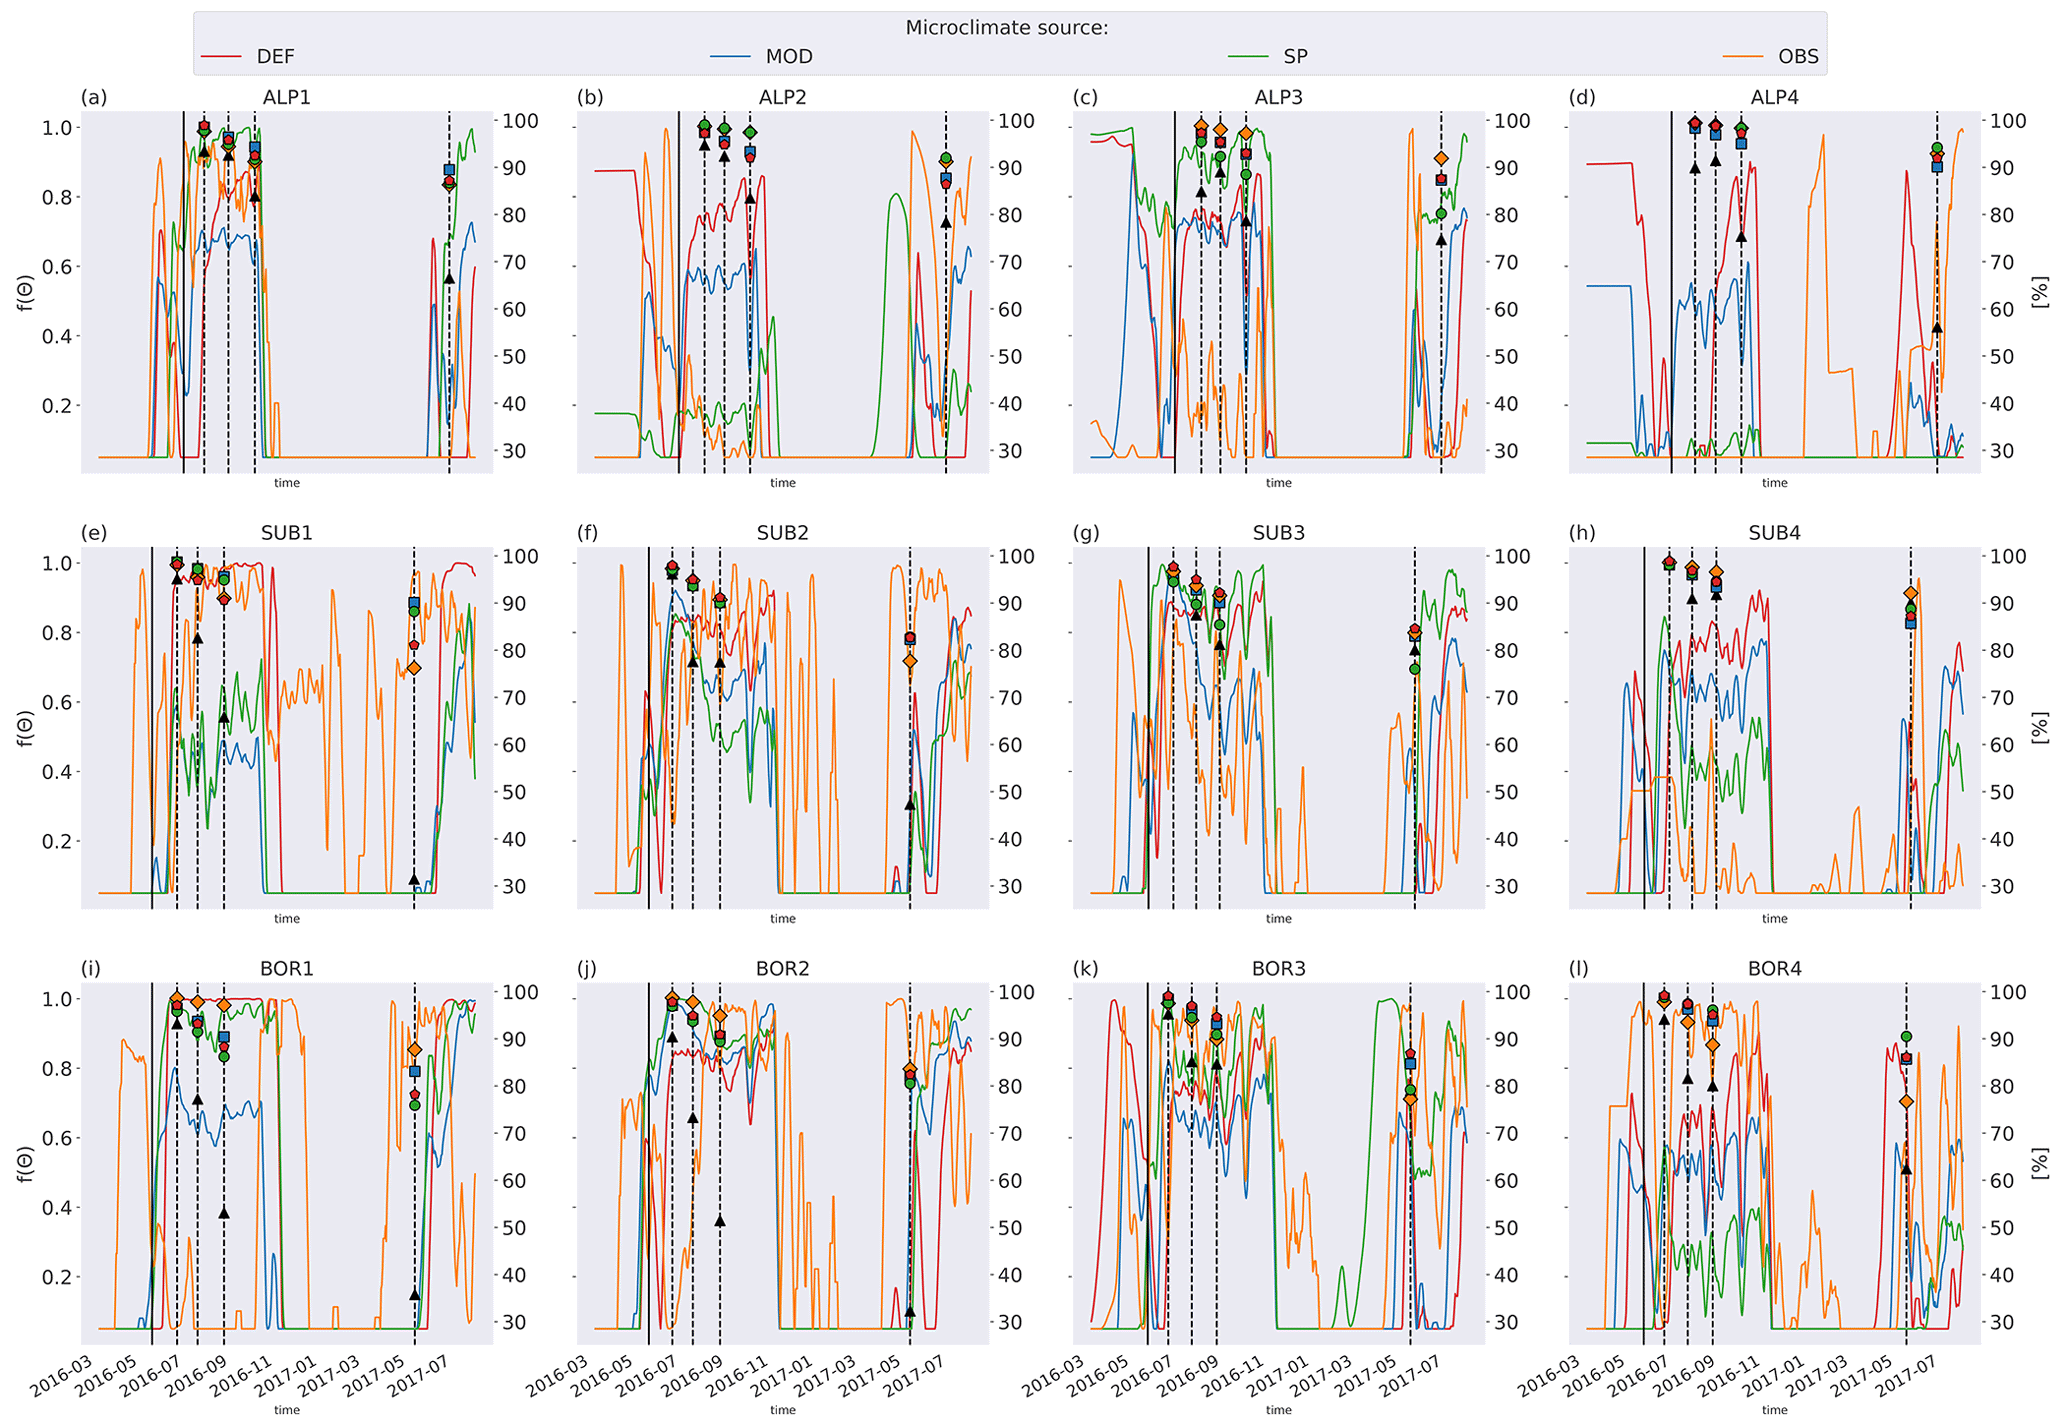
Figure C1Left axis: moisture function values in soil layer where litter is added from the four microclimate sources, namely DEF, MOD, SP, and OBS. Values are smoothed by using a 7 d rolling average. Right axis: remaining litter from observations (black triangles) and simulations using DEF microclimate (red pentagons), MOD microclimate (blue squares), SP microclimate (green circles), and OBS microclimate (orange diamonds). The solid vertical lines mark the burial date of the litterbag, while the dotted vertical lines mark collection dates after 1, 2, 3, and 12 months.
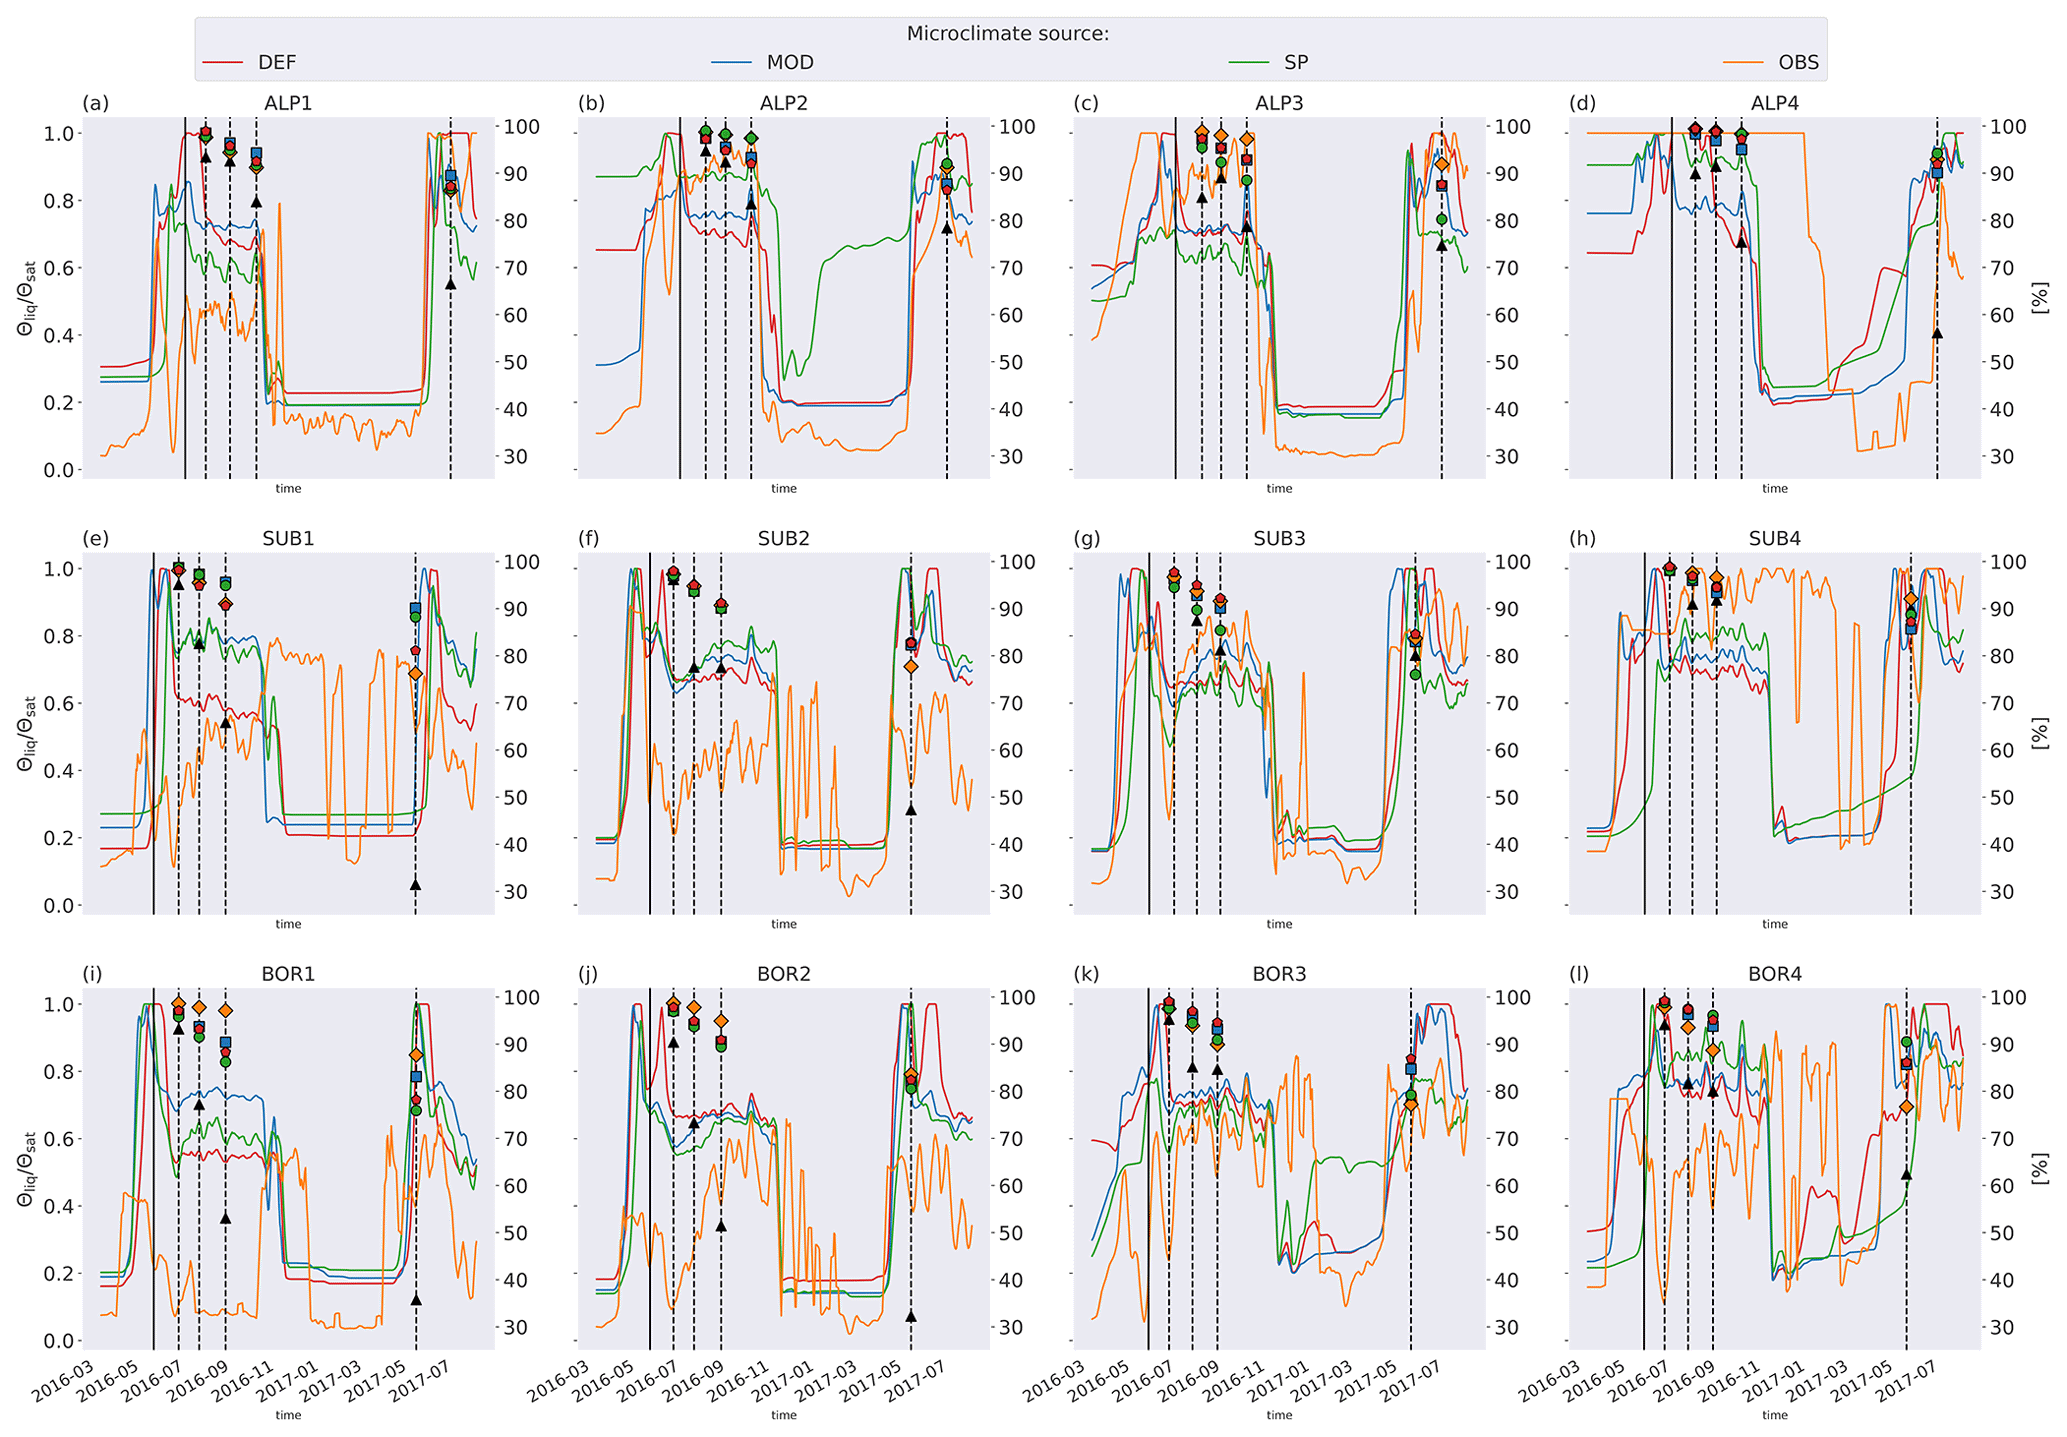
Figure C2Left axis: ratio of liquid-water to saturated-water content from the four microclimate sources, namely DEF, MOD, SP, and OBS. Values are smoothed by using a 7 d rolling average. Right axis: remaining litter from observations (black triangles) and simulations using DEF microclimate (red pentagons), MOD microclimate (blue squares), SP microclimate (green circles), and OBS microclimate (orange diamonds). The solid vertical lines mark the burial date of the litterbag, while the dotted vertical lines mark collection dates after 1, 2, 3, and 12 months.
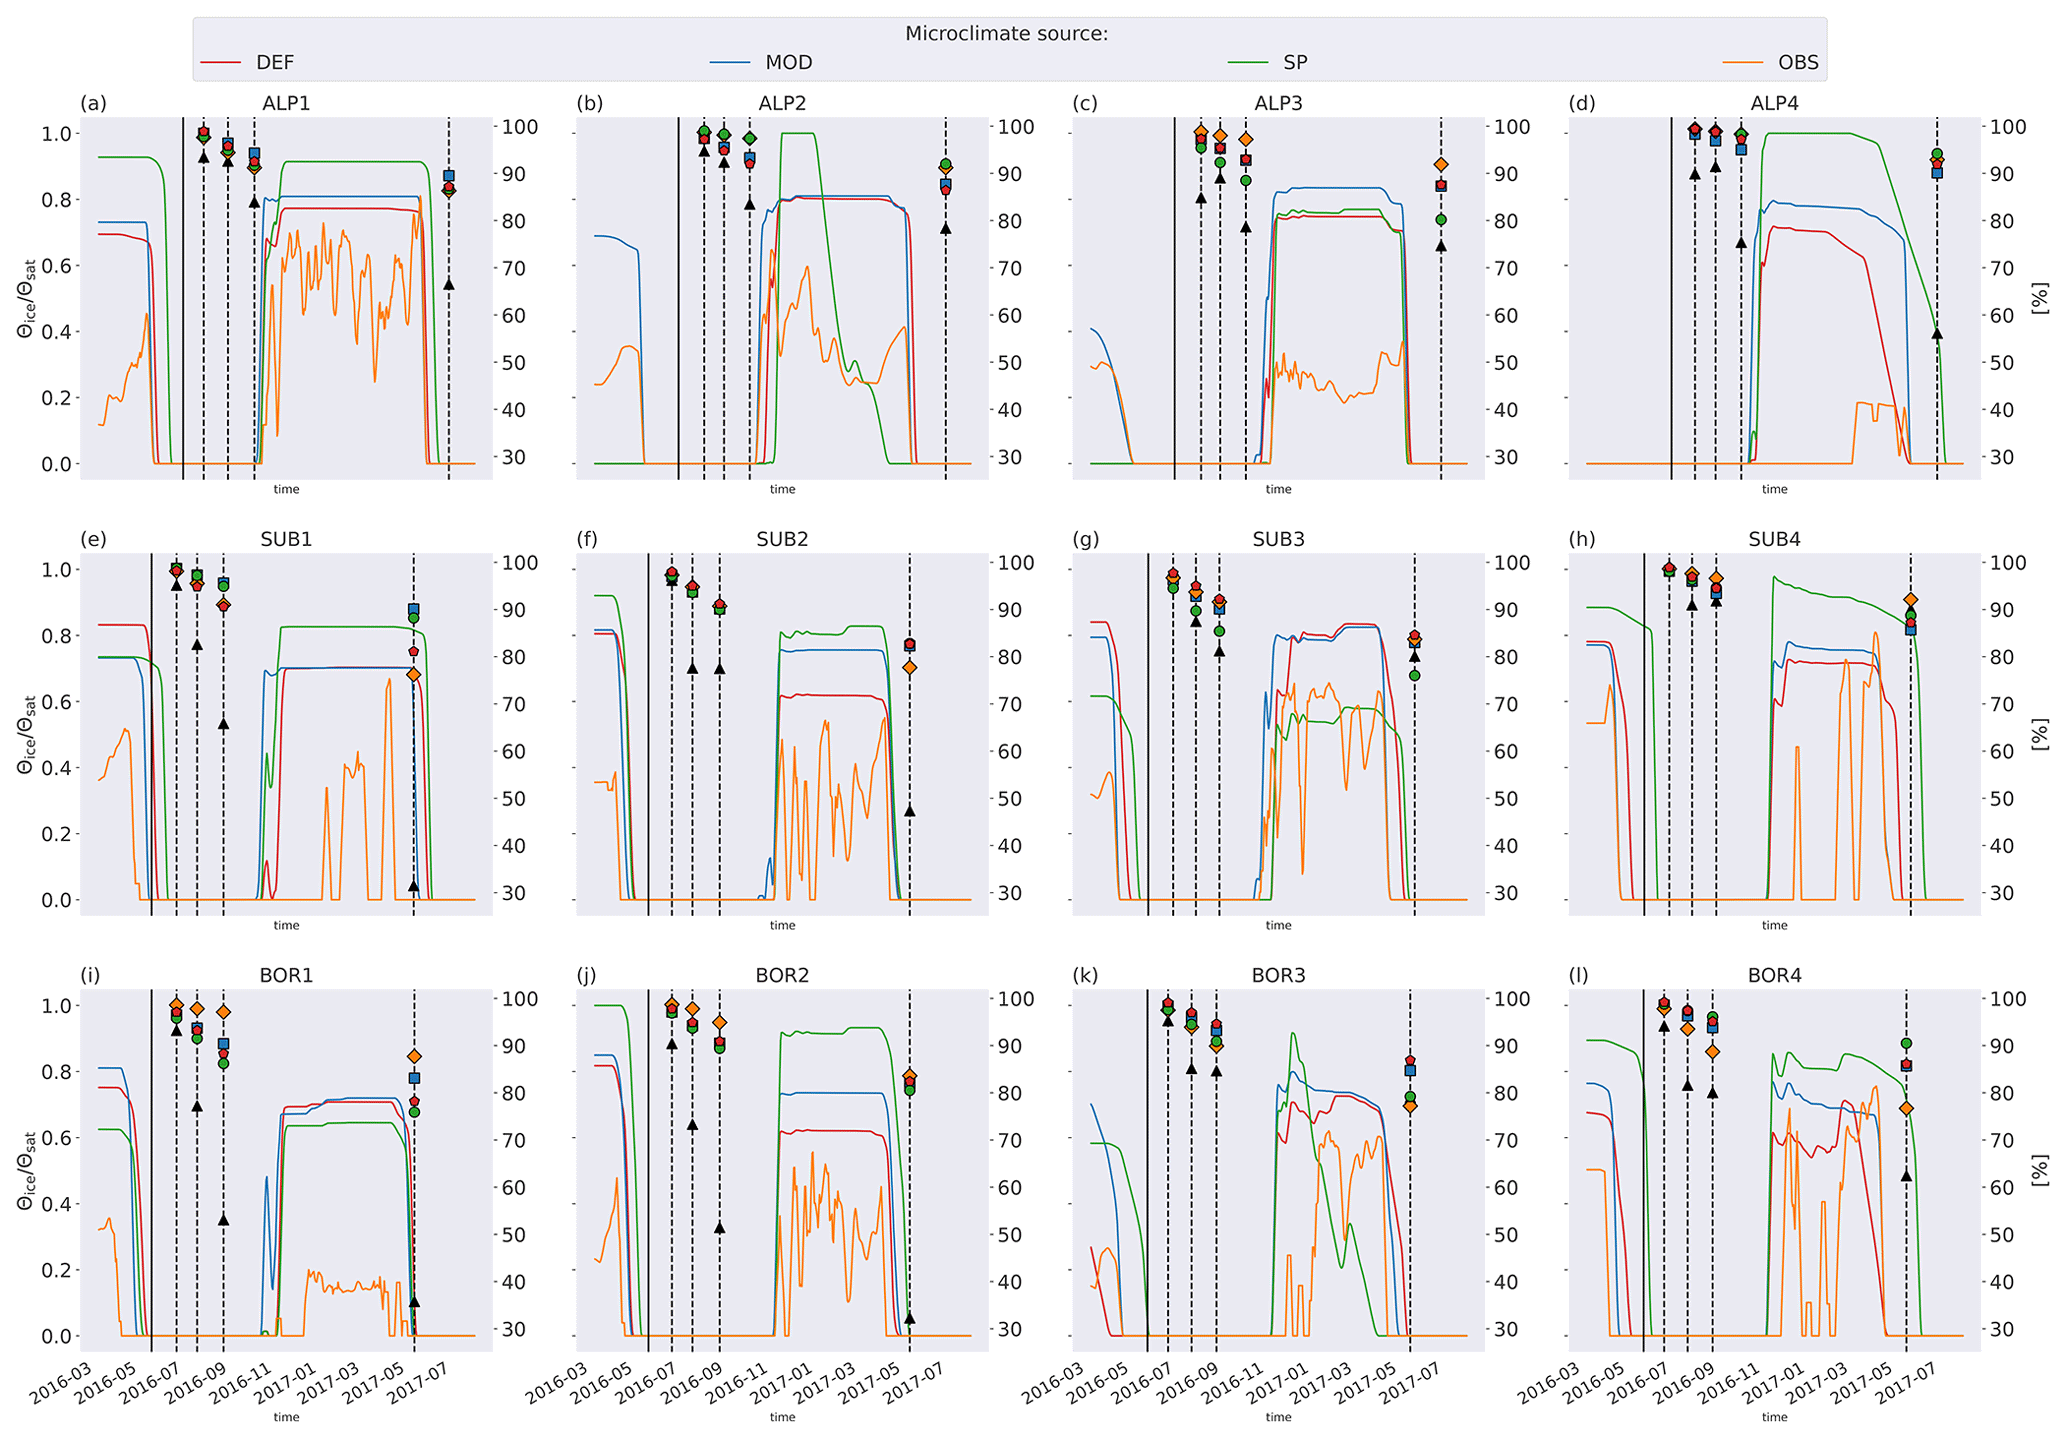
Figure C3Left axis: ratio of frozen-water to saturated-water content from the four microclimate sources, namely DEF, MOD, SP, and OBS. Values are smoothed by using a 7 d rolling average. Right axis: remaining litter from observations (black triangles) and simulations using DEF microclimate (red pentagons), MOD microclimate (blue squares), SP microclimate (green circles), and OBS microclimate (orange diamonds). The solid vertical lines mark the burial date of the litterbag, while the dotted vertical lines mark collection dates after 1, 2, 3, and 12 months.
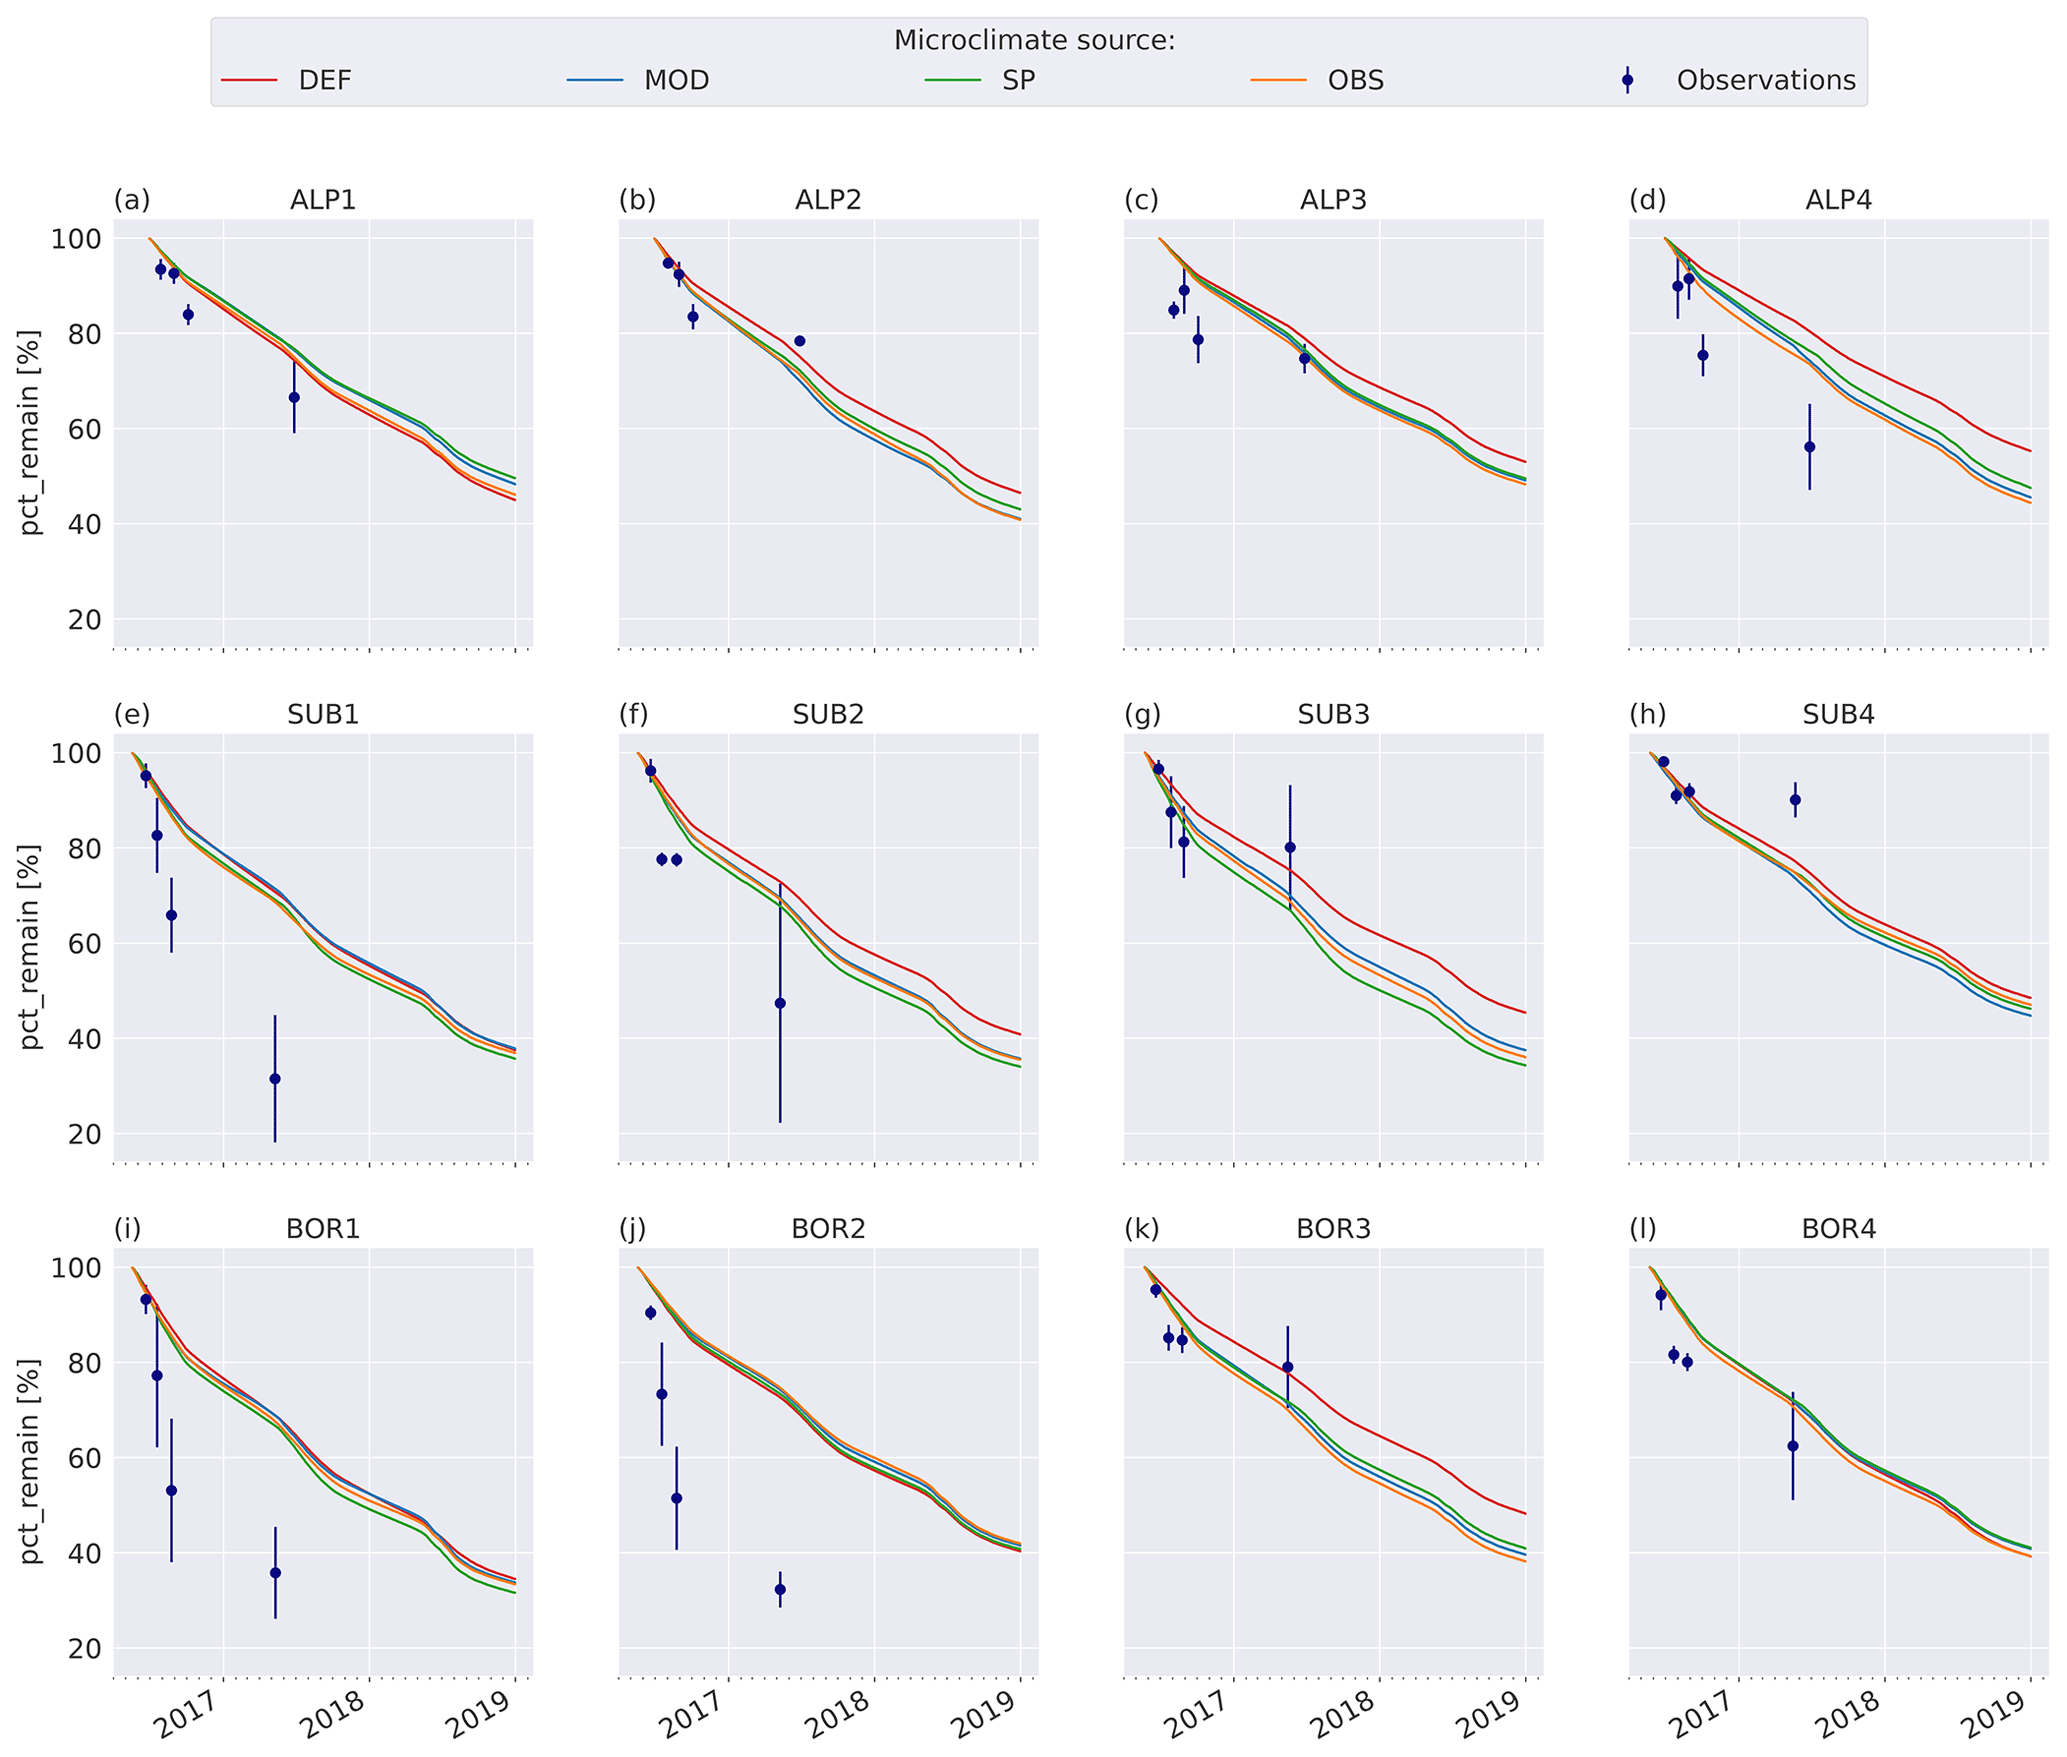
Figure C4Remaining mass (%) in litterbags at VCG sites (Vandvik et al., 2022) for MIMICS+ simulations without any moisture limitation on decomposition (solid lines) and observations (dots).
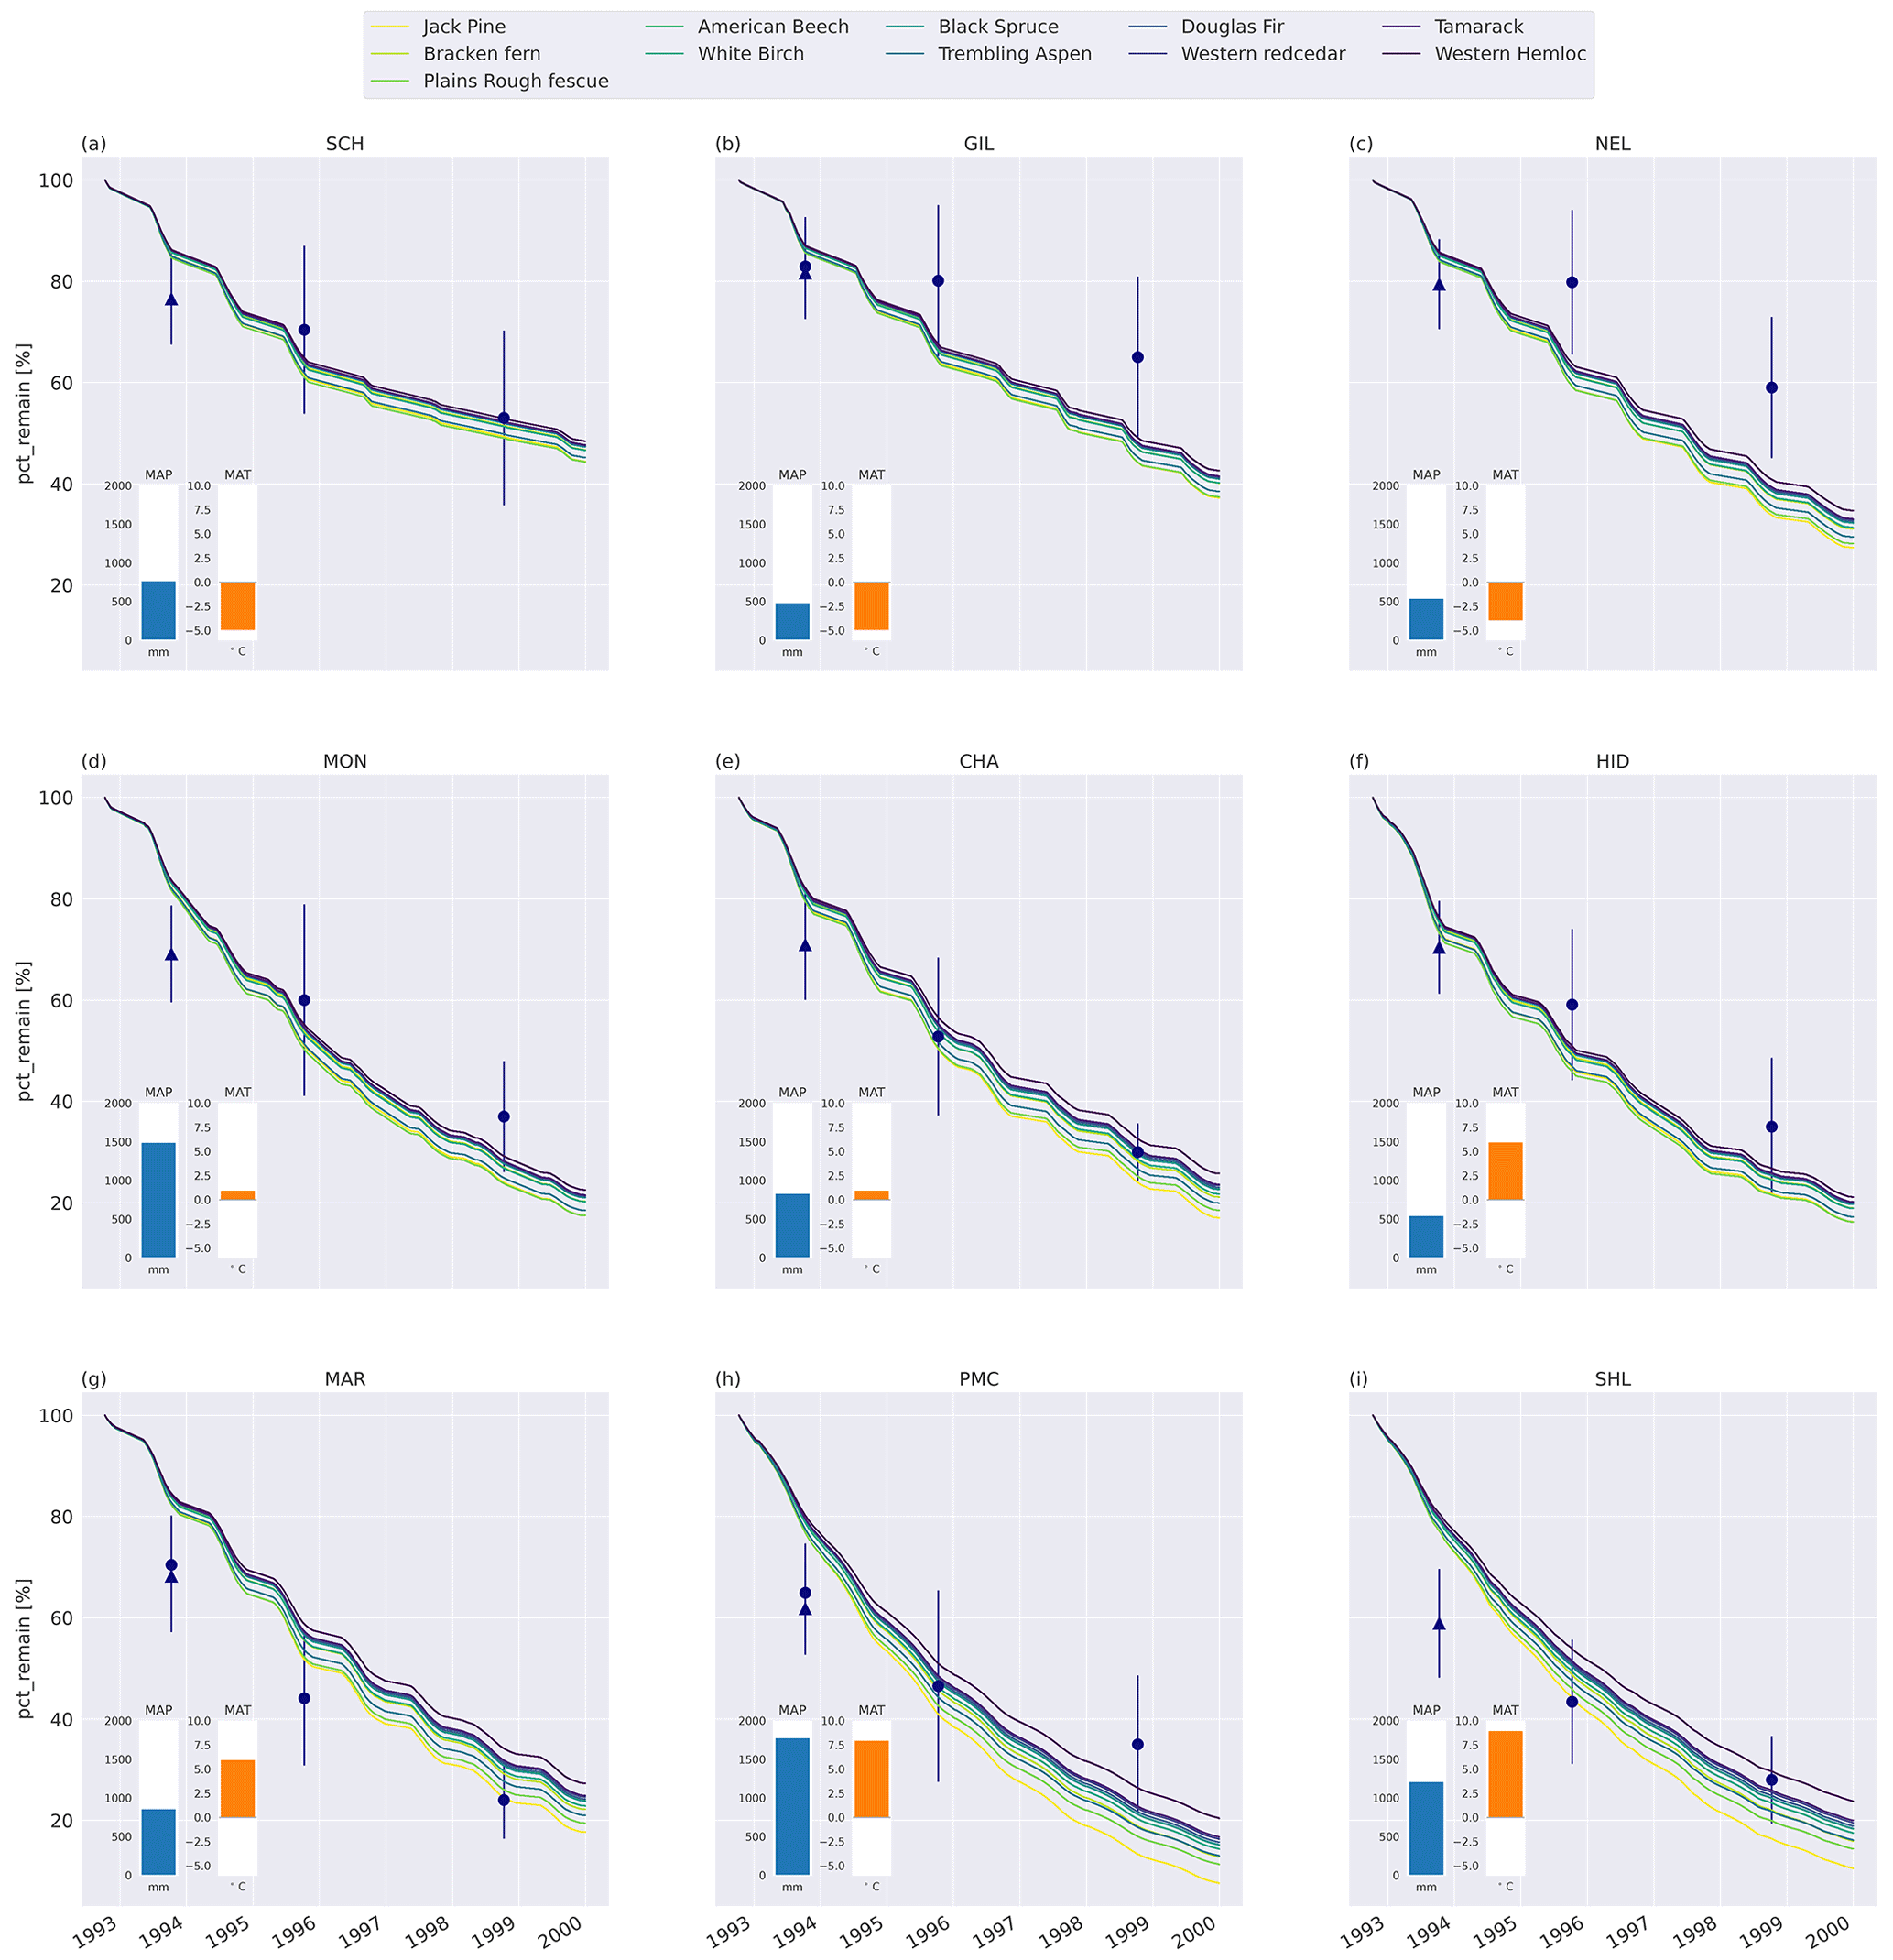
Figure C5Percent remaining mass in litterbags at CIDET sites. The lines show model simulations where litter was added to the third model layer (6–12 cm depth), with the color indicating the type of litter. The lighter the line color, the lower the C : N ratio (see Table A2). The blue dots show the observed mean mass loss of each site across all litter types after 3 and 6 years (Moore et al., 2017, 1999; Trofymow et al., 2002), while the triangles show observed mean mass loss after 1 year across the 10 foliar litter types (Viskari et al., 2021). The error bar shows the standard deviation (SD). The SD was calculated from the reported standard error of the mean, with N=11. The inserted bars show the 1951–1980 average MAP (blue) and MAT (orange) for each site (Trofymow and the CIDET Working Group, 1998).
This appendix contains tables with information about the surface parameters used in the different CLM simulations used in this study.
Table D1Surface parameters used in the CLM simulations of the nine CIDET sites. Pct dom.: percentage of the dominating PFT used in the simulations.
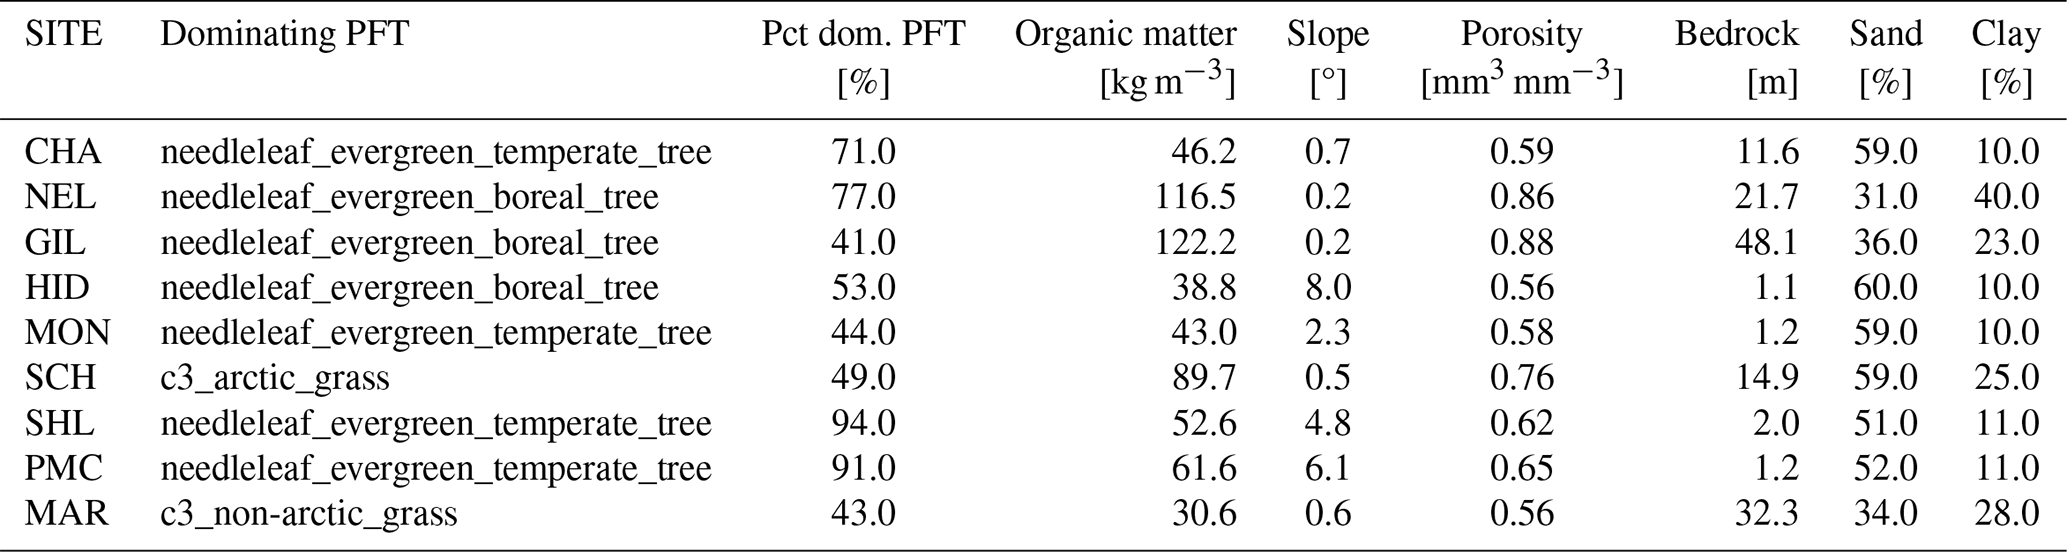
Table D2Surface parameters used in the CLM simulations of the 12 VCG sites using default parameters (simulation set DEF; see Fig. 1). Pct dom.: percentage of the dominating PFT used in the simulations.
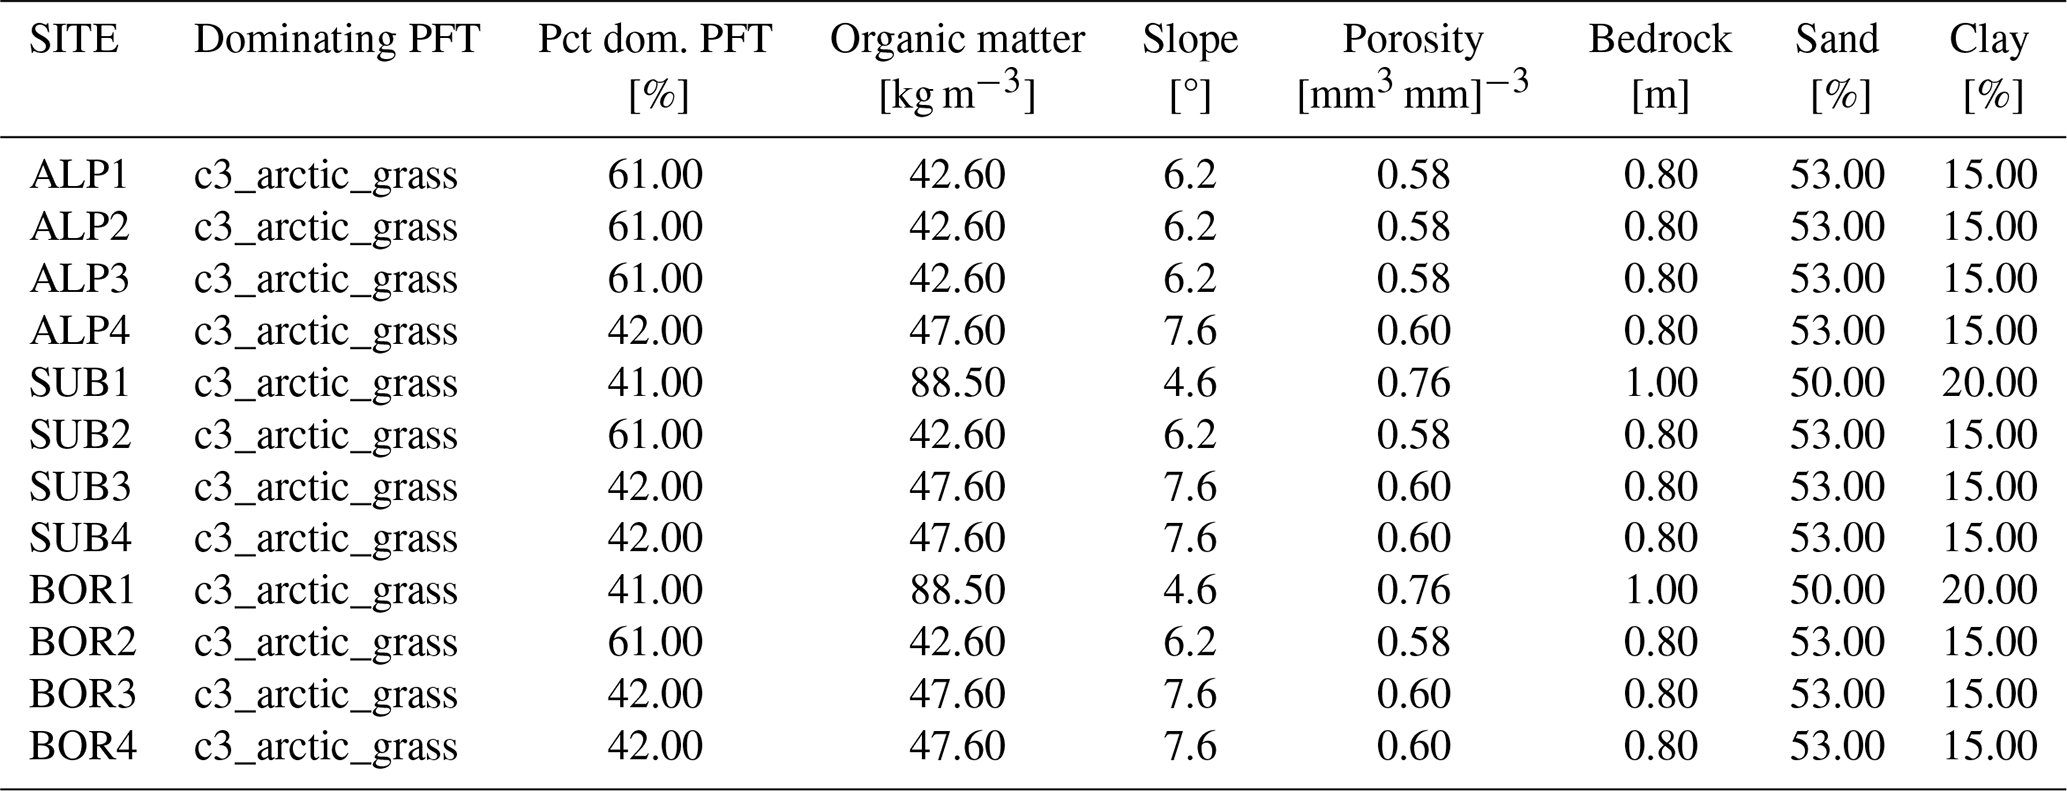
Table D3Surface parameters used in the CLM simulations of the 12 VCG sites using modified parameters (simulation set MOD; see Fig. 1). Pct dom.: percentage of the dominating PFT used in the simulations.
E1 Calculation of relative litter mass loss
The relative mass losses of a litter type compared to western hemlock (the slowest-decomposing substrate), shown in Figs. 3 and C6, are calculated using the following equation:
where pct and pct are the percentage of mass lost in litter type i and in western hemlock, respectively, at time t. The figures show yearly average values.
E2 Calculation of normalized RMSE for mass loss at VCG
The normalized root mean square errors (NRMSEs) referred to in Sect. 4.3 are calculated using the following equation:
where Omax and Omin are, respectively, the maximum and minimum observed percentage mass remaining across N=48 data points (four sampling times at 12 sites). M is the corresponding modeled percentage of mass remaining.
Input data and the MIMICS+ model version used in this study are available at https://doi.org/10.5281/zenodo.12599189 (Aas, 2024) together with a Jupyter notebook that was used for producing plots and analysis. The VCG litterbag data are available at https://doi.org/10.17605/OSF.IO/NPFA9 (Telford et al., 2023) (7_Ecosystem_data).
Conceptualization: ERA, TKB. Data curation: ERA, IA, SG, EL. Formal analysis: ERA. Funding acquisition: TKB, VV. Investigation: ERA, TKB, IA. Methodology: ERA, TB. Project administration: ERA. Resources: ERA. Software: ERA, HT, EL. Supervision: TKB. Validation: ERA. Visualization: ERA, EL. Writing – original draft: ERA. Writing – review and editing: ERA, EL, IA, HT, SG, TKB, VV.
The contact author has declared that none of the authors has any competing interests.
Publisher's note: Copernicus Publications remains neutral with regard to jurisdictional claims made in the text, published maps, institutional affiliations, or any other geographical representation in this paper. While Copernicus Publications makes every effort to include appropriate place names, the final responsibility lies with the authors.
This research has been supported by the Norges Forskningsråd (grant nos. 294948, 315249, and 287490), the Strategic Research Council (SRC) at the Research Council of Finland (grant no. 352431), and the National Infrastructure for High-Performance Computing and Data Storage in Norway (grant no. NN2806k/NS2806k).
This paper was edited by Daniel S. Goll and reviewed by Emma Hauser and Toni Viskari.
Aas, E. R.: Code and data for “Implications of climate and litter quality for simulations of litterbag decomposition at high latitudes” revised version, Zenodo [data set], https://doi.org/10.5281/zenodo.12599189, 2024. a
Aas, E. R., de Wit, H. A., and K. Berntsen, T.: Modeling boreal forest soil dynamics with the microbially explicit soil model MIMICS+ (v1.0), Geosci. Model Dev., 17, 2929–2959, https://doi.org/10.5194/gmd-17-2929-2024, 2024. a, b, c, d, e
Aas, K. S., Gisnås, K., Westermann, S., and Berntsen, T. K.: A Tiling Approach to Represent Subgrid Snow Variability in Coupled Land Surface–Atmosphere Models, J. Hydrometeorol., 18, 49 – 63, https://doi.org/10.1175/JHM-D-16-0026.1, 2017. a
Adair, E. C., Parton, W. J., Del Grosso, S. J., Silver, W. L., Harmon, M. E., Hall, S. A., Burke, I. C., and Hart, S. C.: Simple three-pool model accurately describes patterns of long-term litter decomposition in diverse climates, Glob. Change Biol., 14, 2636–2660, https://doi.org/10.1111/j.1365-2486.2008.01674.x, 2008. a
Aerts, R.: Climate , Leaf Litter Chemistry and Leaf Litter Decomposition in Terrestrial Ecosystems: A Triangular Relationship, Oikos, 79, 439–449, https://doi.org/10.2307/3546886, 1997. a
Aerts, R.: The freezer defrosting: global warming and litter decomposition rates in cold biomes, J. Ecol., 94, 713–724, https://doi.org/10.1111/j.1365-2745.2006.01142.x, 2006. a
Althuizen, I., Lee, H., Michel, P., and Vandvik, V.: Interactive effects of climate change and litter quality enhance decomposition in alpine grasslands, in preparation, 2024. a
Althuizen, I. H., Lee, H., Sarneel, J. M., and Vandvik, V.: Long-Term Climate Regime Modulates the Impact of Short-Term Climate Variability on Decomposition in Alpine Grassland Soils, Ecosystems, 21, 1580–1592, https://doi.org/10.1007/s10021-018-0241-5, 2018. a
Angst, G., Mueller, K. E., Nierop, K. G., and Simpson, M. J.: Plant- or microbial-derived? A review on the molecular composition of stabilized soil organic matter, Soil Biol. Biochem., 156, 108189, https://doi.org/10.1016/j.soilbio.2021.108189, 2021. a
Bokhorst, S., Bjerke, J. W., Melillo, J., Callaghan, T. V., and Phoenix, G. K.: Impacts of extreme winter warming events on litter decomposition in a sub-Arctic heathland, Soil Biol. Biochem., 42, 611–617, https://doi.org/10.1016/j.soilbio.2009.12.011, 2010. a
Bollmeyer, C., Keller, J. D., Ohlwein, C., Wahl, S., Crewell, S., Friederichs, P., Hense, A., Keune, J., Kneifel, S., Pscheidt, I., Redl, S., and Steinke, S.: Towards a high-resolution regional reanalysis for the European CORDEX domain, Q. J. Roy. Meteor. Soc., 141, 1–15, https://doi.org/10.1002/qj.2486, 2015. a
Bradford, M. A., Tordoff, G. M., Eggers, T., Jones, T. H., and Newington, J. E.: Microbiota, fauna, and mesh size interactions in litter decomposition, Oikos, 99, 317–323, https://doi.org/10.1034/j.1600-0706.2002.990212.x, 2002. a
Bradford, M. A., Berg, B., Maynard, D. S., Wieder, W. R., and Wood, S. A.: Understanding the dominant controls on litter decomposition, J. Ecol., 104, 229–238, https://doi.org/10.1111/1365-2745.12507, 2016. a
Chandel, A. K., Jiang, L., and Luo, Y.: Microbial Models for Simulating Soil Carbon Dynamics: A Review, J. Geophys. Res.-Biogeo., 128, 1–27, https://doi.org/10.1029/2023JG007436, 2023. a, b, c
Chapin, F. S., Matson, P. A., and Vitousek, P. M.: Principles of Terrestrial Ecosystem Ecology, vol. 6, Springer New York, NY, New York, 2 edn., ISBN 978-1-4419-9504-9, https://doi.org/10.1007/978-1-4419-9504-9, 2011. a
Crowther, T. W., van den Hoogen, J., Wan, J., Mayes, M. A., Keiser, A. D., Mo, L., Averill, C., and Maynard, D. S.: The global soil community and its influence on biogeochemistry, Science, 365, eaav0550, https://doi.org/10.1126/science.aav0550, 2019. a
De Frenne, P., Zellweger, F., Rodríguez-Sánchez, F., Scheffers, B. R., Hylander, K., Luoto, M., Vellend, M., Verheyen, K., and Lenoir, J.: Global buffering of temperatures under forest canopies, Nat. Ecol. Evol., 3, 744–749, 2019. a
Djukic, I., Kepfer-Rojas, S., Schmidt, I. K., Larsen, K. S., Beier, C., Berg, B., Verheyen, K., and TeaComposition: Early stage litter decomposition across biomes, Sci. Total Environ., 628-629, 1369–1394, https://doi.org/10.1016/j.scitotenv.2018.01.012, 2018. a
German, D. P., Marcelo, K. R. B., Stone, M. M., and Allison, S. D.: The Michaelis-Menten kinetics of soil extracellular enzymes in response to temperature: A cross-latitudinal study, Glob. Change Biol., 18, 1468–1479, https://doi.org/10.1111/j.1365-2486.2011.02615.x, 2012. a, b
Graae, B. J., Frenne, P. D., Kolb, A., Brunet, J., Chabrerie, O., Verheyen, K., Pepin, N., Heinken, T., Zobel, M., Shevtsova, A., Nijs, I., and Milbau, A.: On the use of weather data in ecological studies along altitudinal and latitudinal gradients, Oikos, 121, 3–19, https://doi.org/10.1111/j.1600-0706.2011.19694.x, 2012. a
Halbritter, A. H., De Boeck, H. J., Eycott, A. E., Reinsch, S., Robinson, D. A., Vicca, S., Berauer, B., Christiansen, C. T., Estiarte, M., Grünzweig, J. M., Gya, R., Hansen, K., Jentsch, A., Lee, H., Linder, S., Marshall, J., Peñuelas, J., Kappel Schmidt, I., Stuart-Haëntjens, E., Wilfahrt, P., the ClimMani Working Group, and Vandvik, V.: The handbook for standardized field and laboratory measurements in terrestrial climate change experiments and observational studies (ClimEx), Methods in Ecol. Evol., 11, 22–37, https://doi.org/10.1111/2041-210X.13331, 2020. a, b
Harmon, M. E., Silver, W. L., Fasth, B., Chen, H., Burke, I. C., Parton, W. J., Hart, S. C., Currie, W. S., Laundre, J., Wright, J., Yarie, J., Wedin, D., Clinton, B., Lugo, A., Fahey, T., Melillo, J., Anderson, J., McClellan, M., Halstead, S., Blair, J., Sollins, P., Lodge, J., Baron, J., Nankarni, N., Morris, J., Gower, T., Edmonds, R., White, C., Zedler, P., Gholz, H., and Blum, L.: Long-term patterns of mass loss during the decomposition of leaf and fine root litter: An intersite comparison, Glob. Change Biol., 15, 1320–1338, https://doi.org/10.1111/j.1365-2486.2008.01837.x, 2009. a
IPCC: IPCC, 2023: Climate Change 2023: Synthesis Report. Contribution of Working Groups I, II and III to the Sixth Assessment Report of the Intergovernmental Panel on Climate Change, Geneva, Switzerland, https://doi.org/10.59327/IPCC/AR6-9789291691647, 2023. a
Johannessen, O. M., Kuzmina, S. I., Bobylev, L. P., and Miles, M. W.: Surface air temperature variability and trends in the Arctic: New amplification assessment and regionalisation, Tellus A, 68, 28234, https://doi.org/10.3402/tellusa.v68.28234, 2016. a
Joly, F.-X., Scherer-lorenzen, M., and Hättenschwiler, S.: Resolving the intricate role of climate in litter decomposition, Nat. Ecol. Evol., 7, 214–223, https://doi.org/10.1038/s41559-022-01948-z, 2023. a, b
Keuskamp, J. A., Dingemans, B. J., Lehtinen, T., Sarneel, J. M., and Hefting, M. M.: Tea Bag Index: a novel approach to collect uniform decomposition data across ecosystems, Methods Ecol. Evol., 4, 1070–1075, https://doi.org/10.1111/2041-210X.12097, 2013. a
Klanderud, K., Vandvik, V., and Goldberg, D.: The importance of Biotic vs. Abiotic drivers of local plant community composition along regional bioclimatic gradients, PLoS ONE, 10, 1–14, https://doi.org/10.1371/journal.pone.0130205, 2015. a
Kurz-Besson, C., Coûteaux, M.-M., Thiéry, J. M., Berg, B., and Remacle, J.: A comparison of litterbag and direct observation methods of Scots pine needle decomposition measurement, Soil Biol. Biochem., 37, 2315–2318, https://doi.org/10.1016/j.soilbio.2005.03.022, 2005. a
Kyker-Snowman, E., Wieder, W. R., Frey, S. D., and Grandy, A. S.: Stoichiometrically coupled carbon and nitrogen cycling in the MIcrobial-MIneral Carbon Stabilization model version 1.0 (MIMICS-CN v1.0), Geosci. Model Dev., 13, 4413–4434, https://doi.org/10.5194/gmd-13-4413-2020, 2020. a
Kyker-Snowman, E., Lombardozzi, D. L., Bonan, G. B., Cheng, S. J., Dukes, J. S., Frey, S. D., Jacobs, E. M., McNellis, R., Rady, J. M., Smith, N. G., Thomas, R. Q., Wieder, W. R., and Grandy, A. S.: Increasing the spatial and temporal impact of ecological research: A roadmap for integrating a novel terrestrial process into an Earth system model, Glob. Change Biol., 28, 665–684, https://doi.org/10.1111/gcb.15894, 2022. a
Lawrence, D. M., Fisher, R. A., Koven, C. D., Oleson, K. W., Swenson, S. C., Bonan, G., Collier, N., Ghimire, B., van Kampenhout, L., Kennedy, D., Kluzek, E., Lawrence, P. J., Li, F., Li, H., Lombardozzi, D., Riley, W. J., Sacks, W. J., Shi, M., Vertenstein, M., Wieder, W. R., Xu, C., Ali, A. A., Badger, A. M., Bisht, G., van den Broeke, M., Brunke, M. A., Burns, S. P., Buzan, J., Clark, M., Craig, A., Dahlin, K., Drewniak, B., Fisher, J. B., Flanner, M., Fox, A. M., Gentine, P., Hoffman, F., Keppel-Aleks, G., Knox, R., Kumar, S., Lenaerts, J., Leung, L. R., Lipscomb, W. H., Lu, Y., Pandey, A., Pelletier, J. D., Perket, J., Randerson, J. T., Ricciuto, D. M., Sanderson, B. M., Slater, A., Subin, Z. M., Tang, J., Thomas, R. Q., Val Martin, M., and Zeng, X.: The Community Land Model Version 5: Description of New Features, Benchmarking, and Impact of Forcing Uncertainty, J. Adv. Model. Earth Sy., 11, 4245–4287, https://doi.org/10.1029/2018MS001583, 2019. a, b, c, d
Lindahl, B. D. and Tunlid, A.: Ectomycorrhizal fungi–potential organic matter decomposers, yet not saprotrophs, New Phytol., 205, 1443–1447, https://doi.org/10.1111/nph.13201, 2015. a
Moore, T. R., Trofymow, J. A., Taylor, B., Prescott, C., Camiré, C., Duschene, L., Fyles, J., Kozak, L., Kranabetter, M., Morrison, I., Siltanen, M., Smith, S., Titus, B., Visser, S., Wein, R., and Zoltai, S.: Litter decomposition rates in Canadian forests, Glob. Change Biol., 5, 75–82, https://doi.org/10.1046/J.1365-2486.1998.00224.X, 1999. a, b, c, d, e, f
Moore, T. R., Trofymow, J. A., Prescott, C. E., Titus, B. D., and the CIDET Working Group: Can short-term litter-bag measurements predict long-term decomposition in northern forests?, Plant Soil, 416, 419–426, https://doi.org/10.1007/s11104-017-3228-7, 2017. a, b, c
Moorhead, D. L. and Weintraub, M. N.: The evolution and application of the reverse Michaelis-Menten equation, Soil Biol. Biochem., 125, 261–262, https://doi.org/10.1016/J.SOILBIO.2018.07.021, 2018. a
Mooshammer, M., Wanek, W., Zechmeister-Boltenstern, S., and Richter, A.: Stoichiometric imbalances between terrestrial decomposer communities and their resources: Mechanisms and implications of microbial adaptations to their resources, Front. Microbiol., 5, 1–10, https://doi.org/10.3389/FMICB.2014.00022, 2014. a
Niu, G.-Y. and Yang, Z.-L.: Effects of Frozen Soil on Snowmelt Runoff and Soil Water Storage at a Continental Scale, J. Hydrometeorol., 7, 937–952, https://doi.org/10.1175/JHM538.1, 2006. a
Peng, Y., Holmstrup, M., Schmidt, I. K., Bachega, L. R., Schelfhout, S., Zheng, H., Hedĕnec, P., Yue, K., and Vesterdal, L.: Forest Ecology and Management Tree species identity is the predominant modulator of the effects of soil fauna on leaf litter decomposition, Forest Ecol. Manag., 520, 120396, https://doi.org/10.1016/j.foreco.2022.120396, 2022. a
Pirk, N., Aalstad, K., Yilmaz, Y. A., Vatne, A., Popp, A. L., Horvath, P., Bryn, A., Vollsnes, A. V., Westermann, S., Berntsen, T. K., Stordal, F., and Tallaksen, L. M.: Snow–vegetation–atmosphere interactions in alpine tundra, Biogeosciences, 20, 2031–2047, https://doi.org/10.5194/bg-20-2031-2023, 2023. a
Preston, C. M. and Trofymow, J. A.: Variability in litter quality and its relationship to litter decay in Canadian forests, Can. J. Bot., 78, 1269–1287, https://doi.org/10.1139/cjb-78-10-1269, 2000. a, b
Rixen, C., Høye, T. T., Macek, P., Aerts, R., Alatalo, J. M., Anderson, J. T., Arnold, P. A., Barrio, I. C., Bjerke, J. W., Björkman, M. P., et al.: Winters are changing: snow effects on Arctic and alpine tundra ecosystems, Arctic Science, 8, 572–608, 2022. a
Rocci, K. S., Cleveland, C. C., Eastman, B. A., Georgiou, K., Grandy, A. S., Hartman, M. D., Hauser, E., Holland-Moritz, H., Kyker-Snowman, E., Pierson, D., Reich, P. B., Schlerman, E. P., and Wieder, W. R.: Aligning theoretical and empirical representations of soil carbon-to-nitrogen stoichiometry with process-based terrestrial biogeochemistry models, Soil Biol. Biochem., 189, 109272, https://doi.org/10.1016/j.soilbio.2023.109272, 2024. a
Sarneel, J. M., Hefting, M. M., Sandén, T., van den Hoogen, J., Routh, D., Adhikari, B. S., Alatalo, J. M., Aleksanyan, A., Althuizen, I. H. J., Alsafran, M. H. S. A., Atkins, J. W., Augusto, L., Aurela, M., Azarov, A. V., Barrio, I. C., Beier, C., Bejarano, M. D., Benham, S. E., Berg, B., Bezler, N. V., Björnsdóttir, K., Bolinder, M. A., Carbognani, M., Cazzolla Gatti, R., Chelli, S., Chistotin, M. V., Christiansen, C. T., Courtois, P., Crowther, T. W., Dechoum, M. S., Djukic, I., Duddigan, S., Egerton-Warburton, L. M., Fanin, N., Fantappiè, M., Fares, S., Fernandes, G. W., Filippova, N. V., Fliessbach, A., Fuentes, D., Godoy, R., Grünwald, T., Guzmán, G., Hawes, J. E., He, Y., Hero, J.-M., Hess, L. L., Hogendoorn, K., Høye, T. T., Jans, W. W. P., Jónsdóttir, I. S., Keller, S., Kepfer-Rojas, S., Kuz'menko, N. N., Larsen, K. S., Laudon, H., Lembrechts, J. J., Li, J., Limousin, J.-M., Lukin, S. M., Marques, R., Marín, C., McDaniel, M. D., Meek, Q., Merzlaya, G. E., Michelsen, A., Montagnani, L., Mueller, P., Murugan, R., Myers-Smith, I. H., Nolte, S., Ochoa-Hueso, R., Okafor, B. N., Okorkov, V. V., Onipchenko, V. G., Orozco, M. C., Parkhurst, T., Peres, C. A., Petit Bon, M., Petraglia, A., Pingel, M., Rebmann, C., Scheffers, B. R., Schmidt, I., Scholes, M. C., Sheffer, E., Shevtsova, L. K., Smith, S. W., Sofo, A., Stevenson, P. R., Strouhalová, B., Sundsdal, A., Sühs, R. B., Tamene, G., Thomas, H. J. D., Tolunay, D., Tomaselli, M., Tresch, S., Tucker, D. L., Ulyshen, M. D., Valdecantos, A., Vandvik, V., Vanguelova, E. I., Verheyen, K., Wang, X., Yahdjian, L., Yumashev, X. S., and Keuskamp, J. A.: Reading tea leaves worldwide: Decoupled drivers of initial litter decomposition mass-loss rate and stabilization, Ecol. Lett., 27, e14415, https://doi.org/10.1111/ele.14415, 2024. a
Schuur, E. A. G.: The Effect of Water on Decomposition Dynamics in Mesic to Wet Hawaiian Montane Forests, Ecosystems, 4, 259–273, https://doi.org/10.1007/s10021-001-0008-1, 2001. a
Sierra, C. A., Trumbore, S. E., Davidson, E. A., Vicca, S., and Janssens, I.: Sensitivity of decomposition rates of soil organic matter with respect to simultaneous changes in temperature and moisture, J. Adv. Model. Earth Sy., 7, 335–356, https://doi.org/10.1002/2014MS000358, 2015. a, b, c
Sierra, C. A., Malghani, S., and Loescher, H. W.: Interactions among temperature, moisture, and oxygen concentrations in controlling decomposition rates in a boreal forest soil, Biogeosciences, 14, 703–710, https://doi.org/10.5194/bg-14-703-2017, 2017. a
Strand, L. T., Callesen, I., Dalsgaard, L., and de Wit, H. A.: Carbon and nitrogen stocks in Norwegian forest soils– the importance of soil formation, climate, and vegetation type for organic matter accumulation, Can. J. Forest Res., 46, 1459–1473, https://doi.org/10.1139/cjfr-2015-0467, 2016. a, b
Sulman, B. N., Phillips, R. P., Oishi, A. C., Shevliakova, E., and Pacala, S. W.: Microbe-driven turnover offsets mineral-mediated storage of soil carbon under elevated CO2, Nat. Clim. Change, 4, 1099–1102, https://doi.org/10.1038/nclimate2436, 2014. a, b, c
Sulman, B. N., Moore, J. A. M., Abramoff, R., Averill, C., Kivlin, S., Georgiou, K., Sridhar, B., Hartman, M. D., Wang, G., Wieder, W. R., Bradford, M. A., Luo, Y., Mayes, M. A., Morrison, E., Riley, W. J., Salazar, A., Schimel, J. P., Tang, J., and Classen, A. T.: Multiple models and experiments underscore large uncertainty in soil carbon dynamics, Biogeochemistry, 141, 109–123, https://doi.org/10.1007/s10533-018-0509-z, 2018. a
Sørensen, M. V., Strimbeck, R., Nystuen, K. O., Kapas, R. E., Enquist, B. J., and Graae, B. J.: Draining the Pool? Carbon Storage and Fluxes in Three Alpine Plant Communities, Ecosystems, 21, 316–330, https://doi.org/10.1007/s10021-017-0158-4, 2018. a
Tang, H., Aas, K., Geange, S. R., Fisher R., Althuizen, I., Jaroszynska, F., Grape, V., Berntsen, T., and Vandvik, V.: Simulating the effect of nonvascular photoautotrophs (NVP) on soil temperature and carbon fluxes over alpine tundra – a study using CLM-FATES, in preparation, 2024. a
Telford, R. J., Vandvik, V., Halbritter, A. H., Skarpaas, O., Olsen, S. L., Lynn, J. S., Gya, R., Geange, S. R., Egelkraut, D., Gaudard, J., Tang, H., Aas, E. R., Keetz, L., Althuizen, I. H. J., Töpper, J., Meineri, E., Phinney, N., Demeaux, M., Dahle, I., Thormodsæter, R. S., Jaroszynska, F., Pena, R. A. R., in' t Zandt, D., Zernichow, C. and Berthelsen, S.: Vestland Climate Grid (VCG), Open Science Framework [data set], https://doi.org/10.17605/OSF.IO/NPFA9, 2023. a, b, c, d, e, f, g
Trofymow, J. A. and the CIDET Working Group: The Canadian Intersite Decomposition Experiment (CIDET): Project and Site Establishment Report, Tech. rep., Can. For. Serv. Pac. For. Cent. Inf. Rep., Victoria, B. C., ISBN 0-662-26870-9, 1998. a, b, c, d, e, f, g
Trofymow, J. A., Moore, T. R., Titus, B., Prescott, C., Morrison, I., Siltanen, M., Smith, S., Fyles, J., Wein, R., Camiré, C., Duschene, L., Kozak, L., Kranabetter, M., and Trofymow, S. V.: Rates of litter decomposition over 6 years in Canadian forests: influence of litter quality and climate, Can. J. For. Res, 32, 789–804, https://doi.org/10.1139/X01-117, 2002. a, b, c, d, e, f, g
Vandvik, V., Skarpaas, O., Klanderud, K., Telford, R. J., Halbritter, A. H., and Goldberg, D. E.: Biotic rescaling reveals importance of species interactions for variation in biodiversity responses to climate change, P. Natl. Acad. Sci. USA, 117, 22858–22865, https://doi.org/10.1073/pnas.2003377117, 2020. a
Vandvik, V., Althuizen, I. H., Jaroszynska, F., Krüger, L. C., Lee, H., Goldberg, D. E., Klanderud, K., Olsen, S. L., Telford, R. J., Östman, S. A., Busca, S., Dahle, I. J., Egelkraut, D. D., Geange, S. R., Gya, R., Lynn, J. S., Meineri, E., Young, S., and Halbritter, A. H.: The role of plant functional groups mediating climate impacts on carbon and biodiversity of alpine grasslands, Sci. Data, 9, 451, https://doi.org/10.1038/s41597-022-01559-0, 2022. a, b, c, d, e, f, g, h
Viskari, T., Pusa, J., Fer, I., Repo, A., Vira, J., and Liski, J.: The impact of calibrating soil organic carbon model Yasso with multiple datasets, Zenodo [code, data set], https://doi.org/10.5281/zenodo.5059909, 2021. a, b, c
Wieder, W. R., Grandy, A. S., Kallenbach, C. M., Taylor, P. G., and Bonan, G. B.: Representing life in the Earth system with soil microbial functional traits in the MIMICS model, Geosci. Model Dev., 8, 1789–1808, https://doi.org/10.5194/gmd-8-1789-2015, 2015. a, b
Wieder, W. R., Hartman, M. D., Sulman, B. N., Wang, Y.-P., Koven, C. D., and Bonan, G. B.: Carbon cycle confidence and uncertainty: Exploring variation among soil biogeochemical models, Glob. Change Biol., 24, 1563–1579, https://doi.org/10.1111/gcb.13979, 2017. a, b
- Abstract
- Introduction
- Methods
- Results
- Discussion
- Conclusions
- Appendix A: Site information
- Appendix B: Model details
- Appendix C: Additional figures
- Appendix D: Surface properties for CLM simulations
- Appendix E: Calculations for analysis
- Code and data availability
- Author contributions
- Competing interests
- Disclaimer
- Financial support
- Review statement
- References