the Creative Commons Attribution 4.0 License.
the Creative Commons Attribution 4.0 License.
 | 13 Sep 2024
The Northeast Greenland Shelf as a potential late-summer CO2 source to the atmosphere
Marcos Lemes
Thomas Juul-Pedersen
Mikael Kristian Sejr
Johnna Marchiano Holding
Søren Rysgaard
The Northeast Greenland Shelf is a region currently considered to be an annual net sink of carbon dioxide (CO2) from the atmosphere. Water from the Northeast Greenland Shelf is advected to the formation regions of North Atlantic Deep Water; therefore, any carbon stored in the region may be retained in the global oceans on the timescales of the thermohaline circulation. We present the most extensive study of carbon chemistry on the Northeast Greenland Shelf to date, made possible by opportunistic sampling due to a sudden decrease in the sea ice concentration in late-August and September 2017. These are the first full-depth measurements of total alkalinity and dissolved inorganic carbon at latitudes between 75 and 79° N, with additional data collected in the region of the Northeast Water Polynya and outside of Young Sound. We find that surface mixed-layer concentrations are variable and (for many stations) higher than the interpolated atmospheric concentration for the region during the sampling period. Below the surface mixed layer, CO2 concentrations increase linearly with decreasing apparent oxygen utilisation. The mixed layer deepens during the study period; this is associated with apparent changes in CO2 uptake. The Northeast Greenland Shelf is a hydrologically complex region with many processes influencing the carbonate system at smaller scales than our sampling density. The scatter in the dataset represents more than mere outliers, and the lack of relationship between the outliers and any measured variable indicates a strong influence of a currently undescribed (set of) variable(s) and/or process(es) at the sampled scales. These data were collected during a time of radically low sea ice concentrations for the region and may be an indication of future conditions. As they indicate the potential of the region to act as a seasonal source of CO2 to the atmosphere, this may modify our current estimate of the region as a strong annual net sink that is relatively protected from the immediate influence of atmospheric warming and climate change.
- Article
(4079 KB) - Full-text XML
-
Supplement
(3605 KB) - BibTeX
- EndNote


The Arctic Ocean and adjacent continental shelves are changing rapidly under the influence of climate change (Serreze and Barry, 2011; Richter-Menge et al., 2017; Overland et al., 2019; Stroh et al., 2019). The Northeast Greenland Shelf is an Arctic outflow shelf (Carmack and Wassmann, 2006; Michel et al., 2015) and one of the two gateways (with the other being the Canadian Arctic Archipelago) through which water from the Arctic Ocean is transported southward into the North Atlantic Ocean (Hunt et al., 2016). Together with the along-slope East Greenland Current (EGC), the shelf acts as a gateway through which water from the Arctic Ocean can be advected to the Greenland Sea, the Irminger Sea, and the Labrador Sea, regions that are crucial to the Atlantic Meridional Overturning Circulation through the formation of intermediate- and deep-water masses (Smethie and Fine, 2001). This means that any carbon stored in the region may be retained in the global oceans on the timescales of the thermohaline circulation (Broecker, 1997; Farmer et al., 2019).
The consensus is that the Northeast Greenland Shelf, like other Arctic shelf regions, has been a net annual carbon sink, although this appears to be changing in response to changing conditions. The initial determination of the region as a sink was made using interpolation studies (Takahashi et al., 2014), self-organising maps (SOMs; Yasunaka et al., 2018), and temporally and/or spatially limited observations via various methods, with most focused on the Northeast Water Polynya or the near-coastal regions and fjords (Yager et al., 1995; Nakaoka et al., 2006; Sejr et al., 2011; Bakker et al., 2023). Recent studies have indicated the potential for the region to become corrosive in terms of aragonite saturation (Fransson et al., 2023), and they have also highlighted the difference between the carbon system on the eastern side of Greenland versus the western side in terms of the relationship between carbon chemistry and depth (Henson et al., 2023, 2024). The latter is far more pronounced in western shelf areas than in eastern shelf areas and may be related to differences in their respective hydrography. Higher benthic production nearer to the shelf edge may be indicative of stronger primary productivity in this area, although the shelf is considered to be oligotrophic and the previously strong benthic–pelagic coupling in the region may be weakening (Bodur et al., 2024). Due to high sea ice cover during all seasons, the shelf is challenging to access; this makes it difficult to consistently measure all of the parameters required to determine the conditions and processes influencing dissolved CO2 concentrations.
The northern North Atlantic and the Greenland Sea are more accessible, and studies in these regions, which receive water from the Northeast Greenland Shelf and the EGC (e.g. Olsen et al., 2008; Olafsson et al., 2021), show that waters sourced from the Arctic remain undersaturated in dissolved CO2, whereas Atlantic waters can act as a weak seasonal source. Water from the North Atlantic that might be entrained into the EGC also tends to be undersaturated (Jones et al., 2021; Ericson et al., 2023), but it has rapidly increasing concentrations, particularly in autumn below latitudes of 78° N when concentrations are at or near that of the atmosphere.
The uptake of CO2 gas from the atmosphere in the northern North Atlantic (> 50° N) is partially driven by the cooling of warm water at the surface during northward transport which increases gas solubility, including CO2. High stratification and primary productivity in summer combined with deep convective mixing in winter enable the exposure of more water to the atmosphere, further facilitating uptake. The Arctic Ocean carbon system is less well understood due to low (spatial and temporal) sampling densities, although the Eurasian Basin uptake of anthropogenic CO2 is thought to be increasing (Rajasakaren et al., 2019). There are also additional processes at play in northern latitudes that influence CO2 gas exchange, affecting both the solubility and biological pumps in the region, such as the sea-ice-related processes of brine expulsion and sea ice melting, and the input of 10 %–11 % of global meteoric river water (Shiklomanov et al., 2021). Each of these processes is characterised by their seasonality (Bates et al., 2009; von Appen et al., 2021). The Atlantic Water (AW) being transported north into the Arctic (and into the EGC as part of the Return Atlantic Current, RAC) is much warmer than it was in previous decades (Polyakov et al., 2017). This increase in heat has been associated with changes in the Arctic halocline, which shields sea ice from melting from below (Polyakov et al., 2020) and is likely to also stimulate heating in the EGC and potentially in the Northeast Greenland Shelf where the warm surface water from the Return Atlantic Current (RAC) comes in direct contact with sea ice advected from the Arctic Ocean. As the RAC is a surface current, this energy is directly available for the melting of ice (icebergs, melange, and sea ice). While the melting of melange and icebergs merely reduces the temperature and freshen the surface water, thereby changing the gas solubility, melting sea ice can release ikaite (CaCO3⋅6H2O) which facilitates additional CO2 gas dissolution (Rysgaard et al., 2009). Reduced sea ice cover is thought to facilitate primary productivity via the enhanced availability of light, providing that nutrients are also available (Bates et al., 2009), and rates of net primary productivity are thought to be increasing (Arrigo and van Dijken, 2015), even in the face of increasing stratification and the associated nutrient limitation (von Appen et al., 2021). Arctic Ocean surface waters are nutrient limited (Tuerena et al., 2022), and the regions of extreme nitrate limitation are expanding, although primarily in the western Arctic (Zhuang et al., 2021, 2022). As a result of surface water nutrient limitation, primary producers are generally found in the following regions: under sea ice (Ardyna et al., 2020); in the sea ice marginal zone, particularly where there is upwelling (Mundy et al., 2009); or as a deep chlorophyll maximum (DCM) below the nitrogen-depleted surface layer (Martin et al., 2013, and references therein). As the DCM is not directly in contact with the atmosphere, the uptake by primary producers is not directly associated with drawdown from the atmosphere unless the strong stratification is broken and has a chance to equilibrate prior to sea ice freeze-up. This equilibration needs to occur before the produced organic carbon is remineralised and before sea ice cover is extensive enough to form a barrier between the ocean and atmosphere. This dominance of the DCM may be a recent development. During the 1990s, primary productivity on the northern Northeast Greenland Shelf was found near the surface in the Northeast Water Polynya, and the required nutrients were associated with water from beneath the landfast and glacial ice (Wallace et al., 1995a). This led to the development of the “seasonal rectification hypothesis”, which describes strong uptake of atmospheric CO2 during the sea ice melt season by primary producers followed by a season of inhibited autumn CO2 release to the atmosphere due to the development of extensive sea ice cover (Yager et al., 1995). Since then, the open-water fraction in the region has changed dramatically, as has the temperature of the Arctic river-influenced Polar Water layer (De Steur et al., 2023). In the summer of 2017, the Northeast Greenland Shelf experienced a sudden drop in sea ice cover starting in August 2017, initiating a previously unseen decline in Arctic Ocean sea ice export that persisted throughout 2018 (Sumata et al., 2022). These ice-free conditions allowed unprecedented access to previously unstudied parts of the Northeast Greenland Shelf (Fig. 1a). The observations for this study were made opportunistically in these suddenly ice-free waters and may offer some insight into the response of the CO2 system on the Northeast Greenland Shelf to an increasingly warm and ice-free Arctic.
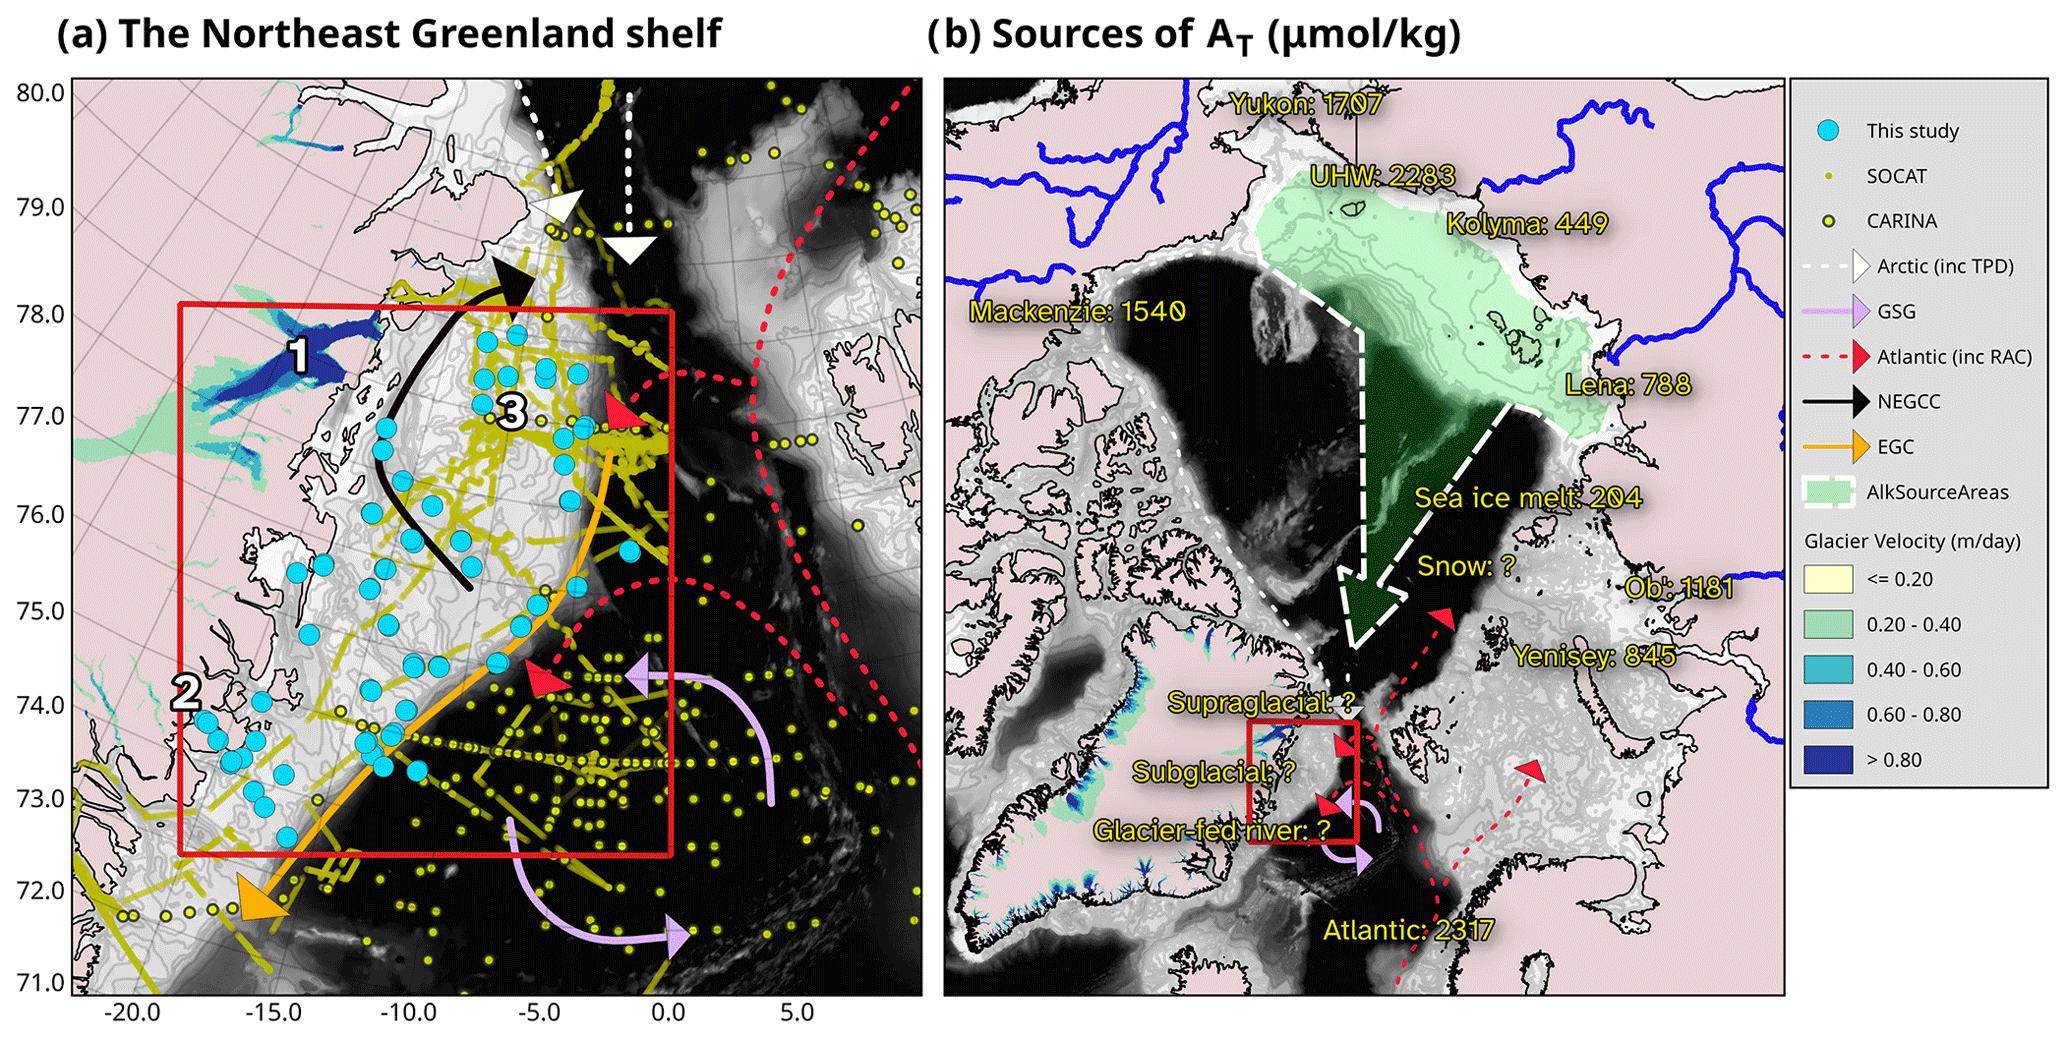
Figure 1(a) Overview of carbon system chemistry and CO2 fugacity (fCO2) samples on the Northeast Greenland Shelf. Arrows indicate known major currents. White indicates the advection of Arctic-sourced water, including Polar Surface Water (PSW) and Eurasian Basin Atlantic Water or Arctic Atlantic Water (EBAW or AAW, respectively). Red arrows indicate Atlantic-sourced water, including Return Atlantic Water (RAW), which is transported by the Return Atlantic Current (RAC) from the east side of Fram Strait towards Northeast Greenland. Black is the Northeast Greenland Counter Current (NEGCC), which transports water west and then northward in a counterclockwise direction directly past the coast; purple is the Greenland Gyre; and orange is the East Greenland Current (EGC), which roughly follows the continental slope. SOCAT surface water fCO2 measurement coordinates are from Bakker et al. (2023), and CARINA full-depth carbon chemistry stations are from Olsen (2009). The numbers 1, 2, and 3 refer to the Northeast Greenland Ice Stream (culminating in 79° N Glacier, or Nioghalvfjerdsbrae, and Zachariae Isstrom), Young Sound, and the Northeast Water Polynya region, respectively. (b) Known sources of total alkalinity (AT) to the Arctic Ocean, highlighting the source regions (green area with dashed white outline) of the Transpolar Drift (TPD) and the location of the study area (red rectangle). Sources to the Arctic Ocean include Arctic rivers with variable catchment geology, sea ice, and snowmelt as well as the Pacific Water coming in through the Bering Strait. River AT values are from Cooper et al. (2008), Pacific values are from Anderson et al. (2013), and Atlantic values are from Jones et al. (2021). Sea ice AT is from our own measurements during these cruises (Willcox et al., 2023). Locally, there is an unknown contribution of both sub- and supraglacial sources as well as glacier-fed rivers. Bathymetry was sourced from the International Bathymetric Chart of the Arctic Ocean (IBCAO; Jakobsson et al., 2020). Ice velocity was sourced from QGreenland v2 (Moon et al., 2022).
2.1 Cruise and hydrographical setting
Data for this study were collected during two cruises: DANA2017 and NEGREEN2017. The hydrography of the Northeast Greenland Shelf during these cruises is described in our previous paper (Willcox et al., 2023). To summarise briefly, several water types were found to be superimposed on much of the shelf, albeit in different ways in different geographical areas.
The hydrography is dominated by Polar Water (PW), which is strongly influenced by inputs from multiple freshwater sources with variable total alkalinities (Fig. 1b), and other geochemical properties. These sources are primarily riverine and located in the shelf seas north of Siberia, and a strong connection was found to the Laptev Sea. River inputs are mixed with and superimposed on Eurasian Basin Atlantic Water (EBAW), which is Atlantic Water (AW) that has lost heat during transport around the eastern Arctic and has a salinity of 34.8. PW is further geochemically modified in the Siberian shelf seas prior to cross-Arctic transport, as a result of shallow bathymetry combined with high winds and extensive polynyas, adding a measurable denitrification signal (Nitishinsky et al., 2007; Chang and Devol, 2009; Anderson et al., 2013) and changing the isotopic fractionation (Bauch et al., 2010).
Finally, the surface water masses are advected off of the Siberian continental shelves and entrained into the Transpolar Drift (TPD). Once entrained into the TPD, the annual sea ice freeze–melt cycle will continue to freshen the surface layer via the export of brine and dilution with meltwater. This process diverts the slope of the surface water from that between Atlantic Water and meteoric freshwater toward the sea ice melt end-member in both the AT–S (total alkalinity–salinity) and δ18O–S (stable water oxygen isotope ratio–salinity) diagrams. When it reaches Fram Strait, this water is joined by AW that is transported directly across from Svalbard by the RAC and has a salinity of 35.
A comparison between the Laptev Sea and Northeast Greenland Shelf in terms of apparent oxygen utilisation (AOU) against the nutrients phosphate and silicate and against the nitrate-to-phosphate ratio confirms the strong link between the Laptev Sea and the Northeast Greenland Shelf via the TPD. The surface water, located above the maximum squared Brunt–Väisälä frequency (N2) and above the remnant of the winter mixed layer, is almost entirely depleted with respect to nitrogen (median NO of 0 µmol kg−1). Directly below this is a remnant of the winter mixed layer that exists at freezing temperatures and a practical salinity of ∼ 31.4 (σT ∼ 25). This is fresher than this inflection point has been in previous decades (Budéus and Schneider, 1995; Budéus et al., 1997; Bignami and Hopkins, 1997). This layer contains (and apparently traps) the oxygen maximum, indicating that it was not actively ventilated during the time when sampling occurred. From the salinity at the inflection point (and the oxygen maximum), there is a cold halocline layer which follows the freezing line up to a salinity of 34.0, the Lower Halocline Water. At this point, we find another inflection away from the freezing line with a sharp increase in temperature to the EBAW at 4 °C (S=34.8) and the AW at 6 °C (S=35). The saltiest and warmest AW found is likely sourced from the West Spitsbergen Current. This water can be found at the surface just off the continental shelf and can make incursions onto the continental shelf, particularly further south. Surface conditions, in terms of sea ice cover and surface temperature, during the 3 weeks of the two cruises were variable (Fig. 2): warm surface temperatures and patchy sea ice dominated the first part of the sampling period; following this, the sea ice fraction increased, particularly toward the northern and northwestern part of the shelf.
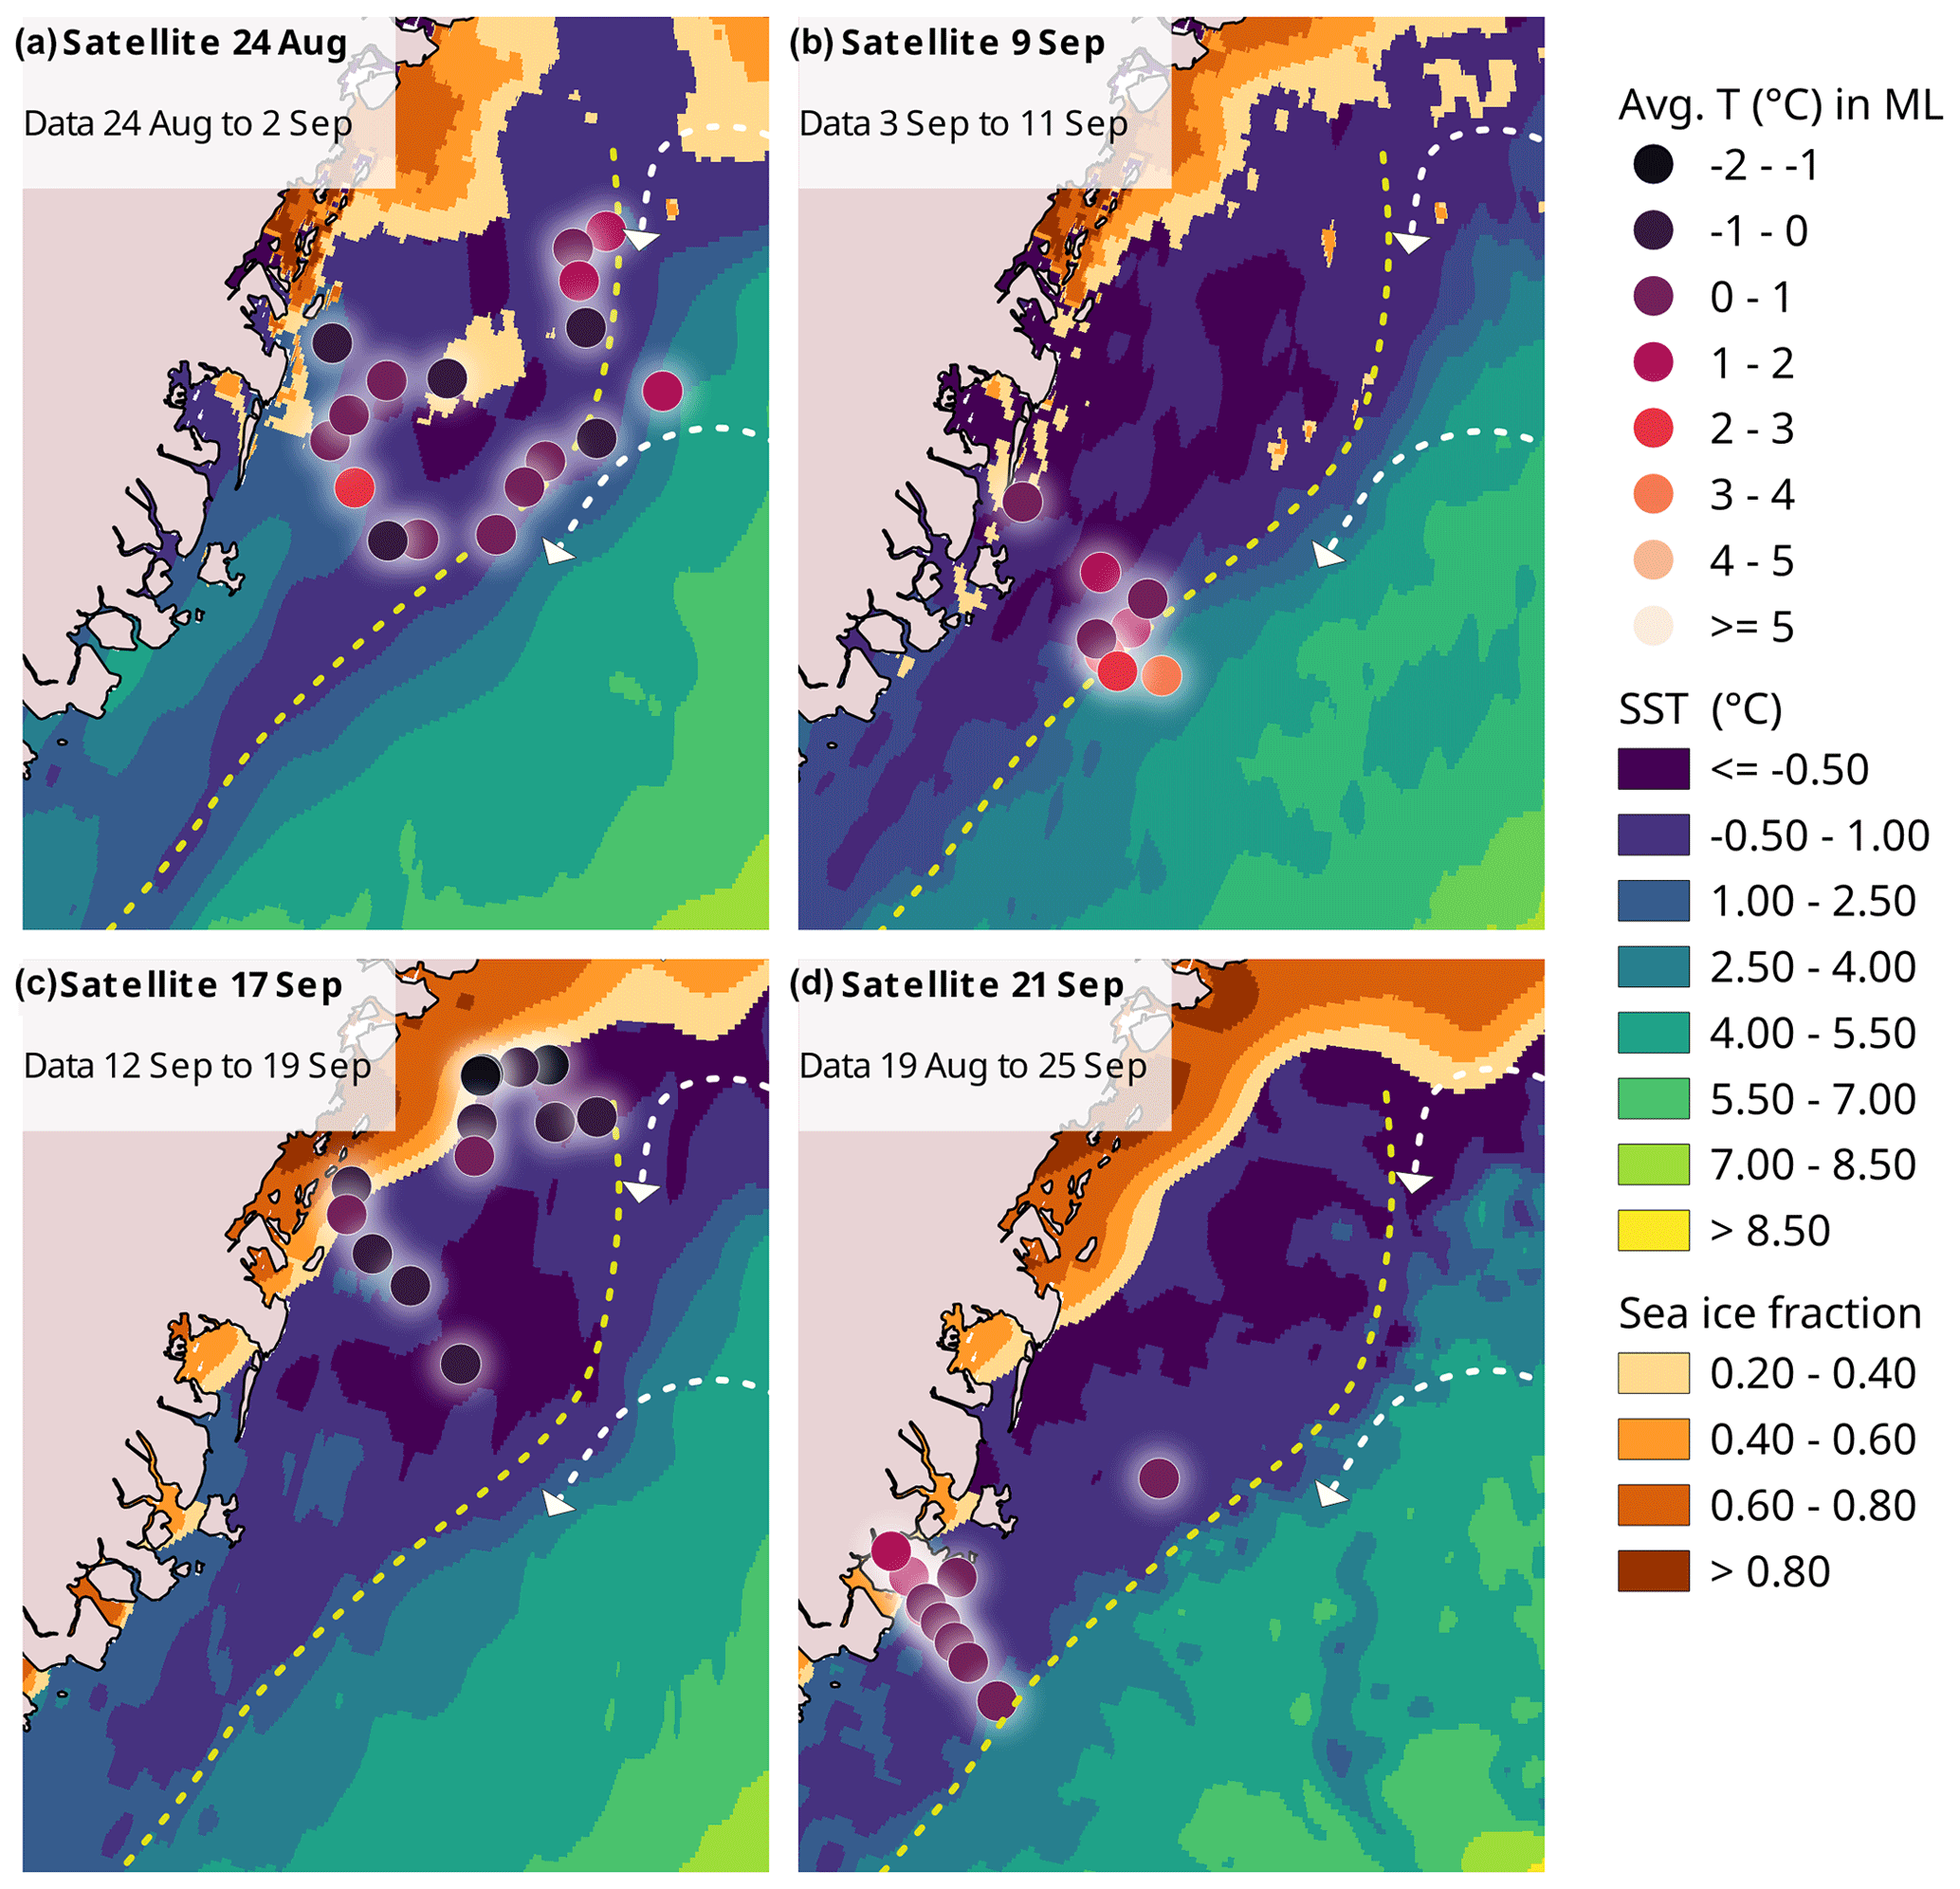
Figure 2Surface conditions (sea ice fraction and sea surface temperature) on the shelf and the average mixed-layer-depth temperature per station subdivided into four sampling periods. The ESA sea surface temperature and sea ice fraction were obtained from Meteorological Office UK (2019) (Good et al., 2020). The average station mixed-layer-depth temperatures are the average temperature for all sampled depths above the maximum squared Brunt–Väisälä frequency (N2).
2.2 Sample analysis
A full description of the hydrography based on the conductivity–temperature–depth (CTD) instrument data; nutrients; and total alkalinity are included in the methods section of Willcox et al. (2023). To analyse dissolved inorganic carbon (DIC), seawater samples were transferred from the CTD rosette to gas-tight vials (12 mL Exetainer, Labco, High Wycombe, UK), poisoned with a 12 µL solution of saturated HgCl2, and stored in the dark at room temperature until analysis. DIC was measured on a DIC analyser (Apollo SciTech, Newark, DE, USA) by acidification of a 0.75 mL subsample with 1 mL 10 % H3PO4 (Sigma-Aldrich, Saint-Louis, MO, USA) and quantification of the released CO2 with a nondispersive infrared CO2 analyser (LI-COR, LI-7000, Lincoln, NE, USA). Results were then converted from micromoles per litre (µmol L−1) to micromoles per kilogram (µmol kg−1) based on the sample density, which was estimated from salinity and temperature. An accuracy of ± 2 µmol kg−1 was determined for DIC from routine analysis of certified reference material (Andrew Dickson, Scripps Institution of Oceanography, San Diego, CA, USA).
CTD measurements of temperature and salinity were combined with the AT and DIC bottle data to calculate the fugacity of CO2 (pCO2) using the CO2SYS program (van Heuven et al., 2011) with the dissociation constants k1 and k2 from Mehrbach et al. (1973) refitted by Dickson and Millero (1987) and the hydrogen sulfite dissociation constant from Dickson (1990).
2.3 Determination of the mixed-layer depth
We estimate the depth of the mixed layer by estimating the pycnocline from the determination of the maximum Brunt–Väisälä frequency squared (N2) (Jones et al., 2021) for all stations with bottles taken at depths shallower than 120 m. Our previous study (Willcox et al., 2023) indicated that this would be a good proxy, as the pycnocline acts as a barrier, trapping dissolved oxygen below it, indicating that this water was not ventilated during the period of our study. The maximum N2 was calculated for each CTD cast individually, and depths varied between 1 and 30 m, with shallower depths closer to the coast and further north.
2.4 Normalisation of carbon chemistry bottle data
The bottle data were normalised with respect to salinity via the application of a fitted polynomial to the data. The polynomial captures the effects of both the sea ice melt and meteoric freshwater dilution. A full justification, including a comparison with more traditional normalisation techniques, is provided in Sect. S3 of the Supplement associated with this paper.
2.5 The modified standard score (Z-score)
Because the mean is heavily influenced by the extreme outliers in these data, parametric methods are not representative. Nonparametric methods relying on the median are more representative. The modified Z-score is one such method; it relies on the mean absolute deviation (MAD). Data are marked as outliers when the modified Z-score is larger than a value D. Our choice of D (1.5) is discussed in Sect. S4 of the Supplement.
Based on previous studies, the region is expected to act as a sink for atmospheric CO2. Periods of high drawdown are specifically thought to occur when the light returns in spring and allows for autotrophic production during phytoplankton blooms, including under ice blooms (Arrigo et al., 2012; Ardyna et al., 2020), and during upwelling events in the marginal ice zone (Mundy et al., 2009). The release of CO2 during the dark season, when no photosynthesis can occur and the region becomes (net) heterotrophic, is inhibited by extensive sea ice cover (Yager et al., 1995). This ice-covered period can be associated with CO2 supersaturation (Duke et al., 2021). Autumn is a transitional period between a summer highly stratified environment, in which light is available and the sea ice and meteoric freshwater flux are dominant, and a winter environment, which is dark, unproductive, and influenced by sea ice growth and brine rejection. In the northern North Atlantic, autumn is associated with the breakdown of stratification near the surface due to higher wind speeds and storms. This pattern is repeated in the Greenland Sea: the average wind speeds tended to increase during the period of this study (days of the year 240–256; Qu et al., 2012), and August and September were associated with increasing concentrations of dissolved CO2 after a seasonal low in July (Arrigo et al., 2010).
The fall of 2017 had exceptionally low sea ice cover for the region (Sumata et al., 2022), allowing unprecedented access to undersampled regions of the shelf. The parameters which usually explain most of the variability infCO2 in the ocean surface are temperature (T), salinity (S), AT, and DIC: gas solubility is expected to increase with decreasing temperature and change with salinity, as a result of variable dissociation constants due to their dependence on ion activities; with increasing AT, the fCO2 is expected to decrease, as these are the ions associated with increasing the ocean buffer capacity (Zeebe and Wolf-Gladrow, 2001); and DIC is taken up by autotrophs during primary production and converted to organic matter. The data collected on the Northeast Greenland Shelf in fall of 2017 do not clearly show the patterns expected (Fig. 3). The data are scattered, and outliers do not follow a discernable pattern with respect to salinity or temperature. Outliers occur during both cruises, in measurements from both labs, toward high and low AT and DIC concentrations, and at different depths. There is no clear correlation between the outliers and any variable measured. Therefore, we have to surmise that we are currently missing a (set of) variable(s) and/or process(es) with which to describe the extreme values in these data, and we do not have sufficient justification to remove any of the outliers from the dataset. We cannot discard any data points without a good reason to flag them as outliers, and using linear correlations loses some efficacy with this amount of variability in the dataset. Mean values are not representative of the data; therefore, any attempt at statistical analysis necessarily relies on nonparametric techniques, such as the modified Z-score.
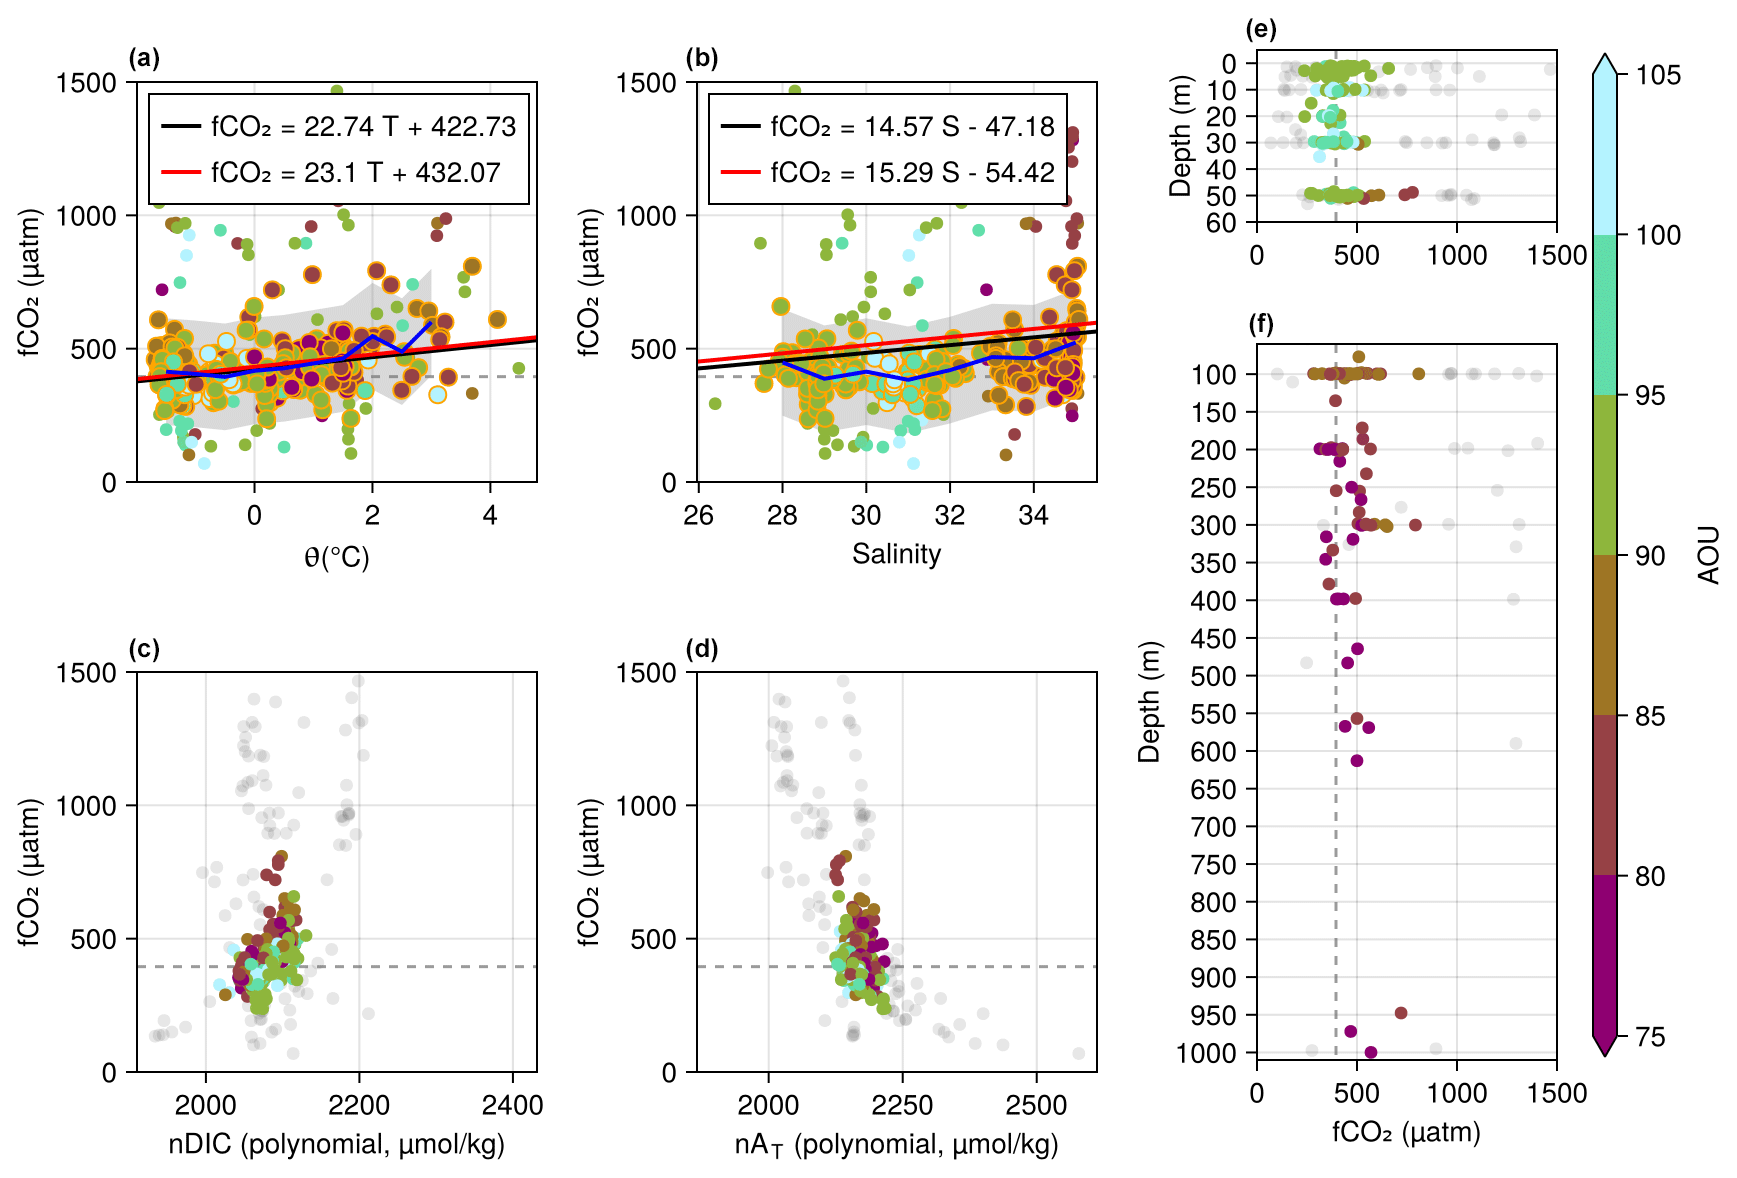
Figure 3Carbon dioxide fugacity (fCO2) plotted as a function of (a) potential temperature, (b) practical salinity, (c) normalised DIC, (d) normalised AT, and depth for (e) shallower and (f) deeper waters. The orange lines in panels (a) and (b) are the best fit line for the median ± 200 fCO2 for each step in the controlling variable. The median for the steps in salinity is shown as the blue line, while values included in the median calculation (± 200) are bounded by the grey region. Data shown with an orange outline in panels (a) and (b) and in colour in panels (c), (d), (e), and (f) are values with a modified Z-score of within D±1.5. The red line in panels (a) and (b) is the best fit to the modified Z-score data. All data are coloured according to the apparent oxygen utilisation (AOU), calculated as the difference between the oxygen solubility calculated with the Thermodynamic Equation of Seawater 2010 (TEOS-10) and the observed oxygen concentrations.
By using median values of fCO2 for the steps in each controlling variable (T, S, etc.), rather than the mean, and picking fCO2 values between which the correlation is to be made or using an extreme modified Z-score outlier flag (>D=1.5), a linear relationship can be established for temperature (Fig. 3a). The same method fails for salinity (Fig. 3b), as the median fCO2 follows a slightly polynomial shape; thus, the line is an overestimate compared with the values calculated from CO2SYS. The median and interquartile range (IQR) for the mixed-layer depth based on the N2 are 410.49 and 147.58 µatm, respectively; this is above the projected atmospheric value for the region of 395 µatm based on SeaFlux (Fay et al., 2021), although it is for the entire time period and, hence, may not be representative (Fig. 4). If we divide further by time, the period before 10 September has a median of 477.66 and an IQR of 201.96 µatm; after this date, the median decreases to 367.89 with an IQR of 110.66 µatm. This indicates a change in conditions, either between the sampling period or the sampling locations, with the region turning from a source into a sink. For samples taken near the surface, the apparent oxygen utilisation is under 95 %, indicating either oxygen use in biochemical processes or the active ventilation of or mixing with waters with even lower dissolved oxygen concentrations. In the case of the former, this may also be responsible for the some of the higher concentrations of fCO2 in the surface layer, although we have no additional evidence to show active remineralisation.
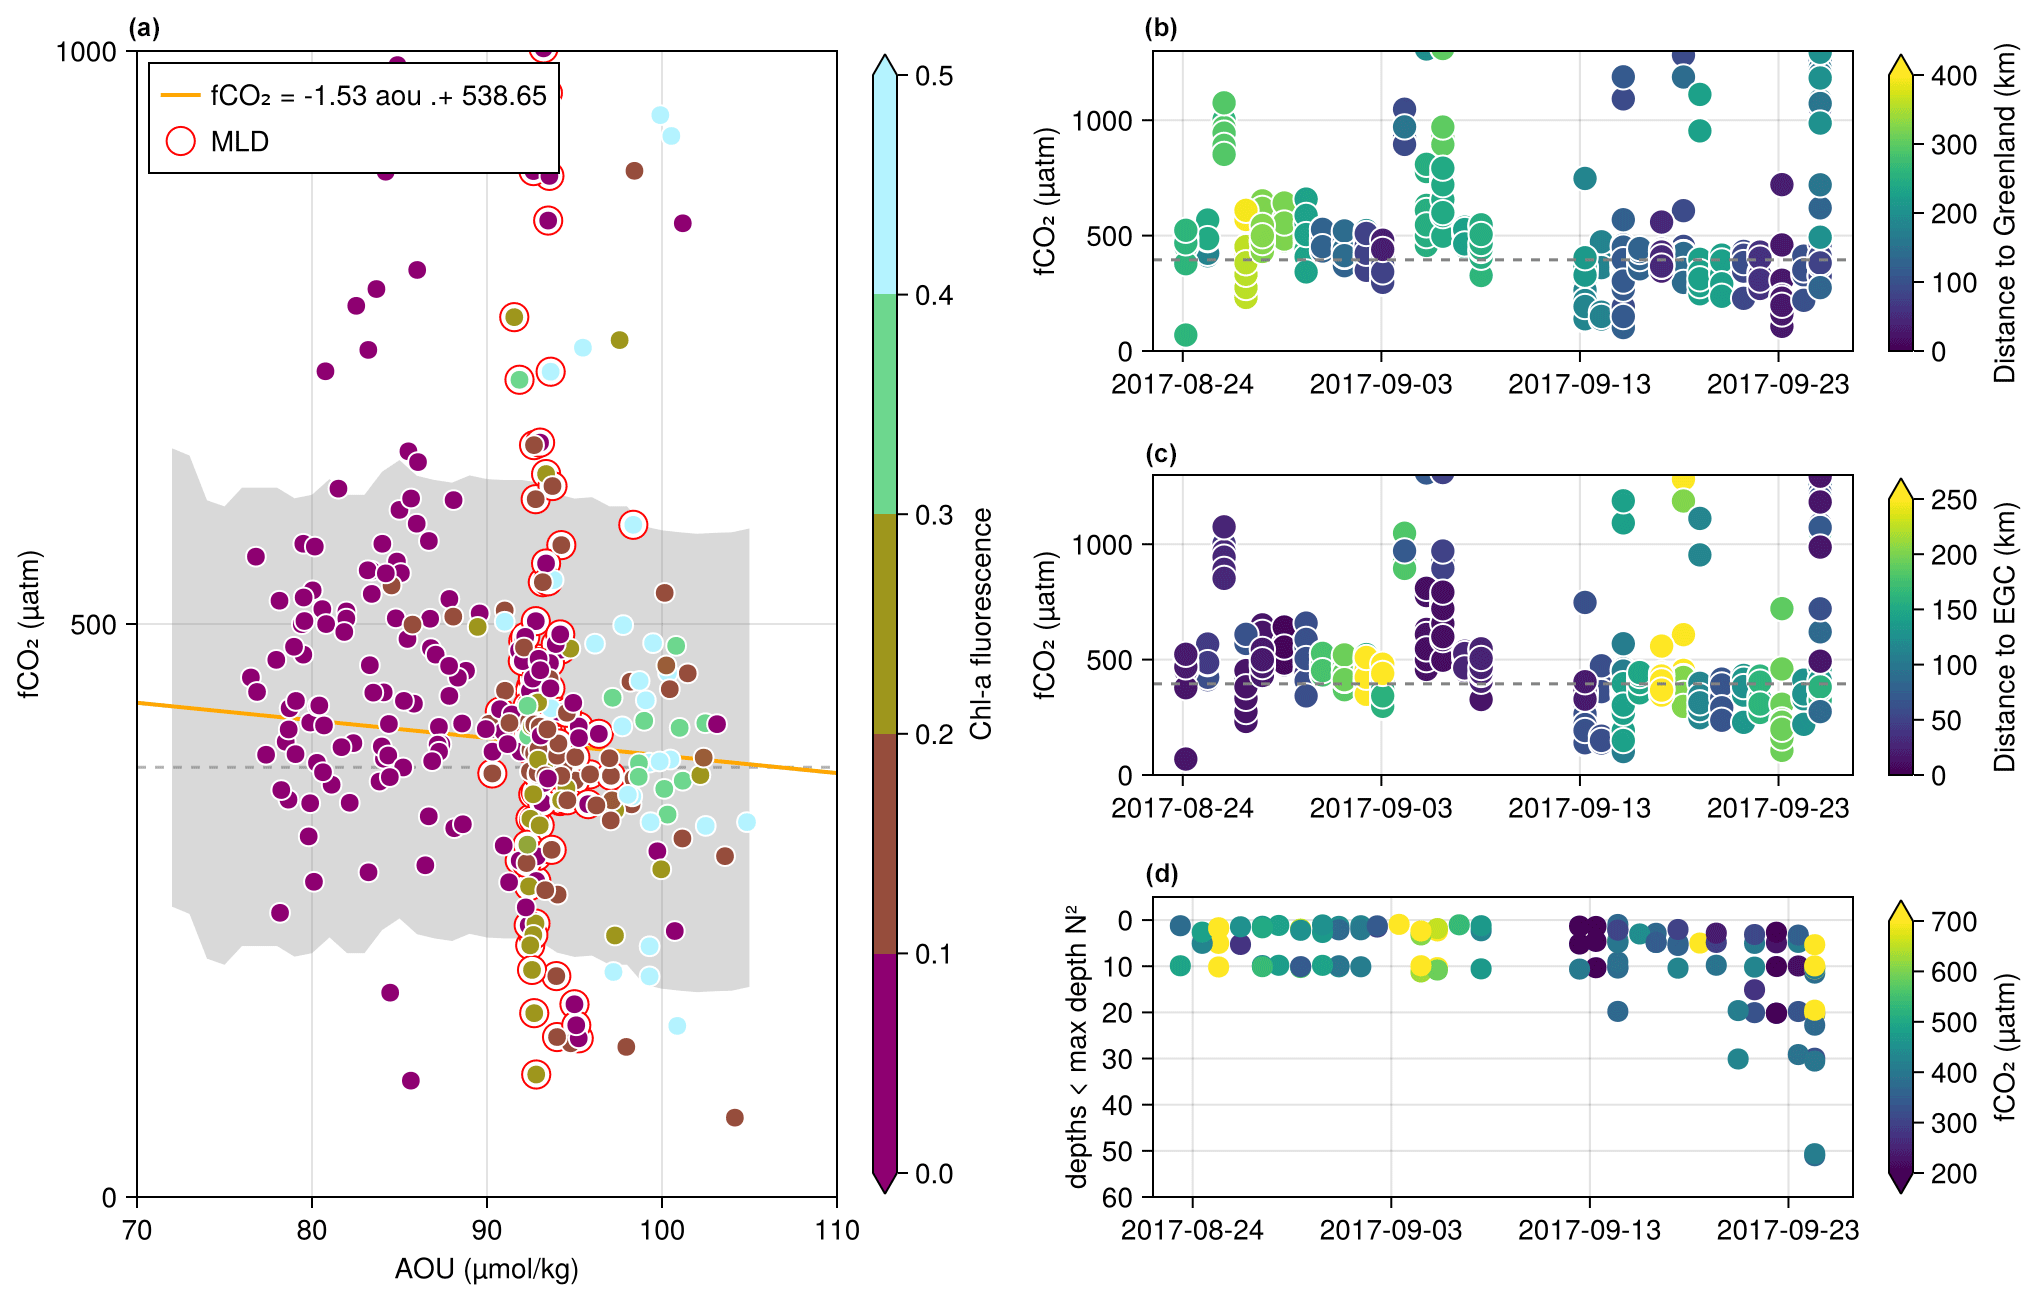
Figure 4(a) The change in fCO2 with changes in apparent oxygen utilisation (AOU). (b, c) fCO2 changes with date, coloured by the distance of the station from Greenland and the EGC, respectively. (d) Data collected at the mixed-layer depth (MLD) for each station by date.
One of the reasons that the relationship of fCO2 with temperature and salinity is unpredictable and highly variable is that water types with different histories found on the Northeast Greenland Shelf can have similar end-member values for certain parameters. For example, meteoric freshwater from the longer fjords has had time to heat up before being advected onto the shelf, with air temperatures in summer as high as 10–12 °C (Rysgaard et al., 2003). Atlantic Water (AW) from the return current also has temperatures of over 4 °C and a salinity of 35. Eurasian Basin Atlantic Water (EBAW), i.e. Arctic Atlantic Water that has circumnavigated the Eurasian Basin and has lost heat, is cold but has a salinity of 34.8. This is very close to the AW salinity (). This proportion is similar to that between their respective total alkalinities. EBAW has an AT of 2274 µmol kg−1 (Jones et al., 2008), while AW has an AT of 2317 µmol kg−1 (Jones et al., 2021), which gives a proportion of 0.98 (). This 1 % difference may show that AT and S remain conservative as AW is transported across the Arctic Ocean; however, a difference of 1 % may also turn out to be the result of additional process(es) rendering AT nonconservative, as this layer is so heavily diluted. The region is also known for its small diameter (5–10 km) and deep penetrating eddies that can reach down to over 1000 m off the shelf (Wadhams et al., 2002; Gascard et al., 2002; Rudels et al., 2005). With our sampling density (distances between stations that are frequently over 30 km), such features could create heterogeneous results for neighbouring station locations.
At depths below the surface mixed layer, as defined by the squared Brunt–Väisälä frequency (N2), the AOU and fCO2 are inversely correlated (Fig. 3e). This ranges from the remnant of the winter mixed layer, which is supersaturated with respect to dissolved oxygen (AOU > 100 %) and in which the median fCO2 is lower than atmospheric values (383.39 with an IQR of 130.40 µatm), to depths where AOU < 80 % and the fCO2 has a median of 453.32 with an IQR of 119.61 µatm. The maximum AOU corresponds to higher chlorophyll-a fluorescence in the remnant winter mixed layer, indicating that the dissolved bioactive gas concentrations in this layer are at least partially driven by the presence of a DCM (Fig. 4a). While surface conditions were variable during the sampling period, in terms of sea ice fraction and temperature (Fig. 2), the region off the shelf, to the east of the EGC, is generally associated with warmer temperatures and higher salinity, whereas waters across the shelf itself have colder surface temperatures. Sea ice is most persistent in the north. The first part of the sampling period had warmer surface temperatures on the shelf itself, especially in the south along the coast (Fig. 2a). In addition, this period (before 13 September) had more stations further from land (Fig. 4b) and closer to the EGC (Fig. 4c) and generally exhibited higher fCO2 values.
During the sampling period, the surface temperature cooled and the sea ice in the north became more consolidated (Fig. 2b, c, d). The fCO2 values during the later period were found to be much lower and trended below atmospheric saturation, potentially indicating a seasonal shift (Fig. 4b, c). The increasing mixed-layer depth (MLD) near the end of the study (Fig. 4d) could support this, although it could also be due to another process, such as the presence of a front. A comparison of mixed-layer values ignoring temporal variability is included in Sect. S6 of the Supplement.
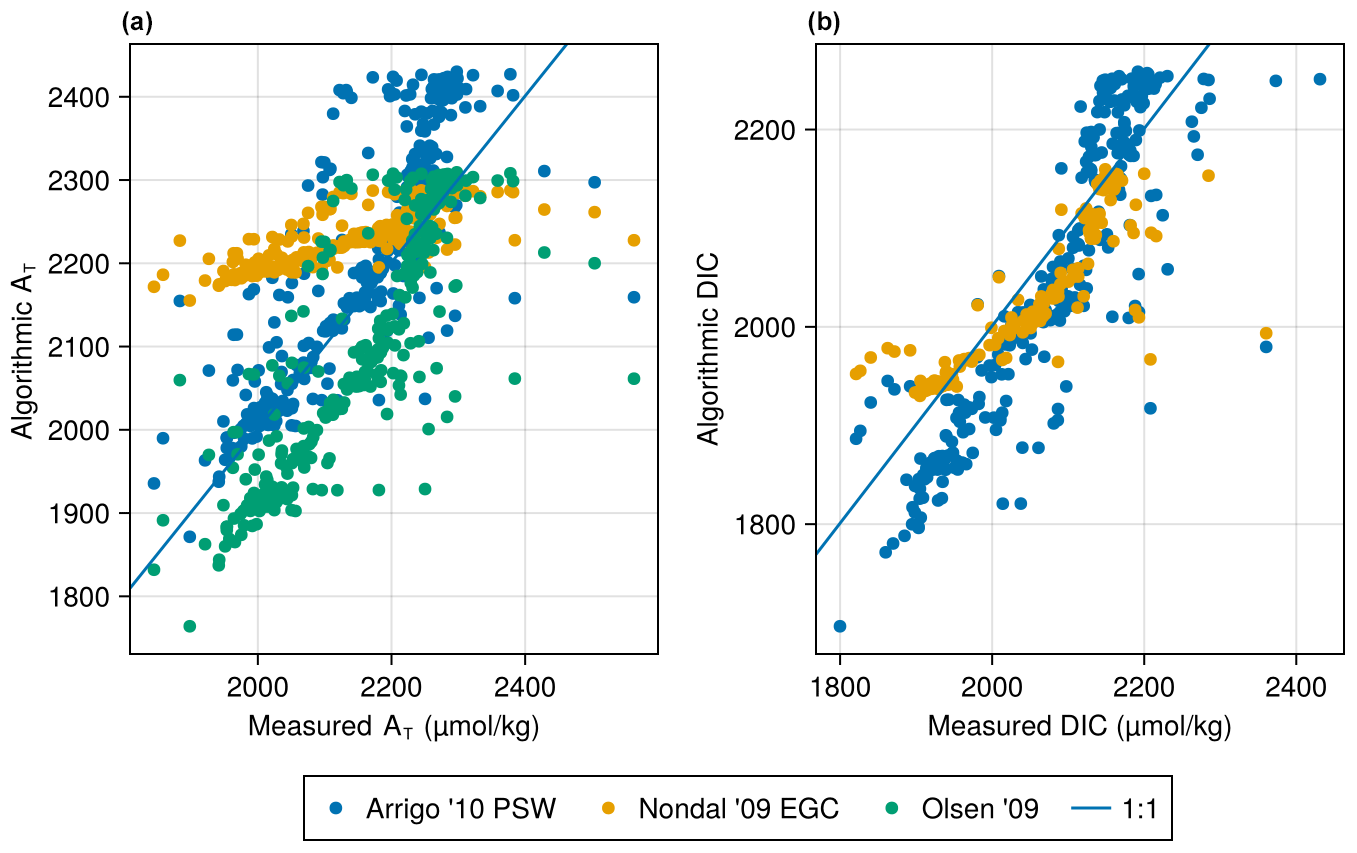
Figure 5Measured concentrations of (a) AT and (b) DIC compared to values predicted using the algorithms from Arrigo et al. (2010), Nondal et al. (2009), and Olsen (2009). As concentrations were only available for the last 2 weeks of the cruise, these are the only data shown for the Nondal et al. (2009) fit in panel (b).
The algorithms established by Arrigo et al. (2010) to determine AT and DIC for the North Atlantic (surface layer) fit our data well for AT, albeit with considerable scatter (Fig. 5a). This is not entirely surprising considering that the dataset used for the algorithm was in part obtained from measurements of the northern part of the Northeast Greenland Shelf (Wallace et al., 1995b). To determine the best fit for DIC, the aforementioned authors removed values for nearshore waters proximal to riverine meteoric freshwater sources from the dataset due to those measurements being lower than the algorithmically predicted values. Our measurements are also lower than the values predicted using their algorithm, although they are not directly near a meteoric freshwater source (Fig. 5b). Similar linear regressions were fitted by Nondal et al. (2009) and Olsen (2009). The former equation does not provide an accurate reflection of our data, whereas the latter has a similar slope but a lower intercept. Thus, the Arrigo et al. (2010) equation is the best predictor for AT on the shelf.
The difference between AT and DIC drives much of the fCO2 variability calculated using CO2SYS, and this difference increases (on average) between the first and second parts of the cruise (Fig. 6a, b) as a result of a reduction in DIC. The average AT in the mixed layer remains the same throughout the study period. The reduction in mixed-layer DIC relative to mixed-layer AT is most pronounced at lower latitudes in the southernmost transect near Young Sound (Fig. 6c).
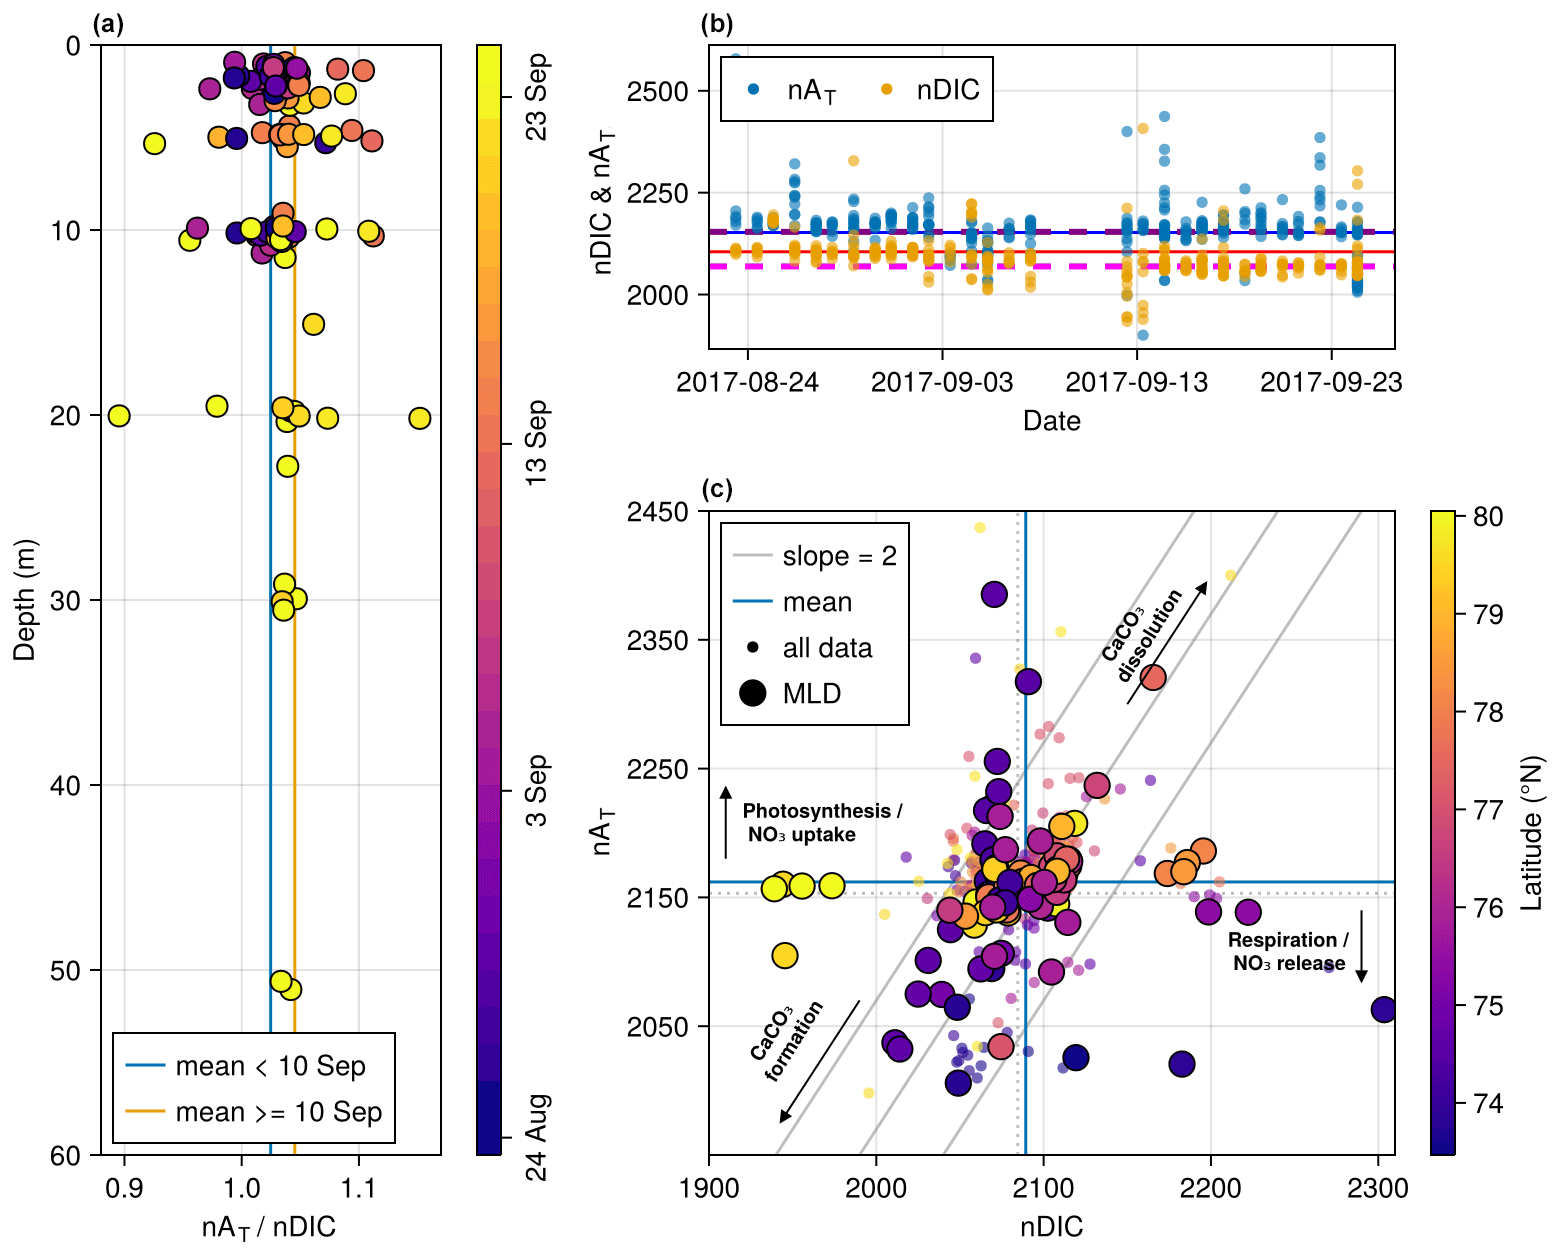
Figure 6(a) Ratio of the normalised AT to the normalised DIC (nDIC) with depth for the surface mixed layer. (b) Normalised AT and nDIC by measurement date. The blue line is AT, the orange line is the DIC best fit between 24 August and 10 September, and dashed lines are for dates after 10 September. Panel (c) shows normalised AT against nDIC.
As previously described in Henson et al. (2024), the depth dependence of carbonate chemistry on the Northeast Greenland Shelf is nonlinear. Whether the surface mixed layer will act as a sink or a source of CO2 with respect to the atmosphere seems to vary, although it is clear that the region is not as strong a sink as previously expected and may actually be a net source. Increases in freshwater, both meteoric and sea ice melt, are associated with more corrosive surface waters near the coast in the region (Henson et al., 2023), but this can be compensated for by high productivity stimulated by nutrient input from local ice melt (Wallace et al., 1995a; Fransson et al., 2023). If this is the case, this may be another reason for the extreme variability in the results that we obtained. The mixed layer at the surface on the Northeast Greenland Shelf that is advected in from the Arctic Ocean is already severely nitrogen depleted (Tuerena et al., 2022); this impacts the opportunities for local primary producers to exist at the surface away from areas where local features, such as eddies or actively melting sea ice, might contribute nutrients to the surface water. Where sea ice melting, glacier melting, or potentially even iceberg fertilisation contribute nutrients to the surface, primary productivity can be quickly stimulated, and the associated removal of DIC would allow for increased buffering by the AT, resulting in lower fCO2 values in these areas. Sea ice and iceberg melt can be patchy, and major continental meteoric freshwater contributions directly onto the shelf happen primarily at the termini of the 79° N Glacier and Zachariae Isstrom; therefore, the extent of surface primary productivity influencing the carbon system is likely limited during the sampling period. The rest of the shelf receives local freshwater input from long fjords where all of the nutrients added at the surface have likely already been fully utilised before they reach the shelf (Holding et al., 2019). This means that primary productivity is necessarily limited to a DCM below the nitracline. During years of more extensive sea ice cover, primary production may occur closer to the surface and stimulate more direct uptake of CO2 from the atmosphere. Higher benthic productivity has been observed closer to the EGC, which (with strong benthic–pelagic coupling in the region) indicates higher productivity at the surface near the slope (Bodur et al., 2024) and an associated higher uptake of CO2. In the absence of sea ice melt, it is possible that this is stimulated by along-shelf upwelling or by EGC-associated eddies, which are particularly prominent in areas where the density of the warm AW and the cool Polar Water are the same (Bashmachnikov et al., 2020).
We present the first full-depth carbon system observations of the area of the Northeast Greenland Shelf between 75 and 79° N, with additional measurements outside of Young Sound and in the region of the Northeast Water Polynya. Our AT measurements correspond well to values from the predictive algorithm created by Arrigo et al. (2010), whereas the DIC measurements are lower than those predicted by these authors. We find that the shelf does not act as a consistent sink, as expected based on the calculated fugacity of carbon dioxide (fCO2) from the AT and DIC samples. Using nonparametric methods, due to the large number of outliers in the dataset, we find that the surface of the region can act as either a sink or source of CO2 with respect to the atmosphere. The highest uptake is associated with a maximum in apparent oxygen utilisation (AOU) and chlorophyll within the remnant of the winter mixed layer, where there is both light and nutrient availability. This water is not actively ventilated and, therefore, cannot contribute directly to atmospheric carbon exchange. The middle of the study period saw an apparent breakdown in stratification based on an increase in the mixed-layer depth, as determined by the maximum squared Brunt–Väisälä frequency (N2). This was associated with a reduction in fCO2 in the surface layer, to median values below the expected atmospheric concentration, apparently due to a corresponding reduction in DIC. The many outliers in the fCO2 data, particularly in the surface mixed layer, are not clearly associated with any known process or measured variable. It is likely that the shelf is characterised by influences at smaller scales than the sampling density of this study. August and September 2017 were extraordinary in terms of low sea ice cover, which was the reason that opportunistic sampling of this previously unsampled area could take place. Therefore, our results may not represent a baseline for the region when it is ice covered; rather, our findings may act as an example of the response of the region to future increases in oceanic and atmospheric heat and reductions in sea ice.
The data for this study can be found at https://doi.org/10.1594/PANGAEA.968792 (Willcox et al., 2024a) and https://doi.org/10.1594/PANGAEA.968793 (Willcox et al., 2024b).
The supplement related to this article is available online at: https://doi.org/10.5194/bg-21-4037-2024-supplement.
The fieldwork component, including taking samples from the CTD, was performed by TJP, JMH, and SR. ML and MKS performed the geochemical laboratory measurements for AT and DIC at their respective institutes. Subsequent data analysis, writing of code, and initial drafting of the manuscript was performed by the primary author. Extensive feedback on the first and second drafts of the manuscript was obtained from all co-authors.
The contact author has declared that none of the authors has any competing interests.
Publisher’s note: Copernicus Publications remains neutral with regard to jurisdictional claims made in the text, published maps, institutional affiliations, or any other geographical representation in this paper. While Copernicus Publications makes every effort to include appropriate place names, the final responsibility lies with the authors.
We would like to thank our manuscript reviewers for providing detailed and relevant feedback and making a positive contribution to this paper. The cruises were funded through the Greenland Ecosystem Monitoring Program (Leg 1), the Danish Centre for Marine Research, the Natural Sciences and Engineering Research Council of Canada (NSERC), and the Independent Research Fund Denmark (G-Ice Project; grant no. 7014-00113B/FNU). This study received financial support from the Aage V. Jensen Charity Foundation, the Arctic Research Centre, Aarhus University, and the Independent Research Fund Denmark (GreenShelf project, grant no. 0135-00165B/FNU). The captain and crew of RV DANA are acknowledged for excellent assistance during our field cruise to Northeast Greenland. Egon Frandsen is acknowledged for logistic and operational support.
This research has been supported by the Danmarks Frie Forskningsfond (grant nos. 0135-00165B/FNU and 7014-00113B/FNU) and the Canadian Network for Research and Innovation in Machining Technology of the Natural Sciences and Engineering Research Council of Canada (grant no. RGPIN-2018-05009).
This paper was edited by Hermann Bange and reviewed by Damian Leonardo Arévalo-Martínez and Are Olsen.
Anderson, L. G., Andersson, P. S., Björk, G., Peter Jones, E., Jutterström, S., and Wåhlström, I.: Source and formation of the upper halocline of the Arctic Ocean, J. Geophys. Res.-Ocean., 118, 410–421, https://doi.org/10.1029/2012JC008291, 2013. a, b
Ardyna, M., Mundy, C. J., Mayot, N., Matthes, L. C., Oziel, L., Horvat, C., Leu, E., Assmy, P., Hill, V., Matrai, P. A., Gale, M., Melnikov, I. A., and Arrigo, K. R.: Under-Ice Phytoplankton Blooms: Shedding Light on the “Invisible” Part of Arctic Primary Production, Front. Mar. Sci., 7, 608032, https://doi.org/10.3389/fmars.2020.608032, 2020. a, b
Arrigo, K. R. and van Dijken, G. L.: Continued increases in Arctic Ocean primary production, Prog. Oceanogr., 136, 60–70, https://doi.org/10/f7mdc6, 2015. a
Arrigo, K. R., Pabi, S., van Dijken, G. L., and Maslowski, W.: Air-sea flux of CO2 in the Arctic Ocean, 1998–2003, J. Geophys. Res., 115, G04024, https://doi.org/10.1029/2009jg001224, 2010. a, b, c, d, e
Arrigo, K. R., Perovich, D. K., Pickart, R. S., Brown, Z. W., Van Dijken, G. L., Lowry, K. E., Mills, M. M., Palmer, M. A., Balch, W. M., Bahr, F., Bates, N. R., Benitez-Nelson, C., Bowler, B., Brownlee, E., Ehn, J. K., Frey, K. E., Garley, R., Laney, S. R., Lubelczyk, L., Mathis, J., Matsuoka, A., Mitchell, B. G., Moore, G. W. K., Ortega-Retuerta, E., Pal, S., Polashenski, C. M., Reynolds, R. A., Schieber, B., Sosik, H. M., Stephens, M., and Swift, J. H.: Massive Phytoplankton Blooms Under Arctic Sea Ice, Science, 336, 1408–1408, https://doi.org/10.1126/science.1215065, 2012. a
Bakker, D. C. E., Alin, S. R., Bates, N., Becker, M., Feely, R. A., Gkritzalis, T., Jones, S. D., Kozyr, A., Lauvset, S. K., Metzl, N., Munro, D. R., Nakaoka, S.-I., Nojiri, Y., O'Brien, K. M., Olsen, A., Pierrot, D., Rehder, G., Steinhoff, T., Sutton, A. J., Sweeney, C., Tilbrook, B., Wada, C., Wanninkhof, R., Akl, J., Barbero, L., Beatty, C. M., Berghoff, C. F., Bittig, H. C., Bott, R., Burger, E. F., Cai, W.-J., Castaño-Primo, R., Corredor, J. E., Cronin, M., De Carlo, E. H., DeGrandpre, M. D., Dietrich, C., Drennan, W. M., Emerson, S. R., Enochs, I. C., Enyo, K., Epherra, L., Evans, W., Fiedler, B., Fontela, M., Frangoulis, C., Gehrung, M., Giannoudi, L., Glockzin, M., Hales, B., Howden, S. D., Ibánhez, J. S. P., Kamb, L., Körtzinger, A., Lefèvre, N., Lo Monaco, C., Lutz, V. A., Macovei, V. A., Maenner Jones, S., Manalang, D., Manzello, D. P., Metzl, N., Mickett, J., Millero, F. J., Monacci, N. M., Morell, J. M., Musielewicz, S., Neill, C., Newberger, T., Newton, J., Noakes, S., Ólafsdóttir, S. R., Ono, T., Osborne, J., Padín, X. A., Paulsen, M., Perivoliotis, L., Petersen, W., Petihakis, G., Plueddemann, A. J., Rodriguez, C., Rutgersson, A., Sabine, C. L., Salisbury, J. E., Schlitzer, R., Skjelvan, I., Stamataki, N., Sullivan, K. F., Sutherland, S. C., T'Jampens, M., Tadokoro, K., Tanhua, T., Telszewski, M., Theetaert, H., Tomlinson, M., Vandemark, D., Velo, A., Voynova, Y. G., Weller, R. A., Whitehead, C., and Wimart-Rousseau, C.: Surface Ocean CO2 Atlas Database Version 2023 (SOCATv2023) (NCEI Accession 0278913) [data set], https://doi.org/10.25921/R7XA-BT92, 2023. a, b
Bashmachnikov, I. L., Kozlov, I. E., Petrenko, L. A., Glok, N. I., and Wekerle, C.: Eddies in the North Greenland Sea and Fram Strait From Satellite Altimetry, SAR and High-Resolution Model Data, J. Geophys. Res.-Ocean., 125, e2019JC015832, https://doi.org/10.1029/2019JC015832, 2020. a
Bates, N. R., Mathis, J. T., and Cooper, L. W.: Ocean acidification and biologically induced seasonality of carbonate mineral saturation states in the western Arctic Ocean, J. Geophys. Res., 114, C11007, https://doi.org/10.1029/2008jc004862, 2009. a, b
Bauch, D., Hölemann, J., Willmes, S., Gröger, M., Novikhin, A., Nikulina, A., Kassens, H., and Timokhov, L.: Changes in distribution of brine waters on the Laptev Sea shelf in 2007, J. Geophys. Res., 115, C11008, https://doi.org/10.1029/2010JC006249, 2010. a
Bignami, F. and Hopkins, T.: The water mass characteristics of the Northeast Water Polynya: Polar Sea data 1992–1993, J. Mar. Syst., 10, 139–156, https://doi.org/10.1016/S0924-7963(96)00079-6, 1997. a
Bodur, Y. V., Renaud, P. E., Lins, L., Da Costa Monteiro, L., Ambrose, W. G., Felden, J., Krumpen, T., Wenzhöfer, F., Włodarska-Kowalczuk, M., and Braeckman, U.: Weakened pelagic-benthic coupling on an Arctic outflow shelf (Northeast Greenland) suggested by benthic ecosystem changes, Elem. Sci. Anth., 12, 00005, https://doi.org/10.1525/elementa.2023.00005, 2024. a, b
Broecker, W. S.: Thermohaline Circulation, the Achilles Heel of Our Climate System: Will Man-Made CO2 Upset the Current Balance?, Science, 278, 1582–1588, https://doi.org/10.1126/science.278.5343.1582, 1997. a
Budéus, G. and Schneider, W.: On the hydrography of the Northeast Water Polynya, J. Geophys. Res., 100, 4287, https://doi.org/10.1029/94jc02024, 1995. a
Budéus, G., Schneider, W., and Kattner, G.: Distribution and exchange of water masses in the Northeast Water polynya (Greenland Sea), J. Mar. Syst., 10, 123–138, https://doi.org/10.1016/s0924-7963(96)00074-7, 1997. a
Carmack, E. and Wassmann, P.: Food webs and physical–biological coupling on pan-Arctic shelves: Unifying concepts and comprehensive perspectives, Prog. Oceanogr., 71, 446–477, https://doi.org/10.1016/j.pocean.2006.10.004, 2006. a
Chang, B. X. and Devol, A. H.: Seasonal and spatial patterns of sedimentary denitrification rates in the Chukchi sea, Deep-Sea Res. Pt. II, 56, 1339–1350, https://doi.org/10.1016/j.dsr2.2008.10.024, 2009. a
Cooper, L. W., McClelland, J. W., Holmes, R. M., Raymond, P. A., Gibson, J. J., Guay, C. K., and Peterson, B. J.: Flow-weighted values of runoff tracers (δ18O, DOC, Ba, alkalinity) from the six largest Arctic rivers, Geophys. Res. Lett., 35, L18606, https://doi.org/10.1029/2008gl035007, 2008. a
De Steur, L., Sumata, H., Divine, D. V., Granskog, M. A., and Pavlova, O.: Upper ocean warming and sea ice reduction in the East Greenland Current from 2003 to 2019, Commun. Earth Environ., 4, 261, https://doi.org/10.1038/s43247-023-00913-3, 2023. a
Dickson, A. and Millero, F.: A comparison of the equilibrium constants for the dissociation of carbonic acid in seawater media, Deep-Sea Res. Pt. A, 34, 1733–1743, https://doi.org/10.1016/0198-0149(87)90021-5, 1987. a
Dickson, A. G.: Standard potential of the reaction: AgCl(s) + iH,(g) = Ag(s) + HCl(aq), and and the standard acidity constant of the ion HSOh in synthetic sea water from 273.15 to 318.15 K, J. Chem. Thermodyn., 22, 113–127, https://doi.org/10.1016/0021-9614(90)90074-Z, 1990. a
Duke, P. J., Else, B. G. T., Jones, S. F., Marriot, S., Ahmed, M. M. M., Nandan, V., Butterworth, B., Gonski, S. F., Dewey, R., Sastri, A., Miller, L. A., Simpson, K. G., and Thomas, H.: Seasonal marine carbon system processes in an Arctic coastal landfast sea ice environment observed with an innovative underwater sensor platform, Elementa, 9, 00103, https://doi.org/10.1525/elementa.2021.00103, 2021. a
Ericson, Y., Fransson, A., Chierici, M., Jones, E. M., Skjelvan, I., Omar, A., Olsen, A., and Becker, M.: Rapid fCO2 rise in the northern Barents Sea and Nansen Basin, Prog. Oceanogr., 217, 103079, https://doi.org/10.1016/j.pocean.2023.103079, 2023. a
Farmer, J. R., Hönisch, B., Haynes, L. L., Kroon, D., Jung, S., Ford, H. L., Raymo, M. E., Jaume-Seguí, M., Bell, D. B., Goldstein, S. L., Pena, L. D., Yehudai, M., and Kim, J.: Deep Atlantic Ocean carbon storage and the rise of 100,000-year glacial cycles, Nat. Geosci., 12, 355–360, https://doi.org/10.1038/s41561-019-0334-6, 2019. a
Fay, A. R., Gregor, L., Landschützer, P., McKinley, G. A., Gruber, N., Gehlen, M., Iida, Y., Laruelle, G. G., Rödenbeck, C., Roobaert, A., and Zeng, J.: SeaFlux: harmonization of air–sea CO2 fluxes from surface pCO2 data products using a standardized approach, Earth Syst. Sci. Data, 13, 4693–4710, https://doi.org/10.5194/essd-13-4693-2021, 2021. a
Fransson, A., Chierici, M., Granskog, M. A., Dodd, P. A., and Stedmon, C. A.: Impacts of glacial and sea-ice meltwater, primary production, and ocean CO2 uptake on ocean acidification state of waters by the 79 North Glacier and northeast Greenland shelf, Front. Mar. Sci., 10, 1155126, https://doi.org/10.3389/fmars.2023.1155126, 2023. a, b
Gascard, J.-C., Watson, A. J., Messias, M.-J., Olsson, K. A., Johannessen, T., and Simonsen, K.: Long-lived vortices as a mode of deep ventilation in the Greenland Sea, Nature, 416, 525–527, https://doi.org/10.1038/416525a, 2002. a
Good, S., Fiedler, E., Mao, C., Martin, M. J., Maycock, A., Reid, R., Roberts-Jones, J., Searle, T., Waters, J., While, J., and Worsfold, M.: The Current Configuration of the OSTIA System for Operational Production of Foundation Sea Surface Temperature and Ice Concentration Analyses, Remote Sens., 12, 720, https://doi.org/10.3390/rs12040720, 2020. a
Henson, H. C., Holding, J. M., Meire, L., Rysgaard, S., Stedmon, C. A., Stuart-Lee, A., Bendtsen, J., and Sejr, M.: Coastal freshening drives acidification state in Greenland fjords, Sci. Total Environ., 855, 158962, https://doi.org/10.1016/j.scitotenv.2022.158962, 2023. a, b
Henson, H. C., Sejr, M. K., Meire, L., Sørensen, L. L., Winding, M. H., and Holding, J. M.: Resolving heterogeneity in CO2 uptake potential in the Greenland coastal ocean, ESS Open Archive, https://doi.org/10.22541/essoar.171052503.36306724/v1, 2024. a, b
Holding, J. M., Markager, S., Juul-Pedersen, T., Paulsen, M. L., Møller, E. F., Meire, L., and Sejr, M. K.: Seasonal and spatial patterns of primary production in a high-latitude fjord affected by Greenland Ice Sheet run-off, Biogeosciences, 16, 3777–3792, https://doi.org/10.5194/bg-16-3777-2019, 2019. a
Hunt, G. L., Drinkwater, K. F., Arrigo, K., Berge, J., Daly, K. L., Danielson, S., Daase, M., Hop, H., Isla, E., Karnovsky, N., Laidre, K., Mueter, F. J., Murphy, E. J., Renaud, P. E., Smith, W. O., Trathan, P., Turner, J., and Wolf-Gladrow, D.: Advection in polar and sub-polar environments: Impacts on high latitude marine ecosystems, Prog. Oceanogr., 149, 40–81, https://doi.org/10.1016/j.pocean.2016.10.004, 2016. a
Jakobsson, M., Mayer, L. A., Bringensparr, C., Castro, C. F., Mohammad, R., Johnson, P., Ketter, T., Accettella, D., Amblas, D., An, L., Arndt, J. E., Canals, M., Casamor, J. L., Chauché, N., Coakley, B., Danielson, S., Demarte, M., Dickson, M.-L., Dorschel, B., Dowdeswell, J. A., Dreutter, S., Fremand, A. C., Gallant, D., Hall, J. K., Hehemann, L., Hodnesdal, H., Hong, J., Ivaldi, R., Kane, E., Klaucke, I., Krawczyk, D. W., Kristoffersen, Y., Kuipers, B. R., Millan, R., Masetti, G., Morlighem, M., Noormets, R., Prescott, M. M., Rebesco, M., Rignot, E., Semiletov, I., Tate, A. J., Travaglini, P., Velicogna, I., Weatherall, P., Weinrebe, W., Willis, J. K., Wood, M., Zarayskaya, Y., Zhang, T., Zimmermann, M., and Zinglersen, K. B.: The International Bathymetric Chart of the Arctic Ocean Version 4.0, Sci. Data, 7, 176, https://doi.org/10.1038/s41597-020-0520-9, 2020. a
Jones, E., Anderson, L., Jutterström, S., and Swift, J.: Sources and distribution of fresh water in the East Greenland Current, Prog. Oceanogr., 78, 37–44, https://doi.org/10.1016/j.pocean.2007.06.003, 2008.
Jones, E. M., Chierici, M., Menze, S., Fransson, A., Ingvaldsen, R. B., and Lødemel, H. H.: Ocean acidification state variability of the Atlantic Arctic Ocean around northern Svalbard, Prog. Oceanogr., 199, 102708, https://doi.org/10.1016/j.pocean.2021.102708, 2021. a, b, c
Martin, J., Dumont, D., and Tremblay, J.-É.: Contribution of subsurface chlorophyll maxima to primary production in the coastal Beaufort Sea (Canadian Arctic): A model assessment: CONTRIBUTION OF SCM IN BEAUFORT SEA, J. Geophys. Res.-Ocean., 118, 5873–5886, https://doi.org/10.1002/2013JC008843, 2013. a
Mehrbach, C., Culberson, C. H., Hawley, J. E., and Pytkowicx, R. M.: Measurement of the apparent dissociation constants of carbonic acid in seawater at atmospheric pressure, Limnol. Oceanogr., 18, 897–907, https://doi.org/10.4319/lo.1973.18.6.0897, 1973. a
Meteorological Office UK: ESA SST CCI and C3S reprocessed sea surface temperature analyses, E.U. Copernicus Marine Service Information (CMEMS), Marine Data Store (MDS), https://doi.org/10.48670/moi-00169, 2019. a
Michel, C., Hamilton, J., Hansen, E., Barber, D., Reigstad, M., Iacozza, J., Seuthe, L., and Niemi, A.: Arctic Ocean outflow shelves in the changing Arctic: A review and perspectives, Prog. Oceanogr., 139, 66–88, https://doi.org/10.1016/j.pocean.2015.08.007, 2015. a
Moon, T. A., Fisher, M., Harden, L., Shimonoko, H., and Stafford, T.: QGreenland (v2.0.0), Zenodo, https://doi.org/10.5281/zenodo.6369184, 2022. a
Mundy, C. J., Gosselin, M., Ehn, J., Gratton, Y., Rossnagel, A., Barber, D. G., Martin, J., Tremblay, J.-É., Palmer, M., Arrigo, K. R., Darnis, G., Fortier, L., Else, B., and Papakyriakou, T.: Contribution of under-ice primary production to an ice-edge upwelling phytoplankton bloom in the Canadian Beaufort Sea, Geophys. Res. Lett., 36, 2009GL038837, https://doi.org/10.1029/2009GL038837, 2009. a, b
Nakaoka, S.-I., Aoki, S., Nakazawa, T., Hashida, G., Morimoto, S., Yamanouchi, T., and Yoshikawa-Inoue, H.: Temporal and spatial variations of oceanic pCO2 and air–sea CO2 flux in the Greenland Sea and the Barents Sea, Tellus B, 58, 148, https://doi.org/10.1111/j.1600-0889.2006.00178.x, 2006. a
Nitishinsky, M., Anderson, L. G., and Hölemann, J. A.: Inorganic carbon and nutrient fluxes on the Arctic Shelf, Cont. Shelf Res., 27, 1584–1599, https://doi.org/10.1016/j.csr.2007.01.019, 2007. a
Nondal, G., Bellerby, R. G. J., Olsen, A., Johannessen, T., and Olafsson, J.: Optimal evaluation of the surface ocean CO2 system in the northern North Atlantic using data from voluntary observing ships, Limnol. Oceanogr.-Method., 7, 109–118, https://doi.org/10.4319/lom.2009.7.109, 2009. a, b, c
Olafsson, J., Olafsdottir, S. R., Takahashi, T., Danielsen, M., and Arnarson, T. S.: Enhancement of the North Atlantic CO2 sink by Arctic Waters, Biogeosciences, 18, 1689–1701, https://doi.org/10.5194/bg-18-1689-2021, 2021. a
Olsen, A.: Nordic Seas total alkalinity data in CARINA, Earth Syst. Sci. Data, 1, 77–86, https://doi.org/10.5194/essd-1-77-2009, 2009. a, b, c
Olsen, A., Brown, K. R., Chierici, M., Johannessen, T., and Neill, C.: Sea-surface CO2 fugacity in the subpolar North Atlantic, Biogeosciences, 5, 535–547, https://doi.org/10.5194/bg-5-535-2008, 2008. a
Overland, J., Dunlea, E., Box, J. E., Corell, R., Forsius, M., Kattsov, V., Olsen, M. S., Pawlak, J., Reiersen, L.-O., and Wang, M.: The urgency of Arctic change, Polar Sci., 21, 6–13, https://doi.org/10.1016/j.polar.2018.11.008, 2019. a
Polyakov, I. V., Pnyushkov, A. V., Alkire, M. B., Ashik, I. M., Baumann, T. M., Carmack, E. C., Goszczko, I., Guthrie, J., Ivanov, V. V., Kanzow, T., Krishfield, R., Kwok, R., Sundfjord, A., Morison, J., Rember, R., and Yulin, A.: Greater role for Atlantic inflows on sea-ice loss in the Eurasian Basin of the Arctic Ocean, Science, 356, 285–291, https://doi.org/10.1126/science.aai8204, 2017. a
Polyakov, I. V., Rippeth, T. P., Fer, I., Alkire, M. B., Baumann, T. M., Carmack, E. C., Ingvaldsen, R., Ivanov, V. V., Janout, M., Lind, S., Padman, L., Pnyushkov, A. V., and Rember, R.: Weakening of Cold Halocline Layer Exposes Sea Ice to Oceanic Heat in the Eastern Arctic Ocean, J. Clim., 33, 8107–8123, https://doi.org/10.1175/JCLI-D-19-0976.1, 2020. a
Qu, B., Gabric, A. J., Zhu, J.-N., Lin, D.-R., Qian, F., and Zhao, M.: Correlation between sea surface temperature and wind speed in Greenland Sea and their relationships with NAO variability, Water Sci. Eng., 5, 304–315, https://doi.org/10.3882/j.issn.1674-2370.2012.03.006, 2012. a
Rajasakaren, B., Jeansson, E., Olsen, A., Tanhua, T., Johannessen, T., and Smethie, W.: Trends in anthropogenic carbon in the Arctic Ocean, Prog. Oceanogr., 178, 102177, https://doi.org/10.1016/j.pocean.2019.102177, 2019. a
Richter-Menge, J., Overland, J. E., Mathis, J. T., Osborne, E., Brown, R., Mudryk, L., Luojus, K., and Helfrich, S.: Arctic Report Card 2017, Tech. rep., https://doi.org/10.25923/8ntk-7817, 2017. a
Rudels, B., Björk, G., Nilsson, J., Winsor, P., Lake, I., and Nohr, C.: The interaction between waters from the Arctic Ocean and the Nordic Seas north of Fram Strait and along the East Greenland Current: results from the Arctic Ocean-02 Oden expedition, J. Mar. Syst., 55, 1–30, https://doi.org/10.1016/j.jmarsys.2004.06.008, 2005. a
Rysgaard, S., Vang, T., Stjernholm, M., Rasmussen, B., Windelin, A., and Kiilsholm, S.: Physical Conditions, Carbon Transport, and Climate Change Impacts in a Northeast Greenland Fjord, Arct. Antarct. Alp. Res., 35, 301–312, https://doi.org/10.1657/1523-0430(2003)035[0301:PCCTAC]2.0.CO;2, 2003. a
Rysgaard, S., Bendtsen, J., Pedersen, L. T., Ramløv, H., and Glud, R. N.: Increased CO2 uptake due to sea ice growth and decay in the Nordic Seas, J. Geophys. Res., 114, C09011, https://doi.org/10.1029/2008JC005088, 2009. a
Sejr, M., Krause-Jensen, D., Rysgaard, S., Sørensen, L., Christensen, P., and Glud, R.: Air–sea flux of CO 2 in arctic coastal waters influenced by glacial melt water and sea ice, Tellus B, 63, 815–822, https://doi.org/10.1111/j.1600-0889.2011.00540.x, 2011. a
Serreze, M. C. and Barry, R. G.: Processes and impacts of Arctic amplification: A research synthesis, Glob. Planet.Change, 77, 85–96, https://doi.org/10.1016/j.gloplacha.2011.03.004, 2011. a
Shiklomanov, A., Déry, S., Tretiakov, M., Yang, D., Magritsky, D., Georgiadi, A., and Tang, W.: River freshwater flux to the arctic ocean, in: Arctic hydrology, permafrost and ecosystems, edited by: Yang, D. and Kane, D. L., 703–738, Springer International Publishing, Cham, ISBN 978-3-030-50930-9, 2021. a
Smethie, J. W. M. and Fine, R. A.: Rates of North Atlantic Deep Water formation calculated from chlorofluorocarbon inventories, Deep-Sea Res. Pt. I, 48, 189–215, https://doi.org/10.1016/S0967-0637(00)00048-0, 2001. a
Stroh, J., Kirillov, S., Panteleev, G., Francis, O., Yaremchuk, M., Bloshkina, E., and Lebedev, N.: Changes in Arctic Ocean Climate Evinced through Analysis of IPY 2007–2008 Oceanographic Observations, in: Arctic Studies – A Proxy for Climate Change, edited by: Kanao, M., Kakinami, Y., and Toyokuni, G., IntechOpen, ISBN 978-1-78984-099-5, 978-1-78984-100-8, https://doi.org/10.5772/intechopen.80926, 2019. a
Sumata, H., De Steur, L., Gerland, S., Divine, D. V., and Pavlova, O.: Unprecedented decline of Arctic sea ice outflow in 2018, Nature Communications, 13, 1747, https://doi.org/10.1038/s41467-022-29470-7, 2022. a, b
Takahashi, T., Sutherland, S., Chipman, D., Goddard, J., Ho, C., Newberger, T., Sweeney, C., and Munro, D.: Climatological distributions of pH, pCO2, total CO2, alkalinity, and CaCO3 saturation in the global surface ocean, and temporal changes at selected locations, Mar. Chem., 164, 95–125, https://doi.org/10.1016/j.marchem.2014.06.004, 2014. a
Tuerena, R. E., Mahaffey, C., Henley, S. F., De La Vega, C., Norman, L., Brand, T., Sanders, T., Debyser, M., Dähnke, K., Braun, J., and März, C.: Nutrient pathways and their susceptibility to past and future change in the Eurasian Arctic Ocean, Ambio, 51, 355–369, https://doi.org/10.1007/s13280-021-01673-0, 2022. a, b
van Heuven, S., Pierrot, D., Rae, J., Lewis, E., and Wallace, D.: CO2SYS v 1.1, MATLAB program developed for CO2 system calculations, ORNL/CDIAC-105b. Carbon Dioxide Information Analysis Center, Oak Ridge National Laboratory, U.S. Department of Energy, Oak Ridge [code], Tennessee, https://news-oceanacidification-icc.org/2011/10/11/co2sys-for-matlab-updated-to-v1-1/ (last access: 6 September 2024), 2011. a
von Appen, W.-J., Waite, A. M., Bergmann, M., Bienhold, C., Boebel, O., Bracher, A., Cisewski, B., Hagemann, J., Hoppema, M., Iversen, M. H., Konrad, C., Krumpen, T., Lochthofen, N., Metfies, K., Niehoff, B., Nöthig, E.-M., Purser, A., Salter, I., Schaber, M., Scholz, D., Soltwedel, T., Torres-Valdes, S., Wekerle, C., Wenzhöfer, F., Wietz, M., and Boetius, A.: Sea-ice derived meltwater stratification slows the biological carbon pump: results from continuous observations, Nat. Commun., 12, 7309, https://doi.org/10.1038/s41467-021-26943-z, 2021. a, b
Wadhams, P., Holfort, J., Hansen, E., and Wilkinson, J. P.: A deep convective chimney in the winter greenland sea, Geophys. Res. Lett., 29, 1434, https://doi.org/10.1029/2001GL014306, 2002. a
Wallace, D., Behrens, W., Hopkins, T., Kinder, C., Deming, J., Smith, W., Top, Z., and Walsh, I.: Collaborative research on the Northeast Water Polynya: NEWP92 hydrographic data report, USCGC Polar Sea cruise, July 15–August 15, 1992, Tech. Rep. BNL–61923, 102497, https://doi.org/10.2172/102497, 1995a. a, b
Wallace, D. W. R., Minnett, P. J., and Hopkins, T. S.: Nutrients, oxygen, and inferred new production in the Northeast Water Polynya, 1992, J. Geophys. Res., 100, 4323, https://doi.org/10.1029/94JC02203, 1995b. a
Willcox, E. W., Bendtsen, J., Mortensen, J., Mohn, C., Lemes, M., Pedersen, T.-J., Holding, J., Møller, E. F., Sejr, M. K., Seidenkrantz, M.-S., and Rysgaard, S.: An Updated View of the Water Masses on the Northeast Greenland Shelf and Their Link to the Laptev Sea and Lena River, J. Geophys. Res.-Ocean., 128, e2022JC019052, https://doi.org/10.1029/2022JC019052, 2023. a, b, c, d
Willcox, E., Rysgaard, S., Sejr, M. K., Juul-Pedersen, T., Lemes, M., Holding, J.: Additional bottle chemistry values (ta, tco2, stable water isotopes, nutrients) for the NEG2017 cruises on the Northeast Greenland Shelf, August–September 2017, PANGAEA [data set], https://doi.org/10.1594/PANGAEA.968792, 2024a. a
Willcox, E., Rysgaard, S., Sejr, M. K., Juul-Pedersen, T., Lemes, M., Holding, J.: Additional bottle chemistry values (ta, tco2, stable water isotopes, nutrients) for the NorthGreen2017 cruise on the Northeast Greenland Shelf, August–September 2017, PANGAEA [data set], https://doi.org/10.1594/PANGAEA.968793, 2024b. a
Yager, P. L., Wallace, D. W. R., Johnson, K. M., Smith, W. O., Minnett, P. J., and Deming, J. W.: The Northeast Water Polynya as an atmospheric CO 2 sink: A seasonal rectification hypothesis, J. Geophys. Res., 100, 4389, https://doi.org/10.1029/94JC01962, 1995. a, b, c
Yasunaka, S., Siswanto, E., Olsen, A., Hoppema, M., Watanabe, E., Fransson, A., Chierici, M., Murata, A., Lauvset, S. K., Wanninkhof, R., Takahashi, T., Kosugi, N., Omar, A. M., van Heuven, S., and Mathis, J. T.: Arctic Ocean CO2 uptake: an improved multiyear estimate of the air–sea CO2 flux incorporating chlorophyll a concentrations, Biogeosciences, 15, 1643–1661, https://doi.org/10.5194/bg-15-1643-2018, 2018. a
Zeebe, R. E. and Wolf-Gladrow, D. A.: CO2 in seawater: equilibrium, kinetics, isotopes, no. 65 in Elsevier oceanography series, Elsevier, Amsterdam, New York, ISBN: 978-0-444-50579-8, 978-0-444-50946-8, 2001. a
Zhuang, Y., Jin, H., Cai, W.-J., Li, H., Jin, M., Qi, D., and Chen, J.: Freshening leads to a three-decade trend of declining nutrients in the western Arctic Ocean, Environ. Res. Lett., 16, 054047, https://doi.org/10.1088/1748-9326/abf58b, 2021. a
Zhuang, Y., Jin, H., Cai, W.-J., Li, H., Qi, D., and Chen, J.: Extreme Nitrate Deficits in the Western Arctic Ocean: Origin, Decadal Changes, and Implications for Denitrification on a Polar Marginal Shelf, Global Biogeochem. Cy., 36, e2022GB007304, https://doi.org/10.1029/2022GB007304, 2022. a