the Creative Commons Attribution 4.0 License.
the Creative Commons Attribution 4.0 License.
 | 25 Apr 2025
Rising Arctic seas and thawing permafrost: uncovering the carbon cycle impact in a thermokarst lagoon system in the outer Mackenzie Delta, Canada
Juliane Wolter
Susanne Liebner
Christian Knoblauch
Guido Grosse
Fiona Giebeler
Dustin Whalen
Climate warming in the Arctic is directly connected to rising sea levels and increasing erosion of permafrost coasts, leading to inland-migrating coastlines and the transformation of coastal permafrost lakes into thermokarst lagoons. These lagoons represent transitional zones between terrestrial to sub-sea permafrost environments. So far, the effect of the transition on the carbon cycle is fairly unknown. In this study, we conducted long-term anoxic incubation experiments on surface samples from thermokarst lagoons with varying degrees of sea connectivity. We also included terrestrial permafrost and the active layer as endmembers to investigate variations in carbon dioxide (CO2) and methane (CH4) production within lagoon systems and along a land–sea transition transect on Reindeer Island, northeast Mackenzie Delta, Canada. Results show that CH4 production peaks at 4.6 mg CH4 g−1 C in younger, less connected lagoons with high-quality organic matter, leading to up to 18 times higher greenhouse gas (GHG) production (in CO2 equivalents) compared to open lagoons. CO2 production is higher under marine conditions (3.8–5.4 mg CO2 g−1 C) than under brackish conditions (1.7–4.3 mg CO2 g−1 C). Along a land–sea transect, CO2 production increased with increasing marine influence. These findings suggest that the landward migration of the sea, resulting in the inundation of permafrost lowlands and thermokarst lakes, may lead to increased GHG emissions from Arctic coasts in the future.
- Article
(2954 KB) - Full-text XML
-
Supplement
(1270 KB) - BibTeX
- EndNote


-
The highest total greenhouse gas production is in the first stage of the land–sea transition (active layer and young thermokarst lagoons under brackish conditions).
-
CO2 production increases along a land–sea transect with increasing salinity.
-
CH4 production is highest under brackish conditions in lagoons.
-
The lowest overall production is in permafrost sediment thawed for the first time, showing that microbes need time to adapt.
The Arctic region is experiencing unprecedented rates of temperature rise, nearly 4 times faster than the global average (Rantanen et al., 2022). The rapid warming has significant effects, particularly evident in the Arctic Ocean and its coastal areas, resulting in rising sea levels (Guimond et al., 2021; Nerem et al., 2018; Proshutinsky et al., 2001; Watson et al., 2015), extensive sea ice loss (Jahn et al., 2024; Kwok and Rothrock, 2009; Notz and Stroeve, 2016) and erosion of ice-rich permafrost coasts (Günther et al., 2013; Jones et al., 2018; Malenfant et al., 2022; Whalen et al., 2022).
With approximately 1 million people residing along the Arctic coastlines, they are directly impacted by the transformation of coastal permafrost landscapes and the migration of the sea inland (Ramage et al., 2021). The average rate of permafrost coastline change throughout the Arctic between 1950 and 2000 was , with significant regional and intra-regional variations (Irrgang et al., 2022). The biggest rise in Arctic erosion rates, ranging from +80 % to +160 %, was observed along the permafrost coasts of the Alaska and Canadian Beaufort Sea (Jones et al., 2020). In the Mackenzie Delta area, shoreline retreat rates have been documented as high as , leading to substantial land loss and inland migration of the coastline (Malenfant et al., 2022; Solomon, 2005).
As sea levels rise and coastal erosion progresses, previously isolated thermokarst lakes and basins with bottom elevations below sea level become connected to the ocean, forming thermokarst lagoons (Jenrich et al., 2021; Schirrmeister et al., 2018). Along the Arctic coast, from the Taymyr Peninsula in Russia to the Tuktoyaktuk Peninsula in Canada, 520 thermokarst lagoons larger than 500 m in diameter have been identified, covering a total area of nearly 3500 km2 (Jenrich et al., 2024b). These lagoons, located at the interface between land and sea, form a critical transition zone from terrestrial to sub-sea permafrost environments. Electrical resistivity surveys revealed that permafrost degradation in former lagoon deposits occurs up to 170 % faster than in submerged Yedoma permafrost (Angelopoulos et al., 2021), significantly accelerating carbon cycling in these areas.
Permafrost, which is ground that has been frozen for more than 2 consecutive years, lies beneath 13.9×10⁶ km2 (ca. 15 %) of the exposed land area (Obu, 2021), and about 407.680 km of arctic coasts (34 % of the world coastline) is classified as permafrost coasts (Lantuit et al., 2012). Including also non-permafrost deposits the permafrost region stores ∼1700 Pg organic carbon (OC) in active layer soils and deposits, frozen ground (Lindgren et al., 2018; Miner et al., 2022; Schuur et al., 2022), and lake taliks (Strauss et al., 2021; Walter Anthony et al., 2014), which is about 50 % of the OC stored in all global soils (3350 Pg; Strauss et al., 2025). Additionally, model simulations estimate another ∼2800 Pg OC in deep permafrost below the seafloor of Arctic shelves (Miesner et al., 2023), which cover an area of almost 2.5×10⁶ km2 (Overduin et al., 2019). Rising temperatures in a warming Arctic accelerate permafrost thaw, activating ancient microbes and leading to the decomposition of organic carbon into greenhouse gases (GHGs) such as carbon dioxide (CO2) and methane (CH4).
The transition from unsaturated, aerobic conditions in terrestrial permafrost to saturated, anaerobic conditions in inundated soils results in a shift in microbial composition and, consequently, greenhouse gas production (Bush et al., 2017; Jenrich et al., 2024a; Liu et al., 2022). Under laboratory conditions, carbon breakdown processes and the associated production of CO2 and CH4 during landscape changes can be replicated by incubation experiments (e.g. Laurent et al., 2023; Liu et al., 2022; Tanski et al., 2019). CO2 production is dominant in unsaturated soils, while CH4 production is happening in saturated, anoxic soils (Le Mer and Roger, 2001; Schädel et al., 2016). Marine sediments generally exhibit lower decomposition rates compared to terrestrial permafrost (Miesner et al., 2023). As terrestrial thermokarst lakes transition to marine environments, the hydrochemical and biogeochemical conditions of the sediment shift, affecting the microbial community composition (Jenrich et al., 2024a; Yang et al., 2023). In marine sediments, methanogens are found mostly in sediment layers below the sulfate reduction zone, as sulfate-reducing bacteria (SRB) outcompete methanogens for key substrates like acetate and hydrogen (Jørgensen, 2006; Oremland and Polcin, 1982). During this transition, as soils become inundated with seawater, CO2-producing SRB grow (An et al., 2023). A few studies focussing on organic-rich sediments (Holmer and Kristensen, 1994; Jørgensen and Parkes, 2010), salt marshes (Oremland et al., 1982), coastal sediments (Maltby et al., 2018) and the early stages of lagoon formation (Jenrich et al., 2024a; Yang et al., 2023) have reported the coexistence of methanogens and SRB, which is probably driven by non-competitive substrates like methanol and methylated compounds. A recent study simulating greenhouse gas production during different transition stages in a coastal thermokarst landscape demonstrated that CO2 production initially decreases following lagoon formation. However, in the long term, after SRB establish themselves, CO2 production increases significantly, surpassing that in thawing terrestrial permafrost by a factor of 8 (Jenrich et al., 2024a).
When highly degraded, lowland thermokarst landscapes are flooded by the sea, thermokarst lagoons, lakes and the sea become connected with each other, and complex lagoon systems are formed. Consequently, a natural gradient of marine submergence age and connectivity emerges within the system with older, well-connected lagoons closer to the sea and younger, less connected lagoons further inland. The individual basins of previous thermokarst lakes are often still identifiable by their characteristic round shape in the new lagoon system. These systems are widespread along all Arctic lowland coasts with ice-rich permafrost and abundant thermokarst lakes, such as the Laptev, East Siberian, Chukchi and Beaufort seas. They serve as a natural study setting for investigating the impact of progressive marine inundation on permafrost and its organic matter pool. Different lagoon development stages found in the same region would represent a space-for-time gradient that could allow better understanding of the production of greenhouse gases in inundated permafrost soils under varying degrees of seawater influence. In Jenrich et al. (2024b), thermokarst lagoons are classified by openness and the degree of connectivity with the sea, both for single lagoons and lagoons within a lagoon system. They defined five connectivity classes from very high (5) for lagoons which are always open and in direct exchange with the sea to very low (1) for nearly closed lagoons where the exchange is very limited due to long channels or for subsequent lagoons in lagoon systems with very limited exchange due to narrow inlets and great distances to the sea.
Despite the abundance of thermokarst lagoons and their potential interesting role in the Arctic carbon cycle, their GHG production dynamics during the transition from terrestrial permafrost to sub-sea permafrost remain poorly studied so far. In particular, knowledge gaps persist regarding the variation in carbon degradability and GHG production based on lagoon development stage as well as the evolution of GHG production with increasing seawater influence.
In this study, we address these gaps by answering the following questions:
-
How does greenhouse gas production differ within a lagoon system under near-natural conditions, considering different degrees of lagoon openness and distance to the sea?
-
How does greenhouse gas production differ with increasing seawater influence in the land–sea transition along a permafrost lake–lagoon transect?
This study is the first focussing on thermokarst lagoon development stages and the GHG production rates occurring during the transition of permafrost from a terrestrial to a marine setting to better understand the role of thermokarst lagoons in the Arctic carbon cycle and more broadly what happens when terrestrial permafrost becomes inundated by the sea.
In this study, we collected and incubated surface samples of thermokarst lagoons of different transgression stages within a lagoon system as well as terrestrial samples from the active layer and permafrost on Reindeer Island, northeast Mackenzie Delta, Canada.
Reindeer Island, formerly connected to the northern head of Richards Island, is situated in the northern region of the Mackenzie Delta, Northwest Territories, Canada (Fig. 1). Thawing of the ice-rich permafrost led to water-filled thaw depressions or thermokarst lake formations that can extend over 20 m deep. Marine transgression during the Holocene period (last 10 000 years) flooded the region creating submerged basins (Solomon et al., 2000). In addition, lake expansion, sea level rise and coastal erosion caused the inundation and eventual connection of individual lakes to each other and ocean, forming the current lagoons system that separates Reindeer Island from Richards Island. The ice-rich permafrost on Richards Island is continuous, exceeding 500 m in thickness, contrasting sharply with the discontinuous permafrost of the Mackenzie Delta (Judge et al., 1987; Kohnert et al., 2017). The regional sedimentology is characterized by discontinuous unconsolidated till in an ice-rich permafrost environment. During the short open-water (ice-free) season (late June to October), the area is exposed to high winds and increased wave action during coastal storms. Although the south side of Reindeer Island and most of the inner lagoon is protected from the forces of offshore waves during storms, it is still susceptible to thawing permafrost during increased air temperatures. There is a direct correlation with northwest winds () and air temperature with coastal erosion in this region (Berry et al., 2021; Lim et al., 2020). Richards Island has experienced moderate to rapid coastal erosion rates. Hynes et al. (2014) reported erosion rates for 1972–2000 to be up to 3.6 m yr−1, with significant annual retreat occurring at North Head (the tip of Richards Island) and the ocean side of Reindeer Island. The average erosion rate within the lagoon study area was reported to be 0.28 m yr−1 (Hynes et al., 2014), with increased rates (up to 1.1 m yr−1) at some locations on the south side of Reindeer Island near sample sites 3, 4 and 16. Despite the regional and localized erosion, it is clear that a significant portion of sediment originates from the Mackenzie River's sediment plume (Solomon et al., 2000), which is supplying 128 Mt of fluvial sediments on average per year (from 1974 to 1994; Carson et al., 1998). The Mackenzie River therefore is the largest supplier of fluvial sediments and the fourth-largest provider of freshwater to the Arctic Ocean (330 km2 yr−1) (Vonk et al., 2015). A total of 55 % of the sedimentary OC is transported through the delta and deposited on the coastal shelf, suggesting that 45 % is deposited mainly in lakes within the delta in the course of the spring ice break (Vonk et al., 2015) and when lakes get more connected to the river system (Burn, 1995) but likely also in the thermokarst lagoons at the head of the delta.
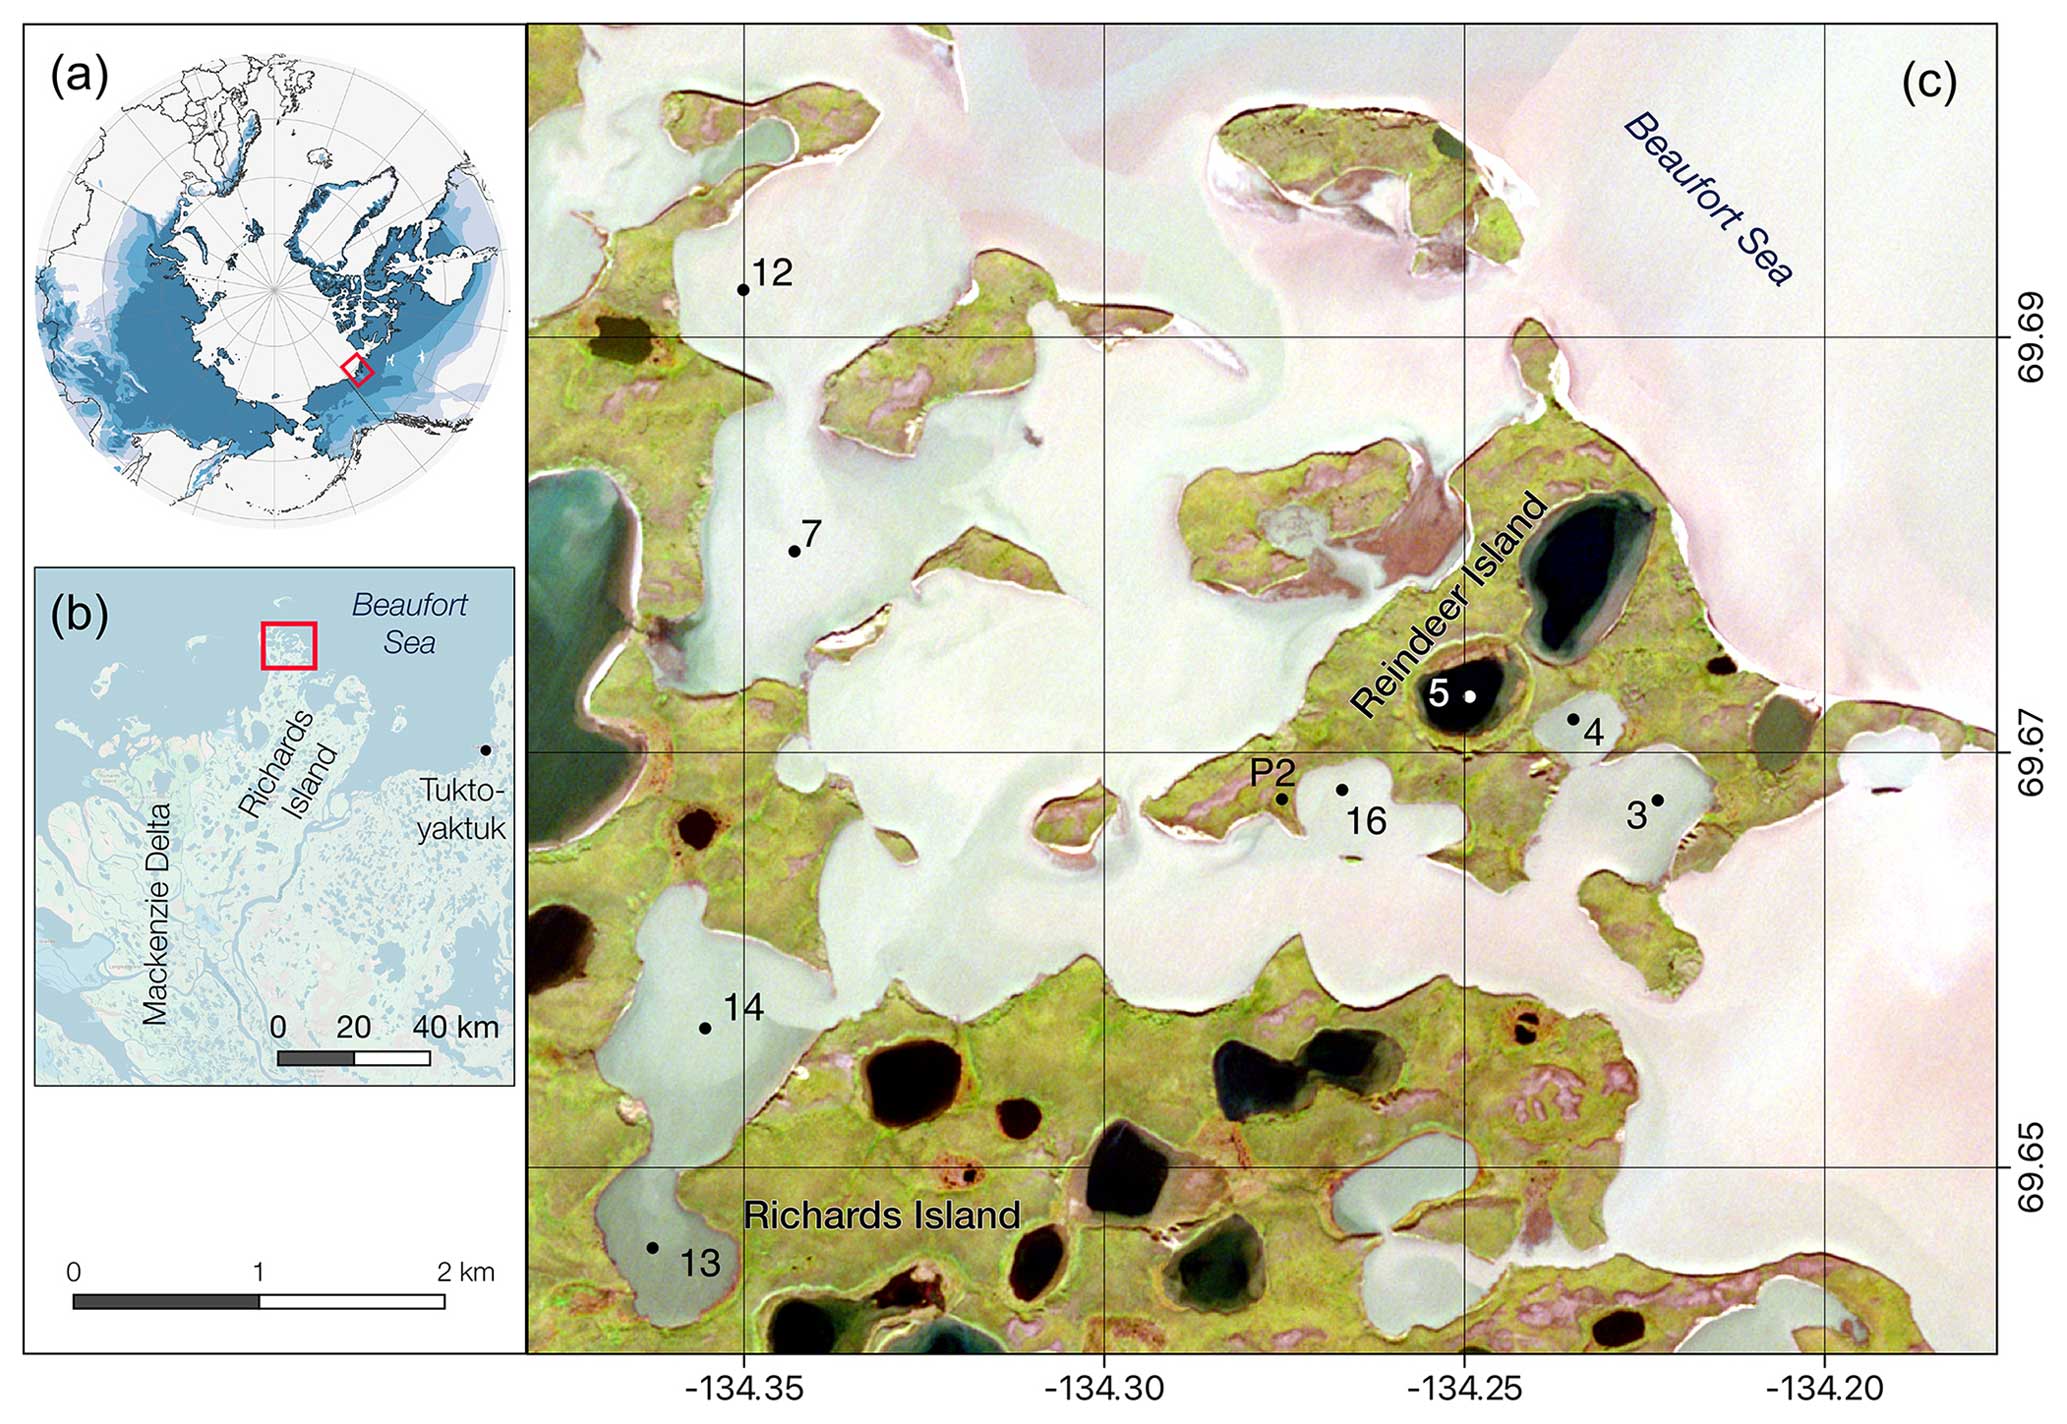
Figure 1Study sites located on Reindeer Island and the surrounding lagoon system close to Richards Island, northern Mackenzie Delta, Canada (A, B). Coring sites are marked by a dot (C): P2 soil pit – active layer and permafrost sampling; 5 – thermokarst lake; 3, 4, 7, 12–14 and 16 – thermokarst lagoons of varying connectivity. Imagery sources: (A) permafrost extent regions based on Brown et al. (1997); (B) ESRI base map; (C) Sentinel-2 satellite image band combination 4-3-2 from 26 August 2021. Note that different water colours are related to sediment load coming from the Mackenzie River plume and indicative of the different lagoon connectivity, with black colours being closed lake basins, darker grey colours limited-open or well-connected lagoon, and light grey waters in very open lagoons (similar to the open sea).
To the east, Reindeer Island borders the Beaufort Sea, while to the south and west, flooded thermokarst lake basins form a lagoon system separating the island from Richards Island. This lagoon system, consisting of at least 14 individual former thermokarst lake basins, covers an area of 13.7 km2 (Jenrich et al., 2024b) and was first investigated in 1993 (Solomon et al., 2000). Bathymetric investigations during these studies have revealed overall shallow water depths (<2 m) around Reindeer Island, allowing for the formation of bottom fast ice during winter. The 137Cs data suggest that sedimentation rates in the lagoons ranged from 0.7 to 2 cm yr−1 over the past 50 years (Solomon et al., 2000). For this study we revisited five of the coring sites investigated by Solomon et al. (2000) (our site names: LAG3, LAG4, LAG7, LAG12 and TKL5) and added three more (LAG13, LAG14, LAG16), all representing lagoons with varying connectivity with the sea and therefore varying influence from marine processes and fluvial inputs from the Mackenzie River. Based on the classification by Jenrich et al. (2024b), LAG7 and LAG12 are Class 5 lagoons with very high connectivity, which are always open. LAG3 and LAG16 are considered Class 4, which are defined as mostly open, spatially second-tier lagoons that are very well connected to the primary lagoon. LAG4 and LAG14 are Class 3, semi-open second-tier lagoons which are well connected to the primary lagoon. LAG13 is a Class 2 second-tier lagoon which is less connected to the primary lagoon due to the great distance and multiple narrow inlets reducing the exchange with the sea.
Further we sampled the active layer and permafrost in a low land position (P2; 69.6723° N, −134.2493° E) on the island.
3.1 Fieldwork and subsampling
Fieldwork was conducted at the Reindeer Island lagoon system in collaboration with Natural Resources Canada during August 2021. For this study we chose seven distinct locations within the lagoon system as well as one thermokarst lake. Using a boat we took surface water samples using a water sampler (UWITEC, Austria), collected conductivity–temperature–depth (CTD) information by using a CastAway CTD device (SonTek, USA) and cored sediments using a gravity coring system (UWITEC Single Corer, Austria). A minimum of two cores were extracted from each site, with one core designated for microbiological analyses and subsequent incubation experiments. These cores were preserved within gas-proof bags filled with nitrogen gas to maintain anaerobic conditions and stored at a temperature of 4 °C. A second core was reserved for sedimentological analyses and also stored at 4 °C. The length of the cores varied from 10 to 49 cm.
Furthermore, active layer (AL) and permafrost (PF) samples were taken from a soil pit located on the lowland of Reindeer Island. The stratigraphy of the active layer was described and documented, with subsamples being selectively collected based on visual observations of distinct sediment layers. These subsamples were used for incubation experiments, including microbiological analyses and sediment analyses. Dimensions of the subsamples were recorded to calculate sample volumes for subsequent bulk density calculations. In addition, permafrost sampling was conducted using a Hilti hand drill, extracting the uppermost permafrost samples extending to a depth of 12 cm. These permafrost samples were kept frozen in the field and transported to the Alfred Wegener Institute laboratories in Potsdam for further analysis.
Samples for incubation experiments were placed in precombusted glass jars, sealed and stored within nitrogen-filled gas-proof bags. Biomarker samples were preserved in precombusted sterilized glass jars, and sediment samples for subsequent analyses were stored in sterile plastic bags (WhirlPak).
In the laboratory, the sediment cores were cut length-wise and the visual stratigraphy was described and documented. Subsamples were carefully extracted ranging from depths of 3 to 10 cm, intended for incubation and microbiological analyses. The edges of these subsamples were cleaned by scratching off the outermost material, and the sample material was deposited into pre-combusted glass jars. To minimize contact with oxygen, these jars were immediately flushed with nitrogen gas and subsequently stored in bags filled with nitrogen at a temperature of 4 °C until the initiation of the planned experiments. Moreover, subsamples from one core half were taken every 5 cm for sedimentology and geochemistry analyses, while the other half was preserved in an archive freezer for future reference. The wet weight of all subsamples was recorded before further handling.
3.2 Hydrochemistry
Using Rhizon samplers (membrane pore size: 0.12–0.18 µm), pore water was collected from thawed samples for the hydrochemical pre-incubation analysis. The pH and electrical conductivity (EC in mS cm−1) of the pore water were measured using a WTW MultiLab 540, with an accuracy of ±0.01 for pH and ±1 mV for EC. After treating the DOC samples with 50 µL of 30 % HCl Suprapur, they were stored at +4 °C until analysis with a Shimadzu total organic carbon analyser (TOC-VCPH) following the protocol described by Fritz et al. (2015), with an accuracy of ±1.5 %. Pore water for measuring sulfate concentration was diluted (1:50) and subjected to triplicate analysis using the Sykam S 155 Compact IC System ion chromatograph, which has a detection limit of 0.1 mg L−1. The detected peaks in the chromatograms were automatically integrated using the ChromStar 7 program, and the triplicate average was used for further assessment.
Using the TEOS-10 MATLAB implementation, we were able to convert the measured electrical conductivity (with respect to 25 °C) to molality (mol kg−1) and absolute salinity (g kg−1) (McDougall and Barker, 2011). This conversion package assumes that the pore water fluid is consistent with standard seawater composition (Millero et al., 2008).
In order to be able to test GHG production in different sediments during the phases of landscape development (lake, lagoon, sub-sea), it is crucial to keep the boundary conditions (fresh: ; brackish: ; marine: ) and the total water volume of 10.5 mL constant. For this purpose, we calculated based on the molarity of the pore water how much of the highly concentrated artificial seawater solution () needed to be added to the samples. The artificial seawater solution had a higher concentration than that of standard seawater, so a relatively lower volume of water could be added to the sediment pore water and be diluted. The artificial seawater contained NaCl (24.99 g L−1), MgCl2×6 H2O (11.13 g L−1), Na2SO4 (4.14 g L−1), CaCl2×2 H2O (1.58 g L−1), KCl (0.79 g L−1) and NaHCO3 (0.17 g L−1) dissolved in ultrapure water and sterile filtered thereafter.
3.3 Sedimentological and biogeochemical bulk analyses
Prior to and following freeze-drying (using a Zirbus Sublimator 15), the sediment was weighed, and the weight difference between the wet and dry sediment was used to calculate the absolute water content.
Grain size analyses were performed using a Malvern Mastersizer 3000 with a connected Malvern Hydro LV wet-sample dispersion machine on organic-free (processed with 35 % H2O2) samples. The percentages of sand, silt and clay are given as sums between 2 mm and 63, 63 and 2 µm and less than 2 µm, in that order. Grain size parameters were computed using GRADISTAT (Blott and Pye, 2001; version 8.0).
The total carbon (TC) and total organic carbon (TOC) content (expressed in weight percent, wt %) of homogenized and milled bulk samples (using a Fritsch Pulverisette 5 planetary mill) were analysed using a soli TOC cube, and the total nitrogen (TN) content was determined using a rapid Max N exceed (both Elementar Analysensysteme, Langenselbold, Germany); both instruments had a device-specific accuracy of ±0.1 wt % and a detection limit of 0.1 wt %. Carbonates were removed from sediments using 1.3 molar hydrochloric acid (HCl) at 50 °C for 5 h in order to perform stable carbon isotope analysis of organic carbon. The samples were then dried once more after being cleaned of chloride ions.
Next, at the AWI ISOLAB Facility Potsdam, stable carbon was analysed with a ThermoFisher Scientific Delta-V-Advantage gas mass spectrometer fitted with a ConFlo IV and a FLASH 2000 elemental analyser.
3.4 Incubation experiment
To assess anaerobic respiration pathways in a controlled environment, we used sealed glass jars with submerged sub-surface sediments. This set-up allowed us to maintain anoxic conditions typical of marine sediment environments. However, the static, sealed nature of these jars may limit natural electron acceptor recharge observed in stratified sediments in open systems with dynamic hydrology. This limitation is noted as a potential artefact when extrapolating findings to natural, vertically stratified marine sediments but gives the advantage of having a controlled setting in the lab to decipher the changes under controlled conditions, e.g. salinity gradients.
To analyse how CO2 and CH4 production differs within a lagoon system (objective 1), given that well-connected lagoons (LAG7, LAG12, LAG14, LAG16) have been under the influence of seawater for a longer period and to a greater extent than poorly connected, younger lagoons (LAG4, LAG13), we incubated sub-surface samples (3–10 cm depth) of the lagoons under brackish () and marine ) conditions using artificial seawater for 415 d. As oxygen has a negative impact on anaerobic microbial populations, we disposed of the first 3 cm of the sample and kept the environment oxygen-free for the duration of the incubation and sample processing (handling and overnight thawing at 8 °C in a glovebox under nitrogen atmosphere).
To investigate the variation in CO2 and CH4 production with increasing seawater influence in a land–sea transect (objective 2), we incubated permafrost, lake and lagoon samples under increasing saline conditions as described in Jenrich et al. (2024a). In short, we incubated the terrestrial samples (P2-PF, P2-AL, TKL5) with freshwater to simulate near-natural lake conditions, with brackish water to simulate freshly formed lagoons and with marine water to simulate established lagoons. We used sediments from the three lagoons (LAG4, LAG3, LAG16) because they differ in age and connectivity from the sea and therefore represent different states of lagoon development. The lagoon samples were incubated under brackish and marine conditions to simulate near-natural conditions depending on their pore water salinity. Permafrost and active layer samples were incubated for 244 d, while lagoon samples were incubated for 415 d. Accordingly, the cumulative CO2 and CH4 after 244 d were used to answer question 2 (GHG production along land–sea transect).
In order to ensure similar boundary conditions for the samples and their individual treatments, we used the same dry weight (5 g) and the same water content (10.5 mL) in all bottles, as well as the same salinity for the brackish and marine treatment. Therefore, depending on the initial pore water content and salinity, different amounts of wet soil had to be weighed in and different volumes of artificial seawater added to the samples, respectively, for the treatment (fresh: ; brackish: ; marine: ). We acknowledge that submerged sediments close to the coast of the Mackenzie Delta still experience brackish conditions, but for simplicity, we ignore the effects of river discharge.
Given the well-established anaerobic conditions in waterlogged soils in situ, we conducted the incubation anaerobically.
The samples were homogenized to ensure identical replicates before being put into 120 mL glass incubation vials that had been previously combusted. For every treatment, three replicates were incubated at 4 °C for comparability with previous permafrost incubation studies (e.g. Jongejans et al., 2021; Tanski et al., 2019) and to roughly match with the temperature of the water at the bottom of the water bodies in the summer.
CO2 and CH4 concentrations were measured using gas chromatography (7890A Agilent, United States) equipped with a thermal conductivity detector and a flame ionization detector, respectively, with helium as the carrier gas and a 100 °C oven furnace temperature. To prevent zonation in sediment and water, the incubation vials were shaken before each measurement. Using a gastight syringe, gas samples were extracted from the vials' headspace and promptly fed into the gas chromatograph. The measurements were taken five times in the first 2 weeks, then every week for the next 7 weeks and then roughly every 2 weeks after that. Gas concentrations were normalized to the dry weight of the sediment (g dw−1). The total amount of CO2 and CH4 was calculated in micromoles (µmol) using the ideal gas law (Knoblauch et al., 2018) employing the gas concentration, headspace volume, water volume, pH, temperature and solubility, including carbonate and bicarbonate concentrations for CO2 calculations (Millero et al., 2007). Further, the average of CO2 and CH4 for each of the three replicates was calculated, and we used the TOC content to normalize the data to grams per soil organic carbon (g SOC−1). Rates were then determined using the measured time intervals. Cumulative values were obtained by subtracting the initial measurement from each subsequent one, allowing for the calculation of production rates.
3.5 Statistics
All data analyses were conducted in R version 4.3.2. To compare brackish and marine treatments across all lagoons (n=7) and transect sites (n=6), we used both paired Student's t tests and Wilcoxon signed-rank tests (R functions: t-test and wilcox-test, respectively). While the t test assumes approximate normality and is sensitive to outliers, the Wilcoxon test is non-parametric and does not rely on these assumptions. Since both tests yielded the same results, we reported the Wilcoxon test outcomes. Principal component analyses (PCAs) were performed on range-transformed data using the base R function “princomp” to explore which biogeochemical parameters correlate with CO2 and CH4 production in the different connectivity classes. The parameters tested included surface water EC, TOC, TN and δ13C under both brackish and marine conditions. The PCA results were visualized in a biplot using the “ggbiplot” package (Vu and Friendly, 2023).
4.1 Surface water hydrochemistry
Table 1 summarizes the surface water properties of the lake and the seven lagoons. Only two of the lagoons we examined (LAG3, LAG12) had a depth shallower than 2 m, while the others ranged between 2.3 and 7.4 m in depth. Average EC over depth measured in the lagoons ranged from 5.8 to 17.5 mS cm−1 and is therefore much lower than the average surface water salinity of the Arctic Ocean (52.8 mS cm−1, 33.8 psu; Hall et al., 2023).
Table 1Lake (TKL5) and lagoon (LAG) surface water properties: connectivity class (2 low to 5 very high – open lagoons), water depth, temperature (T), electrical conductivity (EC) and pH have been measured in the field in August 2021. Dissolved organic carbon (DOC) and sulfate concentrations were measured in the laboratory. Min: minimal; max: maximal; av: average.
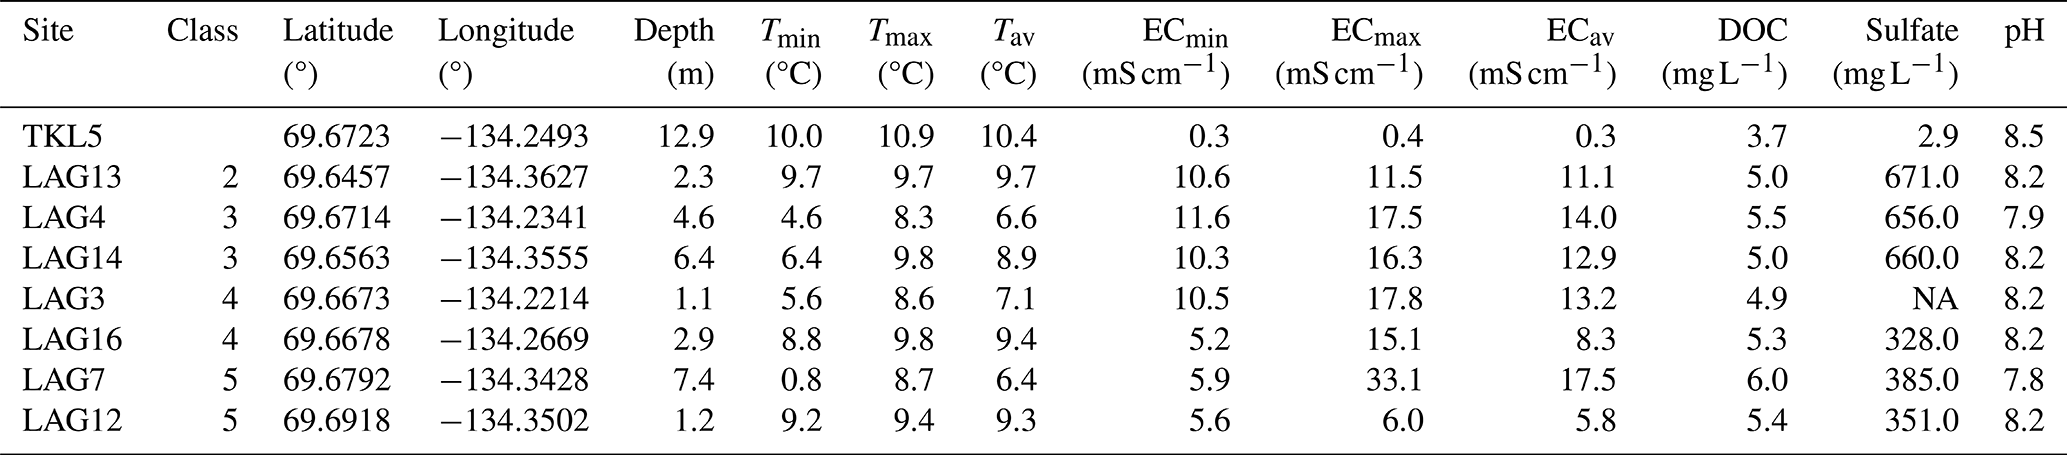
NA: not available.
During summer, stratification occurred in the deeper lagoons due to freshwater discharge from the Mackenzie River, particularly evident in LAG7 with a temperature difference of approximately 8 °C and an EC difference of around 27 mS cm−1 between surface and near-bottom layers. No stratification was observed in the lake and shallow lagoons LAG12 and LAG13, while in LAG16, there was no difference in temperature but a variation in salinity.
4.2 Bulk sediment biogeochemistry and pore water hydrochemistry
Results on bulk sediment biogeochemistry and pore water hydrochemistry are presented in Table 2. The TOC content of the sediment was lowest in LAG3 (1.45 wt %) and highest in the active layer (26.31 wt %). Nitrogen content ranged from 0.17 % in LAG3 and LAG12 to 1.53 % in the active layer, followed by permafrost and LAG13. The CN ratio was lowest in LAG3 (8.53) and highest in permafrost (30.91). The average CN ratio in the lagoons was approximately 14±3. Additionally, the δ13C composition was relatively homogeneous, ranging from −27.65 ‰ in the AL to −25.86 ‰ in LAG3.
Table 2Bulk sediment and pore water biogeochemistry of permafrost (PF), active layer (AL), thermokarst lake (TKL5) and thermokarst lagoons (LAG): total organic carbon (TOC) and nitrogen (N) content, carbon to nitrogen ratio, stable 13C isotopes, water content (WC), electrical conductivity (EC), salinity, pH, and dissolved organic carbon content (DOC). PDB is the reference standard for stable carbon isotope measurements.
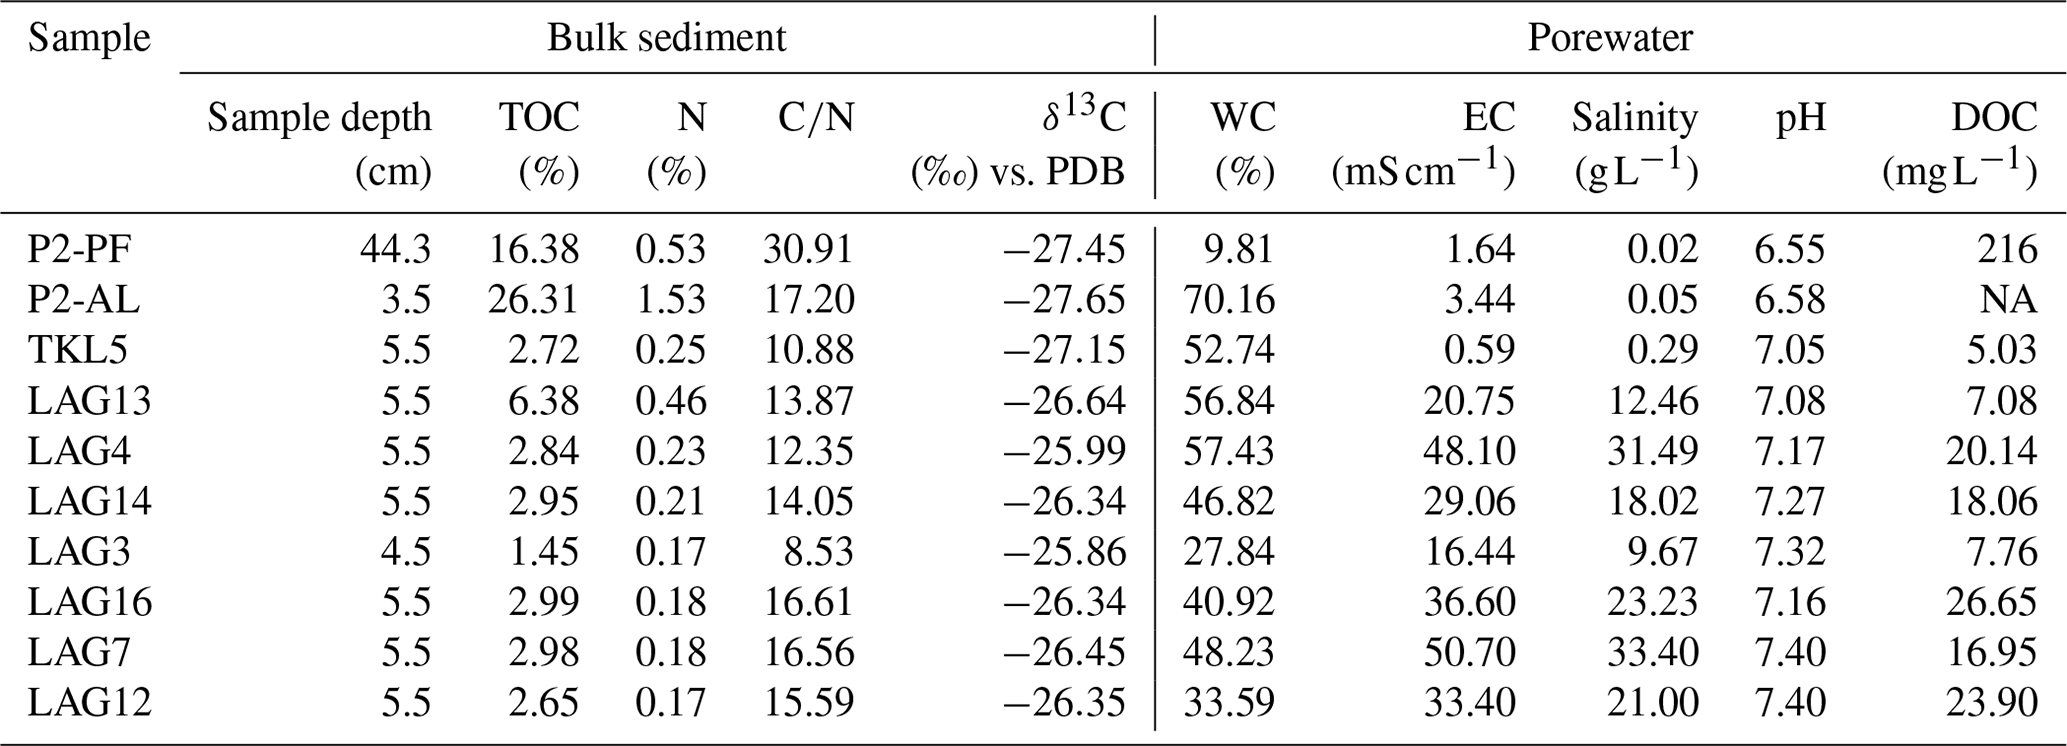
Regarding pore water, water content was lowest in the permafrost sample and highest in the AL. EC of the pore water varied significantly, with the lowest salinity recorded in the freshwater lake (EC: 0.59 mS cm−1, 0.02 g L−1) and the highest in LAG7 (EC: 50.7 mS cm−1, 33.4 g L−1). DOC concentrations showed marked differences, with the lowest levels detected in the lake, LAG3 and LAG13 and the highest in the permafrost samples.
In surface water, sulfate concentration exhibited diverse patterns. The lowest levels were recorded in the lake (3 mg L−1), while the highest was observed in LAG13 (671 mg L−1). Similar sulfate concentrations were detected for LAG7, LAG12 and LAG16, as well as for LAG4, LAG13 and LAG14.
4.3 Grain size distribution
The particle size distribution analysis shows significant differences between permafrost and the active layer (Fig. S1 in the Supplement). Permafrost exhibited a predominance of fine silt particles, with a mean grain size of 8.1 µm, whereas the active layer was characterized by sandy sediment, with a mean grain size of 97.3 µm. Lagoons LAG4–LAG16 displayed a consistent pattern of fine silt composition, with mean grain sizes ranging from 3.75 to 7.41 µm. However, Lagoon LAG3 stood out due to its very poorly sorted medium to coarse silt with a mean grain size of 34.2 µm. LAG3 also has a second peak in the sandy fraction, which is very similar to the sandy active layer. It is also notable that the permafrost has a unimodal (one-peak) distribution, as do most of the lagoons within a similar range as the permafrost, while the lake and LAG3 exhibit a bimodal (two-peak) distribution. The active layer is unimodal but has its peak in a different range. This suggests that at least two main processes contribute to the depositional regimes.
4.4 Greenhouse gas production
4.4.1 CO2 and CH4 production in lagoon sediments after 415 d of incubation
The results on the cumulative anaerobic CO2 and CH4 production measured after 415 d for the lagoons are shown in Fig. 2.
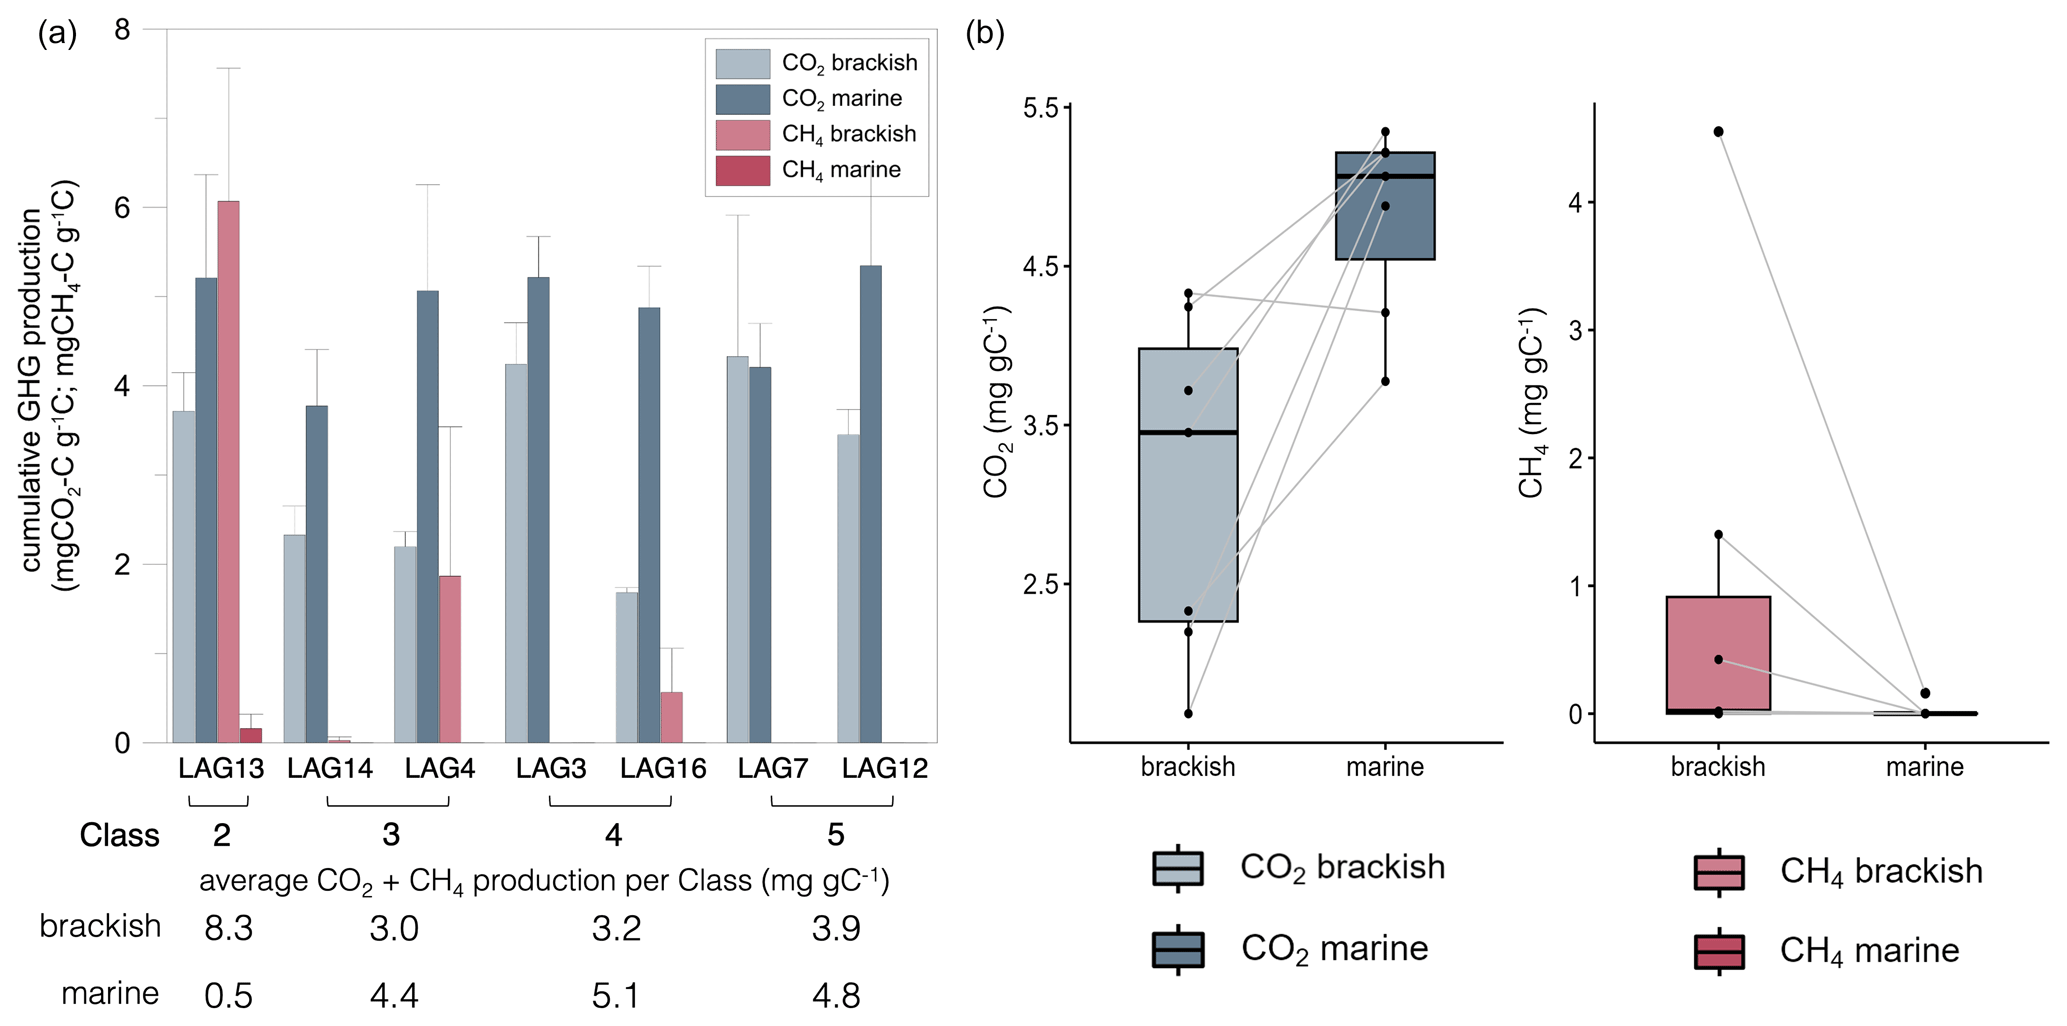
Figure 2Cumulative CO2 (mg CO2 g−1 C) and CH4 (mg CH4 g−1 C) production of surface sediment from the seven lagoons of varying seawater connectivity under brackish (13 g L−1) and marine (36 g L−1) conditions after 415 d of anaerobic incubation. (a) Grouped barplot with lagoons (LAG) ordered by connectivity class from low connectivity (Class 2) to very high connectivity (Class 5) to the sea. Error bars indicate standard deviation. (b) Treatment comparison – paired box–whisker plots with connected data points (lines). The treatment has a significant effect on both CO2 and CH4 production (two-sided Wilcoxon test: n=7; p=0.031 and p=0.047, respectively).
CO2 production ranged from 1.68 to 4.33 mg CO2 g−1 C under brackish conditions and from 3.78 to 5.35 mg CO2 g−1 C under marine conditions, and the CH4 production ranged from 0.00 to 4.55 mg CH4 g−1 C under brackish conditions and from 0.00 to 0.16 mg CH4 g−1 C under marine conditions (Fig. 2a). CO2 production was significantly lower under brackish compared to marine conditions (n=7, p=0.016), while CH4 production was significantly higher under brackish conditions (n=7, p=0.023) (Fig. 2b). For six of the seven lagoons no CH4 production was observed under marine conditions. The highest cumulative CH4 production rate was observed under brackish conditions below the limitedly open LAG13 (). CH4 production started after 150 to 200 d for LAG13, LAG4 and LAG16 under brackish conditions and for LAG13 after 360 d under marine conditions (Fig. S1). For Lagoons 14, 3, 7 and 12 no methane production was observed in the time frame of the experiment.
LAG14 and LAG4, both categorized with medium connectivity (Class 3), exhibit very similar CO2 production under brackish conditions of 2.33±0.32 and , respectively, while under marine conditions LAG14 produced more CO2.
Mostly open Class 4 lagoons, LAG3 and LAG16, both categorized with high connectivity to the sea, demonstrate different cumulative CO2 production under brackish conditions of 4.24±0.46 and , respectively, but similar CO2 production under marine conditions.
The very highly connected Class 5 lagoons, LAG7 and LAG12, both show high CO2 production under brackish and marine conditions. The highest CO2 production of all lagoons was observed in LAG12 with 5.35±1.12 mg CO2 g−1 C.
Relationships between biogeochemical parameters and gas production. Based on the principal component analysis (Figs. S2 and S3 in the Supplement) of the parameters brackish and marine CO2 and CH4 production, TN, TOC, δ13C, and surface water EC, the sites are grouped by openness, with the most closed lagoons forming one group and the more open lagoons forming another. CO2 production correlates with surface water EC but not clearly with substrate parameters, while CH4 production correlates with substrate parameters in brackish and marine incubations.
4.4.2 CO2 and CH4 production of permafrost, lake and lagoon sediments after 244 d of incubation
The incubation with fresh water, which represents natural conditions for the terrestrial sites, showed that the thermokarst lake sample exhibited the highest cumulative CO2 production of , while the permafrost sample showed the lowest CO2 production at (Fig. 3a). The highest cumulative CH4 production was measured in the active layer sample at (Fig. 3b). In contrast, the thermokarst lake sample exhibited the lowest CH4 production at .
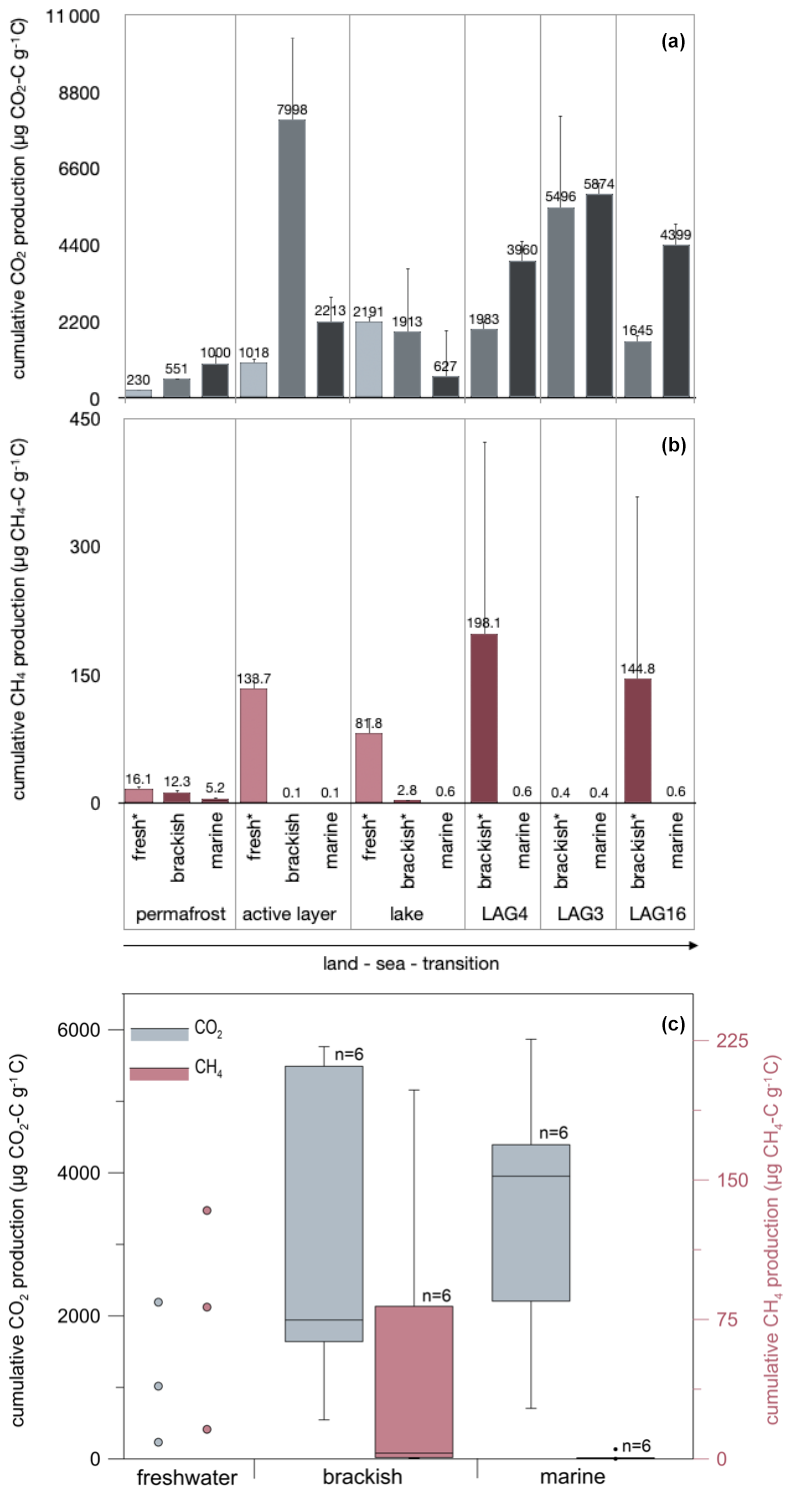
Figure 3Cumulative (a) CO2 and (b) CH4 production after 244 d of anaerobic incubation at 4 °C under an increasing seawater influence (treatment: fresh, brackish, marine conditions) and (c) box–whisker plots visualizing the effect of the treatment on CO2 and CH4 production. Note that CO2 and CH4 production is not at the same scale.
Under brackish conditions, the permafrost sample exhibited the lowest CO2 production of . Even though brackish conditions are not natural for microbes in terrestrial settings, the active layer sample showed the highest cumulative CO2 production (), followed by the mostly open lagoon LAG3 () (Fig. 3a). Regarding CH4 production, the LAG4 sample displayed the highest cumulative production under brackish conditions at , while the active layer sample showed the lowest average CH4 production at (Fig. 3b).
Under marine water treatments, the most CO2 was produced in the LAG3 sample (), while the lake sample showed the lowest CO2 production () (Fig. 3a). Regarding CH4 production, the permafrost sample displayed the highest cumulative production of , while the active layer sample showed the lowest CH4 production at . However, CH4 production under marine conditions was generally low for all samples (Fig. 3b).
In Fig. 3c, CO2 and CH4 production is compared by treatment. By testing the effect of the treatment on CO2 and CH4 production in a paired Wilcoxon test for the six transect settings, we found that CO2 production does not differ significantly between brackish and marine treatments (n=6, p=0.844), but CH4 production is significantly higher under brackish than marine conditions (n=6, p=0.031). If all 10 sites are considered, the difference is stronger (Wilcoxon test, paired, two-sided, n=10, p=0.03711).
Relationships between biogeochemical parameters and gas production. Based on the principal component analysis (Figs. S4 and S5 in the Supplement) of the parameters brackish and marine CO2 and CH4 production, TOC, δ13C, and surface water EC, terrestrial and lagoon sites group separately. CO2 production in brackish incubations shows no correlations, while in marine incubations, CO2 production is positively correlated with δ13C and surface water EC. CH4 production in brackish incubations is positively correlated with δ13C and surface water EC and negatively correlated with TOC, but it shows no clear correlations in marine incubations.
The Reindeer Island lagoon system was first studied in 1994 to investigate the response of the Mackenzie Delta shoreline to changing hydrological influences (Solomon et al., 2000). That study used seismic data to show that most of the sediment in the marine areas comes from tidal exchange with inner shelf water and storm surges. The study estimated that Richards Island's thaw lakes contain 250 000 t of total organic carbon (Solomon et al., 2000). Almost 30 years later we revisited the area to investigate the greenhouse gas production within the lagoon system and along a land–sea transition transect. Our goal was to get a better understanding of carbon dynamics in these transitional environments.
5.1 Variations in CO2 and CH4 production within the lagoon system
We found that the production of greenhouse gases shifts from a balanced ratio to the exclusive production of CO2 as the lagoons become increasingly connected to the sea. Thus, as expected, sulfate reduction seems to inhibit methanogenesis. In Fig. 4, we show cumulative CO2 and CH4 production under near-natural saline conditions. Here, we define “near-natural” as brackish for pore water salinities of less than 24.5 g L−1 (mean of brackish (13 g L−1) and marine (36 g L−1) treatment), which was the case for LAG12, LAG16, LAG3, LAG14 and LAG13, and marine for pore water salinities greater than 24.5 g L−1 (LAG7 and LAG4).
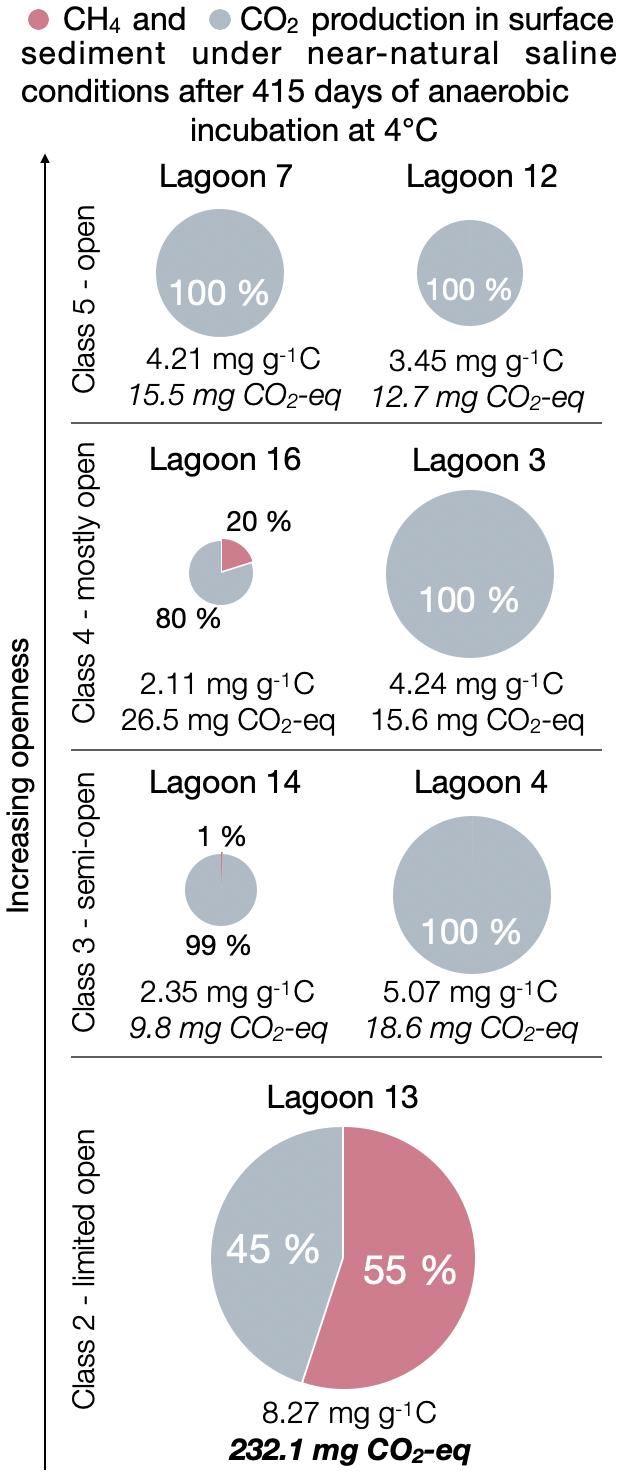
Figure 4Cumulative CO2 and CH4 production in sub-surface lagoon sediments after 415 d of anaerobic incubation under near-natural salinity conditions which are brackish conditions for Lagoons 12, 16, 3, 14 and 13 and under marine conditions for Lagoons 7 and 4. The size of the pie diagram is proportional to the total production of CO2 and CH4 in milligrams per gram carbon (mg g−1 C) (number below chart). The share of CH4 (pink) and CO2 (grey) for the total production of CO2 and CH4 (in mg g−1 C) is given in percent. The total in CO2 equivalents is based on 36 CH4 for GWP100 (Balcombe et al., 2018).
In the youngest, less open LAG13 (Class 2), methane production was very high (Fig. 2). Observing CH4 production in sulfate-containing environments was surprising, as the current understanding is that sulfate-reducing bacteria (SRB) outcompete methanogens for the major substrates hydrogen and acetate (Holmes et al., 2017; Kristjansson and Schönheit, 1983; Lovley et al., 1982; Olefeldt et al., 2013; Schönheit et al., 1982). Nevertheless, CH4 production under brackish conditions in young lagoons has been observed before (Jenrich et al., 2024a; Yang et al., 2023). In these environments, which are in the early stages of transitioning from a terrestrial lake to a lagoon, terrestrial methanogens are still present. Under low sulfate levels, methanogens and SRB can coexist (Dar et al., 2008; Yang et al., 2023). LAG13 exhibits the highest TOC concentrations, with less depletion in 13C, suggesting that the availability of high-quality organic matter may drive enhanced CH4 production. Elevated CH4 production coincides with high CO2 levels, indicating peak GHG emissions during this early stage of the land–sea transition. In terms of CO2 equivalents, calculated based on 36 CH4 for a Global Warming Potential (GWP) of 100 (Balcombe et al., 2018), the CO2 equivalent of LAG13 is significantly higher – up to 18 times – compared to the open lagoons (e.g. LAG12). This is in line with the results of Jenrich et al. (2024a), where the highest CO2 and CH4 production was also detected for the most closed lagoon (Class 1 after Jenrich et al., 2024a) under brackish conditions. Consequently, young lagoons with high OM content and quality exert the greatest climate impact among the studied lagoons (Fig. S2). However, compared to current values, CO2 production in the lagoons of this study area is lower than that of the studied lagoons on Bykovsky Peninsula, Siberia (Jenrich et al., 2024a). There, the maximum CO2 production reached up to 23 mg CO2 g−1 C for lagoon sediments (Class 1) under brackish conditions after 1 year of anaerobic incubation. Unlike the Reindeer Island lagoon system, the lagoons on the Bykovsky Peninsula are located in the Yedoma domain (Jenrich et al., 2021; Strauss et al., 2021). Geographical differences and deposition mechanisms likely influence the colonization of microorganisms, which in turn could explain the variations in CO2 production.
Methane production declines with lagoon openness and marine exposure. Class 5 lagoons produce only CO2, correlating with δ13C enrichment (from −26.64 ‰ to −26.34 ‰) and reduced TOC content (from 6.38 wt % to 2.65 wt %).
Pore water salinity varies widely (Table 2) despite constant surface water salinity during the summer (Table 1) due to differences in pore size and depth. For instance, shallow, sandy LAG3 shows 3 times lower salinity than deeper, finer-grained LAG4. This variation was also highlighted by Solomon et al. (2000).
LAG3 tends to freeze to the bottom in winter due to its shallow depth, significantly impacting the salinity dynamics. During the formation of lagoon ice, high-saline brines form at the lagoon bottom (Angelopoulos et al., 2020; Jenrich et al., 2021). These brines can infiltrate into the sediment, as high pore water salinities observed in LAG4 suggest. Bottom fast ice can freeze the underlying sediment, potentially expelling salts further down, resulting in maximum salinities at greater depths (Jenrich et al., 2021). In LAG4, which contains fine-grained sediments, the downward diffusion of salt is slower compared to lagoons with coarser-grained sediments, leading to higher salinities in the surface layers. The combination of these factors – ice formation, brine infiltration, sediment grain size and water depth – creates complex salinity profiles within these thermokarst lagoons, influencing biogeochemical and microbial processes.
Greenhouse gas production varies between lagoons of the same class due to differences in environmental and microbial factors. For example, although LAG4 and LAG14 (both Class 3 lagoons) have similar biogeochemical and sedimentological parameters but differ in salinity and depth, LAG4 produces over twice as much CO2 under near-natural conditions. This disparity is likely due to differences in microbial community composition, though no data are available to support this hypothesis. Similarly, Lagoons 3 and 16 exhibit significant variations in GHG production, likely driven by differences in depth, salinity, organic carbon content and ice formation dynamics. While Lagoon 3, with shallow bedfast ice, produces more CO2 under brackish conditions, it shows no methane production within the experimental time frame. Many incubation studies have shown that methane production has a long lag time and can start much later than CO2 production (Jenrich et al., 2024a; Jongejans et al., 2021; Knoblauch et al., 2013, 2018; Knorr and Blodau, 2009; Rivkina et al., 2007; Roy Chowdhury et al., 2015). Bedfast ice in shallow Lagoon 3 causes the upper sediment layers to freeze. Freezing is a significant disturbance for microbes (Holm et al., 2020), especially for the slower-recovering and smaller methanogenic community, which might cause delayed methane production compared to deeper Lagoon 16.
The observed differences in greenhouse gas production between lagoons within the same class highlight the potential influence of factors such as microbial community composition, salinity and depth, while connectivity to the sea plays a crucial role in shaping the broader patterns of GHG production across different lagoon classes. Class 2 lagoons with low connectivity to the sea show the most dramatic difference between brackish and marine conditions. In those lagoons, significantly higher GHG production under brackish conditions indicates that microbes are not yet adapted to higher salinities. Class 3 and 4 lagoons show a similar pattern: a moderate GHG production under brackish conditions and a marked increase under marine conditions. This indicates that microbes have already adapted to higher salinities at that stage of the land–sea transition. Very open Class 5 lagoons maintain relatively high GHG production under both brackish and marine conditions, with slightly higher production under marine conditions. Lagoons of this class exhibit the highest GHG production stability across both treatments, implying that microbes in very highly connected lagoons are less sensitive to changes in salinity compared to less open lagoons.
5.2 CO2 and CH4 production along a land–sea transition gradient
The production of CO2 and CH4 varies significantly with increasing seawater (and thus salinity) influence along a land–sea transition gradient.
We simulated different stages of lake evolution by incubating terrestrial permafrost, active layer and lake sediment with freshwater. The results demonstrated that the total GHG production increases as freshly formed ponds evolve to young and then old lakes (Fig. 5). CH4 production in terrestrial samples is highest under freshwater conditions, where methanogens are best adapted (Wen et al., 2017). This is particularly the case in the less degraded, organic-rich active layer (Fig. 3). Here, the sediment has thawed over many summers, so the microbial community is better adapted to current conditions than in the permafrost thawed for the first time, which shows the lowest cumulative GHG production across all treatments. This suggests that microbial communities in these sediments need more time to establish themselves than was allowed in this experiment. The long-term incubation study by Knoblauch et al. (2013) has revealed that the labile organic matter can be mineralized within the first 3 months but that the turnover of stable carbon pools may take several thousands of years.
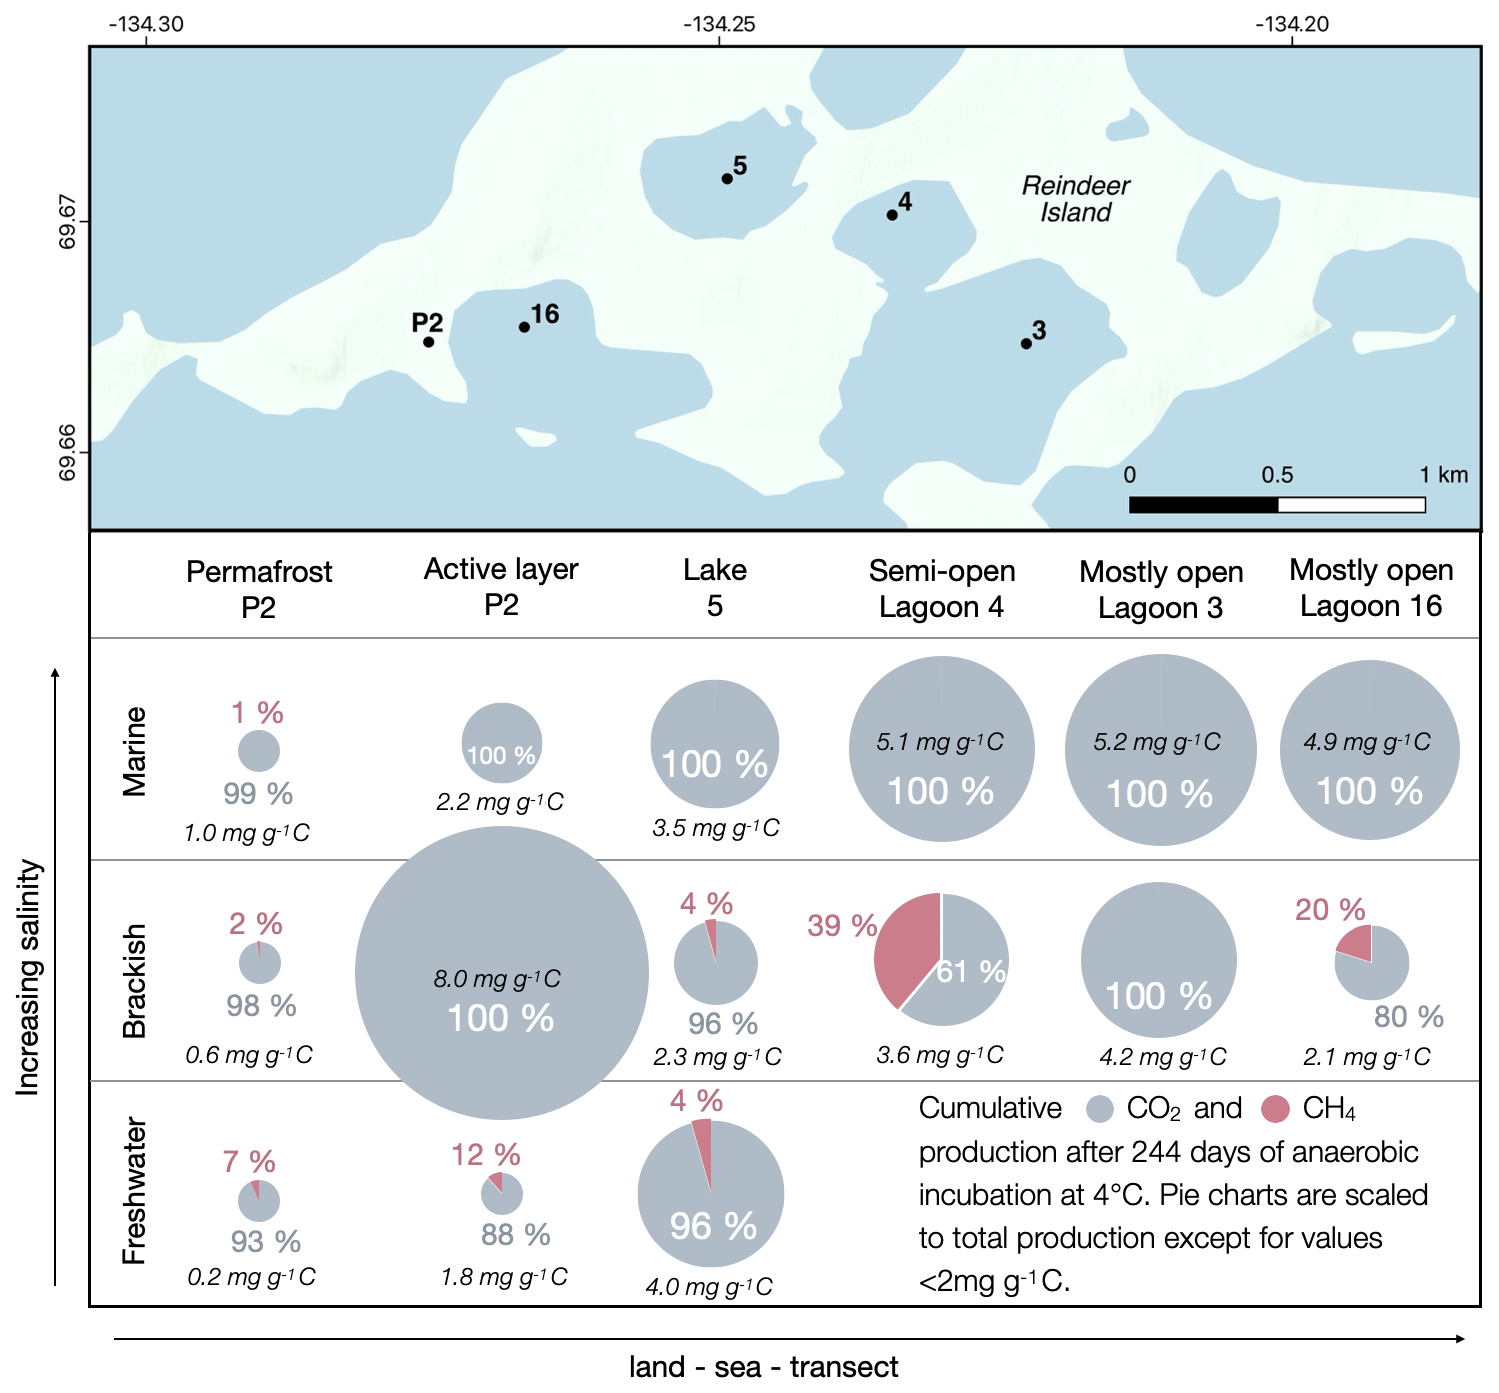
Figure 5GHG production along a land–sea–transect. Cumulative CO2 and CH4 production after 244 d of anaerobic incubation under fresh, brackish and marine conditions for the terrestrial sites and under brackish and marine conditions for the lagoons. Total production normalized to grams of carbon (g C). Map: basemap ESRI.
The incubation experiment revealed that CH4 production is highest in LAG4, the most closed along the transect, under brackish conditions (Fig. 3). Compared to CO2 production, CH4 production there starts after a long lag phase. Sulfate was depleted in LAG4 by the end of the incubation, creating conditions that promoted methanogene activity and therefore CH4 production (Dar et al., 2008). As marine conditions intensified, CO2 production continued to rise, whereas CH4 production stopped. The higher availability of sulfate as an electron acceptor is promoting SRB over methanogens under marine conditions (Kristjansson and Schönheit, 1983).
Beyond sulfate reduction, other anaerobic respiration pathways may influence the balance of CO2 and CH4 production in sediments. Iron reduction, driven by Fe(III)-reducing microbes, can outcompete methanogenesis in Fe(III)-rich environments, favouring CO2 production. Similarly, nitrate reduction may suppress methanogenesis through substrate competition, though nitrate levels in permafrost are typically low. Methanogenesis itself occurs via different pathways: hydrogenotrophic methanogenesis, which depends on H2 availability and dominates in nutrient-poor conditions, and acetoclastic methanogenesis, reliant on acetate – a substrate that can accumulate in thawing permafrost. Additionally, the anaerobic oxidation of methane (AOM), a process that recycles CH4 into CO2 using electron acceptors like sulfate or iron, may play a role, as observed in similar Arctic lagoon systems (Yang et al., 2023). However, due to the lack of measurements for Fe(III), nitrate, acetate and methane fluxes in this study, these pathways remain speculative and warrant further investigation.
The observed increase in CO2 production under marine conditions contrasts with findings from an incubation experiment using sediment from lagoons along the Bykovsky Peninsula coast in northeast Siberia (Jenrich et al., 2024a), where higher salinities led to a decrease in CO2 production. They suggested that microbes were better adapted to brackish, near-natural conditions than to marine conditions. Unlike the lagoons in this study, which are part of an interconnected system, the Bykovsky Peninsula lagoons are more isolated. It is possible that marine microorganisms are better distributed in a lagoon system, allowing them to colonize upper soil layers and adapt more effectively to marine conditions than in isolated lagoons. However, microbial analyses are needed to confirm this hypothesis. Further, the results of the PCA (Figs. S2 and S4) indicate that local conditions have the greatest impact on GHG production; therefore more studies are needed to get an understanding of the underlying mechanisms.
At Reindeer Island, CO2 production increased dramatically when the terrestrial active layer was inundated with brackish water for the first time, overshooting CO2 production in lagoon sediments. This underlines that CO2 production is highest in young, freshly formed lagoons or recently flooded coastal lowlands. In comparison, CO2 production is much lower for active layer sediment incubated under marine conditions, showing that an extreme shift in salinity in a short timescale reduces microbial activity. The increase in CO2 production from brackish to marine conditions in lagoon sediments demonstrates that CO2 production can pick up once the former terrestrial microbial community has adapted to marine conditions during the slow process of seawater inundation.
5.3 Incubation experiments in the context of Arctic coastal carbon dynamics
Placing our greenhouse gas production rate measurements into the larger context of Arctic coastal carbon dynamics is challenging because of the limited number of comparable studies. Tanski et al. (2019) used a similar incubation set-up to investigate carbon dioxide production from eroding coastal permafrost. They recorded higher CO2 production values. Their setting, however, is not directly comparable since they incubated under aerobic conditions where carbon turnover is known to be faster. Similar to our study, Tanski et al. (2019) found that CO2 production is higher with seawater than without and concluded that CO2 production is promoted along the coastal zones. Our investigation has shown that this effect occurs not only under aerobic conditions at the coast, but also under anaerobic conditions in the sediment below the water column. The availability of sulfate as an alternative electron acceptor promotes SRB and leads to a shift from a balanced CH4 and CO2 production in young, less connected lagoons towards purely CO2 production with ongoing marine impact.
Contrary to our findings, Lougheed et al. (2020) report higher in situ CO2 concentrations in the water columns of freshwater systems (thermokarst ponds, lakes and rivers) compared to saline and brackish systems (ocean, coastal lagoon and brackish rivers) on the Arctic coastal plain in Alaska, USA. However, they did not survey thermokarst lagoons, which are distinct from coastal lagoons like the studied Elson Lagoon. Thermokarst lagoons originate from thermokarst lakes and therefore have a higher terrestrial signature than coastal lagoons. Elevated CO2 concentrations in the nearshore waters of Elson Lagoon where the coastline is eroding highlights the role of terrestrial carbon and nutrient input (Tweedie et al., 2012). By studying the interface of sediment and the water column in Elson Lagoon, Dunton et al. (2023) found a vertical gradient in CO2 concentrations with high values at the lagoon bottom and a seasonal shift from net heterotrophic CO2 release from sediments under ice to net autotrophic CO2 uptake during break-up and open water. These findings underscore the complexity of carbon dynamics in Arctic coastal systems. So far, we only know how much CO2 and CH4 is produced in thermokarst lagoon sediments under laboratory conditions. In situ CO2 concentration measurements of the water column would be needed to understand the carbon flux from the sediment to the atmosphere to predict their climate impact.
A total of 520 thermokarst lagoons exist along the coasts of the Laptev, East Siberian, Chukchi and Beaufort shelf seas, including individual lagoons that are part of a larger lagoon system (Jenrich et al., 2024b). They are thus more than twice as abundant as the 216 identified coastal lagoons in the same region (Angelopoulos et al., 2021). More than half of the identified thermokarst lagoons are young, low connected lagoons (Classes 1 and 2) (Jenrich et al., 2024b). This study, along with the previous study by Jenrich et al. (2024a), shows that these low connected lagoons, which are at the first stages of the lake-to-sea transition, have the highest GHG production and therefore should be the focus of further research.
Laboratory incubations offer a controlled environment that provides valuable insights into how GHG production is influenced by specific factors, such as salinity. However, while laboratory settings are excellent for focused investigations, they do not replicate the full complexity of natural environments, which involve a wide range of factors and interactions. In natural settings, various parameters, such as the duration of the open-water season, annual fluctuations in pH and water temperature, water depth, bathymetry, sediment and nutrient input from sources such as rivers, and plant–soil interactions, significantly affect GHG pathways in land–sea transitional areas.
The patterns observed in this long-term incubation study provide insights into anaerobic respiration and carbon dynamics. They also highlight some limitations in representing field conditions. In situ, vertical stratification of redox potential layers is influenced by dynamic recharge of electron acceptors from overlying oxygenated and mineral-rich water columns, which cannot be replicated in sealed jars. Pathways such as iron and nitrate reduction, hydrogenotrophic and acetolactic methanogenesis, and AOM play distinct roles in field environments, where their activity is modulated by substrate availability and redox gradients. In the jars, the static environment may limit competition among pathways, potentially amplifying methanogenesis relative to iron or nitrate reduction. While hydrogenotrophic methanogenesis likely dominates in nutrient-poor conditions of Arctic sediments, the fate of mineralized carbon products (e.g. CO2) in overlying alkaline, oxygenated waters – where precipitation of carbonates can occur – is not captured in this set-up. Additionally, AOM, observed in comparable systems like Bykovsky lagoons (Yang et al., 2023), might reduce net CH4 emissions in situ but remains speculative without methane flux data. These limitations underscore the need for complementary field studies using dynamic systems, such as sediment columns with continuous electron acceptor recharge, to validate lab-based findings and better understand how they translate to natural sedimentary environments.
We found significant variations in GHG production along a gradient from terrestrial to marine settings in Arctic coastal regions. CH4 production was high in terrestrial sediments under natural freshwater conditions due to methanogen adaptation. When Arctic permafrost lowlands are inundated with brackish water, CO2 production accelerates. Young, less connected thermokarst lagoons, which comprise over 50 % of the mapped pan-Arctic thermokarst lagoons, exhibited the highest CH4 and CO2 production. Their CO2 equivalents can be up to 18 times higher than the open lagoons, attributed to high terrestrial organic carbon content and distinct microbial communities. As lagoons become more open, CH4 production decreases or ceases, while CO2 production rises with increased seawater influence. CO2 production was significantly higher under marine conditions, whereas CH4 production was significantly higher under brackish conditions.
Moreover, we found that pore water salinity in lagoon sediments was highly variable but not directly related to the openness of the lagoon. Instead, water depth and the formation of bedfast ice, along with the associated brine exclusion, had the greatest impact on pore water salinity and thus likely on the lagoon GHG production potential.
In the context of climate change, thermokarst lagoons forming along Arctic permafrost coastlines with ice-rich permafrost and abundant thermokarst lakes and basins are a part of the overall permafrost–climate feedback loop. Arctic warming, permafrost thaw and accelerating permafrost coastal erosion likely will result in higher numbers of young, high-emitting thermokarst lagoons, amplifying carbon release and contributing to further warming. Sea level rise further accelerates the transition from terrestrial to coastal environments in permafrost coastal lowlands, enhancing CO2 production. Understanding these processes is crucial for predicting and mitigating the impacts of Arctic changes on global climate as well as capturing the full permafrost carbon picture in models.
All data generated in this study are available on the PANGAEA data repository at https://doi.org/10.1594/PANGAEA.974430 (Jenrich, 2025).
The supplement related to this article is available online at https://doi.org/10.5194/bg-22-2069-2025-supplement.
MJ and JS designed this study. MJ and JS developed the overall coring plans for the Reindeer Island field campaign. MJ and JS conducted the fieldwork. DW enabled fieldwork due to his logistical support. MJ and FG performed laboratory analyses. SL supported the incubation experiments by supplying gas chromatography facilities. JW conducted statistical analyses. MJ led the writing of the first draft of the manuscript. All co-authors contributed with their specific expertise to data interpretation as well as manuscript writing.
At least one of the (co-)authors is a member of the editorial board of Biogeosciences. The peer-review process was guided by an independent editor, and the authors also have no other competing interests to declare.
Publisher's note: Copernicus Publications remains neutral with regard to jurisdictional claims made in the text, published maps, institutional affiliations, or any other geographical representation in this paper. While Copernicus Publications makes every effort to include appropriate place names, the final responsibility lies with the authors.
We thank G. Tanski for helping organize field trip logistics. We further thank Jimmy Kalinek and Nya for boating us and for keeping us safe during fieldwork and remote camp life. We greatly thank our fieldwork assistant Aude Flamand from Université du Québec à Rimouski for always having a helping hand and a bright mind. Thanks to Angus Robertson for bringing a nitrogen bottle by helicopter which ensured keeping samples anoxic. For their essential help in the laboratories, we thank the Alfred-Wegener Institute Helmholtz Centre for Polar and Marine Research (AWI) and GFZ Helmholtz Centre for Geosciences lab technicians (Justin Lindemann, Antje Eulenburg, Jonas Sernau, Oliver Burckhardt, Steffen Okolski).
This research has been supported by the DBU (project “Characterization of Organic Carbon and Assessment of Greenhouse Gas Emissions in a Warming Arctic” grant no. AZ20020/676), and the idea of this study is also connected to the completed Changing Arctic Carbon cycle in the Coastal Ocean Near-shore (CACOON) project (a project focussing on the dynamic interface between land and ocean in the Arctic funded by the German Federal Ministry of Education and Research (BMBF; #03F0806 A). Juliane Wolter was funded by the German Research Foundation (DFG grant no. DFGWO2420/2-1). The Alfred Wegener Institute provided the baseline funding for this project and funded the Arctic fieldwork, as well as open-access publication.
The article processing charges for this open-access publication were covered by the Alfred-Wegener-Institut Helmholtz-Zentrum für Polar- und Meeresforschung.
This paper was edited by Nicolas Brüggemann and reviewed by two anonymous referees.
An, L., Yan, Y.-C., Tian, H.-L., Chi, C.-Q., Nie, Y., and Wu, X.-L.: Roles of sulfate-reducing bacteria in sustaining the diversity and stability of marine bacterial community, Front. Microbiol., 14, https://doi.org/10.3389/fmicb.2023.1218828, 2023.
Angelopoulos, M., Overduin, P. P., Westermann, S., Tronicke, J., Strauss, J., Schirrmeister, L., Biskaborn, B. K., Liebner, S., Maksimov, G., Grigoriev, M. N., and Grosse, G.: Thermokarst Lake to Lagoon Transitions in Eastern Siberia: Do Submerged Taliks Refreeze?, J. Geophys. Res.-Earth, 125, e2019JF005424, https://doi.org/10.1029/2019JF005424, 2020.
Angelopoulos, M., Overduin, P. P., Jenrich, M., Nitze, I., Günther, F., Strauss, J., Westermann, S., Schirrmeister, L., Kholodov, A., Krautblatter, M., Grigoriev, M. N., and Grosse, G.: Onshore Thermokarst Primes Subsea Permafrost Degradation, Geophys. Res. Lett., 48, e2021GL093881, https://doi.org/10.1029/2021GL093881, 2021.
Balcombe, P., Speirs, J. F., Brandon, N. P., and Hawkes, A. D.: Methane emissions: choosing the right climate metric and time horizon, Environ. Sci.-Proc. Imp., 20, 1323–1339, https://doi.org/10.1039/C8EM00414E, 2018.
Berry, H. B., Whalen, D., and Lim, M.: Long-term ice-rich permafrost coast sensitivity to air temperatures and storm influence: lessons from Pullen Island, Northwest Territories, Canada, Arctic Science, 7, 723–745, https://doi.org/10.1139/as-2020-0003, 2021.
Blott, S. J. and Pye, K.: GRADISTAT: a grain size distribution and statistics package for the analysis of unconsolidated sediments, Earth Surf. Proc. Land., 26, 1237–1248, https://doi.org/10.1002/esp.261, 2001.
Brown, J., Ferrians, O. J., Heginbottom, J. A., and Melnikov, E. S.: Circum-Arctic map of permafrost and ground-ice conditions, Circum-Pacific Map, U. S. Geological Survey, https://doi.org/10.3133/cp45, 1997.
Burn, C. R.: The hydrologic regime of Mackenzie River and connection of “no-closure” lakes to distributary channels in the Mackenzie Delta, Northwest Territories, Can. J. Earth Sci., 32, 926–937, https://doi.org/10.1139/e95-078, 1995.
Bush, T., Diao, M., Allen, R. J., Sinnige, R., Muyzer, G., and Huisman, J.: Oxic-anoxic regime shifts mediated by feedbacks between biogeochemical processes and microbial community dynamics, Nat. Commun., 8, 789, https://doi.org/10.1038/s41467-017-00912-x, 2017.
Carson, M. A., Jasper, J. N., and Conly, F. M.: Magnitude and Sources of Sediment Input to the Mackenzie Delta, Northwest Territories, 1974–94, Arctic, 51, 116–124, 1998.
Dar, S. A., Kleerebezem, R., Stams, A. J. M., Kuenen, J. G., and Muyzer, G.: Competition and coexistence of sulfate-reducing bacteria, acetogens and methanogens in a lab-scale anaerobic bioreactor as affected by changing substrate to sulfate ratio, Appl. Microbiol. Biot., 78, 1045–1055, https://doi.org/10.1007/s00253-008-1391-8, 2008.
Dunton, K. H., Whiteaker, T., and McMeans, B.: LTER: Seasonal Controls and Emergent Effects of Changing Land-Ice–Ocean Interactions on Arctic Coastal Ecosystems (BLE II), University of Texas at Austin, https://lternet.edu/wp-content/uploads/BLE-2023-LTER02-proposal-clean.pdf (last access: 9 April 2025), 2023.
Fritz, M., Opel, T., Tanski, G., Herzschuh, U., Meyer, H., Eulenburg, A., and Lantuit, H.: Dissolved organic carbon (DOC) in Arctic ground ice, The Cryosphere, 9, 737–752, https://doi.org/10.5194/tc-9-737-2015, 2015.
Guimond, J. A., Mohammed, A. A., Walvoord, M. A., Bense, V. F., and Kurylyk, B. L.: Saltwater Intrusion Intensifies Coastal Permafrost Thaw, Geophys. Res. Lett., 48, e2021GL094776, https://doi.org/10.1029/2021GL094776, 2021.
Günther, F., Overduin, P. P., Sandakov, A. V., Grosse, G., and Grigoriev, M. N.: Short- and long-term thermo-erosion of ice-rich permafrost coasts in the Laptev Sea region, Biogeosciences, 10, 4297–4318, https://doi.org/10.5194/bg-10-4297-2013, 2013.
Hall, S. B., Subrahmanyam, B., and Steele, M.: The Role of the Russian Shelf in Seasonal and Interannual Variability of Arctic Sea Surface Salinity and Freshwater Content, J. Geophys. Res.-Oceans, 128, e2022JC019247, https://doi.org/10.1029/2022JC019247, 2023.
Holm, S., Walz, J., Horn, F., Yang, S., Grigoriev, M. N., Wagner, D., Knoblauch, C., and Liebner, S.: Methanogenic response to long-term permafrost thaw is determined by paleoenvironment, FEMS Microbiol. Ecol., 96, fiaa021, https://doi.org/10.1093/femsec/fiaa021, 2020.
Holmer, M. and Kristensen, E.: Coexistence of sulfate reduction and methane production in an organic-rich sediment, Mar. Ecol. Prog. Ser., 107, 177–184, https://doi.org/10.3354/meps107177, 1994.
Holmes, D. E., Shrestha, P. M., Walker, D. J. F., Dang, Y., Nevin, K. P., Woodard, T. L., and Lovley, D. R.: Metatranscriptomic Evidence for Direct Interspecies Electron Transfer between Geobacter and Methanothrix Species in Methanogenic Rice Paddy Soils, Appl. Environ. Microb., 83, e00223-17, https://doi.org/10.1128/AEM.00223-17, 2017.
Hynes, S., Solomon, S. M., and Whalen, D.: GIS compilation of coastline variability spanning 60 years in the Mackenzie Delta and Tuktoyaktuk in the Beaufort Sea, https://doi.org/10.4095/295579, 2014.
Irrgang, A. M., Bendixen, M., Farquharson, L. M., Baranskaya, A. V., Erikson, L. H., Gibbs, A. E., Ogorodov, S. A., Overduin, P. P., Lantuit, H., Grigoriev, M. N., and Jones, B. M.: Drivers, dynamics and impacts of changing Arctic coasts, Nat. Rev. Earth Environ., 3, 39–54, https://doi.org/10.1038/s43017-021-00232-1, 2022.
Jahn, A., Holland, M. M., and Kay, J. E.: Projections of an ice-free Arctic Ocean, Nat. Rev. Earth Environ., 5, 164–176, https://doi.org/10.1038/s43017-023-00515-9, 2024.
Jenrich, M., Angelopoulos, M., Grosse, G., Overduin, P. P., Schirrmeister, L., Nitze, I., Biskaborn, B. K., Liebner, S., Grigoriev, M., Murray, A., Jongejans, L. L., and Strauss, J.: Thermokarst Lagoons: A Core-Based Assessment of Depositional Characteristics and an Estimate of Carbon Pools on the Bykovsky Peninsula, Front. Earth Sci., 9, 637899, https://doi.org/10.3389/feart.2021.637899, 2021.
Jenrich, M., Angelopoulos, M., Liebner, S., Treat, C., Yang, S., Grosse, G., Giebeler, F., Jongejans, L. L., and Strauss, J.: Greenhouse gas production and microbial response during the transition from terrestrial permafrost to a marine environment, Permafrost Periglac., 2024a.
Jenrich, M., Prodinger, M., Nitze, I., Grosse, G., and Strauss, J.: Pan-Arctic thermokarst lagoon distribution, area and classification, https://doi.org/10.1594/PANGAEA.968886, 2024b.
Jenrich, M.: Variation in greenhouse gas production within a thermokarst lagoon system, outer Mackenzie Delta, Canada, PANGAEA [data set], https://doi.org/10.1594/PANGAEA.974430, 2025.
Jones, B. M., Farquharson, L. M., Baughman, C. A., Buzard, R. M., Arp, C. D., Grosse, G., Bull, D. L., Günther, F., Nitze, I., Urban, F., Kasper, J. L., Frederick, J. M., Thomas, M., Jones, C., Mota, A., Dallimore, S., Tweedie, C., Maio, C., Mann, D. H., Richmond, B., Gibbs, A., Xiao, M., Sachs, T., Iwahana, G., Kanevskiy, M., and Romanovsky, V. E.: A decade of remotely sensed observations highlight complex processes linked to coastal permafrost bluff erosion in the Arctic, Environ. Res. Lett., 13, 115001, https://doi.org/10.1088/1748-9326/aae471, 2018.
Jones, B. M., Irrgang, A. M., Farquharson, L. M., Lantuit, H., Whalen, D., Ogorodov, S., Grigoriev, M., Tweedie, C., Gibbs, A. E., Strzelecki, M. C., Baranskaya, A., Belova, N., Sinitsyn, A., Kroon, A., Maslakov, A., Vieira, G., Grosse, G., Overduin, P., Nitze, I., Maio, C., Overbeck, J., Bendixen, M., Zagórski, P., and Romanovsky, V. E.: Arctic Report Card 2020: Coastal Permafrost Erosion, https://doi.org/10.25923/E47W-DW52, 2020.
Jongejans, L. L., Liebner, S., Knoblauch, C., Mangelsdorf, K., Ulrich, M., Grosse, G., Tanski, G., Fedorov, A. N., Konstantinov, P. Y., Windirsch, T., Wiedmann, J., and Strauss, J.: Greenhouse gas production and lipid biomarker distribution in Yedoma and Alas thermokarst lake sediments in Eastern Siberia, Glob. Change Biol., 27, 2822–2839, https://doi.org/10.1111/gcb.15566, 2021.
Jørgensen, B. B.: Bacteria and Marine Biogeochemistry, in: Marine Geochemistry, edited by: Schulz, H. D. and Zabel, M., Springer, Berlin, Heidelberg, 169–206, https://doi.org/10.1007/3-540-32144-6_5, 2006.
Jørgensen, B. B. and Parkes, R. J.: Role of sulfate reduction and methane production by organic carbon degradation in eutrophic fjord sediments (Limfjorden, Denmark), Limnol. Oceanogr., 55, 1338–1352, https://doi.org/10.4319/lo.2010.55.3.1338, 2010.
Judge, A. S., Pelletier, B. R., and Norquay, I.: Metadata – Permafrost Base and Distribution of Gas Hydrates, Geological Survey of Canada, Government of Canada, https://doi.org/10.4095/126969, 1987.
Knoblauch, C., Beer, C., Sosnin, A., Wagner, D., and Pfeiffer, E.-M.: Predicting long-term carbon mineralization and trace gas production from thawing permafrost of Northeast Siberia, Glob. Change Biol., 19, 1160–1172, https://doi.org/10.1111/gcb.12116, 2013.
Knoblauch, C., Beer, C., Liebner, S., Grigoriev, M. N., and Pfeiffer, E.-M.: Methane production as key to the greenhouse gas budget of thawing permafrost, Nat. Clim. Change, 8, 309–312, https://doi.org/10.1038/s41558-018-0095-z, 2018.
Knorr, K.-H. and Blodau, C.: Impact of experimental drought and rewetting on redox transformations and methanogenesis in mesocosms of a northern fen soil, Soil Biol. Biochem., 41, 1187–1198, https://doi.org/10.1016/j.soilbio.2009.02.030, 2009.
Kohnert, K., Serafimovich, A., Metzger, S., Hartmann, J., and Sachs, T.: Strong geologic methane emissions from discontinuous terrestrial permafrost in the Mackenzie Delta, Canada, Sci. Rep.-UK, 7, 5828, https://doi.org/10.1038/s41598-017-05783-2, 2017.
Kristjansson, J. K. and Schönheit, P.: Why Do Sulfate-Reducing Bacteria Outcompete Methanogenic Bacteria for Substrates?, Oecologia, 60, 264–266, 1983.
Kwok, R. and Rothrock, D. A.: Decline in Arctic sea ice thickness from submarine and ICESat records: 1958–2008, Geophys. Res. Lett., 36, L15501, https://doi.org/10.1029/2009GL039035, 2009.
Lantuit, H., Overduin, P. P., Couture, N., Wetterich, S., Aré, F., Atkinson, D., Brown, J., Cherkashov, G., Drozdov, D., Forbes, D. L., Graves-Gaylord, A., Grigoriev, M., Hubberten, H.-W., Jordan, J., Jorgenson, T., Ødegård, R. S., Ogorodov, S., Pollard, W. H., Rachold, V., Sedenko, S., Solomon, S., Steenhuisen, F., Streletskaya, I., and Vasiliev, A.: The Arctic Coastal Dynamics Database: A New Classification Scheme and Statistics on Arctic Permafrost Coastlines, Estuar. Coast., 35, 383–400, https://doi.org/10.1007/s12237-010-9362-6, 2012.
Laurent, M., Fuchs, M., Herbst, T., Runge, A., Liebner, S., and Treat, C. C.: Relationships between greenhouse gas production and landscape position during short-term permafrost thaw under anaerobic conditions in the Lena Delta, Biogeosciences, 20, 2049–2064, https://doi.org/10.5194/bg-20-2049-2023, 2023.
Le Mer, J. and Roger, P.: Production, oxidation, emission and consumption of methane by soils: A review, Eur. J. Soil Biol., 37, 25–50, https://doi.org/10.1016/S1164-5563(01)01067-6, 2001.
Lim, M., Whalen, D., J. Mann, P., Fraser, P., Berry, H. B., Irish, C., Cockney, K., and Woodward, J.: Effective Monitoring of Permafrost Coast Erosion: Wide-scale Storm Impacts on Outer Islands in the Mackenzie Delta Area, Front. Earth Sci., 8, https://doi.org/10.3389/feart.2020.561322, 2020.
Lindgren, A., Hugelius, G., and Kuhry, P.: Extensive loss of past permafrost carbon but a net accumulation into present-day soils, Nature, 560, 219–222, https://doi.org/10.1038/s41586-018-0371-0, 2018.
Liu, L., Chen, H., and Tian, J.: Varied response of carbon dioxide emissions to warming in oxic, anoxic and transitional soil layers in a drained peatland, Commun. Earth Environ., 3, 1–12, https://doi.org/10.1038/s43247-022-00651-y, 2022.
Lougheed, V. L., Tweedie, C. E., Andresen, C. G., Armendariz, A. M., Escarzaga, S. M., and Tarin, G.: Patterns and Drivers of Carbon Dioxide Concentrations in Aquatic Ecosystems of the Arctic Coastal Tundra, Global Biogeochem. Cy., 34, e2020GB006552, https://doi.org/10.1029/2020GB006552, 2020.
Lovley, D. R., Dwyer, D. F., and Klug, M. J.: Kinetic analysis of competition between sulfate reducers and methanogens for hydrogen in sediments, Appl. Environ. Microb., 43, 1373–1379, https://doi.org/10.1128/aem.43.6.1373-1379.1982, 1982.
Malenfant, F., Whalen, D., Fraser, P., and van Proosdij, D.: Rapid coastal erosion of ice-bonded deposits on Pelly Island, southeastern Beaufort Sea, Inuvialuit Settlement Region, western Canadian Arctic, Can. J. Earth Sci., 59, 961–972, https://doi.org/10.1139/cjes-2021-0118, 2022.
Maltby, J., Steinle, L., Löscher, C. R., Bange, H. W., Fischer, M. A., Schmidt, M., and Treude, T.: Microbial methanogenesis in the sulfate-reducing zone of sediments in the Eckernförde Bay, SW Baltic Sea, Biogeosciences, 15, 137–157, https://doi.org/10.5194/bg-15-137-2018, 2018.
McDougall, T. J. and Barker, P. M.: Getting started with TEOS-10 and the Gibbs Seawater (GSW) Oceanographic Toolbox, 2011.
Miesner, F., Overduin, P. P., Grosse, G., Strauss, J., Langer, M., Westermann, S., Schneider Von Deimling, T., Brovkin, V., and Arndt, S.: Subsea permafrost organic carbon stocks are large and of dominantly low reactivity, Sci. Rep.-UK, 13, 9425, https://doi.org/10.1038/s41598-023-36471-z, 2023.
Millero, F., Huang, F., Graham, T., and Pierrot, D.: The dissociation of carbonic acid in NaCl solutions as a function of concentration and temperature, Geochim. Cosmochim. Ac., 71, 46–55, https://doi.org/10.1016/j.gca.2006.08.041, 2007.
Millero, F. J., Feistel, R., Wright, D. G., and McDougall, T. J.: The composition of Standard Seawater and the definition of the Reference-Composition Salinity Scale, Deep-Sea Res. Pt. I, 55, 50–72, https://doi.org/10.1016/j.dsr.2007.10.001, 2008.
Miner, K. R., Turetsky, M. R., Malina, E., Bartsch, A., Tamminen, J., McGuire, A. D., Fix, A., Sweeney, C., Elder, C. D., and Miller, C. E.: Permafrost carbon emissions in a changing Arctic, Nat. Rev. Earth Environ., 3, 55–67, https://doi.org/10.1038/s43017-021-00230-3, 2022.
Nerem, R. S., Beckley, B. D., Fasullo, J. T., Hamlington, B. D., Masters, D., and Mitchum, G. T.: Climate-change-driven accelerated sea-level rise detected in the altimeter era, P. Natl. Acad. Sci. USA, 115, 2022–2025, https://doi.org/10.1073/pnas.1717312115, 2018.
Notz, D. and Stroeve, J.: Observed Arctic sea-ice loss directly follows anthropogenic CO2 emission, Science, 354, 747–750, https://doi.org/10.1126/science.aag2345, 2016.
Obu, J.: How Much of the Earth's Surface is Underlain by Permafrost?, J. Geophys. Res.-Earth, 126, e2021JF006123, https://doi.org/10.1029/2021JF006123, 2021.
Olefeldt, D., Turetsky, M. R., Crill, P. M., and McGuire, A. D.: Environmental and physical controls on northern terrestrial methane emissions across permafrost zones, Glob. Change Biol., 19, 589–603, https://doi.org/10.1111/gcb.12071, 2013.
Oremland, R. S. and Polcin, S.: Methanogenesis and sulfate reduction: competitive and noncompetitive substrates in estuarine sediments, Appl. Environ. Microb., 44, 1270–1276, https://doi.org/10.1128/aem.44.6.1270-1276.1982, 1982.
Oremland, R. S., Marsh, L. M., and Polcin, S.: Methane production and simultaneous sulphate reduction in anoxic, salt marsh sediments, Nature, 296, 143–145, https://doi.org/10.1038/296143a0, 1982.
Overduin, P. P., Schneider von Deimling, T., Miesner, F., Grigoriev, M. N., Ruppel, C., Vasiliev, A., Lantuit, H., Juhls, B., and Westermann, S.: Submarine Permafrost Map in the Arctic Modeled Using 1-D Transient Heat Flux (SuPerMAP), J. Geophys. Res.-Oceans, 124, 3490–3507, https://doi.org/10.1029/2018JC014675, 2019.
Proshutinsky, A., Pavlov, V., and Bourke, R. H.: Sea level rise in the Arctic Ocean, Geophys. Res. Lett., 28, 2237–2240, https://doi.org/10.1029/2000GL012760, 2001.
Ramage, J., Jungsberg, L., Wang, S., Westermann, S., Lantuit, H., and Heleniak, T.: Population living on permafrost in the Arctic, Popul. Environ., 43, 22–38, https://doi.org/10.1007/s11111-020-00370-6, 2021.
Rantanen, M., Karpechko, A. Yu., Lipponen, A., Nordling, K., Hyvärinen, O., Ruosteenoja, K., Vihma, T., and Laaksonen, A.: The Arctic has warmed nearly four times faster than the globe since 1979, Commun. Earth Environ., 3, 168, https://doi.org/10.1038/s43247-022-00498-3, 2022.
Rivkina, E., Shcherbakova, V., Laurinavichius, K., Petrovskaya, L., Krivushin, K., Kraev, G., Pecheritsina, S., and Gilichinsky, D.: Biogeochemistry of methane and methanogenic archaea in permafrost, FEMS Microbiol. Ecol., 61, 1–15, https://doi.org/10.1111/j.1574-6941.2007.00315.x, 2007.
Roy Chowdhury, T., Herndon, E. M., Phelps, T. J., Elias, D. A., Gu, B., Liang, L., Wullschleger, S. D., and Graham, D. E.: Stoichiometry and temperature sensitivity of methanogenesis and CO2 production from saturated polygonal tundra in Barrow, Alaska, Glob. Change Biol., 21, 722–737, https://doi.org/10.1111/gcb.12762, 2015.
Schädel, C., Bader, M. K.-F., Schuur, E. A. G., Biasi, C., Bracho, R., Čapek, P., De Baets, S., Diáková, K., Ernakovich, J., Estop-Aragones, C., Graham, D. E., Hartley, I. P., Iversen, C. M., Kane, E., Knoblauch, C., Lupascu, M., Martikainen, P. J., Natali, S. M., Norby, R. J., O'Donnell, J. A., Chowdhury, T. R., Šantrůčková, H., Shaver, G., Sloan, V. L., Treat, C. C., Turetsky, M. R., Waldrop, M. P., and Wickland, K. P.: Potential carbon emissions dominated by carbon dioxide from thawed permafrost soils, Nat. Clim. Change, 6, 950–953, https://doi.org/10.1038/nclimate3054, 2016.
Schirrmeister, L., Grigoriev, M. N., Strauss, J., Grosse, G., Overduin, P. P., Kholodov, A., Guenther, F., and Hubberten, H.-W.: Sediment characteristics of a thermokarst lagoon in the northeastern Siberian Arctic (Ivashkina Lagoon, Bykovsky Peninsula), Arktos, 4, 1–16, https://doi.org/10.1007/s41063-018-0049-8, 2018.
Schönheit, P., Kristjansson, J. K., and Thauer, R. K.: Kinetic mechanism for the ability of sulfate reducers to out-compete methanogens for acetate, Arch. Microbiol., 132, 285–288, https://doi.org/10.1007/BF00407967, 1982.
Schuur, E. A. G., Abbott, B. W., Commane, R., Ernakovich, J., Euskirchen, E., Hugelius, G., Grosse, G., Jones, M., Koven, C., Leshyk, V., Lawrence, D., Loranty, M. M., Mauritz, M., Olefeldt, D., Natali, S., Rodenhizer, H., Salmon, V., Schädel, C., Strauss, J., Treat, C., and Turetsky, M.: Permafrost and Climate Change: Carbon Cycle Feedbacks From the Warming Arctic, Annu. Rev. Env. Resour., 47, 343–371, https://doi.org/10.1146/annurev-environ-012220-011847, 2022.
Solomon, S., Mudie, P. J., Cranston, R., Hamilton, T., Thibaudeau, S. A., and Collins, E. S.: Characterisation of marine and lacustrine sediments in a drowned thermokarst embayment, Richards Island, Beaufort Sea, Canada, Int. J. Earth Sci., 89, 503–521, https://doi.org/10.1007/s005310000126, 2000.
Solomon, S. M.: Spatial and temporal variability of shoreline change in the Beaufort-Mackenzie region, northwest territories, Canada, Geo-Mar. Lett., 25, 127–137, https://doi.org/10.1007/s00367-004-0194-x, 2005.
Strauss, J., Laboor, S., Schirrmeister, L., Fedorov, A. N., Fortier, D., Froese, D., Fuchs, M., Günther, F., Grigoriev, M., Harden, J., Hugelius, G., Jongejans, L. L., Kanevskiy, M., Kholodov, A., Kunitsky, V., Kraev, G., Lozhkin, A., Rivkina, E., Shur, Y., Siegert, C., Spektor, V., Streletskaya, I., Ulrich, M., Vartanyan, S., Veremeeva, A., Anthony, K. W., Wetterich, S., Zimov, N., and Grosse, G.: Circum-Arctic Map of the Yedoma Permafrost Domain, Front. Earth Sci., 9, 758360, https://doi.org/10.3389/feart.2021.758360, 2021.
Strauss, J., Fuchs, M., Hugelius, G., Miesner, F., Nitze, I., Opfergelt, S., Schuur, E., Treat, C., Turetsky, M., Yang, Y., and Grosse, G.: Organic matter storage and vulnerability in the permafrost domain, in: Encyclopedia of Quaternary Science: Reference Module in Earth Systems and Environmental Sciences, edited by: Scott, E., Elsevier, 399–410, https://doi.org/10.1016/B978-0-323-99931-1.00164-1, 2025.
Tanski, G., Wagner, D., Knoblauch, C., Fritz, M., Sachs, T., and Lantuit, H.: Rapid CO2 Release From Eroding Permafrost in Seawater, Geophys. Res. Lett., 46, 11244–11252, https://doi.org/10.1029/2019GL084303, 2019.
Tweedie, C. E., Aguirre, A., Cody, R., Vargas, S., and Brown, J.: Spatial and Temporal Dynamics of Erosion Along the Elson Lagoon Coastline near Barrow, Alaska (2002–2011), in: Proceedings of the 10th International Conference on Permafrost, Volume 1, 425–430, https://www.researchgate.net/publication/262450831_Spatial_and_Temporal_Dynamics_of_Erosion_Along_the_Elson_Lagoon_Coastline_near_Barrow_Alaska_2002-2011 (last access: 9 April 2025), 2012.
Vonk, J. E., Tank, S. E., Bowden, W. B., Laurion, I., Vincent, W. F., Alekseychik, P., Amyot, M., Billet, M. F., Canário, J., Cory, R. M., Deshpande, B. N., Helbig, M., Jammet, M., Karlsson, J., Larouche, J., MacMillan, G., Rautio, M., Walter Anthony, K. M., and Wickland, K. P.: Reviews and syntheses: Effects of permafrost thaw on Arctic aquatic ecosystems, Biogeosciences, 12, 7129–7167, https://doi.org/10.5194/bg-12-7129-2015, 2015.
Vu, V. Q. and Friendly, M.: ggbiplot: A Grammar of Graphics Implementation of Biplots, https://doi.org/10.32614/CRAN.package.ggbiplot, 2023.
Walter Anthony, K. M., Zimov, S. A., Grosse, G., Jones, M. C., Anthony, P. M., III, F. S. C., Finlay, J. C., Mack, M. C., Davydov, S., Frenzel, P., and Frolking, S.: A shift of thermokarst lakes from carbon sources to sinks during the Holocene epoch, Nature, 511, 452–456, https://doi.org/10.1038/nature13560, 2014.
Watson, C. S., White, N. J., Church, J. A., King, M. A., Burgette, R. J., and Legresy, B.: Unabated global mean sea-level rise over the satellite altimeter era, Nat. Clim. Change, 5, 565–568, https://doi.org/10.1038/nclimate2635, 2015.
Wen, X., Yang, S., Horn, F., Winkel, M., Wagner, D., and Liebner, S.: Global Biogeographic Analysis of Methanogenic Archaea Identifies Community-Shaping Environmental Factors of Natural Environments, Front. Microbiol., 8, https://doi.org/10.3389/fmicb.2017.01339, 2017.
Whalen, D., Forbes, D. L., Kostylev, V., Lim, M., Fraser, P., Nedimović, M. R., and Stuckey, S.: Mechanisms, volumetric assessment, and prognosis for rapid coastal erosion of Tuktoyaktuk Island, an important natural barrier for the harbour and community, Can. J. Earth Sci., 59, 945–960, https://doi.org/10.1139/cjes-2021-0101, 2022.
Yang, S., Anthony, S. E., Jenrich, M., in 't Zandt, M. H., Strauss, J., Overduin, P. P., Grosse, G., Angelopoulos, M., Biskaborn, B. K., Grigoriev, M. N., Wagner, D., Knoblauch, C., Jaeschke, A., Rethemeyer, J., Kallmeyer, J., and Liebner, S.: Microbial methane cycling in sediments of Arctic thermokarst lagoons, Glob. Change Biol., 29, 2714–2731, https://doi.org/10.1111/gcb.16649, 2023.