the Creative Commons Attribution 4.0 License.
the Creative Commons Attribution 4.0 License.
 | 30 Apr 2025
CO2 flux characteristics of the open savanna and its response to environmental factors in the dry–hot valley of Jinsha River, China
Chaolei Yang
Jingqi Cui
Guangxiong He
Jingyuan Li
Canfeng Li
Haichuang Duan
Zong Wei
Liu Yan
Xin Xia
Yong Huang
Aihua Jiang
Yuwen Feng
The dry–hot valley ecosystem of Jinsha River (JS) is a non-zonal special heat island habitat within the global temperate region. Revealing the CO2 flux (Fc) changes and the response mechanisms of this ecosystem to environmental factors is crucial for accurately predicting the carbon (C) sequestration capacity of global terrestrial ecosystems, especially temperate ecosystems, under future extreme-drought climate conditions. We focused on the open savanna, which is a core component of the JS dry–hot valley plant community, as our research subject. Using the static chamber method, we conducted long-term fixed-point observations of Fc in the dominant grassy layer, explored the influence of different environmental factors on Fc, and analyzed the trends of Fc changes in the open savanna under future extreme-drought and low-rainfall climate scenarios. Fc of the open savanna exhibits distinct seasonal characteristics. During the dry season, it is in a C emission state, with a cumulative CO2 emission of 1.3215 t ha−1. In contrast, during the rainy season, it shows significant C absorption characteristics, with a cumulative CO2 absorption of 0.6137 t ha−1. The occurrence of extreme-drought events in the study area has weakened the C absorption capacity of the open savanna, making it a weak C source with an annual cumulative CO2 emission of 0.7078 , indicating a C-neutral feature. The main environmental factors affecting the net ecosystem exchange (NEE) variations in the open savanna across different seasons were different, but overall, soil water content was the key environmental factor controlling NEE. The response mechanisms of NEE to changes in different environmental factors were generally similar, with NEE being at its minimum when located at the threshold of environmental factors. When environmental conditions exceed or fall below this threshold, the C emissions of the open savanna will increase. As the frequency and severity of future extreme droughts continue to rise, the C emissions from the open savanna in the study area will also continue to increase.
- Article
(5836 KB) - Full-text XML
- BibTeX
- EndNote


Since the industrial revolution, human economic and social progress heavily relied on fossil energy consumption. The excessive emissions of greenhouse gases such as CO2 have been considered to be the main cause of increased atmospheric CO2 concentration and global warming (Sha et al., 2022; Wang et al., 2023). The terrestrial ecosystem can absorb about 15.0 %–30.0 % of anthropogenic CO2 emissions per year, and the C neutrality capacity index reaches 27.14 % (Green et al., 2019; Bai et al., 2023; Liu et al., 2023; Zeng et al., 2023). This makes it a significant C sink (Piao et al., 2018). With the intensification of global climate change, predicting the future C sequestration potential of terrestrial ecosystems will be of significant importance for formulating climate change adaptation strategies. However, due to the potential changes in precipitation patterns and rising temperatures caused by global climate change, the frequency and intensity of extreme climate events, especially high-temperature and drought events, are expected to continue to increase over the next few decades (IPCC, 2021). This will have profound impacts on the C source/sink structure of terrestrial ecosystems, particularly on the C cycle processes and their response mechanisms, making them more complex (Huang and Zhai, 2024). This significantly hinders researchers' further in-depth understanding and accurate prediction of the C budget characteristics of terrestrial ecosystems under future climate change.
The global distribution of the savanna ecosystem is primarily determined by climate, fire, and anthropogenic disturbance (Williamson et al., 2024), covering approximately one-sixth of the Earth's land area (Grace et al., 2006). This ecosystem's structure and vegetation community composition are significantly influenced by hydrological conditions and are mainly composed of grass, with sparse distribution of trees and shrubs (Yu and D'Odorico, 2015; Lee et al., 2018; Jin et al., 2019; Zhang et al., 2019b; Hoffmann, 2023; He et al., 2024). Being a significant component of the world's vegetation, the savanna's primary productivity accounts for about 30.0 % of the primary production of all terrestrial vegetation, which has significant impacts on global material cycling, energy flow, and climate change (Grace et al., 2006; Peel et al., 2007; Dobson et al., 2022). Due to the specific hydrothermal conditions, Fc of the savanna ecosystem has significantly different characteristics in the dry season and the rainy season, with C absorption predominantly occurring during the rainy season, while the dry season is marked by a weak C source or sink feature (Grace et al., 2006; Millard et al., 2008; Livesley et al., 2011; Fei et al., 2017a). Additionally, most savanna ecosystems globally demonstrate C sequestration features, with only a few exhibiting characteristics of C emissions, with NEE varying from around −3.87 to 1.28 (Fei et al., 2017b).
The savanna ecosystem in China is mainly manifested as the ecological landscape of the valley-type sparsely shrub-grass vegetation distributed in the special geographical unit of the dry–hot valley. The ecosystem is characterized by a scarcity of woody plants, with the dominant herbaceous layer, i.e., the open savanna, being the core component of the plant community (Jin et al., 1987; Shen et al., 2010). It is also known as valley-type savanna vegetation and mainly concentrated in the Yuanjiang (YJ), Nu River, and Jinsha River (JS), as well as their tributaries in southwest China. The valley-type savanna ecosystem in China differs from other tropical savanna ecosystems. Located in the temperate zone within the global climatic zones, it represents a non-zonal special hot island habitat that has evolved from the global temperate humid climate zone (Zhang, 1992). The ecosystem has a relatively high average annual temperature and a significant potential evapotranspiration, which far exceeds the rainfall, making the issue of ecological drought particularly prominent. It is an ideal natural site for studying the C-cycling process of terrestrial ecosystems under conditions of dry and high-temperature climates. Under the backdrop of intensifying global climate change, effectively revealing the C source/sink pattern and its influencing factors of the valley-type savanna ecosystem is of great scientific significance for profoundly understanding the impact of future extreme climate environments on the C sequestration function of terrestrial ecosystems, particularly those in temperate zones.
However, at present, there is a scarcity of research on the C source and sink characteristics of the Chinese valley-type savanna ecosystem (Fei et al., 2017a, Yang et al., 2020). In particular, the open savanna, as the core component of the plant community in this ecosystem (Jin et al., 1987; Shen et al., 2010), can significantly impact the entire ecosystem and the surrounding areas' C balance even with minor dynamic changes. Nevertheless, there is still a research gap in studying Fc changes and related influencing mechanisms, with the open savanna serving as the observation object. We selected the dry–hot valley of JS, the largest valley in China by area, as the study area and took the open grasslands within it as the research object, using the static chamber method to observe Fc of the dominant herbaceous layer. The aim is to clarify the dynamic characteristics of open savanna Fc and its correlation with environmental factors, quantitatively assess the annual Fc, and attempt to address the trends of Fc changes under future drought and low-precipitation climate scenarios. We hope to provide scientific references for a deeper understanding of the key processes of C cycling in terrestrial ecosystems under arid and high-temperature climate conditions and for accurately predicting the C sequestration capacity of terrestrial ecosystems under extreme climate conditions.
2.1 Observation sites
All observational data were derived from the Jinsha River field observation station (26°4′6.24′′ N, 101°49′41.68′′ E), whose test site is situated in the Shikanzi Daqing region on the west bank of JS (Fig. 1), with a representative savanna ecological landscape. The elevation of the basin is 1200–1800 m, falling within the realm of the southern subtropical dry–hot monsoon climate, with the characteristics of drought, high temperature, and less rain. The annual average temperature is 22.93 °C, with daily maximum temperatures reaching over 43.00 °C. The region has distinct rainy season (June–October) and dry season (November–May of the subsequent year), and the annual precipitation is 428.50 mm, with over 90.0 % of the precipitation concentrated in the rainy season. The annual evaporation rate is high, typically 3–6 times the annual precipitation (He et al., 2000). The vegetation community is primarily dominated by herbs, with sparse woody plants. Herbaceous plants are mainly Heteropogon contortus (L.) P.Beauv. ex Roem. & Schult., Eulaliopsis binata (Retz.) C.E.Hubb., Cymbopogon goeringii (Steud.) A.Camus, Eulalia speciosa (Debeaux) Kuntze, and so on. The shrubs include Phyllanthus emblica L., Pistacia weinmanniifolia J.Poiss. ex Franch., Quercus franchetii Skan, Quercus cocciferoides Hand.-Mazz., and Dodonaea viscosa Jacq., among others.
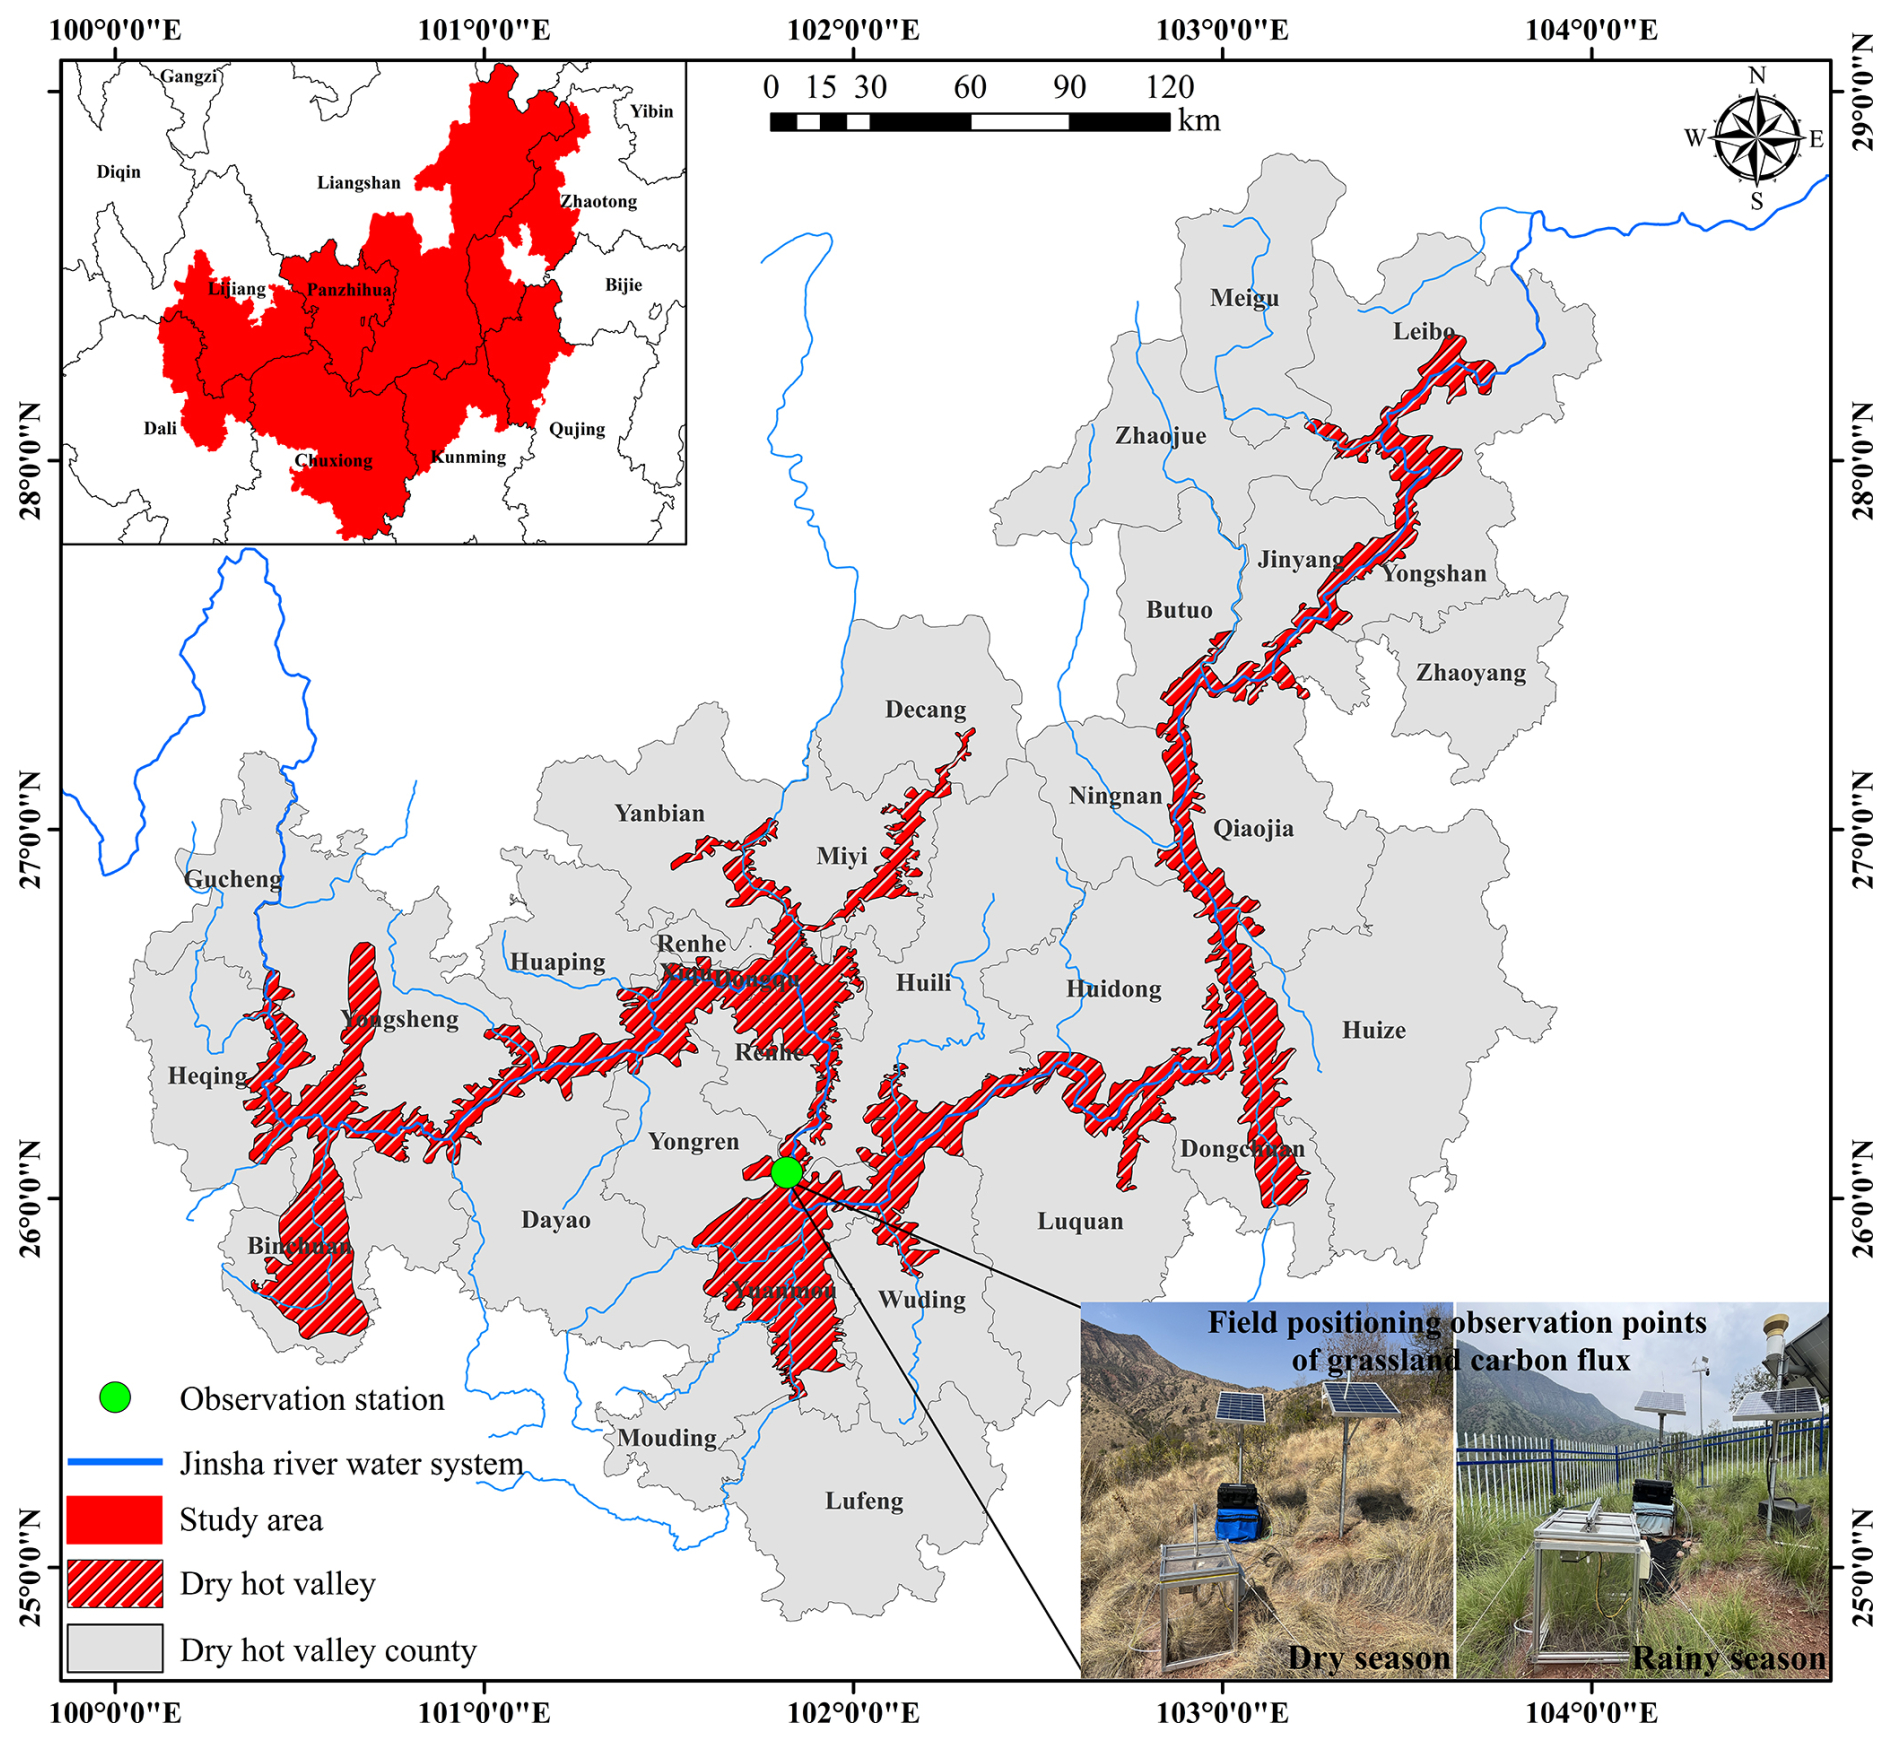
Figure 1Range of the dry–hot valley in JS and location of the Jinsha River field observation station.
2.2 Data source
2.2.1 Micrometeorological factor observation
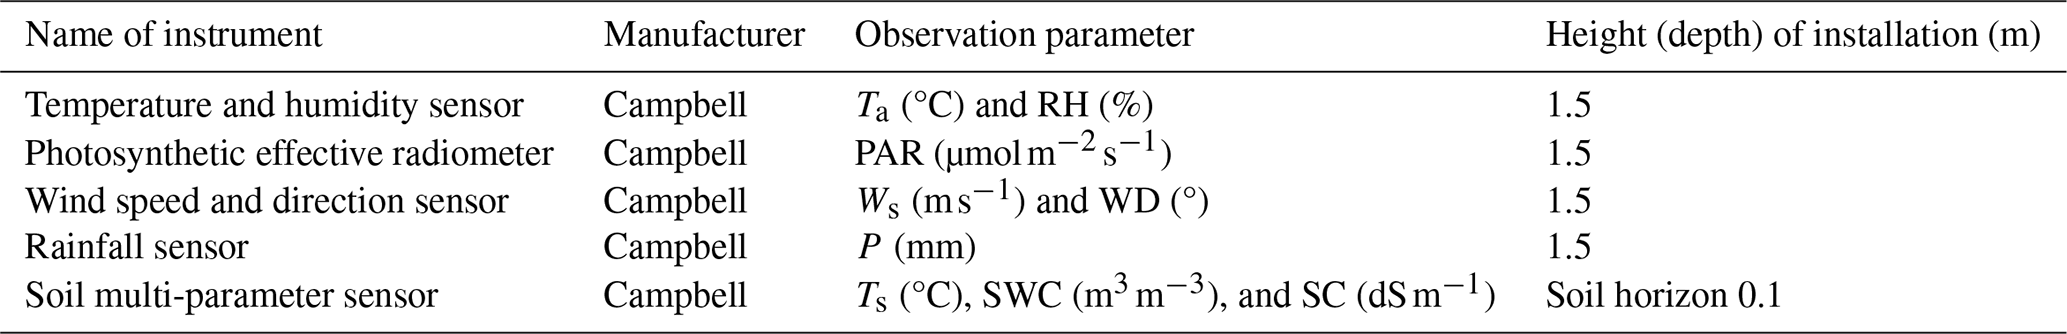
The micrometeorological factors were continuously monitored in real time by the DL3000 small automatic meteorological observation system deployed in the test site of the observation station. The observation time began on 12 January 2023, and the observation indexes included air temperature (Ta), relative humidity (RH), soil temperature (Ts), soil water content (SWC), soil conductivity (SC), precipitation (P), wind speed (Ws), wind direction (WD), and photosynthetically active radiation (PAR). The average values of the environmental factor observation data for 5 min, 30 min, and 24 h are automatically recorded through the CR1000X data logger. The specific meteorological observation system sensor equipment information is listed in Table 1.
Table 1Information of the micrometeorological observation system.
2.2.2 CO2 flux observation
In order to ensure the representativeness of the observation plots and the spatial integration of the observation data, the typical grassy layer plots with small micro-habitat differences were selected in the test site of the observation station to lay out and install static assimilative boxes for positioning observation. The observation point is about 10 m away from the automatic meteorological observation system. The observation time began at 15:05 CST (China standard time, UTC+8) on 3 March 2023 and ended at 10:50 CST on 1 November 2023. The bottom area of the assimilative box is 0.25 m2, and the volume in the box is 125 L. The whole box is composed of transparent organic glass. There are two sets of fans in the box, which can fully mix the gas evenly. The height of the base is 8 cm, the part embedded in the underground soil is 5 cm, and the aboveground part is 3 cm. NEE was mainly measured by the CARBOCAP® C dioxide sensor GMP343 of the Vaisala company. The diffusion probe of the sensor can effectively reduce the measurement error caused by the pressure difference of the pumping system. It has the characteristics of flexibility and high precision and is widely used in ecosystem CO2 monitoring (Harmon et al., 2015). The top cover of the assimilative box can be automatically opened and closed, and the time of a single complete measurement cycle is 15 min. Before the measurement, the top cover of the assimilative box will be automatically opened so that the gas in the box and the surrounding air are mixed evenly, and the time is 5 min. Then the top cover of the box is automatically closed to a closed and stable state, the fan starts, and the gas change in the box is measured. The measurement and recording time is 10 min and is repeated.
2.2.3 Other data
The boundary data of the dry–hot valley were sourced from Deng (2022). The administrative boundary data (Xu, 2023a, b) and river data (Xu, 2018) were sourced from the Resources and Environment Science Data Center (RESDC) of the Chinese Academy of Sciences.
2.2.4 Data processing
When Fc is measured, the whole monitoring system will collect the original data of GMP343 at a speed of 2 Hz through the CR1000X data logger and average the data collected within 5 s for statistical analysis (main scan interval). If the difference between the newly acquired data and the average value exceeds 8 times the standard deviation, it is classified as an outlier, and such data points are eliminated. The system performs linear regression fitting on the removed data and calculates the ecosystem CO2 exchange capacity, goodness of fit, etc.
The ecosystem CO2 exchange capacity is calculated by Eq. (1):
where Fc represents the CO2 flux (), V represents the volume of the assimilative chamber (m3), Pav represents the mean atmospheric pressure (kPa) inside the chamber during the observation period, Wav represents the partial pressure of water vapor inside the chamber during the observation period (mmol mol−1), R represents the atmospheric constant (8.314 ), S represents the area of the assimilative chamber (m2), represents the diffusion rate of CO2 in the chamber, and Tav represents the mean temperature (°C) inside the chamber during the observation period.
The linear regression method was employed to fit the CO2 diffusion rate () (Eq. 2). This method is the basic method for measuring the CO2 diffusion rate of most soil respiration and is widely used (Wen et al., 2007):
where c(t) represents the CO2 concentration within the assimilative chamber, t represents the determination time, and c represents the CO2 concentration in the assimilative chamber when it is closed.
Taking into account the specific conditions of the study area, the recorded Fc data were categorized into dry season (3 March–31 May) and rainy season (1 June–1 November). Due to the damage of the assimilative box from 1 June–6 August and the lack of observation data, considering the continuity of the data time series and the precision of the data, the dry season Fc data are mainly based on the observation data from 4 March–31 May, and the rainy season Fc data are mainly based on the observation data from 7 August–31 October. Quality control was conducted on the raw data to remove invalid data values and abnormal data (the abnormal data mainly consisted of negative values during the dry season and negative values at night during the rainy season). Utilizing the research results from Zhao et al. (2020), missing data points with a time difference of under 3 h are filled in using linear interpolation. For data with a missing duration of more than 3 h, interpolation is mainly performed by distinguishing between daytime and nighttime periods. Among them, the data of daytime in the rainy season were interpolated by the Eq. (3) rectangular hyperbolic model (Ruimy et al., 1995) to simulate the relationship between NEE and PAR. The missing data of the rainy season at nighttime and in the dry season were interpolated by the multiplicative model (Eq. 4) of the response of ecosystem respiration to Ts and SWC:
where NEEdaytime represents NEE during the daytime (), Amax represents the maximum photosynthetic rate (), α represents the apparent quantum efficiency (µmol mol−1), Rdaytime represents the daytime ecosystem respiration rate (), and PARdaytime represents PAR during the daytime ().
where ER represents the ecosystem respiration rate (); α, β, and c represent the fitting parameters; and Ts and SWC are shown in Table 1.
The vapor pressure deficit (VPD) is calculated by Eq. (5) (Campbell and Norman, 2012):
where RH and Ta are shown in Table 1.
3.1 Dynamic changes in environmental factors
Utilizing the observational data of micrometeorological factors, we analyzed the dynamic attributes of environmental factors such as Ta, VPD, RH, P, Ws, PAR, Ts, and SWC. It can be seen that these environmental factors showed a high degree of seasonal characteristics, and in particular P and SWC were the most obvious. Among them, P in the rainy season was 400.80 mm, mainly concentrated in August (142 mm). The precipitation frequency was 17 times, and SWC changed between 0–0.19 m3 m−3 (Fig. 2a and b). The minimum RH was 20.65 % and the maximum was 94.10 %, showing a strong response relationship with P. The VPD fluctuated between 0.11–4.13 kPa, and its value decreased significantly after May, which was related to the increase in P and RH in the rainy season (Fig. 2a and c). During the observation period, PAR varied from 52.28–860.59 , influenced by weather conditions and displaying significant fluctuations (Fig. 2d). From different seasons, the daily average of PAR in the dry season (476.50 ) exceeded that of the rainy season (432.79 ). During the dry season, the mean Ta was 23.04 °C, while in the rainy season, it averaged 25.38 °C. The difference was small. Secondly, the highest and lowest values of Ta appear in May of the dry season. The range of Ta and Ts was 8–34.52 °C and 11.58–36.97 °C, respectively. The seasonal variation characteristics of the two were similar, but Ts was significantly higher than Ta, and the change time lags behind Ta (Fig. 2e). In terms of changes in Ws characteristics, the highest value of Ws appeared in March, reaching 2.93 m s−1, and the lowest value appeared in June, which was 0.57 m s−1. The daily average Ws was the highest in February, which was 1.90 m s−1, and the lowest in August, which was 0.99 m s−1. Ws decreased significantly after mid-July (Fig. 2f). Finally, it is particularly noteworthy that the annual P in the study area has been continuously decreasing in recent years (Fig. 3), especially in 2023, which recorded the lowest annual P since historical data have been recorded. It is a typical extreme-drought event (Wang et al., 2025).
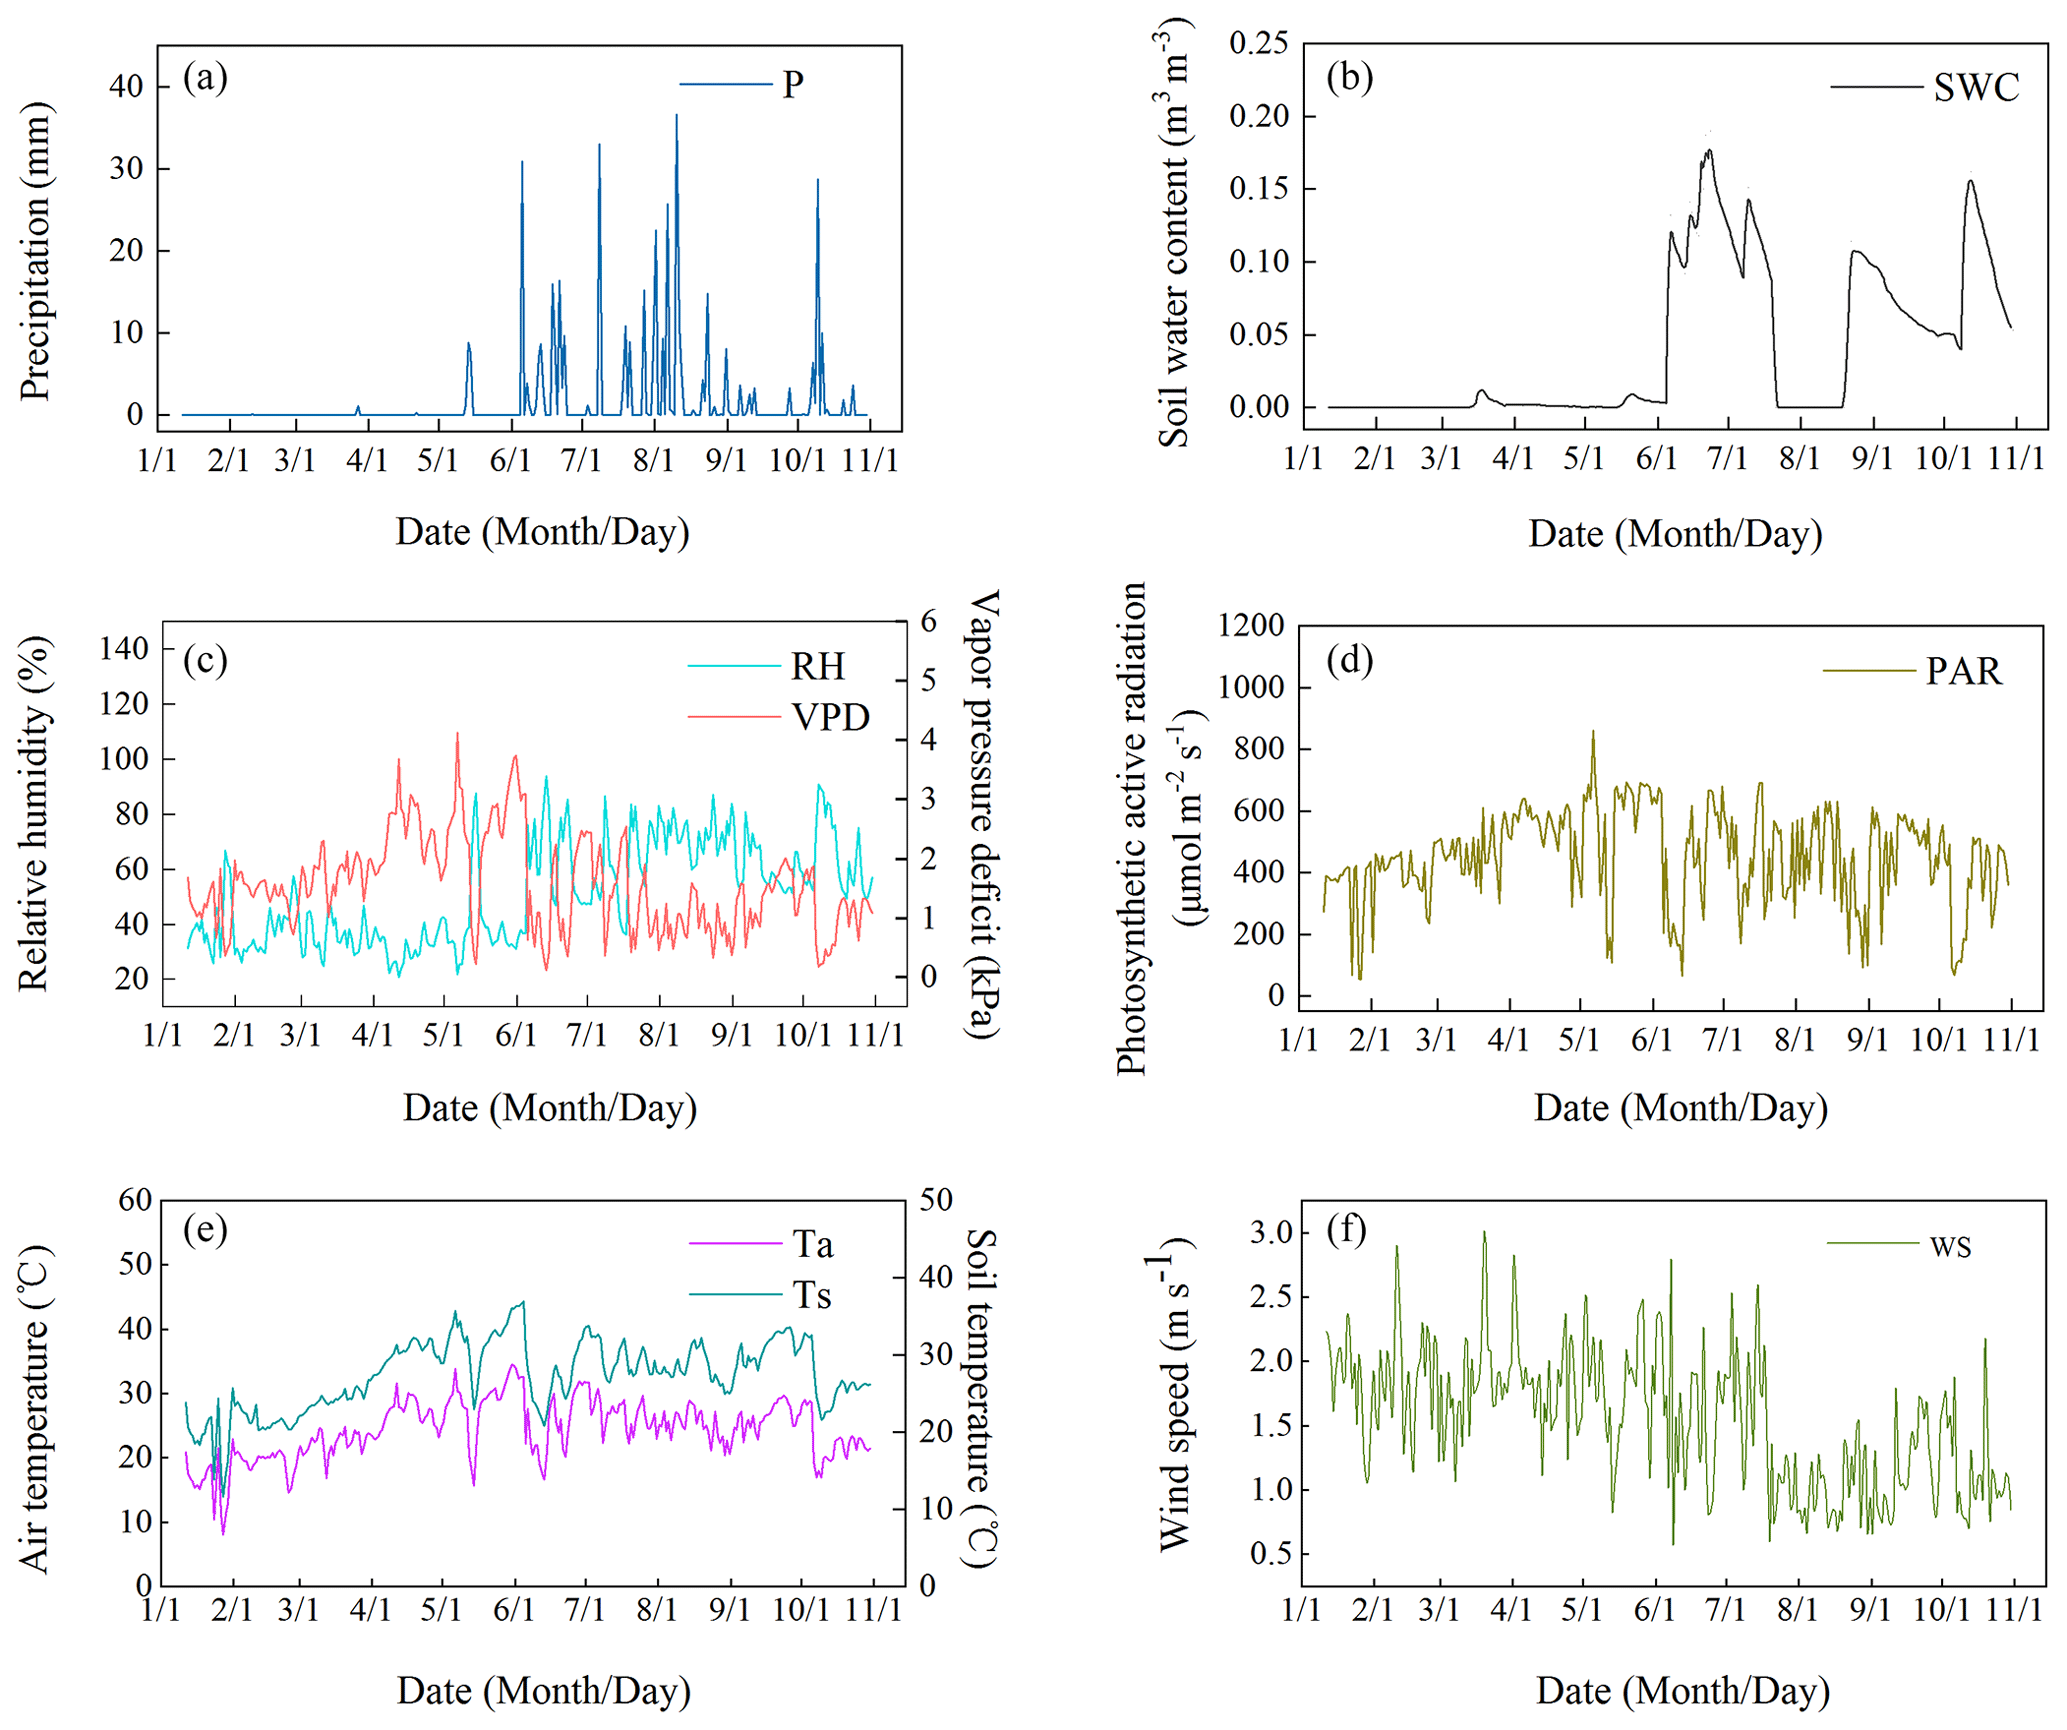
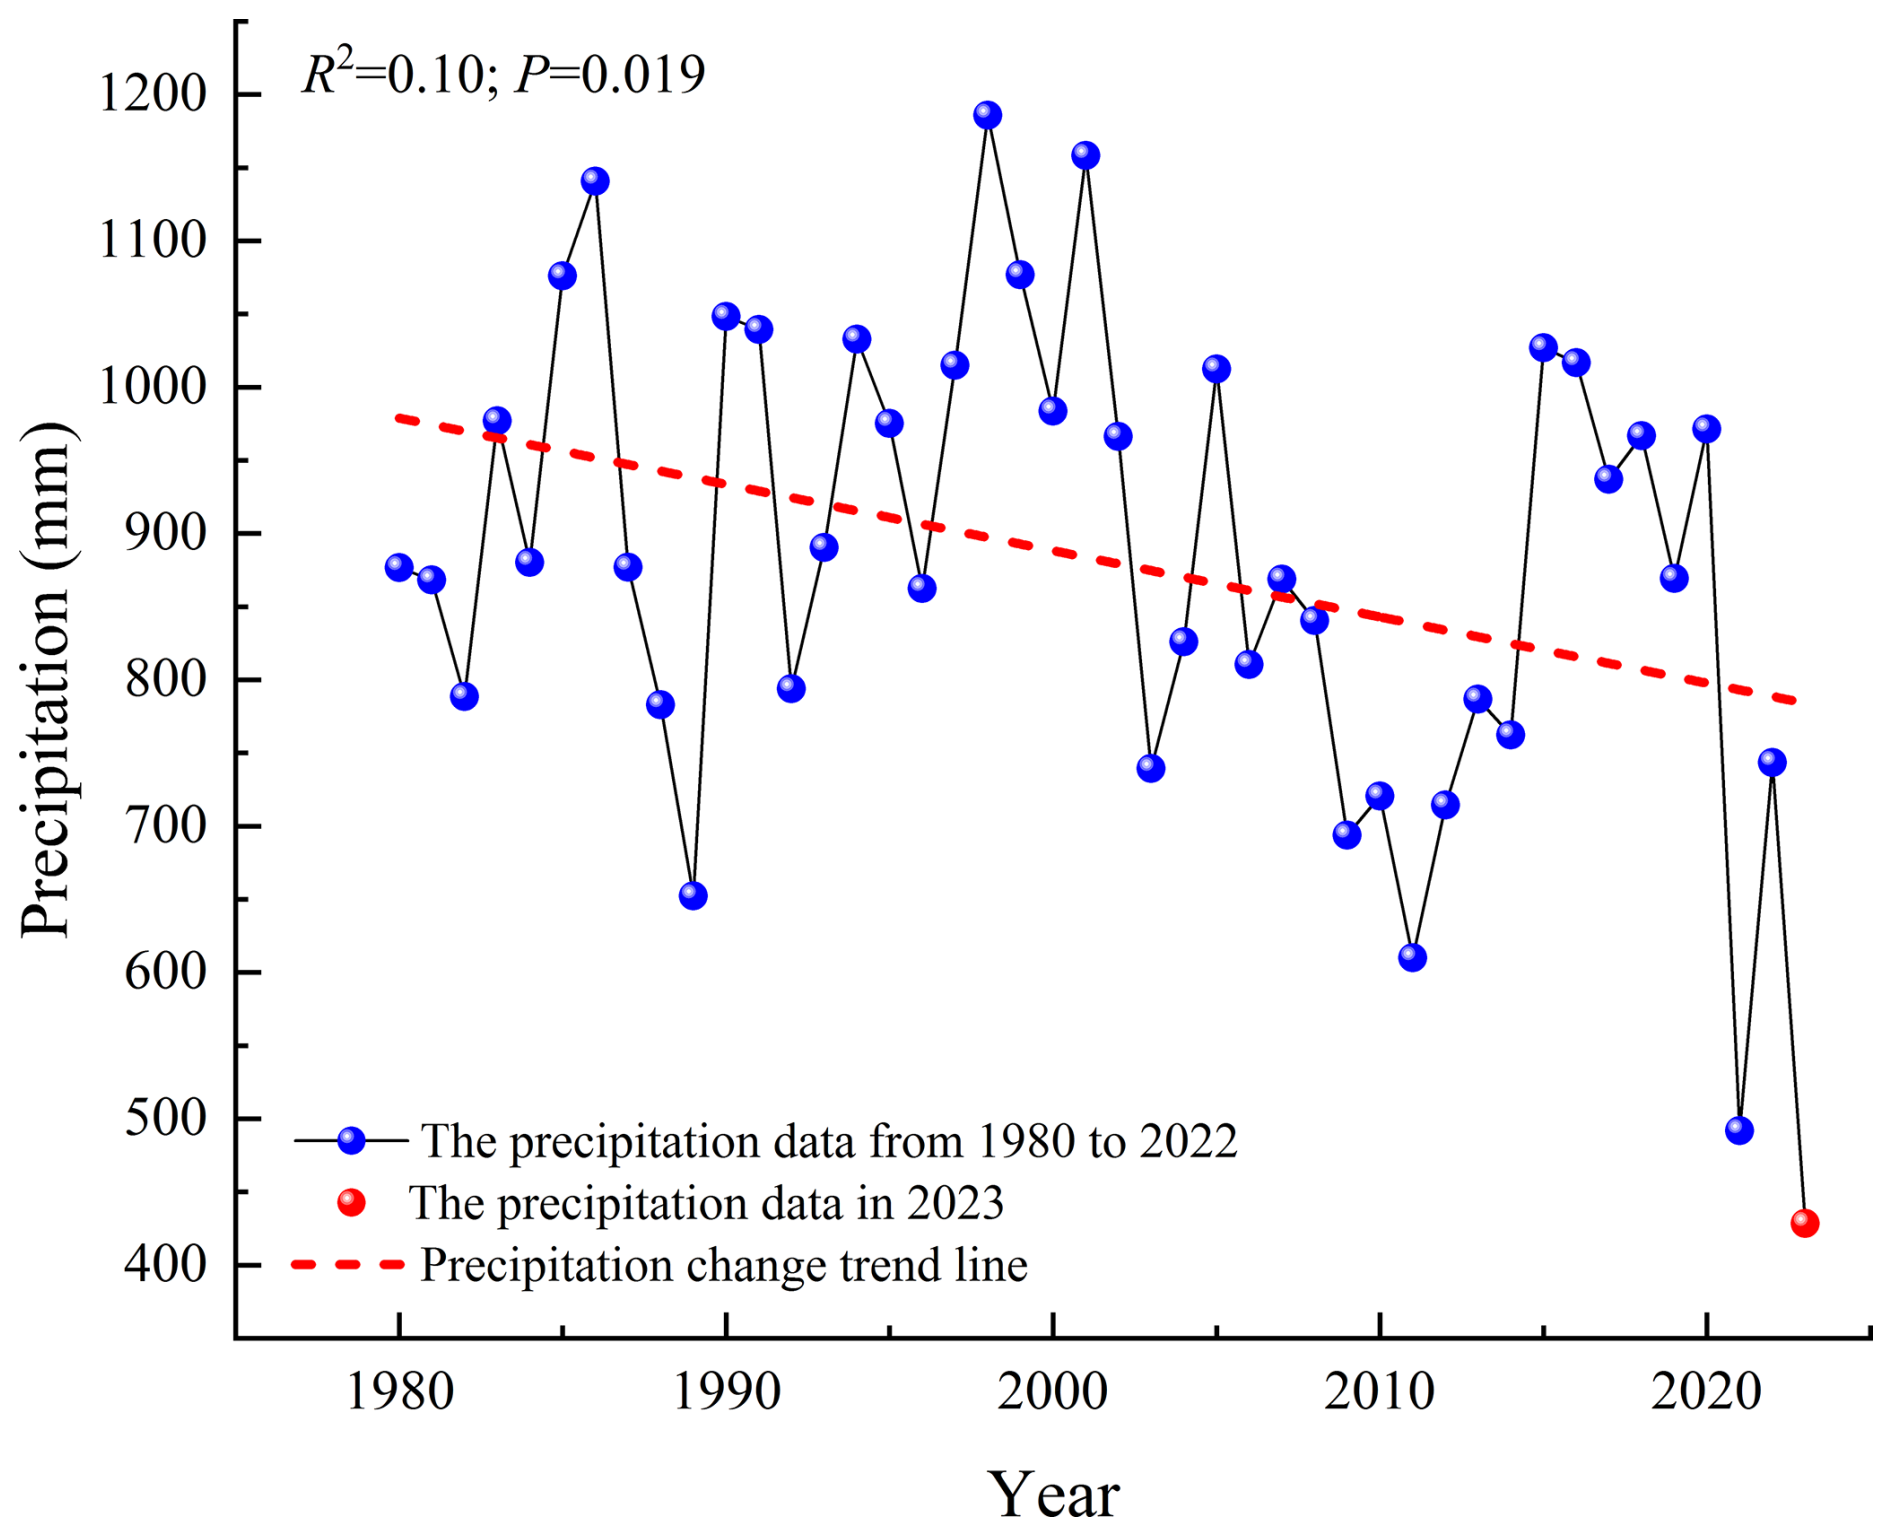
Figure 3The precipitation changes in the study area from 1980–2023 (the precipitation data from 1980–2022 were collected from the Yunnan Statistical Yearbook (Bureau of Statistics of Yunnan Province, 2023), and the precipitation data in 2023 were the measured data of the Jinsha River field observation station).
3.2 Diurnal variation of CO2 flux
Fc was positive, indicating a C emission state, throughout the entire diurnal variation process in the dry season. The diurnal variation showed a W-type bimodal curve (Fig. 4a) of decreasing → increasing → decreasing → increasing; that is, Fc was lower in the morning and afternoon, and Fc was higher in the nighttime and at noon, especially in April and May when this diurnal variation pattern was most pronounced. The lowest Fc values appeared in the morning (08:00–10:00 CST) of each month, which were 0.1178, 0.1148, and 0.1397 , respectively. The highest Fc value appeared in the evening (19:20 CST) in March, which was 0.2158 . In April and May, it appeared in the evening (13:35 CST). They were 0.1148 and 0.1397 , respectively. During the dry season, the herbaceous plants in the study area were in a senescent state, and the open savanna was characterized solely by soil respiration. The study by Carey et al. (2016) found that in all non-desert biomes, soil respiration increases with rising soil temperature; however, beyond a certain threshold, the soil respiration rate decreases with further temperature increases. Therefore, we believe that the diurnal variation of Fc in the open savanna of the JS dry–hot valley during the dry season primarily relates to the diurnal variation of temperature. From night to morning, the temperature gradually decreased, leading to a reduction in soil respiration and a decrease in Fc. It was not until around 10:00 CST that the temperature began to rise, increasing in the intensity of soil respiration and with a continuous rise in Fc, reaching its peak. Subsequently, the soil respiration rate decreased with further temperature increases, and after about 17:00 CST, as the temperature gradually declined, the limitation on soil respiration weakened, and Fc gradually increased again.
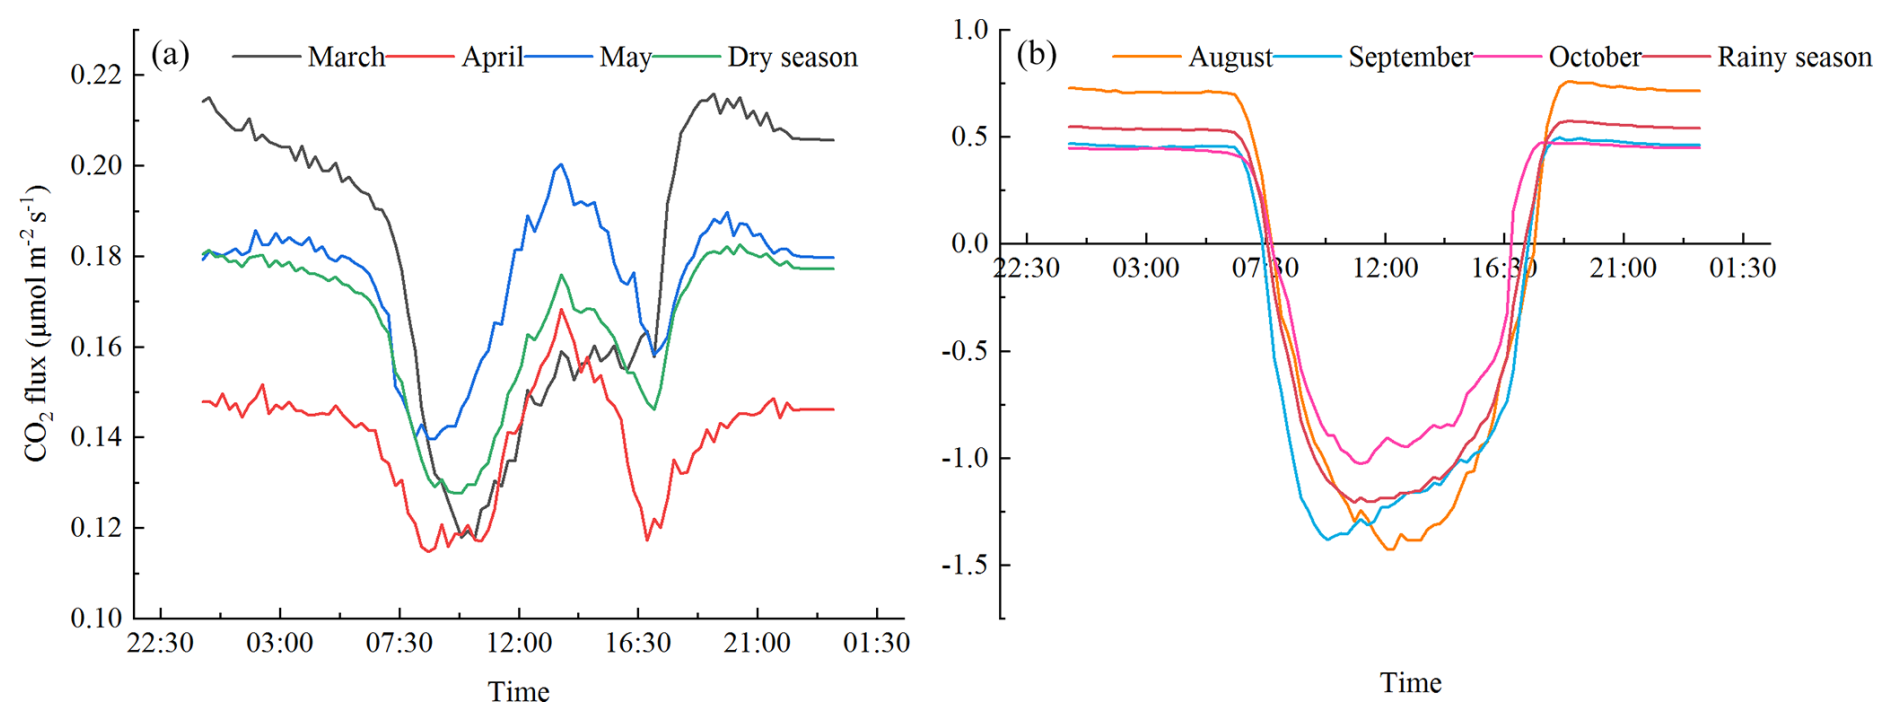
The diurnal variation of Fc was characterized by a U-shaped single-peak curve, which was stable at night and decreased first and then increased during the day (Fig. 4b) during the rainy season. At about 07:35 CST in the morning, with the increase in PAR intensity, the photosynthesis of the herbaceous plants was continuously enhanced, and Fc began to become negative. At this time, the open savanna changes from C emission at night to C absorption, forming the source of CO2 absorption and reaching the maximum peak of C absorption at 10:00–14:00 CST. Until about 17:20 CST, Fc becomes positive again. The open savanna transitions into a state of C emission, releasing CO2 into the atmosphere. During the rainy season, SWC was relatively high, and the increase in SWC had an inhibitory effect on the temperature sensitivity of soil respiration (Xiang et al., 2017). As a result, Fc during the nighttime period remained relatively stable. The lowest Fc values appeared in the morning (10:00–12:00 CST) from the diurnal variation of the flux in various months, which were −1.4286, −1.3834, and , respectively. The highest Fc values appeared in the evening (18:35–18:50 CST), which were 0.7584, 0.4959, and 0.5715 , respectively.
3.3 Seasonal variation of CO2 flux
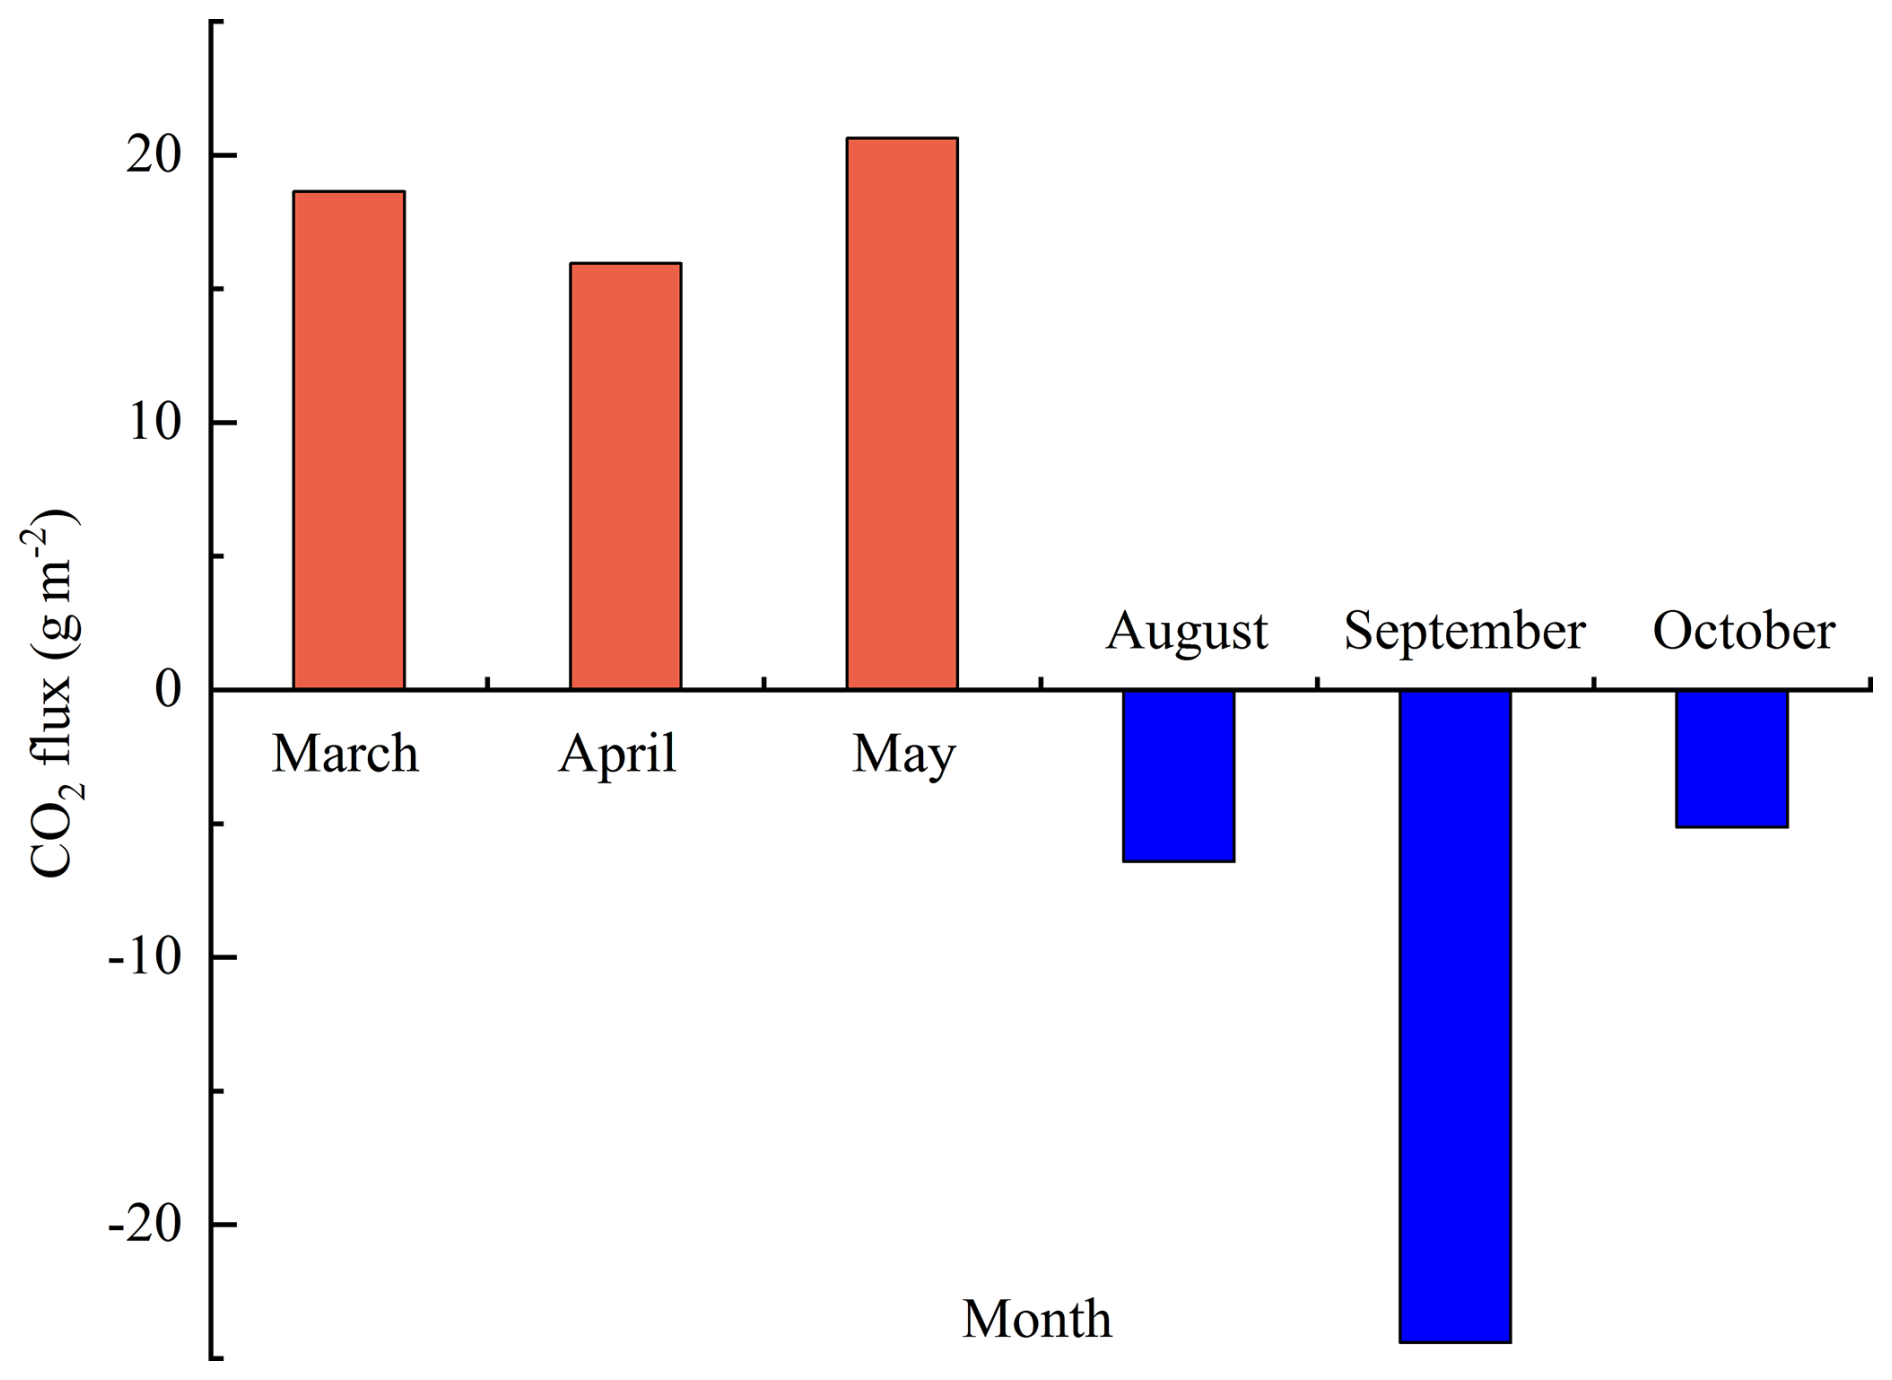
From Fig. 5, we can find that the seasonal variation of Fc was evident. In the dry season, the ecosystem experiences severe drought and water scarcity, leading to poor growth of herbaceous plants, which is characterized by C emissions. The monthly cumulative CO2 emission fluxes were 18.64, 15.96, and 20.64 g m−2, respectively, displaying an initial decline followed by a rise. The CO2 emission flux was the highest in May. The ecosystem has abundant P in the rainy season, SWC is high, the herbaceous plants are in the growing season, and the photosynthesis capacity is significant, so it is characterized by the C sink function. The monthly cumulative CO2 absorption fluxes were 6.42, 24.41, and 5.14 g m−2, respectively, displaying a rise initially followed by a decline, and the C absorption capacity in September was the most significant.
The existing observation data were averaged and calculated, respectively, in this study, and they were used as the daily mean Fc of the two seasons in the whole year. According to the days of the dry season (213 d) and the rainy season (152 d) in the whole year, the dry season, rainy season, and annual Fc of the open savanna were calculated. The findings indicated that the mean daily Fc was 0.1632 in the dry season, and the cumulative CO2 emission was 1.3215 t ha−1. The daily average Fc was in the rainy season, and the cumulative CO2 uptake was 0.6137 t ha−1. From the annual scale, the cumulative Fc of the open savanna was 0.7078 (0.1926 ), making it a weak C source.
3.4 The relationship between CO2 flux and environmental factors
3.4.1 Response of CO2 flux to PAR
This study selected Fc data and micrometeorological observation data to analyze the interrelations between Fc and environmental factors, as well as among different environmental factors (Figs. 6 and 7). The research area belongs to a typical semi-arid region, where vegetation growth and physiological processes are mainly regulated by temperature and moisture factors (Jiang et al., 2007; Fei et al., 2017a). Therefore, when analyzing the influencing factors of ecosystem CO2 flux, we mainly selected environmental factors including P, SWC, Ts, Ta, RH, PAR, and VPD for Pearson analysis and quadratic regression analysis. No significant correlation between PAR and Fc during the dry season was indicated by the results of the Pearson correlation analysis (R2=0.03, P=0.092). Still, there was a strong negative correlation between PAR and Fc during the rainy season (R2=0.33, P<0.01), and this relationship was more obvious in Fig. 6a. As a key environmental factor driving plant photosynthesis, photosynthetically active radiation will directly affect the C absorption rate of the open savanna and further affect the C budget pattern of the ecosystem. In the rainy season, Fc decreased with the increase in PAR, the C absorption capacity increased continuously, and the relationship between them could be expressed by Eq. (3). When PAR was under 500 (Fig. 6b), NEE of the ecosystem decreased rapidly with increasing PAR. At the same time, the distribution of NEE with PAR was relatively concentrated. However, when PAR was above 500 , the magnitude of the decrease in NEE with increasing PAR gradually decreased, and the distribution of NEE with PAR was relatively scattered, indicating that Fc was also influenced by various other environmental factors present in the ecosystem when solar radiation is high. These research findings align with those of previous studies carried out in diverse grassland ecosystems (Zhao et al., 2007; Wang et al., 2015; Guo et al., 2022).
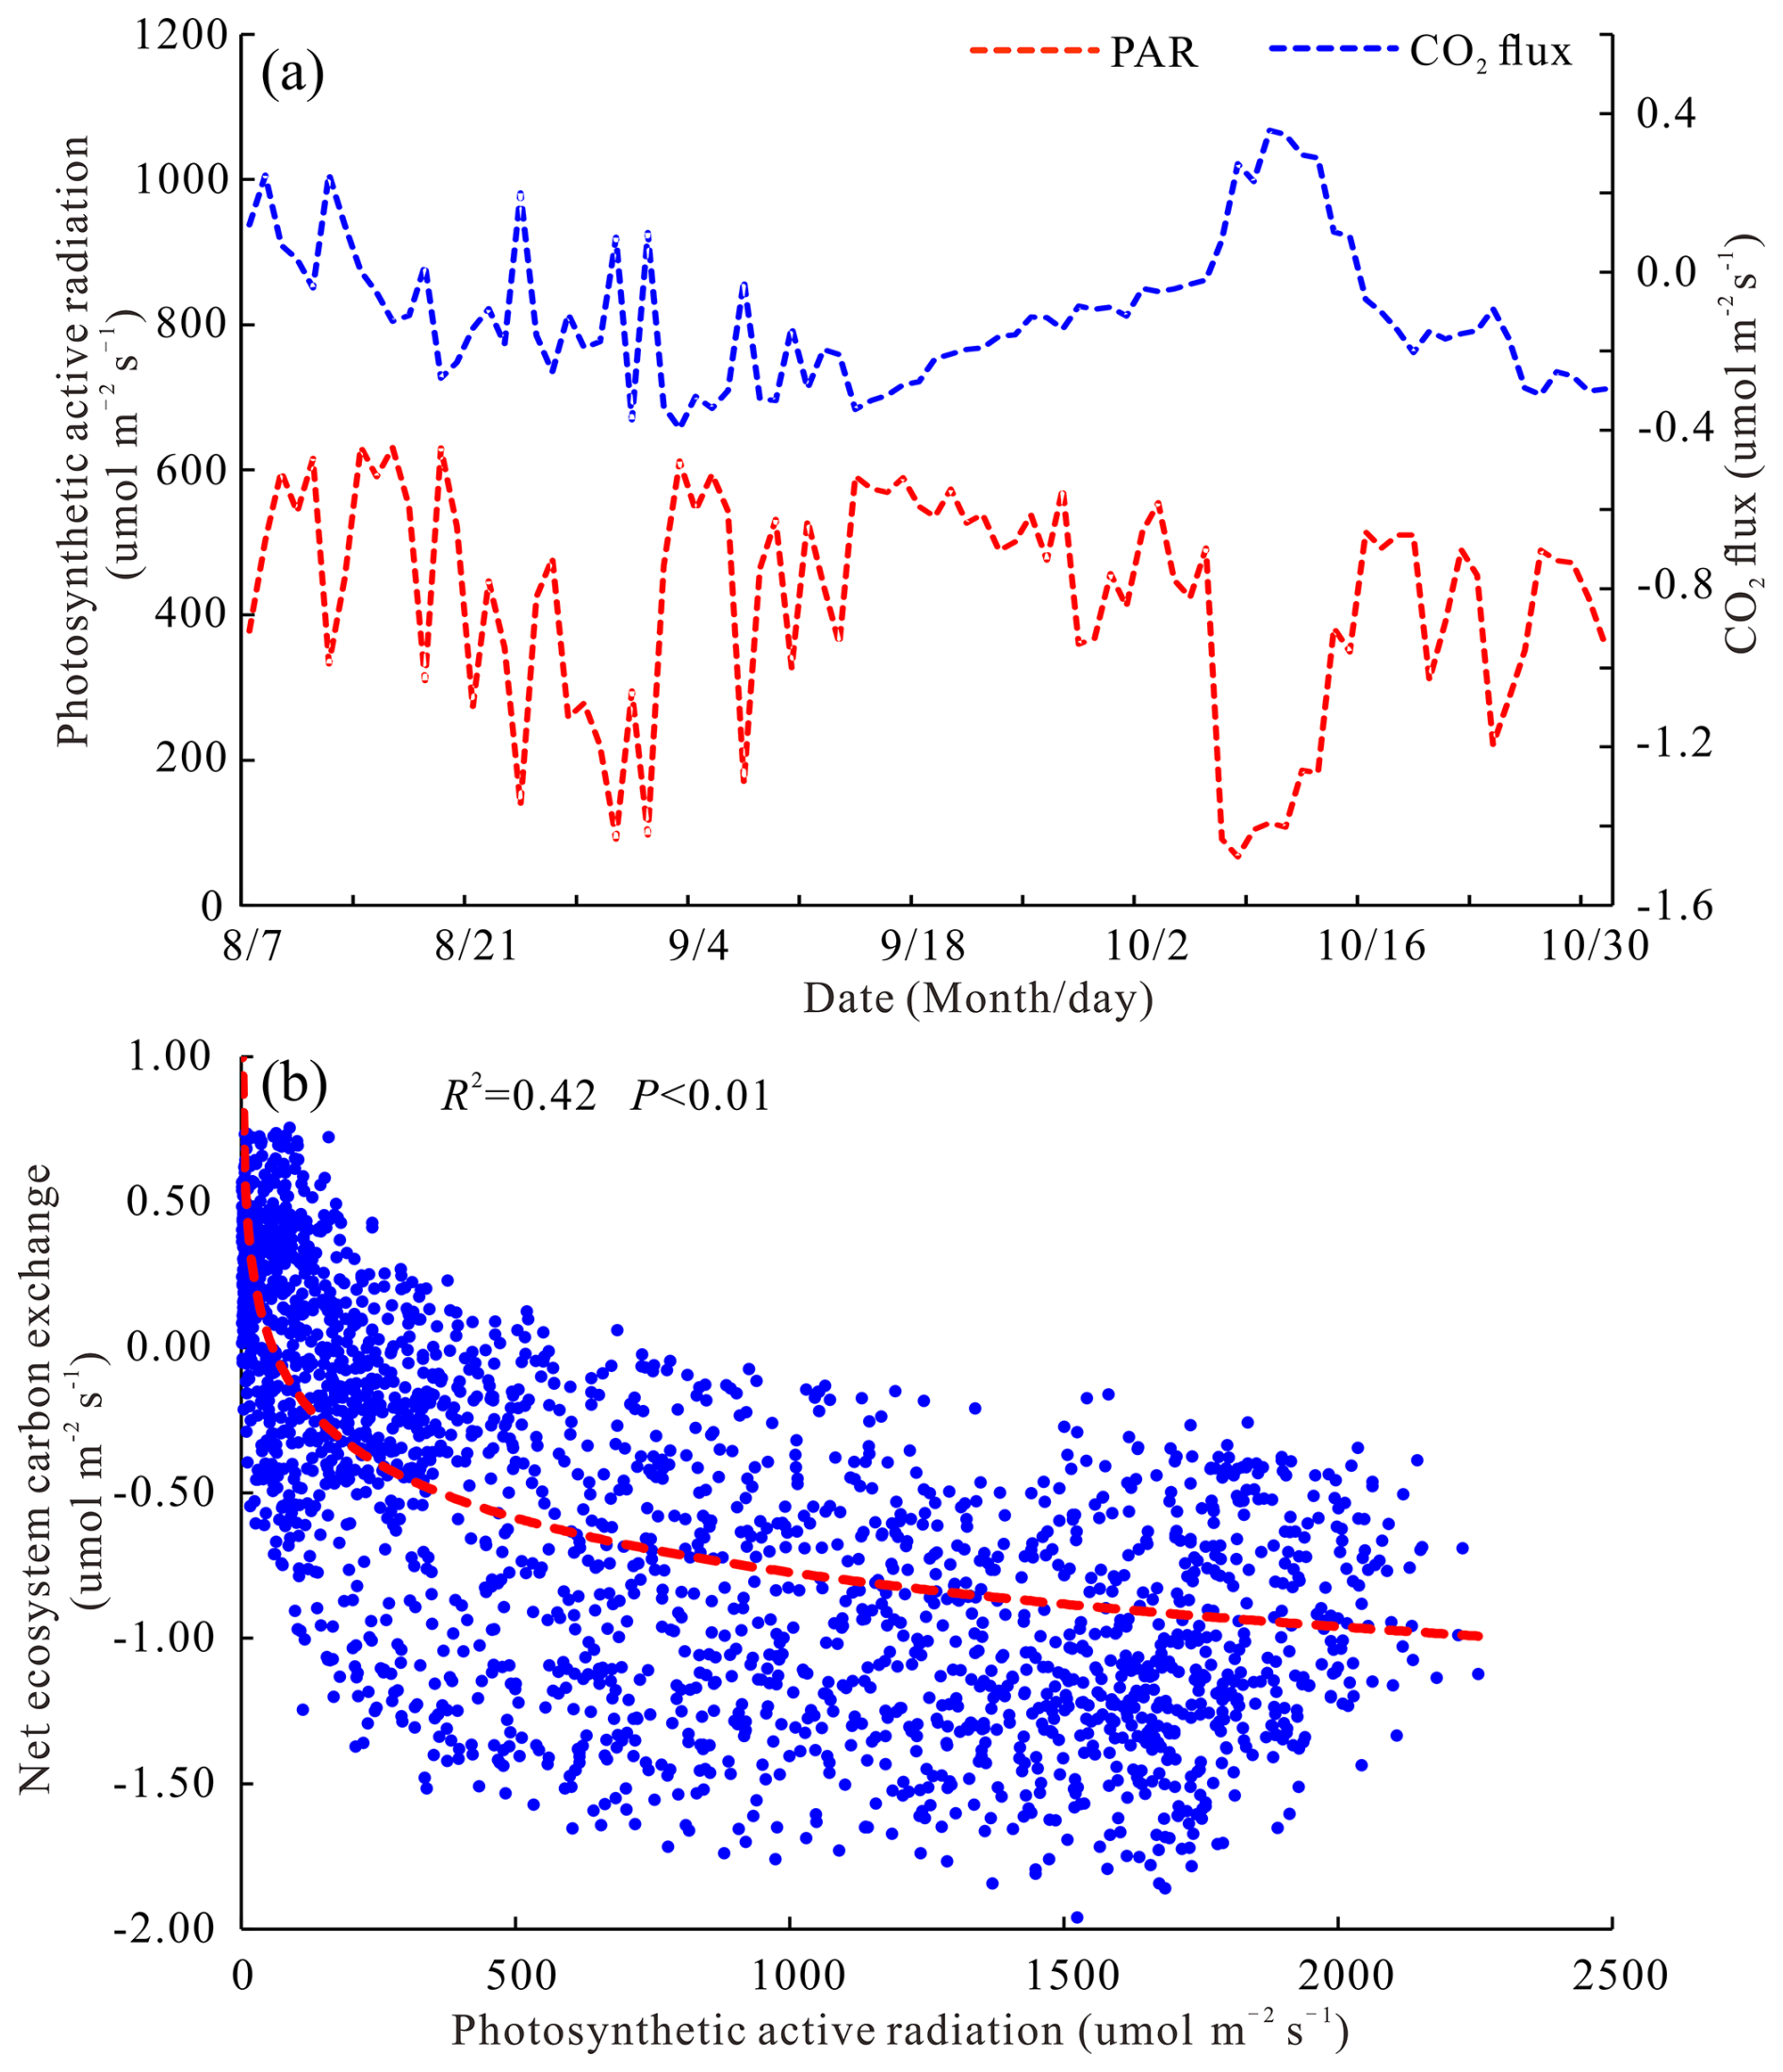
Figure 6The correlation between PAR and Fc (a – the relationship between PAR and Fc in the rainy season; b – the response of Fc to PAR during daytime in the rainy season).
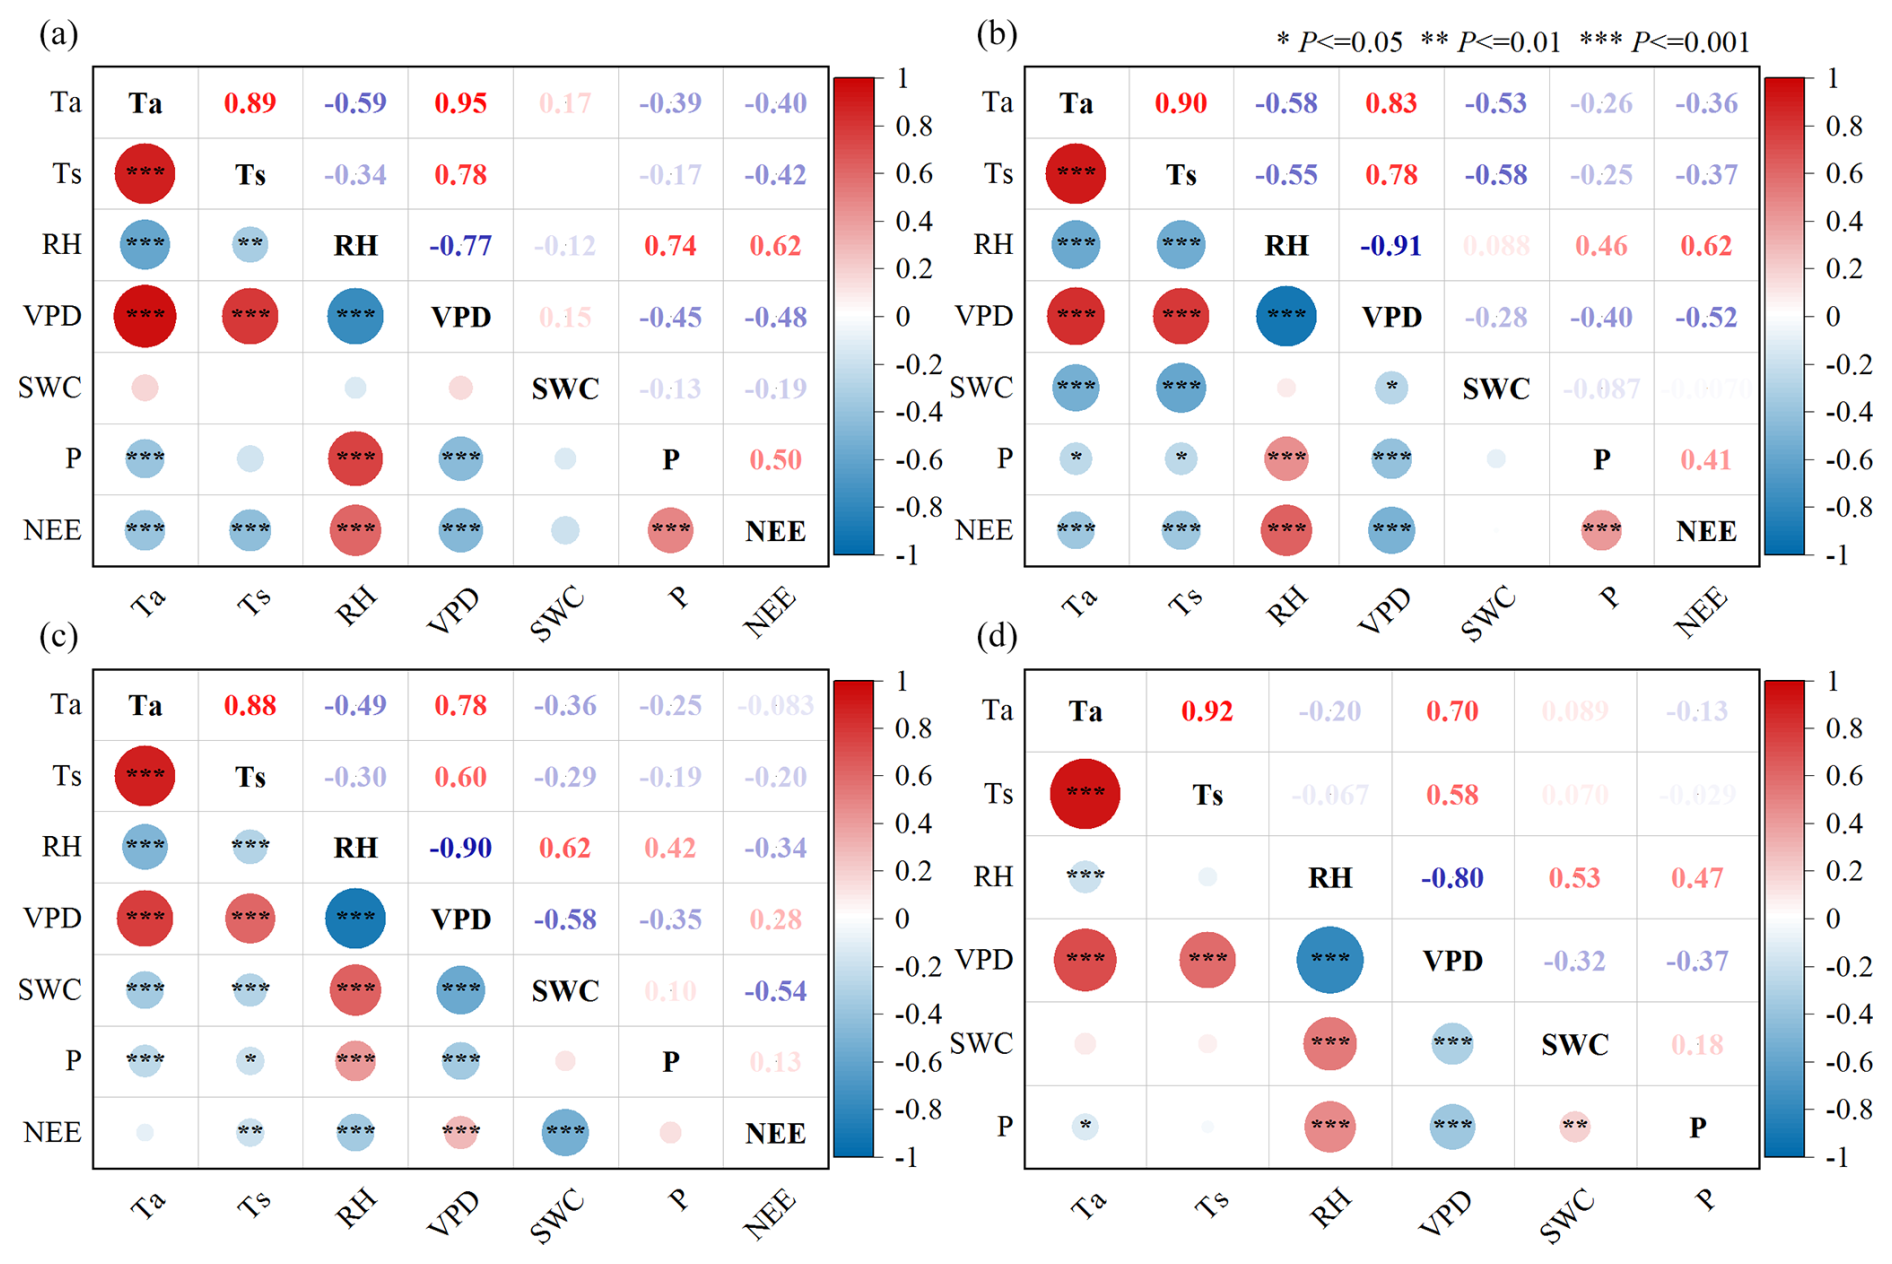
Figure 7The Pearson correlation between Fc and environmental factors (a – daily scales of the dry season; b – daily scales of the rainy season; c – annual daily scales; d – the correlation between different environmental factors; the data are consistent with Fig. 2).
3.4.2 Relationship with other environmental factors
With no significant correlation with SWC (Fig. 7a and b) shown by the daily scale NEE in the various seasons, there was a moderate negative correlation with Ta and Ts and a strong positive correlation with RH and P. The daily scale NEE in the dry season has a moderate negative correlation with VPD, while NEE in the rainy season shows a strong negative correlation with VPD. In general, due to the small variations in SWC within the two seasons (Fig. 2b), the impact of SWC on the diurnal fluctuation of NEE was not significant. The diurnal variation of NEE in the dry season is mainly affected by RH and P, while the rainy season is mainly affected by RH and VPD, and the influence of other environmental factors is relatively weak.
Throughout the year on a daily scale (Fig. 7c), NEE showed no significant correlation with Ta and P, a weak positive correlation with VPD, a weak negative correlation with Ts, a moderate negative correlation with RH, and a strong negative correlation with SWC. It is evident that as the time series extends, the physiological responses of photosynthesis and respiration processes in the open savanna to specific environmental factors have changed. In particular, the impact of SWC was most significant, closely related to the distinct climatic characteristics of wet and dry seasons in the study area. Under such climatic conditions, the variation in SWC throughout the year becomes the dominant factor restricting regional vegetation growth and recovery (Jiang et al., 2007), significantly influencing the intra-annual variation of Fc.
In terms of environmental factors (Fig. 7d), Ta shows a strong positive correlation with Ts and VPD and a weak negative correlation with RH. P has a weak negative correlation with Ta, a moderate negative correlation with VPD, a weak positive correlation with SWC, and a moderate positive correlation with RH. SWC has a strong positive correlation with RH and a moderate negative correlation with VPD. The relationship between Ts and SWC with P is not significant, which should be related to the lag effect of P.
4.1 CO2 flux of the open savanna
The herbs in the study area are mainly C4 plants (Grace et al., 1995), which are called high-efficiency photosynthetic plants, and the C4 plants exhibit higher efficiency in photosynthesis and resource utilization when compared to C3 plants (Cui et al., 2021; Arslan et al., 2023). However, the open savanna has been in a dry, high-temperature, and low-rainy climate for a long time. This extreme climatic condition causes the productivity of C4 herbaceous plants to only be maintained at a medium level (Grace et al., 2006). The daily maximum CO2 uptake rate was recorded at only 1.9585 , which stands notably lower in comparison to other savanna ecosystems (10–15 ) and grasslands found in arid and semi-arid regions (2.16–7.90 ) (Grace et al., 2006; Du et al., 2012; Niu et al., 2018; Hu et al., 2018; Zhang et al., 2020; Guo et al., 2022). Furthermore, the most savanna ecosystems globally demonstrate C sequestration features, with only a few exhibiting characteristics of C emissions (Fei et al., 2017b). Among them, the savanna ecosystem with C source characteristics is mainly grassland savanna and semi-arid savanna, and the grassland savanna has the largest annual C emissions (Archibald et al., 2009; Hutley et al., 2005; Quansah et al., 2015), which is similar to the results of this study. In the arid/semi-arid regions of China, NEE of different grasslands varies between −3.08 and 0.96 (Du et al., 2012; Niu et al., 2018; Chen et al., 2019; Zhang et al., 2020; Bai et al., 2022). We also found that most grasslands act as C sinks, with only a few, such as the Horqin sandy grassland (Niu et al., 2018; Chen et al., 2019), exhibiting C source characteristics, and the C emissions (0.91–0.96 ) are higher than those of the open savanna in the study area. Overall, the open savanna within the study area predominantly exhibits C emissions, but at a relatively low level, displaying a C-neutral trait.
Compared to other savanna ecosystems and the majority of grasslands in arid and semi-arid regions, the open savanna in the study area not only has a lower C absorption capacity but also exhibits a C emission characteristic. This is partly due to the study area's unique high-temperature and dry–hot island climate characteristics and partly because the southwestern region of China experienced a record-breaking extreme-drought event in 2023 (Wang et al., 2025), which significantly reduced vegetation productivity and also led to the study area's rainfall reaching the lowest level in nearly 4 decades (Fig. 3). This further exacerbated the ecological drought of the open savanna, causing a substantial decrease in the C absorption capacity of the ecosystem and an increase in the total annual C emissions.
4.2 Effects of environmental factors on CO2 flux
4.2.1 Temperature factor
The temperature affects Fc of terrestrial ecosystems by regulating biological activities such as photosynthesis and respiration (Pan et al., 2020; Johnston et al., 2021; Chen et al., 2023); especially for grassland ecosystems, several studies have validated that temperature serves as the primary driving force controlling the variation in Fc. Nevertheless, owing to variations in environmental conditions, the regulatory impact of temperature fluctuations on Fc differs significantly across various types of grassland ecosystems. Compared with temperate grasslands and semi-arid grasslands, the warming effect has the most significant impact on Fc of frigid grasslands worldwide (Wang et al., 2019). The rise in temperature (both annual average temperature and annual average soil temperature) reduced Fc of temperate grasslands in China, while the effect on alpine grasslands was the opposite (Liu et al., 2024). In the Inner Mongolia plateau, with the increase in temperature, NEE of the grassland will increase (Liu et al., 2018), whereas the change on the Qinghai–Tibet Plateau is much smaller in comparison. There is no correlation between Fc and temperature change in the Inner Mongolia grassland during the drought period (Hao et al., 2006). Ta and Ts exhibit a negative correlation with Fc at different seasonal daily scales in the open savanna in the dry–hot valley of JS (Fig. 7a and b). As the temporal scale increases, the impact of Ta and Ts on the fluctuations in Fc continues to weaken (Fig. 7c), which is related to the small differences in Ta and Ts within different timescales in the study area. That is, the small temperature differences lead to the Fc being insensitive to fluctuations in temperature, which is similar to the impact mechanisms seen in other arid and semi-arid grasslands (Li et al., 2016; Niu et al., 2018; Chen et al., 2019; Wang et al., 2021).
To further explore the environmental drivers of Fc, we employed a quadratic regression model to quantitatively analyze and predict the response of NEE to Ta, Ts, RH, VPD, P, and SWC (Figs. 8–10). From the regression results (Fig. 8a and b), it was observed that NEE of the open savanna primarily decreases gradually with an increase in Ta. During the dry season, when Ta exceeds 28.83 °C, the C emissions from the ecosystem gradually increase. In the rainy season, when Ta surpasses 25.50 °C, the C sequestration capacity rapidly declines, which is roughly consistent with the temperature threshold (Ta=24.7 °C) of the YJ savanna (Fei et al., 2017b). Similarly, a comparable change trend was observed between NEE and Ts (Fig. 8g and h); that is, when Ts exceeded 32.41 and 29.81 °C, respectively, the C emissions increased during the dry season of the open savanna, and the C sequestration capacity decreased during the rainy season.
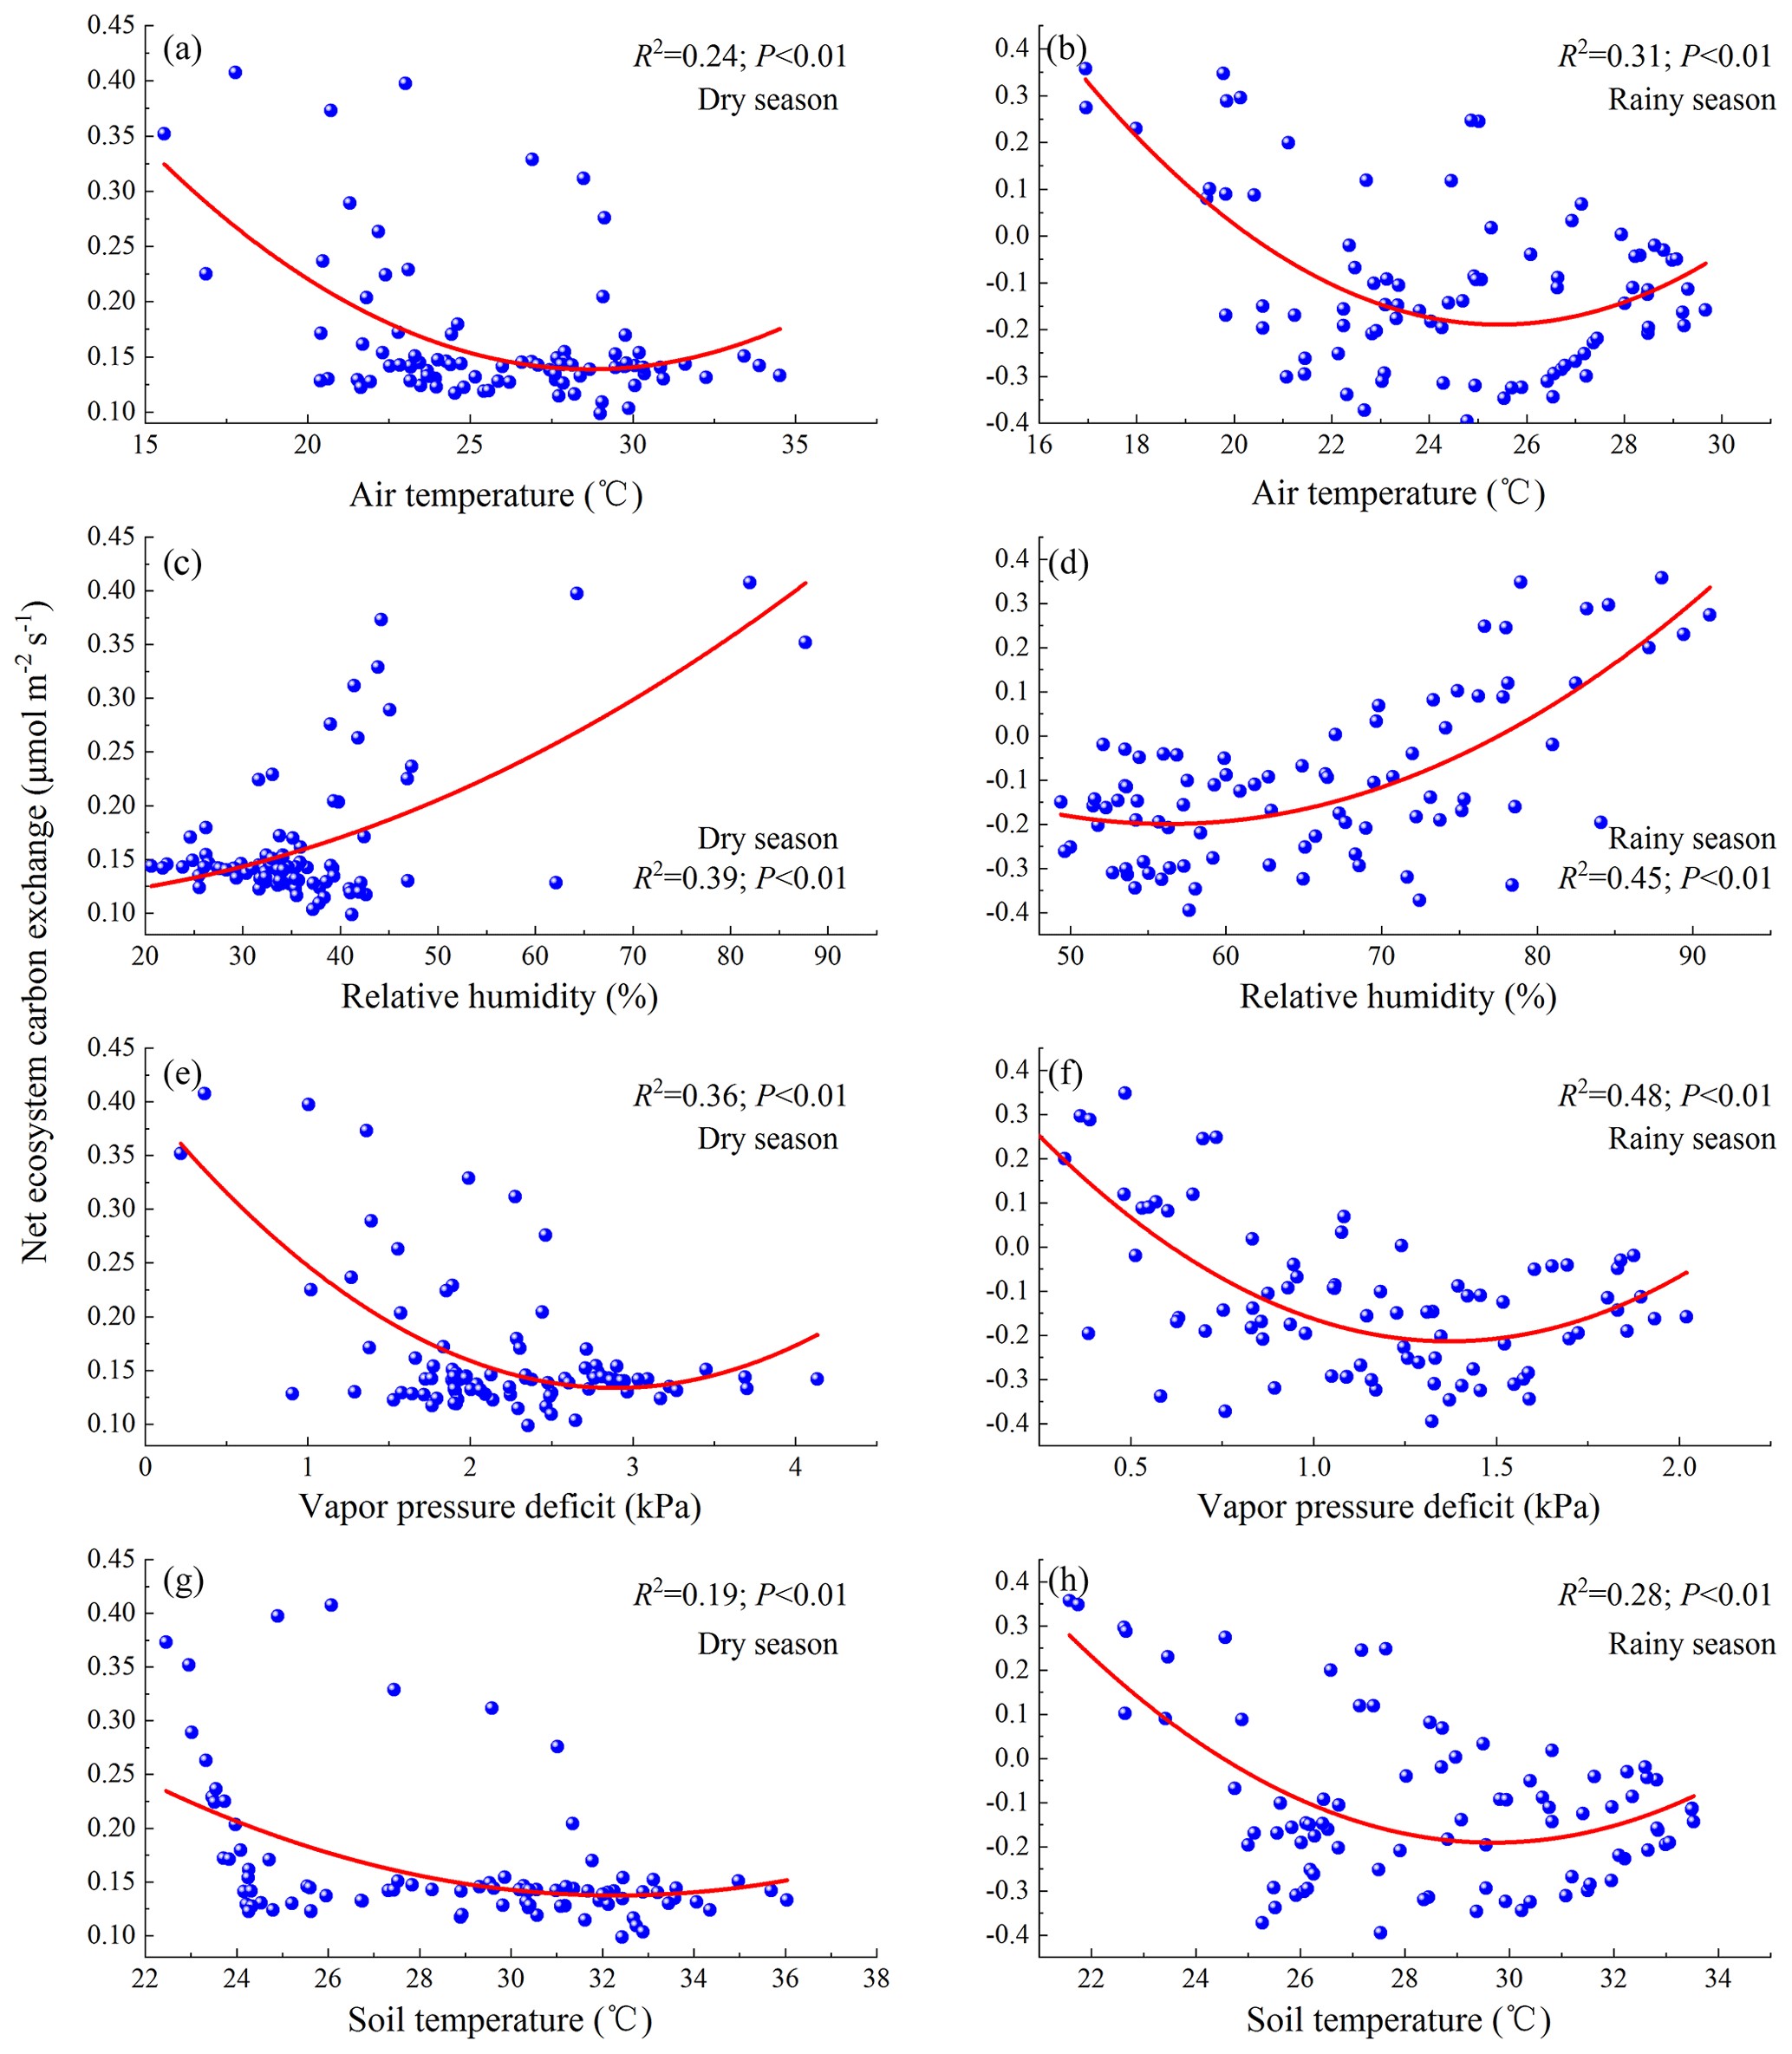
Figure 8The response of Fc to environmental factors (a – the response of NEE to Ta in the dry season; b – the response of NEE to Ta in the rainy season; c – the response of NEE to RH in the dry season; d – the response of NEE to RH in the rainy season; e – the response of NEE to VPD in the dry season; f – the response of NEE to VPD in the rainy season; g – the response of NEE to Ts in the dry season; h – the response of NEE to Ts in the rainy season).
4.2.2 Water factor
A potential limiting factor affecting C uptake in terrestrial ecosystems is soil moisture, which can diminish net primary production through water stress in ecosystems, leading to vegetation death (Green et al., 2019). Simultaneously, soil moisture may exacerbate extreme climatic conditions through the intricate interaction between the land and the atmosphere. Particularly in arid regions, there exists a significant interaction between soil moisture and vegetation. Hence, in terms of Fc affecting dryland ecosystems, SWC is a more important control factor than Ta (Zou et al., 2016; Tarin et al., 2020; Kannenberg et al., 2024). For instance, in the herb growth season of the Qinghai–Tibet Plateau, regions with plentiful precipitation in the east and southeast primarily regulate C absorption capacity through temperature. Conversely, SWC emerges as the principal determinant of C sequestration capability in the arid and water shortage western region (Wang et al., 2021). Simultaneously, SWC emerges also as the predominant factor influencing the diurnal fluctuations of NEE in grassland in the semi-arid regions of northern China (Zhao et al., 2020).
To further assess the impact of SWC on NEE, we divided SWC into three levels: low SWC (), moderate SWC (), and high SWC (), corresponding to dry, intermediate, and wet periods, respectively. We then analyzed the relationship between SWC and NEE during these different periods (Fig. 9a). During the dry period, SWC showed a weak negative correlation with NEE. In the intermediate period, there was a strong negative correlation between SWC and NEE. In the wet period, SWC exhibited a strong positive correlation with NEE. In addition, we can also observe that NEE of the open savanna in the study area exhibits a parabolic trend first decreasing and then increasing with the increase in SWC (Fig. 9b). This indicates that the maximum value of NEE typically occurs at the two extreme SWC values, while the minimum value of NEE appears at the position of moderate SWC. That is, when SWC is in the dry period and the transition period, the C uptake capacity generally enhances with the increase in SWC, reaching a maximum under optimal conditions (), and then decreases in the flooded environment. Globally, Peng et al. (2024) has also found that the total gross primary productivity (GPP) of ecosystems exhibits a hump-shaped response curve with increasing soil moisture, indicating the presence of an apparent optimal soil moisture level. This phenomenon is widespread, even in arid and water-scarce regions (Taylor et al., 2017; Kannenberg et al., 2024).
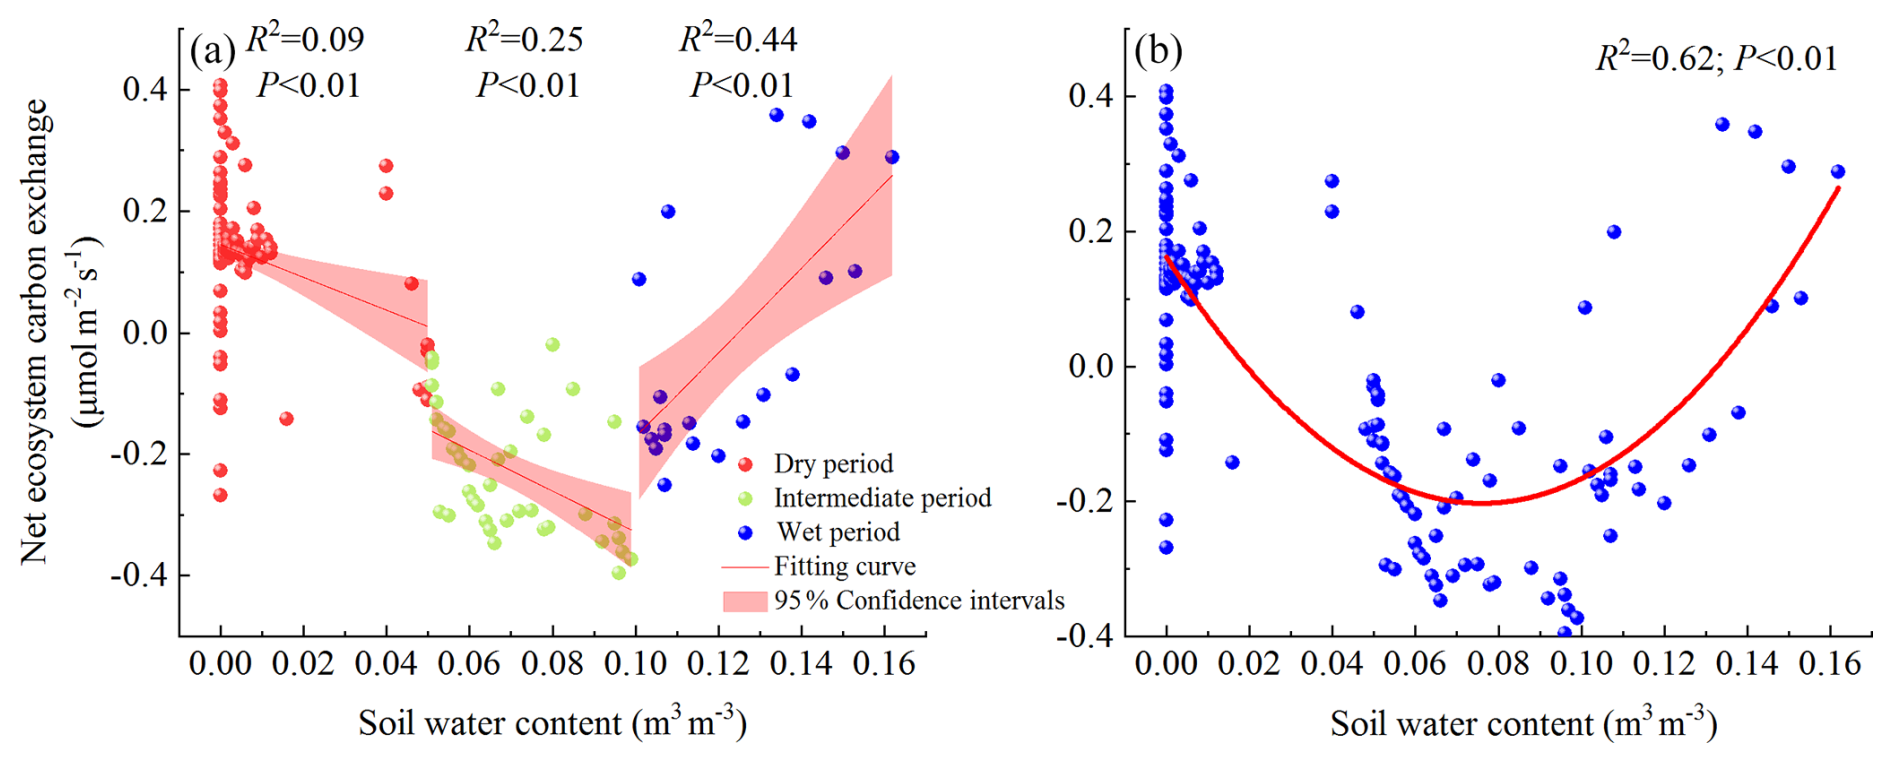
Figure 9Effects of SWC on Fc (a – the relationship between NEE and SWC; b – the response of annual NEE to SWC).
It should be noted that Fc and SWC in the open savanna was influenced by multiple environmental factors. Therefore, when studying the response relationship between NEE and SWC, we analyzed the correlation coefficient between SWC and NEE under conditions where other environmental factors such as Ta, RH, and PAR were controlled or not. The results showed no significant difference (, P<0.01; , P<0.01), indicating that other environmental factors have no significant impact on the nonlinear relationship between NEE and SWC. In summary, for arid regions, both excessively low and high SWC can affect the C absorption capacity of ecosystems.
In arid ecosystem, the effectiveness of water dictates plant growth and the release and absorption of CO2. Therefore, Fc of grasslands in arid regions exhibits greater sensitivity to variations in P (Knapp et al., 2002; Niu et al., 2008; Weltzin et al., 2003; Zhang et al., 2020). An increase in P led to a delay in the peak of gross primary productivity in vegetation growth stage of the Inner Mongolia desert steppe, enhancing the ecosystem's Fc (Li et al., 2017; Zhang et al., 2019a). P of Xilinhot grassland changed Fc in the vegetation growth season mainly by affecting SWC (Wang et al., 2015). High water levels (annual average precipitation and soil moisture) have continuously increased Fc of temperate grasslands and alpine grasslands in the Mongolian Plateau, Loess Plateau, and Qinghai–Tibet Plateau (Liu et al., 2024). As far as the open savanna in the dry–hot valley of JS is concerned, P shows a positive correlation with Fc at different seasonal daily scales, with no significant relationship observed with Fc variation on the daily scales throughout the year (Figs. 7a, b, and 10a). However, the variation in P significantly affects the regional SWC and RH (Fig. 7d). Therefore, the impact mechanism of P on Fc in the JS dry–hot valley open savanna may be similar to that of the Xilinhot grassland, where P mainly controls vegetation growth by affecting SWC and RH, thereby indirectly influencing Fc.
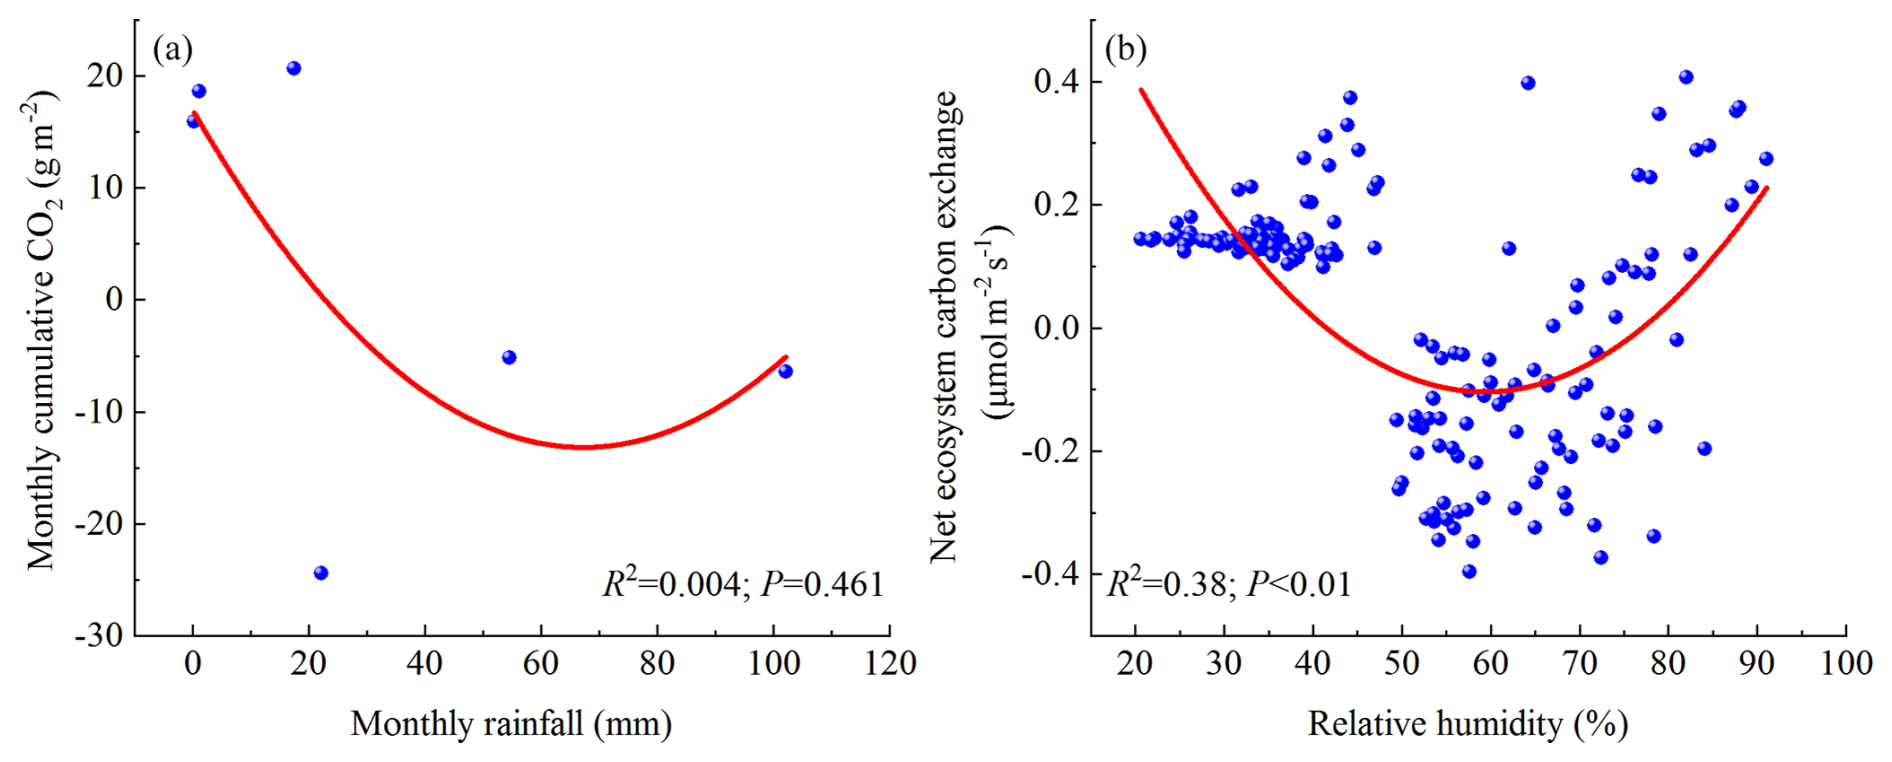
Figure 10The response of Fc to monthly rainfall and annual RH (a – the response of monthly cumulative CO2 to monthly rainfall; b – the response of annual NEE to RH).
4.2.3 Relative humidity and vapor pressure deficit factor
As an important measure of atmospheric dryness, the fluctuation of VPD is controlled by RH and has a high correlation with other important driving factors of ecosystem productivity, such as Ta and SWC. Multiple studies have shown that when RH decreases, vegetation stomata close due to an increase in VPD, thereby preventing excessive water loss (Williams et al., 2013; Novick et al., 2016; Sulman et al., 2016; Hsu et al., 2021), leading to a decrease in the photosynthetic rate of leaves and canopies and thereby inhibiting photosynthesis (McDowell and Allen, 2015; Sulman et al., 2016; Yuan et al., 2019). Therefore, there is a negative correlation between the intensity of plant photosynthesis and VPD. Globally, studies have also shown that increased VPD reduces vegetation growth and offsets the beneficial impacts of CO2 fertilization (Yuan et al., 2019). Simultaneously, the interannual variation of VPD shows a significant negative correlation with net ecosystem productivity and affects the interannual variation of atmospheric CO2 growth rate (He et al., 2022). However, because of variations in climatic conditions and the synergistic effects of multiple environmental factors, the response mechanisms of Fc in different grassland ecosystems to changes in VPD and RH are varied. For instance, in the savanna of YJ, Fc shows a negative correlation with VPD (Fei et al., 2017a). Wang et al. (2021) found through a study on the spatial variation of Fc of 10 distinct grassland types that a positive correlation exists between VPD and NEE in the Qinghai–Tibet Plateau. In the arid grasslands of the Heihe River basin (Bai et al., 2022), Fc is also positively correlated with VPD and RH.
In the study area, the daily scale NEE and RH showed a positive correlation during different seasons, whereas a negative correlation was observed at interannual scales. This indicates that, over long-term timescales, an increase in RH enhances the C sequestration capacity of the open savanna. The relationship between VPD and NEE was the opposite (Fig. 7a–c). However, further regression analysis (Fig. 8c and d) revealed that during the rainy season, NEE initially decreases and then increases with rising RH, reaching a minimum value under certain conditions (RH=56.41 %). This response was more clearly observed in the interannual quadratic regression model of NEE versus RH (Fig. 10b). A similar relationship was also found between NEE and VPD (Fig. 8e and f), with NEE rapidly increasing when VPD exceeds the thresholds of 2.89 kPa (dry season) and 1.37 kPa (rainy season), respectively, in different seasons, which is consistent with the control mechanism of the YJ savanna. (Fei et al., 2017b).
Overall, aside from the P factor, the maximum value of NEE in the open savanna of the JS dry–hot valley generally occurs at the two extreme values of various environmental factors, while the minimum value of NEE appears at positions of the environmental factor threshold. However, as can be observed from Fig. 7, P is closely related to other environmental factors, with the continuous decrease in rainfall and the increasing severity of drought, Ta, Ts, and VPD will continuously rise, while SWC and RH will gradually decrease. That is, from the perspective of NEE's response to different environmental factors, as global warming continues to lead to a decrease in rainfall in the future, the C emissions from the open savanna in the study area will continue to rise. In addition, the study area experiences long-term drought, high temperatures, and low rainfall. Herbaceous vegetation has shown a stronger ability to adapt to ecological drought stress compared to other regions. However, the research has found that under the extreme-drought event of 2023, the C sequestration capacity of the open savanna has still been significantly weakened. Secondly, the study area belongs to a special heat island habitat within the temperate climate zone, with climate characteristics and vegetation community structures representing the future scenarios of temperate ecosystems under conditions of continuous warming and decreasing precipitation. Particularly in recent years, there has been a shift of vegetation communities in some temperate regions towards savannas (Yang and Chang, 2007; Jiang et al., 2024). As the frequency and severity of global droughts continue to rise, researchers have found that the sensitivity of vegetation in grasslands and arid regions to drought is significantly increasing, and the response time of vegetation productivity to drought is also gradually decreasing (Tang et al., 2024). Therefore, under climate scenarios where the frequency, duration, and severity of droughts are all on the rise, some grasslands in temperate climate regions may shift from being C sinks to C sources. This transition is of great importance for the C balance of global terrestrial ecosystems. Our research findings will provide important references for accurately predicting the C budget of terrestrial ecosystems under future extreme climatic conditions.
This study quantitatively analyzed Fc variations and their relationships with environmental factors in the open savanna of the dry–hot valley of JS, further deepening the researchers' theoretical understanding of the changes in grassland C sequestration functions under extreme dry and hot climate conditions and providing an effective reference for the accurate prediction of future terrestrial ecosystem C sink capacity. Nonetheless, the lack of long-term observational data on Fc in our study precludes a more thorough examination of the inter-annual variation characteristics of Fc. Secondly, the study did not effectively monitor the dynamic characteristics of soil respiration, which made it impossible to accurately calculate the ecosystem's GPP. Furthermore, we only observed and studied the changes in Fc of the dominant grassy layer, while the dry–hot valley ecosystem has a vegetation community structure with two levels of shrub and grass. Therefore, our forthcoming research will emphasize the extended observation of Fc changes in the savanna ecosystem with a complete vegetation community structure, especially the use of eddy covariance methods to expand the scope of ecosystem observation and reduce the uncertainty of measurement samples, so as to better elucidate the C budget patterns of ecosystems under extreme climatic conditions. Through this research, we have arrived at the following findings:
-
As a result of environmental factors, Fc of the open savanna in the JS dry–hot valley exhibited significant temporal variations. During the dry season, the open savanna functioned as a C source, with the daily variation of Fc showing a W-shaped bimodal curve. In contrast, during the rainy season, the open savanna functioned as a C sink, with the daily variation of Fc displaying a U-shaped unimodal curve. Overall, open savanna was a weak C source, exhibiting a C-neutral characteristic.
-
During the dry season, NEE of the open savanna was primarily influenced by RH and P, whereas during the rainy season, NEE was mainly affected by PAR, VPD, and RH. On a daily scale throughout the year, SWC had the most pronounced impact on NEE, while the influence of temperature factors on NEE was relatively minor. P primarily influences other environmental factors, thereby indirectly controlling changes in NEE.
-
The response mechanism of NEE to changes in various environmental factors in open savannas was similar. Specifically, the maximum value of NEE generally occurred at the two extreme values of the various environmental factors, and NEE increased when either above or below the thresholds of environmental factors. This mechanism was most pronounced in the relationship between NEE and SWC.
-
The occurrence of extreme-drought events has weakened the C sequestration capacity of the open savannas in the study area. With the continued warming of the global climate leading to changes in future rainfall patterns and a decrease in rainfall, the C emissions from the open savannas are expected to continue to increase.
The CO2 flux data and environmental data used to support the findings of this study are available from the corresponding author upon request. The administrative boundary data (https://doi.org/10.12078/2023010103, https://doi.org/10.12078/2023010101, Xu, 2023a, b) and river data (https://doi.org/10.12078/2018060101, Xu, 2018) were sourced from the RESDC of the Chinese Academy of Sciences.
All authors were involved in the preparation and design of the paper. CY wrote the paper, and all authors provided feedback and suggestions for revision. YT and JC processed and analyzed the research data. ZW, YH, AJ, and YF were mainly responsible for the daily maintenance and data collection of monitoring instruments. All the authors have read and approved the paper.
The contact author has declared that none of the authors has any competing interests.
Publisher's note: Copernicus Publications remains neutral with regard to jurisdictional claims made in the text, published maps, institutional affiliations, or any other geographical representation in this paper. While Copernicus Publications makes every effort to include appropriate place names, the final responsibility lies with the authors.
This research has been supported by the China Geological Survey (grant no. DD20220888), the Basic Research Project of Yunnan Province (grant no. 202401BF070001032), and the National Natural Science Foundation of China (grant no. U2102209).
This paper was edited by Kerneels Jaars and reviewed by Lindokuhle Xolani Dlamini and two anonymous referees.
Archibald, S. A., Kirton, A., van der Merwe, M. R., Scholes, R. J., Williams, C. A., and Hanan, N.: Drivers of inter-annual variability in Net Ecosystem Exchange in a semi-arid savanna ecosystem, South Africa, Biogeosciences, 6, 251–266, https://doi.org/10.5194/bg-6-251-2009, 2009.
Arslan, A. M., Wang, X., Liu, B. Y., Xu, Y. N., Li, L., and Gong, X. Y.: Photosynthetic resource-use efficiency trade-offs triggered by vapour pressure deficit and nitrogen supply in a C4 species, Plant Physiol. Bioch., 197, 107666, https://doi.org/10.1016/j.plaphy.2023.107666, 2023.
Bai, X. J., Wang, X. F., Liu, X. H., and Zhou, X. Q.: Dynamics and driving factors of carbon fluxes in wetland, cropland and grassland ecosystems in Heihe river basin, Remote Sens., 37, 94–107, 2022.
Bai, X. Y., Zhang, S. R., Li, C. J., Xiong, L., Song, F. J., Du, C. C., Li, M. H., Luo, Q., Xue, Y. Y., and Wang, S. J.: A carbon-neutrality-capacity index for evaluating carbon sink contributions, Environ. Sci. Ecotechnol., 15, 100237, https://doi.org/10.1016/j.ese.2023.100237, 2023.
Bureau of Statistics of Yunnan Province: Yunnan Statistical Yearbook, China Statistics Press, Beijing, China, ISBN 9787523002537, 2023.
Campbell, G. S. and Norman, J. M.: An introduction to environmental biophysics, Springer Sci. Business Media, ISBN 9781461216261, 2012.
Carey, C. J., Tang, J. W., Templer, P. H., Kroeger, K. D., Crowther, T. W., Burton, A. J., Dukes, J. S., Emmett, B., Frey, S. D., Heskel, M. A., Jiang, L. F., Machmuller, M. B., Mohan, J., Panetta, A. M., Reich, P. B., Reinsch, S., Wang, X., Allison, S. D., Bamminger, C., Bridgham, S., Collins, S. L., de Dato, G., Eddy, W. C., Enquist, B. J., Estiarte, M., Harte, J., Henderson, A., Johnson, B. R., Larsen, K. S., Luo, Y. Q., Marhan, S., Melillo, J. M., Peñuelas, J., Pfeifer-Meister, L., Poll, C., Rastetter, E., Reinmann, A. B., Reynolds, L. L., Schmidt, I. K., Shaver, G. R., Strong, A. L., Suseela, V., and Tietema, A.: Temperature response of soil respiration largely unaltered with experimental warming, P. Natl. Acad. Sci. USA, 113, 13797–13802, https://doi.org/10.1073/pnas.1605365113, 2016.
Chen, W. N., Wang, S., Wang, J. S., Xia, J. Y., Luo, Y. Q., Yu, G. R., and Niu, S. L.: Evidence for widespread thermal optimality of ecosystem respiration, Nat. Ecol. Evol., 7, 1379–1387, https://doi.org/10.1038/s41559-023-02121-w, 2023.
Chen, Y. P., Niu, Y. Y., Li, W., Li, Y. Q., Gong, X. W., and Wang, X. Y.: Characteristics of carbon flux in sandy grassland ecosystem under natural restoration in Horqin sandy land, Plateau Meteorol., 38, 650–659, 2019.
Cui, H. C.: Challenges and approaches to crop improvement through C3-to-C4 engineering, Front. Plant Sci., 12, 715391, https://doi.org/10.3389/fpls.2021.715391, 2021.
Deng, Y.: The boundary definition and studyon the land use/cover change and landscape pattern of the dry-hot valley in Hengduan Mountains, Yunnan University, https://doi.org/10.27456/d.cnki.gyndu.2022.000408, 2022.
Dobson, A., Hopcraft, G., Mduma, S., Ogutu, J. O., Fryxell, J., Anderson, M., Archibald, S., Lehmann, C., Poole, J., Caro, T., Mulder, M. B., Holt, R. D., Berger, J., Rubenstein, D. I., Kahumbu, P., Chidumayo, E. N., Milner-Gulland, E. J., Schluter, D., Otto, S., Balmford, A., Wilcove, D., Pimm, S., Veldman, J. W., Olff, H., Noss, R., Holdo, R., Beale, C., Hempson, G., Kiwango, Y., Lindenmayer, D., Bond, W., Ritchie, M., and Sinclair, A. R. E.: Savannas are vital but overlooked carbon sinks, Science, 375, 392, https://doi.org/10.1126/science.abn4482, 2022.
Du, Q., Liu, H. Z., Feng, J. W., Wang, L., Huang, J. P., Zhang, W., and Bernhofer, C.: Carbon dioxide exchange processes over the grassland ecosystems in semiarid areas of China, Sci. China Earth Sci., 42, 711–722, https://doi.org/10.1007/s11430-011-4283-1, 2012.
Fei, X. H., Song, Q. H., Zhang, Y. P., Liu, Y. T., Sha, L. Q., Yu, G. R., Zhang, L. M., Duan, C. Q., Deng, Y., Wu, C. S., Lu, Z. Y., Luo, K., Chen, A. G., Xu, K., Liu, W. W., Huang, H., Jin, Y. Q., Zhou, R. W., Li, J., Lin, Y. X., Zhou, L. G., Fu, Y., Bai, X. L., Tang, X. H., Gao, J. B., Zhou, W. J., and Grace, J.: Carbon exchanges and their responses to temperature and precipitation in forest ecosystems in Yunnan, Southwest China, Sci. Total Environ., 616–617, 824–840, https://doi.org/10.1016/j.scitotenv.2017.10.239, 2017a.
Fei, X. H., Jin, Y. Q., Zhang, Y. P., Sha, L. Q., Liu, Y. T., Song, Q. H., Zhou, W. J., Liang, N. S., Yu, G. R., Zhang, L. M., Zhou, R. W., Li, J., Zhang, S. B., and Li, P. G.: Eddy covariance and biometric measurements show that a savanna ecosystem in Southwest China is a carbon sink, Sci. Rep.-UK, 7, 41025, https://doi.org/10.1038/srep41025, 2017b.
Grace, J., Lloyd, J., McIntyre, J., Miranda, A. C., Meir, P., Miranda, H., Moncrieff, J. M., Massheder, J., Wright, I. R., and Gash, J.: Fluxes of carbon dioxide and water vapour over an undisturbed tropical forest in south-west Amazonia, Glob. Change Biol., 1, 1–12, https://doi.org/10.1111/j.1365-2486.1995.tb00001.x, 1995.
Grace, J., José, J. S., Meir, P., Miranda, H. S., and Montes, R. A.: Productivity and carbon fluxes of tropical savannas, J. Biogeogr., 33, 387–400, https://doi.org/10.1111/j.1365-2699.2005.01448.x, 2006.
Green, J. K., Seneviratne, S. I., Berg, A. M., Findell, K. L., Hagemann, S., Lawrence, D. M., and Gentine, P.: Large influence of soil moisture on long-term terrestrial carbon uptake, Nature, 565, 476–479, https://doi.org/10.1038/s41586-018-0848-x, 2019.
Guo, W. Z., Jing, C. Q., Deng, X. J., Chen, C., Zhao, W. K., Hou, Z. X., and Wang, G. X.: Variations in carbon flux and factors influencing it on the northern slopes of the Tianshan Mountains, Acta Prataculturae Sin., 31, 1–12, https://doi.org/10.11686/cyxb2021137, 2022.
Hao, Y. B., Wang, Y. F., Sun, X. M., Huang, X. Z., Cui, X. Y., Niu, H. S., Zhang, Y. H., and Yu, G. R.: Seasonal variation in carbon exchange and its ecological analysis over Leymus chinensis steppe in Inner Mongolia, Sci. China Earth Sci., 49, 186–195, https://doi.org/10.1007/s11430-006-8186-5, 2006.
Harmon, T. C., Dierick, D., Trahan, N., Allen, M. F., Rundel, P. W., Oberbauer, S. F., Schwendenmann, L., and Zelikova, T. J.: Low-cost soil CO2 efflux and point concentration sensing systems for terrestrial ecology applications, Methods Ecol. Evol., 6, 1358–1362, https://doi.org/10.1111/2041-210X.12426, 2015.
He, B., Chen, C., Lin, S. R., Yuan, W. P., Chen, H. W., Chen, D. L., Zhang, Y. F., Guo, L. L., Zhao, X., Liu, X. B., Piao, S. L., Zhong, Z. Q., Wang, R., and Tang, R.: Worldwide impacts of atmospheric vapor pressure deficit on the interannual variability of terrestrial carbon sinks, Natl. Sci. Rev., 9, nwab150, https://doi.org/10.1093/nsr/nwab150, 2022.
He, G. X., Shi, Z. T., Fang, H. D., Shi, L. T., Wang, Y. D., Yang, H. Z., Yan, B. G., Yang, C. L., Yu, J. L., Liang, Q. L., Zhao, L., and Jiang, Q.: Climate and soil stressed elevation patterns of plant species to determine the aboveground biomass distributions in a valley-type Savanna, Front. Plant Sci., 15, 1324841, https://doi.org/10.3389/fpls.2024.1324841, 2024.
He, Y. B., Lu, P. Z., and Zhu, T.: Causes for the formation of dry-hot valleys in Hengduan Mountain-Yunnan plateau, Resour. Sci., 22, 69–72, 2000.
Hoffmann, W. A.: Seasonal flooding shapes forest–savanna transitions, P. Natl. Acad. Sci. USA, 120, e2312279120, https://doi.org/10.1073/pnas.2312279120, 2023.
Hsu, P. K., Takahashi, Y., Merilo, E., Costa, A., Zhang, L., Kernig, K., Lee, K. H., and Schroeder, J. I.: Raf-like kinases and receptor-like (pseudo) kinase GHR1 are required for stomatal vapor pressure difference response, P. Natl. Acad. Sci. USA, 118, e2107280118, https://doi.org/10.1073/pnas.2107280118, 2021.
Hu, Y., Zhu, X. P., Jia, H. T., Han, D. L., Hu, B. A., and Li, D. P.: Effects of fencing on ecosystem crabon exchange at meadow steppe in the northern slop oh the Tianshan Mountains, Chinese J. Plant Eco., 42, 372–381, https://doi.org/10.17521/cjpe.2016.0049, 2018.
Huang, M. T. and Zhai, P. M.: Impact of extreme seasonal drought on ecosystem carbon-water coupling across China, Adv. Clim. Change Res., 15, 914–923, https://doi.org/10.1016/j.accre.2024.08.001, 2024.
Hutley, L. B., Leuning, R., Beringer, J., and Cleugh, H. A.: The utility of the eddy covariance techniques as a tool in carbon accounting: tropical savanna as a case study, Aust. J. Bot., 53, 663–675, https://doi.org/10.1071/Bt04147, 2005.
IPCC (Intergovernmental Panel on Climate Change): Climate Change 2021: the Physical Science Basis. Contribution of Working Group I to the Sixth Assessment Report of the Intergovernmental Panel on Climate Change, Cambridge University Press, Cambridge, UK, https://doi.org/10.1017/9781009157896, 2021.
Jiang, J. M., Fei, S. M., He, Y. P., Zhang, F., and Kong, Q. H.: Study on vegetation restoration in dry-hot valleys of the Jinsha River, J. Southwest For. Univ., 27, 11–15, 2007.
Jiang, Q. Q., He, J. J., Li, Y. R., Yang, X. Y., Peng, Y., Wang, H., Yu, F., Wu, J., Gong, S. L., Che, H. Z., and Zhang, X. Y.: Analysis of the spatiotemporal changes in global land cover from 2001 to 2020, Sci. Total Environ., 908, 168354, https://doi.org/10.1016/j.scitotenv.2023.168354, 2024.
Jin, Y. Q., Li, J., Liu, C. G., Liu, Y. T., Zhang, Y. P., Song, Q. H., Sha, L. Q., Balasubramanian, D., Chen, A. G., Yang, D. X., and Li, P. G.: Precipitation reduction alters herbaceous community structure and composition in a savanna, J. Veg. Sci., 30, 821–831, https://doi.org/10.1111/jvs.12766, 2019.
Jin, Z. Z., Ou, X. K., and Zhou, Y.: The general situation of natural vegetation in dry-hot river valley of Yuanmou, Yunnan Province, Chin. J. Plant Ecol., 11, 308–317, 1987.
Johnston, A. S. A., Meade, A., Ardö, J., Arriga, N., Black, A., Blanken, P. D., Bonalo, D., Brümmer, C., Cescatti, A., Dušeko, J., Grafo, A., Gioli, B., Godedo, I., Gougho, C. M., Ikawa, H., Jassalo, R., Kobayashi, H., Magliulo, V., Mancao, G., Montagnani, L., Moyano, F. E., Olesen, J. E., Sachs, T., Shao, C. L., Tagesson, T., Wohlfahrt, G., Wolfo, S., Woodgate, W., Varlagin, A., and Venditti, C.: Temperature thresholds of ecosystem respiration at a global scale, Nat. Ecol. Evol., 5, 487–494, https://doi.org/10.1038/s41559-021-01398-z, 2021.
Kannenberg, S. A., Anderegg, W. R. L., Barnes, M. L., Dannenberg, M. P., and Knapp, A. K.: Dominant role of soil moisture in mediating carbon and water fluxes in dryland ecosystems, Nat. Geosci., 17, 38–43, https://doi.org/10.1038/s41561-023-01351-8, 2024.
Knapp, A., Fay, P. A., Blair, J. M., Collins, S., Smith, M. D., Carlisle, J. D., Harpper, C. W., Danner, B. T., Lett, M. S., and Mccarron, J.: Rainfall variability, carbon cycling, and plant species diversity in a mesic grassland, Science, 298, 2202–2205, https://doi.org/10.1126/science.1076347, 2002.
Lee, E., Kumar, P., Barron-Gafford, G. A., Hendryx, S. M., Sanchez-Cañete, E. P., Minor, R. L., Colella, T., and Scott, R. L.: Impact of hydraulic redistribution on multispecies vegetation water use in a semiarid savanna ecosystem: an experimental and modeling synthesis, Water Resour. Res., 54, 4009–4027, https://doi.org/10.1029/2017WR021006, 2018.
Li, G. Y., Han, H. Y., Du, Y., Hui, D. F., Xia, J. Y., Niu, S. L., Li, X. N., and Wan, S. Q.: Effects of warming and increased precipitation on net ecosystem productivity: a long-term manipulative experiment in a semiarid grassland, Agr. Forest Meteorol., 232, 359–366, https://doi.org/10.1016/j.agrformet.2016.09.004, 2017.
Li, J. X., Zeng, H., Zhu, J. T., Zhang, Y. J., Chen, N., and Liu, Y. J.: Responses of different experimental warming on ecosystem respiration in Tibetan alpine meadow, Ecol. Environ. Sci., 25, 1612–1620, https://doi.org/10.16258/j.cnki.1674-5906.2016.10.004, 2016.
Liu, D., Li, Y., Wang, T., Peylin, P., MacBean, N., Ciais, P., Jia, G., Ma, M. G., Ma, Y. M., Shen, M. G., Zhang, X. Z., and Piao, S. L.: Contrasting responses of grassland water and carbon exchanges to climate change between Tibetan Plateau and InnerMongolia, Agr. Forest Meteorol., 249, 163–175, https://doi.org/10.1016/j.agrformet.2017.11.034, 2018.
Liu, J. X., Wang, Z., Duan, Y. F., Li, X. R., Zhang, M. Y., Liu, H. Y., Xue, P., Gong, H. B., Wang, X., Chen, Y., and Geng, Y. N.: Effects of land use patterns on the interannual variations of carbon sinks of terrestrial ecosystems in China, Ecol. Indic., 146, 109914, https://doi.org/10.1016/j.ecolind.2023.109914, 2023.
Liu, Z. G., Chen, Z., Yang, M., Hao, T. X., Yu, G. R., Zhu, X. J., Zhang, W. K., Ma, L. X., Dou, X. J., Lin, Y., Luo, W. X., Han, L., Sun, M. Y., Chen, S. P., Dong, G., Gao, Y. H., Hao, Y. B., Jiang, S. C., Li, Y. N., Li, Y. Z., Liu, S. M., Shi, P. L., Tang, Y. K., Xin, X. P., Zhang, F. W., Zhang, Y. J., Zhao, L., Zhou, L., and Zhu, Z. L.: Precipitation consistently promotes, but temperature oppositely drives carbon fluxes in temperate and alpine grasslands in China, Agr. Forest Meteorol., 344, 109811, https://doi.org/10.1016/j.agrformet.2023.109811, 2024.
Livesley, S. J., Grover, S., Hutley, L. B., Jamali, H., Butterbach-Bahl, K., Fest, B., and Arndt, S. K.: Seasonal variation and fire effects on CH4, N2O and CO2 exchange in savanna soils of northern Australia, Agr. Forest Meteorol., 151, 1440–1452, https://doi.org/10.1016/j.agrformet.2011.02.001, 2011.
McDowell, N. G. and Allen, C. D.: Darcy's law predicts widespread forest mortality under climate warming, Nat. Clim. Change, 5, 669–672, https://doi.org/10.1038/nclimate2641, 2015.
Millard, P., Midwood, A. J., Hunt, J. E., Whitehead, D., and Boutton, T. W.: Partitioning soil surface CO2 efflux into autotrophic and heterotrophic components, using natural gradients in soil δ13C in an undisturbed savannah soil, Soil Biol. Biochem., 40, 1575–1582, https://doi.org/10.1016/j.soilbio.2008.01.011, 2008.
Niu, S. L., Wu, M. Y., Han, Y., Xia, J. Y., Li, L. H., and Wan, S. Q.: Water-mediated responses of ecosystem carbon fluxes to climatic change in a temperate steppe, New Phytol., 177, 209–219, https://doi.org/10.1111/j.1469-8137.2007.02237.x, 2008.
Niu, Y. Y., Li, Y. Q., Wang, X. Y., Gong, X. W., Luo, Y. Q., and Tian, D. Y.: Characteristics of annual variation in net carbon dioxide flux in a sandy grassland ecosystem during dry years, Acta Prataculturae Sin., 27, 215–221, https://doi.org/10.11686/cyxb2017231, 2018.
Novick, K. A., Miniat, C. F., and Vose, J. M.: Drought limitations to leaf-level gas exchange: results from a model linking stomatal optimization and cohesion–tension theory, Plant Cell Environ., 39, 583–96, https://doi.org/10.1111/pce.12657, 2016.
Pan, S. F., Yang, J., Tian, H. Q., Shi, H., Chang, J. F., Ciais, P., Francois, L., Frieler, K., Fu, B. J., Hickler, T., Ito, A., Nishina, K., Ostberg, S., Reyer, C. P. O., Schaphoff, S., Steinkamp, J., and Zhao, F.: Climate extreme versus carbon extreme: responses of terrestrial carbon fluxes to temperature and precipitation, J. Geophys. Res.-Biogeo., 125, e2019JG005252, https://doi.org/10.1029/2019JG005252, 2020.
Peel, M. C., Finlayson, B. L., and McMahon, T. A.: Updated world map of the Köppen-Geiger climate classification, Hydrol. Earth Syst. Sci., 11, 1633–1644, https://doi.org/10.5194/hess-11-1633-2007, 2007.
Peng, J. L., Tang, J. W., Xie, S. D., Wang, Y. H., Liao, J. Q., Chen, C., Sun, C. L., Mao, J. H., Zhou, Q. P., and Niu, S. L.: Evidence for the acclimation of ecosystem photosynthesis to soil moisture, Nat. Commun., 15, 9795, https://doi.org/10.1038/s41467-024-54156-7, 2024.
Piao, S. L., Huang, M. T., Liu, Z., Wang, X. H., Ciais, P., Canadell, J. G., Wang, K., Bastos, A., Friedlingstei, P., Houghto, R. A., Quéré, C. L., Liu, Y. W., Myneni, R. B., Peng, S. S., Pongratz, J., Sitch, S., Yan, T., Wang, Y. L., Zhu, Z. C., Wu, D. H., and Wang, T.: Lower land-use emissions responsible for increased net land carbon sink during the slow warming period, Nat. Geosci., 11, 739–743, https://doi.org/10.1038/s41561-018-0204-7, 2018.
Quansah, E., Mauder, M., Balogun, A. A., Amekudz, L. K., Hingerl, L., Bliefernicht, J., and Kunstmann, H.: Carbon dioxide fluxes from contrasting ecosystems in the Sudanian savanna in West Africa, Carbon Balance Manage., 10, 1, https://doi.org/10.1186/s13021-014-0011-4, 2015.
Ruimy, A., Jarvis, P. G., Baldocchi, D. D., and Saugier, B.: CO2 fluxes over plant canopies and solar radiation: a review, Adv. Ecol. Res., 26, 1–68, https://doi.org/10.1016/s0065-2504(08)60063-x, 1995.
Sha, Z. Y., Bai, Y. F., Li, R. R., Lan, H., Zhang, X. L., Li, J., Liu, X. F., Chang, S. J., and Xie, Y. C.: The global carbon sink potential of terrestrial vegetation can be increased substantially by optimal land management, Commun. Earth Environ., 3, 8, https://doi.org/10.1038/s43247-021-00333-1, 2022.
Shen, R., Zhang, J. L., He, B., Li, F., Zhang, Z. M., Zhou, R., and Ou, X. K.: The structure characteristic and analysis on similarity of grassland community in dry-hot valley of Yuanjiang, Ecol. Environ. Sci., 19, 2821–2825, https://doi.org/10.16258/j.cnki.1674-5906.2010.12.011, 2010.
Sulman, B. N., Roman, D. T., Yi, K., Wang, L. X., Phillips, R. P., and Novick, K. A.: High atmospheric demand for water can limit forest carbon uptake and transpiration as severely as dry soil, Geophys. Res. Lett., 43, 9686–9695, https://doi.org/10.1002/2016GL069416, 2016.
Tang, J. W., Niu, B., Hu, Z. G., and Zhang, X. Z.: Increasing susceptibility and shortening response time of vegetation productivity to drought from 2001 to 2021, Agr. Forest Meteorol., 352, 110025, https://doi.org/10.1016/j.agrformet.2024.110025, 2024.
Tarin, T., Nolan, R. H., Eamus, D., and Cleverly, J.: Carbon and water fluxes in two adjacent Australian semi-arid ecosystems, Agr. Forest Meteorol., 281, 107853, https://doi.org/10.1016/j.agrformet.2019.107853, 2020.
Taylor, P. G., Cleveland, C. C., Wieder, W. R., Sullivan, B. W., Doughty, C. E., Dobrowski, S. Z., and Townsend, A. R.: Temperature and rainfall interact to control carbon cycling in tropical forests, Ecol. Lett., 20, 779–788, https://doi.org/10.1111/ele.12765, 2017.
Wang, F., Harindintwali, J. D., Wei, K., Shan, Y. L., Mi, Z. F., Costello, M. J., Grunwald, S., Feng, Z. Z., Wang, F. M., Guo, Y. M., Wu, X., Kumar, P., Kästner, M., Feng, X. J., Kang, S. C., Liu, Z., Fu, Y. H., Zhao, W., Ouyang, C. J., Shen, J. L., Wang, H. J., Chang, S. X., Evans, D. L., Wang, R., Zhu, C. W., Xiang, L. L., Rinklebe, J., Du, M. M., Huang, L., Bai, Z. H., Li, S., Lal, R., Elsner, M., Wigneron, J. P., Florindo, F., Jiang, X., Shaheen, S. M., Zhong, X. Y., Bol, R., Vasques, G. M., Li, X. F., Pfautsch, S., Wang, M. G., He, X., Agathokleous, E., Du, H. B., Kengara, F. O., Brahushi, F., Long, X. E., Pereira, P., Ok, Y. S., Rillig, M. C., Jeppesen, E., Barceló, D., Yan, X. Y., Jiao, N. Z., Han, B. X., Schäffer, A., Chen, J. M., Zhu, Y. G., Cheng, H., Amelung, W., Spötl, C., Zhu, J. K., and Tiedje, J. M.: Climate change: Strategies for mitigation and adaptation, The Innovation Geosci., 1, 100015, https://doi.org/10.59717/j.xinn-geo.2023.100015, 2023.
Wang, N., Quesada, B., Xia, L. L., Butterbach-Bahl, K., Goodale, C. L., and Kiese, R.: Effects of climate warming on carbon fluxes in grasslands – a global meta-analysis, Glob. Change Biol., 25, 1839–1851, https://doi.org/10.1111/gcb.14603, 2019.
Wang, W. Y., Guo, J. X., Wang, Y. S., and Wu, K.: Observing characteristics of CO2 flux and its influencing factors over Xilinhot grassland, J. Meteorol. Sci., 35, 100–107, https://doi.org/10.3969/2013jms.0065, 2015.
Wang, Y. Y., Xiao, J. F., Ma, Y. M., Luo, Y. Q., Hu, Z. Y., Li, F., Li, Y. N., Gu, L. L., Li, Z. G., and Yuan, L.: Carbon fluxes and environmental controls across different alpine grassland types on the Tibetan Plateau, Agr. Forest Meteorol., 311, 1–14, https://doi.org/10.1016/j.agrformet.2021.108694, 2021.
Wang, Z. K., Chen, W., Piao, J. L., Cai, Q. Y., Chen, S. F., Xue, X., and Ma, T. J.: Synergistic effects of high atmospheric and soil dryness on record-breaking decreases in vegetation productivity over Southwest China in 2023, npj Clim. Atmos. Sci., 8, 6, https://doi.org/10.1038/s41612-025-00895-3, 2025.
Weltzin, J. F., Loik, M. E., Schwinning, S., Williams, D. G., Fay, P. A., Haddad, B. M., Harte, J., Huxman, T. E., Knapp, A. K., Lin, G. H., Pockman, W. T., Shaw, R. M., Small, E. E., Smith, M. D., Smith, S. D., Tissue, D. T., and Zak, J. C.: Assessing the response of terrestrial ecosystems to potential changes in precipitation, BioScience, 53, 941–952, https://doi.org/10.1641/0006-3568(2003)053[0941:ATROTE]2.0.CO;2, 2003.
Wen, X. F., Sun, X. M., Liu, Y. F., and Li, X. B.: Effect of linear and exponential fitting on the initial rate of change in CO2 concentration across the soil surface, Chin. J. Plant Ecol., 31, 380–385, https://doi.org/10.17521/cjpe.2007.0046, 2007.
Williams, A. P., Allen, C. D., Macalady, A. K., Griffin, D., Woodhouse, C. A., Meko, D. M., Swetnam, T. W., Rauscher, S. A., Seager, R., Grissino-Mayer, H. D., Dean, J. S., Cook, E. R., Gangodagamage, C., Cai, M., and McDowell, N. G.: Temperature as a potent driver of regional forest drought stress and tree mortality, Nat. Clim. Change, 3, 292–297, https://doi.org/10.1038/nclimate1693, 2013.
Williamson, G. J., Tng, D. Y. P., and Bowman, D. M. J. S.: Climate, fire, and anthropogenic disturbance determine the current global distribution of tropical forest and savanna, Environ. Res. Lett., 19, 024032, https://doi.org/10.1088/1748-9326/ad20ac, 2024.
Xiang, Y. B., Zhou, S. X., Xiao, Y. X., Hu, T. X., Tu, L. H., and Huang, C. D.: Effects of precipitation variations on soil respiration in an evergreen broad-leaved forest during dry and wet seasons, Acta Ecol. Sin., 37, 4734–4742, 2017.
Xu, X. L.: China watershed and river network datasets based on DEM extraction, Resource and Environmental Science Data Registration and Publishing System [data set], https://doi.org/10.12078/2018060101, 2018.
Xu, X. L.: China's multi-year provincial administrative division boundary data, Resource and Environmental Science Data Registration and Publishing System [data set], https://doi.org/10.12078/2023010103, 2023a.
Xu, X. L.: China's multi-year county administrative division boundary data, Resource and Environmental Science Data Registration and Publishing System [data set], https://doi.org/10.12078/2023010101, 2023b.
Yang, K. Y., Gong, H. D., Li, J., Liu, Y. T., Sha, L. Q., Song, Q. H., Jin, Y. Q., Yang, D. X., Li, P. G., Wen, G. J., Chen, A. G., Pang, Z. Q., and Zhang, Y. P.: Dynamic characteristics of soil respiration of savanna ecosystem in dry hot valley of Yuanjiang, J. Zhejiang Agric. For. Univ., 37, 849–859, https://doi.org/10.11833/j.issn.2095-0756.20190647, 2020.
Yang, Z. P. and Chang, Y.: Ecological problems of primary dry valleys is southwest China and advances in the researches into them, Agric. Res. Arid Areas, 25, 90–93, 2007.
Yu, K. and D'Odorico, P.: Hydraulic lift as a determinant of tree–grass coexistence on savannas, New Phytol., 207, 1038–1051, https://doi.org/10.1111/nph.13431, 2015.
Yuan, W. P., Zheng, Y., Piao, S. L., Ciais, P., Lombardozzi, D., Wang, Y. P., Ryu, Y., Chen, G. X., Dong, W. J., Hu, Z. M., Jain, A. K., Jiang, C. Y., Kato, E., Li, S. H., Lienert, S., Liu, S. G., Nabel, J. E. M. S., Qin, Z. C., Quine, T., Sitch, S., Smith, W. K., Wang, F., Wu, C. Y., Xiao, Z. Q., and Yang, S.: Increased atmospheric vapor pressure deficit reduces global vegetation growth, Sci. Adv., 5, eaax1396, https://doi.org/10.1126/sciadv.aax1396, 2019.
Zeng, Z. Q., Wu, W. X., Li, Y. M., Huang, C., Zhang, X. Q., Peñuelas, J., Zhang, Y., Gentine, P., Li, Z. L., Wang, X. Y., Huang, H., Ren, X. S., and Ge, Q. S.: Increasing meteorological drought under climate change reduces terrestrial ecosystem productivity and carbon storage, One Earth, 6, 1326–1339, https://doi.org/10.1016/j.oneear.2023.09.007, 2023.
Zhang, R., Zhao, X. Y., Zuo, X. A., Qu, H., Degen, A. A., Luo, Y. Y., Ma, X. J., Chen, M., Liu, L. X., and Chen, J. L.: Impacts of precipitation on ecosystem carbon fluxes in desert-grasslands in Inner Mongolia, China, J. Geophys. Res.-Atmos., 124, 1266–1276, https://doi.org/10.1029/2018JD028419, 2019a.
Zhang, R. Z.: The dry valley of the Henduan Mountains region, Beijing Sci. Press, ISBN 703002916X, 1992.
Zhang, W. M., Brandt, M., Penuelas, J., Guichard, F., Tong, X., Tian, F., and Fensholt, R.: Ecosystem structural changes controlled by altered rainfall climatology in tropical savannas, Nat. Commun., 10, 671, https://doi.org/10.1038/s41467-019-08602-6, 2019b.
Zhang, Y. J., Qiu, L. P., Gao, H. L., Liu, J., Wei, X. R., and Zhang, X. C.: Responses of ecosystem CO2 exchange to clipping in a semi-arid typical grassland on the Loess Plateau, Acta Ecol. Sin., 40, 336–344, https://doi.org/10.5846/stxb201810172244, 2020.
Zhao, H. C., Jia, G. S., Wang, H. S., Zhang, A. Z., and Xu, X. Y.: Diurnal variations of the carbon fluxes of semiarid meadow steppe and typical steppe in China, Clim. Environ. Res., 25, 172–184, 2020.
Zhao, L., Gu, S., Xu, S. X., Zhao, X. Q., and Li, Y. N.: Carbon flux and controlling process of alpine meadow on Qinghai-Tibetan plateau, Acta Botan. Boreali-Occidentalia Sin., 27, 1054–1060, 2007.
Zou, H., Gao, G. Y., and Fu, B. J.: The relationship between grassland ecosystem and soil water in arid and semi-arid areas: a review, Acta Ecol. Sin., 36, 3127–3136, 2016.