the Creative Commons Attribution 4.0 License.
the Creative Commons Attribution 4.0 License.
 | 06 May 2025
Modeling the contribution of micronekton diel vertical migrations to carbon export in the mesopelagic zone
Hélène Thibault
Frédéric Ménard
Jeanne Abitbol-Spangaro
Jean-Christophe Poggiale
Séverine Martini
Micronekton plays a significant but often overlooked role in carbon transport within the ocean. Using a one-dimensional trait-based model, we simulated the diel vertical migrations (DVMs) of micronekton and their carbon production through respiration, fecal pellets, excretion, and dead bodies. Our model allowed us to explore the biotic and abiotic variables influencing the active transport of carbon in the mesopelagic zone. The functional approach highlighted the importance of size and taxonomy, particularly regarding fishes, crustaceans, and cephalopods as key factors controlling the efficiency of carbon transport. Several metabolic parameters accounted for most of the variability in micronekton biomass, organic carbon production, and transport efficiency, mostly linked to respiration rates and capture efficiency. Our results suggest that, in temperate regions, the export of particles in the mesopelagic zone induced by micronekton is greater in summer, with active carbon transport reaching almost 40 . However, in the context of global warming, the evolution of the impact of micronekton on carbon sequestration remains uncertain. This underscores the imperative for future research to deepen our understanding of micronekton metabolism and vertical dynamics through a functional approach and in relation to their environment.
- Article
(2936 KB) - Full-text XML
-
Supplement
(9803 KB) - BibTeX
- EndNote


The ocean regulates the climate by capturing carbon from the atmosphere through biological and physical pumps (Sarmiento, 2006; Boyd et al., 2019). The biological carbon pump (BCP) exports particulate organic carbon (POC) produced primarily by photosynthetic organisms that convert carbon dioxide into organic matter. This generates a downward flux of carbon (Sigman and Boyle, 2000; Boyd and Trull, 2007) composed of marine snow, phytoplankton detritus, zooplankton and nekton fecal pellets, and dead bodies (Turner, 2002). The export of POC is mainly driven by the gravitational sedimentation of a fraction of particles, ultimately sinking below the euphotic zone. Current estimates suggest this export ranges from 4.0–9.1 Pt C yr−1 (Siegel et al., 2014). However, recent research revealed the significant contribution of the mesopelagic migratory pump (MMP) to carbon sequestration efficiency (Boyd et al., 2019). Migrant organisms are composed of different size classes, including mesozooplankton (0.2–2 mm), macrozooplankton (2–10 mm), and micronekton (10–100 mm). These organisms typically feed near the surface at night and migrate to deeper waters at dawn to avoid visual predators. At these depths, they generate carbon detritus through respiration, egestion of fecal pellets, and mortality (Baird et al., 1975; Clarke, 1983; Longhurst et al., 1990). This ubiquitous movement known as diel vertical migration (DVM) is the Earth's largest animal migration (Hays, 2003). By transporting carbon actively to the deep ocean, the MMP mitigates particle fragmentation and remineralization in the surface layers, thereby enhancing the efficiency of the BCP. This contributes to an estimated carbon export ranging from 0.9–3.6 Pt C yr−1 (Davison et al., 2013) with a sequestration timescale of approximately 250 years (Boyd et al., 2019).
Previous studies focusing on the MMP mainly looked at zooplankton contribution to the BCP (Steinberg and Landry, 2017). However, recent research revealed that micronekton also play a significant role in ocean carbon flux (Saba et al., 2021). These pelagic organisms are described as active swimmers including fishes, large crustaceans, and cephalopods (Brodeur et al., 2019). Despite their lower abundance compared to zooplankton, micronekton can be equally important in driving carbon flux (Pinti et al., 2023). They have greater swimming abilities than mesozooplankton, allowing them to go deeper, where they produce larger particles. Additionally, the longer gut transit time of larger migrant organisms allows the release of fecal pellets after descent into the mesopelagic zone (Pakhomov et al., 1996; Kobari et al., 2008), whereas the shorter gut evacuation rate of zooplankton limits their ability to actively transport carbon to depth (Dagg et al., 1989).
Bioenergetic models are used to estimate carbon fluxes induced by micronekton. These fluxes are highly dependent on micronekton biomass, estimated through in situ methods including trawl sampling and acoustic sounders. Acoustic techniques provide a proxy of organism density, allowing us to distinguish the different scattering layers and their daily dynamics in order to estimate the duration and amplitude of migrations. Trawl net samplings targeting these scattering layers provide data on community composition, including taxonomy, abundance, and size classes (Koslow et al., 1997). These methods used to estimate the contribution of micronekton to the BCP present many uncertainties, mainly due to sampling biases when estimating micronekton biomass using trawling data (e.g., net avoidance, size selectivity) or when using proxies derived from acoustic data. Therefore, these uncertainties have a significant impact on the accuracy of carbon flux estimates and on their spatial variability.
Numerous models have been developed to explore the underlying factors driving the dynamics of DVMs and their impacts on the BCP. Fitness-based models investigate the vertical movements of organisms in the water column by a trade-off between survival, growth, and fecundity. These factors vary in response to environmental conditions. For instance, light intensity influences mortality rates through visual predation, while food concentration affects mortality via starvation. Temperature plays a significant role in generation time, with cooler waters typically reducing reproductive and growth rates. Most of the existing modeling approaches primarily focused on copepod migrations (e.g., Fiksen, 1995; Giske et al., 1997; Han and Straškraba, 1998; Eiane and Parisi, 2001; Bandara et al., 2018) or on common fish species such as Maurolicus muelleri (e.g., Giske and Aksnes, 1992; Rosland and Giske, 1994, 1997). However, a comprehensive approach considering the entire micronekton community is missing.
Global models are used for estimating the impact of organisms on ocean biogeochemistry based on satellite and in situ ocean observations. However, most of these models focusing on the MMP typically represent migrant organisms as a single homogeneous community. These models often assume a uniform distribution of migrant organisms around an isolume of with migration depths constrained by a tolerance of hypoxia estimated at 15 µmol L−1 (Bianchi et al., 2013; Aumont et al., 2018; Archibald et al., 2019; Nowicki et al., 2022). Consequently, migrant organisms are characterized by a simplified set of parameters, reflecting a lack of comprehensive knowledge regarding the diversity of migratory behaviors and physiological traits. DVMs are a ubiquitous phenomenon observed across all oceanic regions, yet the depths and velocities of these migrations vary spatially and temporally (Bianchi and Mislan, 2016). This variability in DVM patterns can be attributed to environmental variables affecting organisms' behaviors, community composition, taxonomy, life stage, and size (Frank and Widder, 1997; De Robertis, 2002; Kaartvedt et al., 2009). Despite the widespread occurrence of DVM, information is missing on the relative importance of different taxonomic groups in the active transport of carbon and how environmental variables influence these carbon fluxes across seasons.
Several regional studies investigated the role of micronekton and their migratory dynamics on the BCP. Most of these studies focused on fish species (Davison et al., 2013; Hudson et al., 2014; Belcher et al., 2019; Woodstock et al., 2022; Aksnes et al., 2023), and some focused on large crustaceans (Andersen and Nival, 1991; Pakhomov et al., 2019; Schukat et al., 2013), but few considered the entire micronekton community (Angel and Pugh, 2000; Hidaka et al., 2001; Ariza et al., 2015; Hernández-León et al., 2019; Kwong et al., 2022; Cotté et al., 2022). These regional studies offer snapshots of specific oceanic processes, yet they frequently overlook temporal variability.
A modeling approach can provide a better understanding of the spatiotemporal dynamics of micronekton, based on in situ observations and insights from models. Micronekton organisms are opportunistic predators that feed on zooplankton, including crustaceans, gelatinous organisms, pteropods, and small fishes (Drazen and Sutton, 2017). These planktivores primarily rely on vision to hunt their prey (Herring, 2001) and take advantage of the contrast created between the illuminated background during the crepuscular periods and the silhouette of their prey (Zaret and Suffern, 1976). Penetration of light in the water column influences the daytime depth of residence for micronekton (Frank and Widder, 2002). Furthermore, the visibility of organisms is strongly related to their size (Aksnes and Giske, 1993); however, the link between size and depth occupation remains poorly understood for micronekton.
An important source of uncertainty in carbon budget models stems from variations in the physiology of mesopelagic organisms across taxonomic groups, size classes, and environmental conditions. Respiration rates can be estimated by empirical models for different taxonomic groups, such as fishes, crustaceans, and cephalopods (Ikeda, 2014, 2016; Belcher et al., 2019), accounting for factors like size, temperature, and depth. However, methods are lacking for estimating the production of large, fast-sinking particles, which could contribute significantly to carbon sequestration in the deep ocean.
Some models attempted to address this issue by focusing on plankton size spectra (Kwong et al., 2020; Serra-Pompei et al., 2022) or on migrating behavior (Lehodey et al., 2010). However, a significant gap exists in our understanding of morphological and physiological traits that drive the greatest variability in both organic and inorganic carbon production along the water column.
Here, we propose a model to investigate the influence of proximal factors on active carbon transport induced by micronekton. The development of a one-dimensional trait-based model with a limited number of variables offers a valuable tool for testing hypotheses and exploring the sensitivity of parameters. While simple models may not fully capture the complexity of interactions between micronekton and their prey, they are an effective way of understanding the influence of some micronekton traits (morphological and physiological) and environmental conditions (e.g., phytoplankton biomass, temperature, light) on carbon export.
This study focuses on characteristic groups of micronekton, including fishes, cephalopods, and large crustaceans of different sizes. The carbon production induced by micronekton was estimated separately for each taxonomic group and by size to investigate their relative impact on carbon transport efficiency in the mesopelagic zone. Sensitivity analyses were conducted to determine the influence of parameters related to micronekton metabolism. Simulations considering daily and seasonal variations in environmental conditions were conducted to evaluate their effects on the BCP. Environmental variables were derived from a long-term time series site, the Porcupine Abyssal Plain Sustained Observatory (PAP-SO), in the northeastern Atlantic Ocean. The APERO cruise, which investigates the biological carbon pump, including trawl and acoustic samplings, was conducted in this region in June–July 2023. Preliminary biological and environmental data from this cruise provided an opportunity to discuss the potential for calibrating the model and to validate our findings. Finally, we explored how this model enhances our understanding of the active transport of carbon by micronekton.
2.1 Vertical distribution modeling
The one-dimensional model used in our study represents the diel vertical migration (DVM) and carbon production by micronekton in the water column. The model comprises three state variables represented in Eq. (1), the resource (P), the consumer's gut (G), and the consumer's biomass (C), with eight associated parameters displayed in Table 1.
P represents the available prey for micronekton. P is conceptualized as a homogeneous community of mesozooplankton constrained in the surface waters (Fig. 1). We assume here that the mesozooplankton are not migrating. C corresponds to one of the three taxonomic groups – fishes (F), crustaceans (A), and cephalopods (S) of average size – ranging from 10–80 mm, depending on the simulation. These taxonomic groups interact with P when they co-occur at the surface layer. The biomass of the resource varies according to logistic growth dynamics, characterized by a maximal growth rate ρ and a carrying capacity K, which are correlated to the phytoplankton biomass.
Jager and Ravagnan (2016)Anderson et al. (2019)Pauly and Christensen (1995)Beseres et al. (2006)Lipiński (1987)Pakhomov et al. (1996)Ikeda (1996)Boyle and Rodhouse (2008)Lasker (1966)Pauly et al. (2021)Pauly et al. (2021)Zhang and Dam (1997)Brett et al. (1979)Brett et al. (1979)Torres and Childress (1983)Brett et al. (1979); Hudson et al. (2014)Mayzaud et al. (2005)Birk (2018)Table 1Micronekton model parameters from the literature for the different taxonomic groups – resource (P), fishes (F), crustaceans (A), and cephalopods (S) – and the range associated when available in the references. “Type” corresponds to the taxon associated with the parameter in the study cited (“Source”), and “Group” corresponds to one of the three taxonomic groups used in the simulations.
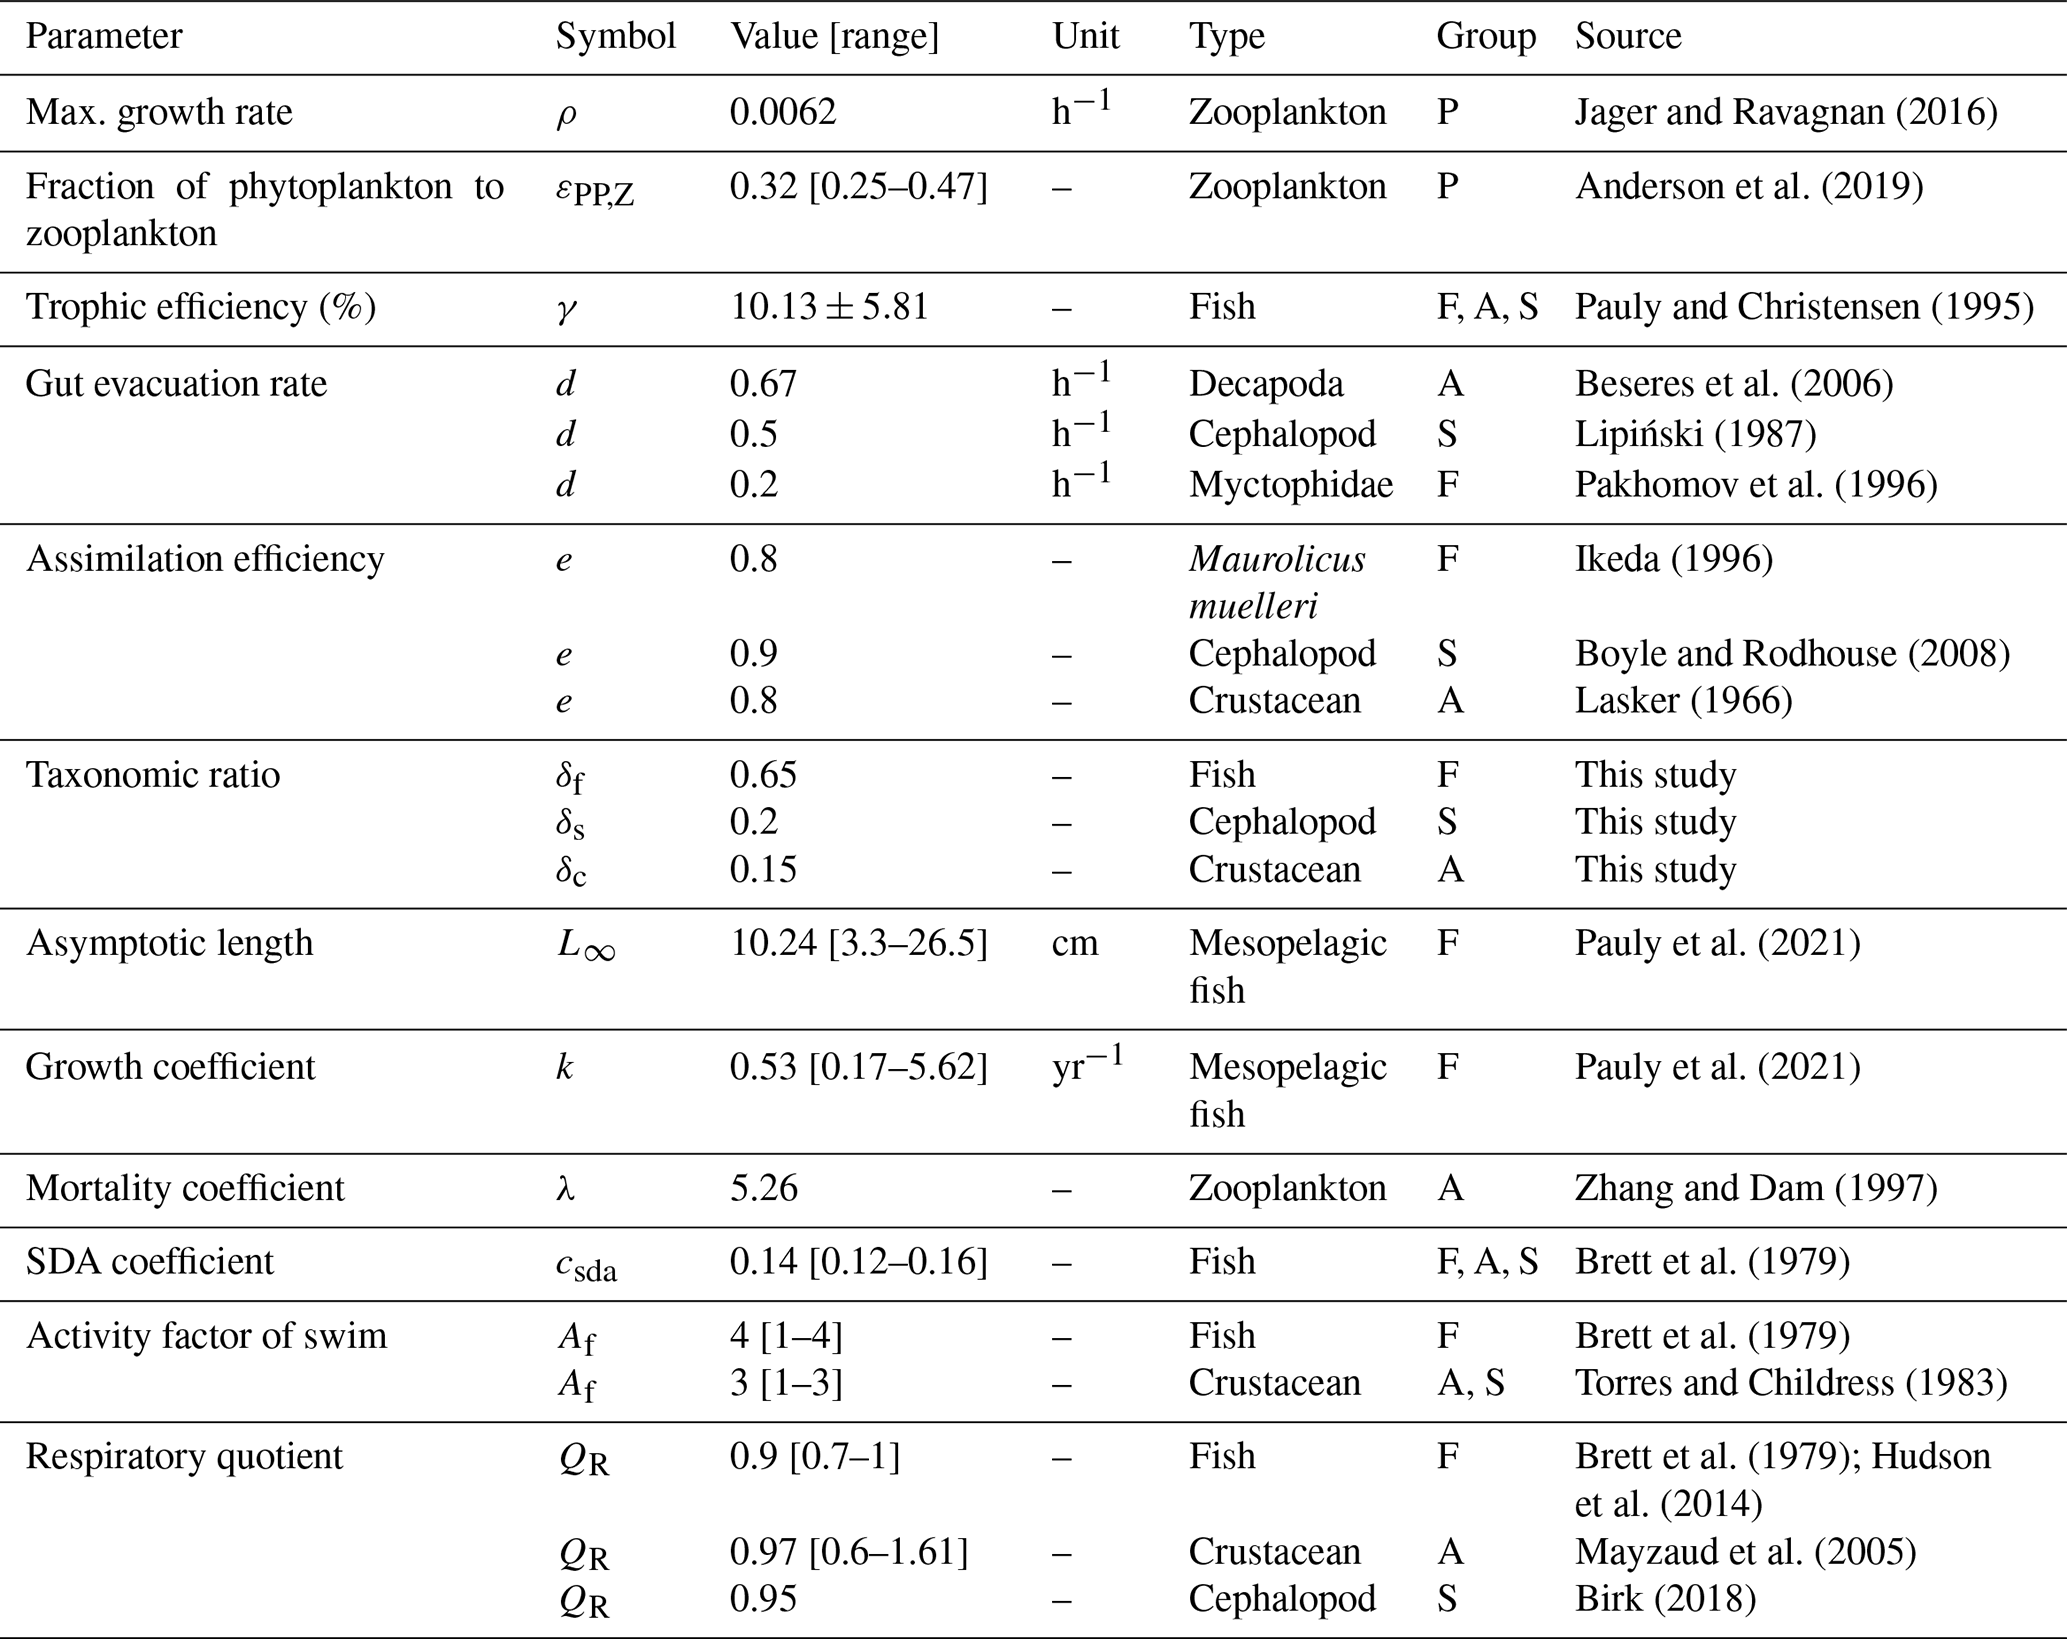
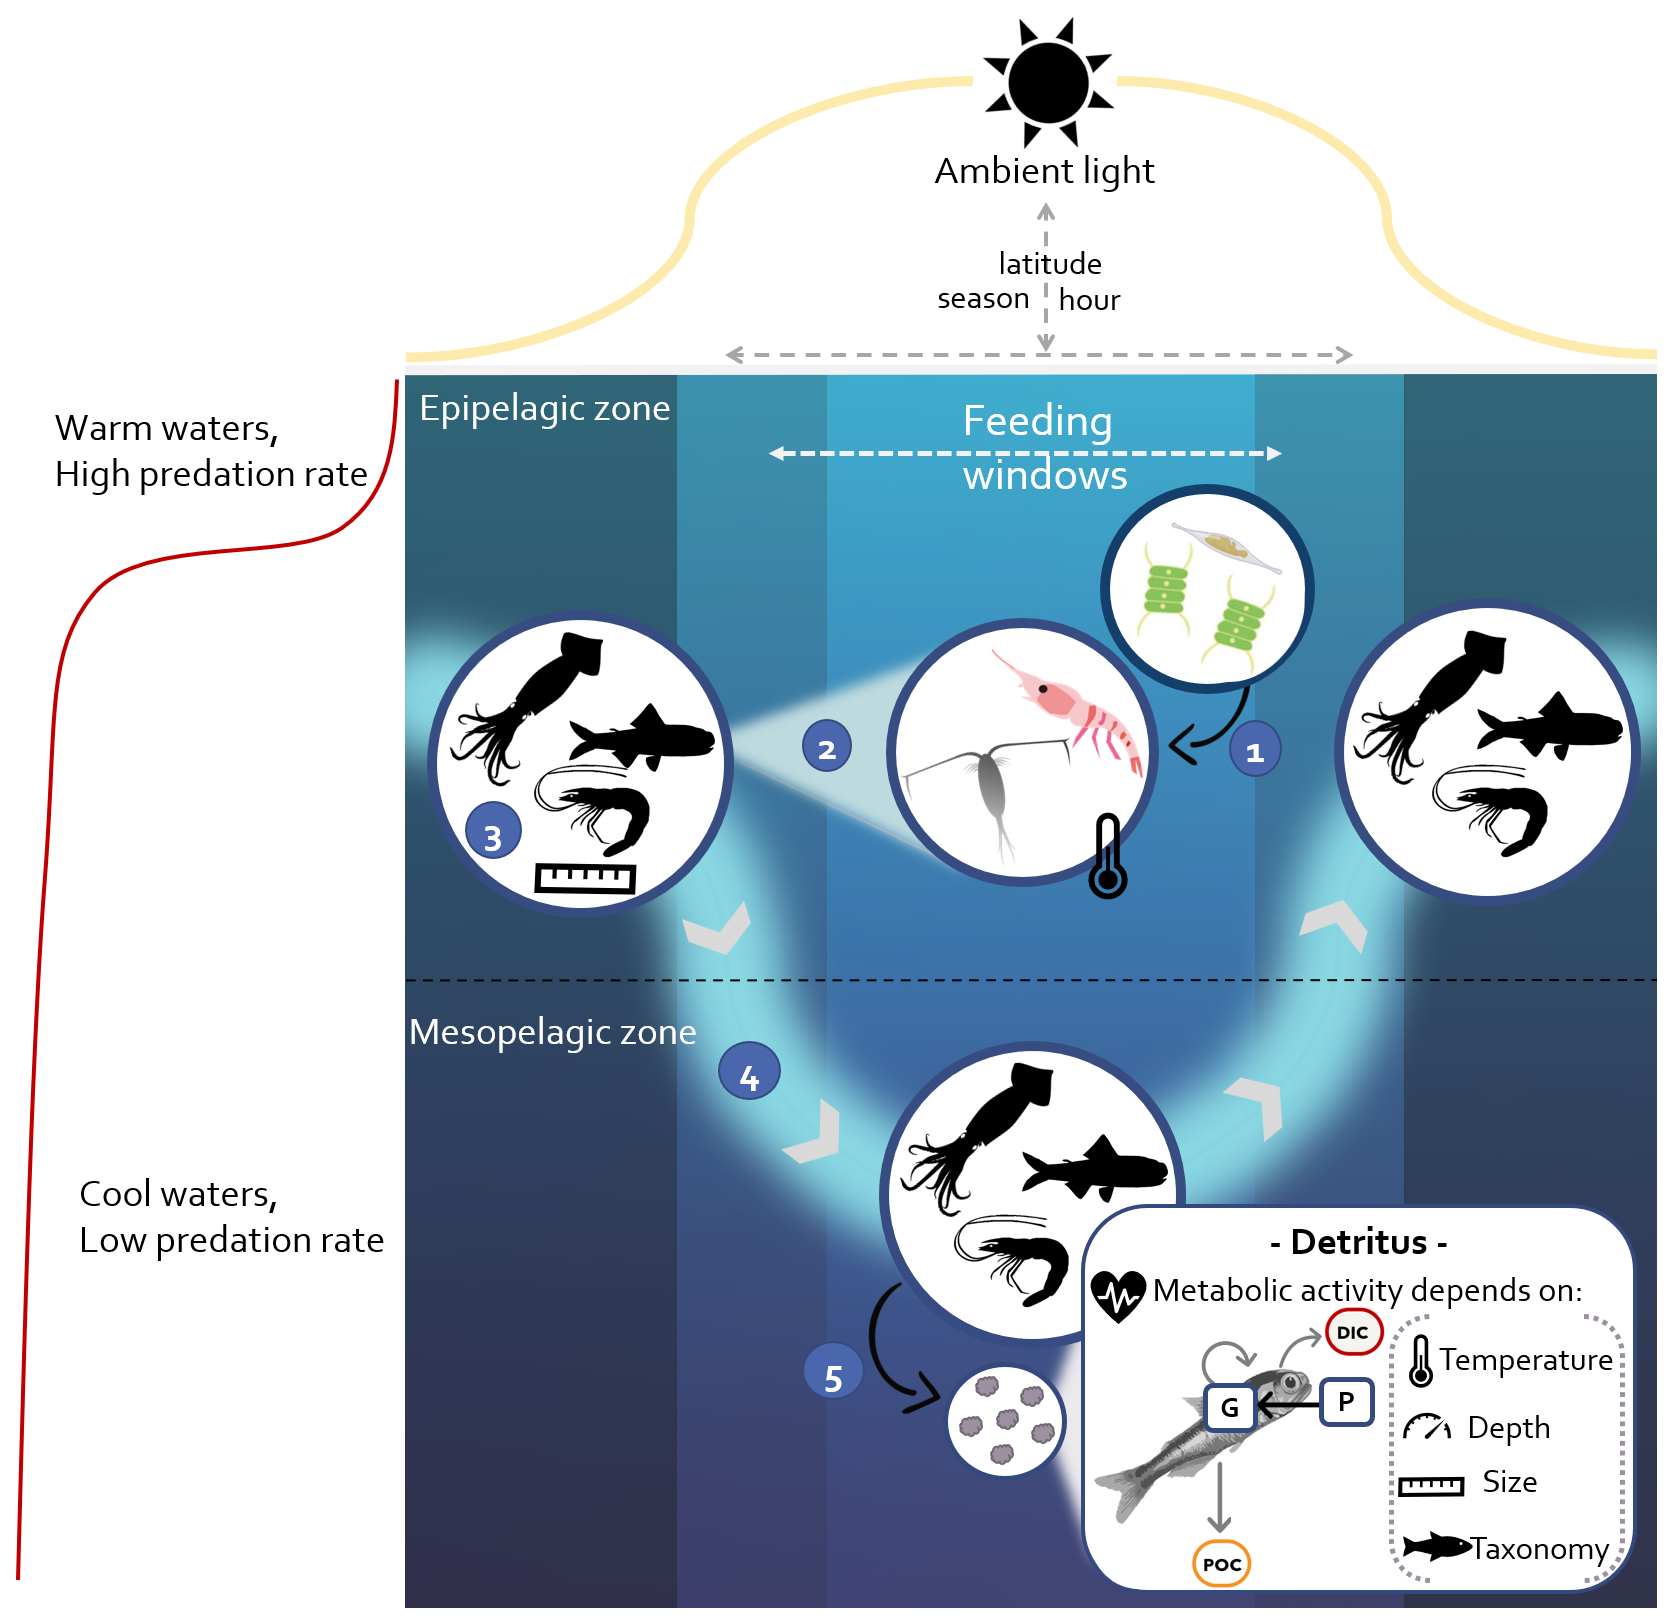
Figure 1Conceptual diagram of the model. ① Zooplankton growth depends on phytoplankton biomass and is temperature-dependent. ② Micronekton use visual predation to hunt zooplankton. ③ Simulations are set for one taxonomic group (fishes, cephalopods, or crustaceans) for a given size. ④ DVM is triggered by the rate of change in light. Migration speed depends on light variation, size, and taxonomy. ⑤ The resource (P) ingested is transferred to the gut (G). One part is assimilated for growth, and the other part is released as fecal pellets. Micronekton produce detritus along the water column, composed of dissolved inorganic carbon (DIC) via respiration (Dm) and particulate organic carbon (POC) including fecal pellets (Dg) and dead bodies (Dμ).
The transfer of biomass from the resource to the consumer is governed by a Holling type II functional response, characterized by a visual capture rate (αv in Eq. 4) and a saturation parameter (β=0.01). Here, instead of being directly assimilated into the consumer's biomass, the ingested food is transferred to the consumer's gut. A proportion e of the ingested food is then assimilated at a rate d, represented by the term edG (see Table 1 for a detailed parameter description). The biomass losses of C include metabolic products (Dm defined in Eq. 5) and mortality (μC).
The numerical method employed to solve this purely advective model is a first-order upwind scheme. This numerical scheme is chosen for its stability and simplicity, offering first-order accuracy in both space and time. The scheme operates under the Courant–Friedrichs–Lewy (CFL) condition to ensure stability; i.e., , where w is the swimming speed, dt is the time step (0.1 h), and dz is the depth step (0.2 m).
The swimming speed (w in m h−1) is assumed to depend on the swimming abilities of the migrant organisms, their size, and the gradient of surface irradiance (I0; modeled in the Supplement). Migrant organisms leave the surface only when the light gradient exceeds a threshold (Δmig=0.1), allowing them to feed more efficiently at sunrise, before descending to depth and before sunset when they return to the surface. According to these assumptions, the swimming speed during the day is modeled as follows:
where w0 represents the maximum swimming speed during the migration phases (wmax) normalized by the maximum light gradient and zmin is the minimum depth at which the maximum abundance of C occurs. The maximum swimming speed is a function of aswim, the swimming coefficient depending on the taxonomic group (see Table 2), and the body length L (cm):
The visual predation rate αv varies in response to light penetration in the water column following the Beer–Lambert law,
where I(t,z) is the irradiance at depth z at a given time t of the day and ψ is the attenuation coefficient (ψ=0.05). The irradiance is then multiplied by a scaling coefficient cα depending on the simulation (see Tables S3 and S4 in the Supplement).
The variation in the saturation parameter (β) showed no distinct influence on P and C.
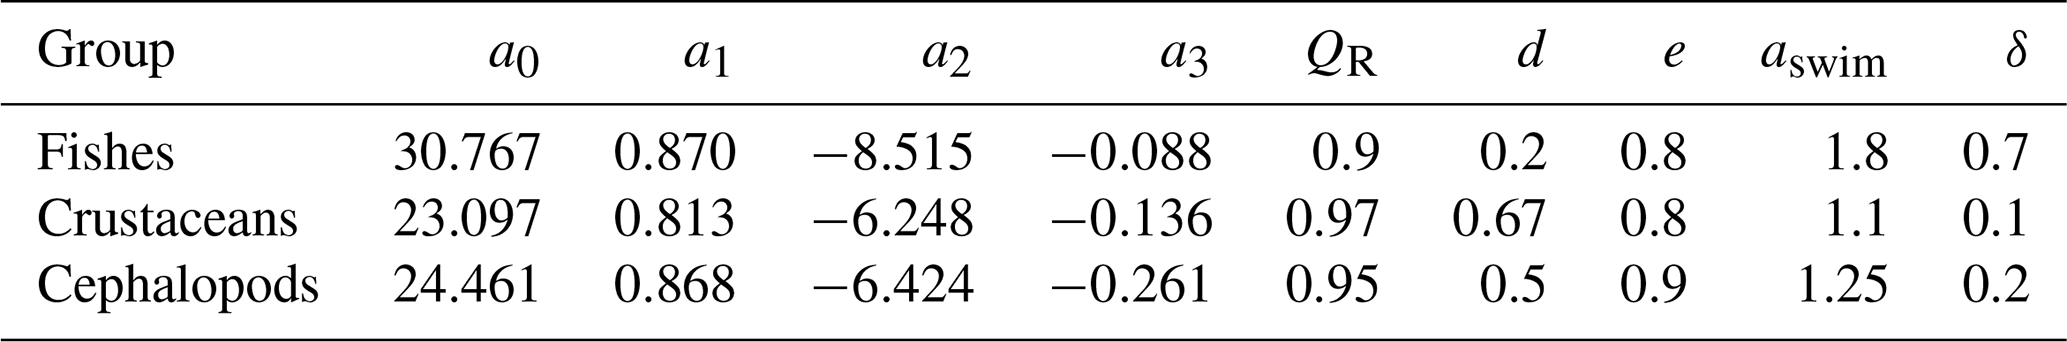
Table 2Taxonomic-dependent parameters of the model for the three different consumers, including fishes, crustaceans, and cephalopods. More details about their range and the citations associated are displayed in Table 1.
The detritus produced by the metabolic activity of C is composed of fecal pellets (Dg), which are the rest of the non-assimilated food; the maintenance products (Dm), which represent the production of carbon expended by the consumer for maintaining its physiological functions (more details in the next section); and the dead bodies (Dμ).
2.2 Bioenergetic model
2.2.1 Metabolic costs
Energy costs associated with micronekton metabolism can be estimated based on the rate of respiration, reflecting the catabolic processes of individuals. Micronekton organisms exhibit varying metabolic rates depending on their activity levels throughout the day. Firstly, the basal activity is composed of the standard metabolic rate (SMR), when the organisms are at rest, and the routine metabolic rate (RMR), corresponding to a minimal activity, when the micronekton swim locally. Secondly, the active metabolic rate (AMR) corresponds to a high catabolic activity, when the organisms swim actively, typically during the migration phases. Finally, the specific dynamic action (SDA) represents the energy expenditure associated with feeding-related activities, including the digestion and assimilation of ingested food (see Eq. 5).
The maintenance rate (m in h−1) in Eq. (5), is expressed as the sum of the RMR (RC) and the AMR (RS),
The SDA is proportional to the amount of food assimilated, expressed in Eq. (5) by the term edG csda, which corresponds to 14 % of assimilated amount (Brett et al., 1979).
For crustaceans, metabolic costs represent losses due to respiration and excretion, while the amount of DOC produced by fishes can be negligible (Davison et al., 2013; McMonagle et al., 2023). Cephalopods are not known to excrete DOC either, and the production of mucus has never been quantified (Boyle and Rodhouse, 2008). Excretion of DOC for crustaceans represents 31 % of CO2 respired (Steinberg et al., 2000). For simplification, the part of DOC produced by crustaceans was added to the respiration in the results as part of the dissolved carbon production (Dm). RMRs () of pelagic marine fishes, crustaceans, and cephalopods are expressed as a function of body mass, temperature, and depth (Ikeda, 2016, 2014). We used a multiple regression model, with coefficients varying by taxonomic groups (see Table 2).
where MC is the body mass (mg C), T is the habitat temperature (K), and D is the depth (m). The following equation is applied to convert to the carbon production rate (RC in h−1):
where is the mass of carbon (12 g) in 1 mol (22.4 L) of CO2 and QR is the dimensionless respiratory taxonomic-dependent quotient (Table 2).
During migrations, swimming activity generates a catabolic cost. According to Brett et al. (1979), the AMR is equal to 4 times the basal metabolic rate for fishes. Here, we derived it from the RMR, equivalent to twice the SMR, when migrant organisms reach their maximum swimming speed (wmax). This AMR (RS) is calculated from a linear relationship between swimming speed and basal metabolic rate proposed by Torres and Childress (1983):
2.2.2 Mortality rate
The mortality rate (μ in d−1) was calculated differently according to the taxonomic group. For marine fishes, the mortality rate is defined as an allometric relationship (Lorenzen et al., 2022):
where L is the body length (cm) and L∞ and k the parameters from Von Bertalanffy growth models estimated from an average of Myctophidae values available in FishBase (Pauly et al., 2021).
For crustaceans, the mortality rate is defined from Zhang and Dam (1997), adapted from Peterson and Wroblewski (1984),
where WD is the dry weight (g) and λ is the mortality coefficient (Table 1).
All cephalopods except Nautilidae are known to have a particular life cycle with a single episode of reproduction leading to the death of the organism. The lifespan is 1 or 2 years, which corresponds to an average mortality rate around .
2.3 Modeling environment variations
The model environment is characterized by several key variables, including temperature, phytoplankton biomass, and light availability, all of which vary with depth, on a daily basis, and over the course of the year. These environmental factors play crucial roles in shaping the distribution, behavior, and physiology of micronekton organisms, as developed in the following sections.
2.3.1 Temperature-dependent process
The effects of temperature on physical and physiological processes are implemented as factors affecting the growth rate of zooplankton. The factor Q10 is used to model the effects of temperature on each corresponding parameter based on the Van 't Hoff rule, which states that a change in the temperature T by 10 °C will multiply the rate ρ at the reference temperature Tref by a factor Q10:
where T is the temperature and ρref is the rate at the reference temperature. A Q10=3 is used for the physiological processes of zooplankton (Hirst et al., 2003), with and Tref=15 °C as reference values. The effect of temperature on the gut evacuation rate was not taken into account, as it induces a negligible variation for the temperature interval considered in this study, based on the relationship established in Pakhomov et al. (1996).
2.3.2 Modeling irradiance
Surface irradiance (I0) is modeled to define the rate of change in light that triggers DVMs (Fig. 2).
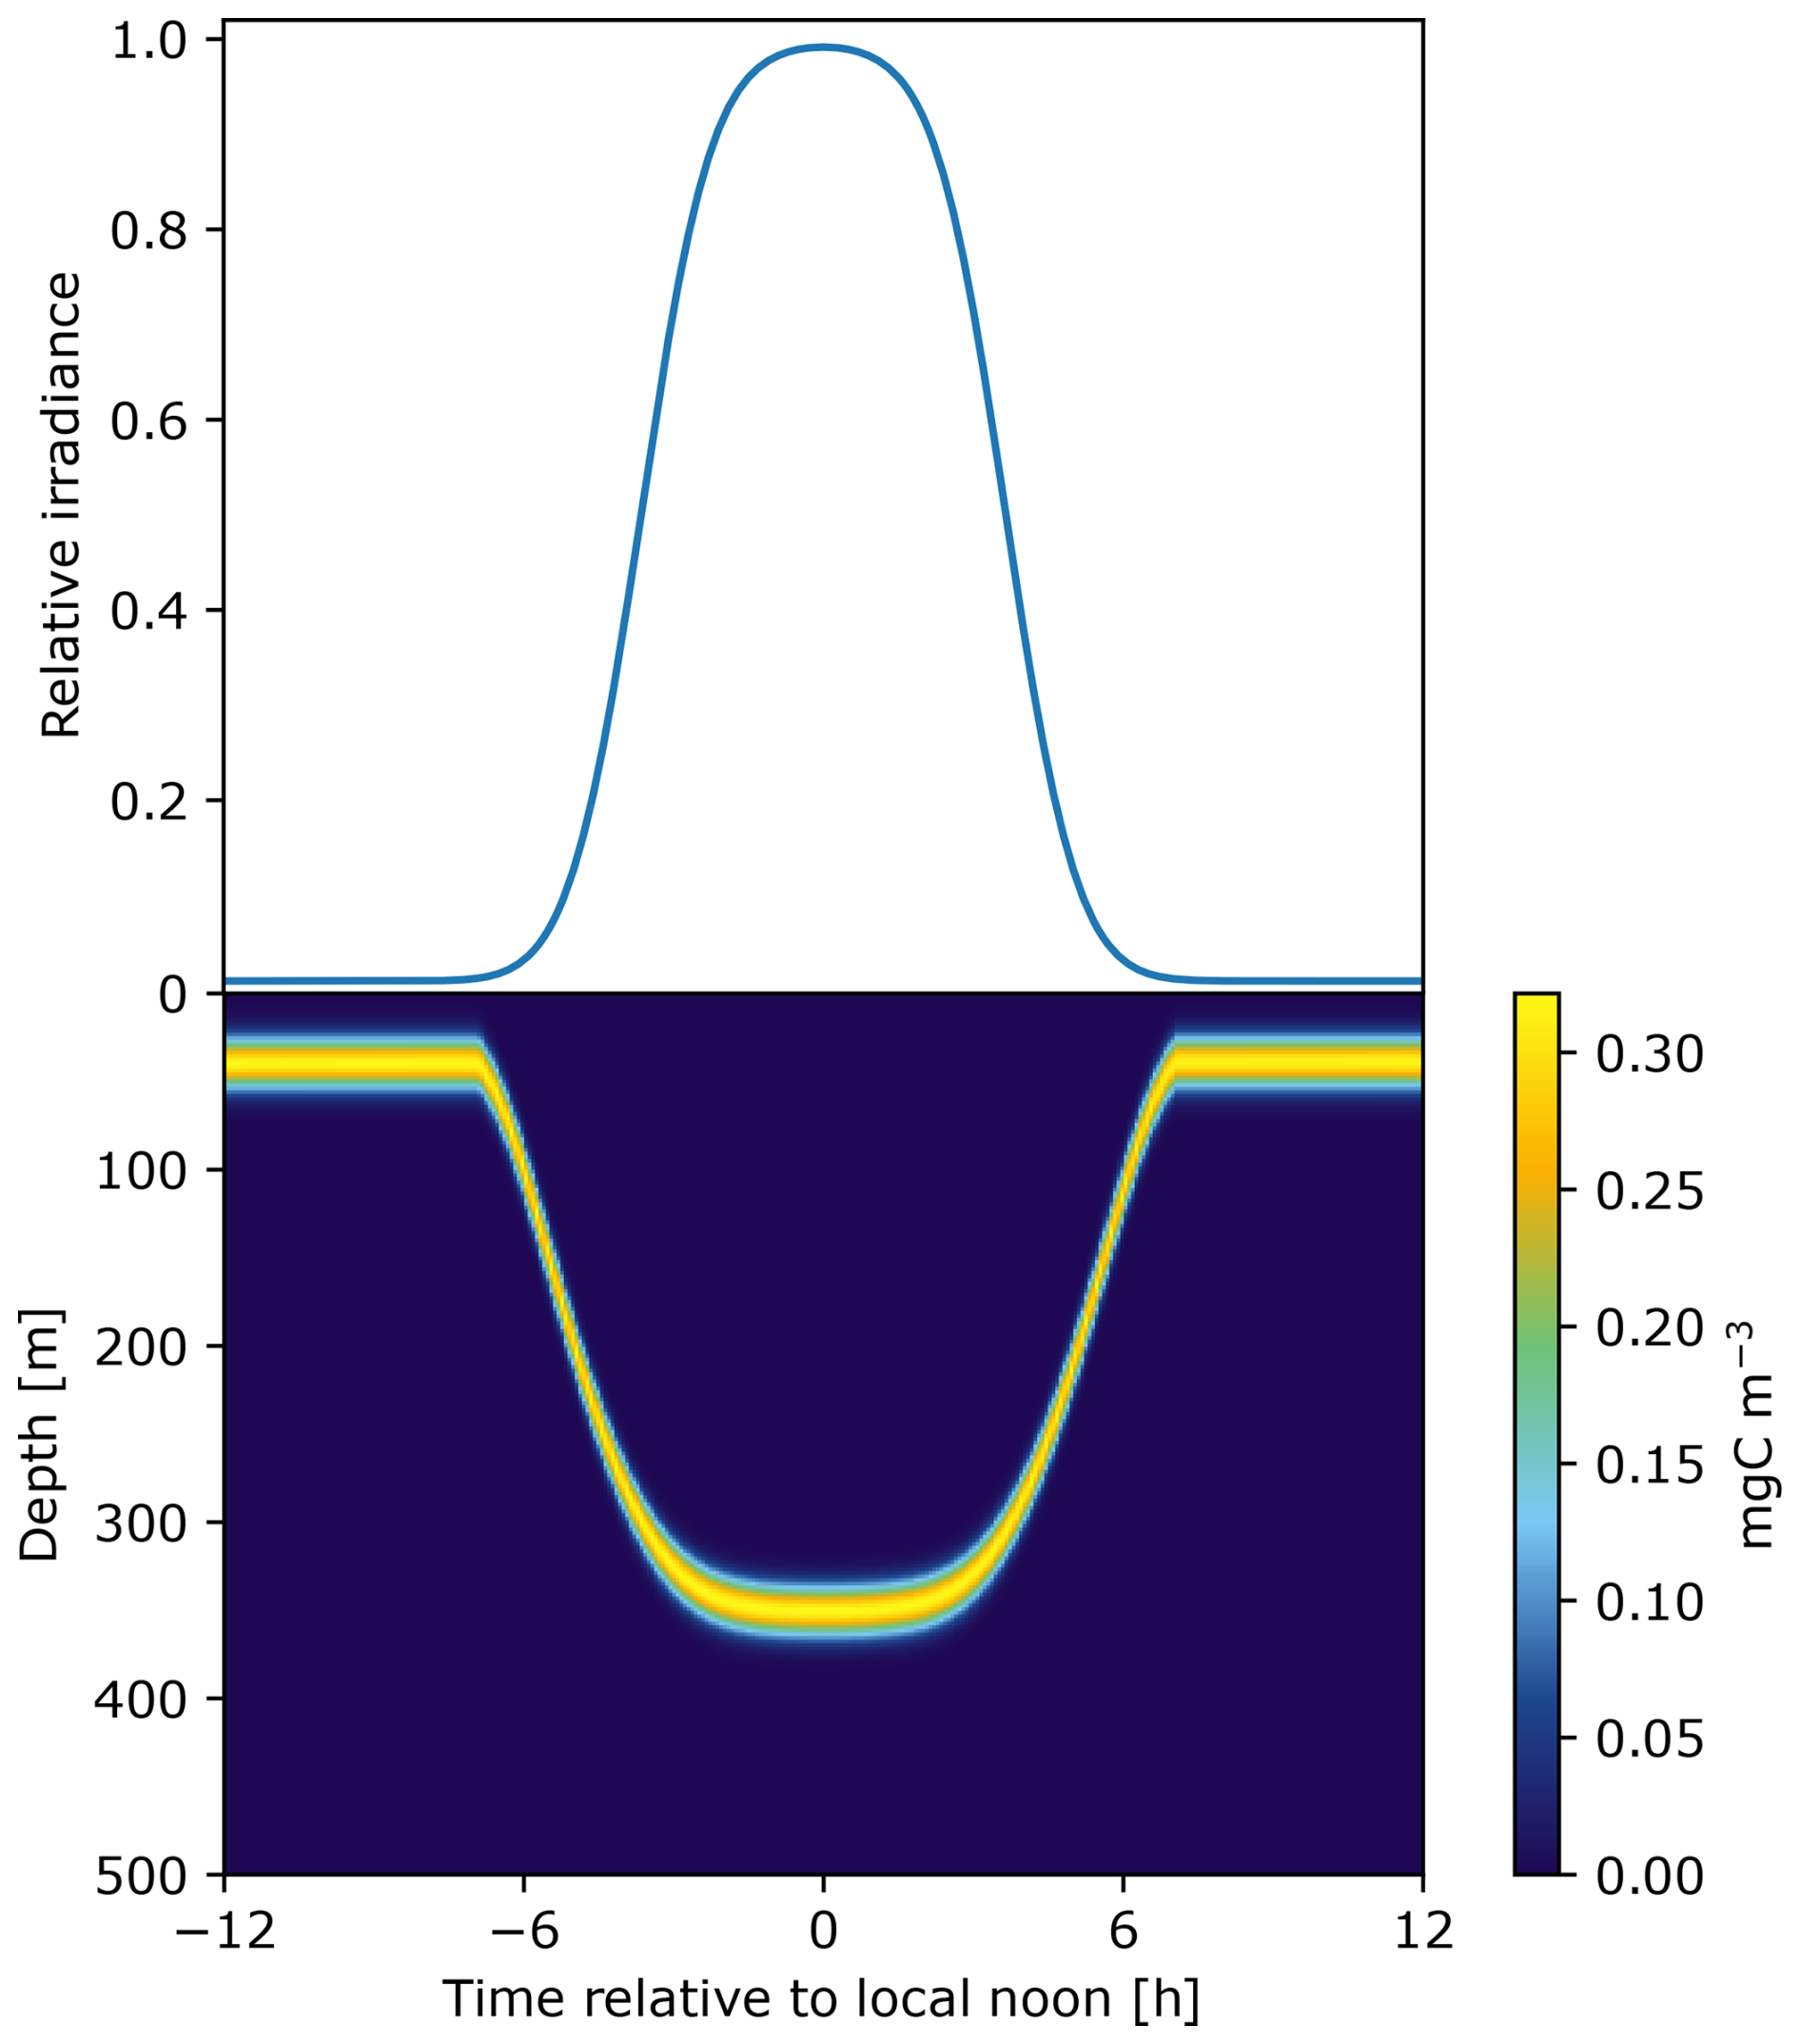
Figure 2Surface irradiance on top is used as a trigger of DVM that defines the relative migration speed. The time of descent corresponds to a positive speed and the time of ascent corresponds to a negative speed during the crepuscular periods. This results in a pattern of diel vertical migration over 24 h as an example here for a community of fish measuring 40 mm.
The light is then modeled in depth to constrain the visual capture rate (see Eq. 4), as a function of chlorophyll concentration. All the equations used to model irradiance at the surface and at depth are described in Sect. S2 of the Supplement.
2.3.3 Environmental data at PAP-SO (48°50′ N, 16°30′ W)
Environmental conditions are set from the Porcupine Abyssal Plain Sustained Observatory (PAP-SO; at 48°50′ N, 16°30′ W; 4850 m water depth). It is part of the North Atlantic Drift, characterized by large spring and secondary late summer/autumn blooms generating a high export of carbon, with light and/or nutrient limitation during the rest of the year (Sutton et al., 2017). All data were interpolated to fit the simulation grid for 1 year with a time step of 0.1 h from the surface to 1000 m depth with 0.2 m intervals.
Temperature data, which contain the three-dimensional monthly mean potential temperature with depth resolution, were collected from Global Ocean Physics Analysis and Forecast of the EU Copernicus Marine Environment Monitoring Service (CMEMS) Marine Data Store (MDS) (https://doi.org/10.48670/moi-00016; Copernicus Marine Service, 2024).
The mole concentration of phytoplankton expressed as carbon in sea water (PHYC) was collected from the Atlantic-Iberian Biscay Irish- Ocean Biogeochemical Analysis and Forecast (EU Copernicus Marine Service, Marine Data Store, https://doi.org/10.48670/moi-00028).
The IBI36 system provides a depth-simulated phytoplankton concentration expressed as carbon per unit volume in sea water compared to four algorithms (VGPM, Eppley-VGPM, CbPM, and Cafe), built on the satellite data. Mole concentrations (mmol C m−3) were converted in carbon mass (mg C m−3).
The mixed-layer depth (MLD) is generated using monthly mean data from the Atlantic-Iberian Biscay Irish- Ocean Physics Analysis and Forecast (EU Copernicus Marine Service, Marine Data Store, https://doi.org/10.48670/moi-00027). The MLD was regarded as the export depth to calculate the efficiency of POC transport by micronekton for simulations considering seasonal variations in the environment. The micronekton carbon export ratio (MCE ratio) was then computed as the integrated biomass of fecal pellets and dead bodies under the MLD divided by the integrated phytoplankton biomass in the surface layers.
2.4 Sensitivity analysis
A sensitivity analysis of model outputs was conducted to assess the impact of parameters related to metabolic rates for each taxonomic group (fishes, crustaceans, cephalopods) on carbon production and export. Indeed, metabolic parameters were compiled from the literature and used in the empirical relationships (Eqs. 7, 10, and 11), allowing us to test the influence of the variability in metabolic costs on carbon transport. Simulations were carried out separately for each taxonomic group, assuming a standardized size of individuals of 30 mm. The sensitivity of the model parameters focused on three key model outputs, including (1) micronekton biomass, potentially linked to the induced carbon production by micronekton; (2) the POC production comprising fecal pellets and dead bodies that sediment and sequester carbon at depth in the water column; and (3) the efficiency of POC transport below 200 m, as the average annual MLD at PAP-SO (MCE ratio200). This metric is calculated as the total production of POC under 200 m depth divided by the integrated phytoplankton biomass in the surface layers. This allows us to investigate the link between the estimation of the biomass of micronekton and their efficiency to transport carbon, which originates from the phytoplankton biomass at the surface.
The model parameters are sourced from the literature and their ranges (Table 1), with standard deviations associated with the respiration coefficients (Table S2 in the Supplement). In cases where ranges were not available, a variation of 25 % is applied, according to the range observed for other parameters.
Bioenergetics equations and associated parameters are selected based on size and taxonomic groups, including fishes, crustaceans, and cephalopods. Parameters are chosen from the most common micronekton taxa whenever possible. For instance, Myctophidae is the most widespread family of micronekton fishes performing diel vertical migration (DVM). Micronekton crustaceans primarily consist of shrimps and large euphausiids, while migrant cephalopods belonging to micronekton are predominantly composed of squids and octopuses. These taxonomic considerations are taken into account when selecting appropriate parameters to represent the bioenergetic processes in the model.
Sobol' indices are used to quantify the relative contributions of the metabolic parameters to the model's outputs (Sobol, 2001; Saltelli, 2002; Saltelli et al., 2010). The Sobol' sequence allows us to generate a set of parameters with uniform partition within their range, allowing low-discrepancy Monte Carlo simulations. Total Sobol' indices (STi) were computed to represent the total contribution of each input variable to the overall variance in the model's output, accounting for both direct and interaction effects (Eq. 13). These indices range from zero to 1, with 1 indicating the total variance in the model output.
where Var(E(Y|Xθ)) is the variance in the expected value of the model output Y when the input variable (Xi) is excluded and all other variables are included (Xθ). Var(Y) is the total variance in Y.
A total of 12 parameters were tested, resulting in 1536 simulations for each of the three taxonomic groups. To ensure the robustness of the results, the sensitivity analysis was run twice and produced consistent outcomes. The global sensitivity analysis features provided by SALib (Herman and Usher, 2017; Iwanaga et al., 2022) facilitated the computation of Sobol' indices.
2.5 Size- and taxonomic-dependent simulations
The model is executed individually for each taxonomic group (F, A, S) across various sizes of individuals ranging from 10–80 mm, with the associated parameters listed in Table 2). Specifically, a range between 20 and 80 mm is employed for fishes and cephalopods, while a range between 10 and 50 mm is used for crustaceans. This approach ensured that the model encompassed a diverse range of sizes representative of migrant micronekton organisms, including fishes and crustaceans, based on night epipelagic samples (e.g., Kwong et al., 2018), allowing a comprehensive assessment of the metabolic impacts across different taxonomic groups and size spectra. Size spectrum is challenging to assess for cephalopods (different measurement method, sample damage). Thus, the same size range as fishes is applied, allowing comparison.
The capture rate coefficient (cα) is calibrated to ensure a consistent transfer efficiency (γ) of 10 % between the biomass of consumers and their resources (Table 1). This transfer efficiency is further adjusted using a taxonomic ratio (δ), which allows the estimation of the relative biomass distribution among fishes, crustaceans, and cephalopods within the micronekton community.
Therefore, the value of cα is estimated for each simulation, allowing the calibration for P and C concentrations. This calibration varies according to size, taxonomic group, and seasonal simulation. The values used in each simulation are provided in the Supplement (see Tables S3 and S4).
3.1 Micronekton traits and carbon production
3.1.1 Influence of size and taxonomy on carbon production
Independent simulations involving one taxonomic group of a given size were conducted to study the impact of micronekton on carbon production, without seasonal variation in the environment.
All migrant organisms of different size (fishes, crustaceans, and cephalopods) exhibited surface feeding behavior during the night, where they consumed food resources (Fig. 1). They migrate during the twilight periods and remain at depth for a few hours around local noon. (Fig. 2).
A part of the ingested food was retained in their gut and subsequently released during the descent at depth, as fecal pellets (Fig. 3a–c). The portion of fecal pellets varied greatly according to the taxonomic group and size, with crustaceans and cephalopods showing no significant transport of fecal pellets at depth. For fishes, a significant number of fecal pellets were released at depth during the daytime (Fig. 3a). This resulted in a peak in metabolic activity at depth, due to the cost of digestion (Fig. S2 in the Supplement).
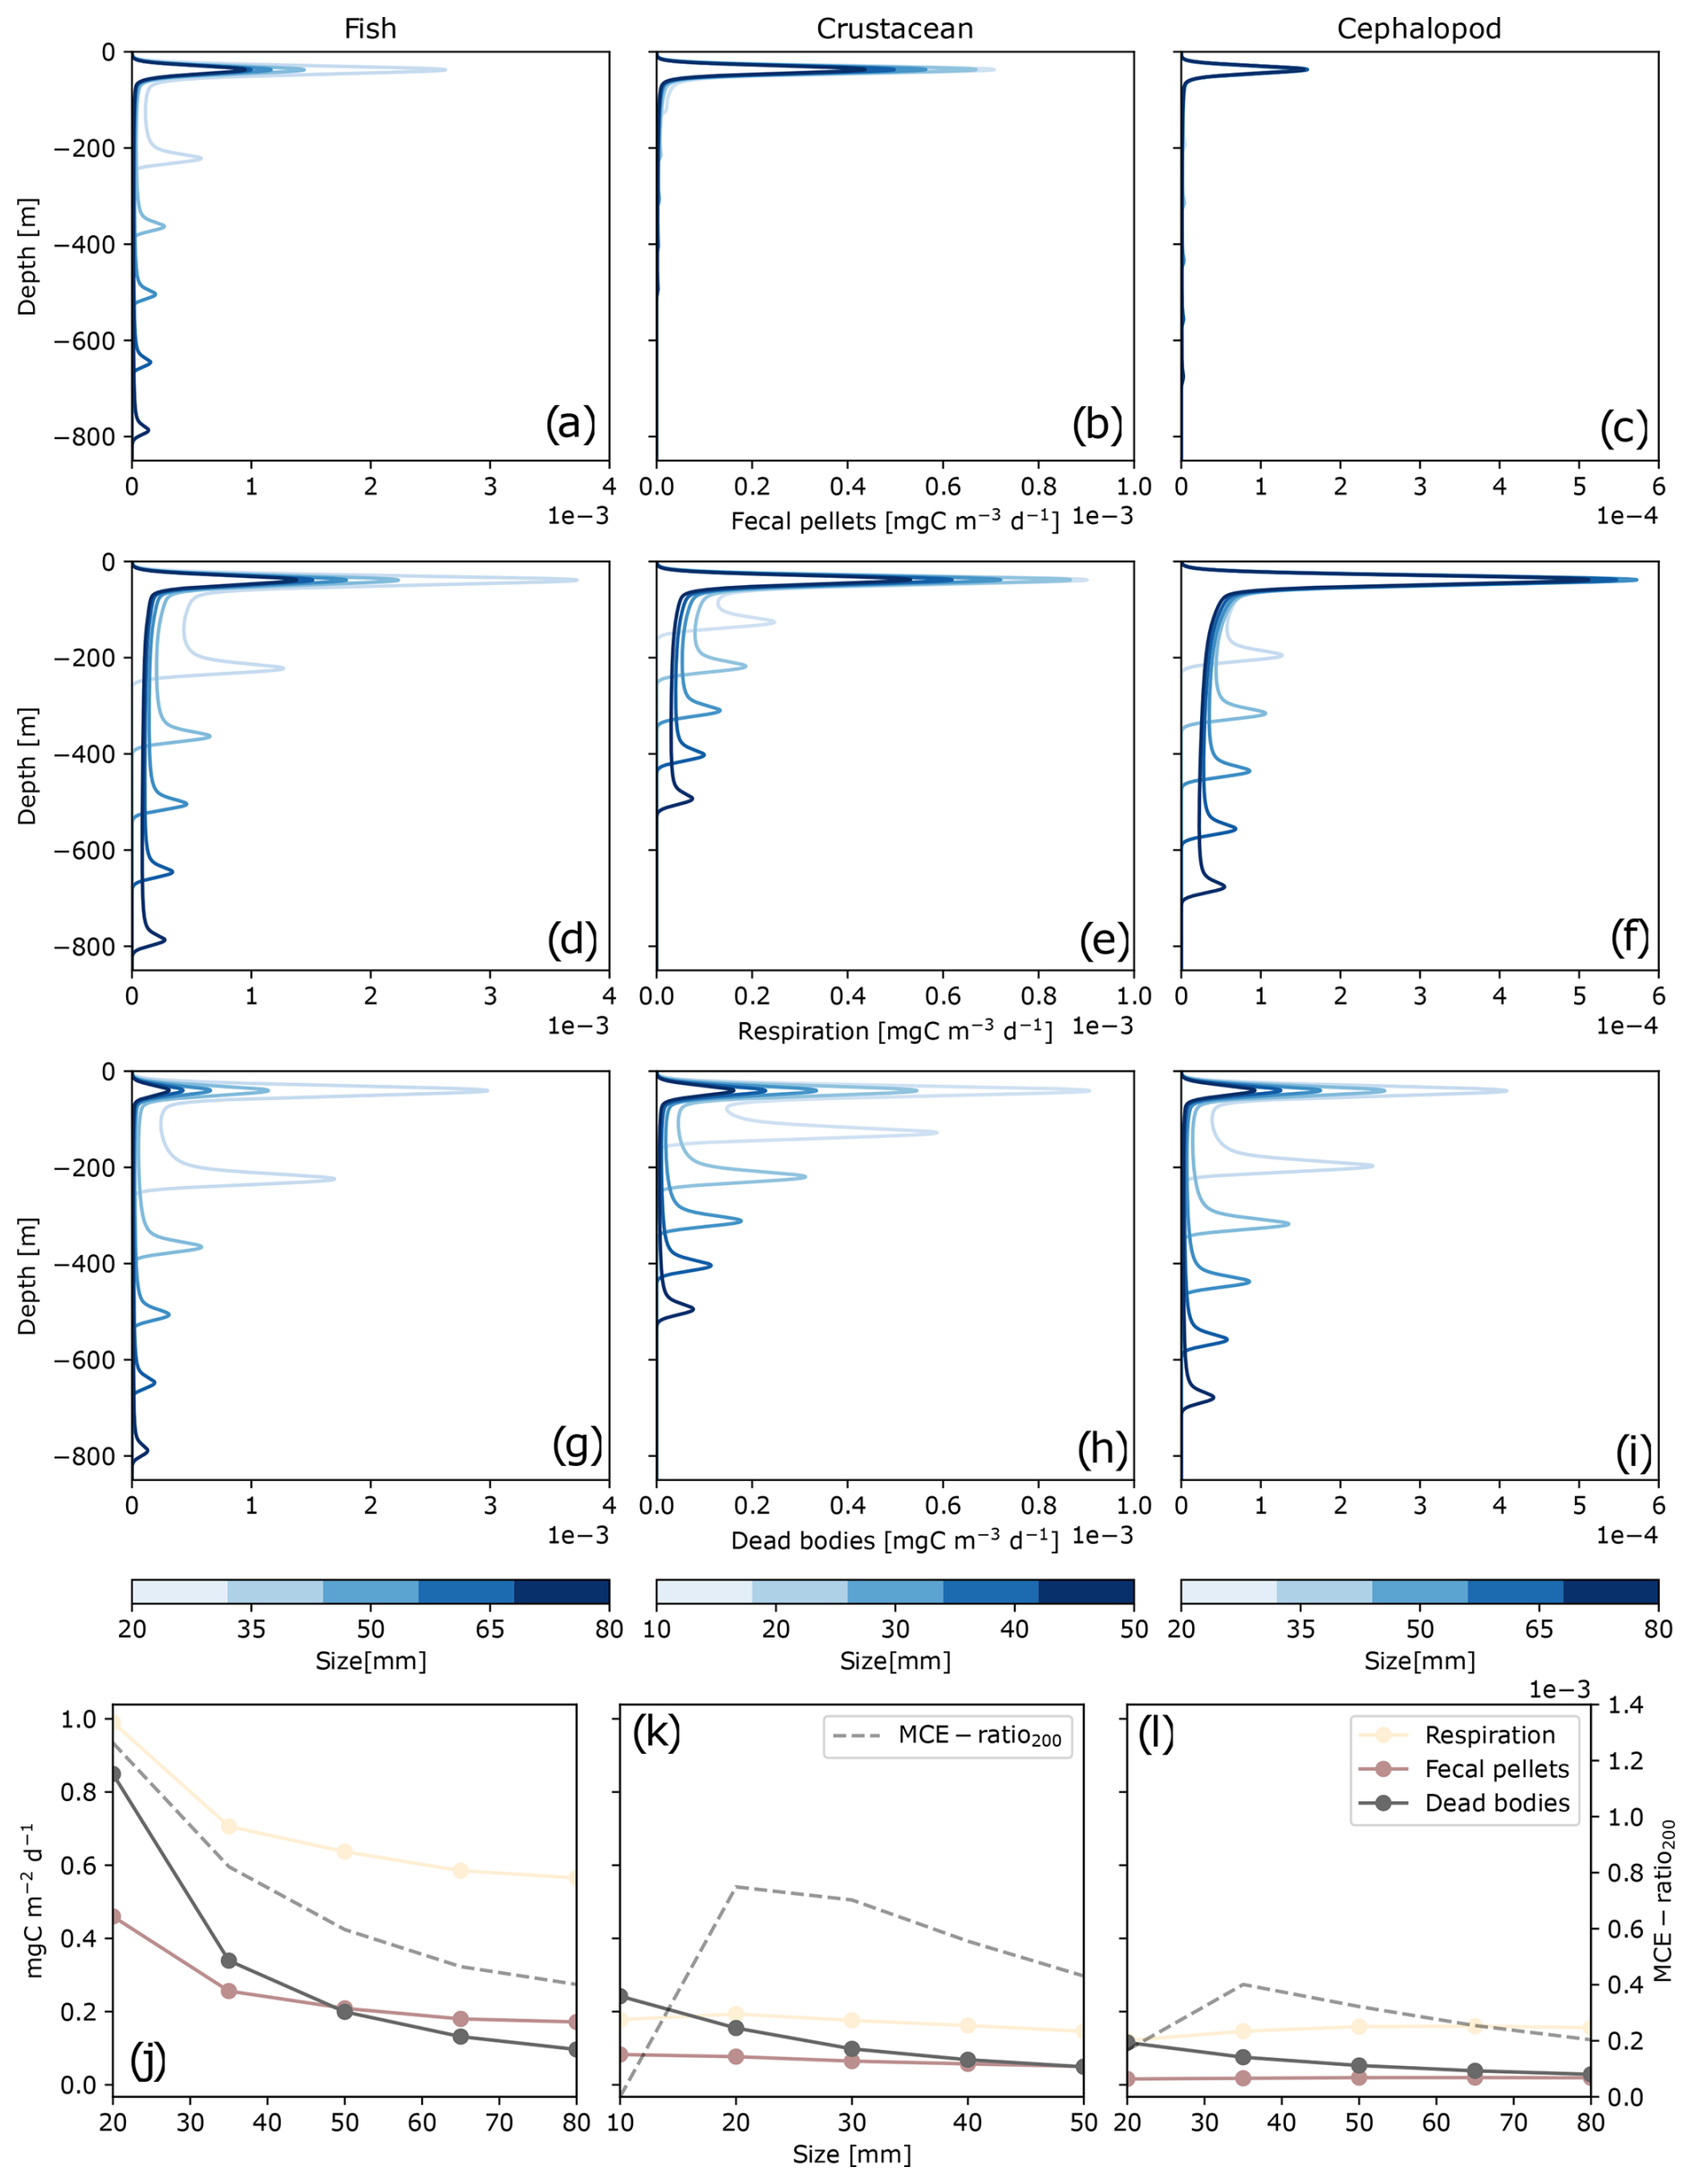
Figure 3Carbon daily production along depth () represented by taxonomic groups – fishes (a, d, g), crustaceans (b, e, f), and cephalopods (c, f, i) – and by size (10–80 mm; indicated by the color bar). Carbon detritus includes fecal pellet production Dg (a–c), released carbon dioxide and dissolved organic carbon Dm (d–f), and dead bodies Dμ (g–i). The bottom panels (j–l) represent the integrated carbon production along depth and the efficiency of POC transfer below 200 m depth (MCE ratio200) as a function of size for fishes (j), crustaceans (k), and cephalopods (l). Each point or each curve represents a single simulation for one taxonomic group of a given size.
Globally, a greater proportion of carbon production was released at the surface, where the organisms reside during the night, through fecal pellets (Dg), metabolic products (Dm), and dead bodies (Dμ) (Fig. 3). Regarding migration depths during the day, fishes ranged between 200 and 800 m depth (Fig. 3a, d, g), from the smallest to the largest individuals. Crustaceans and cephalopods resided at shallower depths during the day, between 100–500 m (Fig. 3b, e, h) and 200–700 m (Fig. 3c, f, i), respectively.
In Fig. 3, each curve corresponds to equivalent concentrations within the same taxonomic group but is composed of individuals with different size. Both size and taxonomy had an impact on the ability of organisms to export carbon. For each taxonomic group, smaller individuals (10 mm for crustaceans or 20 mm for fishes and cephalopods) migrated to shallower depth, above 250 m depth (Fig. 3). Size also influenced each of the three carbon production pools (Dg, Dm, Dμ) induced by fishes, crustaceans, and cephalopods. Smaller individuals produced more carbon globally through Dg, Dm, and Dμ for each taxonomic group (Fig. 3). Size affected the production of Dμ to a greater extent, with smaller individuals having higher mortality rates. To a lesser extent, size also influenced the production of Dg, which was higher for smaller individuals and also for Dm.
Based on the taxonomic ratio of the model (Table 1), the most abundant group of micronekton was fishes (65 %), followed by cephalopods (20 %) and crustaceans (15 %). Fishes produced more carbon detritus than the other groups and at deeper depth layers (Fig. 3). This resulted in a global higher efficiency export of carbon under 200 m (MCE ratio200) (Fig. 3j). Here, this export depth represents the average depth of the mixed-layer depth (MLD) observed at PAP-SO. The MCE ratio200 of crustaceans smaller than 20 mm was null, as they did not reach 200 m depth, and the same applied to some cephalopods of 20 mm. The MCE ratio200 reached its maximum values for intermediate sizes for crustaceans and cephalopods of 20 and 35 mm, respectively (Fig. 3k and l). The highest MCE ratio200 for fishes was observed for the smallest individuals and decreased with size (Fig. 3j).
Larger crustaceans between 35 and 50 mm generated a higher MCE ratio200 than fishes larger than 40 mm. Crustaceans had a similar biomass to cephalopods but produced more Dg and Dμ, with an overall higher MCE ratio200.
The relative contribution of the three types of carbon detritus varied greatly according to the taxonomic group and size, depending on the metabolic activity during the day and the depth of occurrence (Fig. 4, Table S1 in the Supplement). Metabolic products represented the highest production of carbon by micronekton, accounting for 60 % of the carbon metabolized by fishes, 50 % of that metabolized by crustaceans (which also included the excretion of DOC), and 70 % of that metabolized by cephalopods. Cephalopods produced low amounts of fecal pellets, representing less than 10 % of their carbon production. The proportions of carbon products differed between detritus integrated throughout the water column and that found below 200 m. Overall, metabolic products and dead bodies made up a slightly higher proportion below 200 m, while fecal pellets were less abundant across all three taxonomic groups. The difference in fecal pellet proportions was most pronounced in crustaceans, averaging 20.1 % throughout the water column compared to just 2.1 % below 200 m.
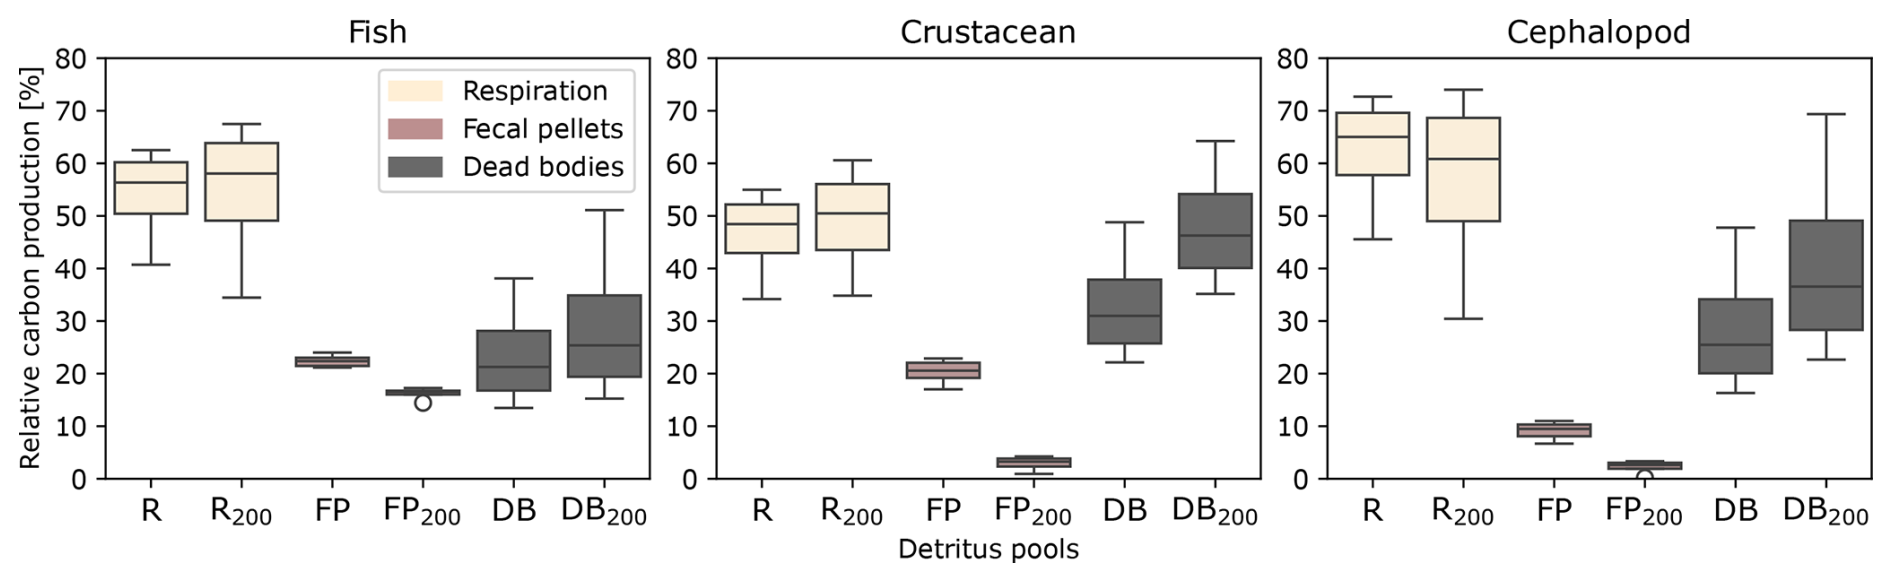
Figure 4Relative contribution of carbon detritus produced by the three taxonomic groups of micronekton (fishes, crustaceans, cephalopods), including the respiration Dm (R,R200), the fecal pellets Dg (FP,FP200), and the dead bodies Dμ (DB,DB200). The proportions represent the integrated production of carbon products over 1 d along the water column (R, DB, FP) and under 200 m depth (). The variability is due to the size of the organisms, with the same size ranges as in Fig. 3.
3.1.2 Sensitivity analysis on metabolic parameters
A sensitivity analysis was performed on the parameters related to metabolic rates of micronekton (Fig. 5). Total Sobol' indices were calculated to assess the influence of these parameters on micronekton metabolic products, total POC production, and MCE ratio below 200 m.
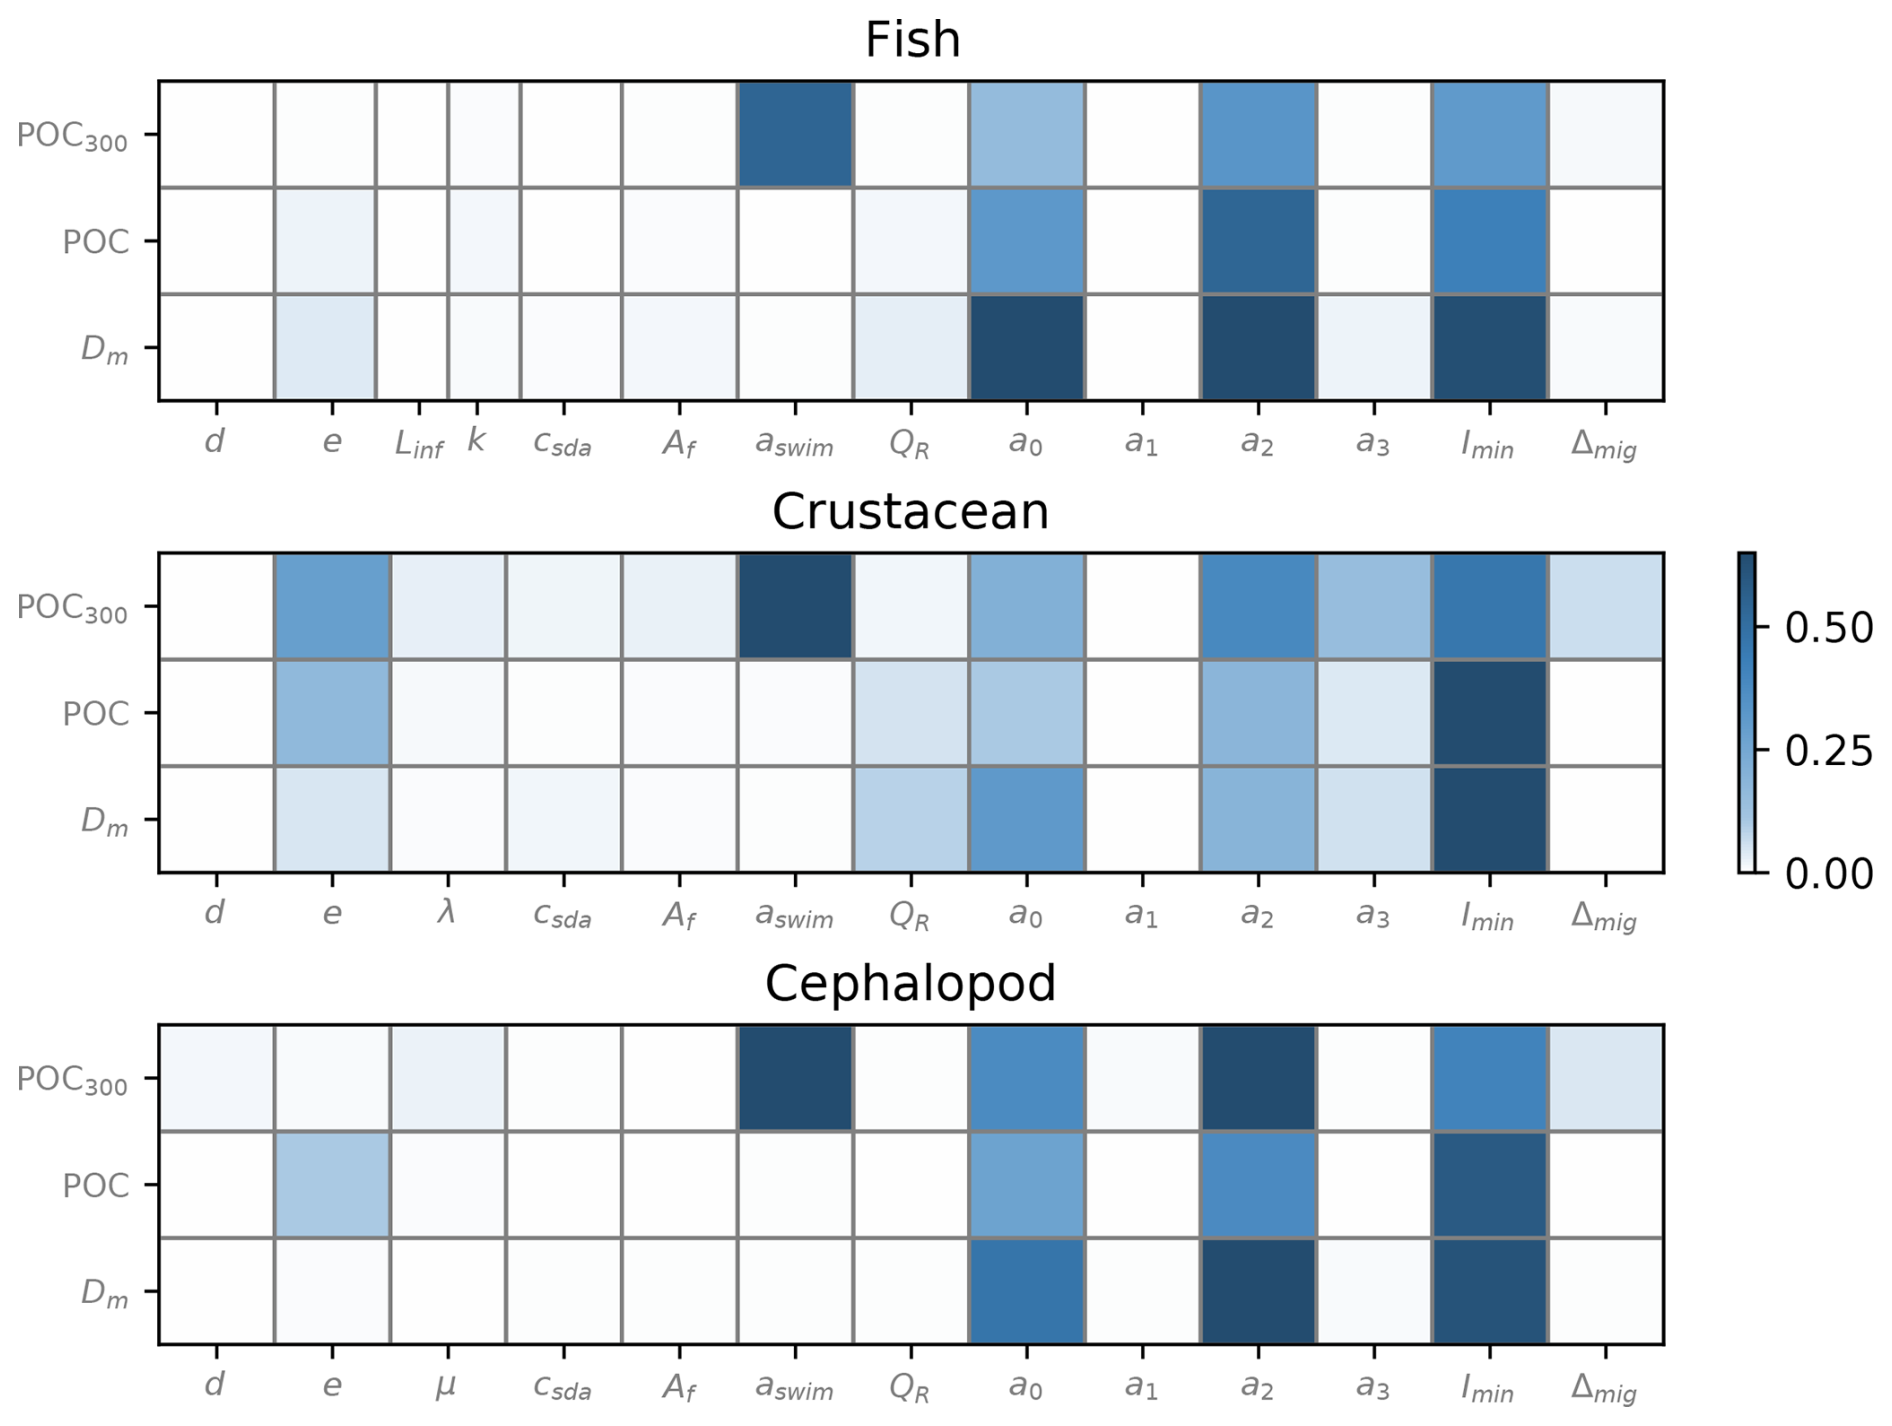
Figure 5Total Sobol' indices generated separately for the three taxonomic groups on different model outputs – total metabolic products of consumers (Dm), total production of fecal pellets and dead bodies (POC), and the MCE ratio – representing the efficiency of POC transport under 200 m depth (POC200). Organism size was set at 30 mm for each simulation.
Overall, the parameters showed similar sensitivity across different model outputs, with slight variations observed within taxonomic groups. In particular, the respiration coefficients a0 and a2 and the minimum level of light Imin exerted the greatest influence on the outputs of all taxonomic groups (Fig. 5).
The parameters aswim associated to the swimming speed (Eq. 2) generated a high variability in the model outputs, particularly for the MCE ratio. The gut evacuation rate d had a slight influence on the MCE ratio for cephalopods only, which was not the case regarding Dm and POC production, as for the other taxonomic groups. The assimilation efficiency e was mostly sensitive for crustaceans and cephalopods regarding the POC production and the MCE ratio for crustaceans.
Parameters linked to mortality rates (Linf, k, λ, and μ) did not show a significant sensitivity compared to the parameters csda and Af linked with the respiration rates, associated with the alimentation and the swimming speed, respectively.
3.2 Environment variability and carbon production
The environment was represented by three variables, including phytoplankton biomass, temperature, and irradiance (Fig. 6), in order to study their impact on the carbon production by micronekton.
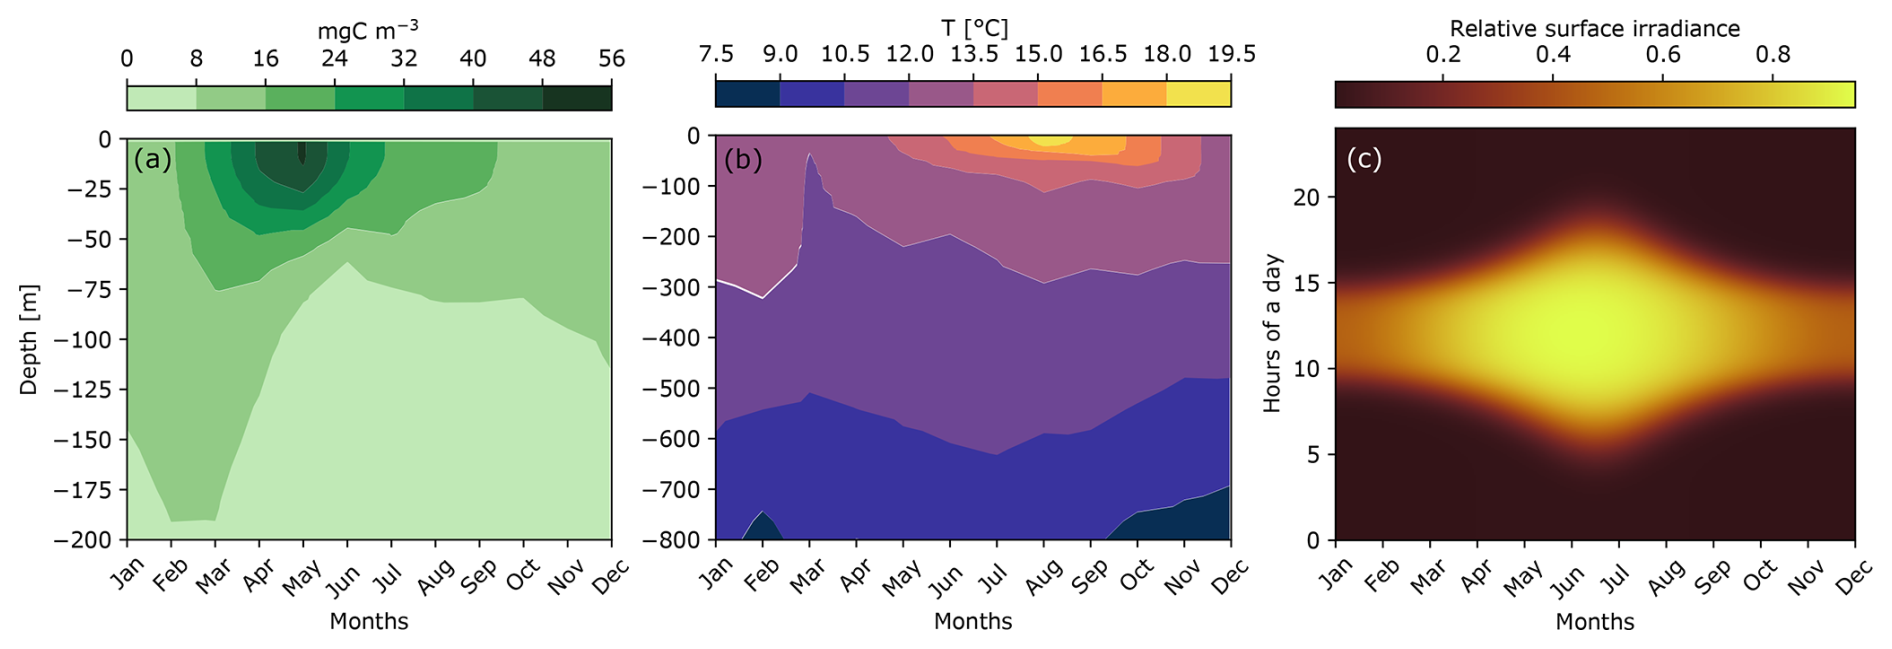
Figure 6Seasonal variation in the environmental conditions at PAP-SO (48°50′ N, 16°30′ W), including the monthly mean of phytoplankton biomass (a), the monthly mean of temperatures (b), and the modeled surface irradiance (c) calculated in the Supplement.
Most of the phytoplankton biomass was concentrated in the first 50 m. The maximum of phytoplankton biomass occurred in April–May and reached 56 mg C m−3 at the surface. Sea surface temperature ranged from 12 °C in winter to 19.5 °C in summer. The greatest temperature variability occurred in the first 100 m. At the winter solstice in late December, days lasted only 8 h, and irradiance was the lowest of the year. In contrast, during the summer solstice in June, daylight lasted 16 h and the relative surface irradiance reached its maximum.
One peak of carbon production induced by micronekton occurred during the year in June (Fig. 7a). This peak reached almost 40 . Carbon concentrations then fell, reaching their lowest values of 10 in the winter. The proportion of POC transported under the MLD, calculated as the MCE ratio, varied greatly during the year, from in January to in September (Fig. 7b).
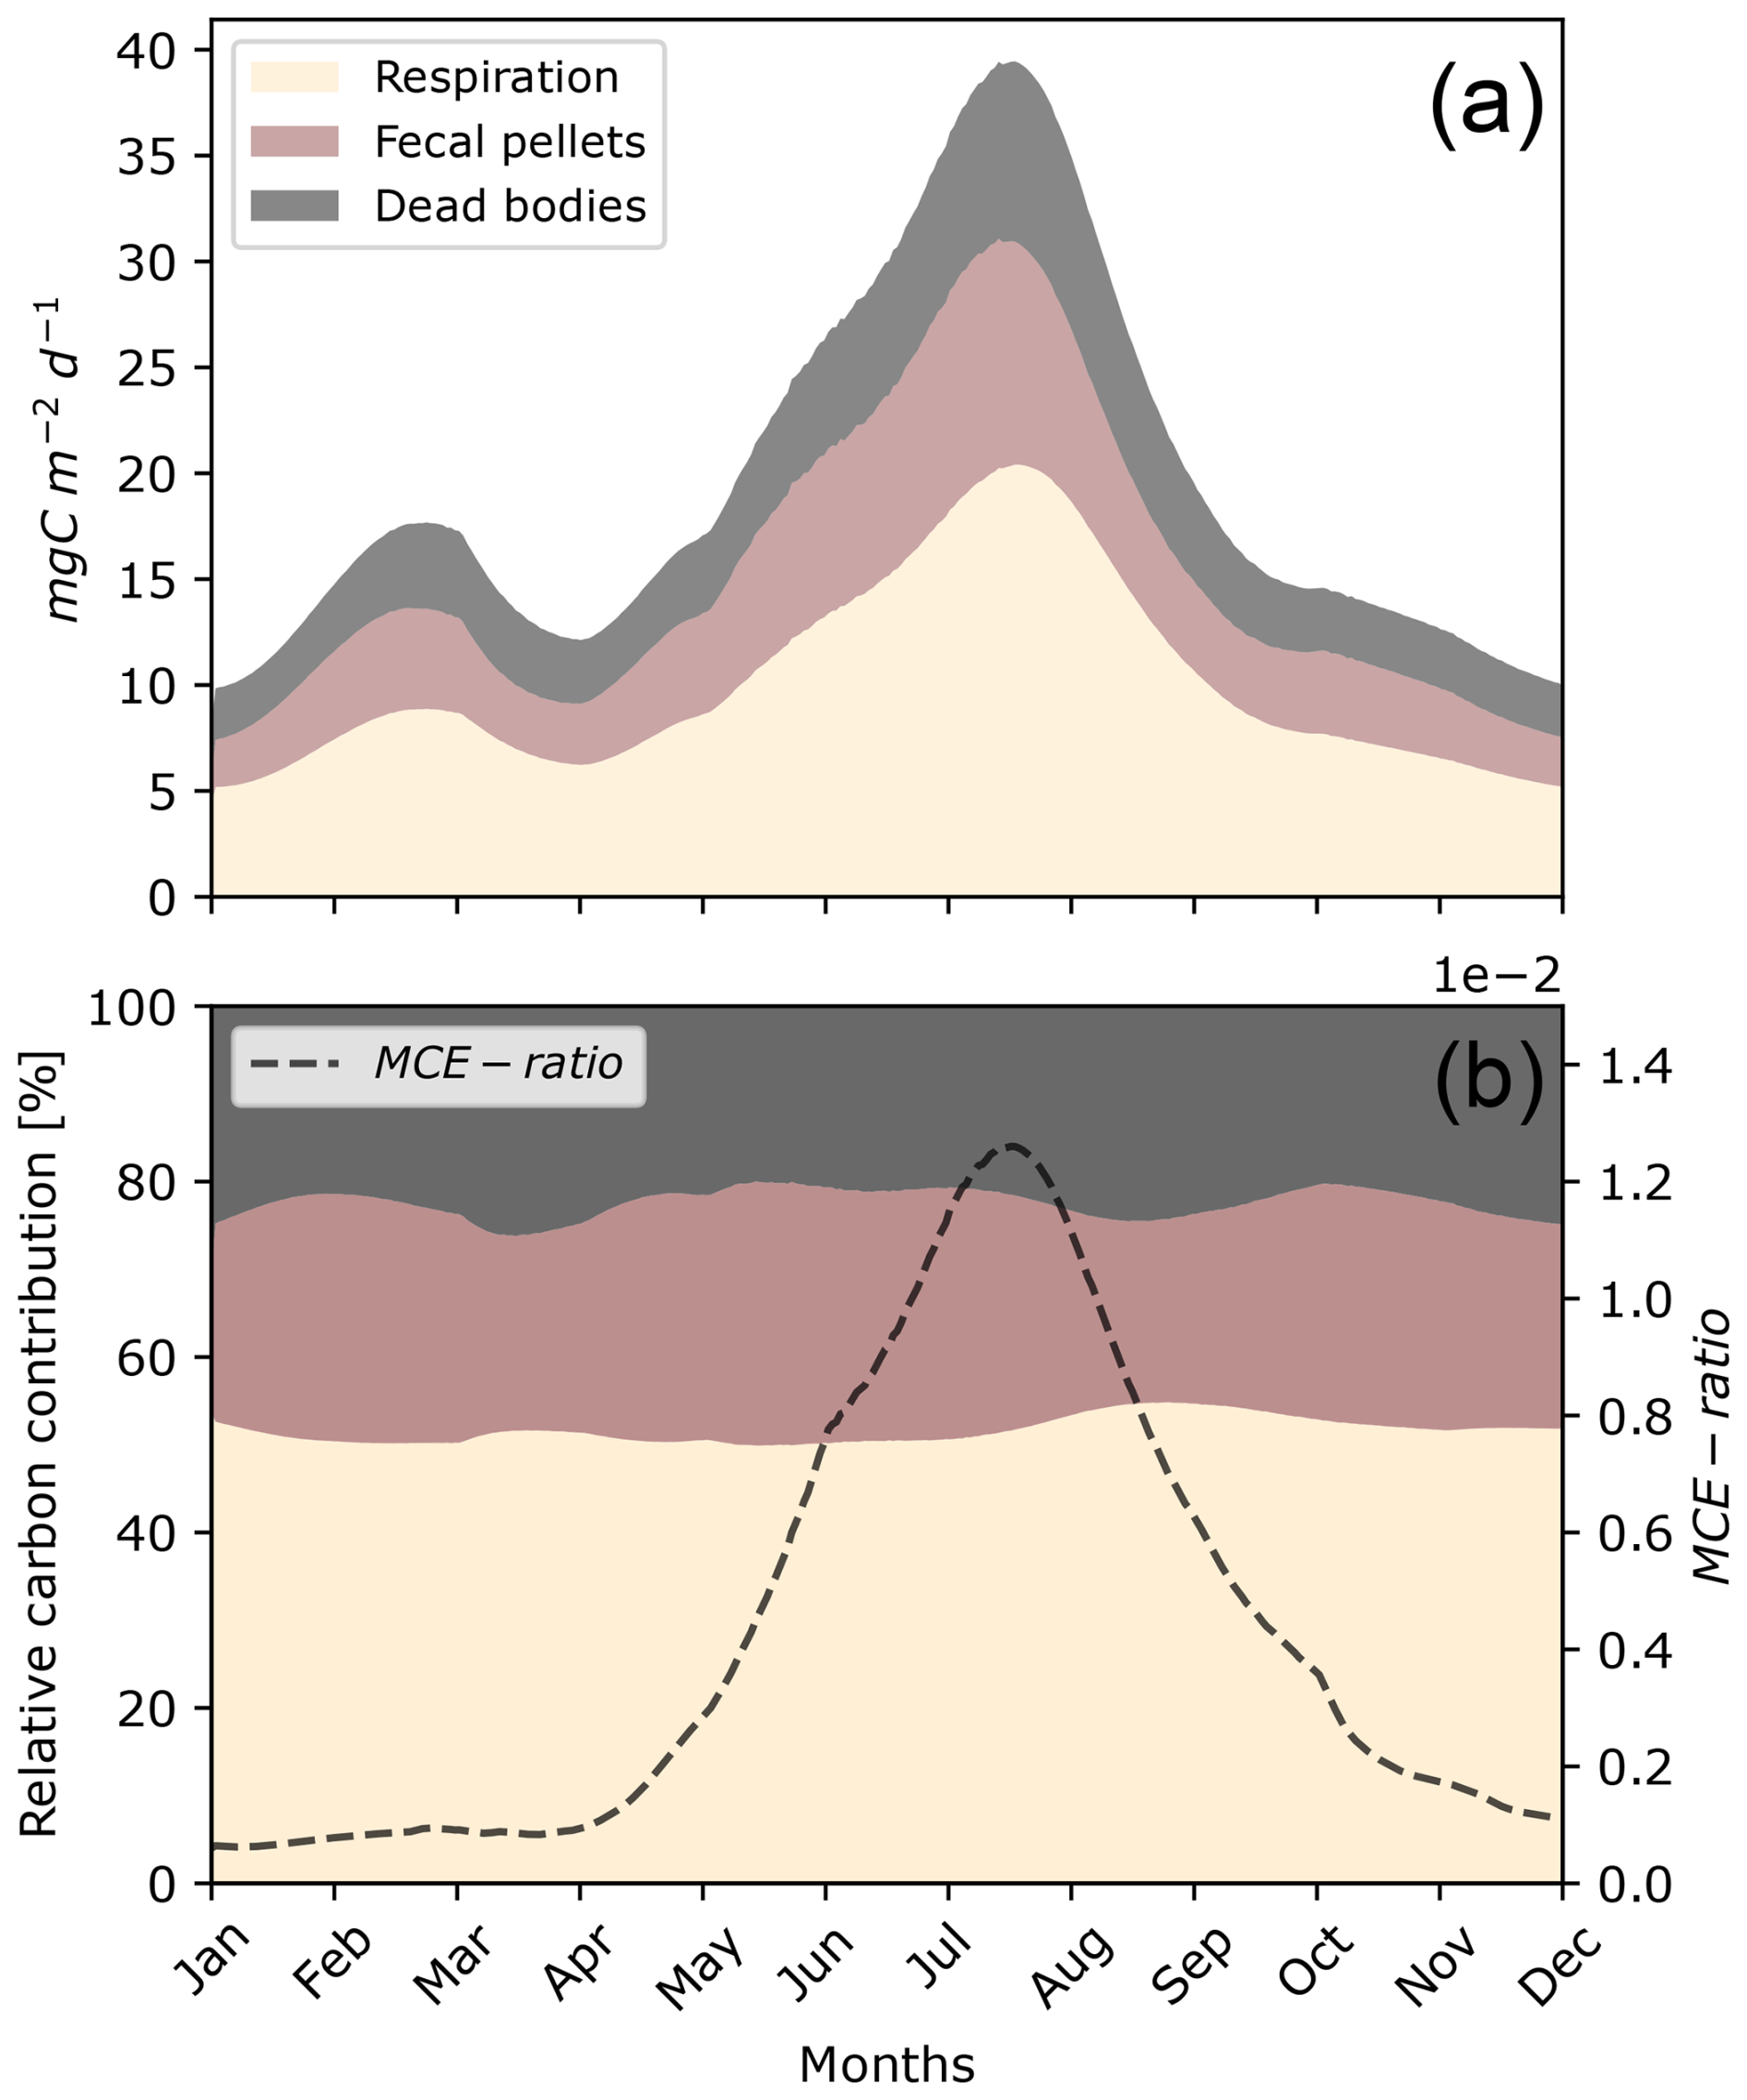
Figure 7Seasonal daily variation in carbon production, including metabolic products (Dm), POC production through fecal pellets (Dg), and dead bodies (Dμ), integrated over depth (a) and with their relative contributions (b) throughout the year. The parameters of this simulation were set for a fish community of 35 mm with seasonal variation in the environment (Fig. 6).
The proportions of carbon products generated by micronekton showed slight variations throughout the year, with metabolic products averaging around 55 % and peaking at nearly 60 % in September, fecal pellets averaging 20 %–25 %, and dead bodies averaging 25 % (Fig. 7b).
Seasonal variations in surface irradiance had a major impact on the migration depths of organisms (Figs. 6c and 8). The daytime residence depths for a uniform community of 35 mm fishes ranged from 450 m in winter to 650 m in summer. During summer, micronekton produced greater quantities of carbon at greater depths than during the rest of the year. Fecal pellet production was lower in autumn and winter, when micronekton concentrations are lower (Fig. S7 in the Supplement), temperatures are colder, and days are shorter (Fig. 6).
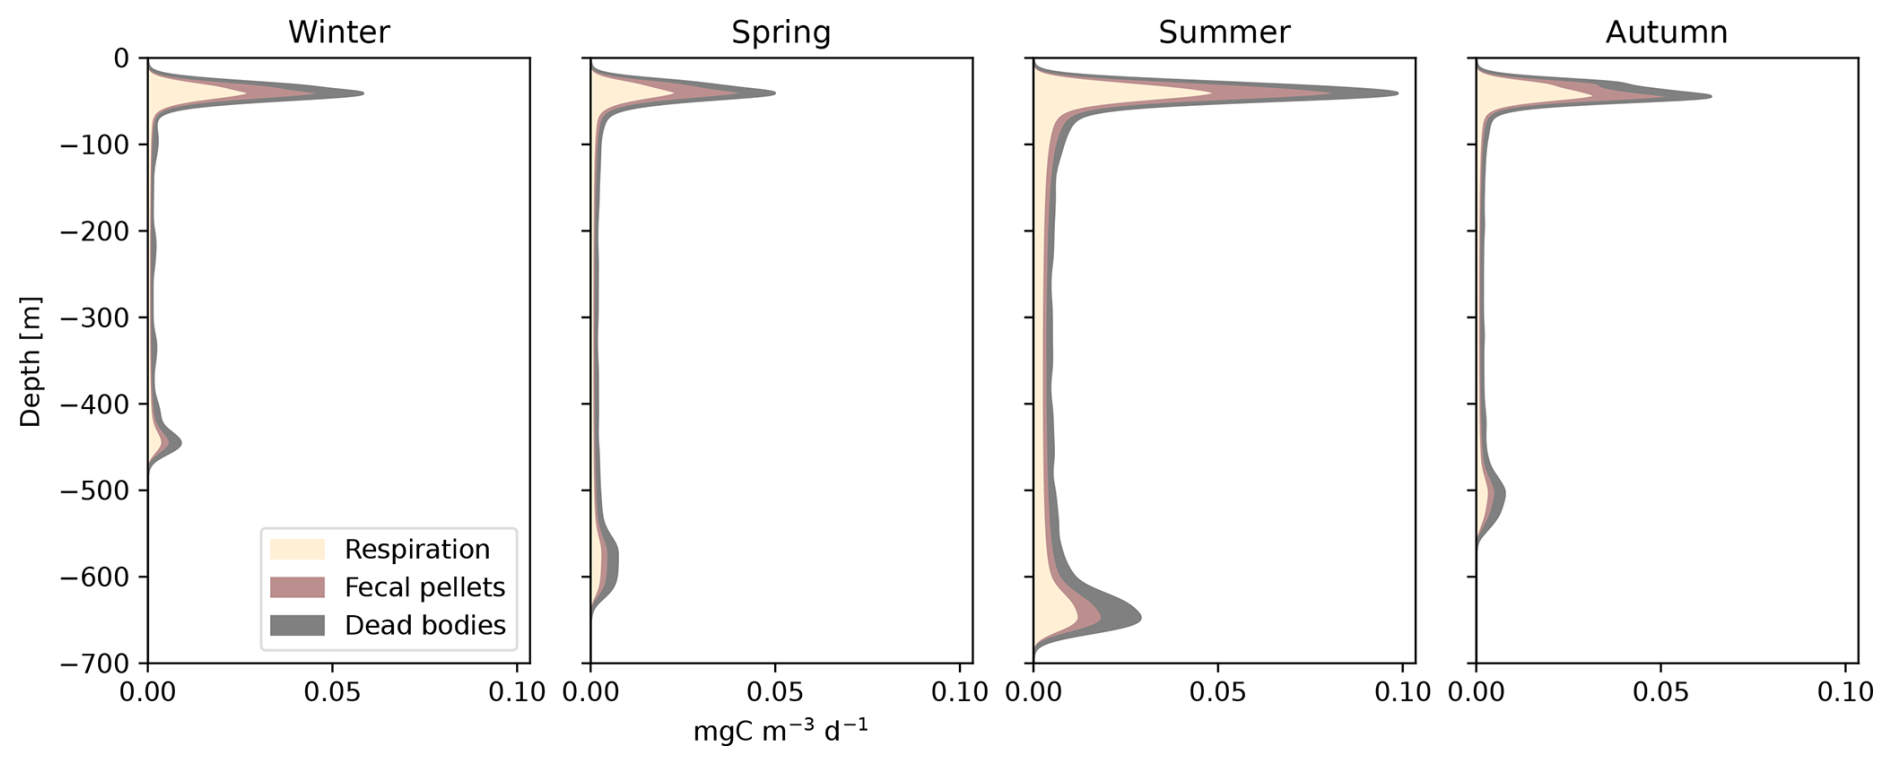
Figure 8Seasonal variation in carbon detritus induced by micronekton at depth, including the daily metabolic products (Dm), the daily production of fecal pellets (Dg), and dead bodies (Dμ). This simulation was set for a fish community of 35 mm with variation in the environment (Fig. 6) as in Fig. 7.
In this work, we propose a bioenergetic model for micronekton in order to explicit the importance of three carbon pathways, including metabolic products, fecal pellets, and dead bodies (Dm, Dg, Dμ). The bioenergetic model implies a comprehensive consideration of all carbon pathways of micronekton, including respiration rates, that vary according to the type of activity. This allowed us to represent the variation in the metabolic activities, i.e., resting, swimming, and feeding, over time and across different depth layers (see Figs. S1 and S2 in the Supplement). The modeling of the DVM allowed us to estimate the amount of carbon that is produced continuously along the water column and its daily variations. Indeed, models that represent instantaneous migrations neglect the influence of this period on carbon transport. This amount of carbon produced during the DVM must be considered, as it impacts the proportion of fecal pellets released at depth.
The bioenergetic model deduced that micronekton feed at night when they overlap with their resource, releasing the largest proportion of fecal pellets while remaining near the surface (Figs. S1 and 3). They spend the day migrating during twilight hours and remain in deep layers around midday. The result is two daily peaks of activity due to the cost of swimming during the DVM, with the first being more important during the descent due to the cost of digestion (Figs. S1 and S2). This supports the “anti-predation window” hypothesis, meaning that, during dusk and dawn, DVM minimizes the ratio of mortality risk to feeding rate (Clark and Levy, 1988). After being satiated at dawn, micronekton descend, avoiding visual predators during the day in the euphotic zone. Then, they rise to the top layers at dusk, becoming hungry again as stated by the “hunger/satiation” hypothesis (Pearre, 2003).
4.1 Influence of micronekton traits on carbon production
Considering the three main taxonomic groups of micronekton, significant differences in migration speed, daytime residence depth, and metabolic activity were observed among fishes, crustaceans, and cephalopods (Fig. 3). Fishes emerged as the group exerting the greatest influence on the efficiency of carbon transport at depth within the micronekton community. Metabolic activity also exhibited significant dependence on organism size, with smaller organisms demonstrating higher energy demands while migrating and releasing particles at shallower depths. The results showed a non-linear relationship between the size and the POC export for crustaceans and cephalopods (Fig. 3k and l). Consequently, our findings suggest that an organism of intermediate size, depending on the taxonomic group, would yield the highest carbon transport efficiency in the mesopelagic zone, as a trade-off between metabolic demands and swimming abilities. However, it is important to interpret these results cautiously, as they rely on parameters such as the swimming speed coefficient (aswim), which may vary depending on the community composition. Nevertheless, these parameters can be calibrated using acoustic detection of scattering layers and associated size distributions.
Figure 3 illustrates that migrant organisms exhibit depth stratification with size, as swimming speed is proportional to body length (see Eq. 2). This pattern has been observed across various taxa, which were collected by a mid-water trawl deployed during the APERO cruise, targeting scattering layers detected by an echo sounder (Fig. S9 in the Supplement). Migrant layers displayed peak abundances at 0–50 m at night and 400–800 m during the day, depending on the station, consistent with depth ranges found by Watanabe et al. (1999). Depth stratification by size was observed in several myctophid species (e.g., Badcock and Merrett, 1976), sergestid shrimps (e.g., Flock and Hopkins, 1992; Koukouras et al., 2000; Vestheim and Kaartvedt, 2009), and cephalopods such as Histioteuthis squids (Quetglas et al., 2010). Indeed, larger animals descend deeper to avoid predation and thrive in colder, nutrient-poor waters due to their lower mass-specific metabolic rates.
Our results highlighted the differences that may occur in the ability of taxonomic groups to release fecal pellets at depth (Fig. 3a–c). The relationship between gut passage time and migration time plays a critical role in controlling the proportion of fecal pellets exported to depth. Fishes appear to have higher swimming abilities and a shorter evacuation rate than large crustaceans and cephalopods (see Table 2). Thus, some of their ingested food at the surface is released where they remain in the deep layers. However, the evacuation rate of cephalopods and crustaceans is more important, and almost all the gut contents are released before reaching the bottom (Figs. 3a–c and S1). Our results corroborate studies on the vertical flux of copepods (Dagg et al., 1989), shrimps, euphausiids, and squids (Hidaka et al., 2001), where the active transport of gut contents was not significant at the base of the euphotic zone.
Cephalopods have a particularly active metabolism, with important respiration rates, 1.5–1.7 times higher than those of fish species (Ikeda, 2016). These fast-growing pelagic organisms produce relatively low amounts of fecal pellets and have short lifespan cycles (Boyle and Rodhouse, 2008). The respiration of dissolved inorganic carbon (DIC) represented on average 61.8 % of the production of carbon compared with 53.9 % for fishes and 46.5 % for crustaceans (Fig. 4 and Table S1). Likewise, the production of fecal pellets accounted on average for only 9.2 % of carbon production compared with 22.3 % for fishes and 20.1 % for crustaceans. Despite their smaller contribution to fecal pellet production and carbon excretion, cephalopods play a significant role in carbon cycling due to their elevated respiration rates. Understanding these metabolic differences among micronekton taxa is crucial for accurately modeling carbon transport and ecosystem dynamics in the pelagic environment.
Our findings indicate that a small subset of parameters significantly contributes to the variability in micronekton-induced carbon production (Fig. 5). A recent study revealed that, considering the range of plausible parameter values, carbon fluxes exhibited a 6-fold variation (McMonagle et al., 2023). Specifically, the respiration coefficients emerged as the primary source of uncertainty in bioenergetic models for fishes, consistent with prior research (Davison et al., 2013; McMonagle et al., 2023). Our results corroborate this observation for crustaceans and cephalopods as well. To adequately account for the impact of micronekton on the BCP, it is imperative to intensify field measurements of respiratory rates across various oceanic regions. The parameters exhibited a similar influence on the metabolic products of micronekton, the production of POC, and the efficiency of carbon transport. Indeed, metabolic activity is directly dependent on biomass, while it is the most sensitive inputs of models (McMonagle et al., 2024), making global estimates highly uncertain. Others factors influenced the export efficiency of carbon. They are directly linked to swimming speed, which depends mainly on factors including the aswim coefficient, and to the assimilation efficiency and evacuation rate for cephalopods (Fig. 5).
4.2 Influence of environmental parameters on carbon production
The most effective taxonomic group for exporting carbon at depth was fishes. This group was therefore selected to carry out analyses on the influence of environmental conditions on carbon export generated by migrating organisms.
Considering separately and simultaneously the seasonal variation in environmental parameters (Figs. S5 in the Supplement and 7), the results showed that phytoplankton biomass drives the amount of carbon that will be exported and has a direct effect on light attenuation in the water column. Indeed, Irigoien et al. (2014) showed a strong relationship between primary production and fish biomass estimated from acoustic observations. During the bloom, productive surface waters increase the density of micronekton prey but also limit the capture efficiency by reducing the water clarity (Fig. S6 in the Supplement). This resulted in moderate carbon concentrations induced by micronekton in spring, followed by a peak in carbon production in June (Fig. 7). Thus, the link between light and primary production is a key process in seasonal carbon export by migrant organisms.
Models of aquatic visual feeding showed that daylight variability is more important than prey abundance for predation efficiency (Aksnes and Giske, 1993; Aksnes and Palm, 1997). Irigoien et al. (2014) found that, in clear oligotrophic waters, the energy transfer efficiency from phytoplankton to mesopelagic fishes was higher than previously established. This may explain a higher peak of micronekton concentrations in summer in our study's temperate region. Although the resource is less abundant than in spring, visual predation is more efficient thanks to clearer waters. Thus, micronekton may have a greater impact on the BCP during summer than in spring, when the carbon flux is mostly driven by the gravitational pump (e.g., Sanders et al., 2014). During summer, the resource's density diminishes, but the growth rate and the micronekton capture rate are higher than in spring. Moreover, micronekton organisms migrate to deeper waters in response to higher light levels, where they release particles (Fig. 8).
In the model, temperature indirectly affects the phytoplankton biomass, estimated from satellite data, by influencing phytoplankton growth and nutrient availability. Higher temperatures can decrease the efficiency of the BCP by increasing the remineralization of organic carbon through respiration. Phytoplankton near their optimum temperature are very sensitive to warming, potentially disrupting the community composition and phenology (Middelburg, 2019). Warmer waters are expected to alter food web structures by increasing plankton diversity in the North Atlantic and reducing copepod mean size (Beaugrand et al., 2010), which will subsequently affect micronekton biomass.
Our estimates of the seasonal variation in carbon detritus in the mesopelagic zone (Fig. 8) are consistent with the findings of Bianchi et al. (2013) for different areas. In our study, winter carbon production is similar to estimates under oligotrophic conditions in the Pacific, around 0.6 . Conversely, our summer carbon production estimates are close to those in productive regions, reaching 1.5 . Their study suggested that carbon production in the mesopelagic zone by DVMs can contribute up to 40 % of carbon export.
4.3 Model limits
A model can provide a simplified representation of a complex system, allowing us to gain insights into the fundamental mechanisms driving system behavior. By focusing on a reasonable number of parameters, our model helps to elucidate important processes involved in the transport of carbon by micronekton. We discuss in this section the main choices made to simplify the representation of vertical dynamics, interactions between micronekton and their prey, and the energy budget of these organisms.
The dynamics of the DVM were based on the rate of change hypothesis; i.e., the migration speed of the organisms is dependent on the gradient of light (e.g., Andersen and Nival, 1991). However, other explanations have received great attention, including the light preferendum hypothesis, where organisms follow an isolume (e.g., Cohen and Forward, 2009) or adjust their position to remain in a “light comfort zone” (e.g., Frank and Widder, 2002; Røstad et al., 2016; Langbehn et al., 2019). Light is a key factor in avoiding visual predators, but oxygen gradients may play a stronger role, particularly in regions with an oxygen minimum zone (OMZ) (Bianchi et al., 2013). In regions without OMZs, migration depths are primarily controlled by light levels, but, to achieve a global perspective, our model should incorporate co-limitation by both oxygen and light. Nevertheless, our method allowed us to reproduce consistent migration speeds and daytime depth residence in a non-hypoxic region, as inferred from sound-scattering-layer data recorded at sea, with an approximate migration duration of 2 h (e.g., Bianchi and Mislan, 2016; Cade and Benoit-Bird, 2015).
In this study, the prey–predator relationships between zooplankton and micronekton are influenced by light. However, even at night there is still some ambient light (e.g., from the moon), and predators that rely on visual predation may still be able to feed, albeit less effectively (Benoit-Bird et al., 2009). Moreover, fishes possess the ability to detect prey using their lateral line in addition to visual cues. Representing only visual predation might underestimate the efficiency of micronekton in capturing prey, especially in turbid waters where the capture rate can be lowered, as observed in spring (Fig. S6). Therefore, we have defined a threshold of light in the model (Imin in Eq. S1 in the Supplement) to ensure that the capture rate never drops to zero. Variations in this parameter induced significant impact on model outputs (Fig. 5). This result suggests the importance of the moon cycle in the alimentation of micronekton and their production of carbon and in other factors improving prey detection in the dark, such as the use of bioluminescence.
A key aspect of prey–predator relationships is how variations in prey quality can affect the amount of carbon assimilated per feeding period by individual micronekton. This approach offers a more realistic estimation compared to assuming uniform ingestion rates across all species (Woodstock et al., 2022). By considering differences in prey taxa, we can more accurately capture feeding behaviors and ecological interactions within the micronekton community, enabling the study of inter-annual variations. However, further research is necessary to minimize uncertainties associated with these feeding parameters. Another factor influencing micronekton feeding behavior is the spatial distribution of their prey. Analysis of gut contents from migratory species during the APERO cruise suggested that these organisms primarily feed at the surface (data unshown), leading us to constrain their resources to this layer. While zooplankton are known to exhibit DVM (e.g., Bianchi et al., 2013; Kiko et al., 2020), they typically migrate to relatively shallow depths. As a result, we did not incorporate zooplankton DVM into the model, as it is unlikely to significantly affect micronekton consumption patterns.
Micronekton taxa were modeled independently to avoid considering interactions between them, including competition for resources. According to the competitive exclusion principle, multiple species cannot coexist in the same environment while feeding on the same resource (Gause, 1935). This would necessitate making trophic compartments more complex, which was not the aim of this study. In our parsimonious modeling approach, relative concentrations of fishes, crustaceans, and cephalopods were defined to represent the micronekton community. A similar micronekton biomass taxonomic ratio, which we used in Table 1, was found based on the preliminary results of the APERO cruise (Fig. S8 in the Supplement), conducted in our study area. The size classes measured from organisms collected by a mid-water micronekton trawl also fall within the same size ranges (Fig. S8). In addition, the size used for the seasonal simulations corresponds to the average size found for fishes (Fig. S8). However, those results must be taken with caution, as they are highly dependent on the selectivity of the sampling gear (Kwong et al., 2018).
4.4 Perspectives
There is an urgent need to address uncertainties associated with the mesopelagic migratory pump (MMP) in light of changing ocean conditions, linked to global warming and overfishing. This entails a deeper understanding of micronekton ecology and metabolism and their role in carbon transport, regarding the risk of their potential exploitation as a resource (Schadeberg et al., 2023).
We suggest using this model as a tool to estimate the active carbon transport induced by micronekton, across different regions. Parameters could be calibrated using data collected from trawl samples, acoustic sounders, zooplankton nets, and sediment traps. Additionally, recording environmental factors such as light, primary production, and temperature at depth could help, in order to capture the variability in the relative contribution of micronekton to the BCP. Establishing recurrent seasonal sampling and deploying calibrated instruments across different regions would facilitate comparisons of environmental changes. For instance, it might help in understanding the factors that control migration depths and dynamics. Size is probably not the only morphological trait influencing nighttime depth occupation. Mesopelagic ecosystems being characterized by dim light and organisms emitting their own bioluminescence for communication/predation can, for example, be one trait of interest (de Busserolles et al., 2014). Moreover, modeling migration dynamics, including state of satiation of organisms based on stomach content analyses sampled from trawl net sampling in layers identified by acoustics, would improve the modeling of the vertical migration behavior. This implies that organisms would ascend only when their guts are empty. Indeed, not all organisms of the same species and size class rise to the surface at night (e.g., Bos et al., 2021).
Further studies on the BCP should investigate the role of gelatinous organisms, particularly salps, which are often overlooked in carbon budget assessments. Salps are known to filter large amounts of suspended particles and produce fast-sinking fecal pellets, potentially enhancing the efficiency of the BCP in the ocean (Phillips et al., 2009; Steinberg et al., 2023; Décima et al., 2023). During the APERO cruise, gelatinous represented on average 14 % of the biomass collected by a mid-water trawls. However, we did not consider this group in this study, since they do not consume the same resource as micronekton.
To conclude, incorporating energetic and functional approaches into carbon budget models will improve our ability to predict and mitigate the impacts of environmental changes on marine ecosystems and global carbon cycling.
The source code (written in Python) supporting this article is available via Zenodo at https://doi.org/10.5281/zenodo.15240441 (Thibault, 2025).
Data from the APERO cruise, including trawl data, are available at https://doi.org/10.17600/18000666 (Memery et al., 2023).
The supplement related to this article is available online at https://doi.org/10.5194/bg-22-2181-2025-supplement.
All authors contributed to the conception of the study. HT carried out model simulations based on an early version of the model developed by JAS with technical support from JCP. HT wrote the article, with contributions from all co-authors.
The contact author has declared that none of the authors has any competing interests.
Publisher's note: Copernicus Publications remains neutral with regard to jurisdictional claims made in the text, published maps, institutional affiliations, or any other geographical representation in this paper. While Copernicus Publications makes every effort to include appropriate place names, the final responsibility lies with the authors.
The authors would like to thank the captain and crew of N/O Thalassa (Flotte Océanographique Française) for their help during the APERO cruise.
Hélène Thibault would like to thank the Grantham Foundation and WHOI's Ocean Twilight Zone project for funding and hosting the OTZ Symposium (Biodiversity, Ecology, and the Biological Carbon Pump in the Ocean Twilight Zone), providing a valuable state of the art and insightful discussions.
We acknowledge the staff of the “Cluster de calcul intensif HPC” platform of the OSU Institut PYTHEAS (Aix-Marseille Université, INSU-CNRS) for providing the computing facilities for the sensitivity analysis.
The authors gratefully acknowledge the Imaging and Taxonomy platform of MIO (Aix-Marseille Université) and its personnel for material support in APERO micronekton sample determination and measurements.
This article contributes to the APERO project funded by the National Research Agency under the grant APERO (grant no. ANR-21-CE01-0027) and by the French LEFE-Cyber program (CNRS, INSU).
This paper was edited by Carolin Löscher and reviewed by two anonymous referees.
Aksnes, D. and Palm, A.: A revised model of visual range in fish, Sarsia, 82, 137–147, https://doi.org/10.1080/00364827.1997.10413647, 1997. a
Aksnes, D., Løtvedt, A., Lindemann, C., Calleja, M., Morán, X., Kaarvedt, S., and Thingstad, T.: Effects of migrating mesopelagic fishes on the biological carbon pump, Mar. Ecol.-Prog. Ser., 717, 107–126, https://doi.org/10.3354/meps14373, 2023. a
Aksnes, D. L. and Giske, J.: A theoretical model of aquatic visual feeding, Ecol. Model., 67, 233–250, https://doi.org/10.1016/0304-3800(93)90007-F, 1993. a, b
Andersen, V. and Nival, P.: A model of the diel vertical migration of zooplankton based on euphausiids, J. Mar. Res., 49, 153–175, 1991. a, b
Anderson, T. R., Martin, A. P., Lampitt, R. S., Trueman, C. N., Henson, S. A., and Mayor, D. J.: Quantifying carbon fluxes from primary production to mesopelagic fish using a simple food web model, ICES J. Mar. Sci., 76, 690–701, https://doi.org/10.1093/icesjms/fsx234, 2019. a
Angel, M. and Pugh, P.: Quantification of diel vertical migration by micronektonic taxa in the northeast Atlantic, in: Island, Ocean and Deep-Sea Biology: Proceedings of the 34th European Marine Biology Symposium, held in Ponta Delgada (Azores), Portugal, 13–17 September 1999, 161–179, Springer, https://doi.org/10.1023/A:1004115010030, 2000. a
Archibald, K. M., Siegel, D. A., and Doney, S. C.: Modeling the Impact of Zooplankton Diel Vertical Migration on the Carbon Export Flux of the Biological Pump, Global Biogeochem. Cy., 33, 181–199, https://doi.org/10.1029/2018GB005983, 2019. a
Ariza, A., Garijo, J., Landeira, J., Bordes, F., and Hernández-León, S.: Migrant biomass and respiratory carbon flux by zooplankton and micronekton in the subtropical northeast Atlantic Ocean (Canary Islands), Prog. Oceanogr., 134, 330–342, https://doi.org/10.1016/j.pocean.2015.03.003, 2015. a
Aumont, O., Maury, O., Lefort, S., and Bopp, L.: Evaluating the Potential Impacts of the Diurnal Vertical Migration by Marine Organisms on Marine Biogeochemistry, Global Biogeochem. Cy., 32, 1622–1643, https://doi.org/10.1029/2018GB005886, 2018. a
Badcock, J. and Merrett, N. R.: Midwater fishes in the eastern North Atlantic – I. Vertical distribution and associated biology in 30° N, 23° W, with developmental notes on certain myctophids, Prog. Oceanogr., 7, 3–58, https://doi.org/10.1016/0079-6611(76)90003-3, 1976. a
Baird, R. C., Hopkins, T. L., and Wilson, D. F.: Diet and feeding chronology of Diaphus taaningi (Myctophidae) in the Cariaco Trench, Copeia, 1975, 356–365, https://doi.org/10.2307/1442891, 1975. a
Bandara, K., Varpe, Ø., Ji, R., and Eiane, K.: A high-resolution modeling study on diel and seasonal vertical migrations of high-latitude copepods, Ecol. Model., 368, 357–376, https://doi.org/10.1016/j.ecolmodel.2017.12.010, 2018. a
Beaugrand, G., Edwards, M., and Legendre, L.: Marine biodiversity, ecosystem functioning, and carbon cycles, P. Natl. Acad. Sci. USA, 107, 10120–10124, https://doi.org/10.1073/pnas.0913855107, 2010. a
Belcher, A., Saunders, R. A., and Tarling, G. A.: Respiration rates and active carbon flux of mesopelagic fishes (Family Myctophidae) in the Scotia Sea, Southern Ocean, Mar. Ecol.-Prog. Ser., 610, 149–162, https://doi.org/10.3354/meps12861, 2019. a, b
Benoit-Bird, K. J., Au, W. W. L., and Wisdom, D. W.: Nocturnal Light and Lunar Cycle Effects on Diel Migration of Micronekton, Limnol. Oceanogr., 54, 1789–1800, 2009. a
Beseres, J., Lawrence, A., and Feller, R.: Practical equivalence of laboratory and field measurements of gut passage time in two penaeid shrimp species, Mar. Ecol.-Prog. Ser., 309, 221–231, https://doi.org/10.3354/meps309221, 2006. a
Bianchi, D. and Mislan, K. A. S.: Global patterns of diel vertical migration times and velocities from acoustic data: Global patterns of diel vertical migration, Limnol. Oceanogr., 61, 353–364, https://doi.org/10.1002/lno.10219, 2016. a, b
Bianchi, D., Stock, C., Galbraith, E. D., and Sarmiento, J. L.: Diel vertical migration: Ecological controls and impacts on the biological pump in a one-dimensional ocean model, Global Biogeochem. Cy., 27, 478–491, https://doi.org/10.1002/gbc.20031, 2013. a, b, c, d
Birk, M. A.: Ecophysiology of Oxygen Supply in Cephalopods, Graduate Theses and Dissertations, https://scholarcommons.usf.edu/etd/7265 (last access: 20 December 2018), 2018. a
Bos, R. P., Sutton, T. T., and Frank, T. M.: State of Satiation Partially Regulates the Dynamics of Vertical Migration, Frontiers in Marine Science, 8, 607228, https://doi.org/10.3389/fmars.2021.607228, 2021. a
Boyd, P. and Trull, T.: Understanding the export of biogenic particles in oceanic waters: Is there consensus?, Prog. Oceanogr., 72, 276–312, https://doi.org/10.1016/j.pocean.2006.10.007, 2007. a
Boyd, P. W., Claustre, H., Levy, M., Siegel, D. A., and Weber, T.: Multi-faceted particle pumps drive carbon sequestration in the ocean, Nature, 568, 327–335, https://doi.org/10.1038/s41586-019-1098-2, 2019. a, b, c
Boyle, P. and Rodhouse, P.: Cephalopods: ecology and fisheries, John Wiley & Sons, https://doi.org/10.1002/9780470995310 2008. a, b, c
Brett, J. R. and Groves, T. D. D.: Physiological energetics, in: Fish Physiology, vol. 8, edited by: Hoar, W. S., Randall, D. J., and Brett, J. R., 280–352, Academic Press, New York, 1979. a, b, c, d, e
Brodeur, R. D., Seki, M. P., Pakhomov, E. A., and Suntsov, A. V.: Micronekton – What are they and why are they important?, North Pacific Marine Science Organization, Pices Press 13, 7–11, 2019. a
Cade, D. E. and Benoit-Bird, K. J.: Depths, migration rates and environmental associations of acoustic scattering layers in the Gulf of California, Deep-Sea Res. Pt. I, 102, 78–89, https://doi.org/10.1016/j.dsr.2015.05.001, 2015. a
Clark, C. W. and Levy, D. A.: Diel Vertical Migrations by Juvenile Sockeye Salmon and the Antipredation Window, Am. Nat., 131, 271–290, https://doi.org/10.1086/284789, 1988. a
Clarke, T. A.: Comparison of abundance estimates of small fishes by three towed nets and preliminary results of the use of small purse seines as sampling devices, Biological Oceanography, 2, 311–340, 1983. a
Cohen, J. H. and Forward Jr., R. B.: Zooplankton diel vertical migration – a review of proximate control, Oceanogr. Mar. Biol., 47, 89–122, 2009. a
Copernicus Marine Service: Global Ocean Physics Analysis and Forecast, Copernicus Marine Service [data set], https://doi.org/10.48670/moi-00016, 2024. a
Cotté, C., Ariza, A., Berne, A., Habasque, J., Lebourges-Dhaussy, A., Roudaut, G., Espinasse, B., Hunt, B., Pakhomov, E., Henschke, N., Péron, C., Conchon, A., Koedooder, C., Izard, L., and Cherel, Y.: Macrozooplankton and micronekton diversity and associated carbon vertical patterns and fluxes under distinct productive conditions around the Kerguelen Islands, J. Marine Syst., 226, 103650, https://doi.org/10.1016/j.jmarsys.2021.103650, 2022. a
Dagg, M., Frost, B., and Walser Jr., W.: Copepod diel migration, feeding, and the vertical flux of pheopigments, Limnol. Oceanogr., 34, 1062–1071, https://doi.org/10.4319/lo.1989.34.6.1062, 1989. a, b
Davison, P., Checkley, D., Koslow, J., and Barlow, J.: Carbon export mediated by mesopelagic fishes in the northeast Pacific Ocean, Prog. Oceanogr., 116, 14–30, https://doi.org/10.1016/j.pocean.2013.05.013, 2013. a, b, c, d
de Busserolles, F., Fitzpatrick, J. L., Marshall, N. J., and Collin, S. P.: The Influence of Photoreceptor Size and Distribution on Optical Sensitivity in the Eyes of Lanternfishes (Myctophidae), PLoS One, 9, e99957, https://doi.org/10.1371/journal.pone.0099957, 2014. a
De Robertis, A.: Size-dependent visual predation risk and the timing of vertical migration: An optimization model, Limnol. Oceanogr., 47, 925–933, https://doi.org/10.4319/lo.2002.47.4.0925, 2002. a
Décima, M., Stukel, M. R., Nodder, S. D., Gutiérrez-Rodríguez, A., Selph, K. E., Dos Santos, A. L., Safi, K., Kelly, T. B., Deans, F., Morales, S. E., Baltar, B., Latasa, M., Gorbunov, M. Y., and Pinkerton, M.: Salp blooms drive strong increases in passive carbon export in the Southern Ocean, Nat. Commun., 14, 425, https://doi.org/10.1038/s41467-022-35204-6, 2023. a
Drazen, J. C. and Sutton, T. T.: Dining in the Deep: The Feeding Ecology of Deep-Sea Fishes, Annu. Rev. Mar. Sci., 9, 337–366, https://doi.org/10.1146/annurev-marine-010816-060543, 2017. a
Eiane, K. and Parisi, D.: Towards a robust concept for modelling zooplankton migration, Sarsia, 86, 465–475, https://doi.org/10.1080/00364827.2001.10420486, 2001. a
Fiksen, O.: Vertical distribution and population dynamics of copepods by dynamic optimization, ICES J. Mar. Sci., 52, 483–503, https://doi.org/10.1016/1054-3139(95)80062-X, 1995. a
Flock, M. E. and Hopkins, T. L.: Species composition, vertical distribution, and food habits of the sergestid shrimp assemblage in the eastern Gulf of Mexico, J. Crustacean Biol., 12, 210–223, https://doi.org/10.2307/1549076, 1992. a
Frank, T. and Widder, E.: Effects of a decrease in downwelling irradiance on the daytime vertical distribution patterns of zooplankton and micronekton, Mar. Biol., 140, 1181–1193, https://doi.org/10.1007/s00227-002-0788-7, 2002. a, b
Frank, T. M. and Widder, E. A.: The correlation of downwelling irradiance and staggered vertical igration patterns of zooplankton in Wilkinson Basin, Gulf of Maine, J. Plankton Res., 19, 1975–1991, https://doi.org/10.1093/plankt/19.12.1975, 1997. a
Gause, G. F.: Vérifications Expérimentales de la Théorie Mathématique de la Lutte pour la Vie, Actual. Scient. Indust., 277, 1–62, 1935. a
Giske, J. and Aksnes, D. L.: Ontogeny, season and trade-offs: Vertical distribution of the mesopelagic fish Maurolicus muelleri, Sarsia, 77, 253–261, https://doi.org/10.1080/00364827.1992.10413510, 1992. a
Giske, J., Rosland, R., Berntsen, J., and Fiksen, Ø.: Ideal free distribution of copepods under predation risk, Ecol. Model., 95, 45–59, https://doi.org/10.1016/S0304-3800(96)00027-0, 1997. a
Han, B.-P. and Straškraba, M.: Modeling patterns of zooplankton diel vertical migration, J. Plankton Res., 20, 1463–1487, https://doi.org/10.1093/plankt/20.8.1463, 1998. a
Hays, G. C.: A review of the adaptive significance and ecosystem consequences of zooplankton diel vertical migrations, in: Migrations and Dispersal of Marine Organisms: Proceedings of the 37th European Marine Biology Symposium held in Reykjavík, Iceland, 5–9 August 2002, Springer, 163–170, https://doi.org/10.1007/978-94-017-2276-6_18, 2003. a
Herman, J. and Usher, W.: SALib: An open-source Python library for Sensitivity Analysis, The Journal of Open Source Software, 2, 97, https://doi.org/10.21105/joss.00097, 2017. a
Hernández-León, S., Olivar, M. P., Fernández de Puelles, M. L., Bode, A., Castellón, A., López-Pérez, C., Tuset, V. M., and González-Gordillo, J. I.: Zooplankton and micronekton active flux across the tropical and subtropical Atlantic Ocean, Frontiers in Marine Science, 6, 535, https://doi.org/10.3389/fmars.2019.00535, 2019. a
Herring, P.: The biology of the deep ocean, OUP Oxford, https://doi.org/10.1093/oso/9780198549567.001.0001 2001. a
Hidaka, K., Kawaguchi, K., Murakami, M., and Takahashi, M.: Downward transport of organic carbon by diel migratory micronekton in the western equatorial Pacific: its quantitative and qualitative importance, Deep-Sea Res. Pt. I, 48, 1923–1939, https://doi.org/10.1016/S0967-0637(01)00003-6, 2001. a, b
Hirst, A., Roff, J., and Lampitt, R.: A synthesis of growth rates in marine epipelagic invertebrate zooplankton, Adv. Mar. Biol., 44, 1–142, https://doi.org/10.1016/S0065-2881(03)44002-9, 2003. a
Hudson, J. M., Steinberg, D. K., Sutton, T. T., Graves, J. E., and Latour, R. J.: Myctophid feeding ecology and carbon transport along the northern Mid-Atlantic Ridge, Deep-Sea Res. Pt. I, 93, 104–116, https://doi.org/10.1016/j.dsr.2014.07.002, 2014. a, b
Ikeda, T.: Metabolism, body composition, and energy budget of the mesopelagic fish Maurolicus muelleri in the sea of Japan, Fish. Bull., 94, 49–58, 1996. a
Ikeda, T.: Respiration and ammonia excretion by marine metazooplankton taxa: synthesis toward a global-bathymetric model, Mar. Biol., 161, 2753–2766, https://doi.org/10.1007/s00227-014-2540-5, 2014. a, b
Ikeda, T.: Routine metabolic rates of pelagic marine fishes and cephalopods as a function of body mass, habitat temperature and habitat depth, J. Exp. Mar. Biol. Ecol., 480, 74–86, https://doi.org/10.1016/j.jembe.2016.03.012, 2016. a, b, c
Irigoien, X., Klevjer, T. A., Røstad, A., Martinez, U., Boyra, G., Acuña, J. L., Bode, A., Echevarria, F., Gonzalez-Gordillo, J. I., Hernandez-Leon, S., Agusti, S., Aksnes, D. L., Duarte, C. M., and Kaartvedt, S.: Large mesopelagic fishes biomass and trophic efficiency in the open ocean, Nat. Commun., 5, 3271, https://doi.org/10.1038/ncomms4271, 2014. a, b
Iwanaga, T., Usher, W., and Herman, J.: Toward SALib 2.0: Advancing the accessibility and interpretability of global sensitivity analyses, Socio-Environmental Systems Modelling, 4, 18155, https://doi.org/10.18174/sesmo.18155, 2022. a
Jager, T. and Ravagnan, E.: Modelling growth of northern krill (Meganyctiphanes norvegica) using an energy-budget approach, Ecol. Model., 325, 28–34, https://doi.org/10.1016/j.ecolmodel.2015.12.020, 2016. a
Kaartvedt, S., Røstad, A., Klevjer, T. A., and Staby, A.: Use of bottom-mounted echo sounders in exploring behavior of mesopelagic fishes, Mar. Ecol.-Prog. Ser., 395, 109–118, https://doi.org/10.3354/meps08174, 2009. a
Kiko, R., Brandt, P., Christiansen, S., Faustmann, J., Kriest, I., Rodrigues, E., Schütte, F., and Hauss, H.: Zooplankton-mediated fluxes in the eastern tropical North Atlantic, Frontiers in Marine Science, 7, 358, https://doi.org/10.3389/fmars.2020.00358, 2020. a
Kobari, T., Steinberg, D. K., Ueda, A., Tsuda, A., Silver, M. W., and Kitamura, M.: Impacts of ontogenetically migrating copepods on downward carbon flux in the western subarctic Pacific Ocean, Deep-Sea Res. Pt. II, 55, 1648–1660, https://doi.org/10.1016/j.dsr2.2008.04.016, 2008. a
Koslow, J. A., Kloser, R. J., and Williams, A.: Pelagic biomass and community structure over the mid-continental slope off southeastern Australia based upon acoustic and midwater trawl sampling, Mar. Ecol.-Prog. Ser., 146, 21–35, https://doi.org/10.3354/meps146021, 1997. a
Koukouras, A., Doulgeraki, S., and Kitsos, M.-S.: Notes on the vertical distribution of pelagic shrimps (Decapoda, Natantia) in the Aegean Sea, Crustaceana, 73, 979–993, 2000. a
Kwong, L. E., Pakhomov, E. A., Suntsov, A. V., Seki, M. P., Brodeur, R. D., Pakhomova, L. G., and Domokos, R.: An intercomparison of the taxonomic and size composition of tropical macrozooplankton and micronekton collected using three sampling gears, Deep-Sea Res. Pt. I, 135, 34–45, https://doi.org/10.1016/j.dsr.2018.03.013, 2018. a, b
Kwong, L. E., Henschke, N., Pakhomov, E. A., Everett, J. D., and Suthers, I. M.: Mesozooplankton and Micronekton Active Carbon Transport in Contrasting Eddies, Frontiers in Marine Science, 6, 825, https://doi.org/10.3389/fmars.2019.00825, 2020. a
Kwong, L. E., Bahl, A. A., and Pakhomov, E. A.: Variability in micronekton active carbon transport estimates on the Southwest Coast of Oahu using three different sampling gears, Frontiers in Marine Science, 9, 948485, https://doi.org/10.3389/fmars.2022.948485, 2022. a
Langbehn, T., Aksnes, D., Kaartvedt, S., Fiksen, Ø., and Jørgensen, C.: Light comfort zone in a mesopelagic fish emerges from adaptive behaviour along a latitudinal gradient, Mar. Ecol.-Prog. Ser., 623, 161–174, https://doi.org/10.3354/meps13024, 2019. a
Lasker, R.: Feeding, growth, respiration, and carbon utilization of a euphausiid crustacean, J. Fish. Board Can., 23, 1291–1317, https://doi.org/10.1139/f66-121, 1966. a
Lehodey, P., Murtugudde, R., and Senina, I.: Bridging the gap from ocean models to population dynamics of large marine predators: A model of mid-trophic functional groups, Prog. Oceanogr., 84, 69–84, https://doi.org/10.1016/j.pocean.2009.09.008, 2010. a
Lipiński, M.: Food and feeding of Loligo vulgaris reynaudii from St Francis Bay, South Africa, S. Afr. J. Marine Sci., 5, 557–564, https://doi.org/10.2989/025776187784522513, 1987. a
Longhurst, A., Bedo, A., Harrison, W., Head, E., and Sameoto, D.: Vertical flux of respiratory carbon by oceanic diel migrant biota, Deep-Sea Res., 37, 685–694, https://doi.org/10.1016/0198-0149(90)90098-G, 1990. a
Lorenzen, K., Camp, E. V., and Garlock, T. M.: Natural mortality and body size in fish populations, Fish. Res., 252, 106327, https://doi.org/10.1016/j.fishres.2022.106327, 2022. a
Mayzaud, P., Boutoute, M., Gasparini, S., Mousseau, L., and Lefevre, D.: Respiration in marine zooplankton–the other side of the coin: CO2 production, Limnol. Oceanogr., 50, 291–298, https://doi.org/10.4319/lo.2005.50.1.0291, 2005. a
McMonagle, H., Llopiz, J. K., Hilborn, R., and Essington, T. E.: High uncertainty in fish bioenergetics impedes precision of fish-mediated carbon transport estimates into the ocean's twilight zone, Prog. Oceanogr., 217, 103078, https://doi.org/10.1016/j.pocean.2023.103078, 2023. a, b, c
McMonagle, H., Llopiz, J. K., Maas, A. E., Steinberg, D. K., Govindarajan, A. F., and Essington, T. E.: Quantifying uncertainty in the contribution of mesopelagic fishes to the biological carbon pump in the Northeast Atlantic Ocean, ICES J. Mar. Sci., 81, 2037–2051, https://doi.org/10.1093/icesjms/fsae149, 2024. a
Memery, L., Tamburini, C., and Guidi, L.: APERO 2023 cruise, RV Thalassa, French Oceanographic Cruises [data set], https://doi.org/10.17600/18000666, 2023. a
Middelburg, J. J.: Marine carbon biogeochemistry: A primer for earth system scientists, Springer Nature, https://doi.org/10.1007/978-3-030-10822-9, 2019. a
Nowicki, M., DeVries, T., and Siegel, D. A.: Quantifying the carbon export and sequestration pathways of the ocean's biological carbon pump, Global Biogeochem. Cy., 36, e2021GB007083, https://doi.org/10.1029/2021GB007083, 2022. a
Pakhomov, E., Perissinotto, R., and McQuaid, C.: Prey composition and daily rations of myctophid fishes in the Southern Ocean, Mar. Ecol.-Prog. Ser., 134, 1–14, https://doi.org/10.3354/meps134001, 1996. a, b, c
Pakhomov, E. A., Podeswa, Y., Hunt, B. P. V., and Kwong, L. E.: Vertical distribution and active carbon transport by pelagic decapods in the North Pacific Subtropical Gyre, ICES J. Mar. Sci., 76, 702–717, https://doi.org/10.1093/icesjms/fsy134, 2019. a
Pauly, D. and Christensen, V.: Primary production required to sustain global fisheries, Nature, 374, 255–257, https://doi.org/10.1038/374255a0, 1995. a
Pauly, D., Piroddi, C., Hood, L., Bailly, N., Chu, E., Lam, V., Pakhomov, E. A., Pshenichnov, L. K., Radchenko, V. I., and Palomares, M. L. D.: The Biology of Mesopelagic Fishes and Their Catches (1950–2018) by Commercial and Experimental Fisheries, Journal of Marine Science and Engineering, 9, 1057, https://doi.org/10.3390/jmse9101057, 2021. a, b, c
Pearre, S.: Eat and run? The hunger/satiation hypothesis in vertical migration: history, evidence and consequences, Biol. Rev. Camb. Philos., 78, 1–79, https://doi.org/10.1017/S146479310200595X, 2003. a
Peterson, I. and Wroblewski, J. S.: Mortality Rate of Fishes in the Pelagic Ecosystem, Can. J. Fish. Aquat. Sci., 41, 1117–1120, https://doi.org/10.1139/f84-131, 1984. a
Phillips, B., Kremer, P., and Madin, L. P.: Defecation by Salpa thompsoni and its contribution to vertical flux in the Southern Ocean, Mar. Biol., 156, 455–467, https://doi.org/10.1007/s00227-008-1099-4, 2009. a
Pinti, J., DeVries, T., Norin, T., Serra-Pompei, C., Proud, R., Siegel, D. A., Kiørboe, T., Petrik, C. M., Andersen, K. H., Brierley, A. S., and Visser, A. W.: Model estimates of metazoans' contributions to the biological carbon pump, Biogeosciences, 20, 997–1009, https://doi.org/10.5194/bg-20-997-2023, 2023. a
Quetglas, A., de Mesa, A., Ordines, F., and Grau, A.: Life history of the deep-sea cephalopod family Histioteuthidae in the western Mediterranean, Deep-Sea Res. Pt. I, 57, 999–1008, https://doi.org/10.1016/j.dsr.2010.04.008, 2010. a
Rosland, R. and Giske, J.: A dynamic optimization model of the diel vertical distribution of a pelagic planktivorous fish, Prog. Oceanogr., 34, 1–43, https://doi.org/10.1016/0079-6611(94)90025-6, 1994. a
Rosland, R. and Giske, J.: A dynamic model for the life history of Maurolicus muelleri, a pelagic planktivorous fish, Fish. Oceanogr., 6, 19–34, https://doi.org/10.1046/j.1365-2419.1997.00023.x, 1997. a
Røstad, A., Kaartvedt, S., and Aksnes, D. L.: Light comfort zones of mesopelagic acoustic scattering layers in two contrasting optical environments, Deep-Sea Res. Pt. I, 113, 1–6, https://doi.org/10.1016/j.dsr.2016.02.020, 2016. a
Saba, G. K., Burd, A. B., Dunne, J. P., Hernández-León, S., Martin, A. H., Rose, K. A., Salisbury, J., Steinberg, D. K., Trueman, C. N., Wilson, R. W., and Wilson, S. E.: Toward a better understanding of fish-based contribution to ocean carbon flux, Limnol. Oceanogr., 66, 1639–1664, https://doi.org/10.1002/lno.11709, 2021. a
Saltelli, A.: Making best use of model evaluations to compute sensitivity indices, Comput. Phys. Commun., 145, 280–297, https://doi.org/10.1016/S0010-4655(02)00280-1, 2002. a
Saltelli, A., Annoni, P., Azzini, I., Campolongo, F., Ratto, M., and Tarantola, S.: Variance based sensitivity analysis of model output. Design and estimator for the total sensitivity index, Comput. Phys. Commun., 181, 259–270, https://doi.org/10.1016/j.cpc.2009.09.018, 2010. a
Sanders, R., Henson, S. A., Koski, M., De La Rocha, C. L., Painter, S. C., Poulton, A. J., Riley, Salihoglu, B., Visser, A., Yool, A., Bellerby, R., and Martin, A. P.: The biological carbon pump in the North Atlantic, Prog. Oceanogr., 129, 200–218, https://doi.org/10.1016/j.pocean.2014.05.005, 2014. a
Sarmiento, J. L.: Ocean biogeochemical dynamics, Princeton University Press, https://doi.org/10.1515/9781400849079, 2006. a
Schadeberg, A., Kraan, M., Groeneveld, R., Trilling, D., and Bush, S.: Science governs the future of the mesopelagic zone, npj Ocean Sustainability, 2, 2, https://doi.org/10.1038/s44183-023-00008-8, 2023. a
Schukat, A., Bode, M., Auel, H., Carballo, R., Martin, B., Koppelmann, R., and Hagen, W.: Pelagic decapods in the northern Benguela upwelling system: Distribution, ecophysiology and contribution to active carbon flux, Deep-Sea Res. Pt. I, 75, 146–156, https://doi.org/10.1016/j.dsr.2013.02.003, 2013. a
Serra-Pompei, C., Ward, B. A., Pinti, J., Visser, A. W., Kiørboe, T., and Andersen, K. H.: Linking Plankton Size Spectra and Community Composition to Carbon Export and Its Efficiency, Global Biogeochem. Cy., 36, e2021GB007275, https://doi.org/10.1029/2021GB007275, 2022. a
Siegel, D., Buesseler, K., Doney, S. C., Sailley, S., Behrenfeld, M. J., and Boyd, P.: Global assessment of ocean carbon export by combining satellite observations and food-web models, Global Biogeochem. Cy., 28, 181–196, https://doi.org/10.1002/2013GB004743, 2014. a
Sigman, D. M. and Boyle, E. A.: Glacial/interglacial variations in atmospheric carbon dioxide, Nature, 407, 859–869, https://doi.org/10.1038/35038000, 2000. a
Sobol, I. M.: Global sensitivity indices for nonlinear mathematical models and their Monte Carlo estimates, Math. Comput. Simulat., 55, 271–280, https://doi.org/10.1016/S0378-4754(00)00270-6, 2001. a
Steinberg, D. K. and Landry, M. R.: Zooplankton and the Ocean Carbon Cycle, Annu. Rev. Mar. Sci., 9, 413–444, https://doi.org/10.1146/annurev-marine-010814-015924, 2017. a
Steinberg, D. K., Carlson, C. A., Bates, N. R., Goldthwait, S. A., Madin, L. P., and Michaels, A. F.: Zooplankton vertical migration and the active transport of dissolved organic and inorganic carbon in the Sargasso Sea, Deep-Sea Res. Pt. I, 47, 137–158, https://doi.org/10.1016/S0967-0637(99)00052-7, 2000. a
Steinberg, D. K., Stamieszkin, K., Maas, A. E., Durkin, C. A., Passow, U., Estapa, M. L., Omand, M. M., McDonnell, A. M., Karp-Boss, L., Galbraith, M., and Siegel D. A.: The outsized role of salps in carbon export in the subarctic Northeast Pacific Ocean, Global Biogeochem. Cy., 37, e2022GB007523, https://doi.org/10.1029/2022GB007523, 2023. a
Sutton, T., Clark, M., Dunn, D., Halpin, P., Rogers, A., Guinotte, J., Bograd, S., Angel, M., Perez, J., Wishner, K., Haedrich, R., Lindsay, D., Drazen, J., Vereshchaka, A., Piatkowski, U., Morato, T., Blachowiak-Samolyk, K., Robison, B., Gjerde, K., and Heino, M.: A global biogeographic classification of the mesopelagic zone, Deep-Sea Res. Pt. I, 126, 85–102, https://doi.org/10.1016/j.dsr.2017.05.006, 2017. a
Thibault, H.: helene-thib/model_dvm_carbon: Modeling the contribution of micronekton diel vertical migrations to carbon export in the mesopelagic zone (Biogeosciences), Zenodo [code], https://doi.org/10.5281/zenodo.15240441, 2025. a
Torres, J. and Childress, J.: Relationship of oxygen consumption to swimming speed in Euphausia pacifica: 1. Effects of temperature and pressure, Mar. Biol., 74, 79–86, https://doi.org/10.1007/BF00394278, 1983. a, b
Turner, J. T.: Zooplankton fecal pellets, marine snow and sinking phytoplankton blooms, Aquat. Microb. Ecol., 27, 57–102, https://doi.org/10.3354/ame027057, 2002. a
Vestheim, H. and Kaartvedt, S.: Vertical migration, feeding and colouration in the mesopelagic shrimp Sergestes arcticus, J. Plankton Res., 31, 1427–1435, https://doi.org/10.1093/plankt/fbp077, 2009. a
Watanabe, H., Moku, M., Kawaguchi, K., Ishimaru, K., and Ohno, A.: Diel vertical migration of myctophid fishes (Family Myctophidae) in the transitional waters of the western North Pacific, Fish. Oceanogr., 8, 115–127, https://doi.org/10.1046/j.1365-2419.1999.00103.x, 1999. a
Woodstock, M. S., Sutton, T. T., and Zhang, Y.: A trait-based carbon export model for mesopelagic fishes in the Gulf of Mexico with consideration of asynchronous vertical migration, flux boundaries, and feeding guilds, Limnol. Oceanogr., 67, 1443–1455, https://doi.org/10.1002/lno.12093, 2022. a, b
Zaret, T. M. and Suffern, J. S.: Vertical migration in zooplankton as a predator avoidance mechanism1, Limnol. Oceanogr., 21, 804–813, https://doi.org/10.4319/lo.1976.21.6.0804, 1976. a
Zhang, X. and Dam, H. G.: Downward export of carbon by diel migrant mesozooplankton in the central equatorial Pacific, Deep-Sea Res. Pt. II, 44, 2191–2202, https://doi.org/10.1016/S0967-0645(97)00060-X, 1997. a, b