the Creative Commons Attribution 4.0 License.
the Creative Commons Attribution 4.0 License.
 | 15 May 2025
Multispecies expression of coccolithophore vital effects with changing CO2 concentrations and pH in the laboratory with insights for reconstructing CO2 levels in geological history
Goulwen Le Guevel
Fabrice Minoletti
Carla Geisen
Gwendoline Duong
Virginia Rojas
Michaël Hermoso
The coccolith sedimentary and micropalaeontological archive has fostered great interest in palaeoclimate applications. Indeed, the geochemistry of coccolith calcite has the potential to reconstruct both palaeo-CO2 concentrations and palaeo-temperature of seawater. Studying coccolith geochemistry aims at better understanding the changes in the vital effect of coccoliths with changes in environmental parameters, especially the carbonate chemistry of seawater. To this aim, we need to deconvolve the biological imprint from the environmental signals recorded in the composition of coccoliths. We have undertaken culture experiments of four coccolithophore strains with various sizes and growth rates, grown under eight CO2/pH conditions typifying the CO2 evolution of the Cenozoic era. We propose an assessment of the expression of the vital effects for Emiliania huxleyi, Gephyrocapsa oceanica, Helicosphaera carteri and Coccolithus braarudii with simultaneous changes in dissolved inorganic carbon (DIC) and pH in the medium resulting in variations in dissolved CO2 (CO2 aq) availability to the cells. We have identified a distinct isotopic response of C. braarudii to pCO2 levels on both sides of the 600 ppmv (pH 7.89) condition. We propose that this discrepancy is the result of a modification of the proton efflux across the plasma membrane through voltage-dependent proton channels. We further show that as the CO2 level rises and pH decreases (from 200 to 500 ppmv and from 8.29 to 7.96 pH units, respectively), a significant increase in of C. braarudii is expressed, along with a coeval decrease in . The constant physiological parameters of C. braarudii (growth rate, particulate inorganic carbon (PIC) and particulate organic carbon (POC)) across the 200 to 500 ppmv interval support the idea that the change in is the consequence of a lower fractionation between dissolved CO2 and organic matter. Meanwhile, the small cells of E. huxleyi and G. oceanica are less carbon-limited and do not exhibit any change in their carbon vital effects with changes in carbonate chemistry of the environment across the whole CO2 spectrum. Using this biogeochemical framework, we have established a calibration between CO2 aq concentration and the differential vital effect (Δδ13C) between isotopically invariant small G. oceanica and large coccoliths C. braarudii, whose vital effect is CO2-dependent at low CO2. The CO2–Δδ13C transfer equation allows palaeo-pCO2 reconstructions based on isotope changes explained by physiological processes, especially at low and medium CO2 levels.
- Article
(6692 KB) - Full-text XML
- BibTeX
- EndNote


The atmospheric concentration of carbon dioxide (pCO2) is a key parameter controlling global climate through its radiative forcing on Earth's surface temperatures. The reconstruction of past pCO2 is challenging to handle as many caveats exist in palaeo-CO2 barometry methods. The magnitude of the carbon isotope fractionation between membrane lipids called alkenones produced by the coccolithophores – found in sediments – and ambient aqueous CO2 constitutes the basis of the foremost palaeo-pCO2 proxy, referred to as εp-alk (Pagani et al., 2010; Zhang et al., 2019, 2020). This approach has led to significant advances in the understanding of the past CO2 concentration, but its application still has some limitations. Conversely to the coccolith archive, alkenone molecules are not ubiquitously preserved in marine sediments, and the assessment of pCO2 involves a cascade of calculations requiring assumptions made on the δ13C value of CO2 aq. Furthermore, this method has recently been shown to overestimate pCO2 below 270 ppmv (Badger et al., 2019), potentially leading to underestimated pCO2 above 270 ppmv. Alongside this proxy, the boron isotope fractionation in foraminifera tests has increasingly been used to reconstruct palaeo-pH (Rae et al., 2021). Combined with another parameter of the carbonate chemistry system as dissolved inorganic carbon (DIC) or alkalinity, and with temperature, palaeo-pH can be used for palaeo-pCO2 reconstructions (Foster, 2008; Sanyal et al., 1995). This proxy also suffers from uncertainties due to the evaluation of δ11B of past seawater among other unknown factors (Klochko et al., 2006; Tripati et al., 2011).
In this study, we investigated the fractionation of carbon and oxygen isotopes in phytoplanktonic organic matter and coccolith calcite driven by changes in the carbonate chemistry of coccolithophores culture media. We have conducted in vivo culture experiments that provide a means to constrain the cellular and isotopic responses of coccolithophores to environmental changes. Our culture experiments were conducted to quantify the isotopic departure of coccoliths from inorganic calcite, called the vital effect. The latter only depends on physico-chemical parameters of the environment such as , , temperature, salinity and pH (Zeebe and Wolf-Gladrow, 2001). However, when calcite is biomineralised intracellularly, biological parameters such as growth rate, cell size and the PICPOC ratio – which refers to the distribution of carbon between particulate organic carbon (POC) and particulate inorganic carbon (PIC) produced by calcifying organisms – also influence this fractionation (Dudley et al., 1986; McClelland et al., 2017; Rickaby et al., 2010). The causes behind the changes in the isotopic fractionation between the different cellular compartments are to be investigated at various stages of carbon fixation. Aqueous CO2, the main form of DIC entering coccolithophorid cells, diffuses through the plasma membrane via passive diffusion (Gutknecht et al., 1977). Aqueous CO2 diffusion is governed primarily by Fick's first law but also by the specific conditions of the cell boundary layer on the external side of the plasma membrane (Reinfelder, 2011; Wolf-Gladrow and Riebesell, 1997). In addition to passive CO2 diffusion, certain taxa of coccolithophores such as Emiliania possess CCMs (carbon concentration mechanisms), allowing the intake of through active transmembrane transport (Bach et al., 2013; Parker and Boron, 2013; Romero et al., 2004). As is enriched in 13C compared to CO2, the greater the acquisition of , the higher the δ13C values in the intracellular DIC pool and ultimately the higher the δ13C of coccolith calcite.
Once inside the cell, carbon is utilised by two main pathways: the fixation into organic matter via photosynthesis in chloroplasts and the precipitation of calcite-forming coccoliths within the coccolith vesicle. Carbon fixation into organic matter by the enzyme RuBisCO (ribulose 1,5-bisphosphate carboxylase/oxygenase) (Ellis, 1979) leads to fractionation as it preferentially fixes the lighter isotopes (12C) (Laws et al., 2001; Popp et al., 1998). Consequently, organic matter is relatively depleted in 13C (very negative ) compared to the carbon source and compared to the intracellular DIC pool (Bidigare et al., 1997; Guy et al., 1993; Rau et al., 1996). The fractionation induced by RuBisCO is one component of a more general fractionation between the CO2 aq from the external environment and the organic matter synthesised within the cell, which leads to an enrichment, denoted εp (Jasper and Hayes, 1990; Pagani et al., 1999). In addition to being dependent on the fractionation associated with RuBisCO, εp is influenced by physiological parameters such as growth rate, cell size and the presence of CCMs (Laws et al., 1995; Popp et al., 1998).
In this work, we provide both and values with changes in pCO2 and pH to explain the mechanisms responsible for the carbon isotope fractionation within the cell. The present study stems from several lines of evidence that the isotopic offset between coccoliths of different sizes conveys a specific pCO2 signal, as shown in sedimentary records by the work of Bolton and Stoll (2013). This empirical observation has been repeatedly reported in culture data (Hermoso, 2015; Hermoso et al., 2016a; McClelland et al., 2017; Rickaby et al., 2010). This approach used to derive palaeo-CO2 concentrations still needs to be fully constrained by implementing new cultures with a view to consolidating the calibration, although a proof of concept exists (Bolton and Stoll, 2013; Godbillot et al., 2022; Hermoso et al., 2016a, 2020; Tremblin et al., 2016). Modelling studies fed by culture data have identified and quantified the main forcing parameters behind the magnitude of the carbon isotope vital effect in coccolith calcite: growth rate, cell size, and the partitioning of CO2 in particulate inorganic matter and particulate organic matter (PICPOC ratio), among other ancillary parameters (McClelland et al., 2017).
Four strains of geological-relevant coccolithophores, representing a wide diversity of growth rate and coccolith and cell sizes, were cultured to study how the composition of the culture medium (DIC, pH) influences the magnitude of coccolith vital effects and to establish transfer functions between these vital effects and the aqueous CO2 concentrations and pH. In contrast with previous culture studies and to accurately mimic the carbonate chemistry of the ocean through the Cenozoic era, we cultured these calcifying microalgae with coupled pCO2 and pH perturbations of the medium. The culture conditions varied from 200 ppmv and 8.29 pH units (pre-industrial) to 1400 ppmv and 7.55 pH units (thought to represent the mid-Eocene levels), keeping all other parameters constant. Particular attention has been paid to conditions similar to those of the last 12 Myr (narrow step of 100 ppmv for pCO2 between 200 and 500 ppmv) because of the scarcity of available data.
2.1 Strains
We cultured four coccolithophore strains kindly provided by the biological station of Roscoff: RCC1200 Coccolithus braarudii, RCC1323 Helicosphaera carteri, RCC1314 Gephyrocapsa oceanica and RCC1256 Emiliania huxleyi (Fig. 1). These species represent a wide range of coccolith taxa with various coccosphere and cell sizes. The rationale of this choice is that they belong to the most abundant groups found in Neogene pelagic sediments (Bolton et al., 2012; Claxton et al., 2022).
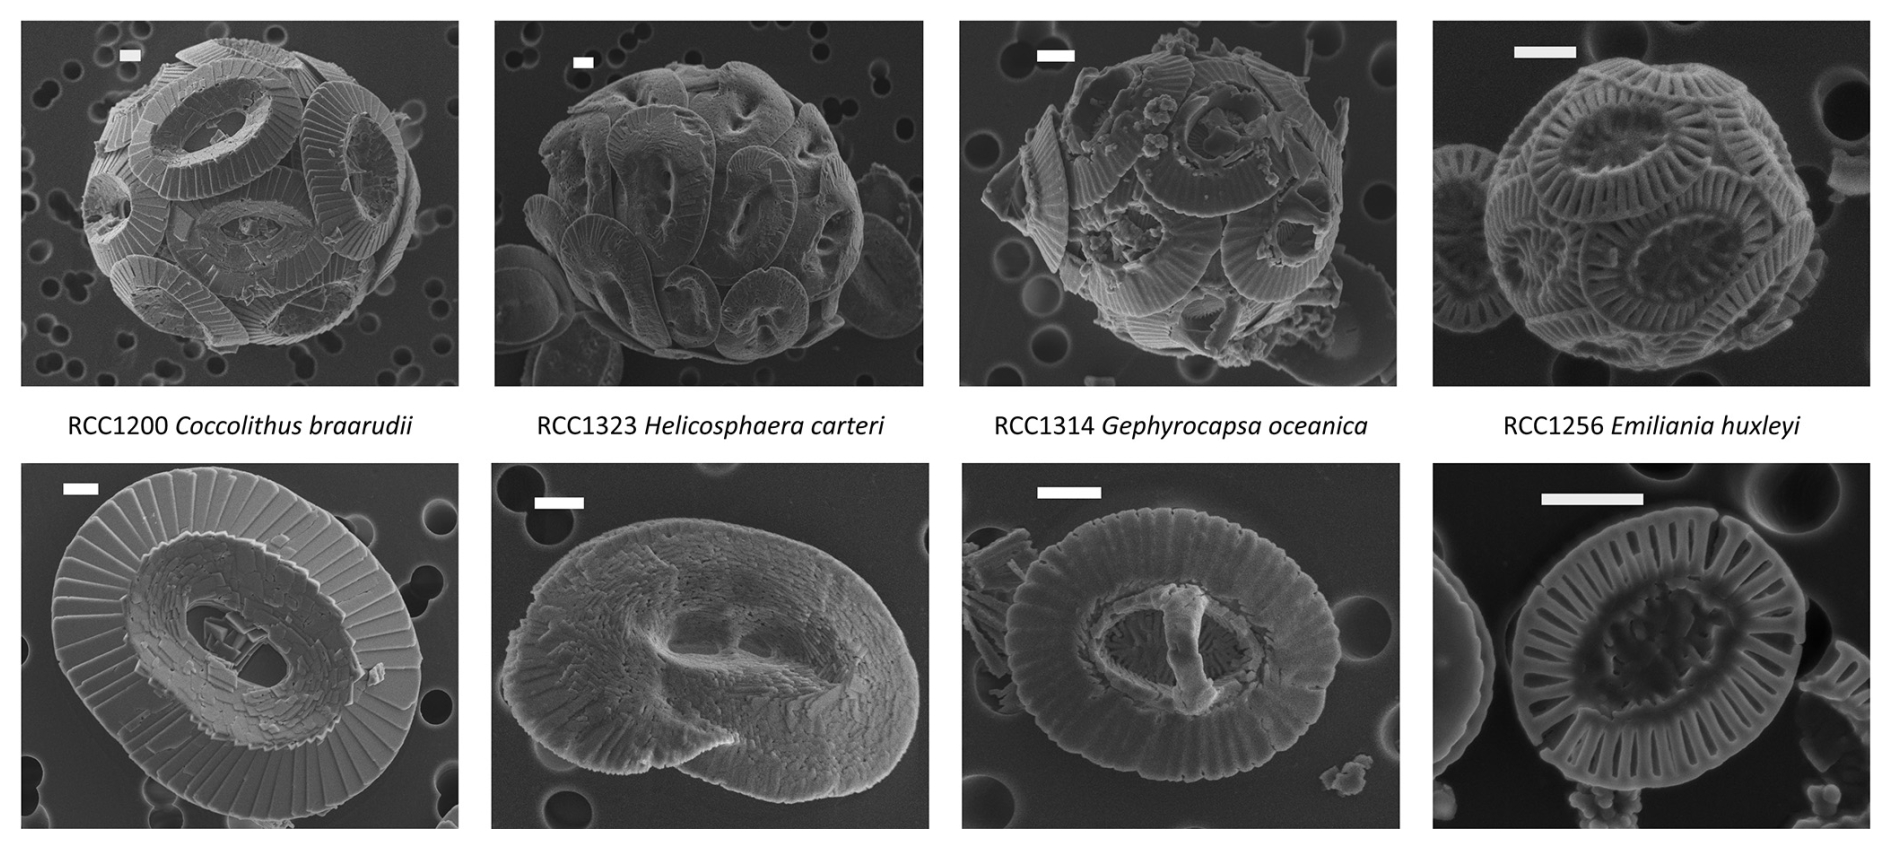
Figure 1Scanning electron microscope (SEM) images of the four studied strains. Top images show the coccospheres, and bottom images show the coccoliths. The scale bars represent 1 µm.
If comparable with our own study (mode of culture, temperature, pH, etc.), the results of previously published biogeochemical work on the same species will be presented along with our own data in the figures.
2.2 Medium preparation
Our culture experiments were designed to represent pH and pCO2 from the last greenhouse period (Eocene) to the pre-industrial Holocene oceanic conditions (Rae et al., 2021; Sosdian et al., 2018). Variable pCO2 levels between 200 and 1400 ppmv at a constant alkalinity of 2300 µmol kg−1 have been used to calculate the target pH (total scale) with the CO2SYS program (Lewis and Wallace, 1998). See Table 2 for details on the chemical parameters of the culture medium.
Artificial seawater with a salinity of 34 psu was prepared following the ESAW recipe of Berges et al. (2001). The use of artificial seawater was preferred over natural seawater in order to facilitate the production of the medium with the CO2 level under 400 ppmv. Phosphate, nitrate, silica, Fe-EDTA, trace metals and vitamins were added to produce K/2 media according to Keller et al. (1987). The DIC concentration was reached by adding different amounts of NaHCO3 (Sigma – batch CAS 144-55-8) (Table 1). The equivalence between the quantity of NaHCO3 added and the resulting DIC concentration was checked beforehand with a Picarro G2131-i isotope and gas concentration analyser coupled with an Apollo SciTech AS-D1 DIC-δ13C analyser at LOCEAN laboratory (Sorbonne University) and by potentiometric dosing at the SNAPO-CO2 service facility at LOCEAN laboratory (Sorbonne University). The pH values were checked by electrometric measurement using a Mettler Toledo pH InLab® Routine pro-ISM electrode. Calibration was performed using a T34 TRIS buffer solution (Del Valls and Dickson, 1998). The pH was adjusted with HCl and NaOH addition until the target pH was reached. This treatment led to a change in the relative abundance of the DIC species (see Bjerrum plot of carbonate speciation versus pH, Zeebe and Wolf-Gladrow, 2001). Lastly, the medium was sterilised with a 0.22 µm filtering step and stored without headspace in amber-coloured bottles at 15 °C in the dark.
Table 1Amount of NaHCO3 added to prepare the different media used in this study (conditions 1 to 8). The amount of NaHCO3 corresponds to the production of 1 L of artificial seawater.
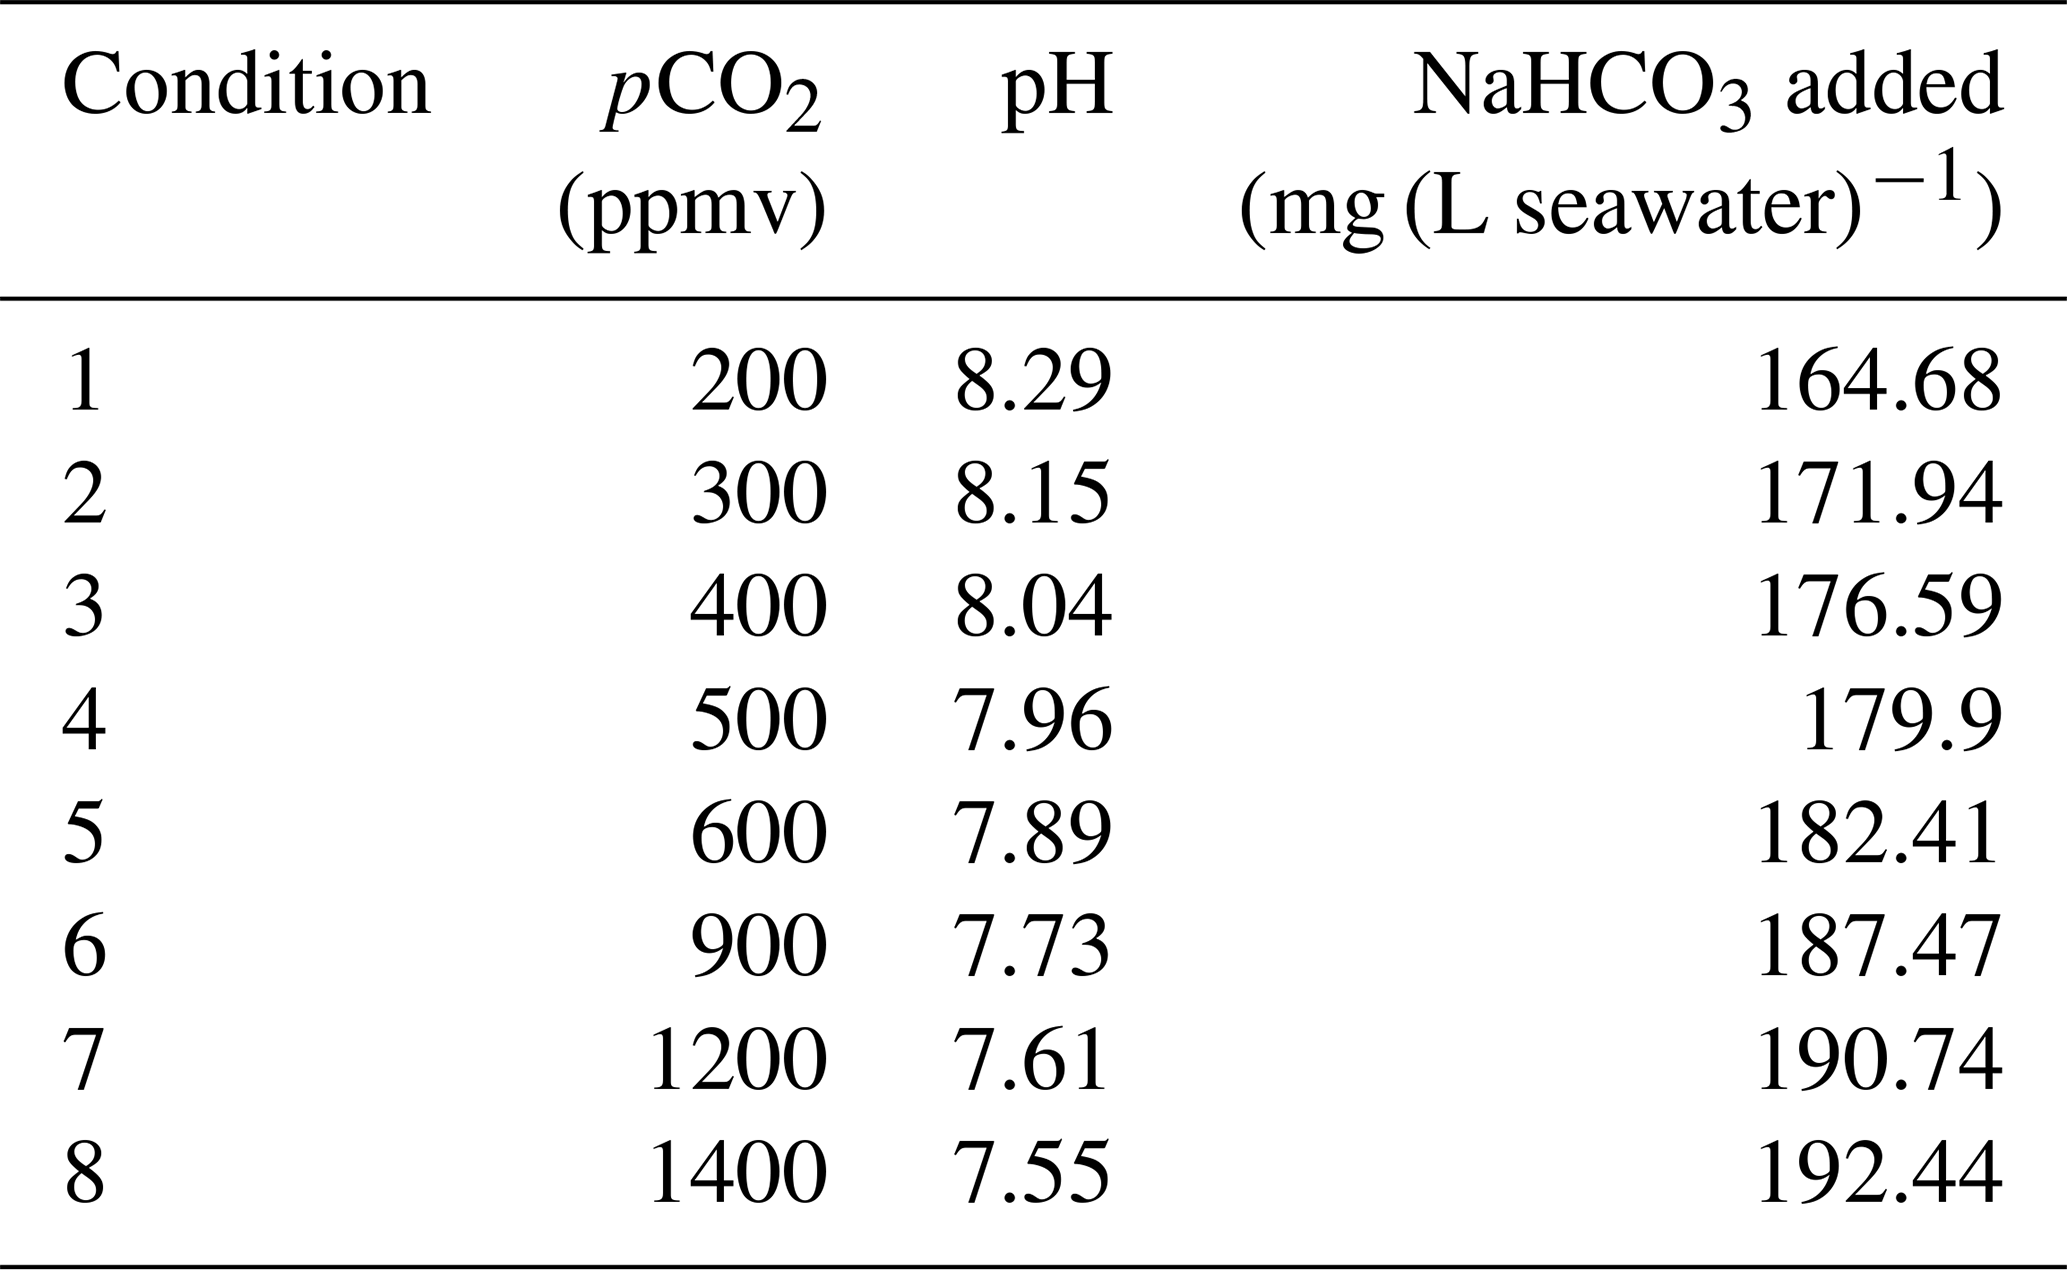
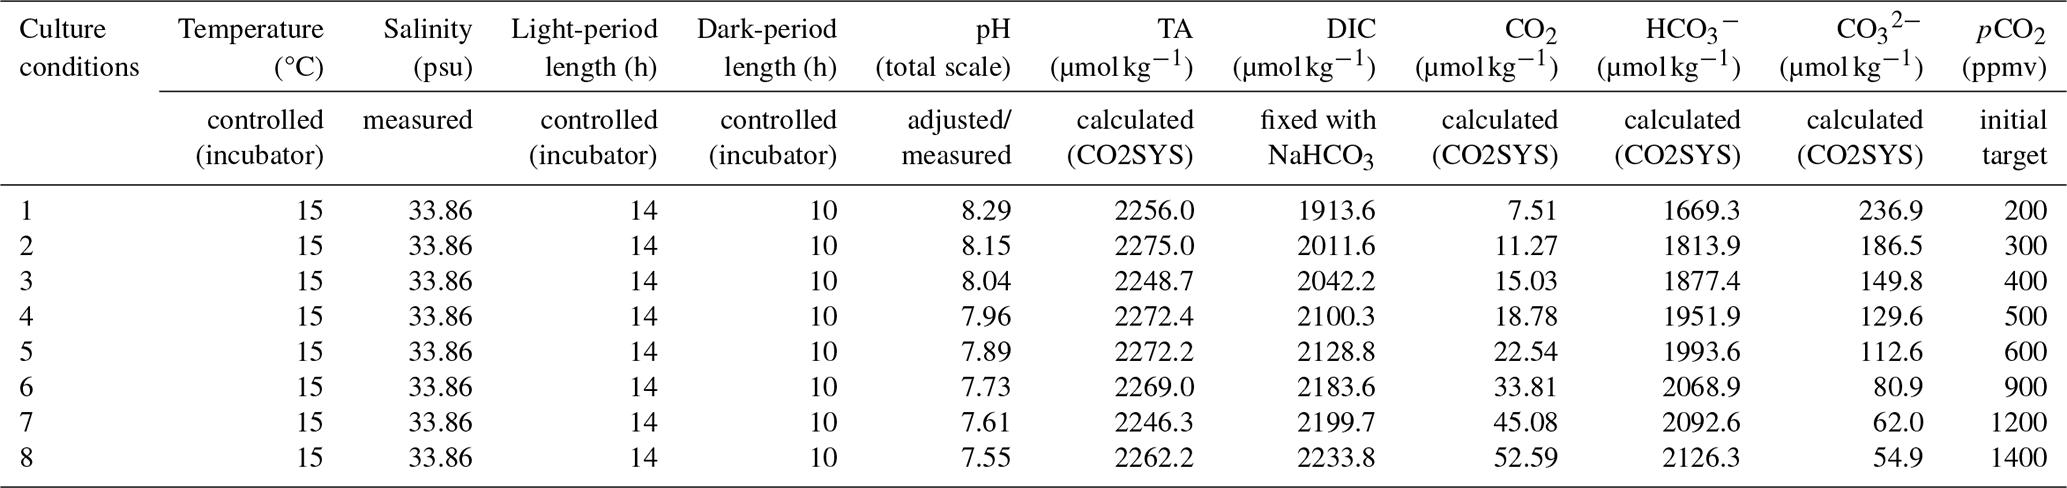
Table 2Experimental parameters of the mediums. The salinity has been measured in the initial medium. The temperature and the light- and dark-period length are controlled by an incubator setup. The total alkalinity (TA) and the DIC, CO2, and concentrations are calculated by the CO2SYS program. pCO2 and pH correspond to the culture conditions tested.
2.3 Culture growth
The cultures were undertaken at the Maison de la Recherche en Environment Naturel (ULCO – LOG) in Wimereux (northern France) in 2023–2024. The coccolithophore strains were first acclimatised to the medium during about 10 generations in 25 cm2 polystyrene flasks. The cells were then inoculated in triplicate experiments in culture bottles of increasing size (75 cm2 polystyrene flasks, 600 and 2300 mL polycarbonate bottles) until the target cell number of the culture was reached. The target cell number corresponds to a sufficient biomass for our analyses (between 2 and 10 mg for the small cells E. huxleyi and G. oceanica and between 50 and 60 mg for the large cells H. carteri and C. braarudii), while ensuring that the cultures remained adequately diluted (less than 8000 cells mL−1 for C. braarudii and for H. carteri and less than 20 000 cells mL−1 for E. huxleyi and for G. oceanica, in accordance with Riebesell et al., 2011).
The cell cultures were maintained at constant temperature (15 °C) with a 14–10 day–night cyclicity and an irradiance of 150 . The cells were regularly resuspended to avoid cell clustering and kept at relatively low concentrations to maintain homogeneous carbon bioavailability and light access during all the experiment. A daily control of the culture health was made with a reverse optical microscope under ×400 magnification. A final control of the coccoliths was made after the harvest with a Zeiss Supra 55 VP scanning electron microscope (SEM) at Sorbonne University.
Cell numeration and coccosphere sizes were measured using a Beckman Multisizer 4e Coulter counter calibrated with 10.16 µm latex beads. The measurements were always performed at the same time of the day (08:30–10:00 LT) to avoid biases related to the growth of the cell during the day phase.
The growth rate μ (in d−1) of a microorganism culture corresponds to the increase in the cell number by time units commonly calculated with the formula:
where c is the cell concentration, and tfinal−tinitial is the number of days between the initial and the final cell concentration measurements. To take into account all the concentration measurements, the μ was derived from the slope of the linear regression of the function , where x is the day of the measurement of cx.
2.4 Isotopic reference of the culture medium
The δ13C of the dissolved inorganic carbon () and the DIC concentrations were measured in 11 samples of various CO2 and pH levels with a Picarro G2131-i isotope and gas concentration analyser coupled with an Apollo SciTech AS-D1 DIC-δ13C analyser at LOCEAN laboratory (Sorbonne University). The medium samples were preserved in 500 mL glass bottles with a ground neck with 0.3 mL saturated HgCl2 solution. The measurements are calibrated with in-house standards. Since we used the same NaHCO3 powder batch for the different experiments, all the culture media had the same values (−12.17 ‰ Vienna Pee Dee Belemnite (V-PDB) (±0.07 ‰)).
The δ18O of seawater was measured by cavity ring-down spectroscopy (CRDS) using a Picarro instrument (model L2130-i Isotopic H2O) at LOCEAN, Sorbonne University. The in-house standards (freshwater) are calibrated using IAEA references V-SMOW (Vienna Standard Mean Ocean Water) and GISP (Greenland Ice Sheet Precipitation). The δ18O of the inorganic reference () in ‰V-PDB is calculated from the and temperature (15 °C) according to the equation of Kim and O'Neil (1997), modified by Tremblin et al. (2016). The slightly changed between successive culture campaigns: −6.44 ‰ V-SMOW (±0.03 ‰) for C. braarudii and G. oceanica, −6.67 ‰ V-SMOW (±0.03 ‰) for H. carteri, and −6.36 ‰ V-SMOW (±0.15 ‰) for E. huxleyi.
The oxygen vital effects are calculated as the difference between the δ18O of the coccoliths (VE18O) in ‰ V-PDB and the δ18O of a theoretical inorganic calcite () in ‰V-PDB:
2.5 Isotopic analysis on calcite
Two methods were used to collect the culture residues for further isotopic measurements of coccolith calcite:
-
RCC1200 C. braarudii and RCC1323 H. carteri culture residues were centrifuged during 15 min at 4500 rpm (relative centrifugal force of 4302×g) in 500 mL centrifuge bottles. After removing the supernatant, samples were rinsed with three cycles of centrifugation with replacement of the supernatant with neutralised demineralised water and homogenisation between each cycle. The rinsing is employed to remove the salt from the culture water. The culture residues were finally dried at 40 °C after the removal of the last supernatant.
-
RCC1256 E. huxleyi and RCC1314 G. oceanica samples were collected and rinsed three times with neutralised demineralised water onto polycarbonate filtering membranes and then dried in a desiccator. We applied a different harvesting method for those strains because of their small size, which induced too much material loss during the centrifugation process. All culture residues were stored at 5 °C after harvest.
Isotopic measurements on calcite were performed at the ISTeP laboratory (Sorbonne University). Between 30 and 60 µg of the samples were digested with 100 % phosphoric acid at 70 °C in pre-evacuated vials using a Kiel IV carbonate device. The evolved CO2 was purified in a cryogenic trapping system, and carbon and oxygen isotope compositions were measured in an isotope-ratio mass spectrometer DELTA V advantage (Thermo Scientific) with a dual-inlet introduction system. The carbon and oxygen isotope compositions were expressed in the delta notation as a value relative to the Vienna Pee Dee Belemnite (V-PDB) and reported as per mil (‰). δ13C and δ18O values were calibrated using NBS-19 and NBS-18 international standards. Internal reproducibility and accuracy were monitored by replicate analysis of in-house calcite standard Marceau (δ13C=2.12 ‰ and ), the measured values for δ13C and δ18O being 2.10 ‰ ± 0.08 ‰ (1σ) and −1.89 ‰ ± 0.10 ‰ (1σ), respectively. The external reproducibility, obtained from replicate analysis of the samples, is better than 0.05 ‰ (1σ) for and 0.10 ‰ (1σ) for . Transfer equations between coccolith isotope ratios and CO2 levels are proposed in this study. The residual errors (also accounting for pH/CO2 uncertainties) are evaluated through Monte Carlo analysis code with 1 000 000 iterations and an uncertainty of 0.17 ‰ for the differential vital effect between small and large coccoliths (1σ).
2.6 Carbon isotope analysis of the organic matter
The culture residues of C. braarudii, G. oceanica and E. huxleyi were gathered onto glass microfiber filters (GFFs), previously burnt at 400 °C for 3 h to remove all trace of residual organic matter. After gathering the culture residues, the GFFs were rinsed three times with neutralised demineralised (Millipore®) water (adjusted to pH 7 by adding sodium hydroxide) and then stored at −18 °C. We then gently scratched the superficial part of the GFFs to collect all the culture residue. The culture residues were decarbonated with hydrochloric acid 2 N overnight. The samples were then rinsed to eliminate the excess of hydrochloric acid and released Ca2+ and alkalinity and then dried at 35 °C. Between 10 and 50 µg of decarbonated culture residue (only organic matter) was weighted and loaded into tin capsules.
The carbon isotope composition of the organic matter was measured at the Stable Isotope Geochemistry laboratory at IPGP (Institut de Physique du Globe de Paris). A Flash EA 1112 elemental analyser coupled in continuous helium flow to a Thermo Fisher Scientific DELTA V Plus isotope ratio mass spectrometer was used for the C. braarudii samples cultured between 200 and 500 ppmv (8.29 and 7.96 pH units). For G. oceanica and E. huxleyi for all culture conditions, and for C. braarudii between 500 and 1400 ppmv (7.96 and 7.55), we used an Elementar vario PYRO cube analyser coupled with the same DELTA V Plus spectrometer at IPGP. Three organic-rich internal standards, calibrated against international standards, were used to calculate the δ13C values of the samples, reported as per mil with respect to V-PDB. Replicate analysis of standards yielded an internal reproducibility better than 0.10 ‰ (1σ). Accuracy was assessed by measuring an in-house Tyrosine standard (), for which the estimated error was better than 0.20 ‰. The external reproducibility for δ13Corg, obtained from replicate analysis of the samples, is better than 0.07 %.
2.7 Carbon content analysis
The PIC : POC ratios of the four strains studied under various pCO2 and pH conditions were measured at the Wimereux marine station using a Thermo Fisher Flash 2000 elemental analyser. The culture residues were collected and stored in the same way for analyses of the δ13Corg. The calibration used for reconstructing carbon content was done with various amounts of acetanilide with a known amount of carbon and nitrogen. Samples for POC analysis were previously acidified. The filters were encapsulated in a tin disc before analysis.
3.1 Physiological parameters and carbon content
3.1.1 Growth rates
The growth rates of the four strains do not show any statistical trend with changes in the carbonate chemistry of the medium (C. braarudii: r2=0.04 and p>0.05, H. carteri: r2=0.08 and p>0.05, G. oceanica: r2=0.11 and p>0.05, E. huxleyi: r2=0.38 and p<0.01) (Fig. 2). In particular, the linear regression between replicated values of growth rates and CO2 concentration below 600 ppmv gives a p value of 0.052 and a r2 of 0.41. More than 85 % of the data are within a ±15 % relative range of the mean growth rate for each strain (coloured band in Fig. 2). E. huxleyi and G. oceanica have the higher mean growth rate (0.87 and 0.67 d−1, respectively), while the larger C. braarudii and H. carteri have a mean growth rate of 0.58 and 0.24 d−1, respectively (Fig. 2). These absolute values are similar to those obtained in previous studies for E. huxleyi, G. oceanica and C. braarudii (Phelps et al., 2021; Rickaby et al., 2010). C. braarudii has been reported with decreasing growth rates with rising CO2 levels (Hermoso et al., 2016a; Rickaby et al., 2010).
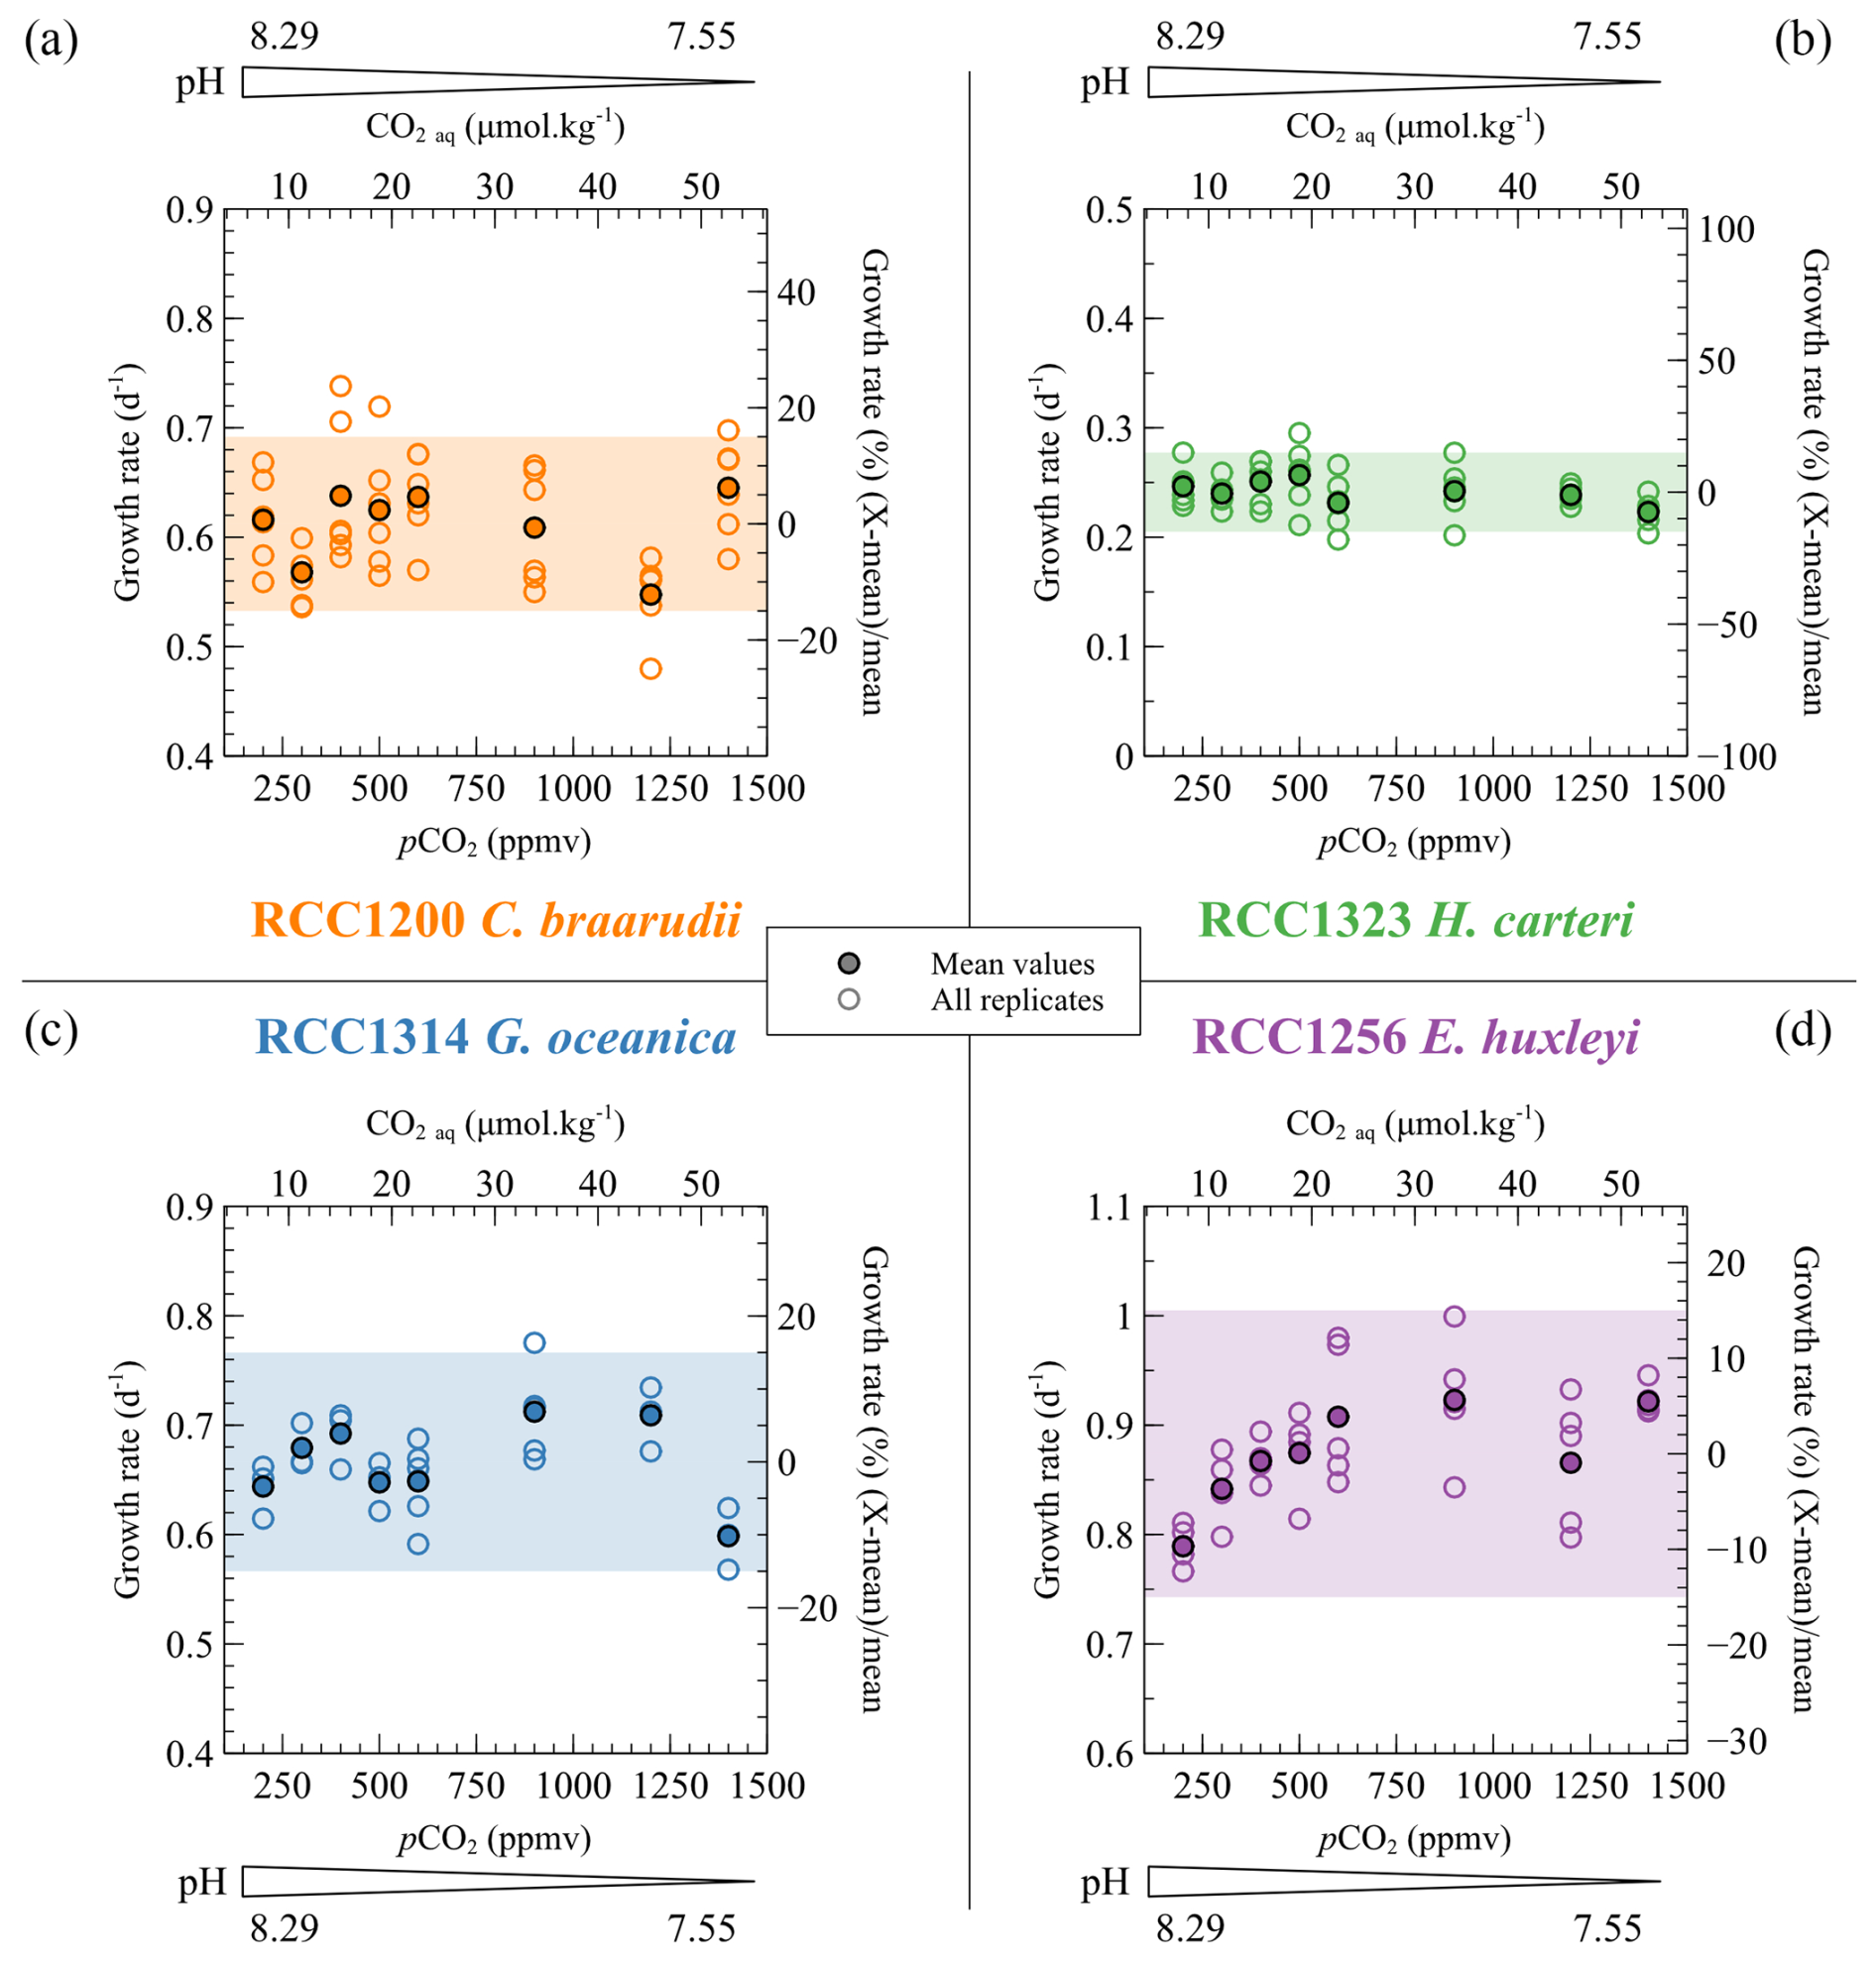
Figure 2Specific growth rate (μ) of the four cultured strains with respect to CO2 level and pH of the culture media. The empty dots show all the replicate data, and the filled dots denote the mean growth rates. Growth rates are given per day (d−1) (left axis) and as a relative deviation of the mean growth rate of each strain (right axis). The coloured bands correspond to the range of ±15 % of variation from the mean growth rate. More than 85 % of the data are within this range.
3.1.2 Coccosphere sizes
The sizes of the coccospheres – i.e. the coccolithophore exoskeletons surrounding the cells, composed of coccoliths – approximate the evolution of cell size. The evolution of this parameter with CO2 and pH varies among the different strains. C. braarudii displays the largest coccospheres amongst the cultured strains. The mean coccosphere diameter of C. braarudii increases from 16.7 to 18.4 µm with increasing CO2 levels from 200 to 600 ppmv and decreasing pH from 8.29 to 7.89 units of pH. The +1.70 µm increase in the coccosphere size represents a relative variation of 10.2 % (r2=0.86, p<0.01). For higher pCO2 and lower pH, the distribution of the coccosphere sizes is not linked with the carbonate chemistry (Fig. 3). The size of H. carteri presents a hyperbolic trend (r2=0.72, p<0.01) of the coccosphere size with increasing CO2 level and decreasing pH (+0.69 µm from 200 ppmv and 8.29 pH units to 600 ppmv and 7.89 pH units and −1.05 µm from 600 ppmv and 7.89 pH units to 1400 ppmv and 7.55 pH units) (Fig. 3). The size of the coccospheres produced by G. oceanica decreases from 8.0 to 7.5 µm with increasing CO2 levels from 200 to 1200 ppmv and decreasing pH from 8.29 to 7.55 (−0.51 µm, a relative variation of 6.4 %, r2=0.67, p<0.01) (Fig. 3). The coccosphere size of the small species E. huxleyi exhibits a +0.22 µm increase with increasing pCO2 and decreasing pH until 600 ppmv and 7.89 pH units (a relative variation of 4.4 %, r2=0.77, p<0.001). At higher pCO2 and lower pH conditions, the coccosphere size is constant (r2=0.04, p>0.05) (Fig. 3). These absolute values and trends in coccosphere size with changes in CO2 level and pH are in line with previously reported coccosphere and cell sizes from previous culture studies (Hermoso, 2015; Hermoso et al., 2014, 2016a; Phelps et al., 2021; Rickaby et al., 2010).
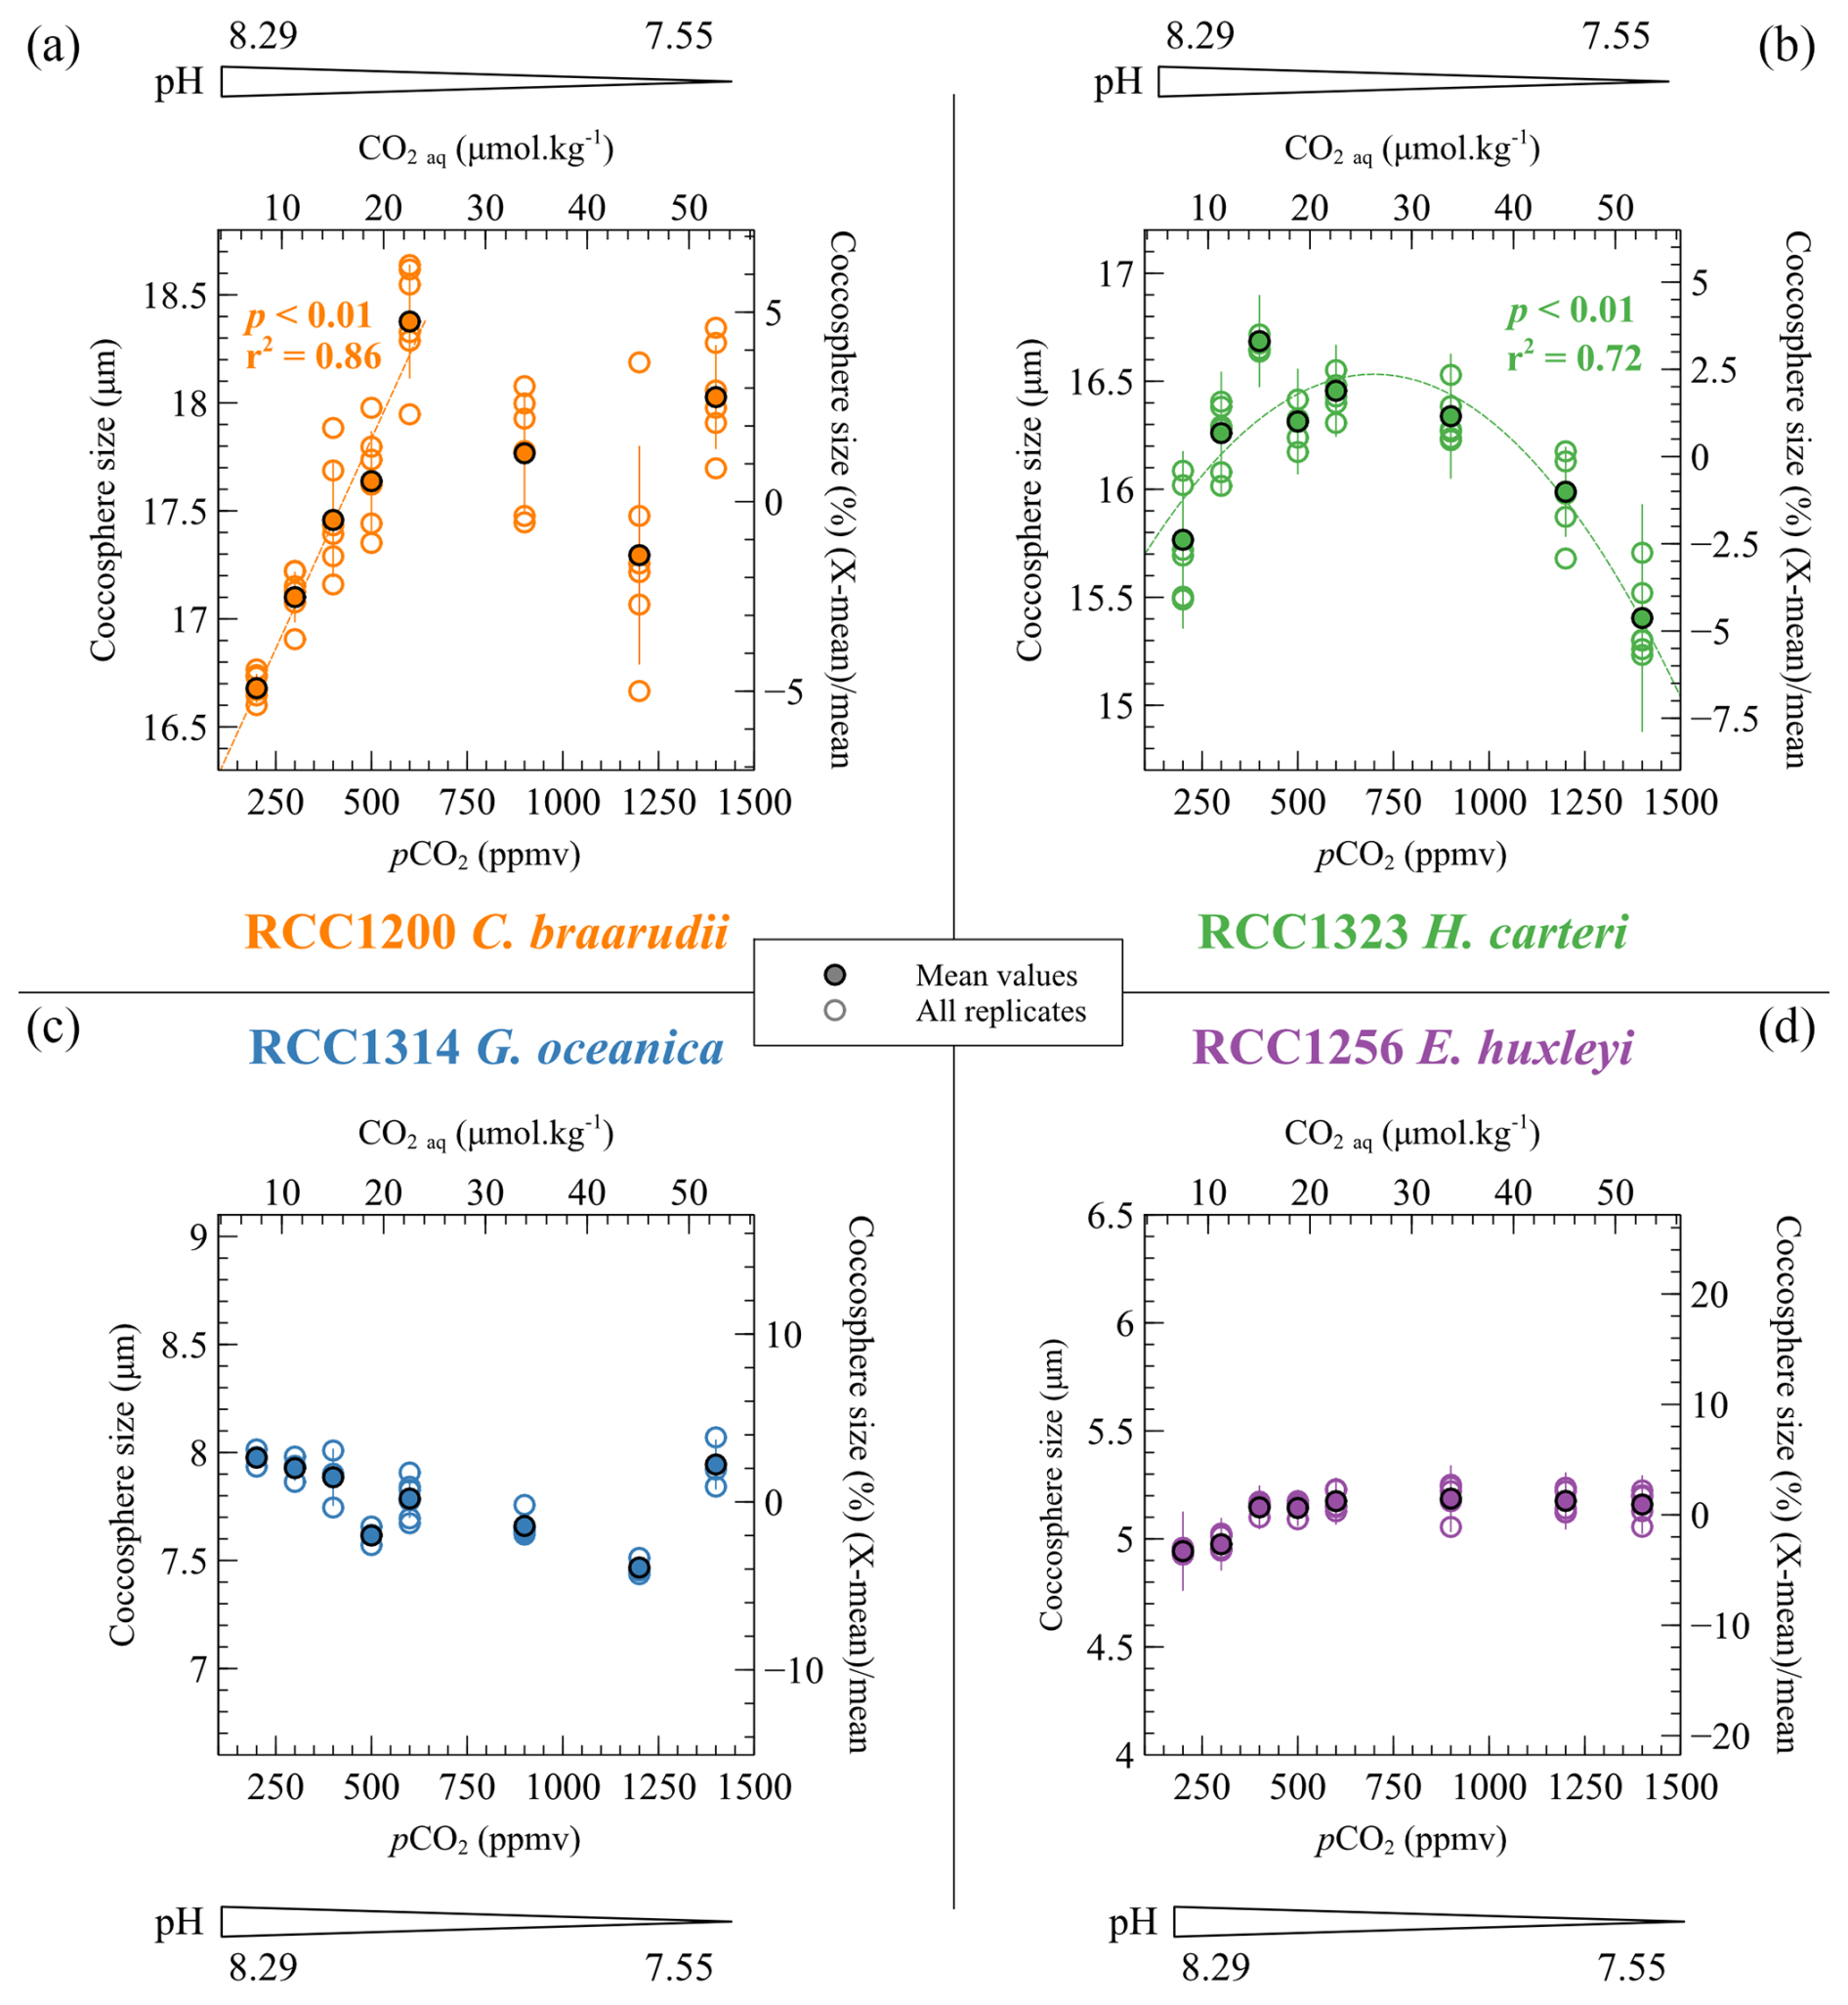
Figure 3Evolution of the coccosphere sizes of the four cultured strains as a function of the CO2 and pH culture conditions. The coccosphere sizes are given as the mean diameter of the coccospheres. They are given in micrometres (µm) (left axis) and as a percent relative to the mean coccosphere size of each strain (right axis). The empty points show the replicate data, and the filled points show the mean coccosphere sizes.
3.1.3 PIC : POC ratios
The PIC : POC ratio allows quantification of the respective allocation of carbon in its two fixation pathways (photosynthesis and calcification), which has isotopic implications for organic matter and coccoliths. The PIC : POC ratios of the four species do not show any statistically significant trend with changes in carbonate chemistry. Among the species cultured, C. braarudii has the highest PIC : POC ratio (mean value of 2.23 ± 0.49), followed by H. carteri (mean value of 1.44 ± 0.35), G. oceanica (0.98 ± 0.20) and E. huxleyi (0.50 ± 0.09) (Fig. 4). These data are consistent with previously published PIC : POC data (Krug et al., 2011; Langer et al., 2006; Müller et al., 2010; Rickaby et al., 2010; Riebesell et al., 2000).
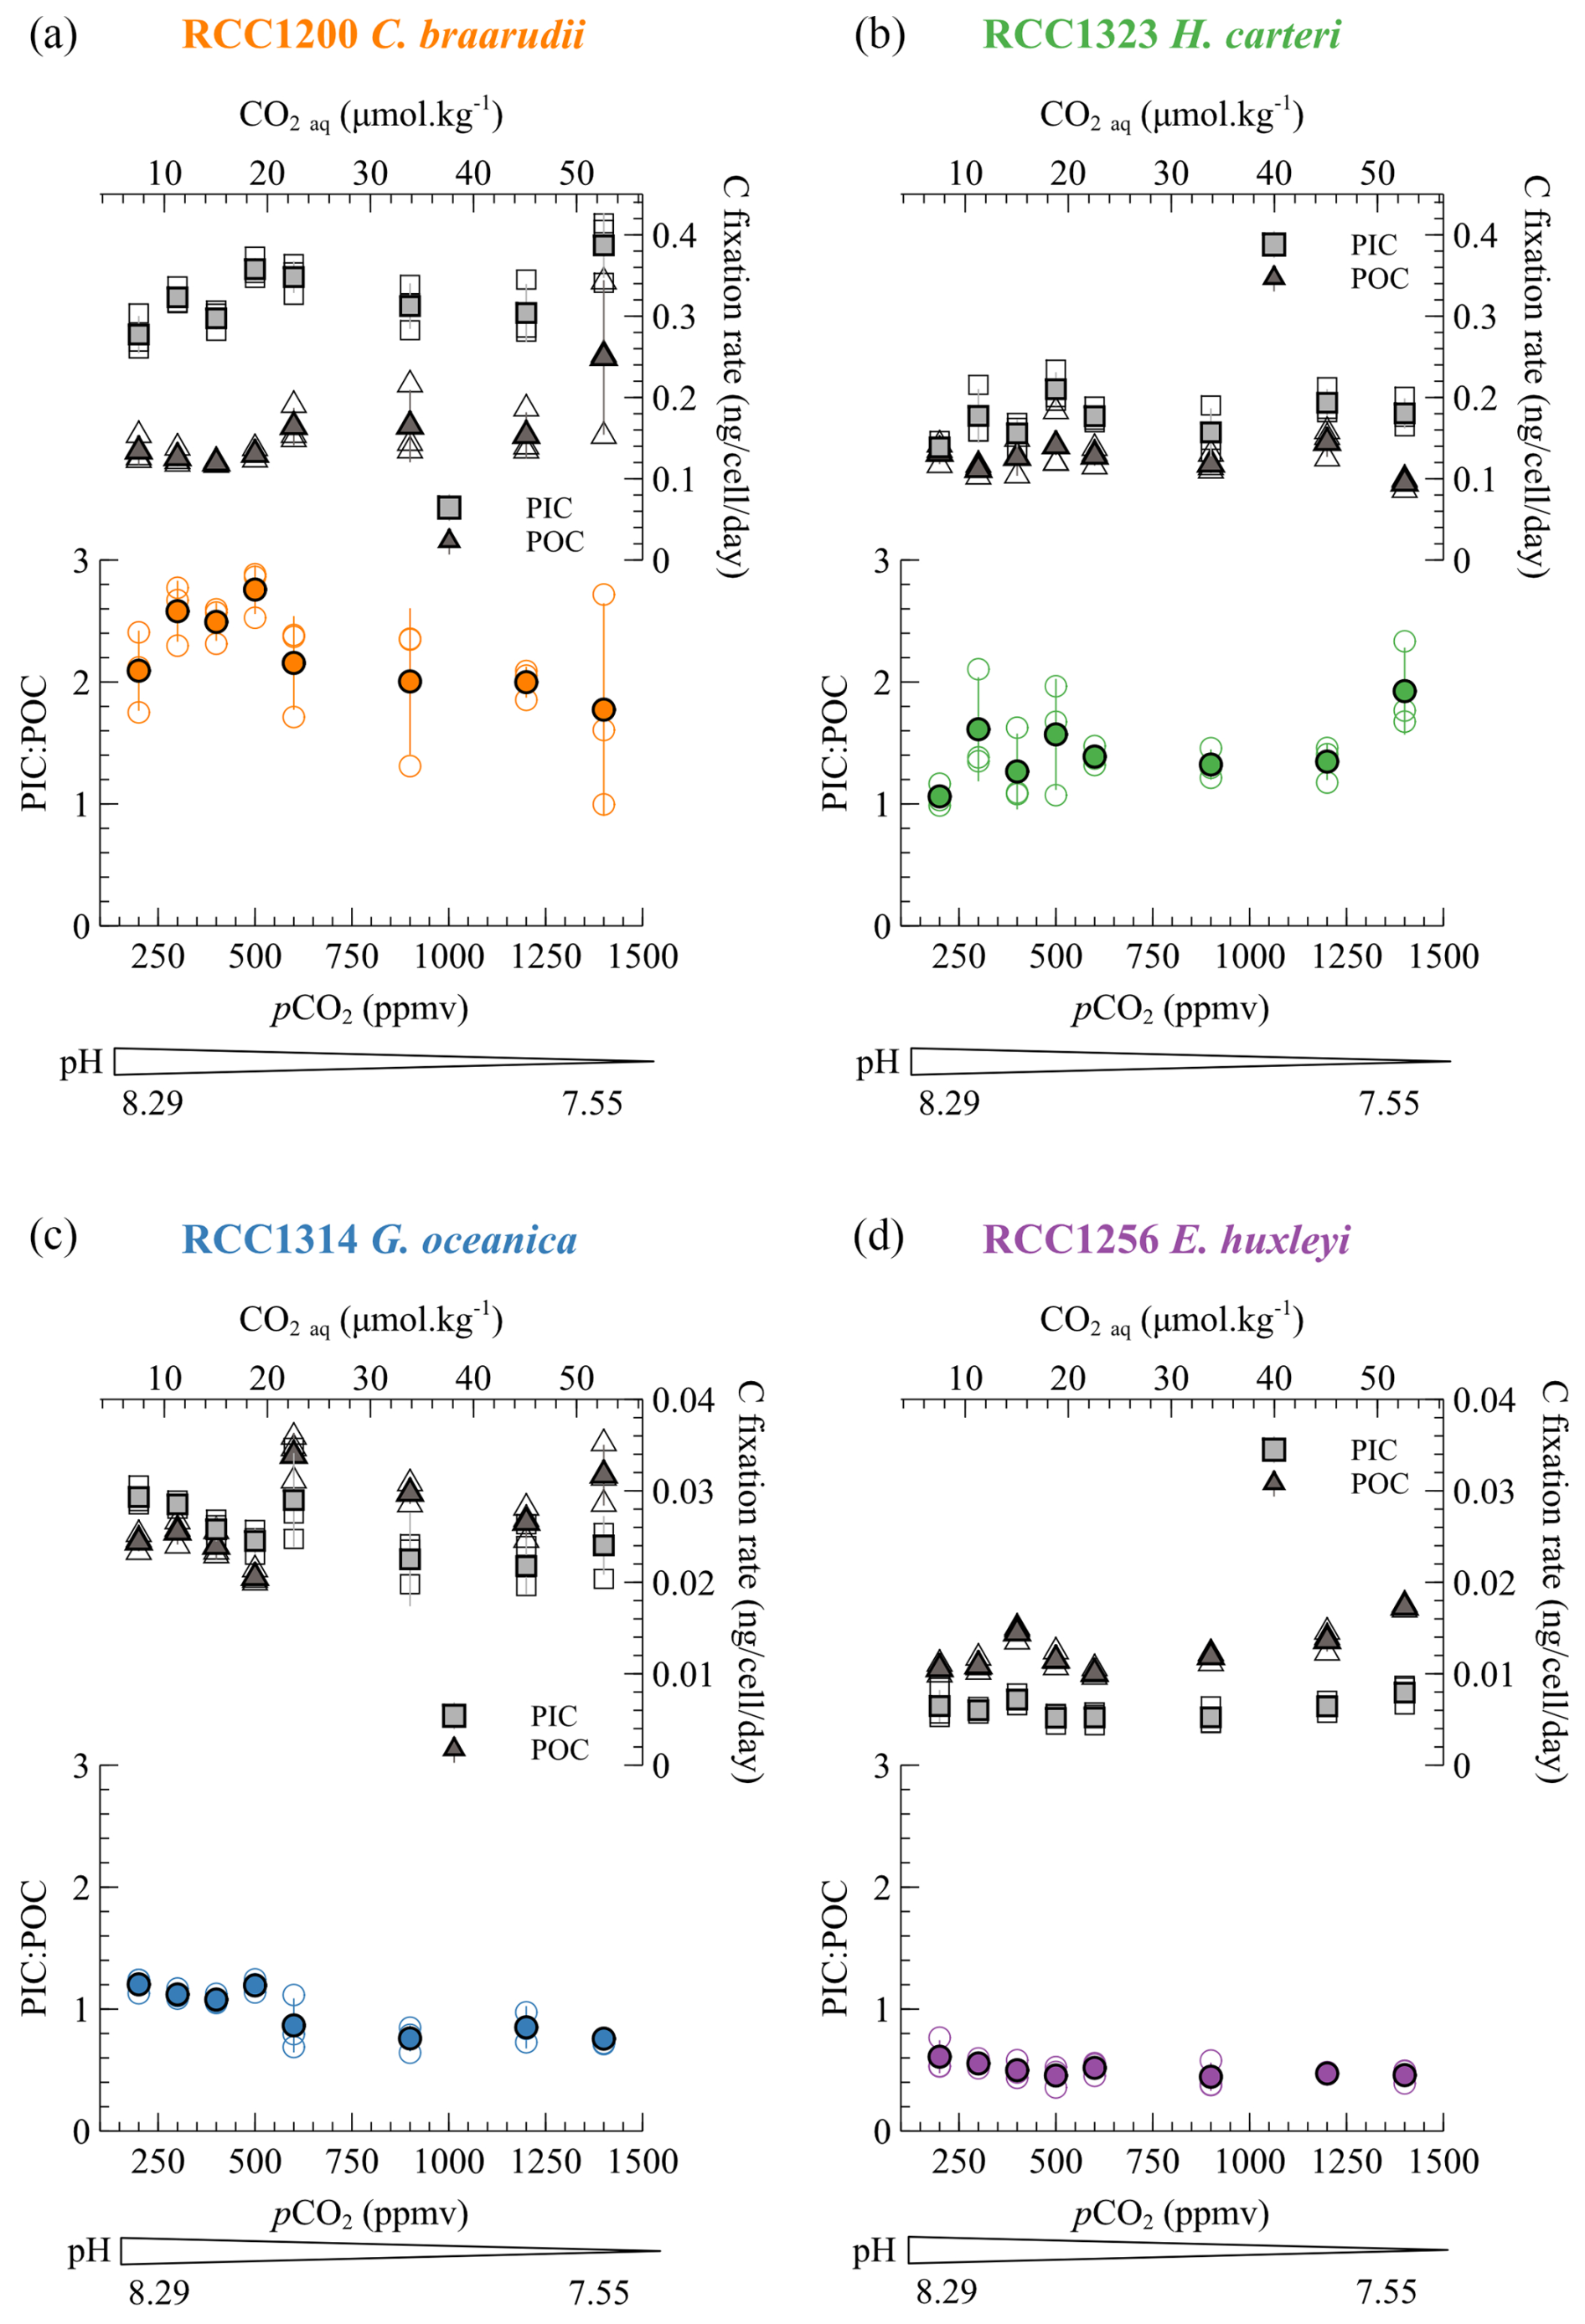
Figure 4Particulate inorganic (square) and organic (triangle) carbon in nanograms (ng) per cell for each of the four species through the pCO2 interval of the study (lower x axis) and the aqueous CO2 (upper x axis). The PIC : POC ratios are also shown. The empty dots are all the replicate data, and the filled points are the mean values for each species/condition.
3.2 Carbon isotope ratios of coccolith calcite
The species E. huxleyi does not show any significant trend in with changes in pCO2 and pH (r2=0.16, p>0.05). The taxon H. carteri exhibits a minor increase of less than 0.5 ‰ in with increasing CO2 level et decreasing pH (r2=0.49, p<0.001) (Fig. 5). A key feature of the dataset pertains to the biogeochemical response of C braarudii. The distribution of the isotope data with changes in carbonate chemistry can be divided into two distinct trends for C. braarudii and G. oceanica. The first trend corresponds to low CO2 level from 200 to 500 ppmv and high pH from 8.29 to 7.96. The second stage corresponds to high CO2 level from 600 to 1400 ppmv and low pH from 7.89 to 7.55 pH units. At low CO2 levels and high pH, the of C. braarudii increases with increasing pCO2 and decreasing pH (+2.41 ‰ V-PDB, a relative variation of 14 %, r2=0.83, p<0.001). Regarding G. oceanica, it exhibits a small increase with increasing pCO2 and decreasing pH (+0.41 ‰ V-PDB, a relative variation of 3 %, r2=0.61, p<0.01). Compared to low pCO2 levels and high pH, the of C. braarudii increases with a less steep slope at high CO2 levels and low pH (+0.92 ‰ V-PDB, a relative variation of 7 %, r2=0.90, p<0.001). The of G. oceanica is steady at high pCO2 and low pH (r2=0.10, p>0.05).
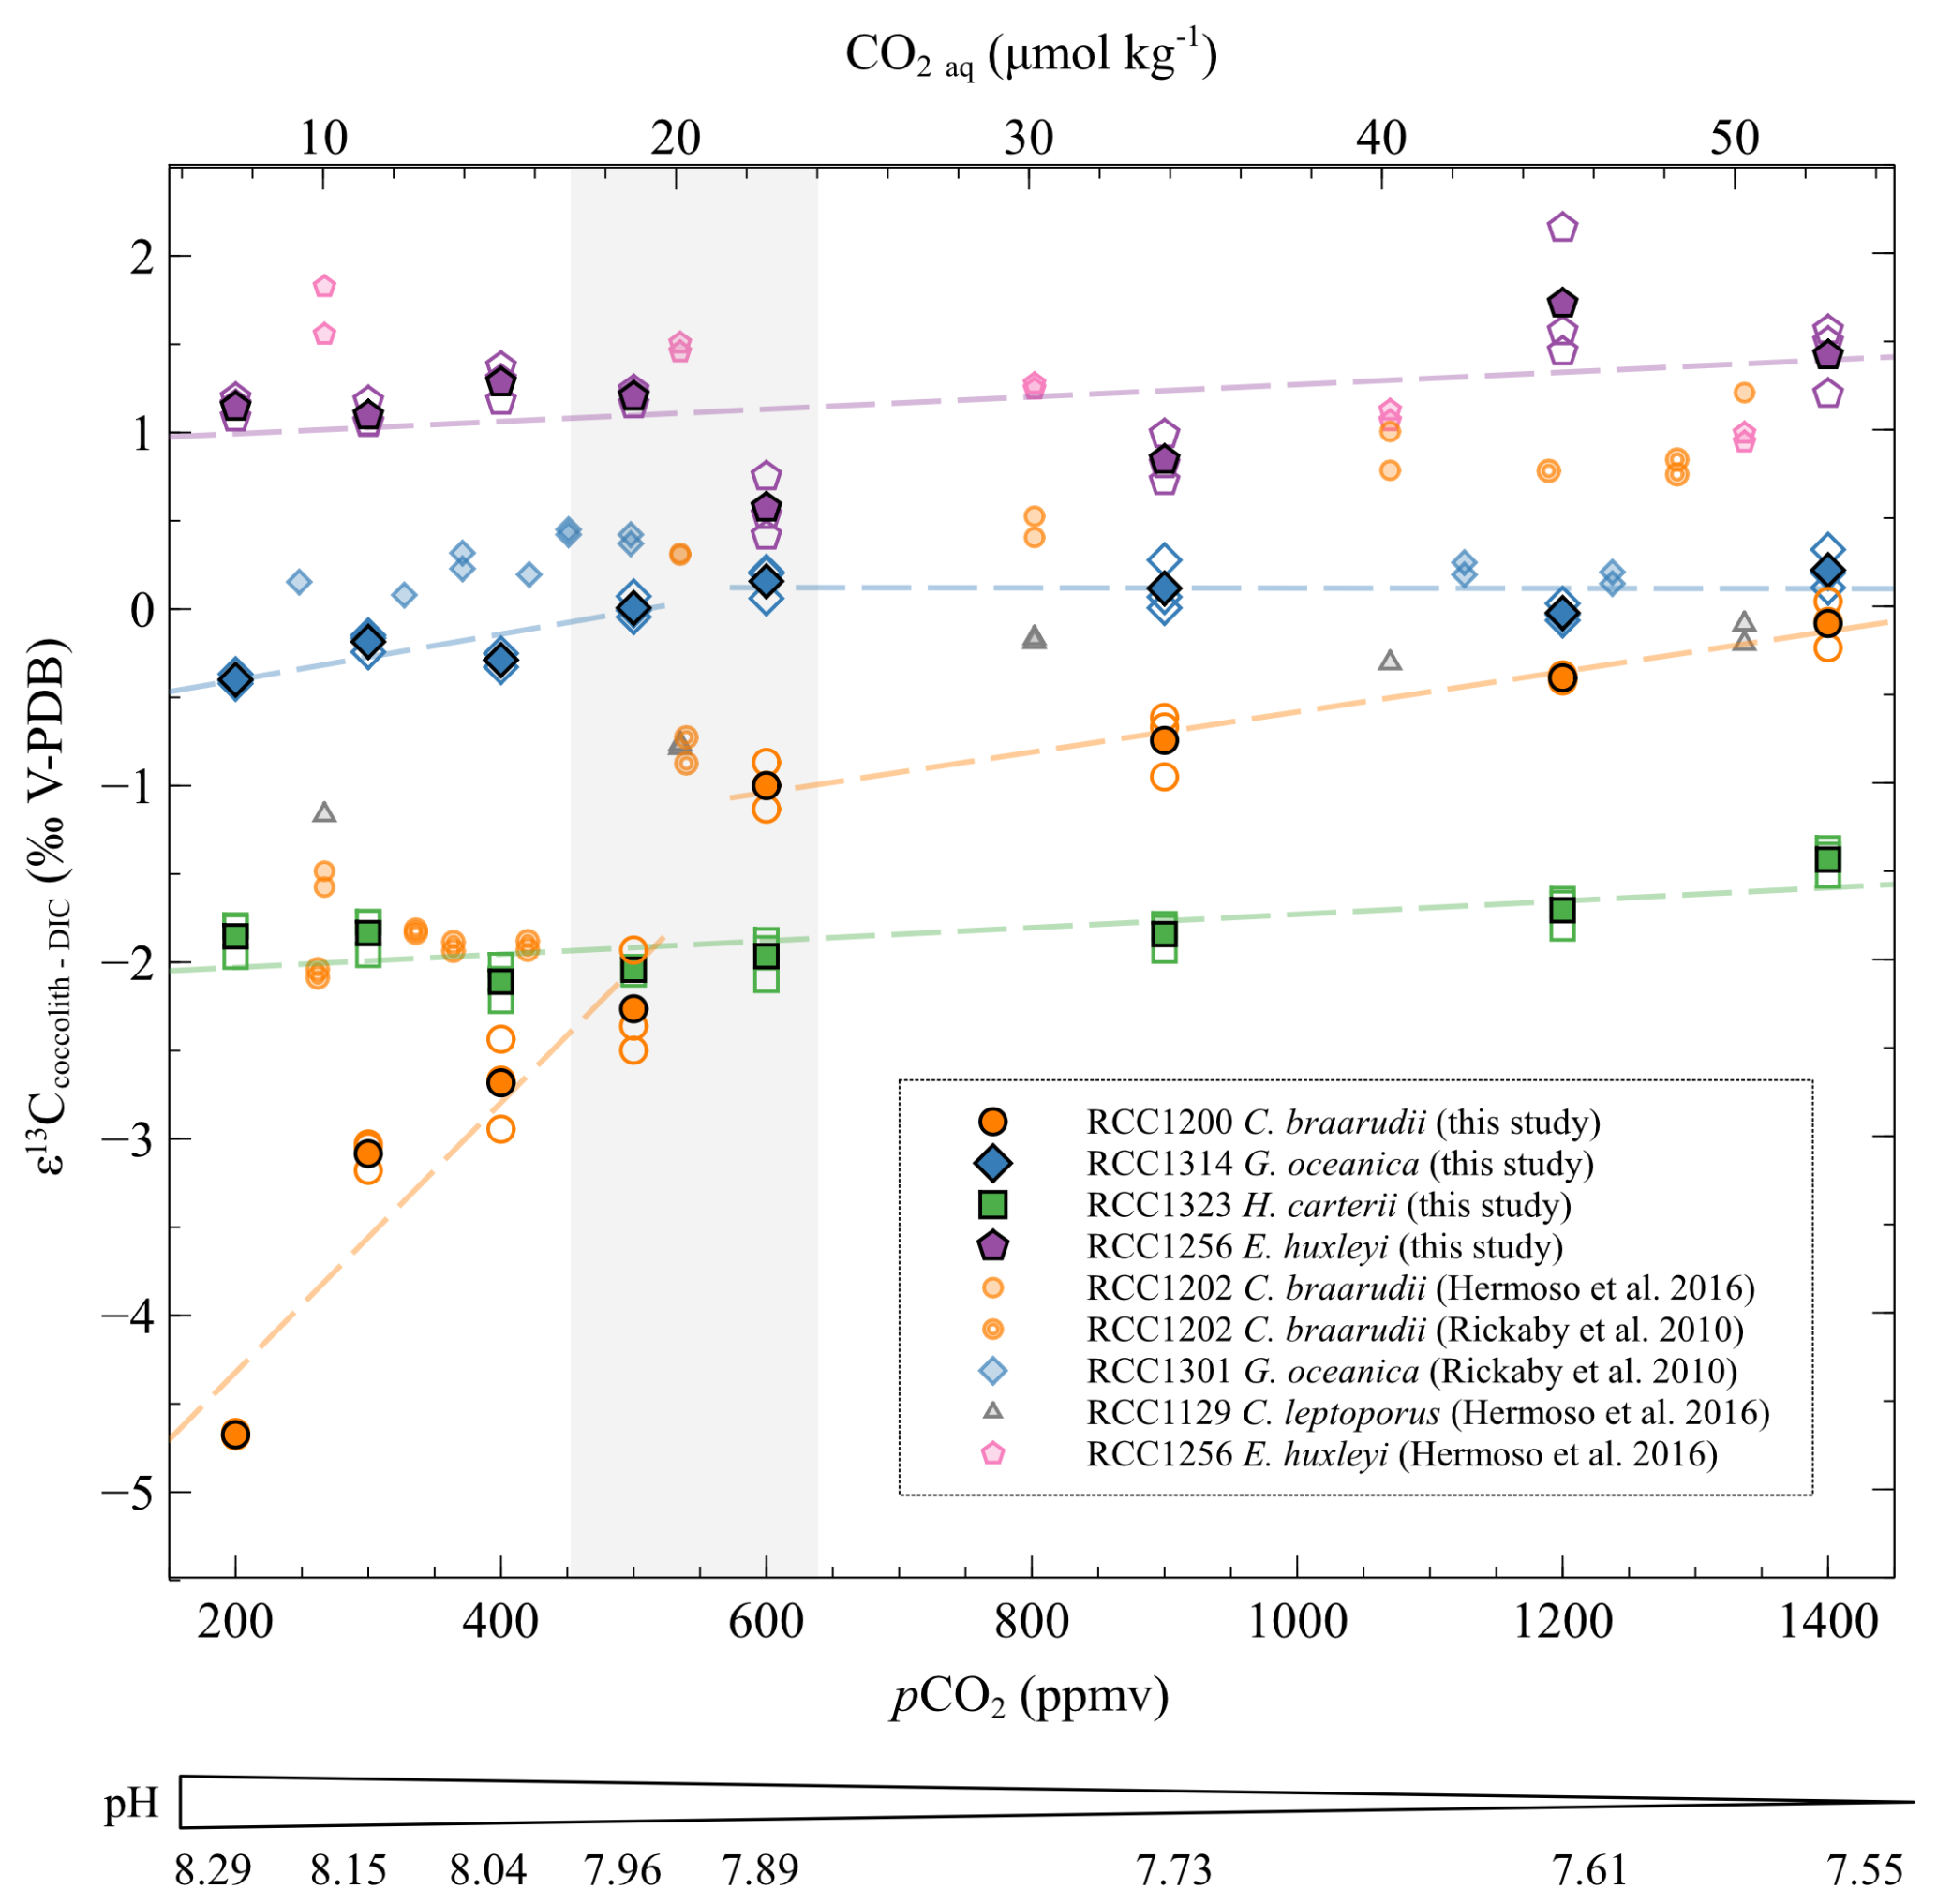
Figure 5Evolution of the carbon isotopic ratios of the four studied strains with increasing CO2 concentration and decreasing pH. The data are represented as the δ13C fractionation between coccoliths and DIC. The empty points are all the replicate data, and the filled points are the means (circles: Coccolithus braarudii, RCC 1200; diamonds: Gephyrocapsa oceanica, RCC 1314; squares: Helicosphaera carteri; pentagons: Emiliania huxleyi). The grey band represents the carbonate chemistry condition where a shift in the carbon and oxygen isotope ratio occurs (between 500 and 600 ppmv). The pH indicated below only refers to the pH of the cultures of this study. The sources of previously reported data (smaller symbols) are shown in the inset.
These δ13C data do not exhibit any consistent trend with changes in growth rate, nor with PIC and POC. G. oceanica and E. huxleyi show a carbon vital effect similar to that obtained in the work of Rickaby et al. (2010) and Hermoso et al. (2016a). It is also similar to the dataset published in McClelland et al. (2017). The vital effects of C. braarudii in this study have a similar evolution to previously published results (Hermoso et al., 2016a; Rickaby et al., 2010), with a 1 ‰ shift towards more negative values (Fig. 5). The δ13C ratios of C. braarudii are relatively similar to the results of Chauhan and Rickaby (2024), albeit with slightly lower absolute values in this latter work. The δ13C values observed by Chauhan and Rickaby (2024) for G. oceanica and for E. huxleyi are very negative for CO2 aq concentrations greater than 20 µmol kg−1 ( values between −2.5 ‰ and −8 ‰ V-PDB), which contrasts with previous studies published in the literature (Rickaby et al., 2010; Hermoso et al., 2016; McClelland et al., 2017).
One of the results of our study is that growth rates remain unchanged despite the imposed changes in CO2 concentration and pH for all strains and that cell size remains unchanged despite imposed changes in CO2 concentration and pH for the small strains (namely G. oceanica and E. huxleyi). It thus turns out that the CO2 concentration is the only parameter that dictates the carbon limitation here (Figs. A3 and A4). This is why we decided not to represent the isotopic data as a function of the carbon limitation (Bidigare et al., 1997) but only as a function of CO2 level (Figs. A3 and A4).
3.3 Oxygen isotope ratios of coccolith calcite
The of G. oceanica is constant regardless of ambient conditions (r2=0.02, p>0.05), as for values of E. huxleyi (r2=0.15, p>0.05). The mean magnitude of the oxygen vital effects of G. oceanica and E. huxleyi is positive (+1.05 ‰ and +1.92 ‰, respectively), in good agreement with previously published data (Dudley et al., 1986; Hermoso et al., 2016a, b; Rickaby et al., 2010; Stevenson et al., 2014; Ziveri et al., 2003).
As already shown in the literature, H. carteri has a close to the inorganic reference (mean of +0.42 ‰) (Ziveri et al., 2003). Indeed, at low CO2 concentrations and high pH, the of H. carteri is slowly decreasing (−0.22 ‰, a relative variation of 4 %, r2=0.57, p<0.01). From 600 ppmv and 7.89 pH units, the of H. carteri is stable (r2≈0, p>0.05) (Fig. 6).
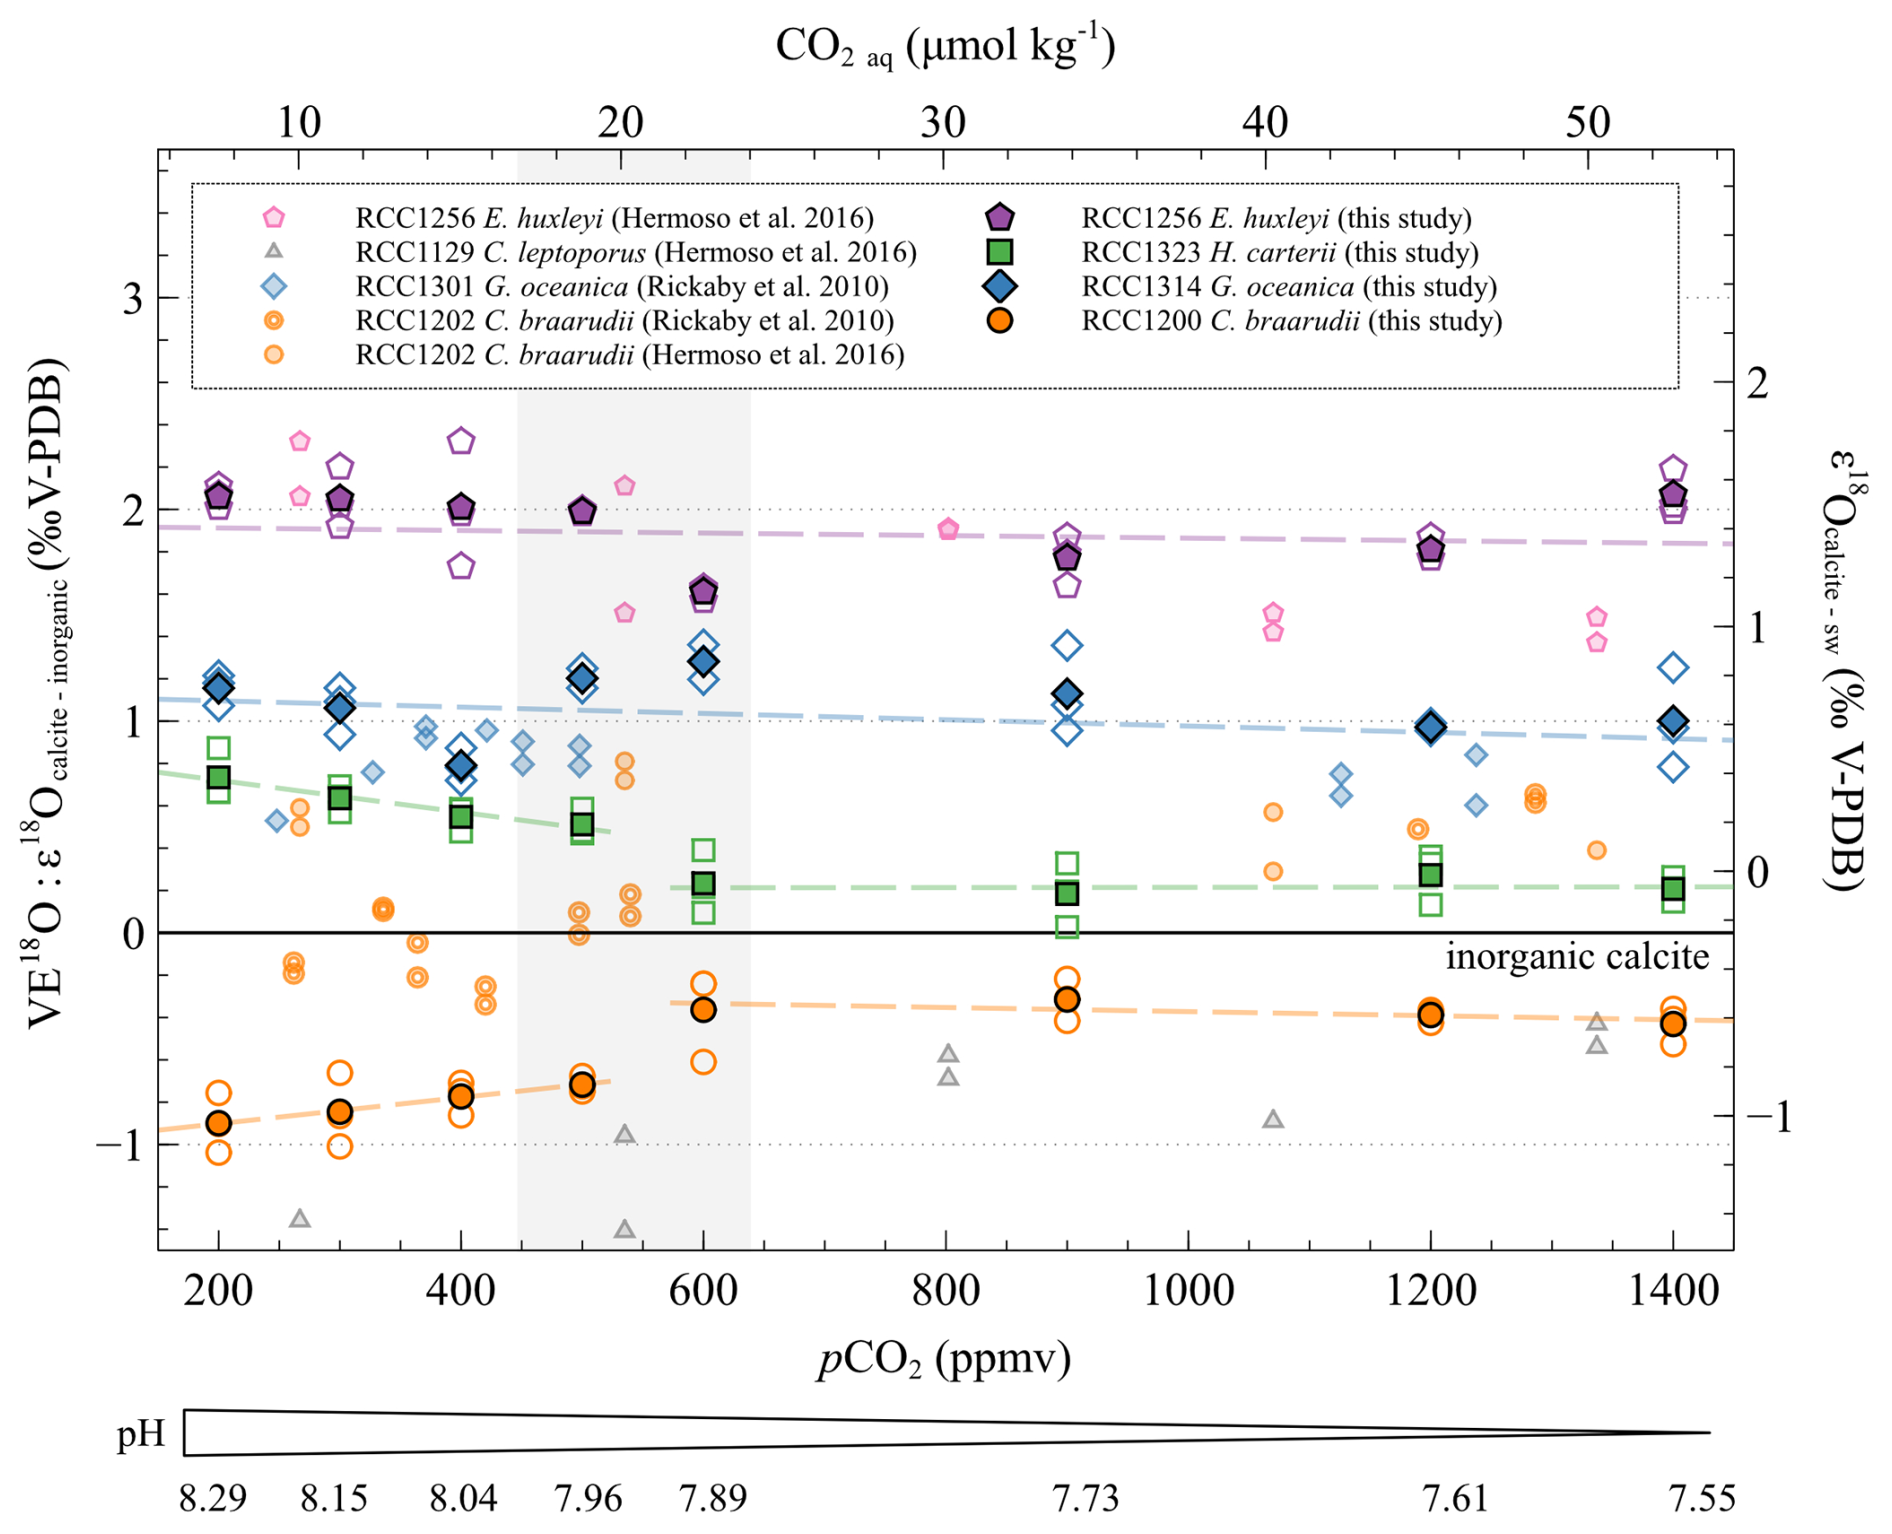
Figure 6Evolution of the oxygen isotopic ratios of the four studied strains with increasing CO2 concentration and decreasing pH. The data are represented as the vital effect (left axis) and as the isotopic fractionation between the seawater and the coccoliths δ18O (right axis). The empty points are all the replicate data, and the filled points are the means (circles: Coccolithus braarudii, RCC 1200; diamonds: Gephyrocapsa oceanica, RCC 1314; squares: Helicosphaera carteri; pentagons: Emiliania huxleyi). The vertical grey band represents the carbonate chemistry condition where a shift in the carbon and oxygen isotope ratio occurs. The black line shows the calculated isotope ratio of an inorganic calcite (see “Materials and methods”). The pH scale indicated below only refers to the data published in this study. The sources of previously reported data (smaller symbols) are shown in the inset.
The of C. braarudii is constant at low pCO2 and high pH with a mean value of −0.81 ‰ ± 0.13 ‰ V-PDB and is also constant at high pCO2 and low pH with a mean value of −0.37 ‰ ± 0.12 ‰ V-PDB. A significant difference in the C. braarudii VE18O is registered between high and low CO2 ambient conditions in the culture medium. This +0.5 ‰ shift occurs between 500 and 600 ppmv. While we present evidence of a negative vital effect of coccoliths for C. braarudii, previous studies have shown a close to that of the inorganic for this species. (Hermoso, 2015; Hermoso et al., 2016b; Rickaby et al., 2010; Stevenson et al., 2014).
3.4 Carbon isotope ratios of organic matter
The carbon isotopic ratio of organic matter of C. braarudii is decreasing with increasing CO2 level (from 200 to 500 ppmv) and decreasing pH (from 8.29 to 7.89 pH units) (r2=0.93, p<0.001). This result is mirrored by a large increase (+2.4 ‰ V-PDB) (Fig. 5). Above 600 ppmv (below 7.89 pH units), values of C. braarudii are stable and close to the values observed for the condition of 200 ppmv and 8.29 pH units (−30.77 ‰ ± 0.36 ‰ V-PDB) (Fig. 7). values of G. oceanica do not change with changes in pCO2 and pH (mean of −29.12 ‰ ± 0.41 ‰ V-PDB), similar to what was described for the changes in .
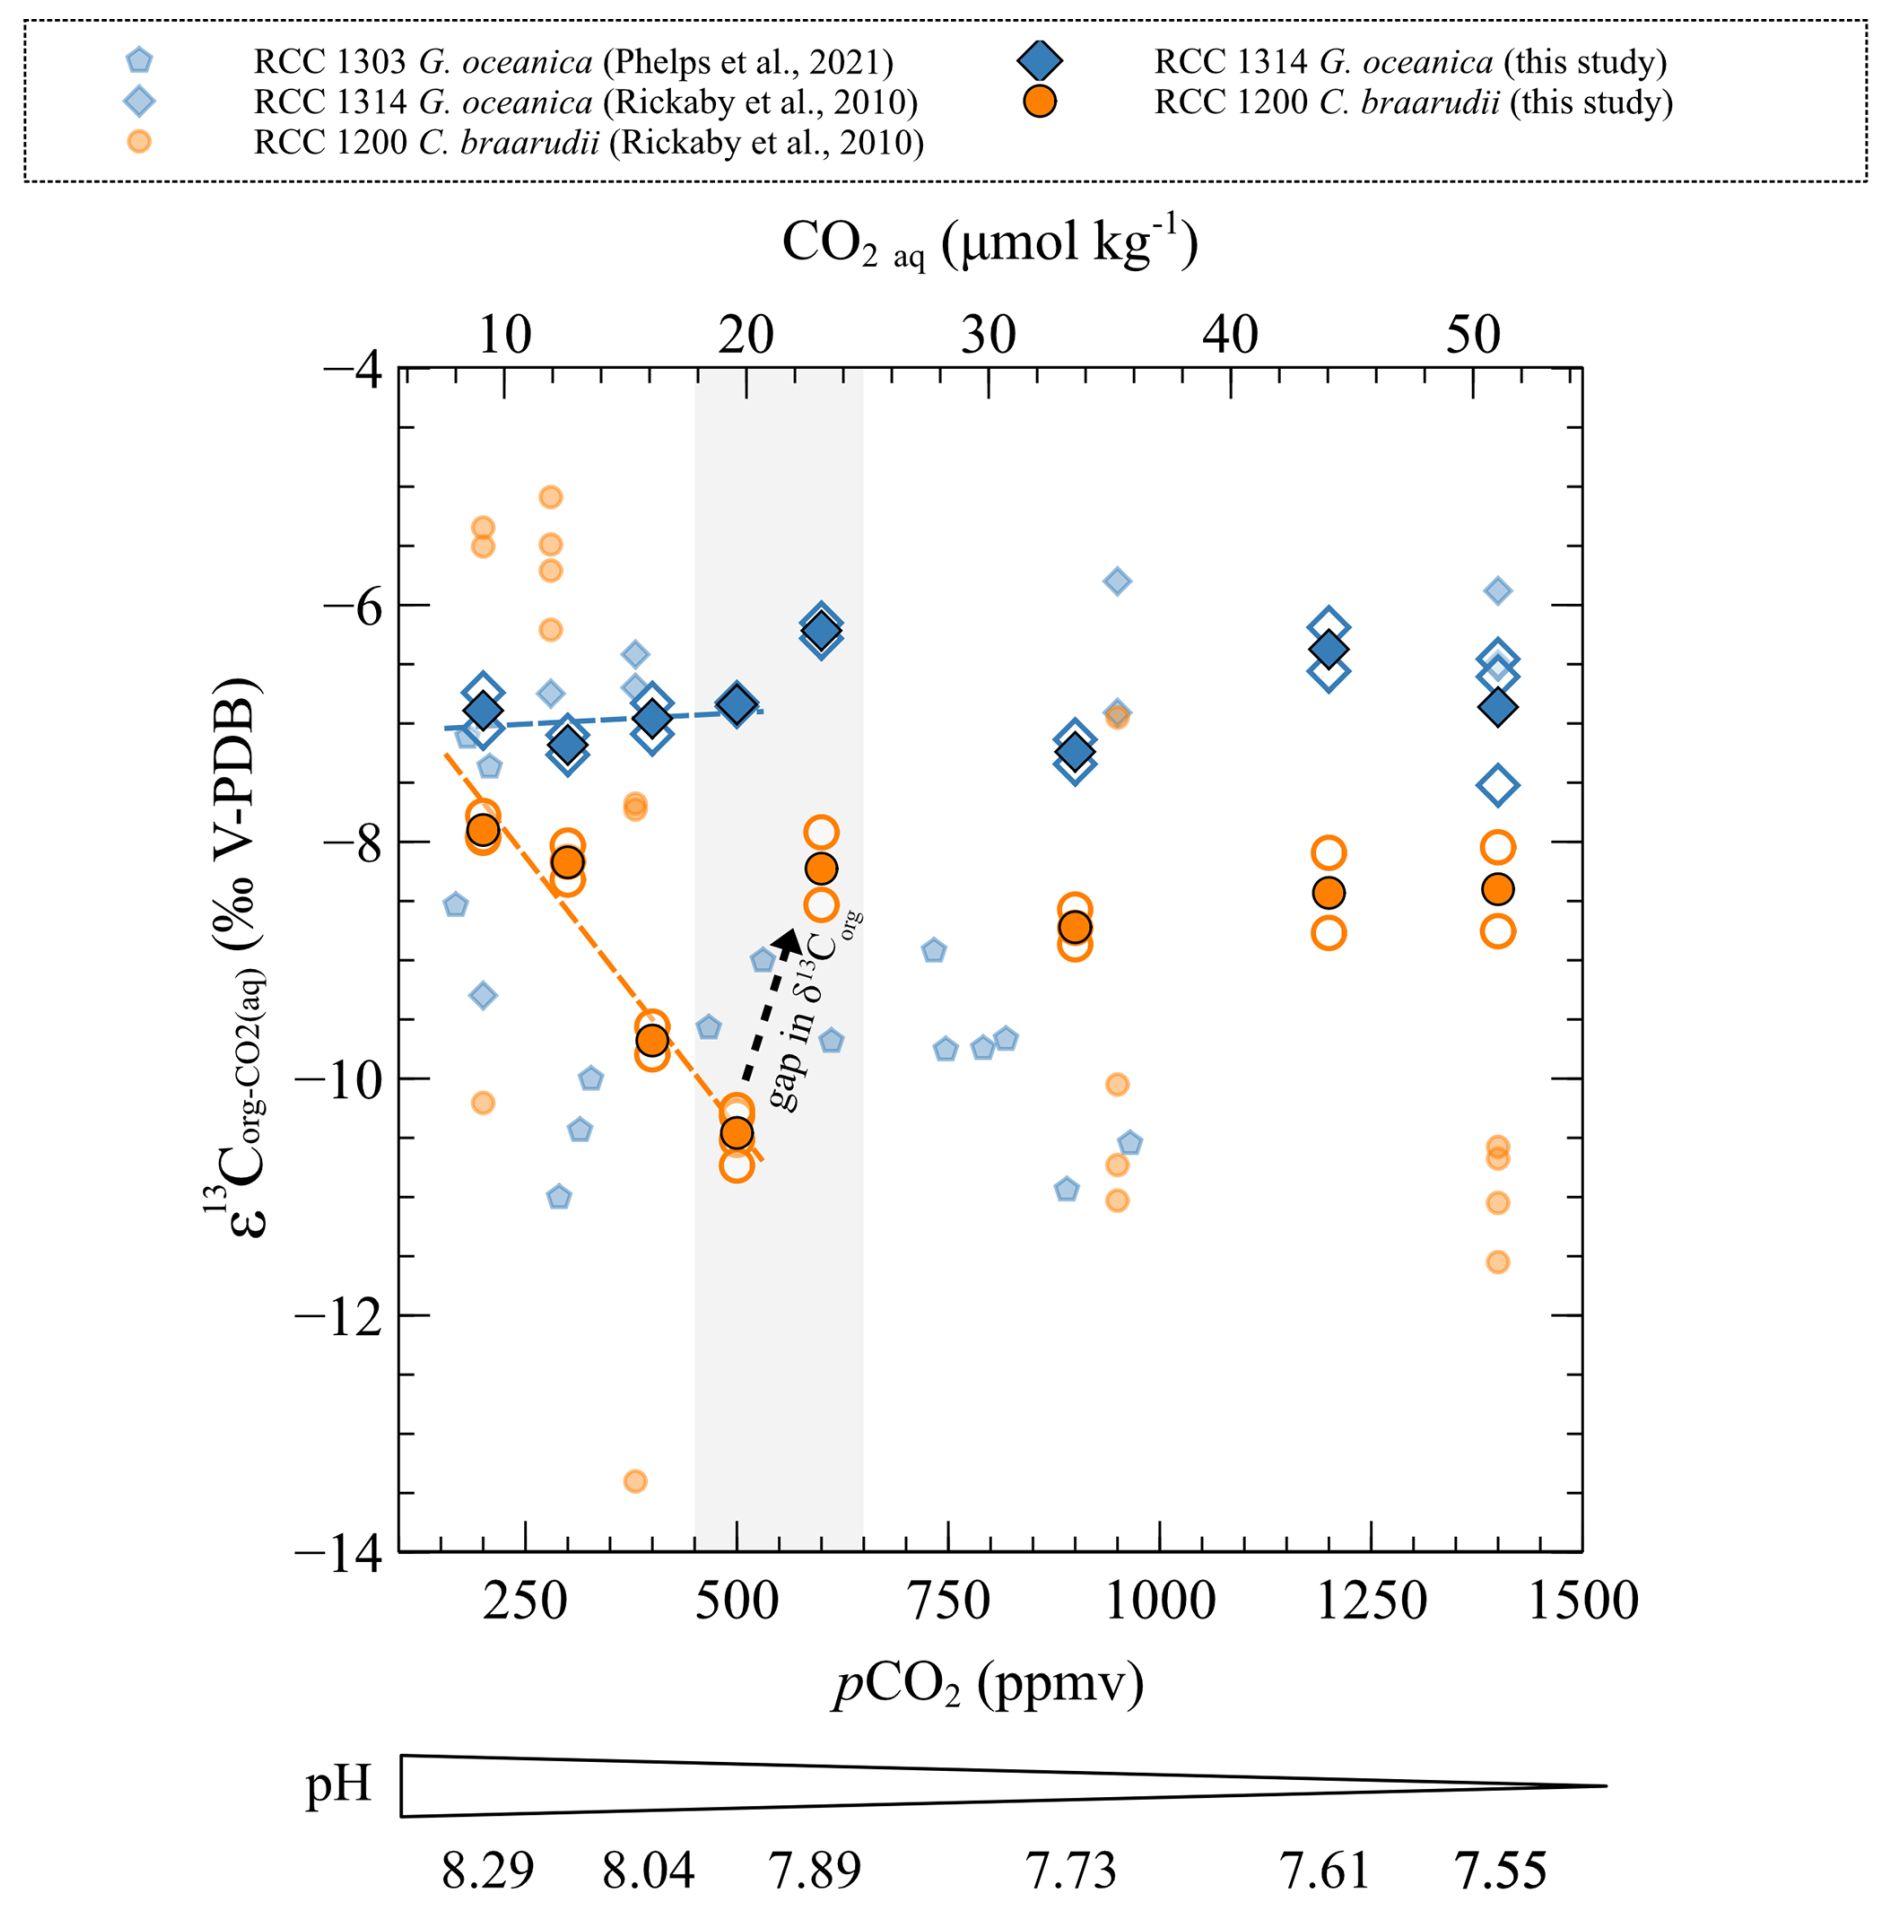
Figure 7Carbon isotopic ratios of organic matter compared to of the strains studied with changes in CO2 level and pH. The empty points are all the replicate data, and the filled points are the means. The grey band represents the carbonate chemistry condition where a shift in the carbon and oxygen isotope ratio occurs. The sources of previously reported data (smaller symbols) are shown in the inset.
In this study, we chose to perturb only the carbonate chemistry of the culture medium in which the cells grew. It is important to remember that other environmental factors, such as light irradiance and temperature, also influence cellular growth and the magnitude of vital effects (Langer et al., 2009; Sett et al., 2014; Hermoso et al., 2016; Gafar et al., 2018).
The aim of our study is to quantify the environmental forcing exerted by CO2 availability and ambient pH on the expression of vital effects of the coccolithophores with a view to develop and further palaeoenvironmental proxies. Our experimental results shed light on the link between the environment, cellular growth and the efficiency of carbon fixation, as these parameters collectively control the expression of biologically induced fractionation in organic and inorganic calcite. The published literature has revealed the role of carbon acquisition throughout the cell membrane and intracellular utilisation of carbon in the magnitude of the vital effect through laboratory and modelling studies (Laws et al., 1995; McClelland et al., 2017; Popp et al., 1998; Rau et al., 1996). Bolton and Stoll (2013) coined the concept of the demand-to-supply ratio to characterise the isotopic implications of carbon trafficking within the cells, with large implications for the carbon isotope vital effect at different timescales. Based on these studies, it appears that the carbon isotopic composition of coccolith calcite was primarily controlled by the interplay between inorganic carbon fixation in the coccolith vesicles and organic carbon fixation in the chloroplast. At a constant source of external carbon, the main driver dictating the is the amount and isotopic composition of organic matter produced through photosynthetic carbon fixation (POC per cell and , respectively) (McClelland et al., 2017).
As the foremost finding of our study, we show that C. braarudii exhibits a large increase (+2.4 ‰ V-PDB) mirrored by a decrease (−2.6 ‰ V-PDB) from 200 ppmv and 8.29 pH units to 500 ppmv and 7.96 pH units (low pCO2 and high pH conditions) (Fig. 8). The correlation between and of C. braarudii is not seen at high pCO2 and low pH (600 to 1400 ppmv/7.89 to 7.55 pH units) (Figs. 5 and 7). Based on this observation, we will treat the data obtained at low pCO2–high pH separately from those obtained at high pCO2–low pH in the following sections. It is also noteworthy that the small species G. oceanica and E. huxleyi do not show statistically significant changes in the magnitude of 13C fractionation, neither in coccolithophores calcite nor in the organic matter with changes in CO2 level and pH (at neither low pCO2 and high pH, nor over the whole interval). The invariant nature of inorganic and bulk organic isotopic composition with our CO2 and pH treatment is an important result for research dealing with alkenone carbon isotope fractionation and requires closer examination by molecular geochemists.
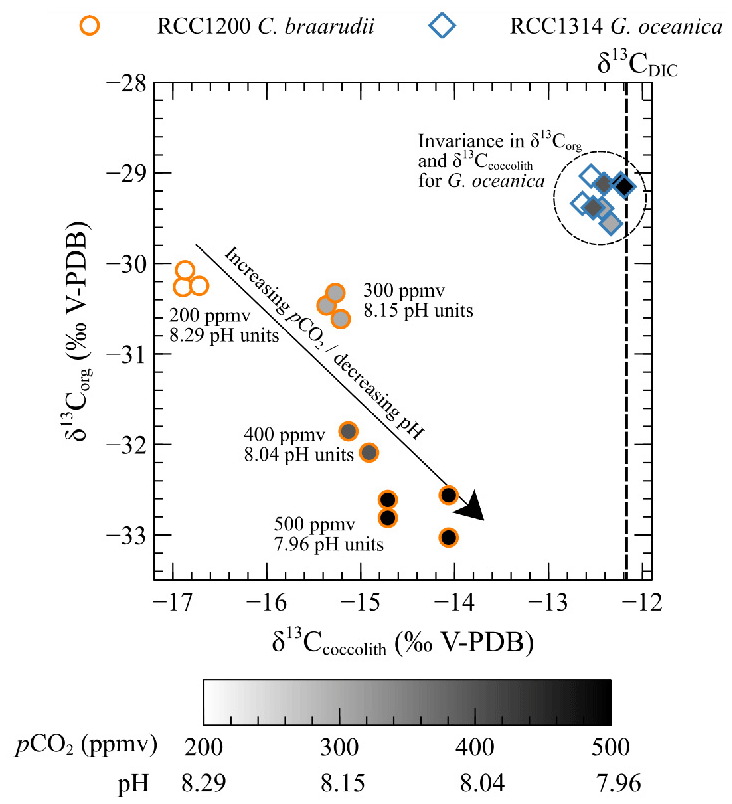
Figure 8Scatter plot showing δ13Corg versus δ13Ccoccolith values with changes in pCO2 and pH (circles: Coccolithus braarudii, RCC 1200; diamonds: Gephyrocapsa oceanica, RCC 1314). Grey levels correspond to growth conditions (white: 200 ppmv–8.29 pH units, light grey: 300 ppmv–8.15 pH units, dark grey: 400 ppmv–8.04 pH units, black: 500 ppmv–7.96 pH units).
4.1 The biogeochemical causes for the changes in of C. braarudii at low pCO2 and high pH
Given that organic compounds are significantly 12C-enriched relative to CO2 with typical values around −25 ‰, the more organic matter produced, the isotopically heavier the residual intracellular carbon pool. As calcification derives from this latter pool, coccoliths produced by highly photosynthetic coccolithophore cells exhibit relatively higher δ13C values. This phenomenon is particularly expressed in small cells such as E. huxleyi and G. oceanica that are characterised by high POC contents and the highest δ13C values (Ziveri et al., 2003) (Figs. 4 and 5). We can hypothesise that a change in the efficiency of POC production with changes in carbon availability can induce a change in values, as it is apparent for C. braarudii with a +2.4 ‰ V-PDB shift between low and high pCO2 conditions (Fig. 5). There is no apparent change in POC, PIC / POC or growth rates with the increase in δ13C at low pCO2 and high pH (Figs. 2 and 4), despite an increase in chlorophyll a concentration within the cells between 200 and 500 ppmv (Fig. A2). These observations exclude a control of the amount of organic matter produced on the isotopic signature of the internal pool. Furthermore, a change in the efficiency of POC production could not explain the coeval −2.6 ‰ and progressive decrease in values within this low pCO2 interval. Thus, another biogeochemical process has to be sought.
A second means to explain coeval changes in both and can rely on a change in the isotopic composition of the carbon acquired by the cell (CO2 vs. ). Carbon-concentrating mechanisms (Giordano et al., 2005) can induce a shift in internal carbon pool to which a contribution by ions by active transport becomes significant (Bolton and Stoll, 2013). Under this circumstance, the internal carbon may exhibit higher δ13C values, as there is a typical 9 ‰ equilibrium fractionation between CO2 and (Zeebe and Wolf-Gladrow, 2001). However, early biological work aiming at characterising inducible CCMs in phytoplankton has revealed the lack of such active strategies of carbon acquisition in the large and ancestral Coccolithus taxon (Nimer et al., 1999). Furthermore, the build-up of the carbon pool with a proportion of would have led to higher δ13C values in both organic and inorganic pool, which is not what is observed at the lowest pCO2 (conversely, the values are lower) (Figs. 5 and 7). These two lines of evidence rule out the CCM hypothesis.
Culture and wild coccolithophore data have revealed that the carbon isotope composition of the organic matter decreases with increasing CO2 concentration (Bidigare et al., 1997). The magnitude of carbon isotope fractionation between the CO2 substrate and the organic matter is thus not constant when the concentration/availability of ambient CO2 changes, forming the ground of the εp-alk proxy (Pagani, 2002; Popp et al., 1998). This modulation of the carbon kinetic fractionation by RuBisCO not only has consequences on the isotopic signature of the organic matter of which the compound-specific as alkenones but also has consequences on the residual carbon pool and ultimately on coccolith calcite.
This biogeochemical control is compatible with the 2.6 ‰ decrease observed in of C. braarudii between 200 and 500 ppmv (r2=0.93, p<0.001) (Fig. 7). As the inorganic carbon pool and organic carbon pool are linked at least from an isotopic perspective, we can interpret the +2.4 ‰ change in as the result of a modulation of kinetic fractionation by the enhanced fixation of 12C in organic matter by the enzyme RuBisCO – itself caused by the alleviated CO2 limitation (Fig. 8).
As we do not observe any change in the growth rate nor in the POC per cell between low and high pCO2 conditions, we suggest that the cells compensate for the decrease in carbon bioavailability in a different way. Indeed, the lower surface-to-volume ratio at 200 ppmv compared to 500 ppmv (cell diameter of 16.7 ± 0.2 µm at 200 ppmv and 17.6 ± 0.4 µm at 500 ppmv, in Fig. 3) may compensate for the lower supply with a lower demand to sustain growth rate (Bolton and Stoll, 2013; Rau et al., 1996). This point will be further discussed in Sect. 4.2 for the high CO2 level and low pH conditions.
4.2 Change in the isotope biogeochemistry of coccolithophore cells in response to alleviated carbon limitation and enhanced proton concentration in the cell (Coccolithus braarudii versus smaller species)
The data for C. braarudii, and in particular the link between CO2 availability and the isotopic composition of coccoliths and organic matter, cannot be explained by a uniform biogeochemical framework, as a gap is seen for C. braarudii between 500 and 600 ppmv (Figs. 5 and 7). The data show that above 600 ppmv, there is no correlation between ambient CO2 levels and . Furthermore, there is no covariation between and values of C. braarudii at high pCO2 and low pH, in contrast to the covariation observed at low pCO2 and high pH. The latter point suggests that the organic-to-inorganic forcing that occurs at low pCO2 levels no longer operates at high pCO2 levels. The fact that there is no organic-to-inorganic forcing at high pCO2 is presumably due to the alleviation of carbon limitation or at least due to a lower carbon demand-to-supply ratio (Bolton et al., 2012). Likewise, coccosphere sizes exhibit no discernible trend with CO2 concentrations at high CO2 levels (Fig. 3), in contrast to the findings at low CO2 levels, which were tentatively attributed to a way to enhance CO2 influx to the cells. This biogeochemical feature would indicate that the forcing of CO2 availability on the apparent fractionation between the organic matter and calcite occurs only below 600 ppmv. Meanwhile, small species (E. huxleyi and G. oceanica) show unchanged isotopic values with the pCO2/pH treatments. As explained in Rickaby et al. (2010) and Hermoso et al. (2016), the high surface-to-volume ratio of the small cells induces no carbon limitation at low CO2 level and hence no impact of the change of pCO2 and pH on the carbon isotopic system.
Elevated pCO2 conditions are accompanied by greater proton concentrations in the environment (more acidic conditions). Calcifying phytoplankton such as the coccolithophores has to efflux the excess protons generated by calcification by an active process operated by transmembrane Hv channels (Kottmeier et al., 2022; Taylor et al., 2011). Previous biological studies have demonstrated that the opening of Hv channels is affected by intracellular pH (Taylor et al., 2011). Hv channels are closed at low pH to counter the influx of protons into the cell from the ambient environment. The pH threshold for the closure of the Hv channels has been assessed to be within the range of 8.1–7.5 pH units (Kottmeier et al., 2022). Therefore, assuming that the threshold stands between 7.96 and 7.89 pH units, the closure of the Hv channels is a good candidate for the 500–600 ppmv gap apparent in our dataset (Figs. 5–7). The closure of the Hv channels can thus result in an accumulation of H+ ions within the cytosol, leading to an intense decline in intracellular pH (Kottmeier et al., 2022; Taylor et al., 2011). The release of protons by coccolithogenesis is even more influential on intracellular pH for species such as C. braarudii, which produces a large amount of PIC compared to smaller cells (Fig. 4). The latter cells (G. oceanica and E. huxleyi) indeed do not exhibit such a gap in between 500 and 600 ppmv (small mean PIC values of 0.025 ± 0.004 and 0.006 ± 0.001 ng per cell in the 600–1400 ppmv interval, respectively). Interestingly, the gap in C. braarudii between low and high CO2 levels is not seen in . This observation could be the consequence of a decrease in the organic–inorganic carbon pool coupling when carbon supply is high, unlike below 500 ppmv when the small carbon pool imposes a high isotopic dependence between organic matter and calcite through Rayleigh distillation, governed by the organic carbon fixation.
Around the same pCO2 and pH limit as presented for of C. braarudii, we observe a change in values. The mean VE18O value is −0.81 ‰ ± 0.13 ‰ V-PDB at low pCO2–high pH conditions, while the mean VE18O value is −0.37 ‰ ± 0.12 ‰ V-PDB at high pCO2–low pH conditions (Fig. 6). The gap in can be explained by the change in pH. When the pH in the environment is low, it has been demonstrated that the equilibration time between DIC species and H2O is shorter compared to high pH conditions (Usdowski et al., 1991). The isotopic equilibration between and due to the assimilation of isotopically heavy CO2 into the cell is consequently more complete at low pH than at high pH. As a consequence, (and consequently ) values are closer to at high pCO2 and low pH (Fig. 6). The difference between high and low pH levels is consistent with a change in pH homeostasis strategy between 7.96 and 7.89 pH units that can be responsible for the δ13C before and after 500/600 ppmv. It has to be noted that coccolithophores possess internal carbonic anhydrase (CA) (Paneth and O'Leary, 1985). CA could also accelerate the sluggish H2O–DIC equilibration isotopic time for the oxygen system, but the kinetics of isotopic re-equilibration of the internal carbon pool within the cell compartments is unknown.
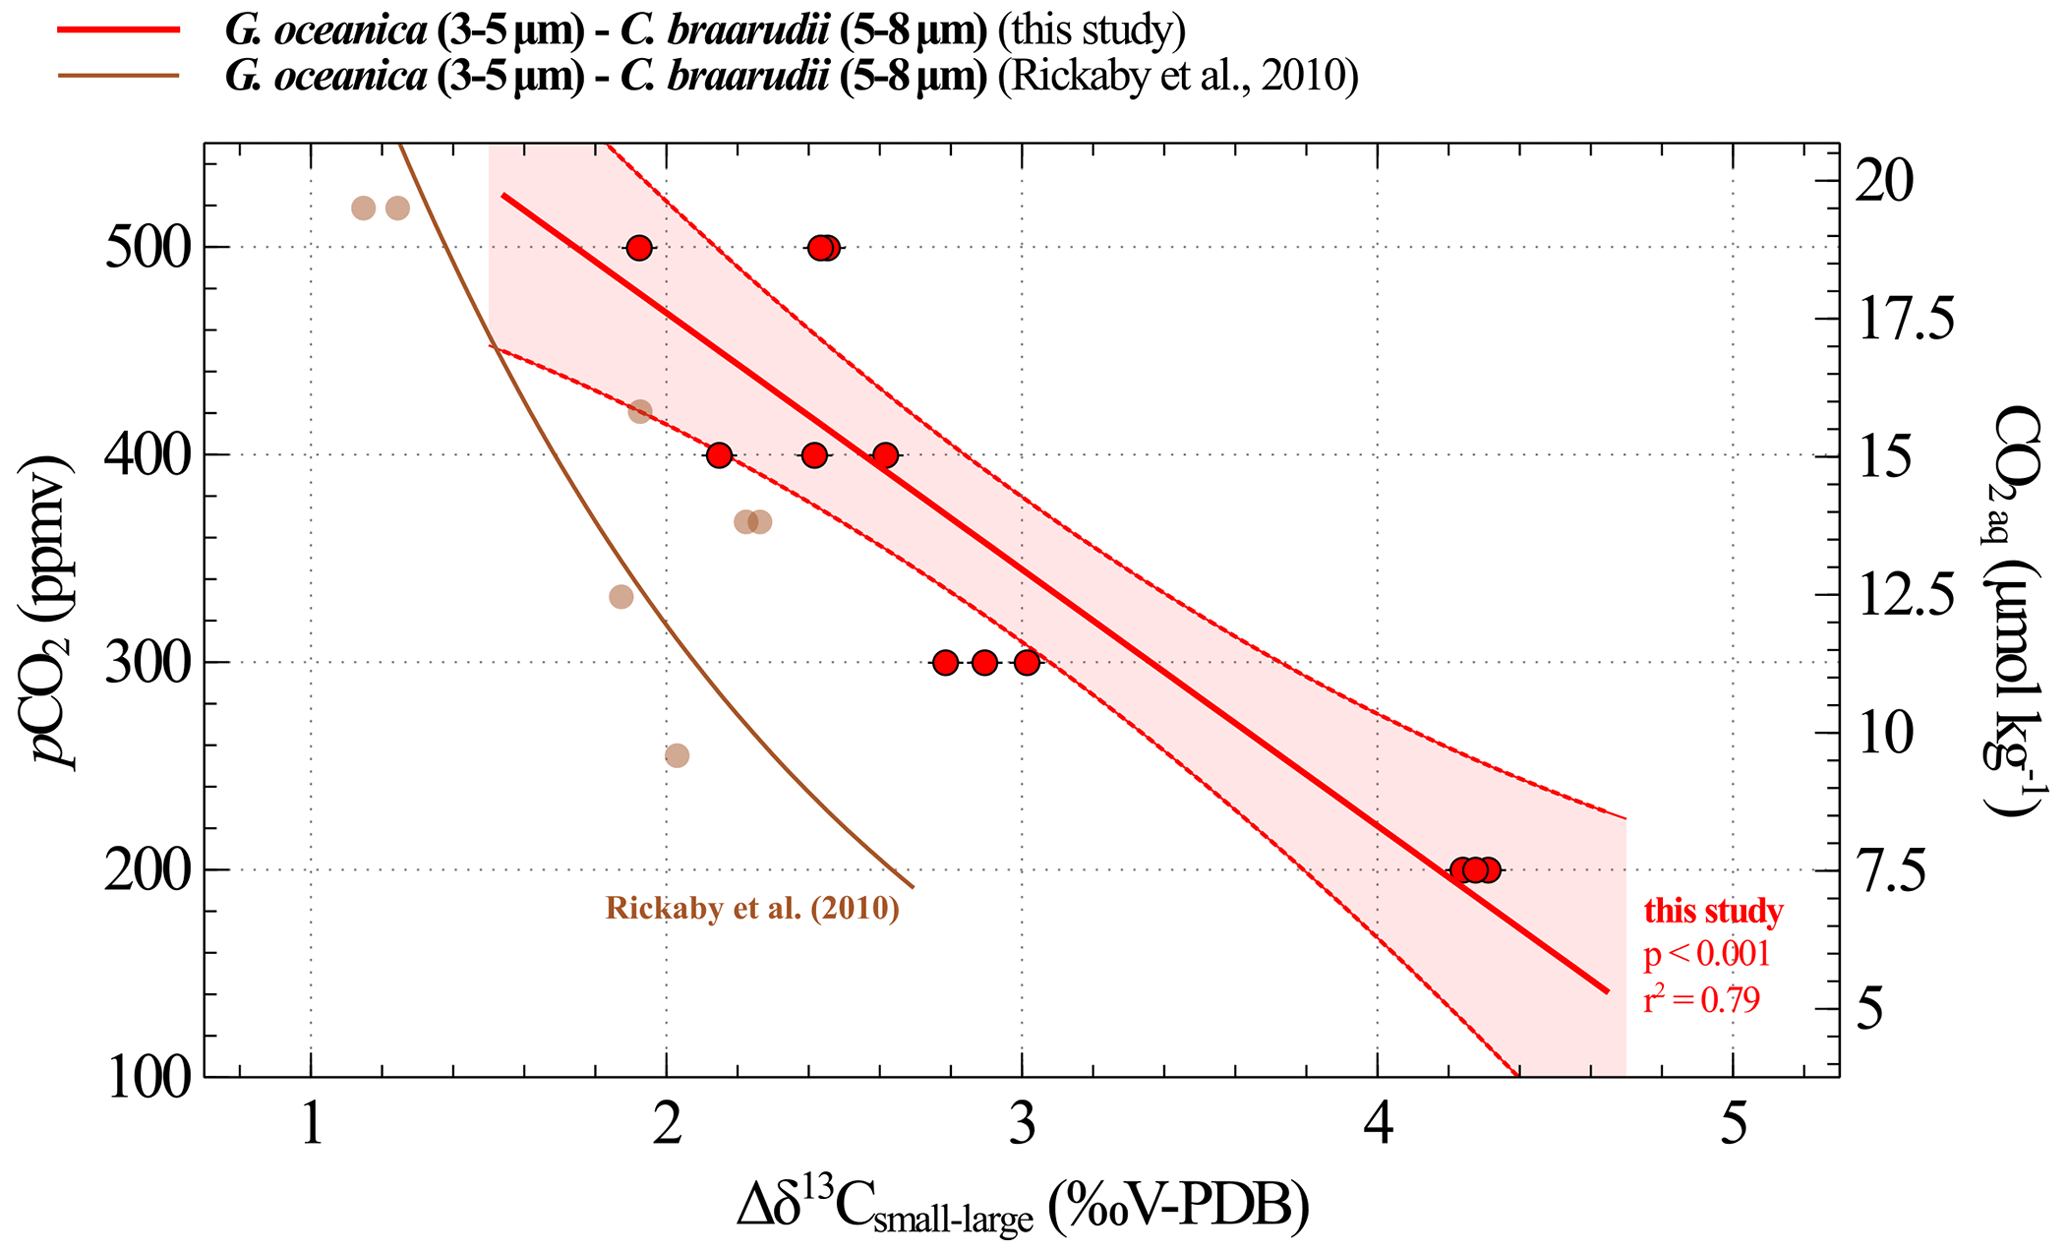
Figure 9Calibration between CO2 and obtained from culture experiments. The results of our study are shown in red (replicate data as dots; the linear regression made between 200 and 500 ppmv corresponds to the solid line, and the confidence interval is shown with dotted lines). The brown curve is the equation recalculated from the Rickaby et al. (2010) dataset. The relation encompassing the 200–1400 ppmv spectrum is shown in Fig. A1.
4.3 Palaeoclimatic implications of the CO2 proxy based on
4.3.1 evolution with changes in CO2 levels and pH
The increase in of C. braarudii with rising pCO2 and decreasing pH shows potential as a proxy for reconstructing past carbonate chemistry and consequently atmospheric pCO2. However, utilising absolute carbon vital effects of coccoliths for palaeo-pCO2 reconstructions requires accurate knowledge of the (DIC) of past oceans, which remains challenging (Hermoso et al., 2020). To overcome this issue, previous studies (Bolton et al., 2012; Bolton and Stoll, 2013; Godbillot et al., 2022; Hermoso et al., 2016a; McClelland et al., 2017; Tremblin et al., 2016) have proposed the use of the offset between the of small and large species, known as the differential vital effect (noted Δδ13C, Eq. 3). Indeed, the of the small cells (Noelaerhabdaceae) is steady, regardless of the pCO2 levels, due to their relatively large carbon pool, akin to C. braarudii under carbon replete conditions (at high pCO2 and low pH). The coccolith-based palaeo-pCO2 proxy is independent of the isotope ratio of ambient DIC, as both small and large coccoliths are produced by cells growing in the same shallow water. In practical terms, can be expressed as follows:
where δ13C is expressed in ‰V-PDB. The small coccoliths used in this work are those of G. oceanica, and the large coccoliths are those of C. braarudii.
Δδ13C and pCO2 data highlight a linear relationship across the range of 200 to 500 ppmv (i.e. pH values between 8.29 and 7.96), which we previously explained by a modulation in the carbon isotope fractionation between CO2 aq and the organic matter (Fig. 9, Eq. 4). The uncertainties associated with the constants in Eq. (4) represent the standard deviation obtained with a linear regression model.
where CO2 aq is expressed in µmol kg−1, and Δδ13C is expressed in ‰V-PDB.
A comparison of our calibration with the data published by Rickaby et al. (2010) in Fig. 9 reveals a discrepancy of up to 1.5 ‰ under the lowest pCO2–highest pH conditions. Explaining this difference is challenging, particularly because the studies were conducted under different conditions, involved different strains and included only a few data points in this low CO2 range, as documented by Rickaby et al. (2010). This observation may call into question the feasibility of achieving a species- and environment-integrated response in coccolithophores (see further discussion in Sect. 4.3.2).
4.3.2 Palaeoclimate application of carbon isotope culture data
In this study, we further develop a geological CO2-sensitive probe by the use of the isotopic offset. This probe forms the basis for a palaeo-CO2 proxy transferable to sedimentary records from geological periods with low CO2 levels, such as the Neogene and the Quaternary (Bolton and Stoll, 2013; Godbillot et al., 2022; Hermoso et al., 2020). Providing a new palaeo-pCO2 proxy for those periods is of key interest, as it has been shown that alkenones are less sensitive to low and medium CO2 level changes (Badger et al., 2019). Another strength of the pCO2 proxy presented here is that it is based on coccolith calcite, which can be separated from other sedimentary components according to their size ranges by microfiltering and centrifuging protocols (Minoletti et al., 2008; Stoll and Ziveri, 2002; Zhang et al., 2018, 2021).
In addition, our study provides a biogeochemical explanation for changes with CO2 level and pH, thus supporting the reliability of these equations for palaeoclimate applications. We also demonstrate that the -CO2 calibration can be extended to the whole interval studied, i.e. above 600 ppmv (Fig. A1). Despite the fact that the link between and CO2 levels is less constrained and understood at high CO2 level than at low CO2 levels, the relationship is statistically supported on the whole interval (r2=0.80, p<0.001) (Fig. A1). Thus, this calibration can potentially be used to reconstruct palaeo-CO2 levels throughout the entire Cenozoic era.
It has to be mentioned that using C. braarudii as a culture model for large cells with a palaeoclimatic perspective is supported by the fact that C. pelagicus coccoliths were present in all sediments from the Equator to the mid latitudes (50° N) in the Atlantic and Pacific oceans before the Pliocene–Pleistocene boundary (Sato et al., 2004). Nowadays, C. braarudii is not a species thriving at low latitudes. One promising research avenue would be the study of the co-variation of CO2 and pH levels crossed with temperature changes in new culture campaigns. This approach could have the potential to reveal the synergistic effect of discrete various controls on cell growth rates and refine the biogeochemical understanding of the vital effects.
The combined study of the impact of CO2 concentration and pH on the fractionation of carbon and oxygen isotopes in coccolithophores (in their organic matter and calcite biominerals) provides an explanation of the cause of variations in . One of the major findings of this study is the coeval variation of and in Coccolithus braarudii with changes in pCO2 between 200 and 500 ppmv and pH between 8.29 and 7.96. Combined with the fact that physiological parameters (growth rates, PIC and POC) of C. braarudii remain unchanged despite changes in the availability of carbon, these results indicate that the cause of variations in is an environmental-driven change in the magnitude of the fractionation between ambient CO2 aq and organic matter produced by C. braarudii. Above 500 ppmv, and for pH values below 7.96, greater carbon availability induces isotopic decoupling between and . On the other hand, small species exhibit no change in or in response to changes in CO2 levels and pH. By comparing values of small (G. oceanica or E. huxleyi) with those of large cells (C. braarudii), we have established an insightful Δδ13C–CO2 transfer equation relevant for the Neogene and Quaternary time slices. The extent to which our biogeochemical calibration can be applied to wild and fossil coccoliths depends on the (palaeo-)environmental context. In these experiments, only the biogeochemical responses of monoclonal strains have been examined, while variations in light irradiance and temperature may interact with changes in the carbonate chemistry of water masses. In the future, a broader range of strains and additional physico-chemical parameters must be studied, integrating these factors to develop a unified response through modelling.
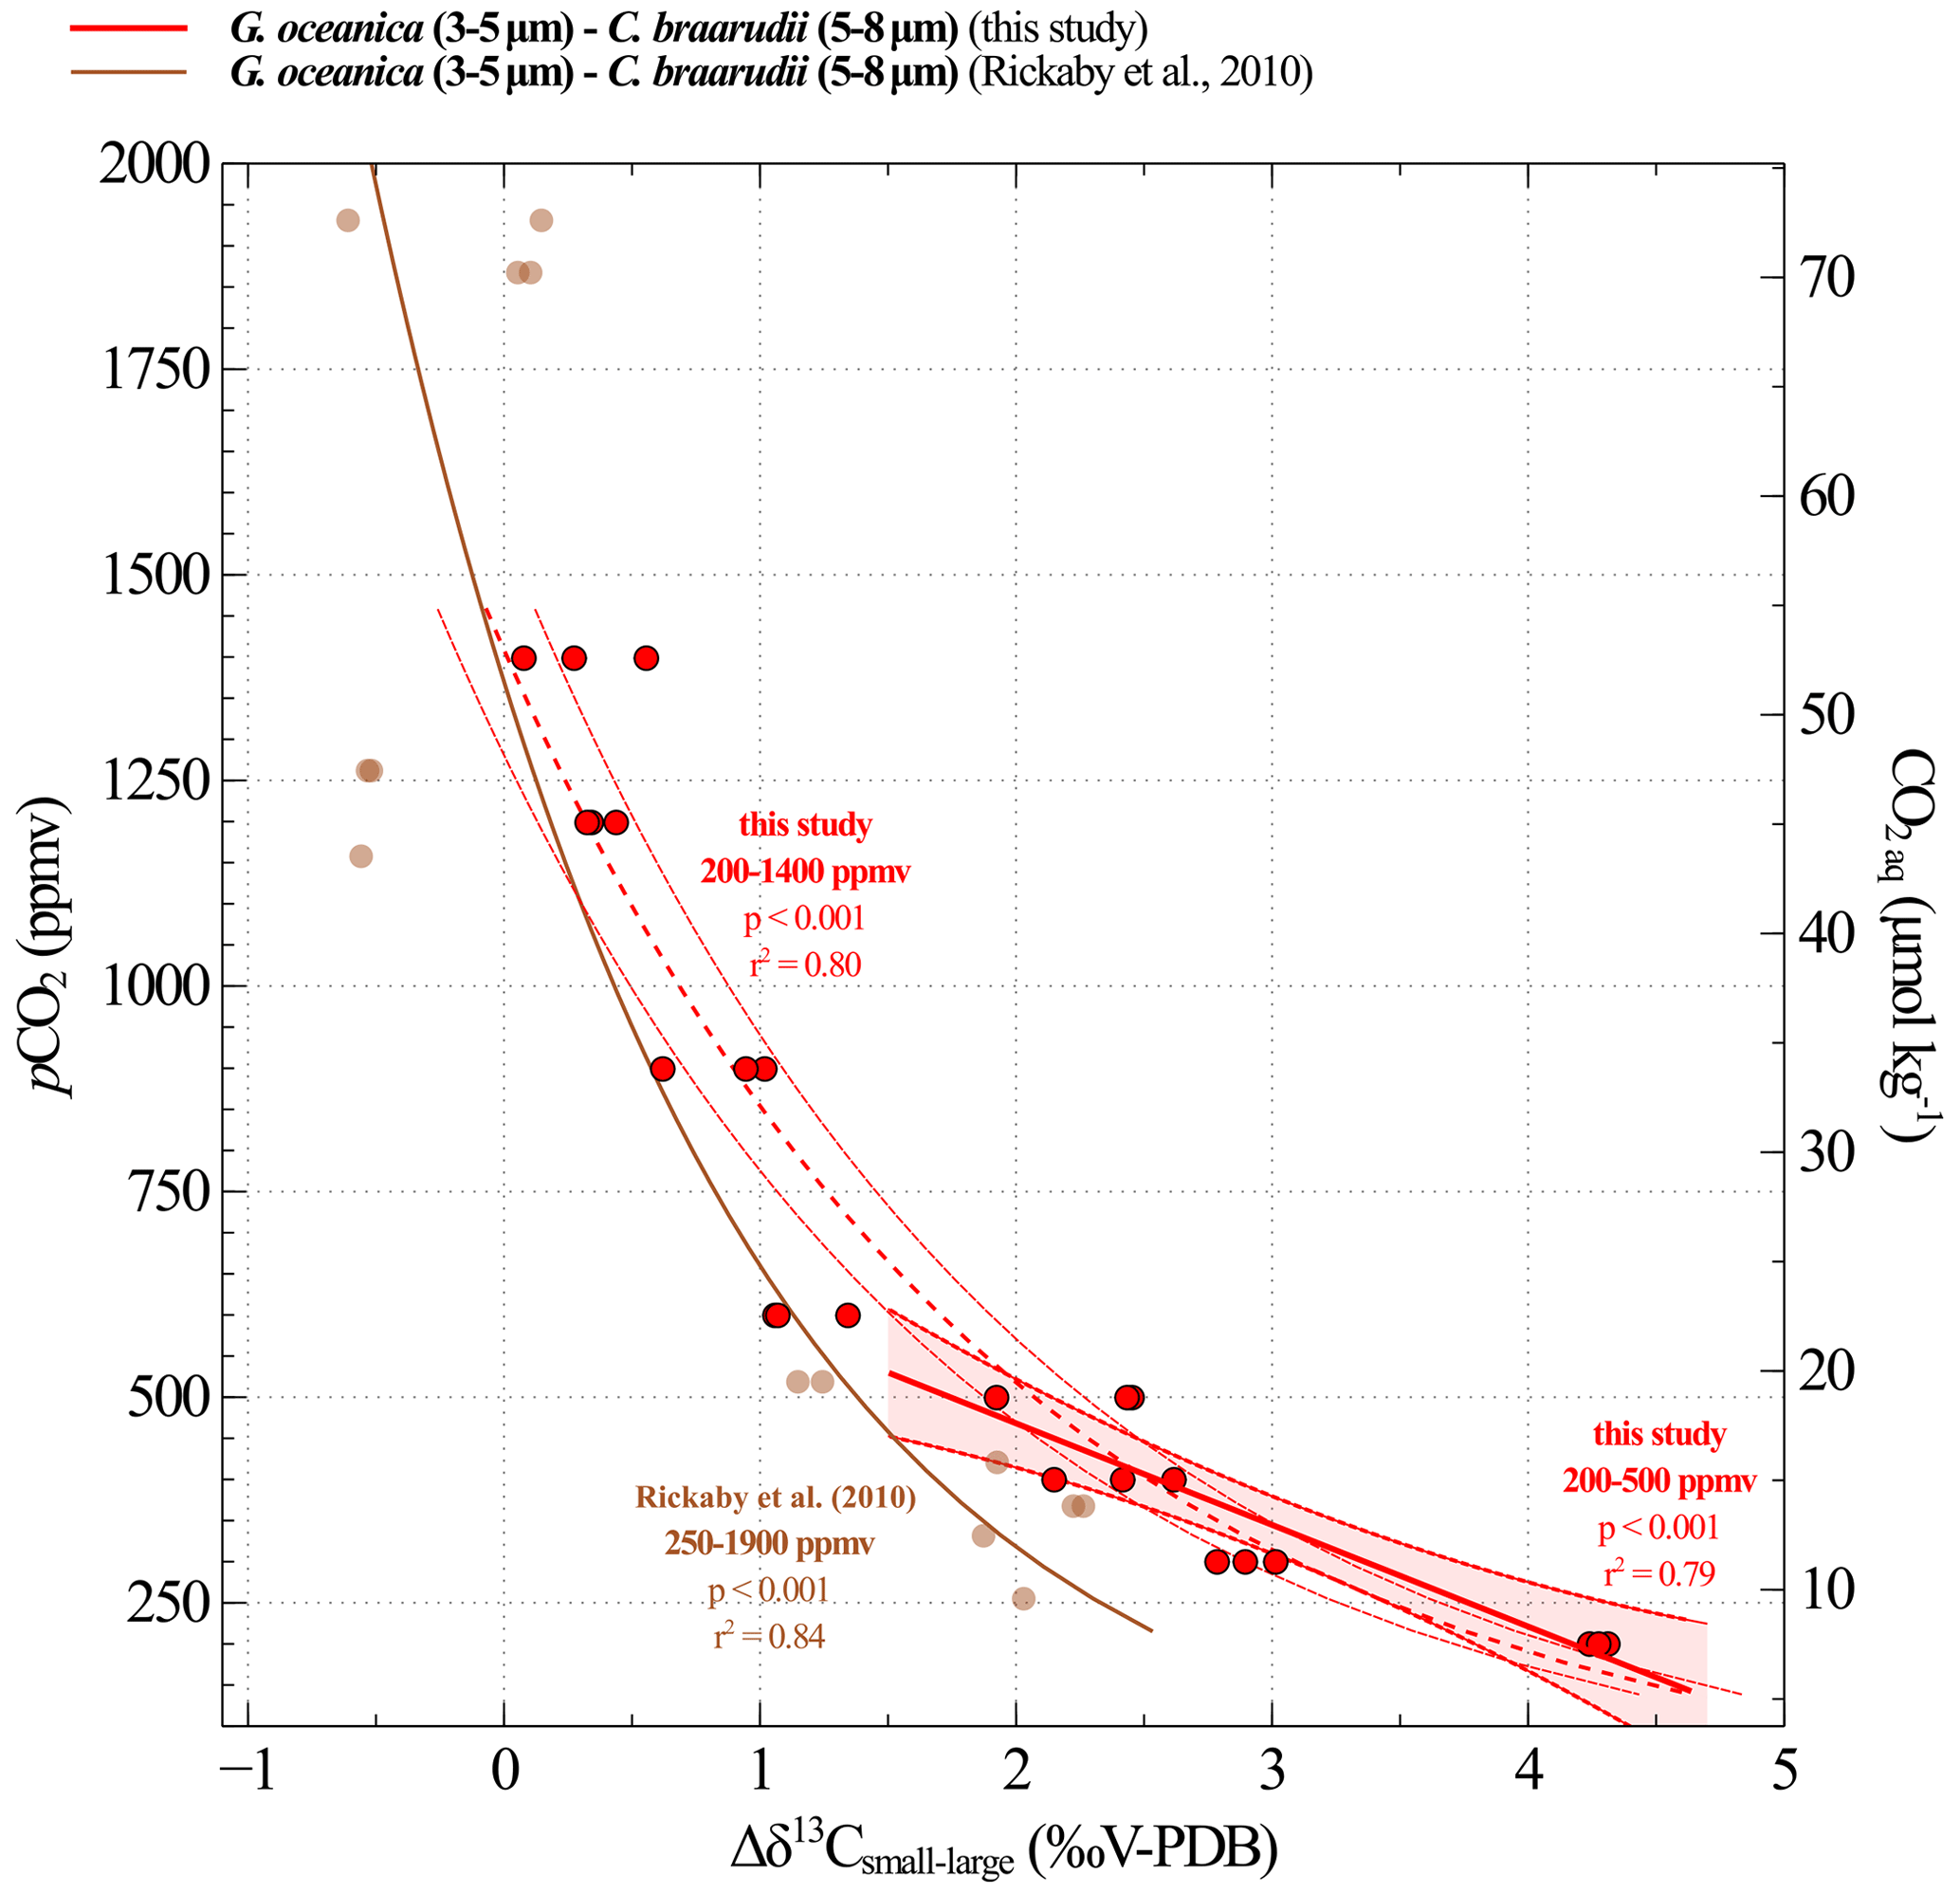
Figure A1Calibration between CO2 concentrations and Δδ13Csmall–large obtained from culture experiments at low and high CO2 levels. The results of our study are shown in red. Replicate data are illustrated with red dots. The linear regression made between 200 and 500 ppmv corresponds to the solid line and the confidence interval is shown with dotted lines. The dotted line shows the logarithmic regression made for the data on the whole interval (200 to 500 ppmv). The brown curve is the equation recalculated from Rickaby et al. (2010) dataset.
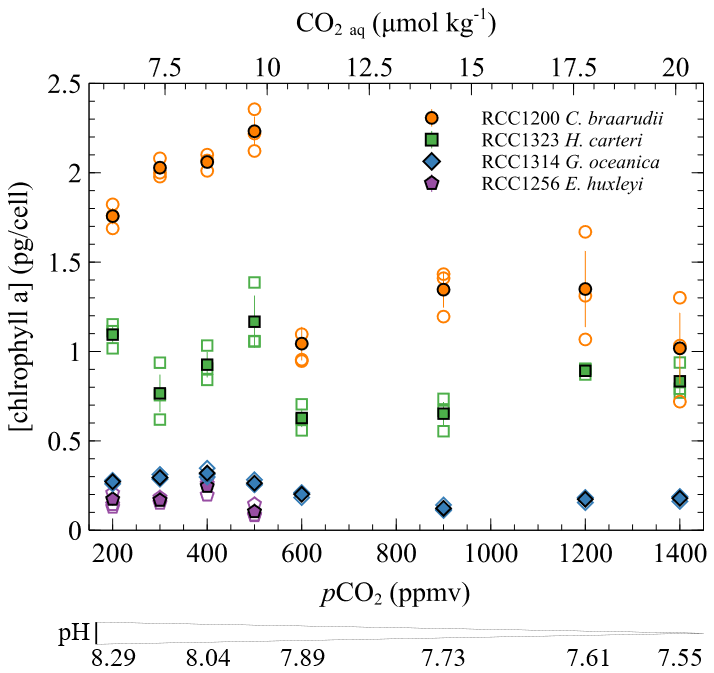
Figure A2Chlorophyll a concentration (pg per cell) as a function of CO2 and pH. The empty points are all the replicate data, and the filled points are the means (circles: Coccolithus braarudii, RCC 1200; diamonds: Gephyrocapsa oceanica, RCC 1314; squares: Helicosphaera carteri; pentagons: Emiliania huxleyi). Measurements of chlorophyll a concentration were conducted using fluorometry according to the SOMLIT national protocol (Yentsch and Menzel, 1963). A Turner Designs Trilogy fluorometer was employed to measure the fluorescence of our samples before and after acidification. The samples were acidified with 10 µL of hydrochloric acid per millilitre (mL) of acetone extract and left in the dark for 2 min between the two measurements. The equation used to calculate the chlorophyll concentration is taken from Lorenzen (1967).
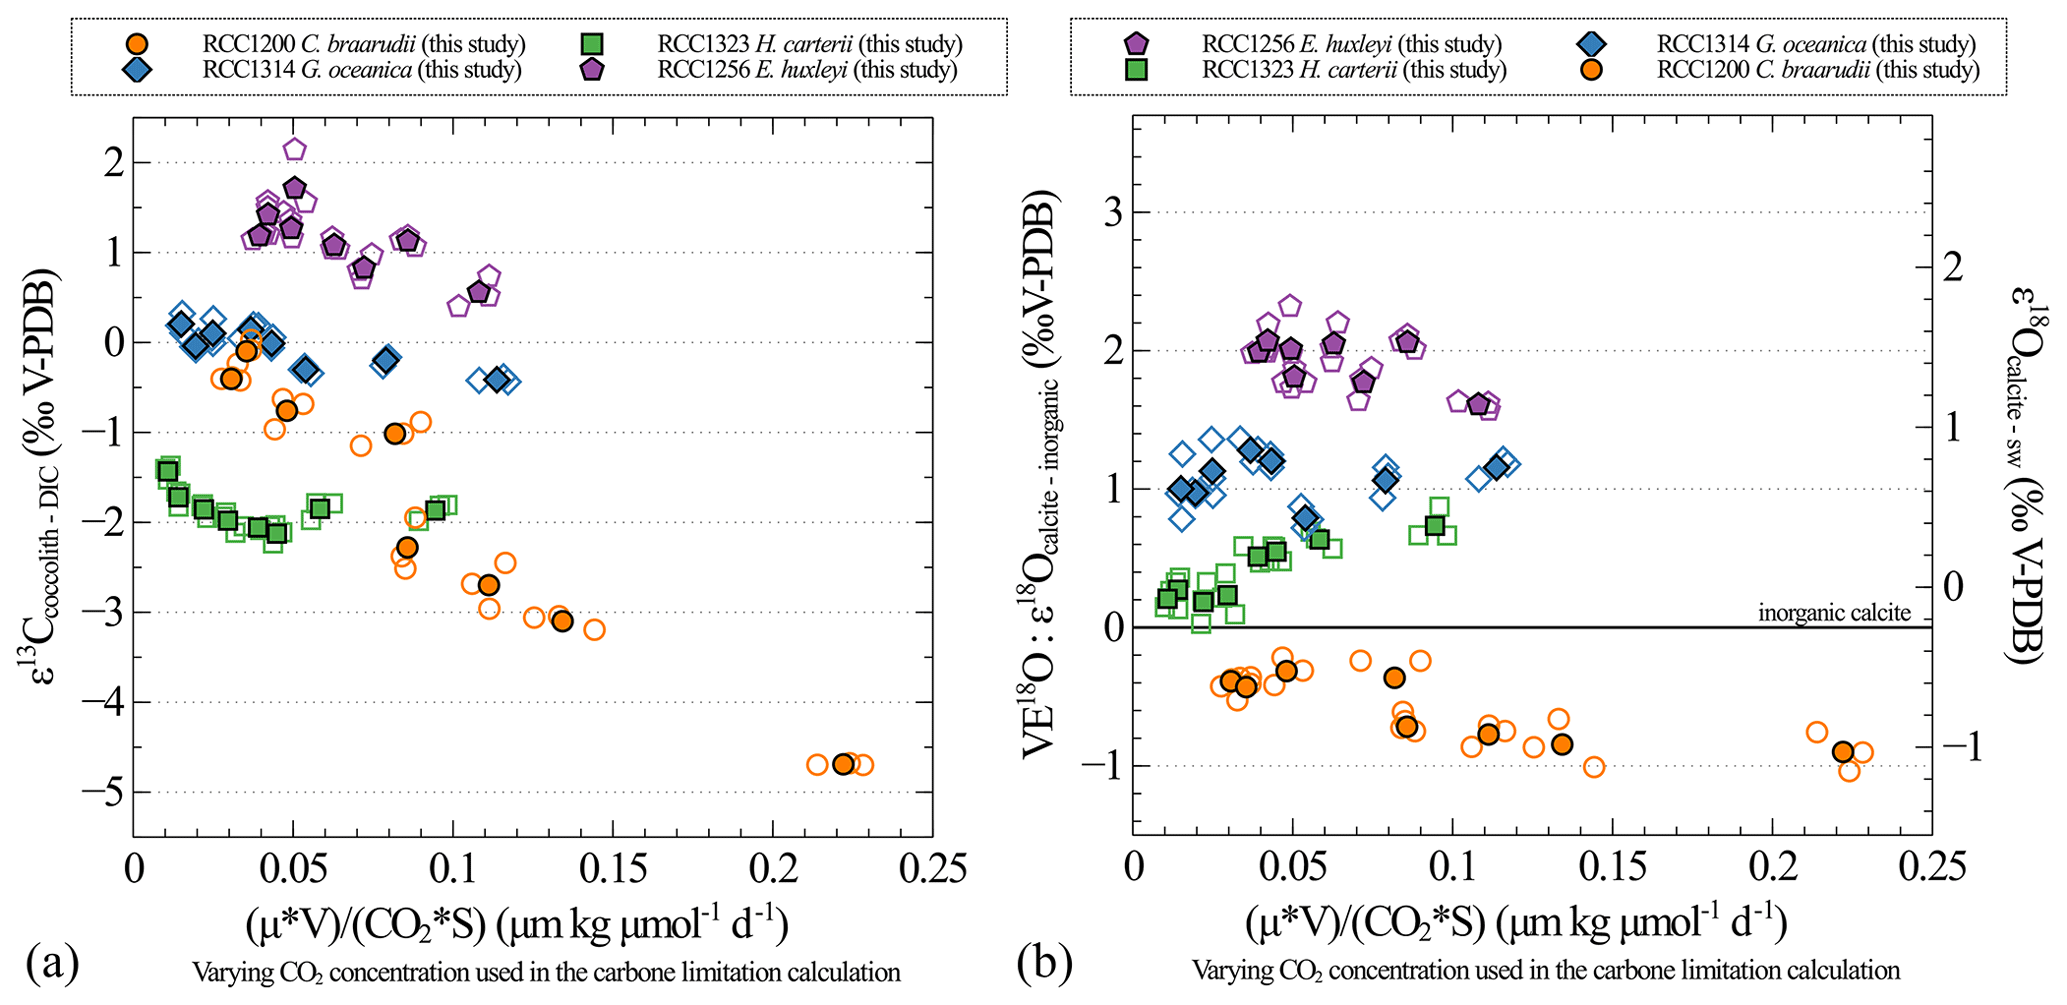
Figure A3Carbon (a) and oxygen (b) isotopic effect with changes in the carbon limitation. Carbon limitation is calculated as the product of growth rate (μ; in d−1) and coccosphere volume (V; in µm3) divided by the product of CO2 concentration (CO2; in µmol kg−1) and coccosphere surface (S; in µm2), according to Bidigare et al. (1997).
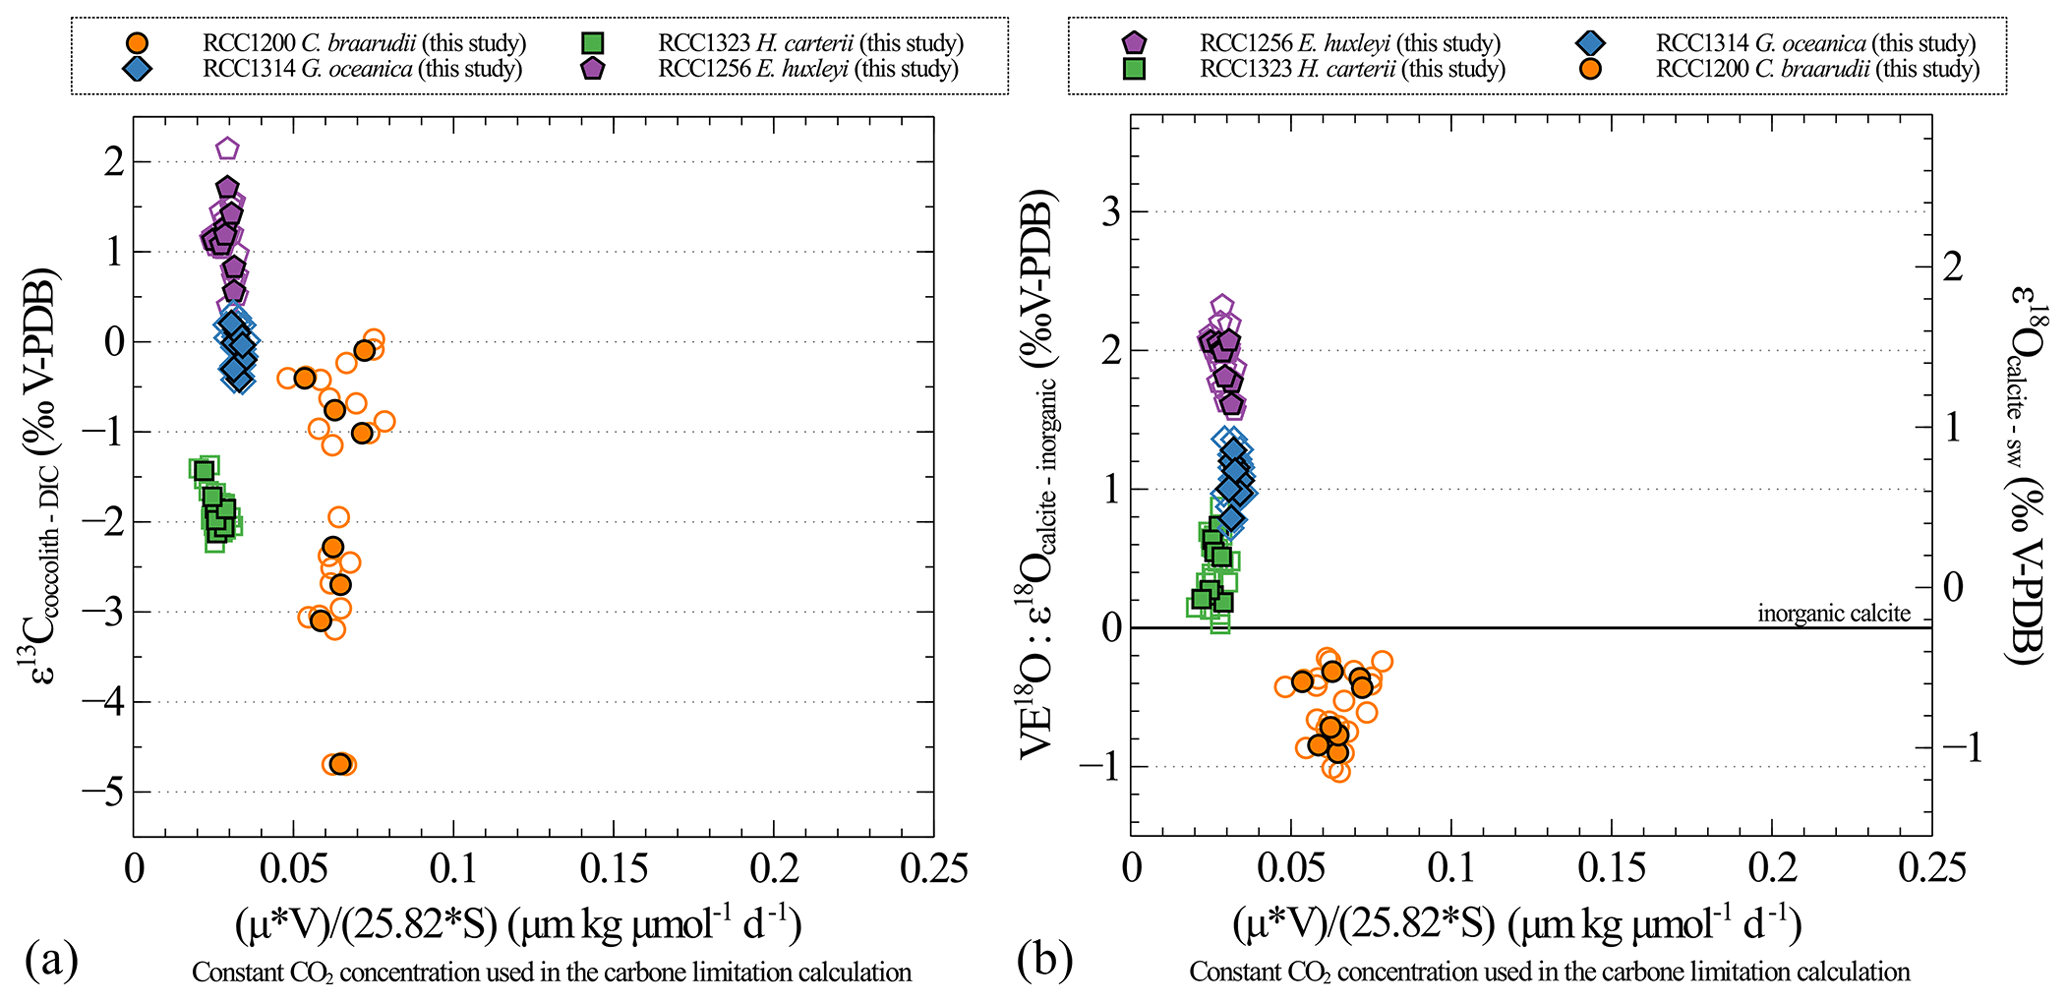
Figure A4Carbon (a) and oxygen (b) isotopic effect with changes in the carbon limitation calculated as for Fig. A3 with the difference that the CO2 concentration is a constant (25.82 µmol kg−1, mean CO2 concentration of the medium conditions in this study).
Available culture residues can be obtained upon demand (michael.hermoso@univ-littoral.fr). The data related to this article are available online at https://doi.org/10.5281/zenodo.12187457 (Le Guevel et al., 2024).
This study was conceived by MH and FM. Experiments were undertaken by GLG, CG and MH. Measurements were done by GLG, CG, GD and VR. Data were analysed by GLG, MH and FM. The paper was written by GLG, FM and MH with inputs from the other authors.
The contact author has declared that none of the authors has any competing interests.
Publisher's note: Copernicus Publications remains neutral with regard to jurisdictional claims made in the text, published maps, institutional affiliations, or any other geographical representation in this paper. While Copernicus Publications makes every effort to include appropriate place names, the final responsibility lies with the authors.
We thank Laurent Emmanuel and Amélie Guittet for help with the calcite isotopic analyses and Omar Boudouma for help with the SEM at the ISTeP laboratory, Sorbonne University. We are also grateful to Gilles Reverdin, Jérôme Demange, Claire Waelbroeck and Jonathan Fin for isotopic and DIC concentration analyses in the culture medium at LOCEAN, Sorbonne University. Some of the AT and CT data used in this study were analysed at the SNAPO-CO2 service facility at LOCEAN laboratory and supported by CNRS-INSU and OSU Ecce Terra. For help with isotopic analyses of organic matter, we thank Magali Ader, Virginia Rojas and Gérard Bardoux from IPGP. Our thanks also go to Ian Probert at the biological station of Roscoff for providing the strains.
This research has been supported by the French Agence Nationale de la Recherche (ANR) CARCLIM project under reference ANR-17-CE01-0004-01. This work is part of the graduate school IFSEA that benefits from grant no. ANR-21-EXES-0011 operated by the French National Research Agency under the France 2030 programme. The authors also received financial support from the French Centre National de la Recherche Scientifique (CNRS-INSU) TOPCAPI project within the TelluS-SYSTER programme.
This paper was edited by Jack Middelburg and reviewed by Hongrui Zhang and two anonymous referees.
Bach, L. T., MacKinder, L. C. M., Schulz, K. G., Wheeler, G., Schroeder, D. C., Brownlee, C., and Riebesell, U.: Dissecting the impact of CO2 and pH on the mechanisms of photosynthesis and calcification in the coccolithophore Emiliania huxleyi, New Phytol., 199, 121–134, https://doi.org/10.1111/nph.12225, 2013.
Badger, M. P. S., Chalk, T. B., Foster, G. L., Bown, P. R., Gibbs, S. J., Sexton, P. F., Schmidt, D. N., Pälike, H., Mackensen, A., and Pancost, R. D.: Insensitivity of alkenone carbon isotopes to atmospheric CO2 at low to moderate CO2 levels, Clim. Past, 15, 539–554, https://doi.org/10.5194/cp-15-539-2019, 2019.
Berges, J. A., Franklin, D. J., and Harrison, P. J.: Evolution of an artificial seawater medium: Improvements in enriched seawater, artificial water over the last two decades, J. Phycol., 37, 1138–1145, https://doi.org/10.1046/j.1529-8817.2001.01052.x, 2001.
Bidigare, R., Freeman, H., Hanson, L., Hayes, M., Jasper, P., King, L., Millero, J., Popp, N., Steinberg, A., and Wakeham, G.: Consistent fractionation of 13C in nature and in the laboratory: Growth-rate effects in some haptophyte algae, Global Biogeochem. Cy., 11, 279–292, 1997.
Bolton, C. T. and Stoll, H. M.: Late Miocene threshold response of marine algae to carbon dioxide limitation, Nature, 500, 558–562, https://doi.org/10.1038/nature12448, 2013.
Bolton, C. T., Stoll, H. M., and Mendez-Vicente, A.: Vital effects in coccolith calcite: Cenozoic climate-pCO2 drove the diversity of carbon acquisition strategies in coccolithophores?, Paleoceanography, 27, 1–16, https://doi.org/10.1029/2012PA002339, 2012.
Chauhan, N. and Rickaby, R. E. M.: Size-dependent dynamics of the internal carbon pool drive isotopic vital effects in calcifying phytoplankton, Geochim. Cosmochim. Ac., 373, 35–51, https://doi.org/10.1016/j.gca.2024.03.033, 2024.
Claxton, L. M., McClelland, H. L. O., Hermoso, M., and Rickaby, R. E. M.: Eocene emergence of highly calcifying coccolithophores despite declining atmospheric CO2, Nat. Geosci., 15, 826–831, https://doi.org/10.1038/s41561-022-01006-0, 2022.
Del Valls, T. A. and Dickson, A. G.: The pH of buffers based on 2-amino-2-hydroxymethyl-1,3-propanediol (“tris”) in synthetic sea water, Deep-Sea Res. Pt. I, 45, 1541–1554, 1998.
Dudley, W. C., Blackwelder, P., Brand, L., and Duplessy, J. C.: Stable isotopic composition of coccoliths, Mar. Micropaleontol., 10, 1–8, https://doi.org/10.1016/0377-8398(86)90021-6, 1986.
Ellis, R. J.: The most abundant protein in the world, Trends Biochem. Sci., 4, 241–244, https://doi.org/10.1016/0968-0004(79)90212-3, 1979.
Foster, G. L.: Seawater pH, pCO2 and [CO2-3] variations in the Caribbean Sea over the last 130 kyr: A boron isotope and study of planktic foraminifera, Earth Planet. Sc. Lett., 271, 254–266, https://doi.org/10.1016/j.epsl.2008.04.015, 2008.
Gafar, N. A., Eyre, B. D., and Schulz, K. G.: A conceptual model for projecting coccolithophorid growth, calcification and photosynthetic carbon fixation rates in response to global ocean change, Frontiers Mar. Sci., 4, 433, https://doi.org/10.3389/fmars.2017.00433, 2018.
Giordano, M., Beardall, J., and Raven, J. A.: CO2 concentrating mechanisms in algae: Mechanisms, environmental modulation, and evolution, Annu. Rev. Plant Biol., 56, 99–131, https://doi.org/10.1146/annurev.arplant.56.032604.144052, 2005.
Godbillot, C., Minoletti, F., Bassinot, F., and Hermoso, M.: Parallel between the isotopic composition of coccolith calcite and carbon levels across Termination II: developing a new paleo−CO2 probe, Clim. Past, 18, 449–464, https://doi.org/10.5194/cp-18-449-2022, 2022.
Gutknecht, J., Bisson, M. A., and Tosteson, F. C.: Diffusion of carbon dioxide through lipid bilayer membranes: effects of carbonic anhydrase, bicarbonate, and unstirred layers, J. Gen. Physiol., 69, 779–794, https://doi.org/10.1085/jgp.69.6.779, 1977.
Guy, R. D., Fogel, M. L., and Berry, J. A.: Photosynthetic fractionation of the stable isotopes of oxygen and carbon, Plant Physiol., 101, 37–47, https://doi.org/10.1104/pp.101.1.37, 1993.
Hermoso, M.: Control of ambient pH on growth and stable isotopes in phytoplanktonic calcifying algae, Paleoceanography, 30, 1100–1112, https://doi.org/10.1002/2015PA002844, 2015.
Hermoso, M., Horner, T. J., Minoletti, F., and Rickaby, R. E. M.: Constraints on the vital effect in coccolithophore and dinoflagellate calcite by oxygen isotopic modification of seawater, Geochim. Cosmochim. Ac., 141, 612–627, https://doi.org/10.1016/j.gca.2014.05.002, 2014.
Hermoso, M., Chan, I. Z. X., McClelland, H. L. O., Heureux, A. M. C., and Rickaby, R. E. M.: Vanishing coccolith vital effects with alleviated carbon limitation, Biogeosciences, 13, 301–312, https://doi.org/10.5194/bg-13-301-2016, 2016a.
Hermoso, M., Minoletti, F., Aloisi, G., Bonifacie, M., McClelland, H. L. O., Labourdette, N., Renforth, P., Chaduteau, C., and Rickaby, R. E. M.: An explanation for the 18O excess in Noelaerhabdaceae coccolith calcite, Geochim. Cosmochim. Ac., 189, 132–142, https://doi.org/10.1016/j.gca.2016.06.016, 2016b.
Hermoso, M., McClelland, H. L. O., Hirst, J. S., Minoletti, F., Bonifacie, M., and Rickaby, R. E. M.: Towards the use of the coccolith vital effects in palaeoceanography: A field investigation during the middle Miocene in the SW Pacific Ocean, Deep-Sea Res. Pt. I, 160, 103262, https://doi.org/10.1016/j.dsr.2020.103262, 2020.
Jasper, J. P. and Hayes, J. M.: A carbon isotope record of CO2 levels during the late Quaternary, Nature, 347, 462–464, https://doi.org/10.1038/347462a0, 1990.
Keller, M. D., Selvin, R. C., Claus, W., and Guillard, R. R. L.: Media for the culture of oceanic ultraphytoplankton, J. Phycol., 23, 633–638, https://doi.org/10.1111/j.1529-8817.1987.tb04217.x, 1987.
Kim, S.-T. and O’Neil, J. R.: Equilibrium and nonequilibrium oxygen isotope effects in synthetic carbonates, Geochim. Cosmochim. Acta, 61, 3461–3475, 1997.
Klochko, K., Kaufman, A. J., Yao, W., Byrne, R. H., and Tossell, J. A.: Experimental measurement of boron isotope fractionation in seawater, Earth Planet. Sc. Lett., 248, 276–285, https://doi.org/10.1016/j.epsl.2006.05.034, 2006.
Kottmeier, D. M., Chrachri, A., Langer, G., Helliwell, K. E., Wheeler, G. L., and Brownlee, C.: Reduced HC channel activity disrupts pH homeostasis and calcification in coccolithophores at low ocean pH, P. Natl. Acad. Sci. USA, 119, e2118009119, https://doi.org/10.1073/pnas.2118009119, 2022.
Krug, S. A., Schulz, K. G., and Riebesell, U.: Effects of changes in carbonate chemistry speciation on Coccolithus braarudii: a discussion of coccolithophorid sensitivities, Biogeosciences, 8, 771–777, https://doi.org/10.5194/bg-8-771-2011, 2011.
Langer, G., Geisen, M., Baumann, K. H., Kläs, J., Riebesell, U., Thoms, S., and Young, J. R.: Species-specific responses of calcifying algae to changing seawater carbonate chemistry, Geochem. Geophy. Geosy., 7, Q09006, https://doi.org/10.1029/2005GC001227, 2006.
Langer, G., Nehrke, G., Probert, I., Ly, J., and Ziveri, P.: Strain-specific responses of Emiliania huxleyi to changing seawater carbonate chemistry, Biogeosciences, 6, 2637–2646, https://doi.org/10.5194/bg-6-2637-2009, 2009.
Laws, E. A., Popp, B. N., Bidigare, R. R., Kennicutt, M. C., and Macko, S. A.: Dependence of phytoplankton carbon isotopic composition on growth rate and [CO2]aq: Theoretical considerations and experimental results, Geochim. Cosmochim. Ac., 59, 1131–1138, 1995.
Laws, E. A., Popp, B. N., Bidigare, R. R., Riebesell, U., Burkhardt, S., and Wakeham, S. G.: Controls on the molecular distribution and carbon isotopic composition of alkenones in certain haptophyte algae, Geochem. Geophy. Geosy., 2, 1006, https://doi.org/10.1029/2000gc000057, 2001.
Le Guevel, G., Minoletti, F., Geisen, C., Rojas, V., Duong, G., and Hermoso, M.: Isotopic and physiologic data for coccolithophores cultured in various CO2 and pH conditions, Zenodo [data set], https://doi.org/10.5281/zenodo.12187457, 2024.
Lewis, E. and Wallace, D.: Program developed for CO2 system calculations, Environmental Sciences Division, 4735, https://doi.org/10.2172/639712, 1998.
Lorenzen, C. J.: Determination of chlorophyll and pheo-pigments: spectrophotometric equations, Limnol. Oceanogr., 12, 343–346, https://doi.org/10.4319/lo.1967.12.2.0343, 1967.
McClelland, H. L. O., Bruggeman, J., Hermoso, M., and Rickaby, R. E. M.: The origin of carbon isotope vital effects in coccolith calcite, Nat. Commun., 8, 14511, https://doi.org/10.1038/ncomms14511, 2017.
Minoletti, F., Hermoso, M., and Gressier, V.: Separation of sedimentary micron-sized particles for palaeoceanography and calcareous nannoplankton biogeochemistry, Nat. Protoc., 4, 14–24, https://doi.org/10.1038/nprot.2008.200, 2008.
Müller, M. N., Schulz, K. G., and Riebesell, U.: Effects of long-term high CO2 exposure on two species of coccolithophores, Biogeosciences, 7, 1109–1116, https://doi.org/10.5194/bg-7-1109-2010, 2010.
Nimer, N. A., Ling, M. X., Brownlee, C. and Merrett, M. J.: Inorganic carbon limitation, exofacial carbonic anhydrase activity, and plasma membrane redox activity in marine phytoplankton species, J. Phycol., 1205, 1200–1205, https://doi.org/10.1046/j.1529-8817.1999.3561200.x, 1999.
Pagani, M.: The alkenone-CO2 proxy and ancient atmospheric carbon dioxide, Philos. T. Roy. Soc. A, 360, 609–632, https://doi.org/10.1098/rsta.2001.0959, 2002.
Pagani, M., Arthur, M. A., and Freeman, K. H.: Miocene evolution of atmospheric carbon dioxide, Paleoceanography, 14, 273–292, https://doi.org/10.1029/1999PA900006, 1999.
Pagani, M., Liu, Z., LaRiviere, J., and Ravelo, A. C.: High Earth-system climate sensitivity determined from Pliocene carbon dioxide concentrations, Nat. Geosci., 3, 27–30, https://doi.org/10.1038/ngeo724, 2010.
Paneth, P. and O'Leary, M. H.: Carbon isotope effect on dehydration of bicarbonate ion catalyzed by carbonic anhydrase, Biochemistry, 24, 5143–5147, 1985.
Parker, M. D. and Boron, W. F.: The Divergence, Actions, Roles, and Relatives of Sodium-Coupled Bicarbonate Transporters, Physiol. Rev., 93, 803–959, https://doi.org/10.1152/physrev.00023.2012, 2013.
Phelps, S. R., Hennon, G. M. M., Dyhrman, S. T., Hernández Limón, M. D., Williamson, O. M., and Polissar, P. J.: Carbon Isotope Fractionation in Noelaerhabdaceae Algae in Culture and a Critical Evaluation of the Alkenone Paleobarometer, Geochem. Geophy. Geosy., 22, 1–20, https://doi.org/10.1029/2021GC009657, 2021.
Popp, B. N., Laws, E. A., Bidigare, R. R., Dore, J. E., Hanson, K. L., and Wakeham, S. G.: Effect of Phytoplankton Cell Geometry on Carbon Isotopic Fractionation, Geochim. Cosmochim. Ac., 62, 69–77, https://doi.org/10.1016/S0016-7037(97)00333-5, 1998.
Rae, J. W. B., Zhang, Y. G., Liu, X., Foster, G. L., Stoll, H. M., and Whiteford, R. D. M.: Atmospheric CO2 over the Past 66 Million Years from Marine Archives, Annu. Rev. Earth Pl. Sc., 49, 609–641, https://doi.org/10.1146/annurev-earth-082420-063026, 2021.
Rau, G. H., Riebesell, U., and Wolf-Gladrow, D.: A model of photosynthetic 13C fractionation by marine phytoplankton based on diffusive molecular CO2 uptake, Mar. Ecol. Prog. Ser., 133, 275–285, https://doi.org/10.3354/meps133275, 1996.
Reinfelder, J. R.: Carbon concentrating mechanisms in eukaryotic marine phytoplankton, Annu. Rev. Mar. Sci., 3, 291–315, https://doi.org/10.1146/annurev-marine-120709-142720, 2011.
Rickaby, R. E. M., Henderiks, J., and Young, J. N.: Perturbing phytoplankton: response and isotopic fractionation with changing carbonate chemistry in two coccolithophore species, Clim. Past, 6, 771–785, https://doi.org/10.5194/cp-6-771-2010, 2010.
Riebesell, U., Zondervan, I., Rost, B., Tortell, P. D., Zeebe, R. E., and Morel, F. M. M.: Reduced calcification of marine plankton in response to increased atmospheric CO2, Nature, 407, 364–367, https://doi.org/10.1038/35030078, 2000.
Riebesell, U., Fabry, V. J., Hansson, L., and Gattuso, J.-P.: Guide to best practices for ocean acidification research and data reporting [reprinted edition including erratum], Publications Office of the European Union, 258 pp., https://doi.org/10.2777/66906, 2011.
Romero, M. F., Fulton, C. M., and Boron, W. F.: The SLC4 family of transporters, Pflug. Arch. Eur. J. Phy., 447, 495–509, https://doi.org/10.1007/s00424-003-1180-2, 2004.
Sanyal, A., Hemming, N. G., Hanson, G. N., and Broecker, W. S.: Evidence for a higher pH in the glacial ocean from boron isotopes in foraminifera, Nature, 373, 234–236, https://doi.org/10.1038/373234a0, 1995.
Sato, T., Yuguchi, S., Takayama, T., and Kameo, K.: Drastic change in the geographical distribution of the cold-water nannofossil Coccolithus pelagicus (Wallich) Schiller at 2.74 Ma in the late Pliocene, with special reference to glaciation in the Arctic Ocean, Mar. Micropaleontol., 52, 181–193, https://doi.org/10.1016/j.marmicro.2004.05.003, 2004.
Sett, S., Bach, L. T., Schulz, K. G., Koch-Klavsen, S., Lebrato, M., and Riebesell, U.: Temperature modulates coccolithophorid sensitivity of growth, photosynthesis and calcification to increasing seawater pCO2, PLOS One, 9, e88308, https://doi.org/10.1371/journal.pone.0088308, 2014.
Sosdian, S. M., Greenop, R., Hain, M. P., Foster, G. L., Pearson, P. N., and Lear, C. H.: Constraining the evolution of Neogene ocean carbonate chemistry using the boron isotope pH proxy, Earth Planet. Sc. Lett., 498, 362–376, https://doi.org/10.1016/j.epsl.2018.06.017, 2018.
Stevenson, E. I., Hermoso, M., Rickaby, R. E. M., Tyler, J. J., Minoletti, F., Parkinson, I. J., Mokadem, F., and Burton, K. W.: Controls on stable strontium isotope fractionation in coccolithophores with implications for the marine Sr cycle, Geochim. Cosmochim. Ac., 128, 225–235, https://doi.org/10.1016/j.gca.2013.11.043, 2014.
Stoll, H. M. and Ziveri, P.: Separation of monospecific and restricted coccolith assemblages from sediments using differential settling velocity, Mar. Micropaleontol., 46, 209–221, https://doi.org/10.1016/S0377-8398(02)00040-3, 2002.
Taylor, A. R., Chrachri, A., Wheeler, G., Goddard, H., and Brownlee, C.: A voltage-gated H+ channel underlying pH homeostasis in calcifying Coccolithophores, PLoS Biol., 9, e1001085, https://doi.org/10.1371/journal.pbio.1001085, 2011.
Tremblin, M., Hermoso, M., and Minoletti, F.: Equatorial heat accumulation as a long-term trigger of permanent Antarctic ice sheets during the Cenozoic, P. Natl. Acad. Sci. USA, 113, 11782–11787, https://doi.org/10.1073/pnas.1608100113, 2016.
Tripati, A. K., Roberts, C. D., Eagle, R. A., and Li, G.: A 20 million year record of planktic foraminiferal ratios: Systematics and uncertainties in pCO2 reconstructions, Geochim. Cosmochim. Ac., 75, 2582–2610, https://doi.org/10.1016/j.gca.2011.01.018, 2011.
Usdowski, E., Michaelis, J., Bottcher, M. E., and Hoef, J.: Factors for the oxygen isotope equilibrium fractionation between aqueous and gaseous CO2, carbonic acid, bicarbonate, carbonate, and water (19 °C), Z. Phys. Chem., 170, 237–249, 1991.
Wolf-Gladrow, D. and Riebesell, U.: Diffusion and reactions in the vicinity of plankton: A refined model for inorganic carbon transport, Mar. Chem., 59, 17–34, https://doi.org/10.1016/S0304-4203(97)00069-8, 1997.
Yentsch, C. S. and Menzel, D. W.: A method for the determination of phytoplankton chlorophyll and phaeophytin by fluorescence, Deep-Sea Research and Oceanographic Abstracts, 10, 221–231, https://doi.org/10.1016/0011-7471(63)90358-9, 1963.
Zeebe, R. and Wolf-Gladrow, D.: CO2 in Seawater: Equilibrium, Kinetics, Isotopes, in: Oceanography Book Series, Elsevier Oceanography Series 65, vol. 65, Amsterdam, 346 pp., ISBN 0444509461, 2001.
Zhang, H., Stoll, H., Bolton, C., Jin, X., and Liu, C.: Technical note: A refinement of coccolith separation methods: measuring the sinking characteristics of coccoliths, Biogeosciences, 15, 4759–4775, https://doi.org/10.5194/bg-15-4759-2018, 2018.
Zhang, H., Liu, C., Mejía, L. M., and Stoll, H.: Technical note: Accelerate coccolith size separation via repeated centrifugation, Biogeosciences, 18, 1909–1916, https://doi.org/10.5194/bg-18-1909-2021, 2021.
Zhang, Y. G., Pearson, A., Benthien, A., Dong, L., Huybers, P., Liu, X., and Pagani, M.: Refining the alkenone-pCO2 method I: Lessons from the Quaternary glacial cycles, Geochim. Cosmochim. Ac., 260, 177–191, https://doi.org/10.1016/j.gca.2019.06.032, 2019.
Zhang, Y. G., Henderiks, J., and Liu, X.: Refining the alkenone-pCO2 method II: Towards resolving the physiological parameter “b”, Geochim. Cosmochim. Ac., 281, 118–134, https://doi.org/10.1016/j.gca.2020.05.002, 2020.
Ziveri, P., Stoll, H., Probert, I., Klaas, C., Geisen, M., Ganssen, G., and Young, J.: Stable isotope “vital effects” in coccolith calcite, Earth Planet. Sc. Lett., 210, 137–149, https://doi.org/10.1016/S0012-821X(03)00101-8, 2003.