the Creative Commons Attribution 4.0 License.
the Creative Commons Attribution 4.0 License.
 | 19 May 2025
Role of air–soil temperature in the leaf area index (LAI) course and role of height–diameter at breast height (DBH) in the maximum LAI during foliation of Platanus orientalis L. in an urban–rural greenway system
Turgay Biricik
Rıdvan Koruyan
Rural greenway systems passing through woodlands to connect urban societies are valuable in terms of not only transportation but also roadside tree phenology and ecophysiology and associated recreation. Therefore, particularly during their foliation periods, monitoring and analyses of that phenological and ecophysiological course of the roadside trees will primarily indicate their gradual degree of closure and will determine their gradual degree of coverage on the road and the roadside. Hence, the leaf area index (LAI) is a significant and comprehensive canopy parameter which is referred to for those monitoring and analyses procedures. This gradual-closure indicator and coverage determinant parameter can further be used for detecting shading and recreation potential, as well as the safety level of those greenways. Major driving factors of the phenological and ecophysiological course can also be investigated by monitoring and assessing the development of and change in the mean LAI under the influence of the mean temperature, height and diameter at breast height (DBH) values. Therefore, for this study, in order to monitor and determine the development of and change in LAI, hemispherical photographs were taken beneath the tree canopies at 10 different points along part of a regionally well known greenway system, which involves alleys of Platanus orientalis L. (oriental plane) trees. This point-based hemispherical photographing procedure was applied and repeated 20 times, particularly during the foliation period between mid-March and late June, when a total of 200 photographs were obtained and analysed using a digital image processing method. The seasonal course of the LAI values was graphed for each point, and principally the daily mean LAI (ranging between 0.35 and 2.76 m2 m−2) was evaluated referring to both the air and the soil (−10 cm) temperature data. The point-based maximum LAI values (average 2.76 m2 m−2, ranging between 2.42 and 3.16) were achieved during mid-June. They were examined comparing their ranking with the rankings of the basic physiological parameters: mean height (ranging between 17.0 and 26.7 m) and mean DBH (ranging between 26.5 and 38.2 cm) and number of trees (5 to 15) within the canopy frames of the relevant points. Afterwards, the phenologically based and daily mean LAI values were discussed dependent upon their high and significant correlation, particularly with the soil temperature data (r = 0.89, P < 0.01), and the point-based maximum LAI values were also discussed dependent upon their non-correlation with the point-based mean height and mean DBH. In conclusion, the overall results of this study primarily emphasize the influence of the soil temperature on the phenological course of oriental plane canopies and on the development of their daily mean LAI, particularly during their foliation period. This current effect of the soil temperature indicates the potential alarm triggered by the early budburst dates and associated possible advance of the tree foliation period, depending on the warming capacity of the road asphalt and roadside pavement on the soil underneath, particularly during and after new-pavement and resurfacing practices.
- Article
(6713 KB) - Full-text XML
- BibTeX
- EndNote


The introduction of intercity roads into rural landscapes that are predominantly composed of ecologically sensitive vegetative ecosystems requires environmental responsibility (Forman and Alexander, 1998). These intercity roads that pass through woodlands and forests mostly constitute rural greenway systems and ultimately become part of the overall rural landscape by becoming integrated with those surrounding woodland ecosystems (Konijnendijk, 2008; Turner and Gardner, 2015). Their trees frequently lined up on the roadside often form alleys with different canopy closures throughout the different seasons and hence play active roles in road shading and safety and associated recreation (Wolf, 2003). The species, arrangement and number of these trees together with their physiological characteristics are the common and key factors for determining the degree of canopy closure and relevant coverage of tree projection over the road and on the roadside ground (Rahman et al., 2015). However, principally for deciduous tree canopies, the phenological course of these roadside trees, particularly during their foliation periods, also influences the degree of canopy closure and relevant coverage not only on a spatial basis but also on a temporal basis (Neyns and Canters, 2022). Therefore, continuous monitoring for the purpose of determining both the trees' phenological course and their physiological characteristics through the analysis of certain vegetation parameters will help to define the degree of canopy closure and relevant coverage (Granero-Belinchon et al., 2020; Pu, 2021) on the road and roadsides of these rural greenway systems as well (Wang et al., 2019). Furthermore, associating and correlating those parameters with some ecological factors such as daily temperature data will also contribute to discovering ecophysiological characteristics that will consequently assist in determining the probable role of these parameters in ecosystem services (García-Pardo et al., 2022).
Depending principally upon their active role in photosynthesis, leaves and canopies affect the stem physiology of trees (Pretzsch, 2009). Thus, the diameter at breast height (DBH) and the height of trees are the two significant physiological parameters that define the trees' growth characteristics (Landsberg and Sands, 2011). Hence, stem and overall tree physiology are directly related to canopy physiology and characteristics. However, the reverse role of tree leaves and canopies in their DBH and height has not been thoroughly determined, particularly for deciduous trees. Although there are scientific studies that have tried to correlate the crown area (e.g. Blanchard et al., 2016) and canopy structure (e.g. Côté et al., 2012) of the trees with their height and DBH, tree canopy parameters that are directly referred to as indicators of canopy characteristics under the influence of stem physiological characteristics are relatively restricted. Out of those canopy parameters, the leaf area index (LAI; m2 m−2), which defines the one-sided area of all the leaves within a particular canopy over the projection area of that canopy (Burrows et al., 2002), is the most prominent. Therefore, LAI is the key parameter indicating the influence level of the leaves and canopies of tree–shrub communities within many substantial phenological, ecological, ecophysiological, climatological and hydrological processes (Bonan, 2016). The LAI parameter is consequently an indicator of canopy closure and the associated shading potential of those tree canopies, ultimately being linked to the recreation potential of the environment where those trees exist (Zhang et al., 2022). Moreover, many recent studies have indicated the relatively high and significant positive correlations between LAI and tree and canopy heights (Yuan et al., 2013; Klingberg et al., 2017). Additionally, air and soil temperatures are the main driving climatic factors behind phenological and ecophysiological processes and hence to some extent the periodical, seasonal and overall annual course of LAI values of forest trees within both urban and rural landscapes (Öztürk et al., 2015).
Consequently, the main aim of this study is to investigate and reveal the importance and effective role of the air–soil temperature in the seasonal change in tree LAI and to question the existence of the role of tree physiology in the maximum LAI values along a roadside. Thus, in this study, the LAI course of oriental plane (Platanus orientalis L.) trees was monitored and analysed, principally throughout the foliation seasons and particularly referring to relevant daily temperature data and physiological parameters solely during the time period when maximum LAI values were achieved. For this purpose, LAIs of tree canopies over definite different points were determined along part of a greenway system, which constitutes a certain section of a temperate forest ecosystem between two provinces. These determined LAI values, as well as their correlation with the air–soil temperature data, were discussed with regard to their phenological periods. Besides, the point-based maximum LAI values were discussed based primarily on their height and DBH values, especially questioning the existence and level of correlation between them. In this way, the influence of tree stem physiology on the maximum LAI values of the tree canopies was determined.
1.1 Species description of Platanus orientalis L.
Platanus orientalis L. (oriental plane), which belongs to the Platanaceae family, is a deciduous, vigorous tree up to 30 m in height, overshadowing large areas with its large canopy (Boyd et al., 1996). Its massive trunk is smooth with ash-grey bark, which peels off in large thin flakes, and its large leaves with flat surfaces are each cut into five deep lobes with numerous secondary notches (Anşin and Özkan, 1997). Oriental planes are both forest and ornamental trees that naturally extend from the Balkans towards Anatolia and then towards the Himalayas (Davis, 1982). They also exist in Ireland and South America (Johns, 2014). They require direct sunlight and a sunny environment and therefore need warm and humid climates (Çepel, 1994), and they prefer good soil on a high water table, near running water at the valley bottoms (Saatçioğlu, 1976). Given the fact that their physiological characteristics, particularly their height and vast canopy, lead them to be among the most distinguished alley trees, they are suitable for urban and rural greenways (Johns, 2014).
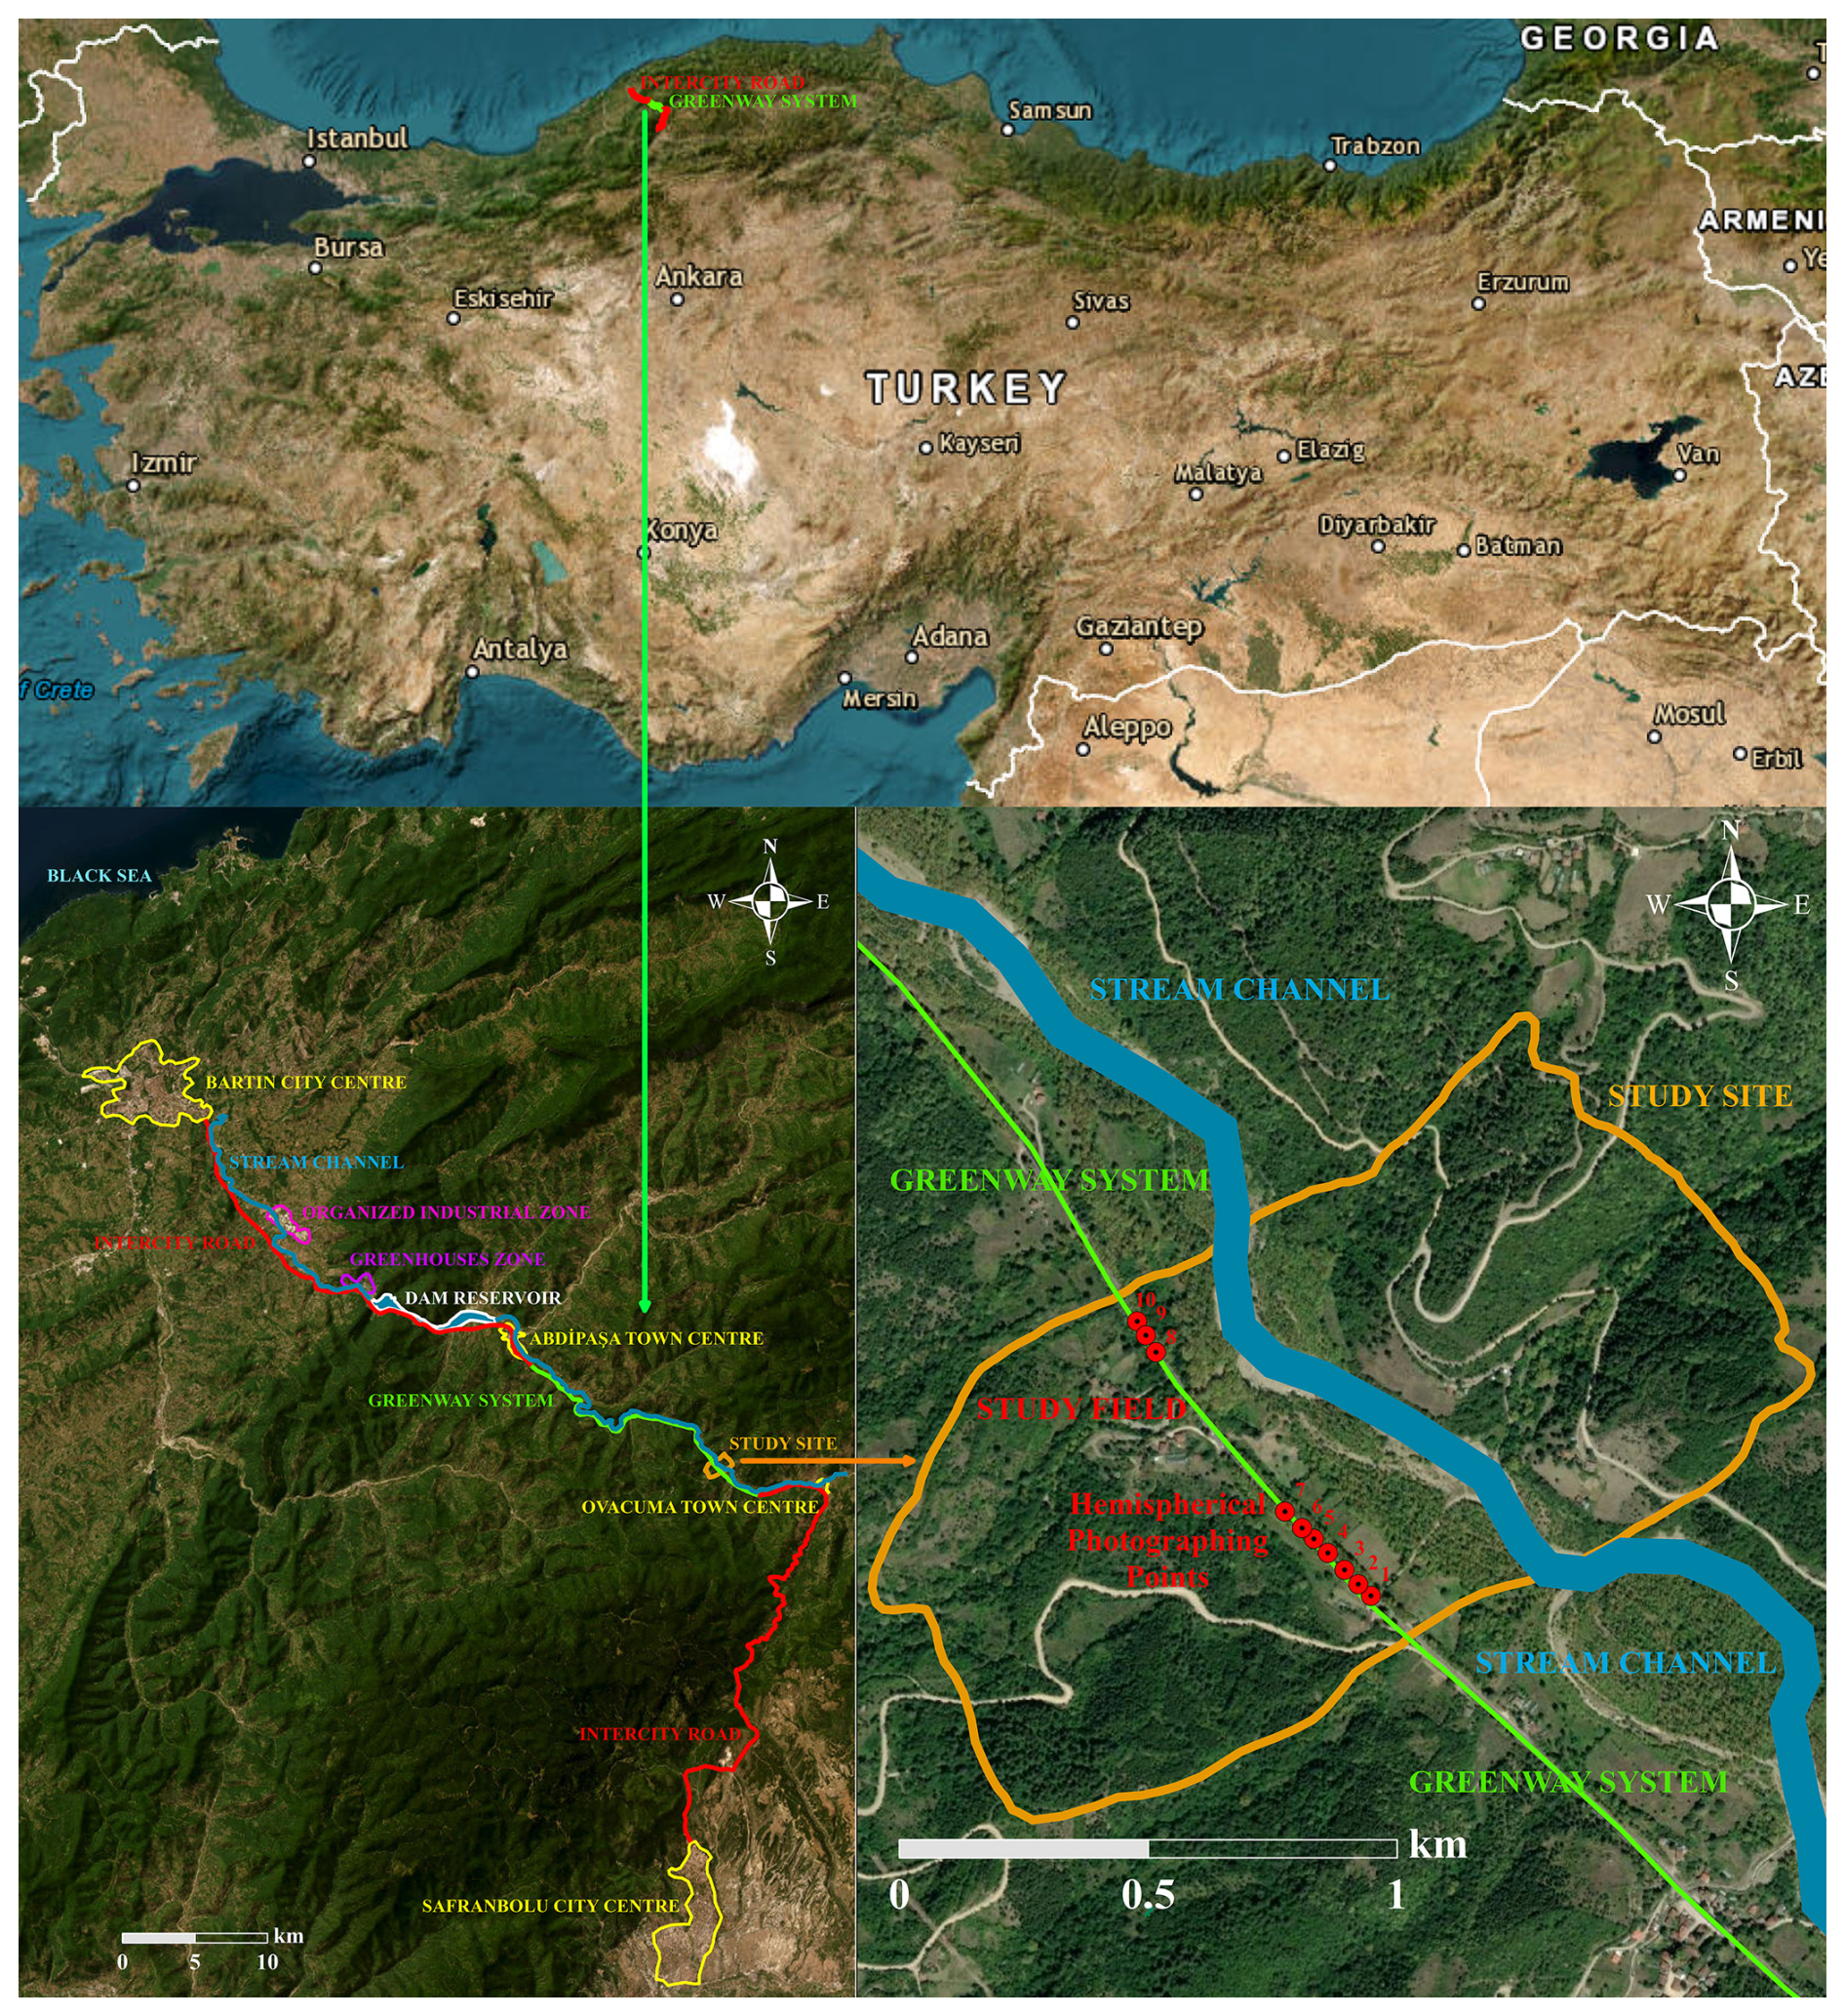
Figure 1Location of the focal study field together with the hemispherical photographing points on the intercity road and overall greenway system within Türkiye. Base maps are derived from ArcMap10.5 (ESRI Inc., 2016).
2.1 Study site characteristics and hemispherical photographing points
The study site is part of the greenway system between the Bartın and Karabük provinces of the western Black Sea region of Türkiye (Fig. 1). The study site is approximately 15 km away from the town of Abdipaşa and about 40 km away from the city of Bartın, both to the northwest, where there are frequent district and village settlements along the road (Fig. 1). On the other side, the study site is approximately 40 km away from the city of Safranbolu, a World Heritage Site (UNESCO, 1994), to the south. It is about 50 km away from the city of Karabük, also to the south, where there are also frequent district and village settlements along the road (Fig. 1). Therefore, the greenway system along this intercity road, which is primarily famous for spectacular tree canopy tunnels, is quite dense in some places. In order to secure the sustainability of this greenway system, road construction and repair works are carried out very sensitively, and hence environmental and ecological monitoring studies are encouraged.
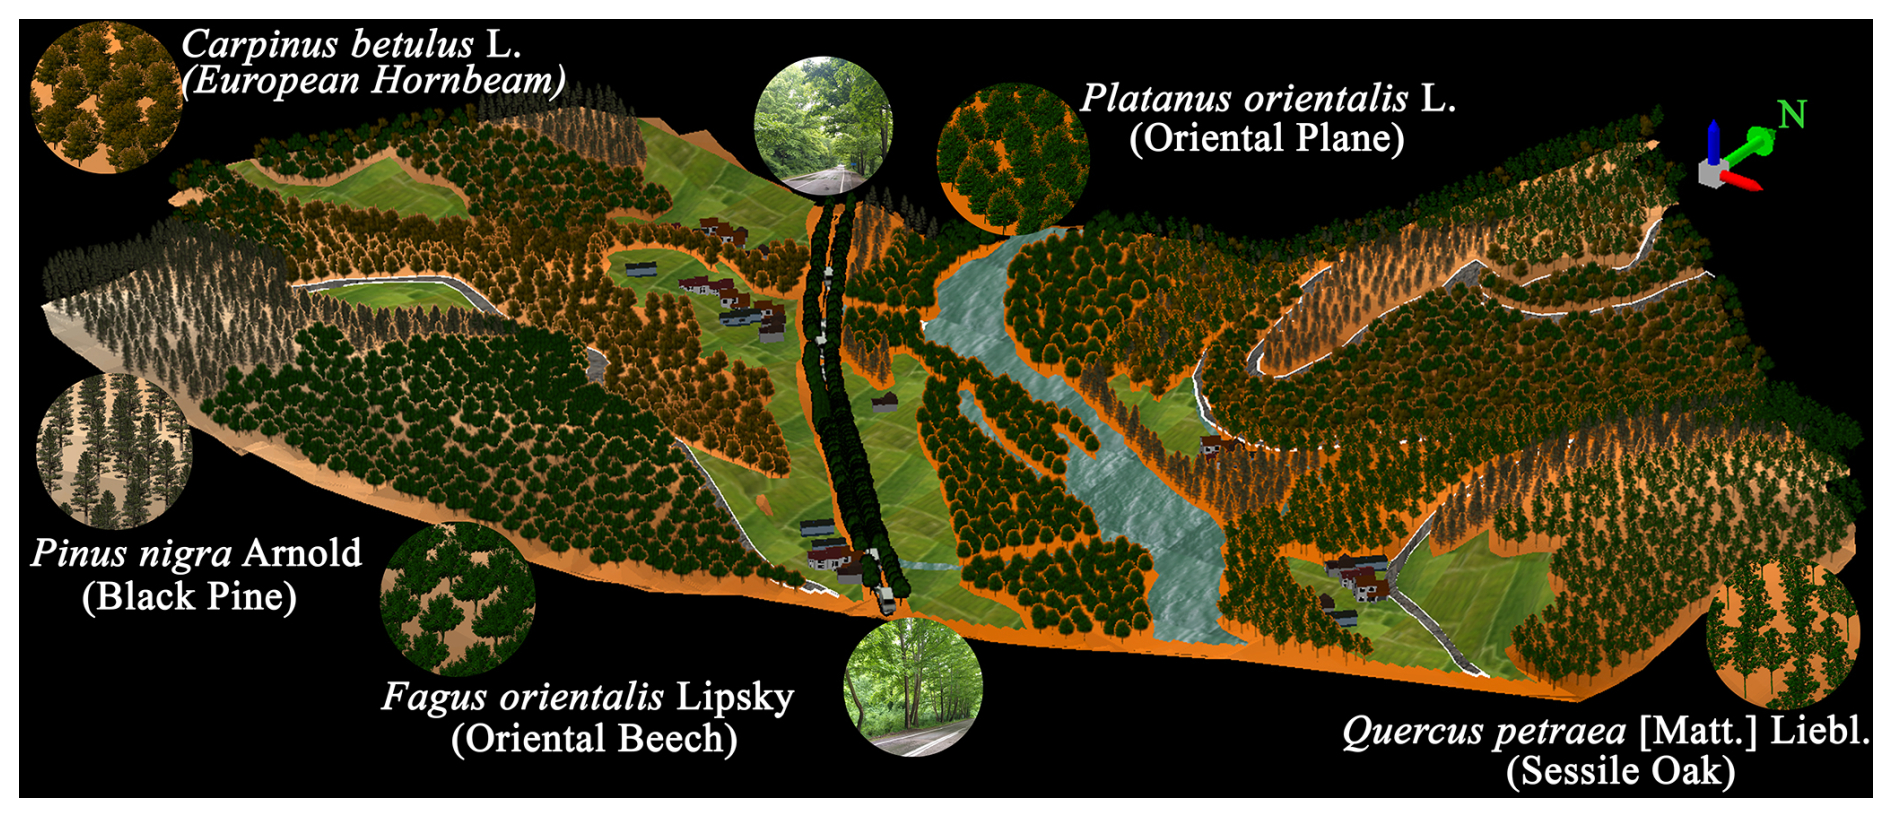
Figure 2Exact scaled 3D simulation and illustration of part of the overall greenway system with the surrounding forest and agricultural landscape, focusing primarily on the study field together with the representative tree species (with their focal images), stream channels, village houses and roads, and intercity road and cars.
The study site consists of 10 hemispherical photographing points at the centre of the two-lane road (a single lane in each direction) beneath the canopies of the Platanus orientalis L. (oriental plane) trees (Fig. 1). Specifically, the study site is located between the 41°27′22′′ N and 41°27′35′′ N latitudes and between the 32°41′1′′ E and 32°41′17′′ E longitudes (Fig. 1). The extent of the part of the road which was chosen as the focal research area is approximately 700 m (Fig. 1), where the average altitude is 290 The intervals between the hemispherical photographing points change between 20 and 300 m, which was ultimately why they were chosen to best represent the differentiation of canopy characteristics within the focal research area (Fig. 1). Forest stands, agricultural fields and fluvial sands constitute the dominant land uses surrounding the hemispherical photographing points on the road within the focal research area (Fig. 1). The forest stands, which are particularly scattered on slopes and the tops of the surrounding hills, are mainly composed of black pines (Pinus nigra Arnold), European hornbeams (Carpinus betulus L.), oriental beeches (Fagus orientalis Lipsky) and sessile oaks (Quercus petraea (Matt.) Liebl.) (TGDF, 2021) (Figs. 1 and 2). On the other hand, some agricultural fields, which are principally at the foot of the hills and in lowlands close to the stream, include a few village houses (Figs. 1 and 2). The altitude of the surrounding hills ranges between 390 and 490 The shallow (20–50 cm) or moderate deep (50–90 cm) grey-brown podzolic soils together with brown forest soils have formed particularly on the slopes and tops of the hills, whereas deep (90+ cm) alluvial soils have been deposited at lowlands close to the stream (TMAF, 2005). However, these soils have been composed and formed on sandstones and mudstones (TGDMRE, 2007). The research region falls within the mesothermal climate regime (Atalay, 2011), with approximately 1180 mm average annual total precipitation and 12.5 °C average annual temperature (TSMS, 2022).
2.2 Meteorological calculation
The data of the six different meteorological stations, which were at 36 (∼ 33 km away to the northwest; Bartın), 134 (∼ 12 km away to the northwest; Ulus), 359 (∼ 5 km away to the east; Ovacuma), 520 (∼ 12 km away to the west; Ceyüpler), 40 (∼ 29 km away to the northeast; Çubukbeli) and 1090 (11 km away to the south; Orman), were referred to during the analyses and determination of the air temperature values for the study field, as suggested by the scientific literature (Barry, 2008) for mesothermal humid regions such as this one (TSMS, 2022). As a matter of fact, initial correlation analyses were conducted between the air temperature data of these meteorological stations. Some of their correlation (r = 0.96; P < 0.01) and regression suggested a lapse rate of 0.5 , as also suggested by Barry (2008) for mesothermal humid regions. Since its air temperature data were more consistent and soil temperature data were also recorded at the station, the temperature data of Bartın Meteorological Station were used during the calculation of the temperature data for the study field (TSMS, 2022). Therefore, the air and soil (−10 cm) temperature data of this meteorological station were modified based on the suggested lapse rate and the altitudinal difference between the meteorological station and the study field. Because of the dense distribution of the oriental plane tree roots within the 0 and 15 cm soil depth (Xie et al., 2020), the soil temperature data belonging to the −10 cm soil depth were referred to. Provided that the 1-week air–soil (−10 cm) temperature data prior to the initial monitoring in early March were included, the modified mean air–soil temperature data were calculated throughout the frequent intervals between each field visit for hemispherical photographing.
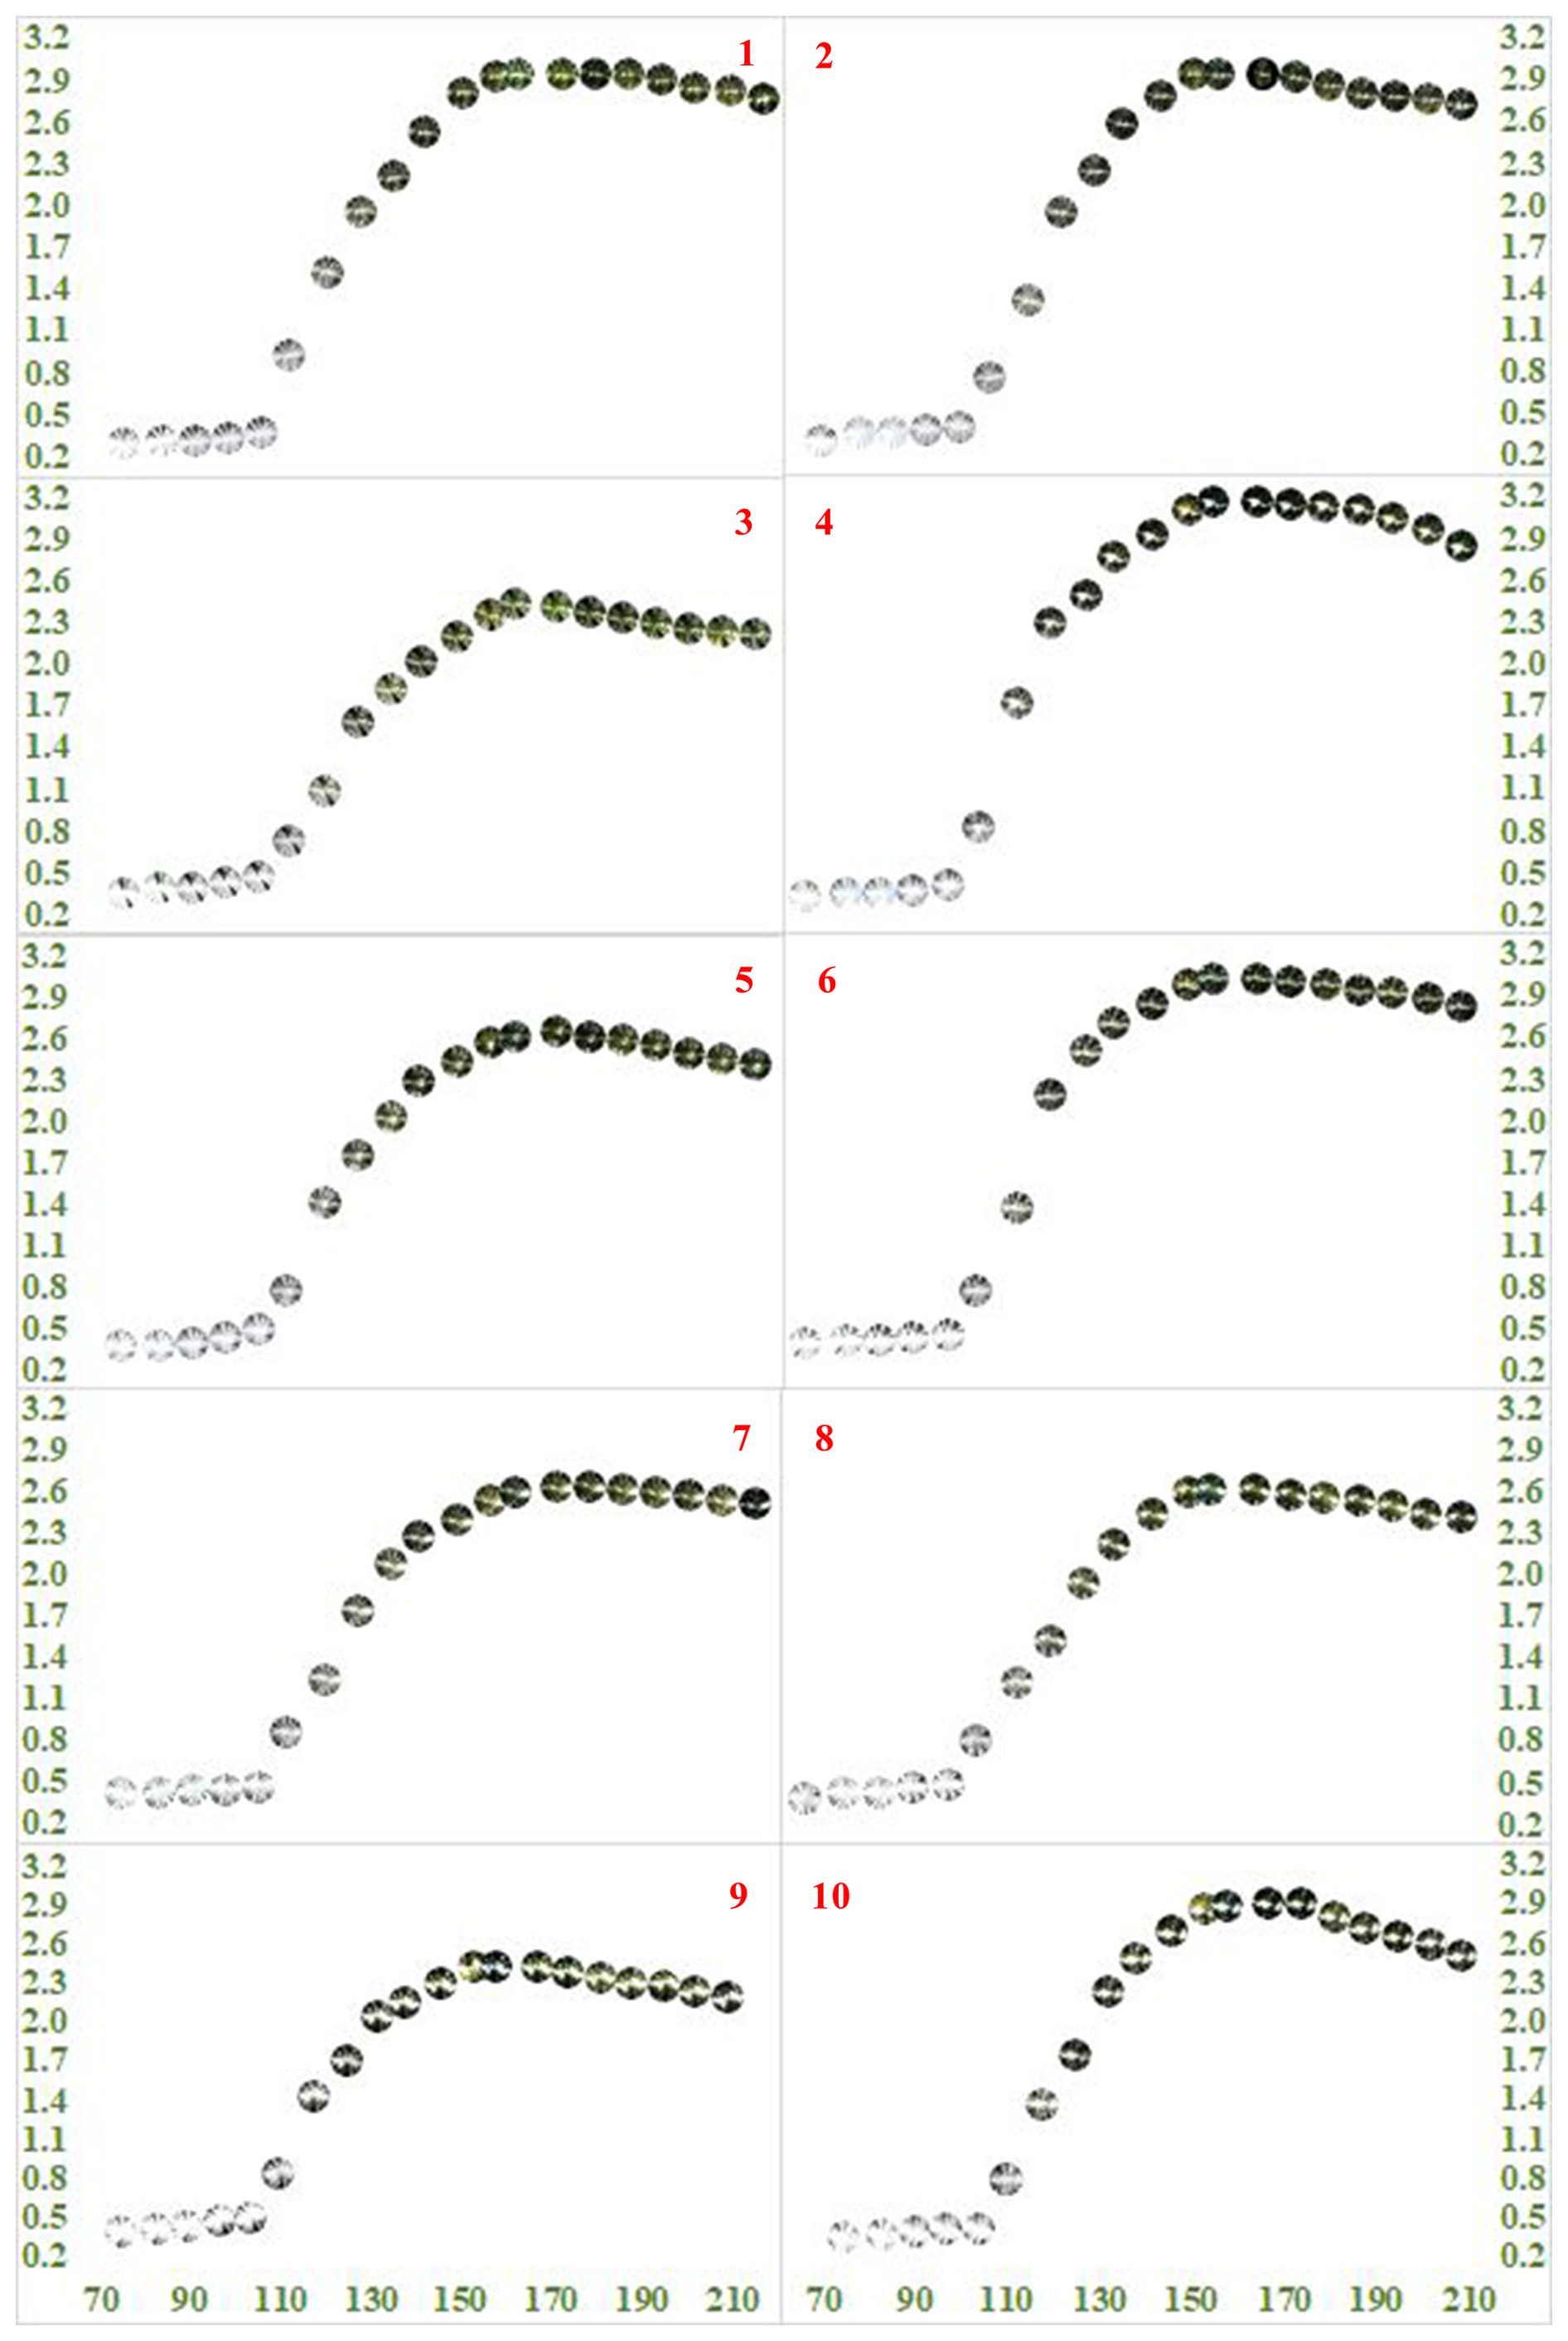
Figure 3LAI values (y axis) of all 10 points against the monitoring days of year (DOYs) in 2023 (x axis) together with their corresponding hemispherical photographs.
2.3 Hemispherical photographing and LAI, height and DBH analyses
The 10 hemispherical photographing points in the middle of the road were chosen in the field and marked (Fig. 1). The hemispherical photographing (180°) of the tree canopies was conducted at these fixed points beneath and was directed towards the canopies above. For this hemispherical photographing perpendicular (90°) to the middle of the road, an 8 mm fisheye objective (Sigma F3.5 EX DG Circular Fisheye – Sigma Corporation) was mounted on a digital camera (Canon EOS 5D SLR digital camera – Canon Inc.). Beginning on the 75th day (mid-March) of the year and going until the 209th day (late July) of the year, 20 field visits were made, during which 200 hemispherical photographs were obtained in total (Fig. 3). In order to analyse the LAI values, the digital images of these 200 hemispherical photographs were processed using the Hemisfer version 3.3 software program (Swiss Federal Institute of Forest, Snow and Landscape Research; Schleppi et al., 2007). The methodology by Thimonier et al. (2010) was principally referred to during the analyses of LAI since it is more compatible for the deciduous trees. For the thresholding, the automatic detection methodology suggested by the study of Nobis and Hunziker (2005) was applied. However, the necessary corrections were made referring to an integrated methodology dependent upon the studies by Schleppi et al. (2007) and Chen and Cihlar (1996). The number of oriental plane trees that are included within the canopy frame of each hemispherical photographing point was recorded. Thereby, when they were fully foliated, the height and DBH of each of these plane trees within those frames were measured and recorded according to their points to which they belonged. The heights of the oriental planes were measured using a Blume-Leiss ALTIMeter model BL6 (Carl Leiss slope and tree height measuring device), whereas their DBHs were measured using a tree calliper.
Statistical correlation analyses between the interim mean air–soil temperature data and the mean LAI values were conducted referring to Pearson correlation and significance tests (Devore and Farnum, 1999) via SPSS software, version 22.0 (SPSS Inc., Chicago, IL). The same correlation and significance tests were also applied for statistical correlation analyses between the point-based mean tree height–DBH values and the point-based maximum LAI values.
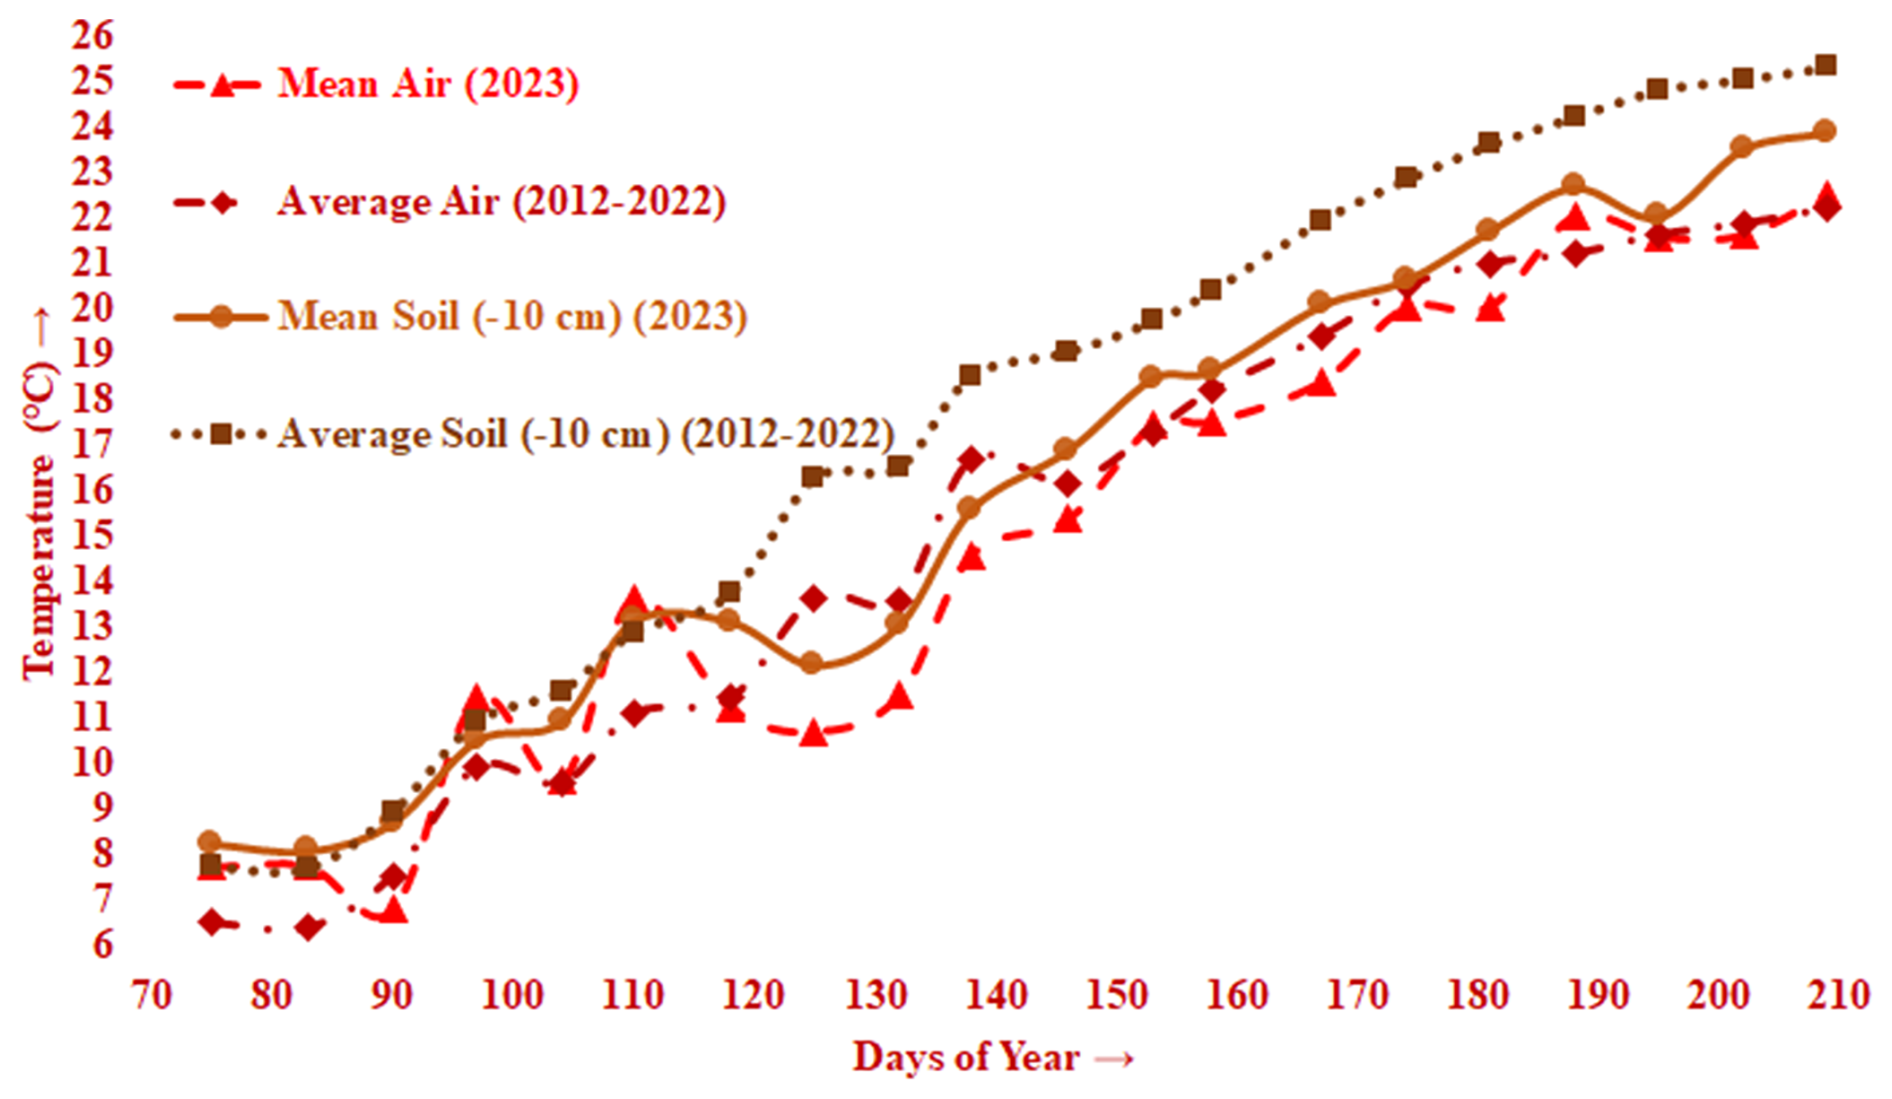
Figure 4Mean air and soil (−10 cm) temperature data (2023) together with average air and soil (−10 cm) temperature data (2012–2022) against the relevant monitoring DOYs.
At the beginning of the monitoring (DOY 75), when the oriental planes were almost leafless, the mean LAI was 0.35 m2 m−2 and ranged between 0.28 m2 m−2 (Point 1) and 0.42 m2 m−2 (Point 7) (Fig. 3). The mean LAI remained almost stable until the end of March (DOY 90), increasing only 0.03 m2 m−2 and ranging between 0.31 m2 m−2 (Point 1) and 0.43 m2 m−2 (Point 7) (Fig. 3). During the 2 weeks between 11 and 24 March (DOY 70 to 83), the mean air and soil temperatures (−10 cm) were 7.8 and 8.2 °C, respectively, yet the mean air temperature dropped to 6.8 °C and the mean soil temperature (−10 cm) increased to 8.7 °C by the end of March (DOY 90) (Fig. 4). The mean air temperature ascended to 11.5 °C and diminished again to 9.7 °C, while the mean soil temperature (−10 cm) ascended first to 10.5 °C and then to 11.0 °C during the following 2 weeks (DOY 90 to 104) (Fig. 4), when the mean LAI increased first to only 0.41 m2 m−2, ranging between 0.33 m2 m−2 (Point 1) and 0.46 m2 m−2 (Point 9), and then to only 0.44 m2 m−2, ranging between 0.36 m2 m−2 (Point 1) and 0.49 m2 m−2 (Point 5) (Fig. 3).
During only 6 d at the beginning of the second half of April (DOY 104 to 110), the mean air and soil temperatures climbed from 9.7 to 13.7 °C and from 11.0 to 13.2 °C, respectively (Fig. 4). These temperatures principally triggered leaf budburst, and the directly associated mean LAI climbed from 0.44 m2 m−2 (ranging between 0.36 m2 m−2 for Point 1 and 0.49 m2 m−2 for Point 5) to 0.80 m2 m−2 (ranging between 0.72 m2 m−2 for Point 3 and 0.92 m2 m−2 for Point 1) (Fig. 3). Although during the following 3 weeks until the 12 May (DOY 110 to 132), the mean air temperatures dropped from 13.7 to 11.3 °C and then to 10.7 °C and then fluctuated slightly at 11.5 °C, it did not do much to affect the soil (−10 cm) temperatures (∼ 12.8 °C) (Fig. 4) and the increasing trend of the mean LAI from 0.80 m2 m−2 (0.72 m2 m−2 for Point 3 to 0.92 m2 m−2 for Point 1) to 1.36 m2 m−2 (1.07 m2 m−2 for Point 3 to 1.51 m2 m−2 for Point 1) to 1.83 m2 m−2 (1.58 m2 m−2 for Point 2 to 2.28 m2 m−2 for Point 4) to 2.15 m2 m−2 (1.81 m2 m−2 for Point 3 to 2.50 m2 m−2 for Point 6). This situation indicated the period of the occurrence, flushing, and to some extent expansion of the oriental plane leaves (Fig. 3). The increment in the number and size of the oriental plane leaves proceeded during the following 3 weeks until early June (DOY 132 to 153), during which the mean air and soil (−10 cm) temperatures increased from 11.5 to 17.5 °C and from 13.1 to 18.5 °C, respectively (Fig. 4). All these increments led the mean LAI to rise from 2.15 to 2.72 m2 m−2 (2.35 m2 m−2 for Point 3 to 3.10 m2 m−2 for Point 4) by 2 June (DOY 153), when the stationary period for the oriental plane leaves had started (Fig. 3).
During the stationary period, principally beginning in early June (DOY 153) and approximately lasting until at least late July (DOY 209), the maximum value of 2.76 m2 m−2 for the mean LAI (ranging between 2.41 m2 m−2 for Point 3 and 3.16 m2 m−2 for Point 4) was achieved (DOY 158–167), and then it gradually diminished to 2.54 m2 m−2 (ranging between 2.20 m2 m−2 for Point 3 and 2.84 m2 m−2 for Point 4) (Fig. 3). However, both the mean air and the mean soil (−10 cm) temperatures gradually continued to increase from 17.6 to 22.5 °C and from 18.7 to 23.9 °C, respectively (DOY 158 to 209) (Fig. 4). Thus, even though both the mean air and the mean soil (−10 cm) temperatures had apparent influences on the periodical course of the LAIs until they reached their maximum values, the instant decrease in the LAIs for a certain period afterwards could not immediately and solely be attributed to the course of the temperatures during that period.
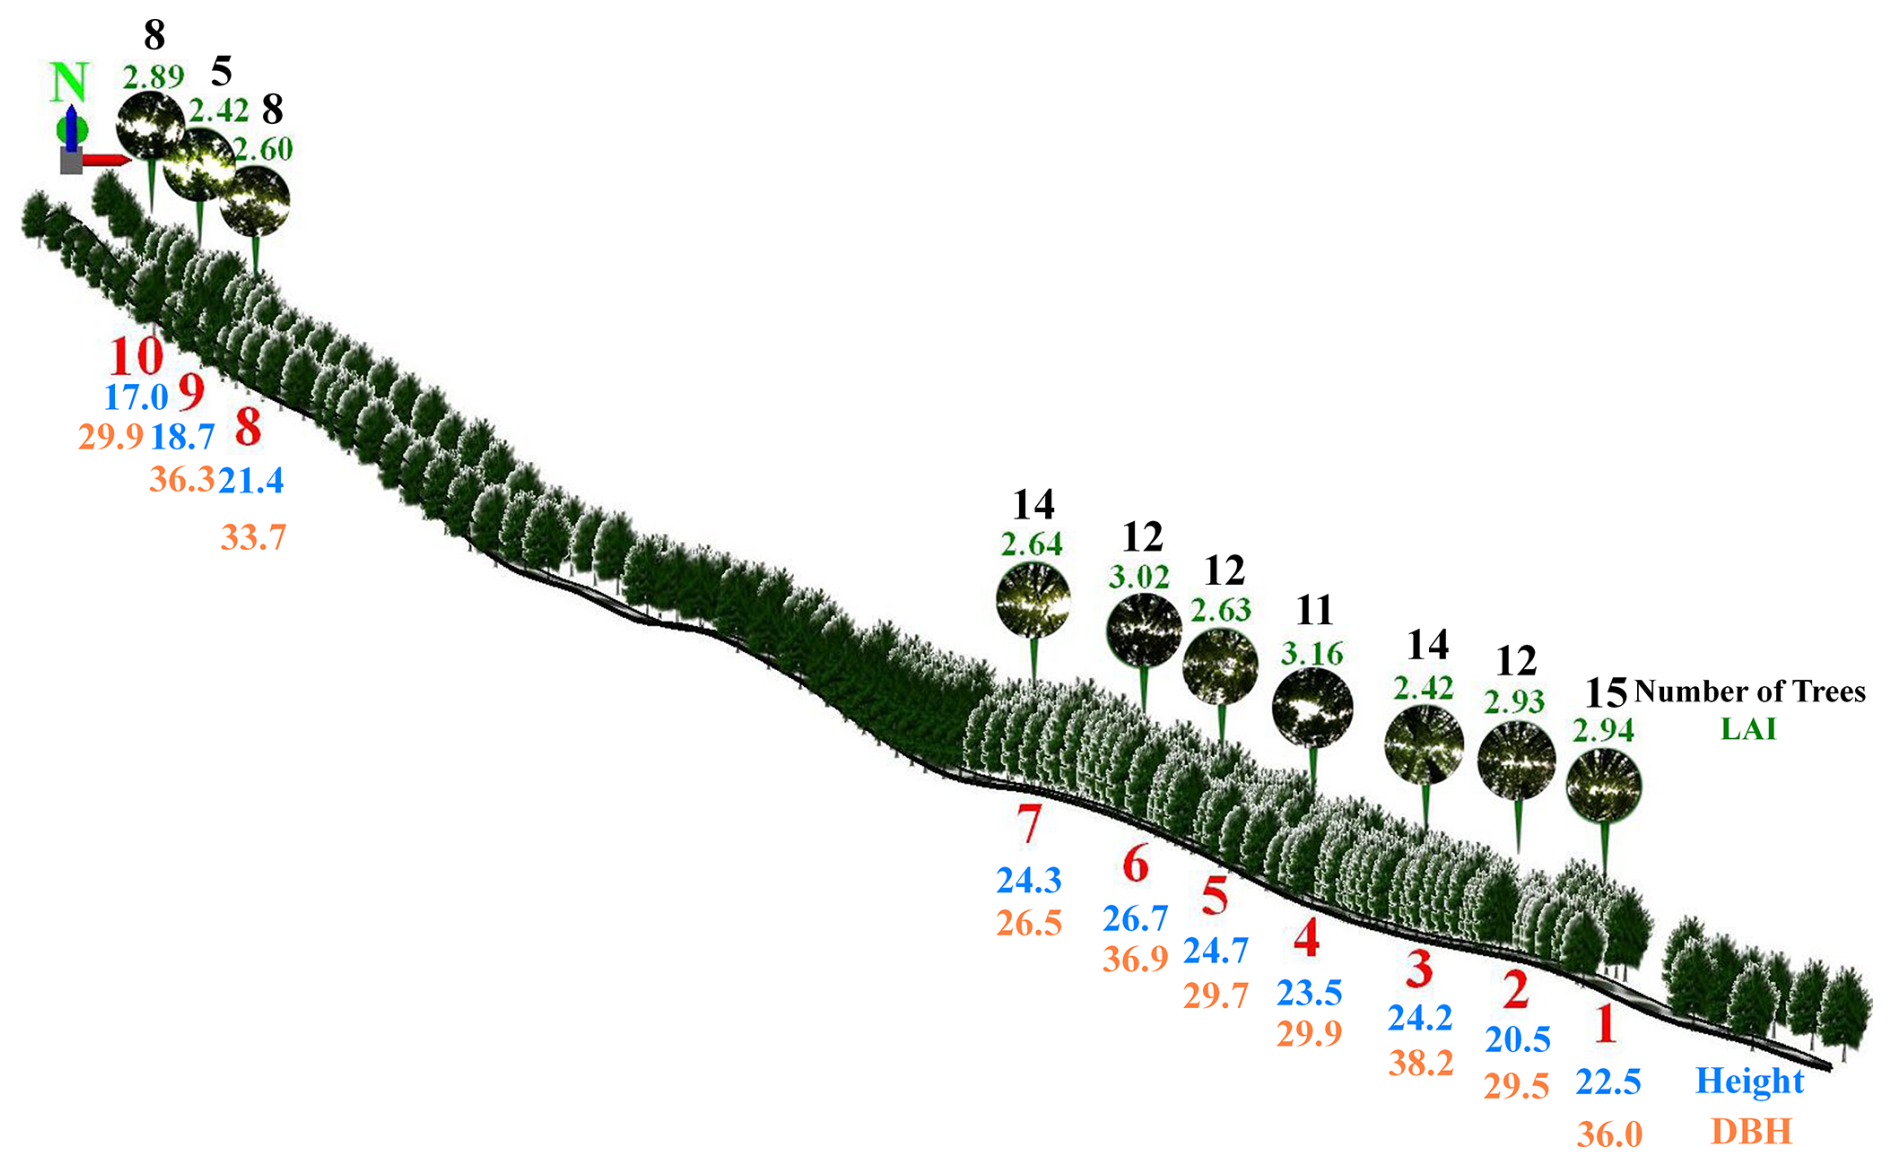
Figure 5An exact scaled 3D simulation and illustration of the study field oriental plane trees at the 10 points together with their dense-canopy hemispherical photographs. Also included is the number of trees within the canopy frame of each point, the average height (m) and DBH (cm) of those trees, and the maximum LAI values of each of those 10 canopies.
Comparing the maximum values of LAI (m2 m−2) for each point, the order of the points was 4 (3.16), 6 (3.02), 1 (2.94), 2 (2.93), 10 (2.89), 7 (2.64), 5 (2.63), 8 (2.60), and 3 and 9 (both 2.42), ranking from the highest to the lowest. On the other hand, that order was 6 (26.7; 23.5–31.0), 5 (24.7; 17.5–28.5), 7 (24.3; 19.5–28.0), 3 (24.2; 19.5–27.5), 4 (23.5; 17.5–29.0), 1 (22.5; 19.5–26.0), 8 (21.4; 18.5–24.5), 2 (20.5; 13.0–26.0), 9 (18.7; 16.0–21.0) and 10 (17.0; 14.5–20.3) for the mean height (in m; format: mean; minimum–maximum) of the trees (Fig. 5). In addition, for the mean DBH (in cm; format: mean; minimum–maximum) of the trees, the order was 3 (38.2; 18.5–57.0), 6 (36.9; 18.0–64.1), 9 (36.3; 23.0–48.7), 1 (36.0; 26.6–49.3), 8 (33.7; 12.0–52.4), 4 (29.9; 12.8–36.0), 10 (29.9; 15.7–46.7), 5 (29.7; 10.7–47.2), 2 (29.5; 14.8–49.8) and 7 (26.5; 7.3–40.3) (Fig. 5). In fact, the point-based ranking compatibility of the maximum LAI values was valid neither with the mean (also the minimum–maximum) height nor with the mean (also the minimum–maximum) DBH of the trees (Fig. 5). This situation indicates that the maximum LAI values were not directly related either to the height or to the DBH of the trees within the canopy frame of each point. Furthermore, that ranking was 1 (15); 3 and 7 (14); 2, 5 and 6 (12); 4 (11); 8 and 10 (8); and 9 (5) for the number of trees within the canopy frames of the relevant points (Fig. 5). Therefore, it can be deduced that the maximum LAI values did not coincide with these numbers of trees, revealing their unremarkable influence on those maximum LAI values (Fig. 5).
After the initial monitoring (DOY 75) of LAI, the leafless status of the oriental planes remained for an approximately 1-month period, during which a total of five hemispherical photographing visits to the study field were made. During this 1-month period, when their leaf buds had swollen but not burst until at least mid-April (DOY 104), the increment of the mean LAI could not even reach 0.1 m2 m−2 (Fig. 3). In their relatively recent study, Sadeghi et al. (2018) monitored the same species, Platanus orientalis L. trees, for 3 years, during which the trees' leafless period ended approximately in late March (second half of March), which was about 1 month earlier than in our study. Although in that study that altitude of the site was 1000 m higher than our site, the latitudinal and longitudinal differences and associated temperature differences with our study (the average annual temperature was 4.6 °C higher than ours) basically led to the 1-month phenological earliness for the same tree species (Platanus orientalis L.). However, in our study, during the 35 d before mid-April (DOY 70 to 104), the mean air temperature was 8.7 °C and widely ranged between 0.4 and 15.4 °C (Fig. 4).
Essential transformation actually occurred with the budburst of the oriental plane leaves during the following 6 d in mid-April (DOY 104 to 110), which resulted in the latest mean LAI, which almost doubled in this time (Fig. 3). Conformably, in their study within a western European deciduous forest composed of mature sessile oaks and understorey European hornbeams, Soudani et al. (2021) indicated approximately the same dates as ours for the budburst of their leaves, which also led to their mean LAI likewise doubling. During this 6 d period, the mean air and soil (−10 cm) temperatures suddenly increased by 4.0 and by 2.4 °C, respectively (Fig. 4). Then, until mid-May (DOY 110 to 138), this led to the onset of the flushing of fresh leaves and the associated approximately 3-fold increment of the mean LAI (from 0.80 to 2.39 m2 m−2) (Fig. 3). For a temperate deciduous forest, mainly composed of sugar maples and North American beeches, in Ontario, Canada, Croft et al. (2014) determined mid-May for the initiation of the LAI increment following budburst and early June for the maximum LAI values. Even though sharing almost exactly the same average annual precipitation (1050 mm) as our study, an average annual air temperature difference of 7.5 °C (theirs 5 °C, ours 12.5 °C) could have led to that 1-month delay for the initiation of LAI increment compared to our study. During that almost 1-month period (DOY 110 to 138), the mean air and soil (−10 cm) temperatures continued to climb by 1.0 and by 2.5 °C, respectively (Fig. 4). On the other hand, Zolles et al. (2021) detected almost the same dates (around DOY 108) as our study for the leaf unfolding of European beech trees within a stand of deciduous forests at similar altitudes in central Europe.
Furthermore, during the almost 3 weeks that followed until early June (DOY 138 to 158), the mean air temperature ascended by 2.9 °C, whereas the soil temperature ascended by 3.1 °C (Fig. 4). This situation emphasizes the essential role of the soil temperature both in the phenological processes and in the canopy LAI of the oriental plane trees. In their modelling study, Klinek et al. (2023) suggested that a model based on soil–air temperature could be used to predict the initiation of seasonal phenology of deciduous forests. As a matter of fact, in our study, high and significant positive correlations between the mean soil temperatures and the mean LAI values were valid throughout both the leaf budburst development period (DOY 104 to 158; r = 0.84, P < 0.01) and the entire monitoring period (DOY 70 to 209; r = 0.89, P < 0.01) (see also Figs. 3 and 4). Although not as much as for soil temperature, high and significant positive correlations were also valid between the mean air temperatures and the mean LAI values throughout both the leaf budburst development period (DOY 104 to 158; r = 0.75, P < 0.03) and the entire monitoring periods (DOY 70 to 209; r = 0.85, P < 0.01) (see also Figs. 3 and 4). Similarly, within a relatively close study area, Öztürk et al. (2015) revealed soil temperature's, rather than the air temperature's, influence on and significance for LAI during the leaf budburst development period for an urban forest patch composed of European hornbeams. The development of leaves in size and number continued throughout the following 3 weeks (DOY 138 to 158), when the mean LAI increased by 0.37 m2 m−2, reaching 2.76 m2 m−2, the maximum, and remaining constant at this value for at least 10 more days (until mid-June; DOY 167) (Fig. 3).
Point-based correlation analysis between the maximum LAI values and the mean height of the trees, which are included within the canopy frame of the relevant points, showed the inexistence of pronounced correlation (DOY 158 and 167; r = 0.12, P = 0.739) between them (see also Fig. 5). However, for an urban forest in India, Behera et al. (2022) demonstrated high and significant correlation (r = 0.95, P < 0.01) between LAI and tree height. Besides, in our study, the correlation between the maximum LAI values and the mean DBH of those trees was also not valid (DOY 158 and 167; r = −0.27, P = 0.457) (see also Fig. 5). Cai et al. (2022) monitored the canopy structures of the roadside trees also including the same oriental planes in summer and determined relatively weak and insignificant correlation (r = −0.20, P > 0.05) between the summer LAI values and the DBH of the urban trees. On the other hand, in their relatively recent study for the Ginkgo biloba and Platanus orientalis trees in parks and roadsides of Beijing, China, Cui et al. (2022) correlated both LA (leaf area) and SLA (specific leaf area) with both H (height) and DBH (diameter at breast height). They found significant positive correlations between LA and both H (r = 0.83, 0.54; P < 0.01) and DBH (r = 0.63, 0.65; P < 0.001) for both the oriental planes and the gingkos, whereas the correlations between SLA and both H (r = 0.27, 0.20; P < 0.05) and DBH (r = 0.35, 0.23; P < 0.05) were relatively weak and insignificant for both the oriental planes and the gingkos.
In our study, due to the lack of significant correlation between the point-based maximum LAI values and the primary physiological parameters of trees, height and DBH, a possible cause of these maximum LAI values could be associated with the number of trees within the canopy frame of each point. According to the study by Klingberg et al. (2017), a mean effective LAI based on remote sensing data was correlated with both the canopy cover and the total tree volume. However, in our study, the number of trees that are included within the canopy frame of relevant points was not directly correlated (r = 0.24, P = 0.504) with their maximum LAI values (see also Fig. 5). Beyond and rather than the individual effects of those physiological and quantitative factors, their combined effects together with some other possible ecological and environmental factors affected the point-based maximum LAI values of these tree canopies. Nevertheless, the difference between the two extreme values of the point-based maximum LAI was relatively narrow (± 0.74) (see also Fig. 5).
After achieving maximum values (DOY 167 to 209), a gradual yet slight decrease in LAI in terms of both the point-based and the mean values (Fig. 3) was probably due to some other factors rather than the air–soil temperature. Hence, the mean air–soil temperature values continued to increase gradually until the end of July 2023 (Fig. 4). These probable factors may have involved a shortage of soil moisture due to lack of adequate precipitation and windblown leaves. However, the same situation was valid for another study on oriental plane trees at another section of the same greenway system about 11 years ago (2012), which also indicated a gradual decrease in the mean and point-based LAI values after late June, although the mean air temperature similarly continued to increase until the end of July (Öztürk, 2016).
Although minor differences amongst the LAI values occurred on a point basis for each of the field visit days, the mean LAI values showed significant high correlations with the mean temperature data, particularly with the soil temperatures throughout the monitoring period of approximately 4.5 months. This effect of the soil temperature on the oriental plane phenology and on the overall, seasonal and periodical course of the mean LAI values reveals the significance of possible warming, which may occur for several reasons such as prospective climate warming phenomena, resurfacing practices and associated new road asphalt and roadside pavements, heat from wheels, and the exhaust gases of an increasing number of vehicles. These threatening possible situations may indicate potentially alarming early budburst dates and the associated possible advance of the tree foliation period, which then may lead to the physiological growth of the trees due to their extended period of photosynthesis. However, in this study, high and significant correlation was not valid between the height and DBH on the one hand and maximum LAI values of those oriental planes along a greenway system on the other hand.
The consequences of this study reveal the importance of monitoring the foliation course of the tree LAI parameter, which can be a significant indicator, particularly of canopy closure, shading, safety and associated recreation on the road and roadside in the outstanding greenway system. Besides, proving the essential role of air–soil temperature in that LAI course suggests, in reverse, the significance of the road and roadside for those alley trees and their canopies. Therefore, this study emphasizes how important sustainability is for the region's most valuable greenway system and implies what the necessary conditions for this sustainability and protection might be. In fact, this relatively old but splendid urban–rural greenway system with a spectacular surrounding forest landscape is under possible threat of becoming a past relic following alteration or of being completely suppressed after the introduction of a new highway construction campaign within the region.
Data sets are available upon request.
All the authors contributed to the study conception and design. Additionally, they all conducted the fieldwork and monitoring processes and performed the parameter and statistical analyses. The data tabulating, graphics and 3D modelling were performed by MÖ. The ultimate writing process was completed by MÖ, TB and RK.
The contact author has declared that none of the authors has any competing interests.
Publisher's note: Copernicus Publications remains neutral with regard to jurisdictional claims made in the text, published maps, institutional affiliations, or any other geographical representation in this paper. While Copernicus Publications makes every effort to include appropriate place names, the final responsibility lies with the authors.
Part of the data of this study are from the report of the project “Monitoring Some Canopy Parameters of Trees Throughout Their Phenological Periods Along a Greenway System Within the Forest Landscape: Greenway System Between The Bartın and Karabük Provinces” submitted to TUBİTAK (the Scientific and Technological Research Council of Türkiye) and accepted under grant number 2209-A-1919B012223881. Thus, the authors of this study owe TUBİTAK a debt of gratitude for all its financial support and encouragement. Besides, forest engineers Hasan Güneş, Serkan Bulut and Metehan Ayvaz are gratefully acknowledged for their complementary support during the fieldwork of this study. In addition, we would like to credit the Turkish State Meteorological Service, which provided the meteorological data, and Turkish General Directorate of Forestry, which shared forest management plans and maps with us. Above all, we would like to acknowledge Bartın University, which continuously encouraged our studies with financial and moral support.
Part of this study was supported by Türkiye Bilimsel ve Teknolojik Araştırma Kurumu (TUBİTAK, the Scientific and Technological Research Council of Türkiye) via grant number 2209-A-1919B012223881. One of the authors, Rıdvan Koruyan, received that research support from TUBİTAK.
This paper was edited by Anja Rammig and reviewed by Abdurrahim Aydin and Yasin Dönmez.
Anşin, R. and Özkan, Z. C.: Seed Plants (Spermatophyte), Ligneous Taxon, Karadeniz Technical University, Faculty of Forestry Press, Trabzon, Turkey, 1997 (in Turkish).
Atalay, İ.: Climate Atlas of Turkey, İnkılâp Bookstore Press, İstanbul, Turkey, p. 136, ISBN: 9789751031877, 2011 (in Turkish).
Barry, R. G.: Mountain Weather and Climate, third edition, Cambridge University Press, New York, USA, ISBN-10: 0521681588, ISBN-13: 978-0521681582, 2008.
Behera, S. K., Mishra, S., Sahu, N., Manika, N., Singh, S. N., Anto, S., Kumar, R., Husain, R., Verma, A. K., and Pandey, N.: Assessment of carbon sequestration potential of tropical tree species for urban forestry in India, Ecol. Eng., 181, 106692, https://doi.org/10.1016/j.ecoleng.2022.106692, 2022.
Blanchard, E., Birnbaum, P., Ibanez, T., Boutreux, T., Antin, C., Ploton, P., Vincent, G., Pouteau, R., Vandrot, H., Hequet, V., Barbier, N., Droissart, V., Sonké, B., Texier, N., Kamdem, N. G., Zebaze, D., Libalah, M., and Couteron, P.: Contrasted allometries between stem diameter, crown area, and tree height in five tropical biogeographic areas, Trees-Struct. Funct., 30, 1953–1968, https://doi.org/10.1007/s00468-016-1424-3, 2016.
Bonan, G.: Ecological Climatology: Concepts and Applications, third edition, Cambridge University Press, New York, USA, 692 p., ISBN-10: 110761905X, ISBN-13: 978-1107619050, 2016.
Boyd, P., Byles, M., Cheifetz, A., Chisholm, J., Copland, A., Double, C., Frances, P., Gavira, A., Hammond, R., O’Hanlon, M., Hawthorne, L., Paxton, S., Riley, L., Stewart-Jones, H., Weeks, J., Whitehorn, T., Widdicombe, S., and Wild, F.: The A–Z plant directory, Dorling Kindersley, London, UK, 1996.
Burrows, S. N., Gower, S. T., Clayton, M. K., Mackay, D. S., Ahl, D. E., Norman, J. M., and Diak, G.: Application of geostatistics to characterize leaf area index (LAI) from flux tower to landscape scales using a cyclic sampling design, Ecosystems, 5, 667–679, https://doi.org/10.1007/s10021-002-0110-z, 2002.
Cai, Y., Li, C., Ye, L., Xiao, L., Gao, X., Mo, L., Du, H., Zhou, Y., and Zhou, G.: Effect of the roadside tree canopy structure and the surrounding on the daytime urban air temperature in summer, Agr. Forest Meteorol., 316, 108850, https://doi.org/10.1016/j.agrformet.2022.108850, 2022.
Chen, J. M. and Cihlar, J.: Retrieving leaf area index of boreal conifer forests using Landsat TM images, Remote Sen. Environ., 55, 153–162, https://doi.org/10.1016/0034-4257(95)00195-6, 1996.
Çepel, N.: Landscape Ecology, İstanbul University, Faculty of Forestry Press, İstanbul, Turkey, ISBN: 975-404-371-X, 1994 (in Turkish).
Côté, J-F., Fournier, R. A., Frazer, G. W., and Niemann, K. O.: A fine-scale architectural model of trees to enhance LiDAR-derived measurements of forest canopy structure, Agr. Forest Meteorol., 166–167, 72–85, https://doi.org/10.1016/j.agrformet.2012.06.007, 2012.
Croft, H., Chen, J. M., and Zhang, Y.: Temporal disparity in leaf chlorophyll content and leaf area index across a growing season in a temperate deciduous forest, Int. J. Appl. Earth Obs., 33, 312–320, https://doi.org/10.1016/j.jag.2014.06.005, 2014.
Cui, B., Wang, X., Su, Y., Gong, C., Zhang, D., Ouyang, Z., and Wang, X.: Responses of tree growth, leaf area and physiology to pavement in Ginkgo biloba and Platanus orientalis, Front. Plant. Sci., 13, 1003266, https://doi.org/10.3389/fpls.2022.1003266, 2022.
Davis, P. H.: Flora of Turkey and the Aegean Islands. Volume VII, Edinburgh University Press, Edinburgh, UK, ISBN-10: 0852243960, ISBN-13: 978-0852243961, 1982.
Devore, J. and Farnum, N.: Applied Statistics for Engineers and Scientists, first edition, Duxbury Press, USA, ISBN-10: 053435601X, ISBN-13: 9780534356019, 1999.
ESRI Inc.: ArcGIS 10.5, What is new in ArcGIS 10.5, ESRI Publications, Redlands, California, USA, 2016.
Forman, R. T. T. and Alexander, L. E.: Roads and their major ecological effects, Annu. Rev. Ecol. Syst., 29, 207–231 + C2, http://www.jstor.org/stable/221707 (last access: 14 June 2024), 1998.
García-Pardo, K. A., Moreno-Rangel, D., Domínguez-Amarillo, S., and García-Chávez, J. R.: Remote sensing for the assessment of ecosystem services provided by urban vegetation: A review of the methods applied, Urban For. Urban Gree., 74, 127636, https://doi.org/10.1016/j.ufug.2022.127636, 2022.
Granero-Belinchon, C., Adeline, K., Lemonsu, A., and Briottet, X.: Phenological dynamics characterization of alignment trees with Sentinel-2 imagery: A vegetation indices time series reconstruction methodology adapted to urban areas, Remote Sens.-Basel, 12, 639, https://doi.org/10.3390/rs12040639, 2020.
Johns, C. A.: The Forest Trees of Britain. Volume II, (This edition first published 1849), Cambridge University Press, Cambridge, UK, ISBN-10: 1108069150, ISBN-13: 978-1108069151, 2014.
Klinek, L., Au, J., Wong, C. Y. S., Magney, T. S., and Baldocchi, D.: A soil-air temperature model to determine the start of season phenology of deciduous forests, Agr. Forest Meteorol., 341, 109638, https://doi.org/10.1016/j.agrformet.2023.109638, 2023.
Klingberg, J., Konarska, J., Lindberg, F., Johansson, L., and Thorsson, S.: Mapping leaf area of urban greenery using aerial LiDAR and ground-based measurements in Gothenburg, Sweden, Urban For. Urban Gree., 26, 31–40, https://doi.org/10.1016/j.ufug.2017.05.011, 2017.
Konijnendijk, C. C.: The Forest and the City; The Cultural Landscape of Urban Woodland, first edition, Springer Science + Business Media B. V., https://doi.org/10.1007/978-3-319-75076-7, 2008.
Landsberg, J. J. and Sands, P.: Physiological Ecology of Forest Production: Principles, Processes and Models, vol. 4, Elsevier Academic Press, USA, 331 p., Paperback ISBN: 9780128102060, Hardback ISBN: 9780123744609, eBook ISBN: 9780080922546, 2011.
Neyns, R. and Canters, F.: Mapping of urban vegetation with high-resolution remote sensing: A review, Remote Sens.-Basel, 14, 1031, https://doi.org/10.3390/rs14041031, 2022.
Nobis, M. and Hunziker, U.: Automatic thresholding for hemispherical canopy-photographs based on edge detection, Agr. Forest Meteorol., 128, 243–250, https://doi.org/10.1016/j.agrformet.2004.10.002, 2005.
Öztürk, M.: Complete intra-annual cycle of leaf area index in a Platanus orientalis L. stand, Plant Biosyst., 150, 1296–1305, https://doi.org/10.1080/11263504.2015.1054446, 2016.
Öztürk, M., Bolat, İ., and Ergün, A.: Influence of air–soil temperature on leaf expansion and LAI of Carpinus betulus trees in a temperate urban forest patch, Agr. Forest Meteorol., 200, 185–191, https://doi.org/10.1016/j.agrformet.2014.09.014, 2015.
Pretzsch, H.: Forest Dynamics, Growth and Yield, first edition, Springer-Verlag, Berlin Heidelberg, Germany, 664 p., https://doi.org/10.1007/978-3-540-88307-4_1, 2009.
Pu, R.: Mapping tree species using advanced remote sensing technologies: A state-of-the-art review and perspective, J. Remote Sens., 9812624, 1–26, https://doi.org/10.34133/2021/9812624, 2021.
Rahman, M. A., Armson, D., and Ennos, A. R.: A comparison of the growth and cooling effectiveness of five commonly planted urban tree species, Urban Ecosyst., 18, 371–389, https://doi.org/10.1007/s11252-014-0407-7, 2015.
Saatçioğlu, F.: Silviculture I; Biological Fundamentals and Principles of Silviculture, second edition, İstanbul University, Faculty of Forestry Press, İstanbul, Turkey, 1976 (in Turkish).
Sadeghi, S. M. M., Van Stan, J. T., Pypker, T. G., Tamjidi, J., Friesen, J., and Farahnaklangroudi, M.: Importance of transitional leaf states in canopy rainfall partitioning dynamics, Eur. J. For. Res., 137, 121–130, https://doi.org/10.1007/s10342-017-1098-4, 2018.
Schleppi, P., Conedera, M., Sedivy, I., and Thimonier, A.: Correcting non-linearity and slope effects in the estimation of the leaf area index of forests from hemispherical photographs, Agr. Forest Meteorol., 144, 236–242, https://doi.org/10.1016/j.agrformet.2007.02.004, 2007.
Soudani, K., Delpierre, N., Berveiller, D., Hmimina, G., Pontailler, J.-Y., Seureau, L., Vincent, G., and Dufrêne, É.: A survey of proximal methods for monitoring leaf phenology in temperate deciduous forests, Biogeosciences, 18, 3391–3408, https://doi.org/10.5194/bg-18-3391-2021, 2021.
TGDF: Forest Management Plans (2006 and 2021) of Karakışla-Ovacuma Sub-District of Bartın Forestry Administration affiliated to the Zonguldak Regional Forest Directorate, Turkish General Directorate of Forestry, Ankara, Türkiye, 2021.
TGDMRE: Digital Geological Maps of Zonguldak E-29 Section, Turkish General Directorate of Mineral Research and Exploration, Ankara, Türkiye, 2007.
Thimonier, A., Sedivy, I., and Schleppi, P.: Estimating leaf area index in different types of mature forest stands in Switzerland: a comparison of methods, Eur. J. For. Res., 129, 543–562, https://doi.org/10.1007/s10342-009-0353-8, 2010.
TMAF: Digital Soil Maps of Bartın Stream Watershed, Turkish Ministry of Agriculture and Forestry, Ankara, Türkiye, 2005.
TSMS: Meteorological Data of Bartın (Turkey) Meteorology Station, Turkish State Meteorological Service, Türkiye, 2022.
Turner, M. G. and Gardner, R. H.: Landscape Ecology in Theory and Practice; Pattern and Process, second edition, Springer Science + Business Media LLC, New York, USA, Ankara, Türkiye, https://doi.org/10.1007/978-1-4939-2794-4, 2015.
UNESCO: World Heritage Convention Web Site, City of Safranbolu, UNESCO, World Heritage Convention, https://whc.unesco.org/en/list/614/ (last access: 14 June 2024). 1994.
Wang, W., Zhang, B., Zhou, W., Lv, H., Xiao, L., Wang, H., Du, H., and He, X.: The effect of urbanization gradients and forest types on microclimatic regulation by trees, in association with climate, tree sizes and species compositions in Harbin city, northeastern China, Urban Ecosyst., 22, 367–384, https://doi.org/10.1007/s11252-019-0823-9, 2019.
Wolf, K. L.: Freeway roadside management: The urban forest beyond the white line, J. Arboric., 29, 127–136. 2003.
Xie, C., Cai, S., Yu, B., Yan, L., Liang, A., and Che, S.: The effects of tree root density on water infiltration in urban soil based on a Ground Penetrating Radar in Shanghai, China, Urban For. Urban Gree., 50, 126648, https://doi.org/10.1016/j.ufug.2020.126648, 2020.
Yuan, Y., Wang, X., Yin, F., and Zhan, J.: Examination of the quantitative relationship between vegetation canopy height and LAI, Adv. Meteorol., 964323, https://doi.org/10.1155/2013/964323, 2013.
Zhang, T., Hong, B., Su, X., Li, Y., and Song, L.: Effects of tree seasonal characteristics on thermal-visual perception and thermal comfort, Build. Environ., 212, 108793, https://doi.org/10.1016/j.buildenv.2022.108793, 2022.
Zolles, A., Schueler, S., Gartner, K., and Scheifinger, G.: Continuous parameterization of Leaf Area Index and phenological phases within deciduous forests based on temperature measurements, Front. For. Global Change, 4, 768085, https://doi.org/10.3389/ffgc.2021.768085, 2021.