the Creative Commons Attribution 4.0 License.
the Creative Commons Attribution 4.0 License.
 | 10 Jun 2025
Duration of vegetation green-up response to snowmelt on the Tibetan Plateau
Jingwen Ni
Jin Chen
Yao Tang
Jingyi Xu
Jiahui Xu
Linxin Dong
Qingyu Gu
Bailang Yu
Jianping Wu
Yan Huang
The Tibetan Plateau (TP) is characterized by abundant snow and heightened sensitivity to climate change. Although the impact of snowmelt on vegetation green-up is well recognized, the duration of vegetation response to snowmelt on the TP remains unclear. This study calculates the time differences between the green-up date and the start of snowmelt from 2001–2018 on the TP, denoted as ΔD. Exploratory spatial data analysis and the Mann–Kendall test were then applied to investigate the spatiotemporal distribution feature of ΔD. Subsequently, partial correlation and multiple linear regression analysis were employed to examine the impact of spring mean temperature, spring total rainfall, and daily snowmelt on ΔD. The results reveal that the mean ΔD across the TP was 38.5 d, with a spatially clustered distribution: low ΔD values were concentrated in the Hengduan Mountains, while high ΔD values were observed in the Bayankara and Himalaya mountains. Additionally, ΔD shortened with increasing spring temperature, total rainfall, and daily snowmelt, which accounted for 23.5 %, 28.8 %, and 35.4 % of ΔD variation, respectively. In 67 % of arid areas and 64 % of regions with low vegetation, daily snowmelt was the dominant factor influencing ΔD. Conversely, spring temperature played a primary role in 48 % of humid areas and 37 % of regions with high vegetation. Our findings enhance the understanding of vegetation responses to snowmelt and provide a scientific foundation for further research on the stability of alpine ecosystems and the impacts of climate change on the TP.
- Article
(9328 KB) - Full-text XML
-
Supplement
(1494 KB) - BibTeX
- EndNote


The Tibetan Plateau (TP) is the largest plateau in China and the highest in the world. It serves as the source of several major Asian rivers, providing water resources to approximately 1.6 billion people (Bibi et al., 2018). Its unique natural environment and diverse habitats facilitate the interaction and integration of various biota (Chu et al., 2024; Yu et al., 2021). These features help mitigate global warming, protect biodiversity, and provide carbon sequestration, thereby playing a crucial role in ecological security (Liang and Song, 2022). Over the past 50 years, climate change has caused the mean temperature of the TP to rise at twice the global rate (Yang et al., 2019; Zhang et al., 2018a). Plant phenology, which reflects climatic patterns and influences climate through biological and biochemical processes, is a key aspect of this change (Piao et al., 2019; Zhang et al., 2022b). Specifically, the green-up date (DGU), marking the onset of vegetation growth under favorable climatic conditions (Zhang et al., 2003), is a vital indicator for studying climate change (Shen et al., 2015). Therefore, understanding the changes and mechanisms affecting DGU is essential for assessing the impact of climate change on the TP and its ecological stability.
Previous studies on climatic factors influencing DGU have primarily focused on temperature and precipitation, as these are the two most significant determinants of DGU (Zhang et al., 2022a). Temperature regulates thermal conditions, while precipitation provides the necessary moisture for vegetation growth (Shen et al., 2022). However, the role of snow in influencing DGU should not be ignored (Wang et al., 2018a). Snow affects vegetation mainly by influencing soil temperature, soil moisture, soil nutrients, and photosynthetically active radiation. Specifically, snow cover can mitigate the exchange of soil heat and moisture with the atmosphere (Zhu et al., 2019a), leading to smaller annual variations in soil temperature compared to air temperature (Zhang et al., 2018b), thereby providing a more favorable overwintering environment for vegetation (Zhu et al., 2019a). Furthermore, snowmelt increases soil moisture, promoting vegetation growth (Peng et al., 2010; Potter, 2020). Changes in soil temperature and moisture due to snow cover can also influence microbial activity, which in turn affects the availability of nutrients for vegetation (Ren et al., 2020; Wang et al., 2015). Additionally, the high albedo of snow reflects much of the solar radiation essential for photosynthesis (Rixen et al., 2022; Yang et al., 2022). Consequently, changes in snow cover invariably influence transitions in DGU.
The TP has abundant snow cover. In high-altitude areas (around 17.69 %), snow cover typically begins in October and ends in April, whereas in low-elevation areas (around 56.69 %), the snow cover duration is usually less than 20 d, concentrated in December and January (Xu et al., 2024). Snow phenology serves as a crucial indicator of changes in snow cover, and several studies have analyzed the impact of snow phenology on DGU in the TP. The snow cover end date typically exhibits a significant positive correlation with DGU, with each 1 d advancement leading to a 0.56 d earlier DGU (Potter, 2020; Wu et al., 2023). In contrast, the effect of snow cover duration on DGU is more complex and region-dependent. For instance, a longer snow cover duration leads to a delayed DGU in the western TP, while it advances DGU in the eastern TP (Huang et al., 2019; Xiong et al., 2019). Notably, DGU is most sensitive to the start of snowmelt (DSOM) among various snow cover phenology metrics on the TP (Xu et al., 2022a). Wang et al. (2015) found that 39.9 % of meadows and 36.7 % of steppes on the TP showed a significant correlation between DGU and DSOM. Additionally, Xu et al. (2022a) further highlighted the role of environmental factors in modulating this relationship, noting that precipitation-enhanced humidity strengthened the positive correlation between DSOM and DGU, whereas in high-temperature areas, a strong negative correlation prevailed. Besides temperature and precipitation, snowmelt significantly altered environmental conditions conducive to vegetation growth, suggesting that the magnitude of snowmelt between DSOM and DGU may also influence ΔD – the time difference between DGU and DSOM across the TP (An et al., 2022; Rixen et al., 2022).
Although previous studies have confirmed the role of snowmelt in vegetation green-up dynamics, the response time of vegetation to snowmelt remains poorly understood. This study aims to investigate how long it takes for DGU to respond to DSOM and how this response varies regionally. To address this, we calculated and analyzed the time difference between DGU and DSOM across the TP, denoted as ΔD. Accurate extraction of DSOM and DGU is essential for this analysis. DSOM detection presents challenges due to the limitations of different remote sensing techniques: while optical remote sensing effectively detects the presence or absence of snow, it struggles to identify the melting state. In contrast, microwave remote sensing provides more reliable snowmelt detection but suffers from lower spatial resolution. To balance these trade-offs, we used a daily snow depth dataset with high spatial resolution to extract DSOM for the TP from 2001–2018. Similarly, DGU was derived from an existing high-accuracy dataset for the same period. We then calculated ΔD to assess the delayed response of vegetation green-up to snowmelt. Furthermore, we employed exploratory spatial data analysis to examine the spatiotemporal variation in ΔD, hypothesizing that regional heterogeneity in ΔD is influenced by multiple environmental factors.
2.1 Study area
The TP, located between 25.99–39.82° N and 73.46–104.67° E, has an average elevation exceeding 4000 m (Fig. 1). The TP is characterized by distinct climatic patterns, including intense solar radiation and significant diurnal temperature variations. Winter temperatures range from −15 to −2 °C, while summer temperatures average between 8 and 18 °C. Annual precipitation is approximately 400 mm, with the region transitioning from humid in the southeast to sub-humid, semiarid, and arid conditions in the northwest (Diao et al., 2021).
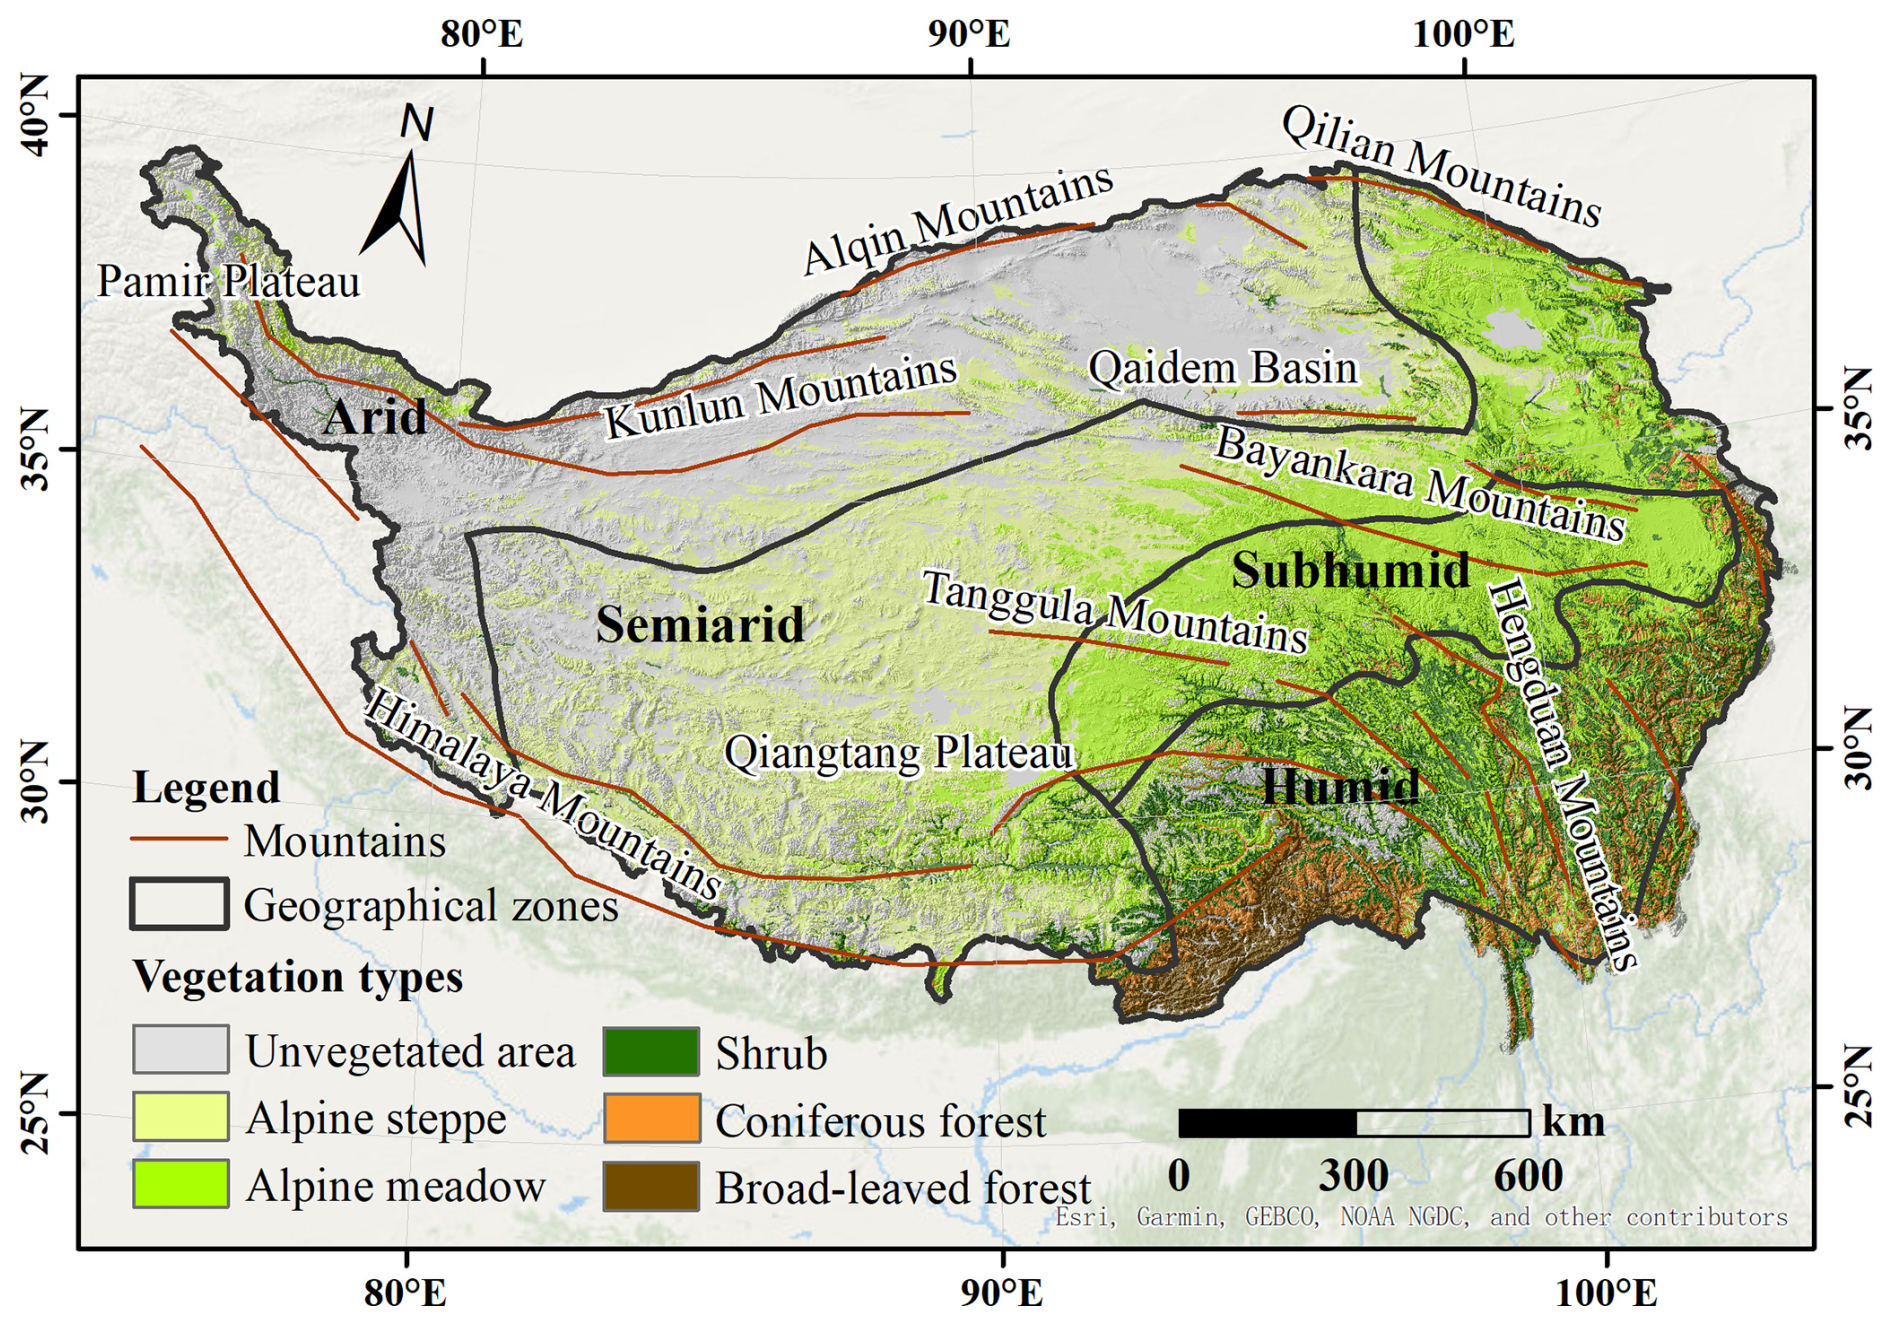
Figure 1Map of the study area with vegetation types, distribution of mountains, and geographical zones (base map from ESRI).
Due to substantial topographic uplift and its extensive spatial extent, the TP exhibits a diverse range of climate types and ecosystems. Predominant vegetation types include alpine meadows and alpine steppes, which are widespread across the central regions. The southeastern areas are primarily covered by forests and shrubs, while the western and northern regions are largely barren or desertified due to the terrain and climatic conditions (Zhao et al., 2011).
Snow cover on the TP shows clear spatial and seasonal variability. Except for the Himalayan Mountains, the Pamir Plateau, and the eastern sector of the Tanggula Mountains, which have perennial snow cover, other areas experience seasonal snow cover. Snow accumulation generally begins in September, persists from October to late November, and peaks from December to February. The mean snow cover fraction across the TP is 36.6 % (Zou et al., 2022).
2.2 Data sources
2.2.1 Green-up date dataset
Remote-sensing-based vegetation indices (VIs) are commonly used to identify the DGU. However, different VIs and extraction methods can introduce uncertainties into the results (Shen et al., 2014). Xu et al. (2022b) compared six different vegetation indices and four extraction methods, finding that the normalized difference greenness index (NDGI) combined with the maximum curvature change rate method (CCRmax) yielded the highest identification accuracy (r=0.62, RMSE=11 d, p<0.01) on the TP. Since the authors of Xu et al. (2022b) are also the collaborators of this study, they directly provided these data. The dataset, spanning 2001–2018, had a spatial resolution of 500 m and was measured in day of year (DOY). To ensure consistent data resolution, we applied bilinear interpolation to reproject the dataset to a resolution of 0.05°.
2.2.2 Snow depth and snowmelt products
Daily snow depth data from 2001–2018 were used to identify the DSOM. This dataset is accessible through the National Tibetan Plateau Data Center (https://data.tpdc.ac.cn/, last access: 20 January 2025) and has a spatial resolution of 0.05°. Produced by Yan et al. (2022), it is based on a long-term series of daily snow depth data in China (1979–2023) (http://poles.tpdc.ac.cn/en/, last access: 20 January 2025) and snow cover probability data derived from the Moderate Resolution Imaging Spectroradiometer (MODIS). Yan et al. (2022) employed a spatial–temporal downscaling method to improve spatial resolution from 0.25° to 0.05°, achieving greater accuracy compared to the original dataset (RMSE=0.61 cm).
Snowmelt data for the period between 2001 and 2018 were sourced from ERA5-Land, provided by the Climate Data Store (https://cds.climate.copernicus.eu/datasets, last access: 20 January 2025). This dataset integrates physical models with global reanalysis observations and has a spatial resolution of 0.1° and a temporal resolution of 1 h. The snowmelt variable quantifies the total amount of water (m) produced by snow melting within snow-covered areas. The data were reprojected to a 0.05° resolution using bilinear interpolation, and the time resolution was adjusted to daily values through summation.
2.2.3 Meteorological dataset
Daily average air temperature and precipitation data from 2001–2018 were used to investigate the impact of meteorological factors on ΔD. These data were obtained from the China Meteorological Forcing Dataset (CMFD), provided by the National Tibetan Plateau Data Center (https://data.tpdc.ac.cn/, last access: 20 January 2025). The CMFD integrates remote sensing data with field observations, and due to its use of numerous actual observation sites, it offers higher accuracy compared to the Global Land Data Assimilation System (GLDAS) and ERA5-Land (He et al., 2020; Li et al., 2022). The CMFD dataset has a spatial resolution of 0.1° and a temporal resolution of 3 h, with units of kelvin (K) for temperature and millimeters per hour (mm h−1) for precipitation. To match our analysis requirements, we reprojected the dataset to a 0.05° resolution using bilinear interpolation and adjusted the temporal resolution to daily values by summing (for precipitation) and averaging (for air temperature).
2.2.4 Land cover type
The land cover type map of the TP (2010), which provided vegetation type information for this study, was sourced from the Science Data Bank (https://www.scidb.cn/en, last access: 20 January 2025). This map was classified using the support vector machine method based on MODIS images, achieving a classification accuracy of 93 % with a spatial resolution of 500 m. The map delineates 10 land cover types on the TP: alpine desert, alpine steppe, alpine meadow, bare land/desert, arable land, shrub, coniferous forest, broad-leaved forest, permanent snow/glacier, and lake. Considering that some land covers are non-seasonal or non-vegetation, this study focuses exclusively on alpine steppe, alpine meadow, shrub, coniferous forest, and broad-leaved forest. Prior to use, the dataset was reprojected to a resolution of 0.05°.
2.3 Method
2.3.1 Calculation of ΔD
The time differences between DGU and DSOM (ΔD) can be calculated using the following equation:
where DGU and DSOM are the green-up date and start of snowmelt, respectively, in DOY.
The DGU dataset was provided by Xu et al. (2022b). They used the MODIS surface reflectance product MOD09A1 to calculate the NDGI, which integrates red (band 1), near-infrared (band 2), and green (band 4) reflectances. The NDGI time series was then fitted with a four-parameter logistic function, and the curvature change rate (CCR) of the logistic function was calculated. DGU was defined as the date on which the CCR reached its first local maximum.
DSOM was identified from snow depth measurements. A snowfall event typically involves two stages: snow accumulation and snowmelt (Fontrodona-Bach et al., 2023), which are characterized by changes in snow depth. The maximum snow depth marks the transition between these two stages (Zheng et al., 2022) (see the orange point in Fig. S1 in the Supplement). To determine DSOM, the snow depth time series was first smoothed using Savitzky–Golay filtering with a 5 d window to minimize the influence of outliers (as indicated by the orange line in Fig. S1). The date of the maximum snow depth in spring was then identified as DSOM. Given that multiple snow accumulation and melting events may occur throughout the snow year on the TP (Lei et al., 2023), two criteria were established. First, the snow depth time series was analyzed starting from DOY 61 (1 March), as snowmelt before spring has a minimal impact on vegetation dormancy and snowmelt on the TP typically begins in March (Dong et al., 2024). Second, the snowfall event with the longest duration of snow cover was considered the most significant. Thus, the number of consecutive snow cover days was compared to determine the turning point. According to Stanislaw et al. (2023), a snow cover day is defined as a day when the snow depth exceeds 1 cm. As illustrated in Fig. S1, Snow depth was above 1 cm from DOY 61 to DOY 107, making the duration of the first snowfall event 47 d. In contrast, the durations of the second and third events were 3 and 6 d, respectively. The first snow accumulation and melting process was the longest; thus, the turning point on DOY 96 was designated as DSOM. Additionally, to ensure that the snow cover is not transient and can influence vegetation, we have introduced a third criterion: the snow cover duration in winter must exceed 10 d (Zhao et al., 2022).
2.3.2 Exploratory spatial data analysis
Classical statistical analysis models assume sample independence, which limits their ability to reveal correlations between the geographical locations of spatial data. Exploratory spatial data analysis (ESDA) offers an enhancement over traditional methods by examining spatial discrepancies and autocorrelation in spatial datasets. Two commonly used indicators in ESDA are the global and local Moran's I. In this study, these indices are applied to analyze the spatial distribution of ΔD. The global Moran's I (I) measures the overall similarity of ΔD between a region and its neighboring regions, as detailed in Eq. (2). The local Moran's I (Ii) measures the degree of clustering or spatial autocorrelation of ΔD within a specific region i, relative to all other regions, as calculated using Eq. (3).
where xi and xj represent ΔD for region i and j, is the mean value of ΔD, wij is the spatial weight between region i and region j determined by inverse Euclidean distance, and n is the total number of regions.
Moran's I ranges from −1 to 1. A positive value indicates significant spatial autocorrelation, suggesting a tendency for spatial clustering. Conversely, a negative value signifies significant spatial autocorrelation, indicating a tendency for spatial dispersion. If the value is close to zero, the data are considered to be randomly distributed. The significance of spatial autocorrelation can be assessed using the p value of the standardized Z statistic (Eq. 4).
where I denotes Moran's index, E(I) represents the expectation value of I, and Var(I) is the variance of I. A significance level of p<0.01 is used to determine statistical significance. The calculations were performed using the “Spatial Autocorrelation” and “Cluster and Outlier Analysis” tools in ArcGIS 10.8.
2.3.3 Mann–Kendall test
The Mann–Kendall test was used to investigate the temporal trend of ΔD from 2001–2018 for each pixel. Unlike traditional regression or trend-fitting methods, this test does not require the samples to adhere to a specific distribution. Additionally, the Mann–Kendall test is robust to outliers, thereby minimizing disturbances (Howell et al., 2012).
First, the statistic S must be calculated, as shown in Eq. (5). This statistic represents the sum of the indicator functions that compare the differences between years: if the latter year has a higher value than the former, the function returns 1; if it has a lower value, it returns −1; otherwise, it returns 0 (Semmens and Ramage, 2013). The standardized statistic (Zc) is then calculated using Eq. (6).
Here n is the length of the time series , Var(S) is the variance of the statistic, and Zc is used for trend testing. If , a significant temporal trend is present. Here, represents the standard normal variance, and α signifies the significance level. In this study, the significance levels were set at three thresholds: α=0.01, α=0.05, and α=0.1.
If the time series exhibits a significant temporal trend, the trend in ΔD can be assessed using the parameter β (Eq. 7).
where xi and xj are ΔD of year i and j, respectively. The median function is denoted by “median”, and β indicates the degree of trend: an upward trend if β>0 and a decline if β<0.
2.3.4 The influence of meteorological and snow factors on ΔD
We selected the daily mean temperature of spring (Tspring), the total spring rainfall (Pspring), and the daily mean snowmelt from DSOM to DGU (SStoG) as the influencing factors of ΔD (Shen et al., 2022). The partial correlation coefficient between each variable and ΔD was calculated to quantify their relationship. To isolate the direct effects of Tspring, Pspring, and SStoG on ΔD while minimizing indirect influences, the second-order partial correlation coefficient was employed (Eqs. 8 and 9).
where rij represents the simple correlation coefficient between variables i and j, calculated using the corr function in Python 3.8. rij⋅n is the first-order partial correlation coefficient between i and j, which accounts for their correlation after removing the linear effects of control variable n. Similarly, rij⋅mn is the second-order partial correlation coefficient between i and j, controlling for both m and n. Accordingly, we calculated , , and .
Next, a multiple linear regression model was established for each pixel (Eq. 10). The partial correlation coefficient between each variable and ΔD was calculated to quantify their relationship. Subsequently, a multiple linear regression model was established for each pixel (Eq. 8). A prerequisite for multiple linear regression is passing the collinearity test, which requires the variance inflation factor (VIF) to be less than 3, indicating no collinearity. In this study, the VIF values for Tspring, Pspring, and SStoG were 1.243, 1.209, and 1.174, respectively, confirming that the collinearity test was satisfied. The OLS and variance_inflation_factor functions were used to construct the linear regression model and perform the collinearity test in Python 3.8.
where a,b, and c are the fitting coefficients used to determine the contribution of Tspring, Pspring, and SStoG to ΔD, respectively, while d represents a constant term. By comparing the fitting coefficients, the factor with the largest coefficient was deemed dominant.
It is important to note that all variables were standardized by Z scores before being input into the model to eliminate dimensional differences. Given that the model was based on the pixel scale and the sample size was too small, we have expanded the sample pixel to its surrounding eight neighboring pixels. The significance level was set at p<0.05.

Figure 2Spatial distribution of multiyear-averaged (a) DSOM and (b) DGU from 2001–2018 on the Tibetan Plateau.
3.1 Spatial variation in DSOM and DGU
Figure 2 shows the spatial pattern of the multiyear mean DSOM and DGU data from 2001–2018. The Qaidam Basin and southern Qiangtang Plateau, which rarely experience snowfall (Xu et al., 2024), present challenges for snowmelt detection. In the northern TP, where vegetation is sparse, and in the southeastern TP, where seasonal vegetation changes are minimal, DGU was not observed. Generally, DSOM occurred between DOY 70–100 (10 March–9 April) for 73.5 % of the TP, with an average DOY of 86.7. The latest DSOM (>DOY 105) was found in the Kunlun and Nyainqentanglha mountains, while the earliest DSOM occurred in the Hengduan and Minshan mountains, with an averaged DOY of 76.8. In contrast, DGU appeared later, ranging from DOY 110–140 (19 April–19 May) for 77.6 % of the TP. Vegetation greens up earlier in the southeast and later in the center and west.

Figure 3(a) Spatial and frequency distribution histogram and (b) local and global Moran's I values of average ΔD on the Tibetan Plateau over 2001–2018.
3.2 Spatial and temporal distribution characteristics of ΔD
3.2.1 Spatial distribution of ΔD
ΔD was calculated using Eq. (1) for regions where both DSOM and DGU were non-null (Figs. 3a and S2 in the Supplement). A positive ΔD indicates that DSOM preceded DGU, and vice versa. The average ΔD over the TP from 2001–2018 was 38.5 d, with positive values observed over 95 % of the TP. The proportion of ΔD ranging from 40–60 d was the highest, accounting for 40.4 % on average. In the east TP, ΔD increased from south to north, with larger values observed in the Gangdise and Himalayas mountains. Negative ΔD was mainly found in the northwest TP.
To gain more insight about spatial distribution characteristics of ΔD, the global and local Moran's I were calculated (Figs. 3b, S3, and S4 in the Supplement), The global Moran's I of ΔD over the TP from 2001–2018 was 0.3 and was significant at the 0.01 level (). This indicates that ΔD demonstrates spatial clustering. The local Moran's I index revealed that about 81.7 % of the regions exhibited significant spatial autocorrelation. The pale blue regions in Fig. 3b represent low-value clustering, while the pink regions indicate high-value clustering, meaning ΔD was generally longer in these areas. Red (blue) areas represent high (low) values surrounded by low (high) values. Low values are predominantly concentrated in the Hengduan Mountains, and high values are primarily clustered around the Bayankara and Himalaya mountains. In the eastern TP, the Bayankara Mountains mark the boundary between high and low values. In the central and northwestern TP, negative ΔD results in the low-value cluster with scattered positive values.
3.2.2 Temporal dynamic of ΔD
Regarding the temporal trend of ΔD, Fig. 4 shows the interannual variation from 2001–2018, along with its significance indicated in the bottom-left corner. Only 5.2 % of the study area, predominantly in the eastern TP, exhibits a significant trend. Of these regions, approximately 36.6 % show a declining trajectory, suggesting that vegetation in these areas responded more rapidly to snowmelt. However, for most regions, no discernible trend was observed over time, likely because the warming hiatus since the 2000s has not led to noticeable advancements in DSOM and DGU (Piao et al., 2019; Wang et al., 2019).
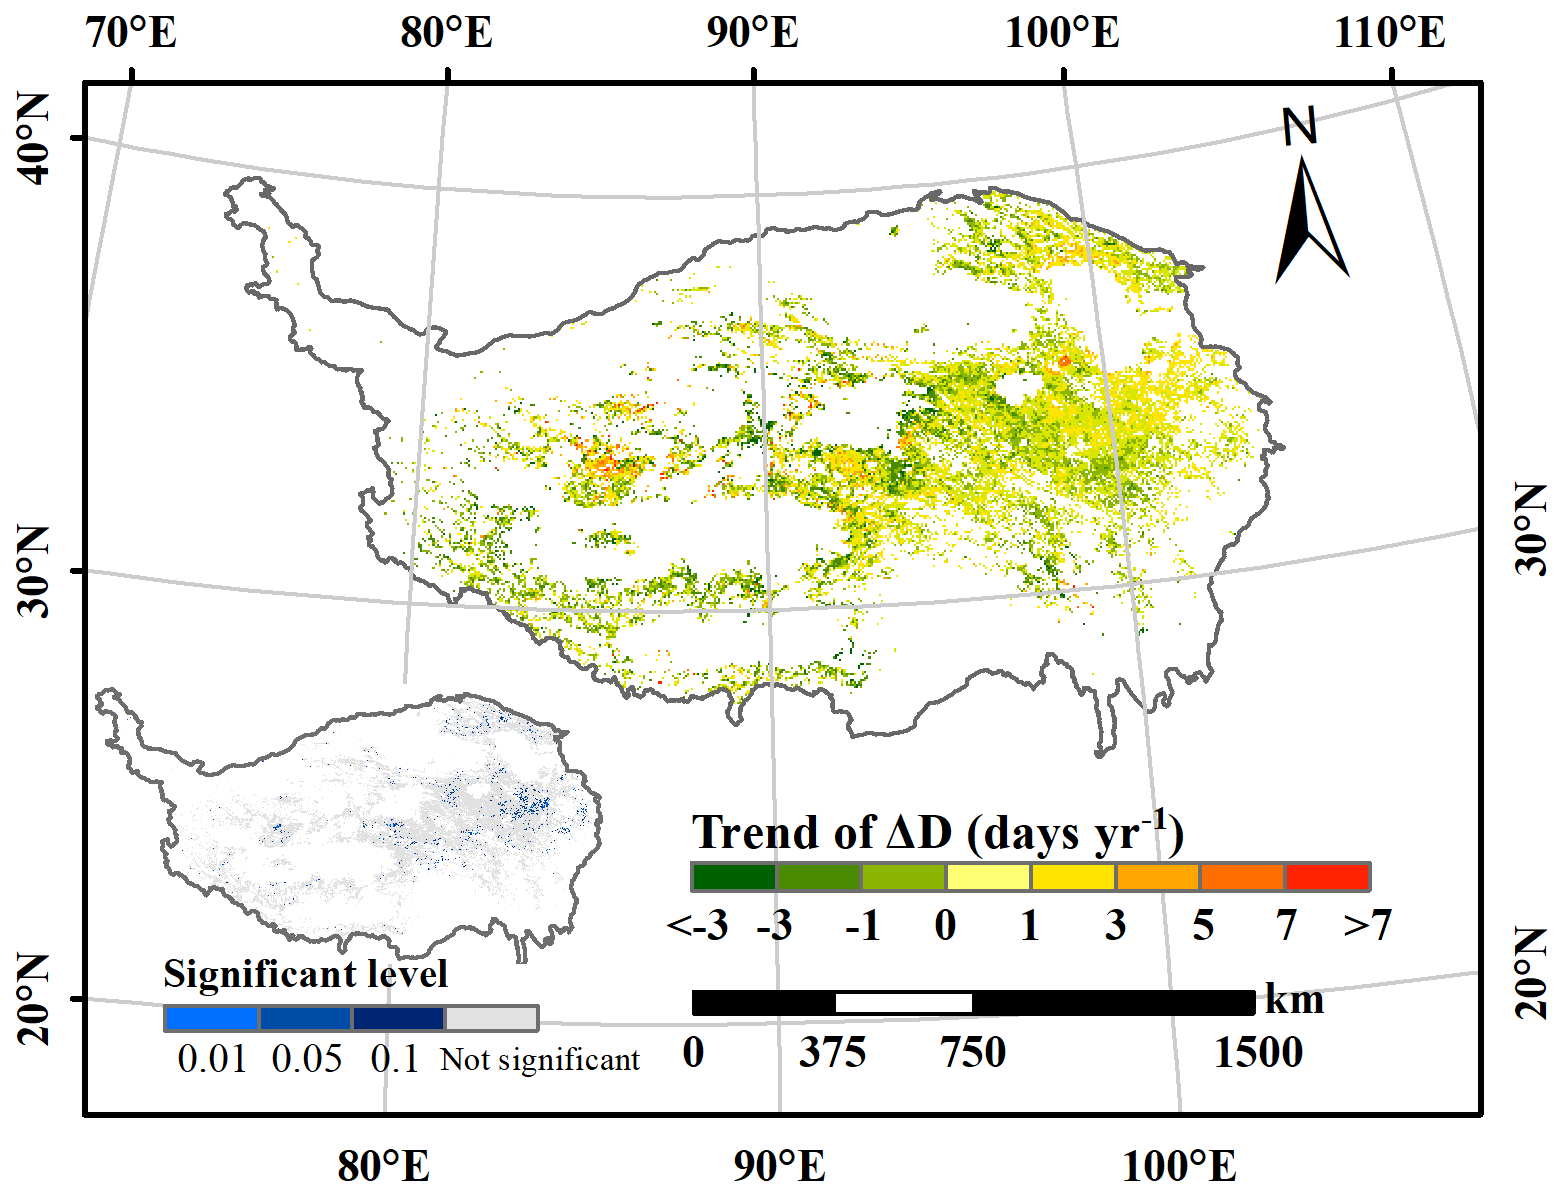
Figure 4Interannual variation trend and significant levels of ΔD on the Tibetan Plateau from 2001–2018.
3.3 Influence of air temperature, precipitation, and snowmelt on ΔD
As observed in Sect. 3.2, ΔD is positive in most regions. Furthermore, snowmelt only significantly impacts vegetation when DSOM precedes DGU. Consequently, subsequent analyses will focus exclusively on areas where ΔD is positive.
Figure 5 illustrates the mean value of ΔD under varying spring meteorological conditions. ΔD exhibits a clear stepwise decline from cold to warm regions, decreasing from approximately 48 to 37 d (Fig. 5a). In colder or hotter spring conditions (i.e., Tspring<270 K or Tspring>275 K), ΔD decreased slightly. However, near the freezing point (270–275 K), ΔD shortens by 3 d with each 1 K increase in Tspring. Under various precipitation conditions (Fig. 5b), ΔD shortens by 0.29–1.96 d for every 10 mm increase in Pspring. Figure 5c reveals a strong negative correlation between ΔD and SStoG when SStoG exceeded 6 mm d−1. For each 1 mm increase in SStoG, ΔD decreases by approximately 0.615 d. The dispersion within each snowmelt category remains relatively consistent, with a standard deviation of about 16.8 d.

Figure 5Variations in ΔD across regions with differing (a) spring mean temperature (Tspring), (b) spring total rainfall (Pspring), and (c) daily snowmelt from DSOM to DGU (SStoG). Points represent the mean ΔD, while error bars denote 1 standard deviation. The slope and R2 value reflect the coefficient and precision of the linear regression, respectively, with a significance level of 0.01.
To quantify the influence of environmental factors on ΔD across different regions, a partial correlation coefficient was calculated for each pixel (Fig. 6). Only pixels with valid ΔD over a 6-year period were included in the analysis.
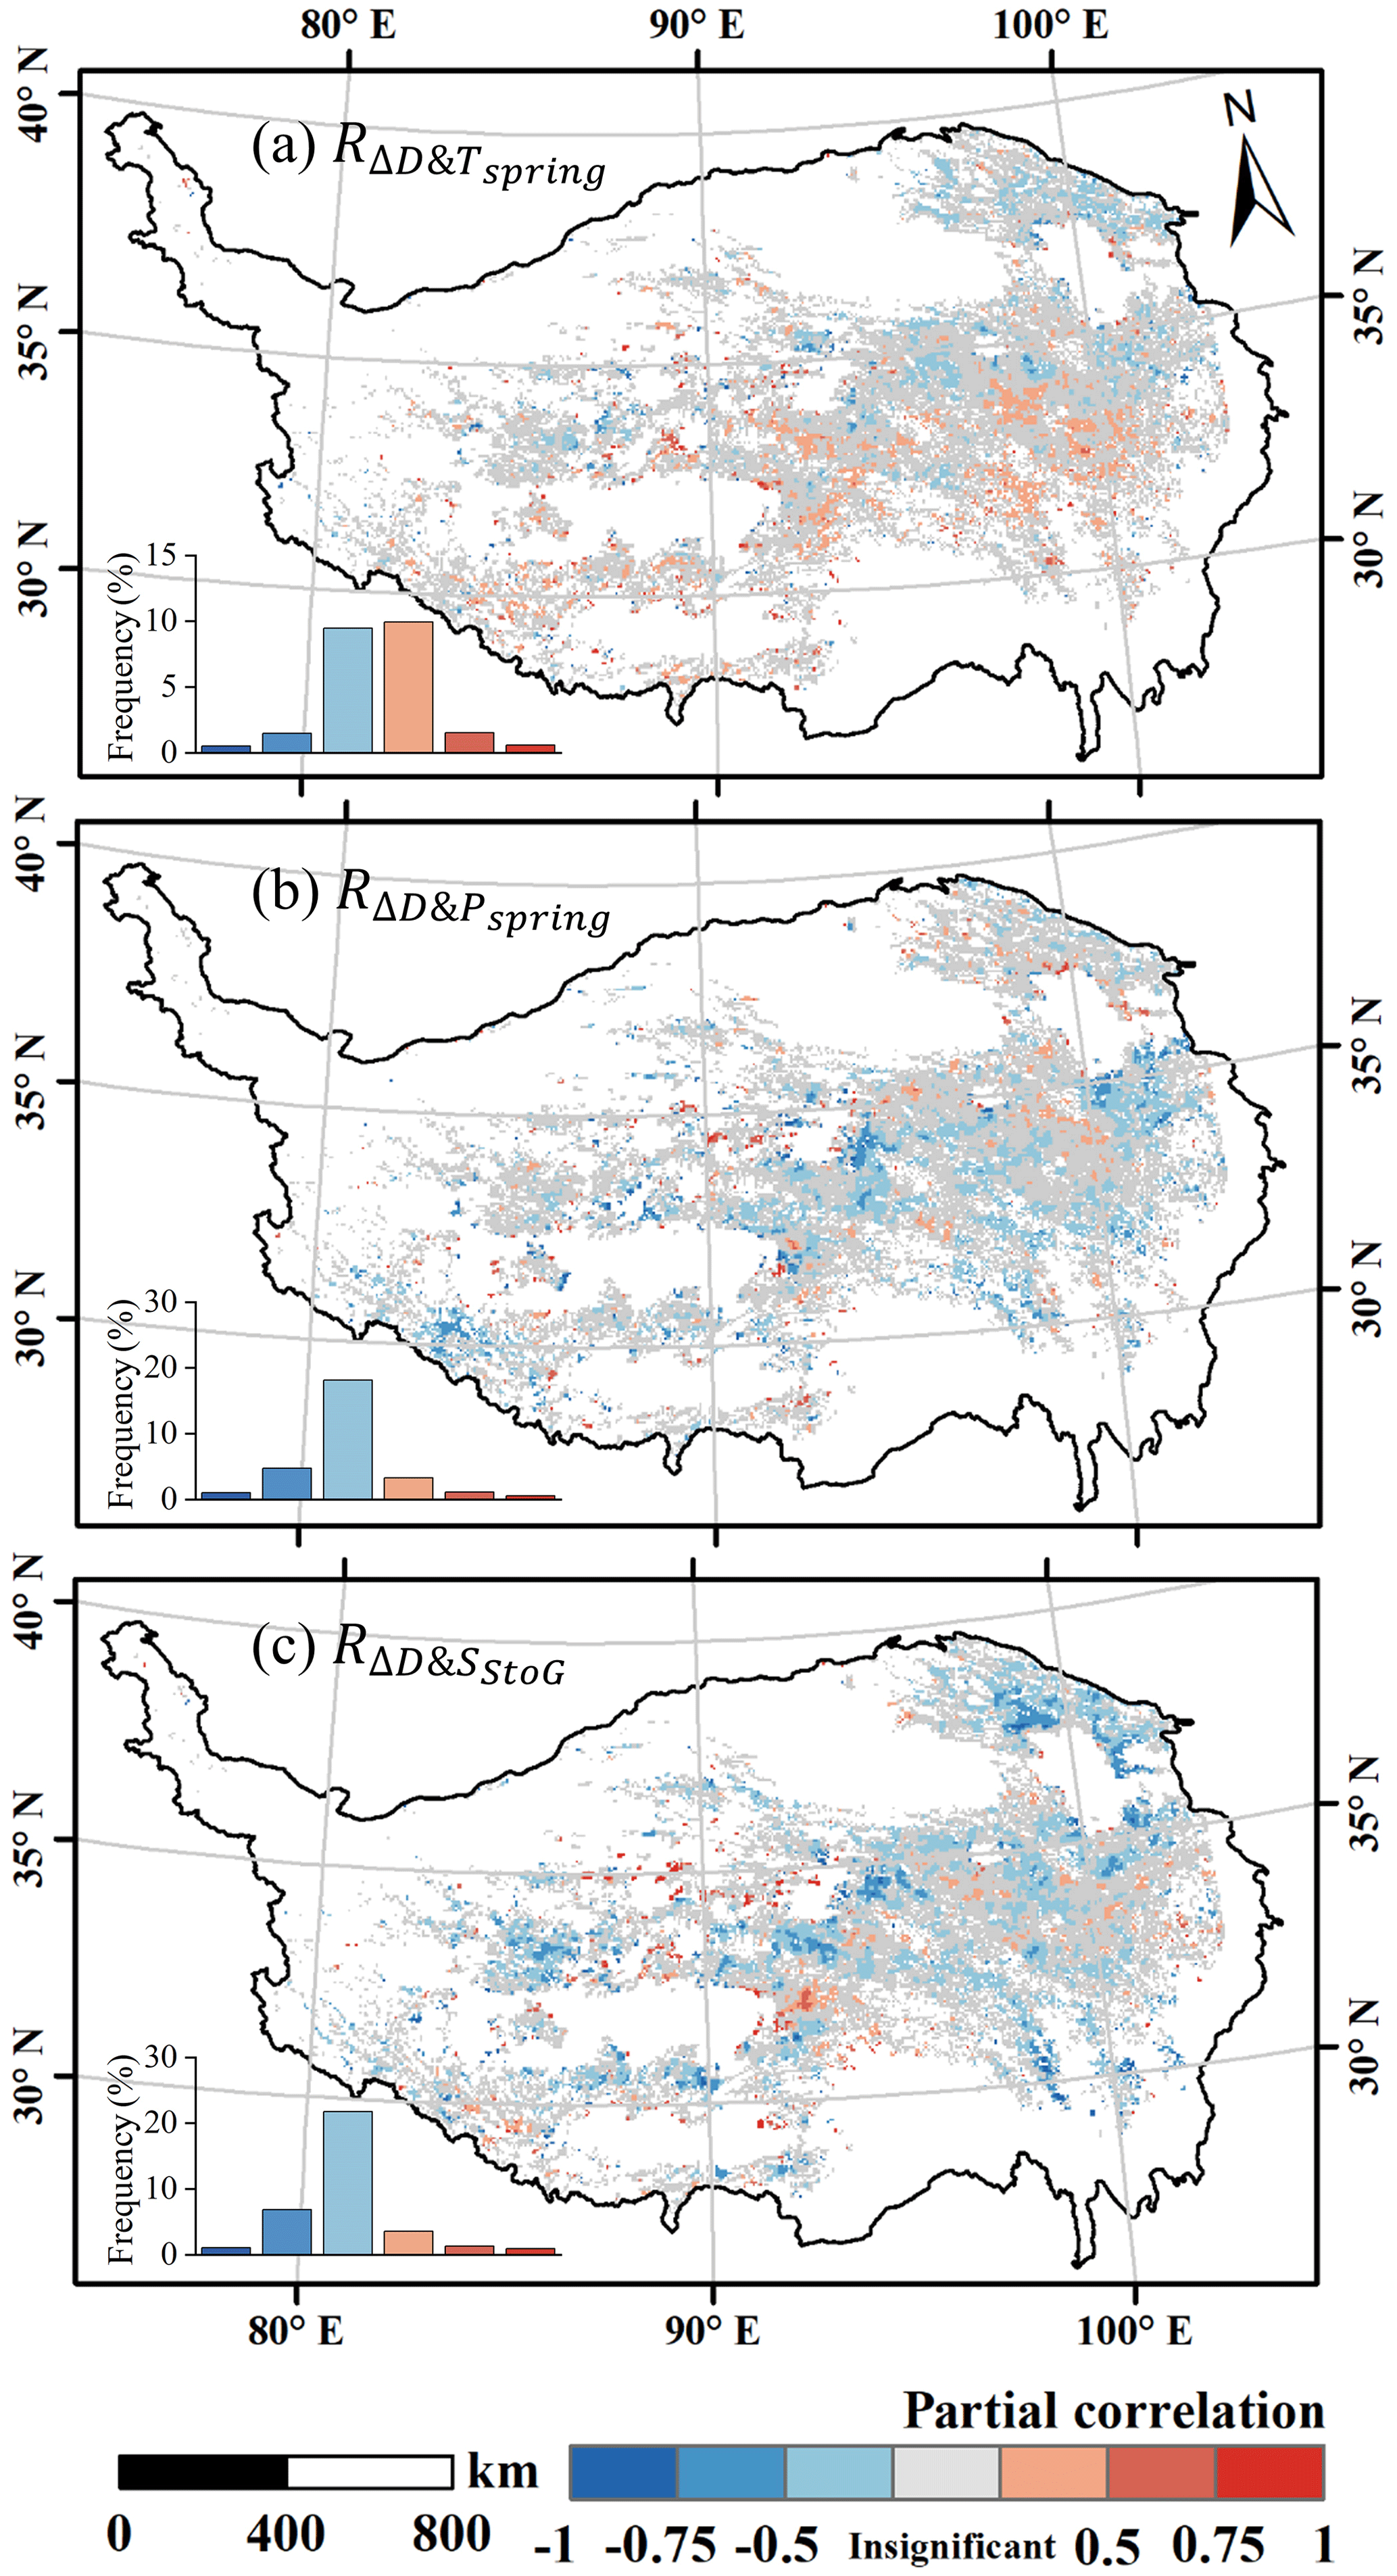
Figure 6Spatial distribution of the partial correlation between ΔD and (a) spring mean temperature (), (b) spring total rainfall (), and (c) daily snowmelt from DSOM to DGU () with a significance level of 0.05.
At a significance level of 0.05, ΔD was significantly correlated with temperature in 23.5 % of the samples. Among these significant pixels, 51.3 % exhibited a positive correlation between ΔD and Tspring. These positively correlated pixels were predominantly located in the southern part of the valid data, while negatively correlated pixels were concentrated in the northern regions. Regarding rainfall, 28.8 % of the samples exhibited a significant correlation with ΔD, with 82.9 % of these showing a negative correlation and 17.1 % showing a positive one. Snowmelt demonstrated a significant relationship with ΔD in 35.4 % of samples, with 83.8 % showing a negative correlation, and the average correlation index was −0.27.
A linear regression model was established to determine the dominant factor influencing ΔD at each pixel (Figs. 7 and S5 in the Supplement). Among the significant samples (p<0.05), Tspring, Pspring, and SStoG accounted for 34.1 %, 20.3 %, and 45.6 % of the dominant factors, respectively. On the southeastern TP, Tspring primarily influences ΔD, whereas on the northwestern TP, SStoG is more influential. This aligns with the distribution of vegetation types and geographical zones (Fig. 1). Consequently, the proportion of each dominant factor across different regions was assessed. In the arid zone, 67 % of pixels were dominated by SStoG, compared to 20 % dominated by Tspring. As moisture increased, the dominant factor shifted from SStoG to Tspring, with 48 % of pixels in humid regions under temperature dominance and only 18 % under SStoG. Similarly, the proportion of Tspring-dominant pixels increased from 20 % to 44 %, while SStoG-dominant pixels decreased from 64 % to 27 % as vegetation became taller. Additionally, Pspring-dominant pixels consistently represented the lowest fractions (12 %–36 %) across all regions.
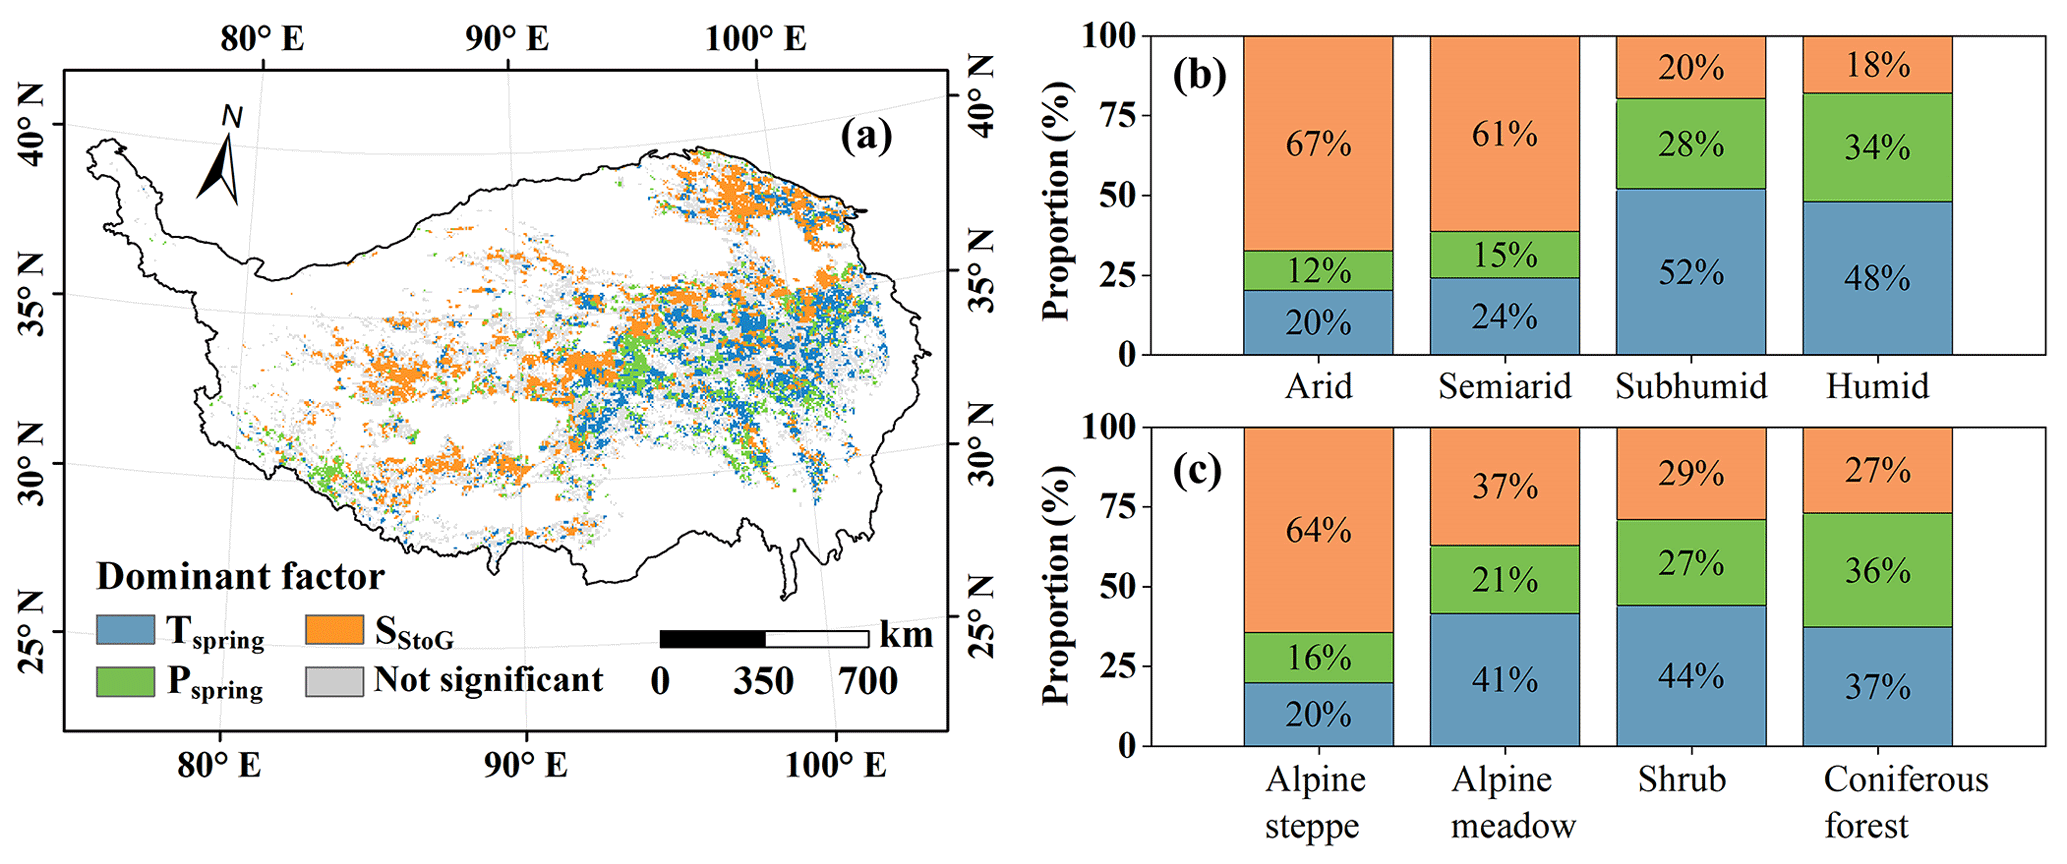
Figure 7(a) Spatial distribution of dominant factor of ΔD with a significance level of 0.05 and its proportion diagram among (b) different geographical zones and (c) different vegetation types.
4.1 Quality evaluation of ΔD
ΔD is primarily determined by DSOM and DGU. Xu et al. (2022b) discussed the accuracy of DGU, so this study focused on the identification quality of DSOM.
DSOM can currently be derived from optical or microwave remote sensing images. The normalized difference snow index (NDSI) is commonly used for snow identification in optical images. During periods of surface snow coverage, the NDSI tended to remain elevated and steady. After the start of snowmelt, the NDSI began to decrease. Consequently, DSOM can be identified using the dynamic threshold method on the NDSI time-series curve (Potter, 2020; Zheng et al., 2022). However, NDSI mainly reflects snow presence rather than the snowmelt process, which initially reduces snow depth rather than snow cover extent (Panday et al., 2011).
Microwave bands, on the other hand, are more effective at tracking the internal state of snowpacks due to differences in the dielectric constant between water and snow (Ma et al., 2020). Melting snow leads to abrupt changes in brightness temperature or backscatter coefficient, facilitating DSOM identification (Smith et al., 2017). Methods developed for this purpose include the band threshold method (Howell et al., 2012), the diurnal amplitude variation algorithm (DAV) (Semmens and Ramage, 2013), and the cross-polarized gradient ratio (Grippa et al., 2005). For instance, Xiong et al. (2017) identified DSOM as the date when the differential average derivative of the Ku-band reached a maximum, providing the snowmelt onset time for the SOMHMA high-mountain Asia (1979–2018) dataset, available from the National Tibetan Plateau Data Center (https://data.tpdc.ac.cn/, last access: 20 January 2025) with a spatial resolution of 0.25°.
Although this dataset captures snowmelt evolution, its spatial resolution is relatively low. DSOM can also be indirectly identified from abrupt points in the snow depth/snow water equivalent time series (Fontrodona-Bach et al., 2023; Zheng et al., 2022). Our study used the snow depth dataset from Sect. 2.2.2, which improved spatial resolution to 0.05° via downscaling while maintaining the benefits of microwave bands, making it more accurate than traditional microwave data with a 0.25° resolution.
Verifying DSOM is challenging due to the lack of in situ data. Snowmelt patterns, influenced by external conditions and similar to temperature distributions, have been cross-validated with temperature records in previous studies (Drobot and Anderson, 2001; Panday et al., 2011; Zheng et al., 2020). Thus, following Grippa et al. (2005), we randomly selected one sample area for each land cover on the TP and calculated the correlation coefficient between average DSOM and mean April temperature (Fig. 8). Our results showed stronger consistency with temperature trends compared to SOMHMA. The ΔD calculated by SOMHMA was relatively random and inconclusive (Figs. S6–S8 in the Supplement), potentially due to mixed-pixel issues from its limited resolution. Although our method offers improved accuracy, some errors in DSOM persist due to original data uncertainty (RMSE=0.61 cm) (Yan et al., 2022).
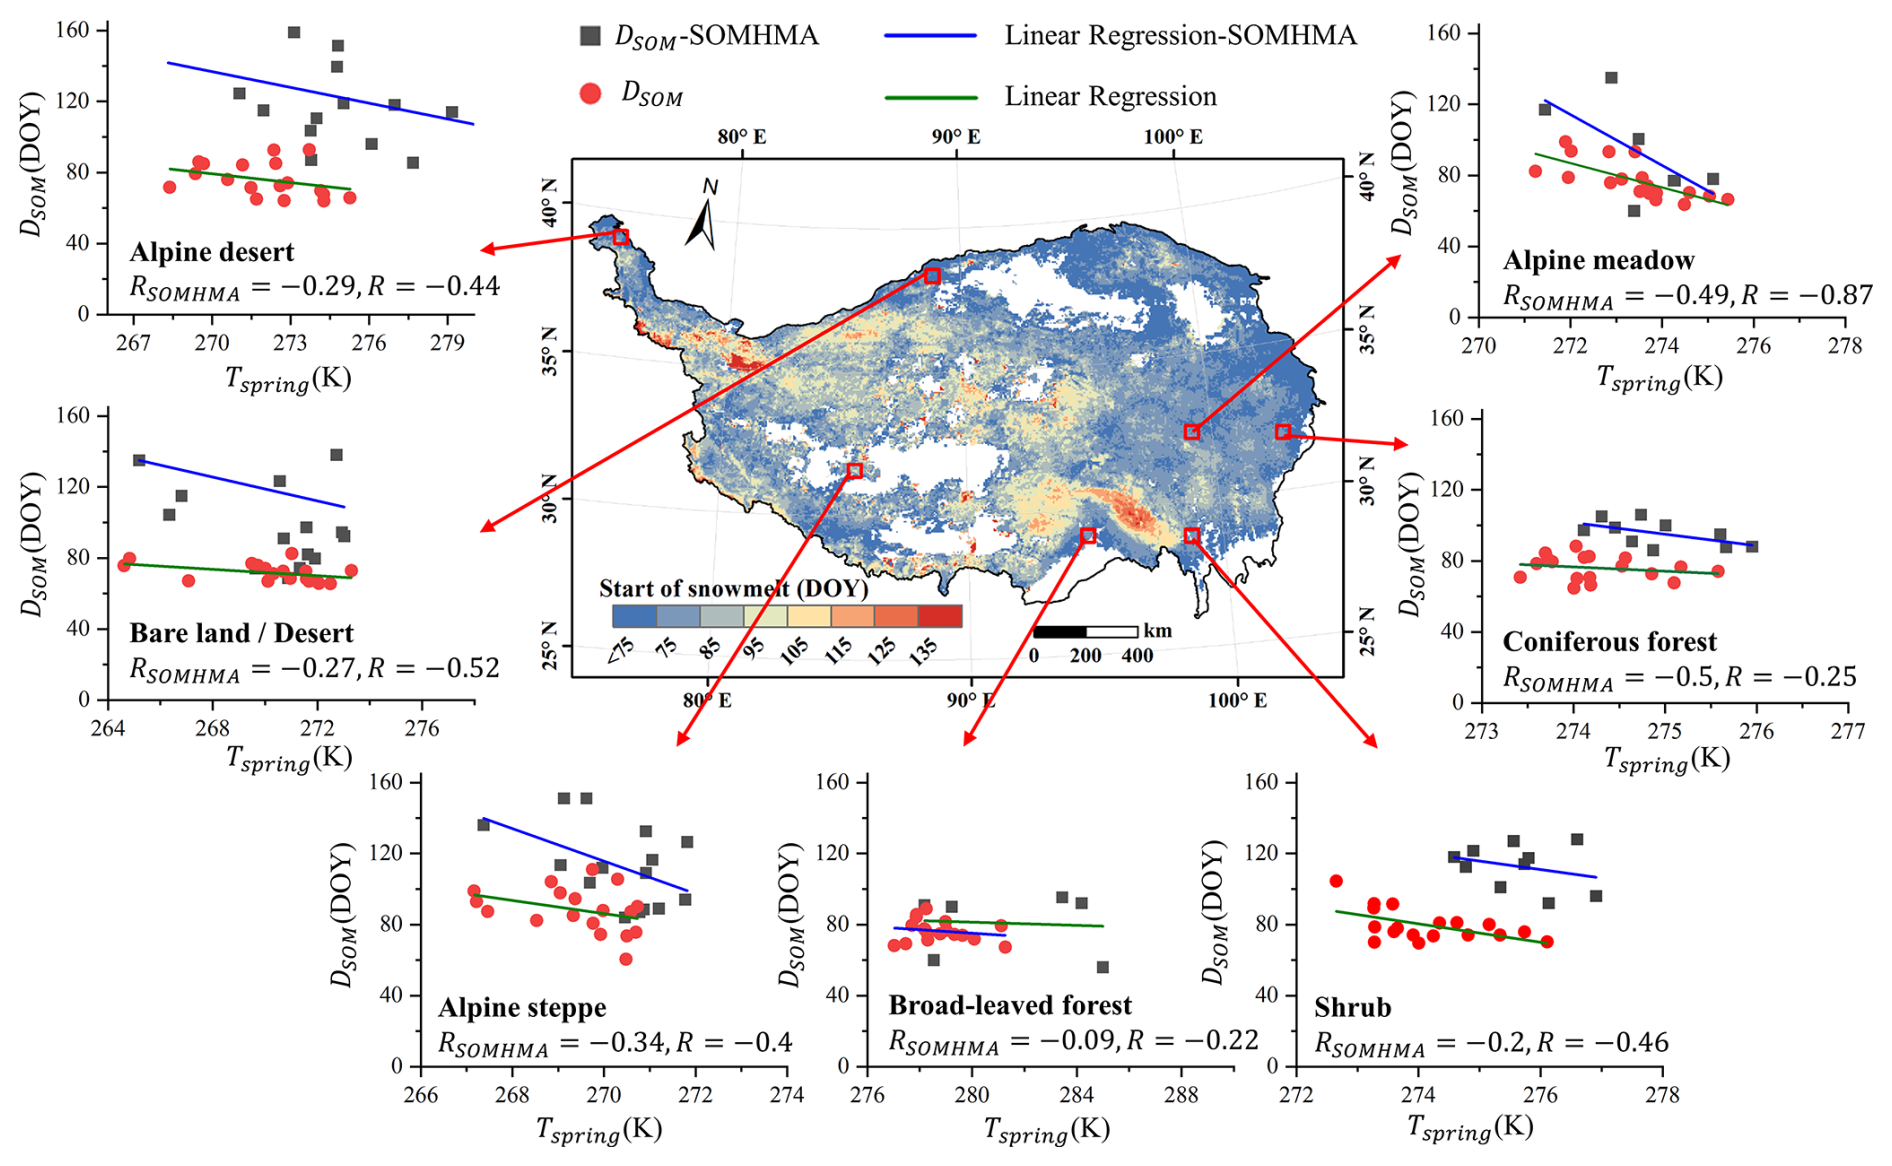
Figure 8Relevance between the average DSOM and mean April temperature in a sample area of each land cover type.
4.2 Response of vegetation to snowmelt
In this study, the time difference between DGU and DSOM was defined as ΔD. This metric can have both positive and negative values, each with different implications. A positive ΔD indicates the time it takes for vegetation to respond to snowmelt. On the TP, ΔD was predominantly positive, with an average of 38.5 d. This suggests that vegetation response to snowmelt typically involves a delay of nearly 1 month. In contrast, response times are generally shorter in other regions. ΔD in the high Arctic, Alaska, and Finland averaged 3 weeks (Cooper et al., 2011), 14.9 d (Zheng et al., 2022), and 5–13 d (Manninen et al., 2019), respectively. They were shorter than those on the TP, likely due to differences in snowpack characteristics. The blocking effect of the Himalayas and Karakoram mountains results in transient, shallow, and patchy snow on the TP (Lei et al., 2023). Consequently, the impact of snow on response times is particularly significant on the TP.
The influence of SStoG on response rate was notably widespread, with more SStoG shortening the response time in one-fourth of the TP. It can be inferred that reductions in ice volume and increases in the rain-to-snow ratio due to global warming may influence vegetation sensitivity to snowmelt (Tomaszewska et al., 2020). Snowmelt primarily affects soil moisture and nutrients, thus stimulating vegetative response to DSOM. Previous studies have emphasized the critical role of snowmelt in soil moisture. During early vegetation development, especially in alpine and cold regions, snow serves as an essential water source (Ernakovich et al., 2014; Li et al., 2020; Ma et al., 2024). This is evident in Fig. 7, where regions dominated by SStoG were more extensive than those dominated by Pspring. Edwards et al. (2007) observed that nitrogen is leached from the snow layer during snowmelt and combines with nitrogen released from mineralization to form a pulse of inorganic nitrogen beneath the snow. This results in a peak in available post-snowmelt. As alpine vegetation typically prefers as a nitrogen source, snowmelt meets this need (Broadbent et al., 2021). Additionally, the insulating effect of snow on vegetation diminishes after melting (Rixen et al., 2022). For instance, Starr and Oberbauer (2003) measured solar radiation at different snow depths in the northern foothills of the Brooks Mountain Range, Alaska, finding that light levels were reduced by 20 %–40 % under 10 cm of snow and declined by up to 70 % under 20 cm compared to bare ground. Thus, future remote sensing efforts should aim to quantify the snow's shielding effect to better understand vegetation response mechanisms.
The vegetation response to DSOM is influenced not only by snowmelt but also by meteorological conditions. Temperature and precipitation, as primary factors of DGU, significantly affect the response rate on the TP, accounting for 23.5 % and 28.8 %, respectively (Fig. 6). Precipitation provides essential water for vegetation, enabling a swift return to growth post-snowmelt. Temperature, on the other hand, impacts the heat required for vegetation growth and accelerates snowmelt, thereby supplying water and nutrients (Liu et al., 2021). Higher temperature can thus enhance DGU and shorten response time (Fig. 5a). However, elevated temperatures may also advance DSOM (Mioduszewski et al., 2014; Mioduszewski et al., 2015). Due to the differential effects of temperature on DSOM and DGU, both a positive and a negative correlation between Tspring and ΔD were observed at local scales (Fig. 6a). Statistical analysis shows that positively correlated pixels are typically found in southern regions with an average Tspring of 271.19 K, while negatively correlated areas are in northern regions with an average Tspring of 269.84 K. In warmer regions with mean annual temperatures above freezing, spring temperature correlates negatively with DSOM () and DGU (), indicating that temperature primarily influences snowmelt rather than vegetation growth, thus extending response times. In colder regions increased temperatures can reduce cold stress on vegetation, resulting in a larger effect on DGU (). However, consistent sub-freezing temperatures do not significantly lead to later , which is similar with DGU). In summary, the relationship between temperature and response time is modulated by the magnitudes of their respective influences at the local scale.
Furthermore, the primary factors controlling response time varied across regions but exhibited a clear regional distribution. Previous studies have indicated that in arid areas, DGU is more sensitive to water availability, especially in the central and western TP, while DGU shows a more significant negative correlation with temperature in the eastern TP, which experiences wetter springs (Piao et al., 2019; Shen et al., 2022). Despite differences in dependent variables, this conclusion remains consistent (Fig. 7b). In arid regions, where water is the main limiting factor, ΔD is predominantly controlled by snowmelt. In contrast, in humid regions where heat is the limiting factor, ΔD is mainly influenced by Tspring. When analyzing by vegetation type, Tspring was the dominant factor for higher vegetation (e.g., shrubs and forests), while lower vegetation (e.g., alpine steppes and meadows) is more affected by SStoG (Fig. 7c). Wind speed is high on the TP due to its special topography and elevation. This limited the snow accumulation on the branches for higher vegetation, and thus some parts of the vegetation are exposed to the outside environment. In contrast, the height of the lower vegetation is sometimes equal to the depth of the snow, which can partially or completely cover the vegetation (Tang et al., 2024). If the temperature rises, it will directly act on higher vegetation while heat will transfer slower to the low vegetation buffered by snow. If the snow melts, the melting water can directly affect the lower vegetation under the snow while the tall vegetation can only be used after absorption through the soil. This finding aligns with the observations of Zheng et al. (2022), who noted that soil temperature increased more rapidly in lower vegetation than in higher vegetation following snowmelt in Alaska, suggesting that snowmelt has a greater impact on lower vegetation. Our study, which compares these factors at the pixel scale, further substantiates this view and clarifies the spatial variations across the TP.
Specially, if ΔD is negative (i.e., DSOM occurs later than DGU), this situation is termed “false spring” (Chamberlain et al., 2019, 2021; Peterson and Abatzoglou, 2014). During false springs, once plant growth begins, frost tolerance significantly decreases. Continued exposure to freezing conditions can damage vegetation tissues and reduce productivity, leading to both ecological and economic impacts (Chamberlain et al., 2019). Zhu et al. (2019b) used the Spring Indices (SI-x) model to simulate the probability of false spring in China from 1950–2005 and projected it until 2100. Their findings revealed that the central TP exhibited the highest probability of false spring in China. Rising temperatures due to global warming are expected to further advance the DGU, thereby increasing the risk of false spring. Thus, false spring warrants further investigation in the TP, even though it was not the primary focus of this study.
Although previous studies have established a strong positive correlation between DSOM and DGU (An et al., 2022; Wang et al., 2015, 2018b; Xu et al., 2022a), the specific time differences between them in the TP remain unclear. Our study advances this understanding by examining the heterogeneity and mechanisms of vegetation response to snowmelt and reinforces the notion that snowmelt primarily affects arid regions and areas with low vegetation cover.
This study investigates the dynamic response of vegetation to snowmelt on the Tibetan Plateau from 2001–2018. Our results reveal that the effect of snowmelt on vegetation is not immediate, with a mean response lag of 38.5 d from DSOM to DGU. Notably, the false spring was observed in the northwestern TP, which warrants further exploration. As precipitation and snowmelt increase, the response time shortens. More complex than these factors, temperature exerts a greater influence on DGU than DSOM in colder regions, thus shortening the response time. Conversely, in warmer areas, the increased temperature has a stronger impact on DSOM, which lengthens the response time. Furthermore, vegetation in arid regions is more dependent on water than heat, and low-vegetation areas rely more on sub-snow habitats than external climatic factors. These findings provide valuable insights into how vegetation responds to snowmelt in the context of climate change, deepening our understanding of the relationship between snowmelt onset and green-up dates. This knowledge is essential for predicting vegetation phenology and managing ecosystem services under changing climate conditions. Future research should focus on the impacts of snow cover and false spring.
The data used in this study are all available upon request to the corresponding author.
The supplement related to this article is available online at https://doi.org/10.5194/bg-22-2637-2025-supplement.
JN: investigation, methodology, data curation, validation, visualization, writing (original draft). JC: conceptualization, methodology, formal analysis, writing (review and editing). YT: methodology, formal analysis. JinX: methodology, resources. JiaX: methodology, visualization. LD: formal analysis. QG: formal analysis. BY: formal analysis. JW: formal analysis. YH: conceptualization, project administration, funding acquisition, validation, resources, formal analysis, writing (review and editing).
The contact author has declared that none of the authors has any competing interests.
Publisher's note: Copernicus Publications remains neutral with regard to jurisdictional claims made in the text, published maps, institutional affiliations, or any other geographical representation in this paper. While Copernicus Publications makes every effort to include appropriate place names, the final responsibility lies with the authors.
This study was supported by the National Natural Science Foundation of China (grant nos. 42071306, 42471143). W9e also thank the National Tibetan Plateau Data Center, the Climate Data Store, and the Science Data Bank for providing the required data.
This research has been supported by the Foundation for Innovative Research Groups of the National Natural Science Foundation of China (grant nos. 42071306 and 42471143).
This paper was edited by David Medvigy and reviewed by Fandong Meng and Mikel Moriana-Armendariz.
An, S., Zhang, X., and Ren, S.: Spatial Difference between Temperature and Snowfall Driven Spring Phenology of Alpine Grassland Land Surface Based on Process-Based Modeling on the Qinghai-Tibet Plateau, Remote Sens.-Basel, 14, 1273, https://doi.org/10.3390/rs14051273, 2022.
Bibi, S., Wang, L., Li, X. P., Zhou, J., Chen, D. L., and Yao, T. D.: Climatic and associated cryospheric, biospheric, and hydrological changes on the Tibetan Plateau: a review, Int. J. Climatol., 38, E1–E17, https://doi.org/10.1002/joc.5411, 2018.
Broadbent, A. A. D., Snell, H. S. K., Michas, A., Pritchard, W. J., Newbold, L., Cordero, I., Goodall, T., Schallhart, N., Kaufmann, R., Griffiths, R. I., Schloter, M., Bahn, M., and Bardgett, R. D.: Climate change alters temporal dynamics of alpine soil microbial functioning and biogeochemical cycling via earlier snowmelt, ISME J., 15, 2264–2275, https://doi.org/10.1038/s41396-021-00922-0, 2021.
Chamberlain, C. J., Cook, B. I., de Cortazar-Atauri, I. G., and Wolkovich, E. M.: Rethinking false spring risk, Glob. Change Biol., 25, 2209–2220, https://doi.org/10.1111/gcb.14642, 2019.
Chamberlain, C. J., Cook, B. I., Morales-Castilla, I., and Wolkovich, E. M.: Climate change reshapes the drivers of false spring risk across European trees, New Phytol., 229, 323–334, https://doi.org/10.1111/nph.16851, 2021.
Chu, Q. S., Liu, Y. J., Peng, C. Y., Zhang, Y. L., Cernava, T., Qiong, L., Zhou, Y. H., Siddiqui, J. A., Ghani, M. I., Wang, Q. R., Liu, Y., and Chen, X. Y.: Invasive alien plants in the Qinghai-Tibetan Plateau (China): Current state and future predictions, Ecol. Indic., 166, 112448, https://doi.org/10.1016/j.ecolind.2024.112488, 2024.
Cooper, E. J., Dullinger, S., and Semenchuk, P.: Late snowmelt delays plant development and results in lower reproductive success in the High Arctic, Plant Sci., 180, 157–167, https://doi.org/10.1016/j.plantsci.2010.09.005, 2011.
Diao, C., Liu, Y., Zhao, L., Zhuo, G., and Zhang, Y. Q.: Regional-scale vegetation-climate interactions on the Qinghai-Tibet Plateau, Ecol. Inform., 65, 101413, https://doi.org/10.1016/j.ecoinf.2021.101413, 2021.
Dong, L., Zhou, H., Xu, J., Tang, Y., Teng, X., Ni, J., Yu, B., Wu, J., and Huang, Y.: BI or IB: Which Better Generates High Spatiotemporal Resolution NDSI by Fusing Sentinel-2A/B and MODIS Data?, IEEE J. Sel. Top. Appl., 17, 3314–3333, https://doi.org/10.1109/jstars.2023.3347202, 2024.
Drobot, S. D. and Anderson, M. R.: An improved method for determining snowmelt onset dates over Arctic sea ice using scanning multichannel microwave radiometer and Special Sensor Microwave/Imager data, J. Geophys. Res.-Atmos., 106, 24033–24049, https://doi.org/10.1029/2000jd000171, 2001.
Edwards, A. C., Scalenghe, R., and Freppaz, M.: Changes in the seasonal snow cover of alpine regions and its effect on soil processes: A review, Quatern. Int., 162, 172–181, https://doi.org/10.1016/j.quaint.2006.10.027, 2007.
Ernakovich, J. G., Hopping, K. A., Berdanier, A. B., Simpson, R. T., Kachergis, E. J., Steltzer, H., and Wallenstein, M. D.: Predicted responses of arctic and alpine ecosystems to altered seasonality under climate change, Glob. Change Biol., 20, 3256–3269, https://doi.org/10.1111/gcb.12568, 2014.
Fontrodona-Bach, A., Schaefli, B., Woods, R., Teuling, A. J., and Larsen, J. R.: NH-SWE: Northern Hemisphere Snow Water Equivalent dataset based on in situ snow depth time series, Earth Syst. Sci. Data, 15, 2577–2599, https://doi.org/10.5194/essd-15-2577-2023, 2023.
Grippa, M., Mognard, N., and Le Toan, T.: Comparison between the interannual variability of snow parameters derived from SSM/I and the Ob river discharge, Remote Sens. Environ., 98, 35–44, https://doi.org/10.1016/j.rse.2005.06.001, 2005.
He, J., Yang, K., Tang, W. J., Lu, H., Qin, J., Chen, Y. Y., and Li, X.: The first high-resolution meteorological forcing dataset for land process studies over China, Sci. Data, 7, 25, https://doi.org/10.1038/s41597-020-0369-y, 2020.
Howell, S. E. L., Assini, J., Young, K. L., Abnizova, A., and Derksen, C.: Snowmelt variability in Polar Bear Pass, Nunavut, Canada, from QuikSCAT: 2000–2009, Hydrol. Process., 26, 3477–3488, https://doi.org/10.1002/hyp.8365, 2012.
Huang, K., Zu, J., Zhang, Y., Cong, N., Liu, Y., and Chen, N.: Impacts of snow cover duration on vegetation spring phenology over the Tibetan Plateau, J. Plant Ecol., 12, 583–592, https://doi.org/10.1093/jpe/rty051, 2019.
Lei, Y., Pan, J., Xiong, C., Jiang, L., and Shi, J.: Snow depth and snow cover over the Tibetan Plateau observed from space in against ERA5: matters of scale, Clim. Dynam., 60, 1523–1541, https://doi.org/10.1007/s00382-022-06376-0, 2023.
Li, Y., Li, T., Liu, D., Fu, Q., Hou, R., Ji, Y., and Cui, S.: Estimation of snow meltwater based on the energy and mass processes during the soil thawing period in seasonally frozen soil areas, Agr. Forest Meteorol., 292, 15, https://doi.org/10.1016/j.agrformet.2020.108138, 2020.
Li, Y. Z., Qin, X., Liu, Y. S., Jin, Z. Z., Liu, J., Wang, L. H., and Chen, J. Z.: Evaluation of Long-Term and High-Resolution Gridded Precipitation and Temperature Products in the Qilian Mountains, Qinghai-Tibet Plateau, Frontiers in Environmental Science, 10, 906821, https://doi.org/10.3389/fenvs.2022.906821, 2022.
Liang, Y. and Song, W.: Ecological and Environmental Effects of Land Use and Cover Changes on the Qinghai-Tibetan Plateau: A Bibliometric Review, Land, 11, 2163, https://doi.org/10.3390/land11122163, 2022.
Liu, X. G., Chen, Y. N., Li, Z., Li, Y. P., Zhang, Q. F., and Zan, M.: Driving Forces of the Changes in Vegetation Phenology in the Qinghai-Tibet Plateau, Remote Sens.-Basel, 13, 4952, https://doi.org/10.3390/rs13234952, 2021.
Ma, W., Xiao, P., Zhang, X., Song, Y., Ma, T., and Ye, L.: Retrieving snow wetness based on surface and volume scattering simulation, ISPRS J. Photogramm., 169, 17–28, https://doi.org/10.1016/j.isprsjprs.2020.08.021, 2020.
Ma, W., Hu, J., Zhang, B., Guo, J., Zhang, X., and Wang, Z.: Later-melting rather than thickening of snowpack enhance the productivity and alter the community composition of temperate grassland, Sci. Total Environ., 923, 171440, https://doi.org/10.1016/j.scitotenv.2024.171440, 2024.
Manninen, T., Aalto, T., Markkanen, T., Peltoniemi, M., Böttcher, K., Metsämäki, S., Anttila, K., Pirinen, P., Leppänen, A., and Arslan, A. N.: Monitoring changes in forestry and seasonal snow using surface albedo during 1982–2016 as an indicator, Biogeosciences, 16, 223–240, https://doi.org/10.5194/bg-16-223-2019, 2019.
Mioduszewski, J. R., Rennermalm, A. K., Robinson, D. A., and Mote, T. L.: Attribution of snowmelt onset in Northern Canada, J. Geophys. Res.-Atmos., 119, 9638–9653, https://doi.org/10.1002/2013jd021024, 2014.
Mioduszewski, J. R., Rennermalm, A. K., Robinson, D. A., and Wang, L.: Controls on Spatial and Temporal Variability in Northern Hemisphere Terrestrial Snow Melt Timing, 1979–2012, J. Climate, 28, 2136–2153, https://doi.org/10.1175/jcli-d-14-00558.1, 2015.
Panday, P. K., Frey, K. E., and Ghimire, B.: Detection of the timing and duration of snowmelt in the Hindu Kush-Himalaya using QuikSCAT, 2000–2008, Environ. Res. Lett., 6, 024007, https://doi.org/10.1088/1748-9326/6/2/024007, 2011.
Peng, S., Piao, S., Ciais, P., Fang, J., and Wang, X.: Change in winter snow depth and its impacts on vegetation in China, Glob. Change Biol., 16, 3004–3013, https://doi.org/10.1111/j.1365-2486.2010.02210.x, 2010.
Peterson, A. G. and Abatzoglou, J. T.: Observed changes in false springs over the contiguous United States, Geophys. Res. Lett., 41, 2156–2162, https://doi.org/10.1002/2014gl059266, 2014.
Piao, S., Liu, Q., Chen, A., Janssens, I. A., Fu, Y., Dai, J., Liu, L., Lian, X., Shen, M., and Zhu, X.: Plant phenology and global climate change: Current progresses and challenges, Glob. Change Biol., 25, 1922–1940, https://doi.org/10.1111/gcb.14619, 2019.
Potter, C.: Snowmelt timing impacts on growing season phenology in the northern range of Yellowstone National Park estimated from MODIS satellite data, Landscape Ecol., 35, 373–388, https://doi.org/10.1007/s10980-019-00951-3, 2020.
Ren, Y., Zhang, L., Yang, K., Li, Z., Yin, R., Tan, B., Wang, L., Liu, Y., Li, H., You, C., Liu, S., Xu, Z., and Kardol, P.: Short-term effects of snow cover manipulation on soil bacterial diversity and community composition, Sci. Total Environ., 741, 140454, https://doi.org/10.1016/j.scitotenv.2020.140454, 2020.
Rixen, C., Høye, T. T., Macek, P., Aerts, R., Alatalo, J. M., Anderson, J. T., Arnold, P. A., Barrio, I. C., Bjerke, J. W., Björkman, M. P., Blok, D., Blume-Werry, G., Boike, J., Bokhorst, S., Carbognani, M., Christiansen, C. T., Convey, P., Cooper, E. J., Cornelissen, J. H. C., Coulson, S. J., Dorrepaal, E., Elberling, B., Elmendorf, S. C., Elphinstone, C., Forte, T. A. G. W., Frei, E. R., Geange, S. R., Gehrmann, F., Gibson, C., Grogan, P., Halbritter, A. H., Harte, J., Henry, G. H. R., Inouye, D. W., Irwin, R. E., Jespersen, G., Jónsdóttir, I. S., Jung, J. Y., Klinges, D. H., Kudo, G., Lämsä, J., Lee, H., Lembrechts, J. J., Lett, S., Lynn, J. S., Mann, H. M. R., Mastepanov, M., Morse, J., Myers-Smith, I. H., Olofsson, J., Paavola, R., Petraglia, A., Phoenix, G. K., Semenchuk, P., Siewert, M. B., Slatyer, R., Spasojevic, M. J., Suding, K., Sullivan, P., Thompson, K. L., Väisänen, M., Vandvik, V., Venn, S., Walz, J., Way, R., Welker, J. M., Wipf, S., and Zong, S.: Winters are changing: snow effects on Arctic and alpine tundra ecosystems, Arct. Sci., 8, 572–608, 2022.
Semmens, K. A. and Ramage, J. M.: Recent changes in spring snowmelt timing in the Yukon River basin detected by passive microwave satellite data, The Cryosphere, 7, 905–916, https://doi.org/10.5194/tc-7-905-2013, 2013.
Shen, M. G., Zhang, G. X., Cong, N., Wang, S. P., Kong, W. D., and Piao, S. L.: Increasing altitudinal gradient of spring vegetation phenology during the last decade on the Qinghai-Tibetan Plateau, Agr. Forest Meteorol., 189, 71–80, https://doi.org/10.1016/j.agrformet.2014.01.003, 2014.
Shen, M. G., Piao, S. L., Dorji, T., Liu, Q., Cong, N., Chen, X. Q., An, S., Wang, S. P., Wang, T., and Zhang, G. X.: Plant phenological responses to climate change on the Tibetan Plateau: research status and challenges, Natl. Sci. Rev., 2, 454–467, https://doi.org/10.1093/nsr/nwv058, 2015.
Shen, M., Wang, S., Jiang, N., Sun, J., Cao, R., Ling, X., Fang, B., Zhang, L., Zhang, L., Xu, X., Lv, W., Li, B., Sun, Q., Meng, F., Jiang, Y., Dorji, T., Fu, Y., Iler, A., Vitasse, Y., Steltzer, H., Ji, Z., Zhao, W., Piao, S., and Fu, B.: Plant phenology changes and drivers on the Qinghai-Tibetan Plateau, Nat. Rev. Earth Environ., 3, 633–651, https://doi.org/10.1038/s43017-022-00317-5, 2022.
Smith, T., Bookhagen, B., and Rheinwalt, A.: Spatiotemporal patterns of High Mountain Asia's snowmelt season identified with an automated snowmelt detection algorithm, 1987–2016, The Cryosphere, 11, 2329–2343, https://doi.org/10.5194/tc-11-2329-2017, 2017.
Stanislaw, K., Pawel, C., Danuta, K., and Robert, P.: Variability and changes of the height and duration of snow cover on the Gasienicowa Glade (Tatras), Int. J. Climatol., 43, 7018–7031, https://doi.org/10.1002/joc.8249, 2023.
Starr, G. and Oberbauer, S. F.: Photosynthesis of arctic evergreens under snow: Implications for tundra ecosystem carbon balance, Ecology, 84, 1415–1420, https://doi.org/10.1890/02-3154, 2003.
Tang, Y., Chen, J., Xu, J., Xu, J., Ni, J., Zheng, Z., Yu, B., Wu, J., and Huang, Y.: The Impact of Autumn Snowfall on Vegetation Indices and Autumn Phenology Estimation, Remote Sens.-Basel, 16, 4783, https://doi.org/10.3390/rs16244783, 2024.
Tomaszewska, M. A., Nguyen, L. H., and Henebry, G. M.: Land surface phenology in the highland pastures of montane Central Asia: Interactions with snow cover seasonality and terrain characteristics, Remote Sens. Environ., 240, 111675, https://doi.org/10.1016/j.rse.2020.111675, 2020.
Wang, K., Zhang, L., Qiu, Y., Ji, L., Tian, F., Wang, C., and Wang, Z.: Snow effects on alpine vegetation in the Qinghai-Tibetan Plateau, Int. J. Digit. Earth, 8, 56–73, https://doi.org/10.1080/17538947.2013.848946, 2015.
Wang, X., Wu, C., Peng, D., Gonsamo, A., and Liu, Z.: Snow cover phenology affects alpine vegetation growth dynamics on the Tibetan Plateau: Satellite observed evidence, impacts of different biomes, and climate drivers, Agr. Forest Meteorol., 256, 61–74, https://doi.org/10.1016/j.agrformet.2018.03.004, 2018a.
Wang, X. Y., Wang, T., Guo, H., Liu, D., Zhao, Y. T., Zhang, T. T., Liu, Q., and Piao, S. L.: Disentangling the mechanisms behind winter snow impact on vegetation activity in northern ecosystems, Glob. Change Biol., 24, 1651–1662, https://doi.org/10.1111/gcb.13930, 2018b.
Wang, X., Xiao, J., Li, X., Cheng, G., Ma, M., Zhu, G., Arain, M. A., Black, T. A., and Jassal, R. S.: No trends in spring and autumn phenology during the global warming hiatus, Nat. Commun., 10, 2389, https://doi.org/10.1038/s41467-019-10235-8, 2019.
Wu, Y., Xiao, P., Zhang, X., Liu, H., Dong, Y., and Feng, L.: Effects of Snow Cover on Spring Vegetation Phenology Vary With Temperature Gradient Across the Pan-Arctic, J. Geophys. Res.-Biogeo., 128, e2022JG007183, https://doi.org/10.1029/2022jg007183, 2023.
Xiong, C., Shi, J., Cui, Y., and Peng, B.: Snowmelt Pattern Over High-Mountain Asia Detected From Active and Passive Microwave Remote Sensing, IEEE Geosci. Remote S., 14, 1096–1100, https://doi.org/10.1109/lgrs.2017.2698448, 2017.
Xiong, T., Zhang, H., Zhao, J., Zhang, Z., Guo, X., Zhu, Z., and Shan, Y.: Diverse Responses of Vegetation Dynamics to Snow Cover Phenology over the Boreal Region, Forests, 10, 376, https://doi.org/10.3390/f10050376, 2019.
Xu, J. Y., Tang, Y., Xu, J. H., Shu, S., Yu, B. L., Wu, J. P., and Huang, Y.: Impact of Snow Cover Phenology on the Vegetation Green-Up Date on the Tibetan Plateau, Remote Sens.-Basel, 14, 583–592, https://doi.org/10.3390/rs14163909, 2022a.
Xu, J. Y., Tang, Y., Xu, J. H., Chen, J., Bai, K. X., Shu, S., Yu, B. L., Wu, J. P., and Huang, Y.: Evaluation of Vegetation Indexes and Green-Up Date Extraction Methods on the Tibetan Plateau, Remote Sens.-Basel, 14, 3160, https://doi.org/10.3390/rs14133160, 2022b.
Xu, J., Tang, Y., Dong, L., Wang, S., Yu, B., Wu, J., Zheng, Z., and Huang, Y.: Temperature-dominated spatiotemporal variability in snow phenology on the Tibetan Plateau from 2002 to 2022, The Cryosphere, 18, 1817–1834, https://doi.org/10.5194/tc-18-1817-2024, 2024.
Yan, D., Ma, N., and Zhang, Y.: Development of a fine-resolution snow depth product based on the snow cover probability for the Tibetan Plateau: Validation and spatial–temporal analyses, J. Hydrol., 604, 127027, https://doi.org/10.1016/j.jhydrol.2021.127027, 2022.
Yang, M. X., Wang, X. J., Pang, G. J., Wang, G. N., and Liu, Z. C.: The Tibetan Plateau cryosphere: Observations and model simulations for current status and recent changes, Earth Sci. Rev., 190, 353–369, https://doi.org/10.1016/j.earscirev.2018.12.018, 2019.
Yang, T., Li, Q., Zou, Q., Hamdi, R., Cui, F. Q., and Li, L. H.: Impact of Snowpack on the Land Surface Phenology in the Tianshan Mountains, Central Asia, Remote Sens.-Basel, 14, 3462, https://doi.org/10.3390/rs14143462, 2022.
Yu, H. B., Deane, D. C., Zhang, Y. L., Li, S. C., Miao, S. Y., Xie, G. W., Yin, X., and Favre, A.: Integrating multiple indices of geobiodiversity reveals a series of regional species-rich areas worthy of conservation in the region of the Qinghai-Tibet Plateau, Biol. Conserv., 261, 109238, https://doi.org/10.1016/j.biocon.2021.109238, 2021.
Zhang, X. Y., Friedl, M. A., Schaaf, C. B., Strahler, A. H., Hodges, J. C. F., Gao, F., Reed, B. C., and Huete, A.: Monitoring vegetation phenology using MODIS, Remote Sens. Environ., 84, 471–475, https://doi.org/10.1016/s0034-4257(02)00135-9, 2003.
Zhang, Q., Kong, D. D., Shi, P. J., Singh, V. P., and Sun, P.: Vegetation phenology on the Qinghai-Tibetan Plateau and its response to climate change (1982–2013), Agr. Forest Meteorol., 248, 408–417, https://doi.org/10.1016/j.agrformet.2017.10.026, 2018a.
Zhang, Y., Sherstiukov, A. B., Qian, B., Kokelj, S. V., and Lantz, T. C.: Impacts of snow on soil temperature observed across the circumpolar north, Environ. Res. Lett., 13, 044012, https://doi.org/10.1088/1748-9326/aab1e7, 2018b.
Zhang, J., Chen, S. Z., Wu, Z. F., and Fu, Y. H.: Review of vegetation phenology trends in China in a changing climate, Prog. Phys. Geog., 46, 829–845, https://doi.org/10.1177/03091333221114737, 2022a.
Zhang, Q., Yuan, R. Y., Singh, V. P., Xu, C. Y., Fan, K. K., Shen, Z. X., Wang, G., and Zhao, J. Q.: Dynamic vulnerability of ecological systems to climate changes across the Qinghai-Tibet Plateau, China, Ecol. Indic., 134, 108483, https://doi.org/10.1016/j.ecolind.2021.108483, 2022b.
Zhao, D. S., Wu, S. H., Yin, Y. H., and Yin, Z. Y.: Vegetation distribution on Tibetan Plateau under climate change scenario, Reg. Environ. Change, 11, 905–915, https://doi.org/10.1007/s10113-011-0228-7, 2011.
Zhao, Q., Hao, X., Wang, J., Luo, S., Shao, D., Li, H., Feng, T., and Zhao, H.: Snow Cover Phenology Change and Response to Climate in China during 2000–2020, Remote Sens.-Basel, 14, 3936, https://doi.org/10.3390/rs14163936, 2022.
Zheng, L., Zhou, C., Zhang, T., Liang, Q., and Wang, K.: Recent changes in pan-Antarctic region surface snowmelt detected by AMSR-E and AMSR2, The Cryosphere, 14, 3811–3827, https://doi.org/10.5194/tc-14-3811-2020, 2020.
Zheng, J., Jia, G., and Xu, X.: Earlier snowmelt predominates advanced spring vegetation greenup in Alaska, Agr. Forest Meteorol., 315, 108828, https://doi.org/10.1016/j.agrformet.2022.108828, 2022.
Zhu, L., Ives, A. R., Zhang, C., Guo, Y., and Radeloff, V. C.: Climate change causes functionally colder winters for snow cover-dependent organisms, Nat. Clim. Change, 9, 886–893, https://doi.org/10.1038/s41558-019-0588-4, 2019a.
Zhu, L. K., Meng, J. J., Li, F., and You, N. S.: Predicting the patterns of change in spring onset and false springs in China during the twenty-first century, Int. J. Biometeorol., 63, 591–606, https://doi.org/10.1007/s00484-017-1456-4, 2019b.
Zou, Y. F., Sun, P., Ma, Z. C., Lv, Y. F., and Zhang, Q.: Snow Cover in the Three Stable Snow Cover Areas of China and Spatio-Temporal Patterns of the Future, Remote Sens.-Basel, 14, 3098, https://doi.org/10.3390/rs14133098, 2022.