the Creative Commons Attribution 4.0 License.
the Creative Commons Attribution 4.0 License.
 | 10 Jul 2025
Responses of riverine dissolved organic matter to damming in two distinct hydrological regimes in northern Spain
Edurne Estévez
José Barquín Ortiz
Iberian rivers are characterized by flow regimes with high seasonal flow variation. They also host one-fifth of Europe's reservoirs for hydropower generation, irrigation, or water supply needs, and thus many rivers in this region have heavily altered flow regimes. Such flow conditions also alter the natural dynamics of dissolved organic matter (DOM), which likely has implications for carbon cycling due to changed conditions for the transformation, transportation, production, and storage of carbon. Here we looked into the effects of flow alteration on the DOM regime, i.e. the seasonal variation in DOM concentration and composition, in 20 rivers belonging to two different natural (reference) flow regimes (i.e. Mediterranean and Atlantic) in northern Spain. To further investigate which flow regime components influence DOM properties, we linked the observed seasonal shifts in DOM composition to a range of hydrological indices. We found that Atlantic rivers with a natural flow regime tended to have lower annual mean dissolved organic carbon (DOC) concentrations than their altered equivalents; this flow alteration trend is weakly mirrored in Mediterranean rivers. We did not observe much difference in annual average DOM composition due to flow alteration in either Atlantic or Mediterranean rivers. However, the seasonal variation in DOM composition was lower in altered Atlantic rivers compared to natural ones. This flow alteration effect on the DOM regime was not as distinctive in Mediterranean rivers, which showed a higher diversity of DOM regimes across rivers. We linked the lack of seasonal variation in DOM composition in flow-altered rivers mainly to the prevention of transmission of upstream-sourced DOM from the reservoirs. It appears that in our study area, reservoirs mostly act as a temporally homogenizing buffer, averaging out naturally occurring shifts in DOM composition by transiently storing upstream-sourced carbon inputs and subjecting them to bio- and photo-degradation, thus sending relatively invariable amounts of DOM further downstream. This effect of dams on DOM regimes appears robust across both Atlantic and Mediterranean regimes despite some heterogeneity of dam types and purposes, with potentially important consequences for riverine carbon cycling.
- Article
(4113 KB) - Full-text XML
-
Supplement
(1281 KB) - BibTeX
- EndNote


The structure and functioning of a river ecosystem are strongly tied to its flow regime (Poff et al., 2006). Climate and weather interacting with catchment properties such as topography, geology, and land cover are the primary controls of natural flow dynamics (Poff and Zimmerman, 2010), yet natural flows are altered globally by a range of human interventions, including the construction and operation of dams for irrigation, navigation, and hydropower generation (Stewardson et al., 2017). Traditionally, flow regimes are described by five components: magnitude, frequency, duration, timing, and rate of change, and an altered flow regime is identified by the deviation of one or more of these components from its natural tendency (Poff et al., 1997). Given the natural diversity of flow regimes and the many ways in which they can be modified by dam operations (McManamay et al., 2012; Nadon et al., 2015), the prediction of the ecological consequences of flow alterations is not a trivial task.
Dissolved organic matter (DOM) is the largest pool of organic carbon and the main energy source for bacteria in aquatic environments (Battin et al., 2008; Riedel et al., 2012). DOM is chemically highly complex because of (i) the numerous sources it originates from and (ii) the various biological and chemical processes it is subjected to during transport along the riverine network (Jaffé et al., 2008). Most of the DOM is of terrestrial origin, characterized by high aromaticity associated with humic acids (Jaffé et al., 2008), while only a small fraction is composed of highly reactive substances such as carbohydrates and proteins, which may have terrestrial as well as in-stream origins. This highly reactive fraction is often microbially degraded within minutes to hours of creation or entering the system, while the more recalcitrant terrestrial fraction is transported along the river for a longer time (Hansen et al., 2016; Kaplan et al., 2008). This linkage of DOM reactivity with residence time creates a compositional DOM continuum unfolding over space and time (Catalán et al., 2016; Peter et al., 2020).
Spatiotemporal variation in DOM composition must also be tied to the flow regime (Hayes et al., 2018). In natural rivers, the variability in DOM concentration and composition is linked to (i) activation of heterogeneous flow paths draining water from the terrestrial surrounding to the river channel, especially during intense hydrologic events induced by snowmelt or rain (Raymond et al., 2016; Raymond and Saiers, 2010), and (ii) the residence time of the DOM within the riverine network that is determined by discharge (Peter et al., 2020). High-discharge spates may be “hot moments” for the mobilization and transport of terrestrial DOM (McClain et al., 2003), yet the decreased residence times in the river corridor may limit its microbial transformation. In contrast, during base-flow conditions, such terrestrial material is more dependent on soil processes and subsurface flow paths. Moreover, following high-flow events, discharge and concentration (or composition) of terrestrial DOM undergo uncoupling due to the limited terrestrial storage capacity and exhaustion of DOM reservoirs along drainage flow paths (Andrea et al., 2006; Wagner et al., 2019). Such hysteresis in discharge–concentration relationships combined with dynamic residence times prevents the simple translation of flow regimes into “DOM regimes” (Andrea et al., 2006).
When flow dynamics are controlled by dams, flood extremes are minimized (Hayes et al., 2018) and water residence time increases due to the storage in the reservoirs, providing an opportunity to change the composition of DOM and altering the timing of its delivery to the downstream river (Xenopoulos et al., 2021). Recent studies indicate that DOM concentration and composition vary according to the dam operation and purpose, which also determines whether a reservoir acts as a source or sink of carbon (Chen et al., 2016; Kraus et al., 2011). A dam with sufficient residence time may dampen event-driven and seasonal terrestrial (allochthonous) signatures of DOM for downstream environments as the increased residence time in the reservoir enables photodegradation and biodegradation and may shift DOM composition towards a more autochthonous and more biolabile composition (Xenopoulos et al., 2021). The net effect of production, transformation, and loss of organic carbon in a reservoir (as in any river reach) depends on several variables, including the amount and composition of inflowing carbon, algal and bacterial activity, nutrient availability, temperature, and solar radiation (Kraus et al., 2011). Most of these seasonal biotic and abiotic factors are also associated with the river's natural flow regime, suggesting that the alteration of a specific flow regime may result in quite a specific DOM regime for the downstream river sections. Notably, temporal changes in DOM composition throughout the year, i.e. shifts in DOM composition (especially under the influence of flow alteration), have yet to be included in concepts of riverine carbon cycling.
Here, we study the effects of anthropogenic flow regime alterations produced by dams (which serve mainly hydropower and irrigation purposes) in rivers with two distinct natural (reference) flow regimes, namely, Atlantic and Mediterranean. Rivers were grouped into one of these two climate-zone-associated flow regime types depending on either observed flow conditions (for natural, unaltered rivers) or climate and landscape covariate classification (for those rivers altered by dams). Our objectives were to identify commonalities and differences in the response to dam-induced flow alteration across Atlantic and Mediterranean rivers with regard to (i) mean and (ii) seasonally induced variation in DOM concentration and composition over 1 year as descriptors of a river's DOM regime and (iii) the assessment of spatial similarity of flow alteration effects on DOM regimes across multiple rivers (Fig. 1). We hypothesize that DOM regimes are shaped by natural flow regimes but also reflect anthropogenic flow alteration. The natural reference flow regime expected for a river may constrain how a dam can impact the DOM regime. Alternatively, a dam could force a DOM regime irrespective of the underlying natural hydrology of a catchment, perhaps with more or less dependence on the specific dam and reservoir features. Given the high spatial and temporal variance of DOM composition, determining commonalities in the response of DOM regimes to dam-induced flow alteration could increase our understanding of the ecological consequences of a dam on the downstream river's structure and functioning and thus improve our ability to predict the effects on riverine carbon cycling.
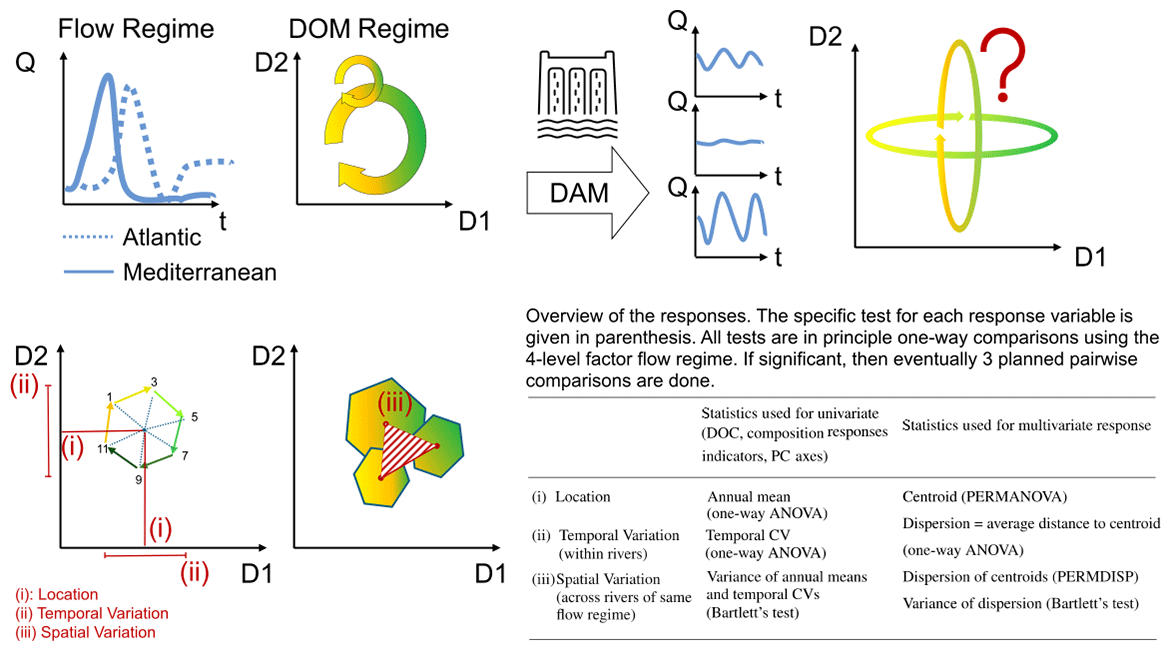
Figure 1Conceptual summary of the objectives and statistical pipeline. The upper row of graph panels shows a river`s hydrograph (shown as discharge Q over time t) translated into compositional shifts in DOM (shown as a circular shift in two-dimensional space that multiple descriptors of DOM chemistry could define). With the effect of a reservoir on a flow regime resulting in variously altered hydrographs, the consequences for the DOM regime remain unknown. The lower row illustrates how we investigated the effects on DOM regimes by looking at the quality and quantity of DOM from three different angles: (i) the annual mean DOM composition (location), (ii) the temporal variation on an annual timescale, and (iii) the spatial variation in various DOM regime descriptors across several rivers. Our choice of statistical method depended on whether a univariate or a multivariate response was used.
2.1 Study design and sampling strategy
Our study followed a control–impact design, comparing rivers with natural and altered flow regimes in two natural (reference) flow regime types in northern Spain (Figs. 1 and 2). Peñas and Barquín (2019) classified hydrologically un-impacted Spanish rivers into 20 hydrological classes using data from 282 gauged naturally flowing rivers and relevant environmental and hydrological drivers such as climate, topography, land cover, and geology. Using these discriminators, they defined natural equivalent flow regimes (in the sense of estimated pre-impact reference flow regimes) for rivers that are nowadays impacted by various types of flow alteration (Peñas et al., 2016). For our study, we selected 20 rivers within classes 13 and 10 of Peñas and Barquín (2019); in each class, we sampled 4 naturally flowing rivers and 6 rivers with altered flow regimes (where one altered Mediterranean river had to be removed). Sampling sites were distributed within six basins, but we excluded locations on main stems and – except for one site – no site's catchment was nested within another one to maintain spatial independence (Fig. 2). All sampling locations were second- to fourth-order rivers (Table S1 in the Supplement). For simplicity, the two (reference) flow regime types will be referred to as Atlantic and Mediterranean since class 13 is located in the Atlantic-type climatic region and class 10 in the Mediterranean-type climatic region of Spain, regardless of where these rivers discharge or which basin they belong to (Table 1, Fig. 2). Overall, in our study, the sampled sites – referred to as rivers for simplicity – belong to one of four flow regimes: natural Atlantic (nA), altered Atlantic (aA), natural Mediterranean (nM), and altered Mediterranean (aM).
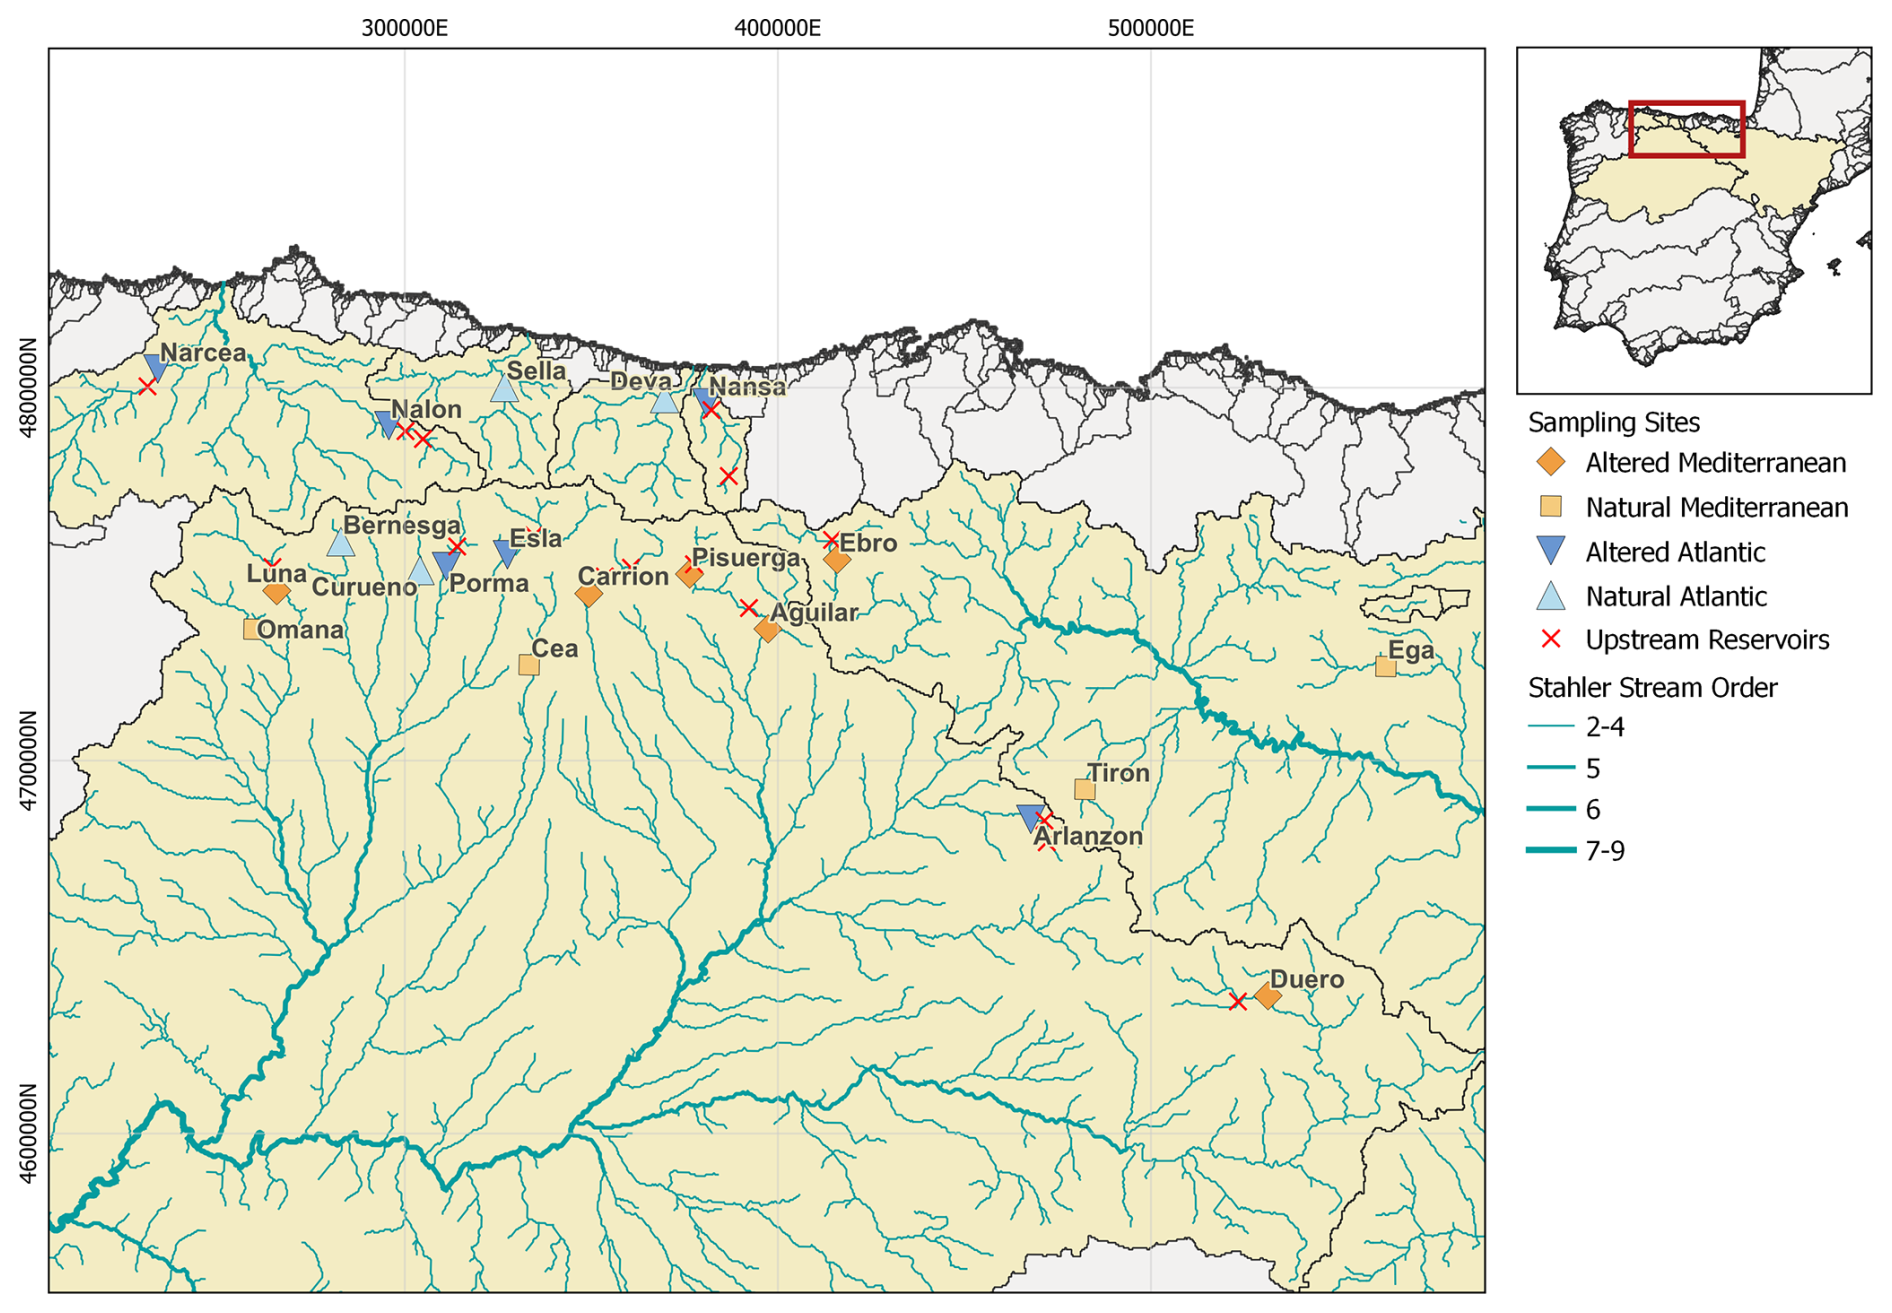
Figure 2Location of sampling sites in selected rivers with Atlantic (blue) and Mediterranean (orange) (reference) flow regimes in northern Spain. Light and dark shades of the colour represent rivers with natural and altered flow regimes, respectively. All sampling locations had spatially independent non-nested catchments, except Pisuerga nestled in Aguilar. The rivers and their basins were sourced from the HydroSHEDS database (Lehner and Grill, 2013).
Table 1Study design and environmental characteristics of the altered (a) and natural (n) Atlantic (A) and Mediterranean (M) flow regimes. The altered rivers encompass dams for various purposes and operations with varying reservoir volumes. Sampling sites were located at similar distances to the next upstream reservoir, yet some sites had multiple upstream reservoirs. The catchment of Pisuerga is nested within the catchment of Aguilar; all other sites have spatially independent non-nested catchments. Storage indices were taken from Pompeu et al. (2022) and show storage volume divided by average annual runoff. The last column reports the ecological status of the nearest reservoir located upstream according to the WISE WFD database (wfd, 2021).
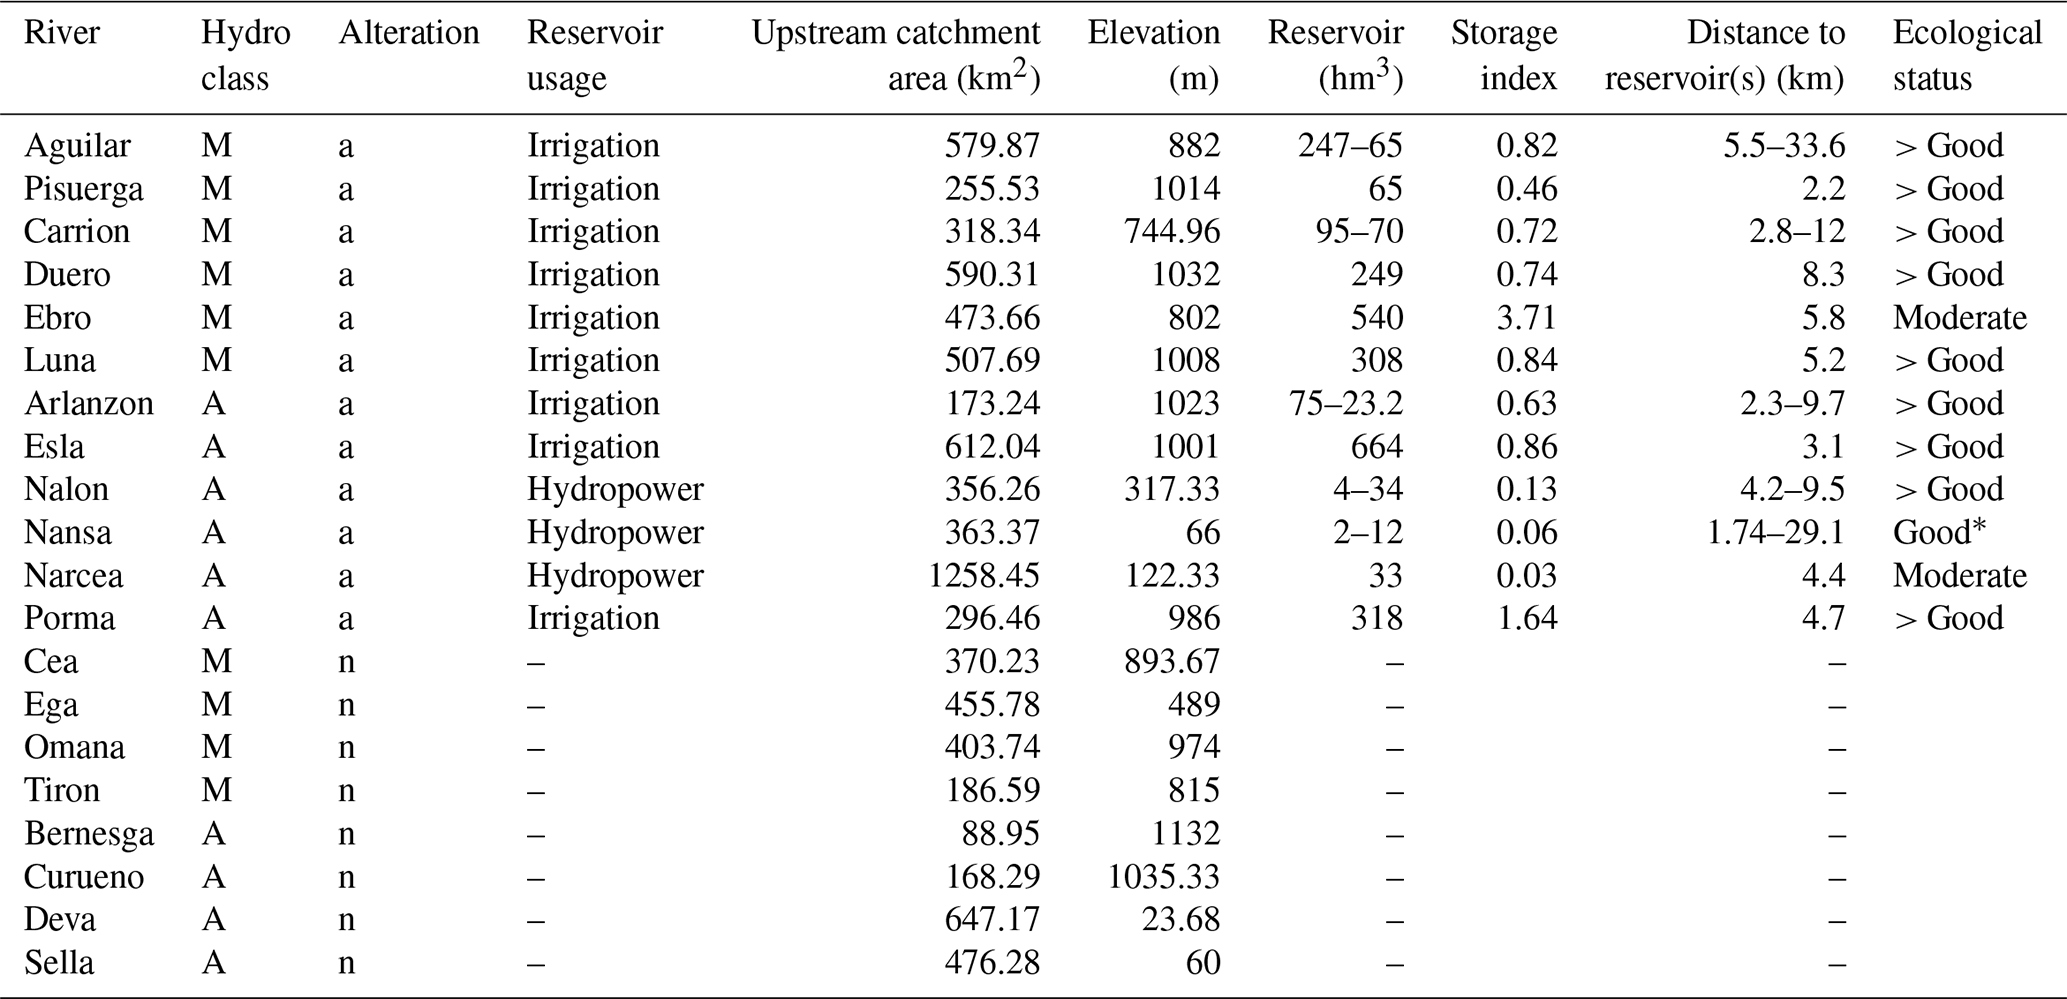
* We could not find the reservoir information, so instead we checked upstream and downstream water bodies for their ecological statuses.
A natural Atlantic regime is characterized by the highest flows in early spring (February–April) due to snowmelt, followed by a gradual decrease in flow until summer low flows are reached and continue throughout July–September (Fig. 3a). Once minimum flows are reached in October, the flow rate picks up quite quickly, with a steep incline due to heavy rains in the fall. On the contrary, a natural Mediterranean regime (Fig. 3d) has its highest flows a bit later in the spring, in March/April, followed by a sharp decrease in flow in May consequently leading to a long, dry summer, reaching the minimum flows between August and September. As opposed to Atlantic rivers, the flow rate increases slowly leading back to the spring peaks, implying comparably less intense fall rains.
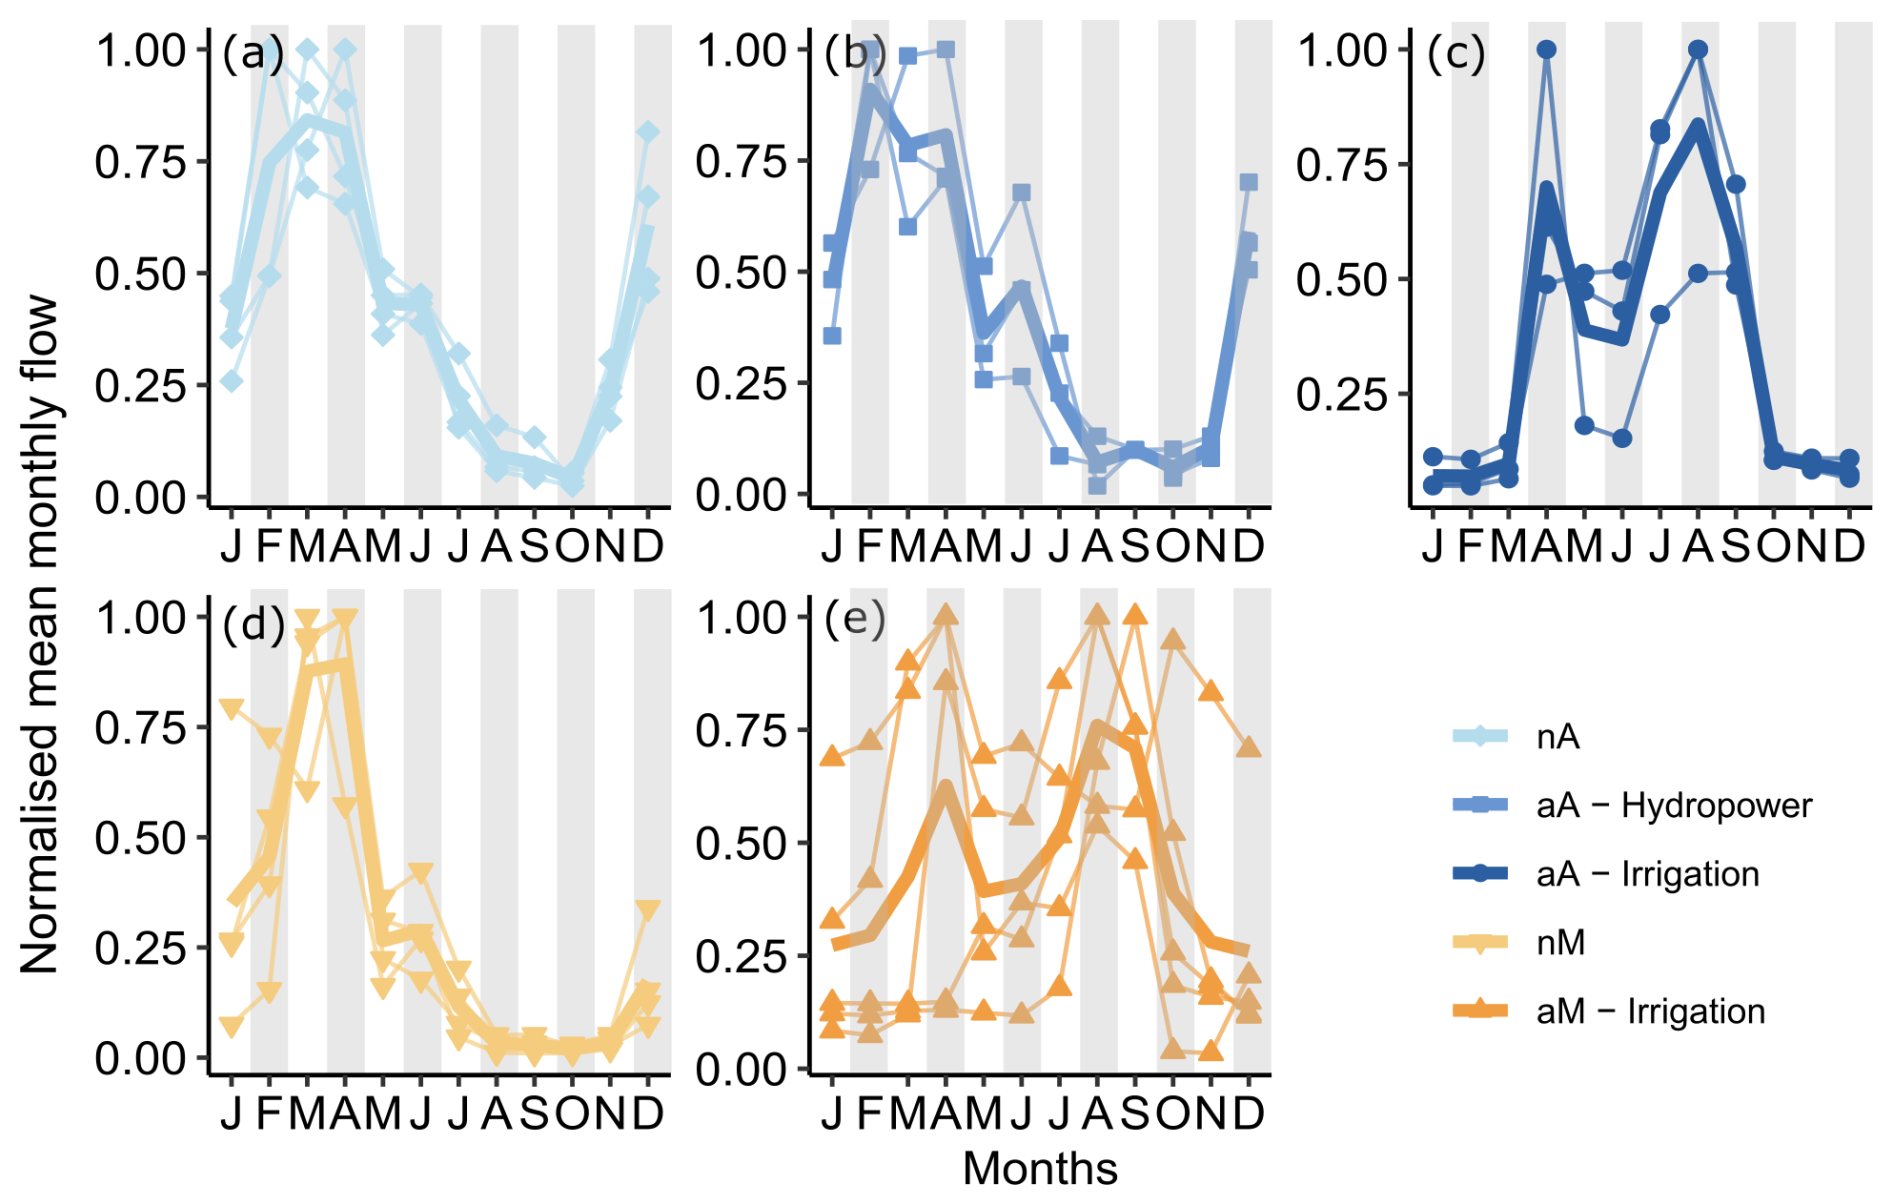
Figure 3Normalized (to maximum) mean monthly flow of each river grouped by flow regime: (a) natural Atlantic (nA) in light blue, (b, c) altered Atlantic (aA) in dark blue shades according to the reservoir purpose, (d) natural Mediterranean (nM) in light orange, and (e) altered Mediterranean (aM) in dark orange (only reservoirs used for irrigation). The thick line represents the average of the flow regimes. The shaded months are the sampling months.
The altered rivers selected all have a dam with a reservoir (predominantly in the headwaters or upper reaches), although the exact alteration of the flow regime may vary depending on the size, purpose, and operation of the dam involved (Table 1). The sampling sites in the altered rivers were located on average 4.1 km (range 1.74–33.6 km) downstream of a reservoir, and some sites had multiple upstream reservoirs. The catchment areas upstream of the sampling sites ranged from 89 to 1258 km2 (Table 1), with an average of 429 km2. All the reservoirs in altered Mediterranean rivers were used for irrigation, while in altered Atlantic rivers, three reservoirs had irrigation and three reservoirs had hydropower production as their main purpose. Only one hydropower-producing reservoir, Narcea, has hydropeaking on a short timescale and has insufficient capacity for seasonal storage. On the other end of the spectrum, while Esla has the biggest reservoir capacity, Ebro has the highest storage index (i.e. highest capacity compared to its average annual runoff). In each river, we characterized DOM properties bi-monthly from October 2017 to August 2018, totalling six sampling occasions (October and December 2017 and February, April, June, and August 2018). Discharge measurements for each river and sampling day are given in Table S1.
2.2 DOM composition
We measured dissolved organic carbon (DOC) concentration, DOM absorbance and fluorescence, and DOM molecular size distribution. In the field, we filtered water samples through pre-combusted (450 °C, 4 h) glass fibre filters with a 0.3 μm nominal pore size (Advantec GF-75, Japan) into acid-washed, MilliQ-water-rinsed, pre-combusted (450 °C, 4 h) glass vials. We stored all the samples in the dark at 4 °C until analysis. We measured DOC concentration (mg L−1) by high-temperature catalytic combustion of an acidified and sparged water sample using a Shimadzu TOC-V Analyser with a typical limit of quantification (computed as 6 times the standard deviation of blanks) of mg L−1 and a typical analytical precision of 1.5 %. To prepare the standards for the DOC measurements, we used potassium hydrogen phthalate (KHP). We took DOM absorbance and fluorescence measurements simultaneously using an Aqualog (Horiba Ltd, Kyoto, Japan). We used MilliQ water as a blank inserted every 10–15 measurements; each of the three field replicates was measured 3 times, and spectra were visually checked for consistency and outlier removal. We measured absorbance in 5 nm increments from 250 to 600 nm and fluorescence as excitation–emission matrices (EEMs); we excited the samples from 250 to 600 nm in 5 nm increments, with emission from 212 to 620 nm in 2 nm increments. We subtracted the MilliQ water EEMs from all sample EEMs to remove optical scatter phenomena but did not apply any inner filter correction since the decadal absorption coefficient at 254 nm (A254) was lower than the threshold of 0.3 for all samples (Ohno, 2002).
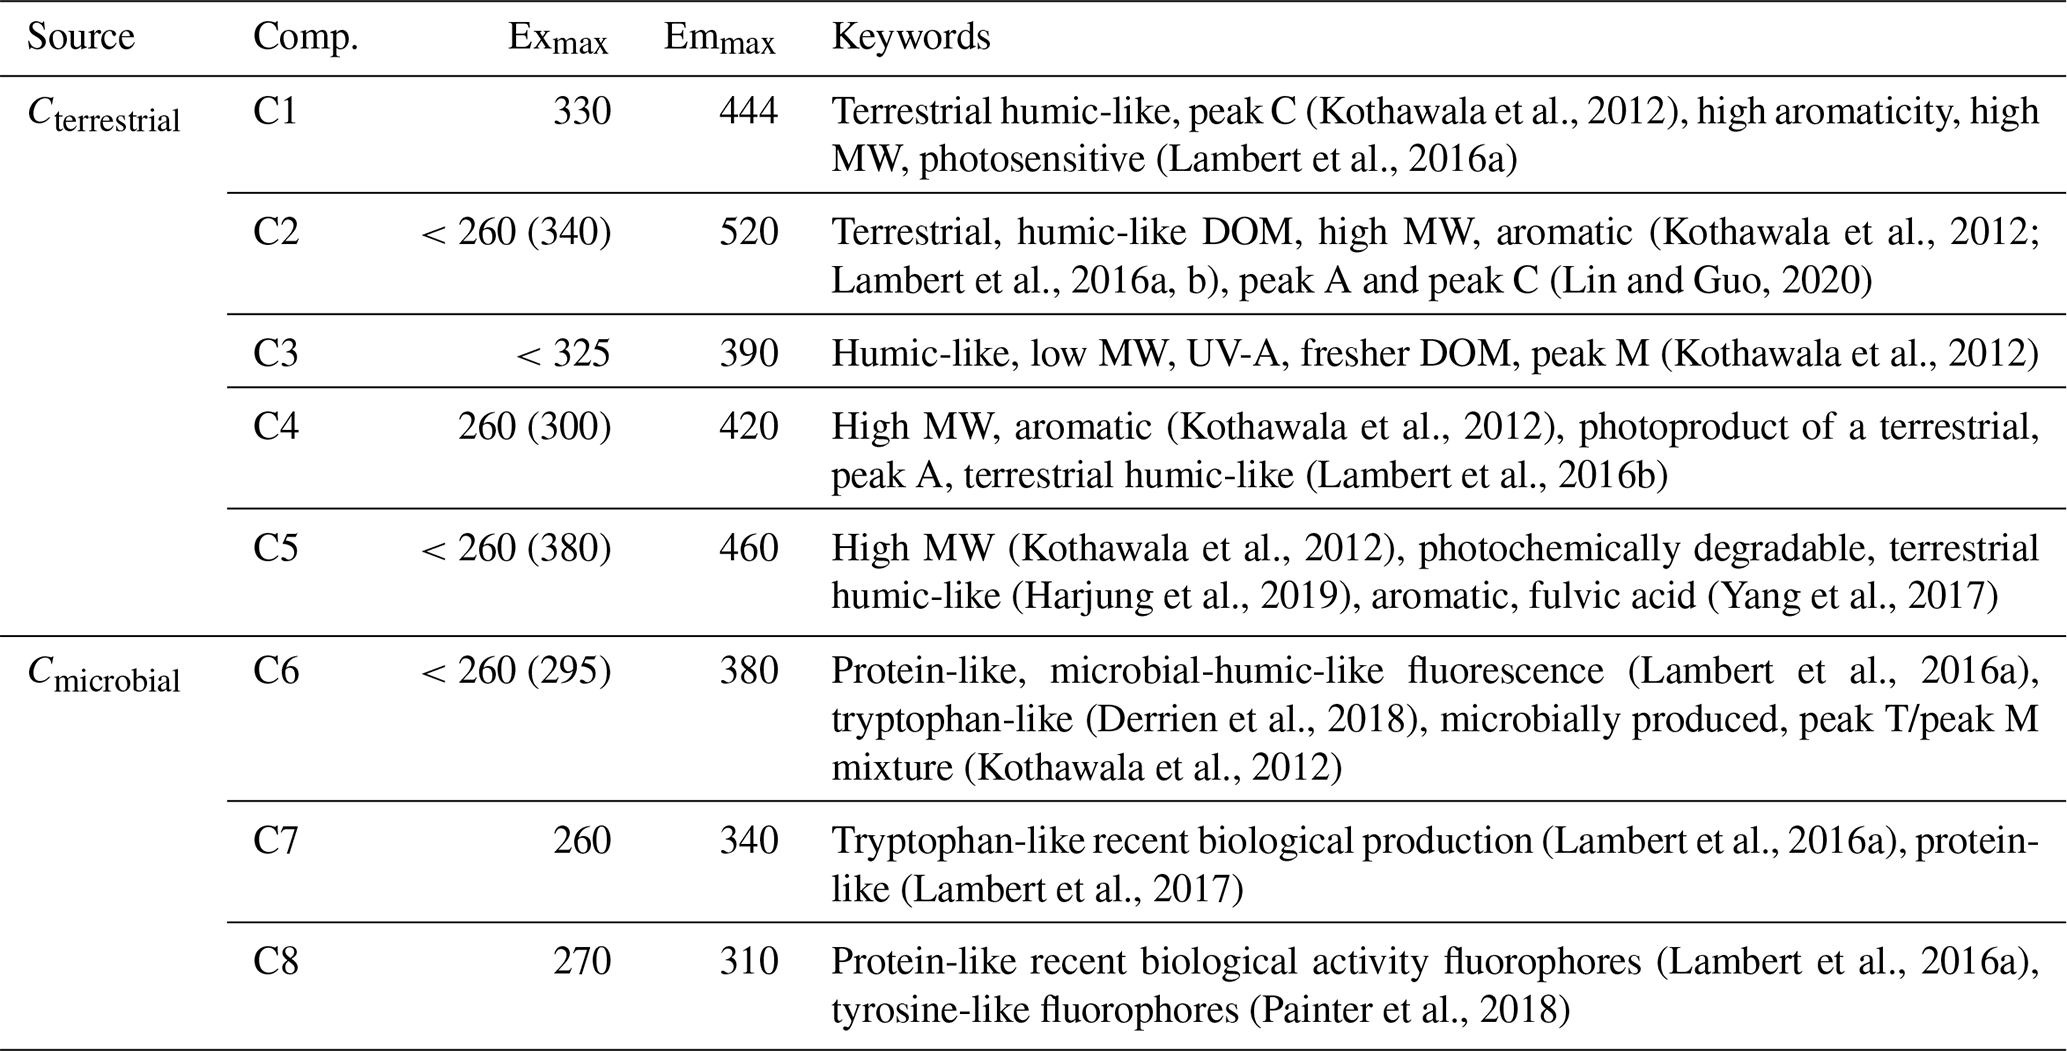
We used the Aqualog measurements to calculate six optical indices: the fluorescence index (FI), the humification index (HI), the freshness index (), the E2 : E3 ratio, the slope ratio (SR), and specific UV absorbance (SUVA254), as summarized in Table 2. Further, we performed a parallel-factor analysis (PARAFAC) by setting the maximum emission to 1 after Raman normalizing, smoothing, and normalizing each EEM (Coble et al., 2019). We used the StaRdom package (Pucher et al., 2019) in R version 4.0.3 (R Core Team, 2020) to partition the EEMs into individual components following the PARAFAC modelling strategy. We chose the eight-component PARAFAC model as the one achieving the best representation of the 699 EEM dataset. We verified the model using split-half analysis with random-sample selection following residual analysis. Sample-specific fluorescence of components was expressed in Raman units by reverting the normalization step through the multiplication of Fmax values with the original EEMs' maximum emission values. We scanned the literature via the OpenFluor database (Murphy et al., 2014) for similar components (Table 3). The components C1, C2, C3, C4, and C5 were reported as old humic-like DOM with strong terrestrial signals composed of mostly high-molecular-weight (MW) substances. C6, C7, and C8 were all protein-like compounds of recently produced fresh material (Table 3). We grouped the relative contribution of the first five components (C1–C5) into an indicator of humic and terrestrial signatures (Cterrestrial) by dividing the sum of the relative contributions by the sum of all components. In the same manner, we turned the last three components into an indicator of freshly produced microbial input (Cmicrobial). We used liquid size-exclusion chromatography (SEC) with organic carbon and nitrogen detection (LC-OCD-OND; Huber et al., 2011) for the molecular size distribution measurements. This allowed us to estimate the abundance of non-humic high-molecular-weight substances (CHMWS; like polysaccharides and proteins, mg C L−1); humic substances (CHS, mg C L−1); and neutral, hydrophilic-to-amphiphilic low-molecular-weight substances (CLMWS; e.g. aldehydes, sugars, and amino acids in mg C L−1). For samples below the detection limit, we used half the value of the detection limit in the final dataset to allow multivariate data analysis. To have an estimate of the relative contributions of each of the defined size fractions, we divided each by the total dissolved organic carbon concentration measured by SEC (Heinz and Zak, 2018).
(McKnight et al., 2001)(Ohno, 2002)(Harjung et al., 2019; Wilson and Xenopoulos, 2009)(Loiselle et al., 2009)Table 2Calculated optical indices, their meaning, and the method used.
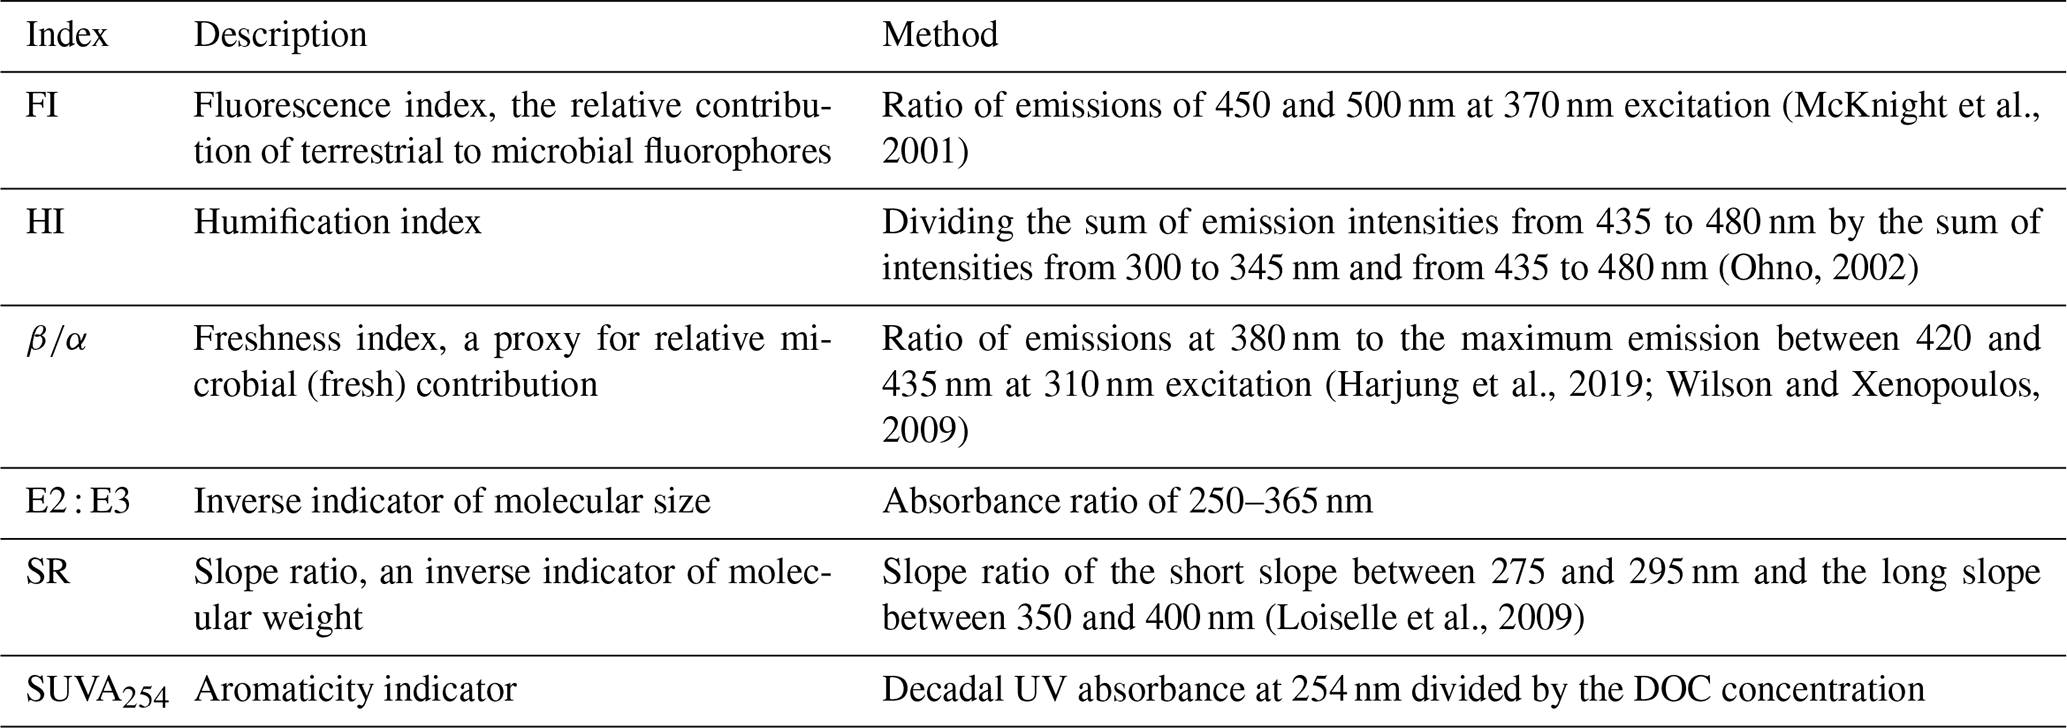
Table 3PARAFAC components with the modelled maximum emission and excitation values (Exmax, Emmax) were compared to the literature using OpenFluor (Tucker's congruency coefficients (TCC) combined >0.90). For each component, the main sources, the peak names, and selected keywords from the literature are given.
2.3 Statistical analysis
To assess differences among the flow regimes, we used principal component analysis (PCA) using the 81 flow indices reported in Peñas et al. (2016) and grouped the rivers according to their flow regime to see if flow alterations homogenize or diversify natural flow characteristics (Fig. S1 in the Supplement). With this in mind, we also used the average distance to the centroid of a particular flow regime as a measure of dispersion in the same way as for DOM data (see below for the assessment of the among-river variation in annual mean DOM composition). The magnitudes of 1, 30, or 90 d high-flow events (1HF, 30HF, 90HF) and the magnitude of 1, 30, or 90 d low-flow events (1LF, 30LF, 90LF) were selected to compare the four flow regimes following the findings of natural and altered river flow differences from Goldenberg-Vilar et al. (2022) for the same rivers.
As measures of mean DOM concentration and mean composition for each river, we computed annual means of the DOC concentration, of optical indices, and of SEC fractions. To express the seasonal variability in these variables, we computed river-specific temporal coefficients of variation (CVs) and used them as indicators of annual shifts in DOM composition. Annual means and temporal CVs were then used as univariate responses describing DOM regimes to test for differences between the four flow regimes. For this, we followed a one-way approach in two steps for each response variable: first, we tested mean and CV differences in all four flow regimes with a one-way test (Welch, 1951), which – unlike classical ANOVA – does not need variance homogeneity as a prerequisite. In the case of significance, this was then followed by planned paired t tests between (i) natural Atlantic and natural Mediterranean (nA vs. nM), (ii) altered Mediterranean and natural Mediterranean (aM vs. nM), and (iii) altered Atlantic and natural Atlantic (aA vs. nA). We corrected the p values with the Bonferroni method, assuming three a priori planned tests. We also compared the spatial variation in annual means and temporal CVs across the rivers of the four flow regimes. For this, we followed a similar one-way approach in two steps, where we first tested for variance homogeneity of annual means and of temporal CVs across all four regimes with a Bartlett test, which – when significant – was followed by planned F tests between (i) nA vs. nM, (ii) aM vs. nM, and (iii) aA vs. nA. Taken together, our response variables included measures of mean location and temporal variation for each river's DOM indicators, which serve as DOM regime descriptors, and measures of (spatial) variation in these DOM regime descriptors across rivers belonging to the same flow regime. The latter was specifically computed to assess whether, in any given natural reference flow regime, dam-induced flow alteration diversifies DOM regimes across rivers compared to DOM regimes under natural flow.
Additionally, to assess the similarities and differences in annual average DOM composition and shifts in DOM composition between natural and altered rivers in a more integrative, multivariate way, we did a principal component analysis (PCA) using the relative fluorescence of PARAFAC components, optical indices, and SEC fractions. We looked for recognizable differences in DOM composition among flow regimes (i.e. between natural and altered regimes of both hydrological classes) with regard to location (mean DOM composition) and specifically with regard to temporal shifts in DOM composition in the various rivers. To statistically test for differences in DOM composition among flow regimes, we used a one-way permutational multivariate ANOVA (Anderson, 2001) on annual mean locations (river-specific centroids) in the PCA space with the same paired testing strategy as described above. Temporal shifts in DOM composition are graphically represented in 2D PCA space by polygons for each river (Fig. 6c–f), where each corner represents the DOM composition of a sampling date in the PCA space and the centroid represents the mean DOM composition of that river over the entire sampling period. The average distance of individual sampling dates to the centroid of a river serves as a measure of temporal shifts in DOM composition; it is computed as a dispersion (i.e. multivariate variation) on all dimensions of the PCA using the function betadisper() from the R package vegan (Oksanen et al., 2025). Here, a high average distance to the centroid (high dispersion) means strong temporal shifts in DOM composition. To statistically test the temporal shifts in DOM composition, we followed the same analysis approach as described above for a univariate response variable, i.e. a one-way ANOVA comparing dispersion as a response among all four flow regimes, followed by three planned t tests as post hoc tests.
Analogously to the analysis of univariate responses, we also compared the among-river variation in annual mean DOM composition and that of temporal shifts in DOM composition across the four flow regimes given by the multivariate dataset. Our motivation was again to assess whether, in any given natural reference flow regime, dam-induced flow alteration diversifies DOM regimes (in either mean location or temporal shifts in composition, i.e. dispersion) compared to DOM regimes under natural flow. Again, we followed a similar one-way approach in two steps. For the among-river variation in annual mean DOM composition, we tested for dispersion homogeneity of river centroids across all four regimes with PERMDISP, a permutational equivalent of the Bartlett test (Anderson, 2006), which – when significant – was followed by planned permutational F tests between (i) nA vs. nM, (ii) aM vs. nM, and (iii) aA vs. nA. For the among-river variation in temporal shifts in DOM composition, we used the river-specific measure of temporal dispersion as a univariate response and followed the same approach as described above for variation in univariate responses (Bartlett test followed by planned t tests).
As the individual axes of the PCA can be understood as distinct meaningful components of a river's DOM regime, we also tested the differences in average location and variance along the PC1 and PC2 axes following the same univariate strategy of a one-way test followed by planned t tests, as described above. Similarly, we compared across-river variance of average location and variance along the PC1 and PC2 axes using a Bartlett test followed by planned F tests as post hoc analysis. A summary of the statistical workflow followed is included in Fig. 1.
To look for links between characteristics of the flow regime and temporal shifts in DOM composition, we performed three partial least-squares (PLSR) analyses (one for the overall shifts in DOM composition and one each for PC1 and PC2 variance). We chose PLSR analysis due to its reputed good performance in situations with high collinearity of predictors and small sample size (Carrascal et al., 2009; Coble et al., 2019). As predictors, we used the 81 hydrological indices computed by Peñas and Barquín (2019) that were grouped into five flow regime components: magnitude, duration, frequency, timing, and rate of change (Table S3). As dependent variables, we used the multivariate dispersion (for the overall shifts in DOM composition) and the two variances on the first two PCA axes for each river, which can be understood as the two most important components of shifts in DOM composition, each having a specific qualitative character captured by the respective PCA axis. In the PLSR analysis, we selected the hydrological indices with VIP scores (variable importance on the predictor) higher than 1 as the most important explanatory variables and reported only the first component of the PLSR analysis for simplicity.
3.1 Flow regimes
Both Atlantic and Mediterranean natural flow regimes are characterized by high flows in early to late spring and low flows throughout the summer, with a minimum in August–September before the fall rains begin (Fig. 3a and d). Additionally, natural Atlantic flow regimes have a second high-flow peak in early winter (November–December) compared to the natural Mediterranean regime.
On the contrary, altered Mediterranean rivers, with their irrigation reservoirs, do not experience the natural succession of high spring flows followed by summer droughts as observed in the natural Mediterranean rivers (Fig. 3d and e). From previous studies, we know that our altered Mediterranean rivers collect water during winter and spring and release it from May to September (Pompeu et al., 2022), which is the reason behind the high summer flows. We also know that this behaviour is limited by the storage capacity of these reservoirs, where a lower storage capacity requires an additional pre-release in late winter–spring due to the capacity being reached, resulting in a double-humped shape of the annual hydrograph (Fig. 3c and e).
When the mean of the altered Atlantic rivers is compared to its natural equivalent (Fig. 3a–c), we see that the abovementioned introduction of summer high flows is not as consistent; i.e. three rivers have distinct summer high flows, while three others have late-summer droughts. When grouped by reservoir purpose, rivers with hydropower reservoirs (Fig. 3b, Narcea, Nalon, Nansa) still show summer droughts even though they have altered flow regimes; i.e. they somewhat mimic the natural flow regime expected of that river. On the contrary, rivers with irrigation reservoirs (Fig. 3c, Porma, Esla, Arlanzon) have clear summer high flows and a secondary peak in spring due to limited storage capacity. Thus, in altered Atlantic rivers, flow regime heterogeneity among the rivers comes from the different purposes of the reservoirs (irrigation vs. hydropower), whereas in altered Mediterranean rivers, flow regime heterogeneity is derived mostly from the differences in storage capacity of reservoirs exclusively dedicated to irrigation.
From previous studies on our rivers, we know that altered rivers show a higher diversity of flow regimes compared to natural rivers (Goldenberg-Vilar et al., 2022). In a PCA analysis, we found that altered Mediterranean rivers have 13-fold and altered Atlantic rivers 44-fold higher dispersion in the PCA space compared to their natural equivalents, while both natural flow regimes showed similarly small dispersions (Fig. S1). This confirms that altered Atlantic regimes encompassing both irrigation and hydropower reservoirs are more diversified than altered Mediterranean regimes with irrigation reservoirs only.
As a final step, we looked at selected flow regime characteristics (Fig. 4), specifically at the magnitudes of 1, 30, or 90 d high- and low-flow events (selected from Goldenberg-Vilar et al., 2022). These selected indicators are used to show the general trend of our flow regimes in magnitude and duration of annual minimum and maximum flows, covering short-duration flood pulses as well as seasonal droughts. Both natural flow regimes have higher 1 d high flows than their altered counterparts. Natural Mediterranean rivers have higher 30 d high flows than altered Mediterranean rivers, whereas this difference was not as clear between natural and altered Atlantic rivers. There was not much visible difference between regimes in 90 d high flows. Similarly, natural Atlantic rivers have lower 1 d low flows than altered Atlantic rivers with irrigation dams but do not have flows lower than on those with hydropower dams. Natural rivers have lower 30 d low flows and 90 d low flows than their altered counterparts for both Atlantic and Mediterranean rivers.
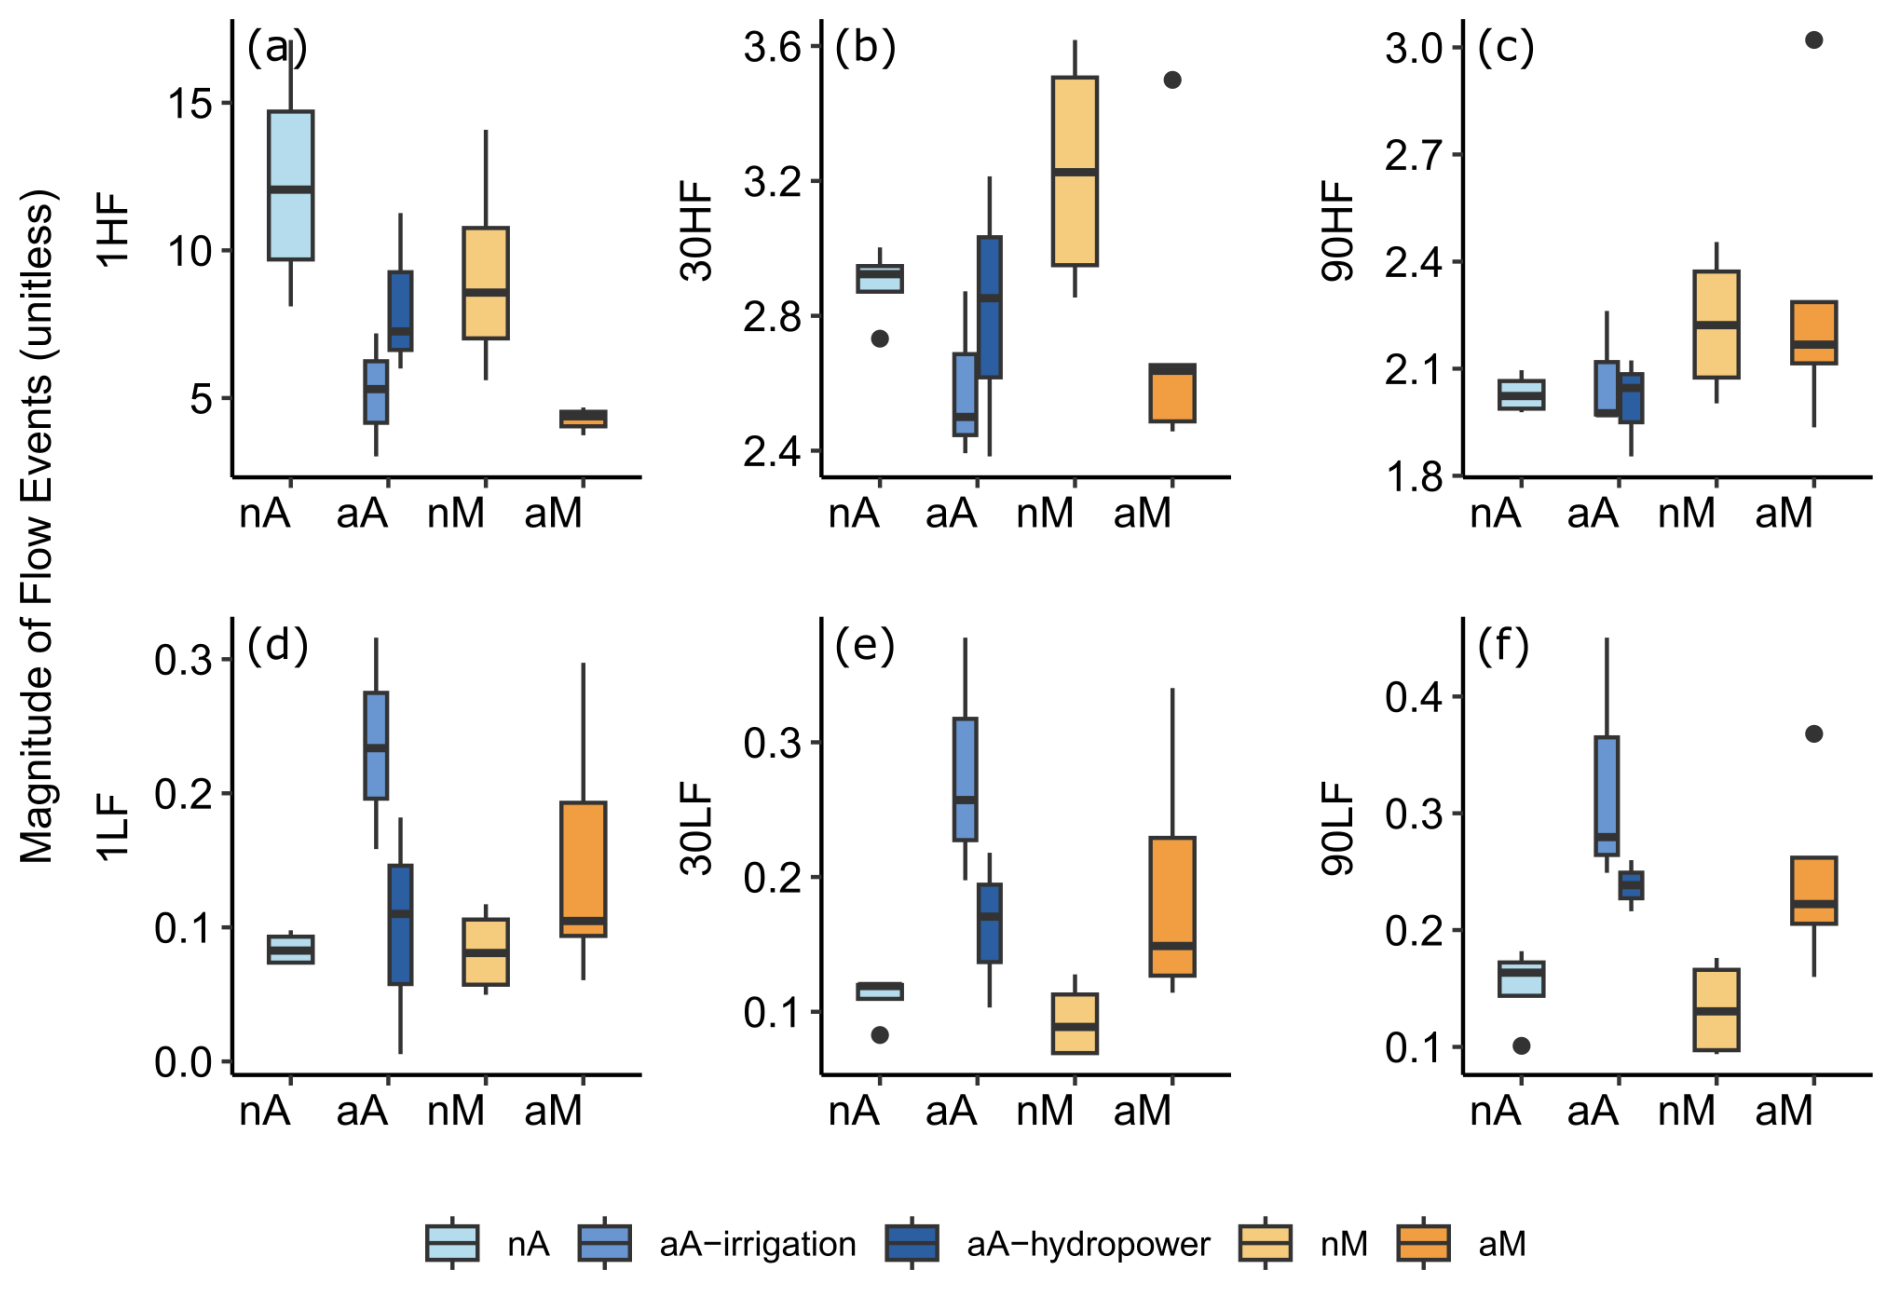
Figure 4Boxplots of the magnitude of extreme flow events representing flow variability: magnitude of a (a) 1 d high-flow event (1HF), (b) 30 d high-flow event (30HF), and (c) 90 d high-flow event (90HF) and of a (d) 1 d low-flow event (1LF), (e) 30 d low-flow event (30LF), and (f) 90 d low-flow event (90LF). Natural Atlantic (nA) rivers are shown in light blue; altered Atlantic (aA) rivers in dark blue, separated by different shades according to the purposes of their dams; natural Mediterranean (nM) rivers are shown in light orange; and altered Mediterranean (aM) in dark orange, where all rivers are altered by dams built for irrigation.
3.2 Average and temporal variation in DOC concentration
The DOC concentration varied 10-fold, from 0.59 to 5.3 mg L−1, across rivers throughout the year. Planned t tests did not show any significant difference in annual mean DOC concentration (Fig. 5a and Table 4) between the two natural flow regimes (nA–nM) or between the altered and natural rivers (aA–nA and aM–nM, respectively). The consistently higher median in all altered Atlantic rivers compared to the natural Atlantic rivers and partly significant results prior to Bonferroni correction point to a lack of statistical power due to a low sample size, causing a lack of significance. The two highest average DOC concentrations belong to Duero and Ebro (Fig. 5a). We could not find any common hydrological characteristics separating these two from the remaining altered Mediterranean rivers, but note that Ebro has the highest storage index in the dataset. We also could not find any association of DOC concentration with discharge (Table S1). In fact, Ebro and Duero show completely opposite trends; Ebro has its highest DOC concentration in April at 1.05 m3 s−1 and its lowest DOC value in August at 5.31 m3 s−1, which coincides with the water release timings. On the contrary, Duero has its highest DOC concentration in June at 4.56 m3 s−1 and its lowest DOC concentration in December at 0.88 m3 s−1, when reservoirs are filled up.
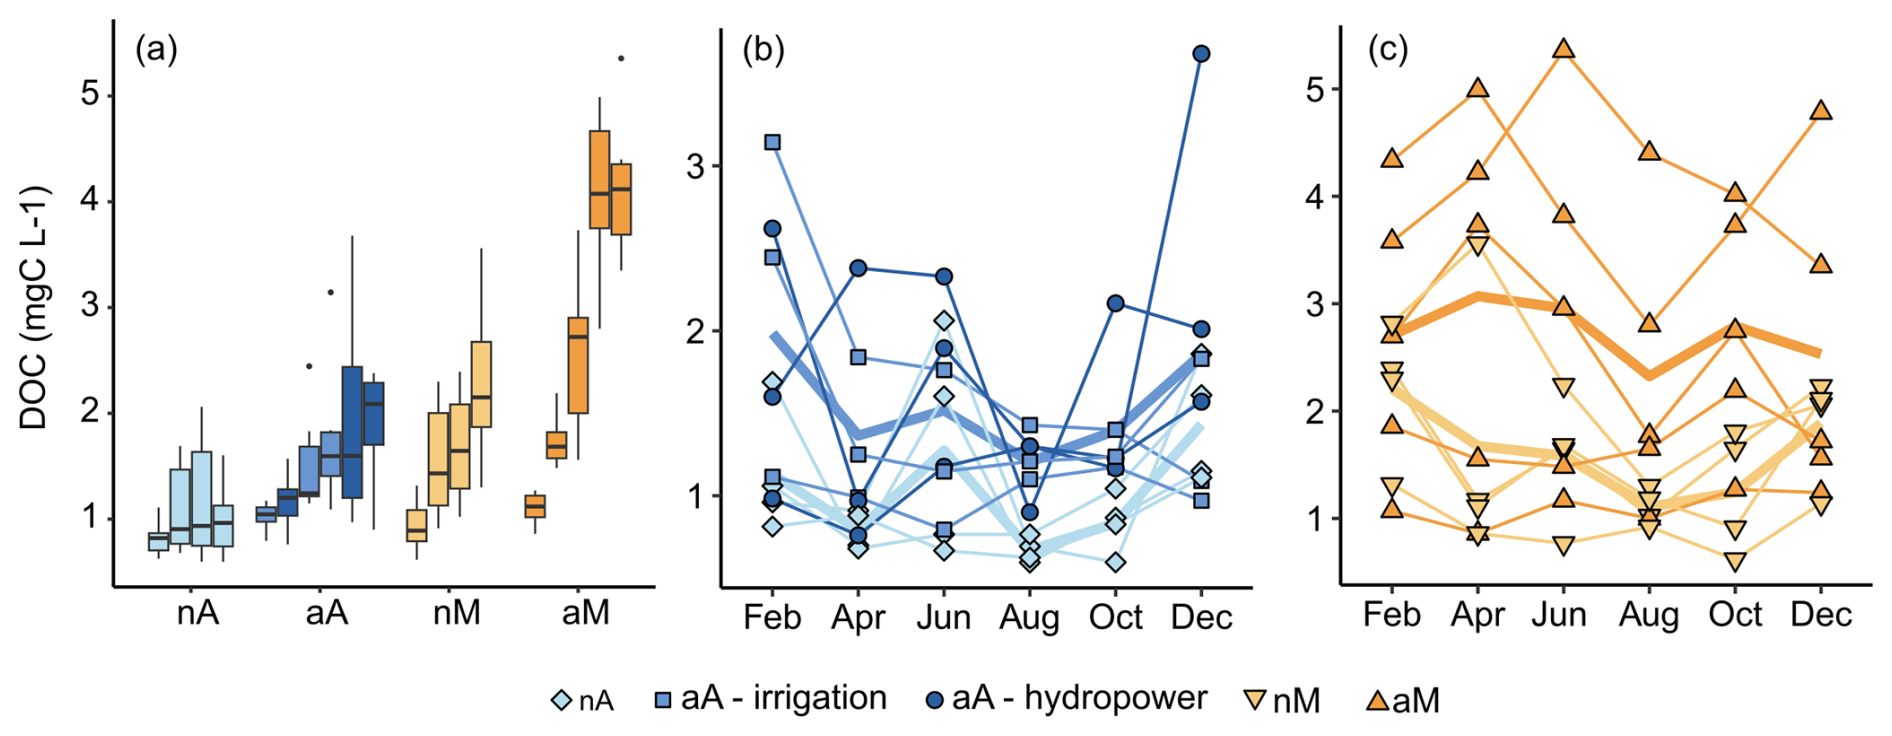
Figure 5(a) DOC of each river as individual boxplots grouped by flow regime: natural Atlantic (nA) in light blue, altered Atlantic (aA) in dark blue, natural Mediterranean (nM) in light orange, and altered Mediterranean (aM) in dark orange. (b) Atlantic and (c) Mediterranean river temporal DOC behaviours are represented as lines following the same colour scheme. The aA rivers are separated into two reservoir purpose groups, irrigation and hydropower. All aM rivers have irrigation reservoirs. The individual points represent single DOC measurements in various rivers of each flow regime in each sampling month; the thin lines represent the trajectory of a river throughout the year. The thick lines connect the monthly averages for all the rivers of the respective flow regimes.
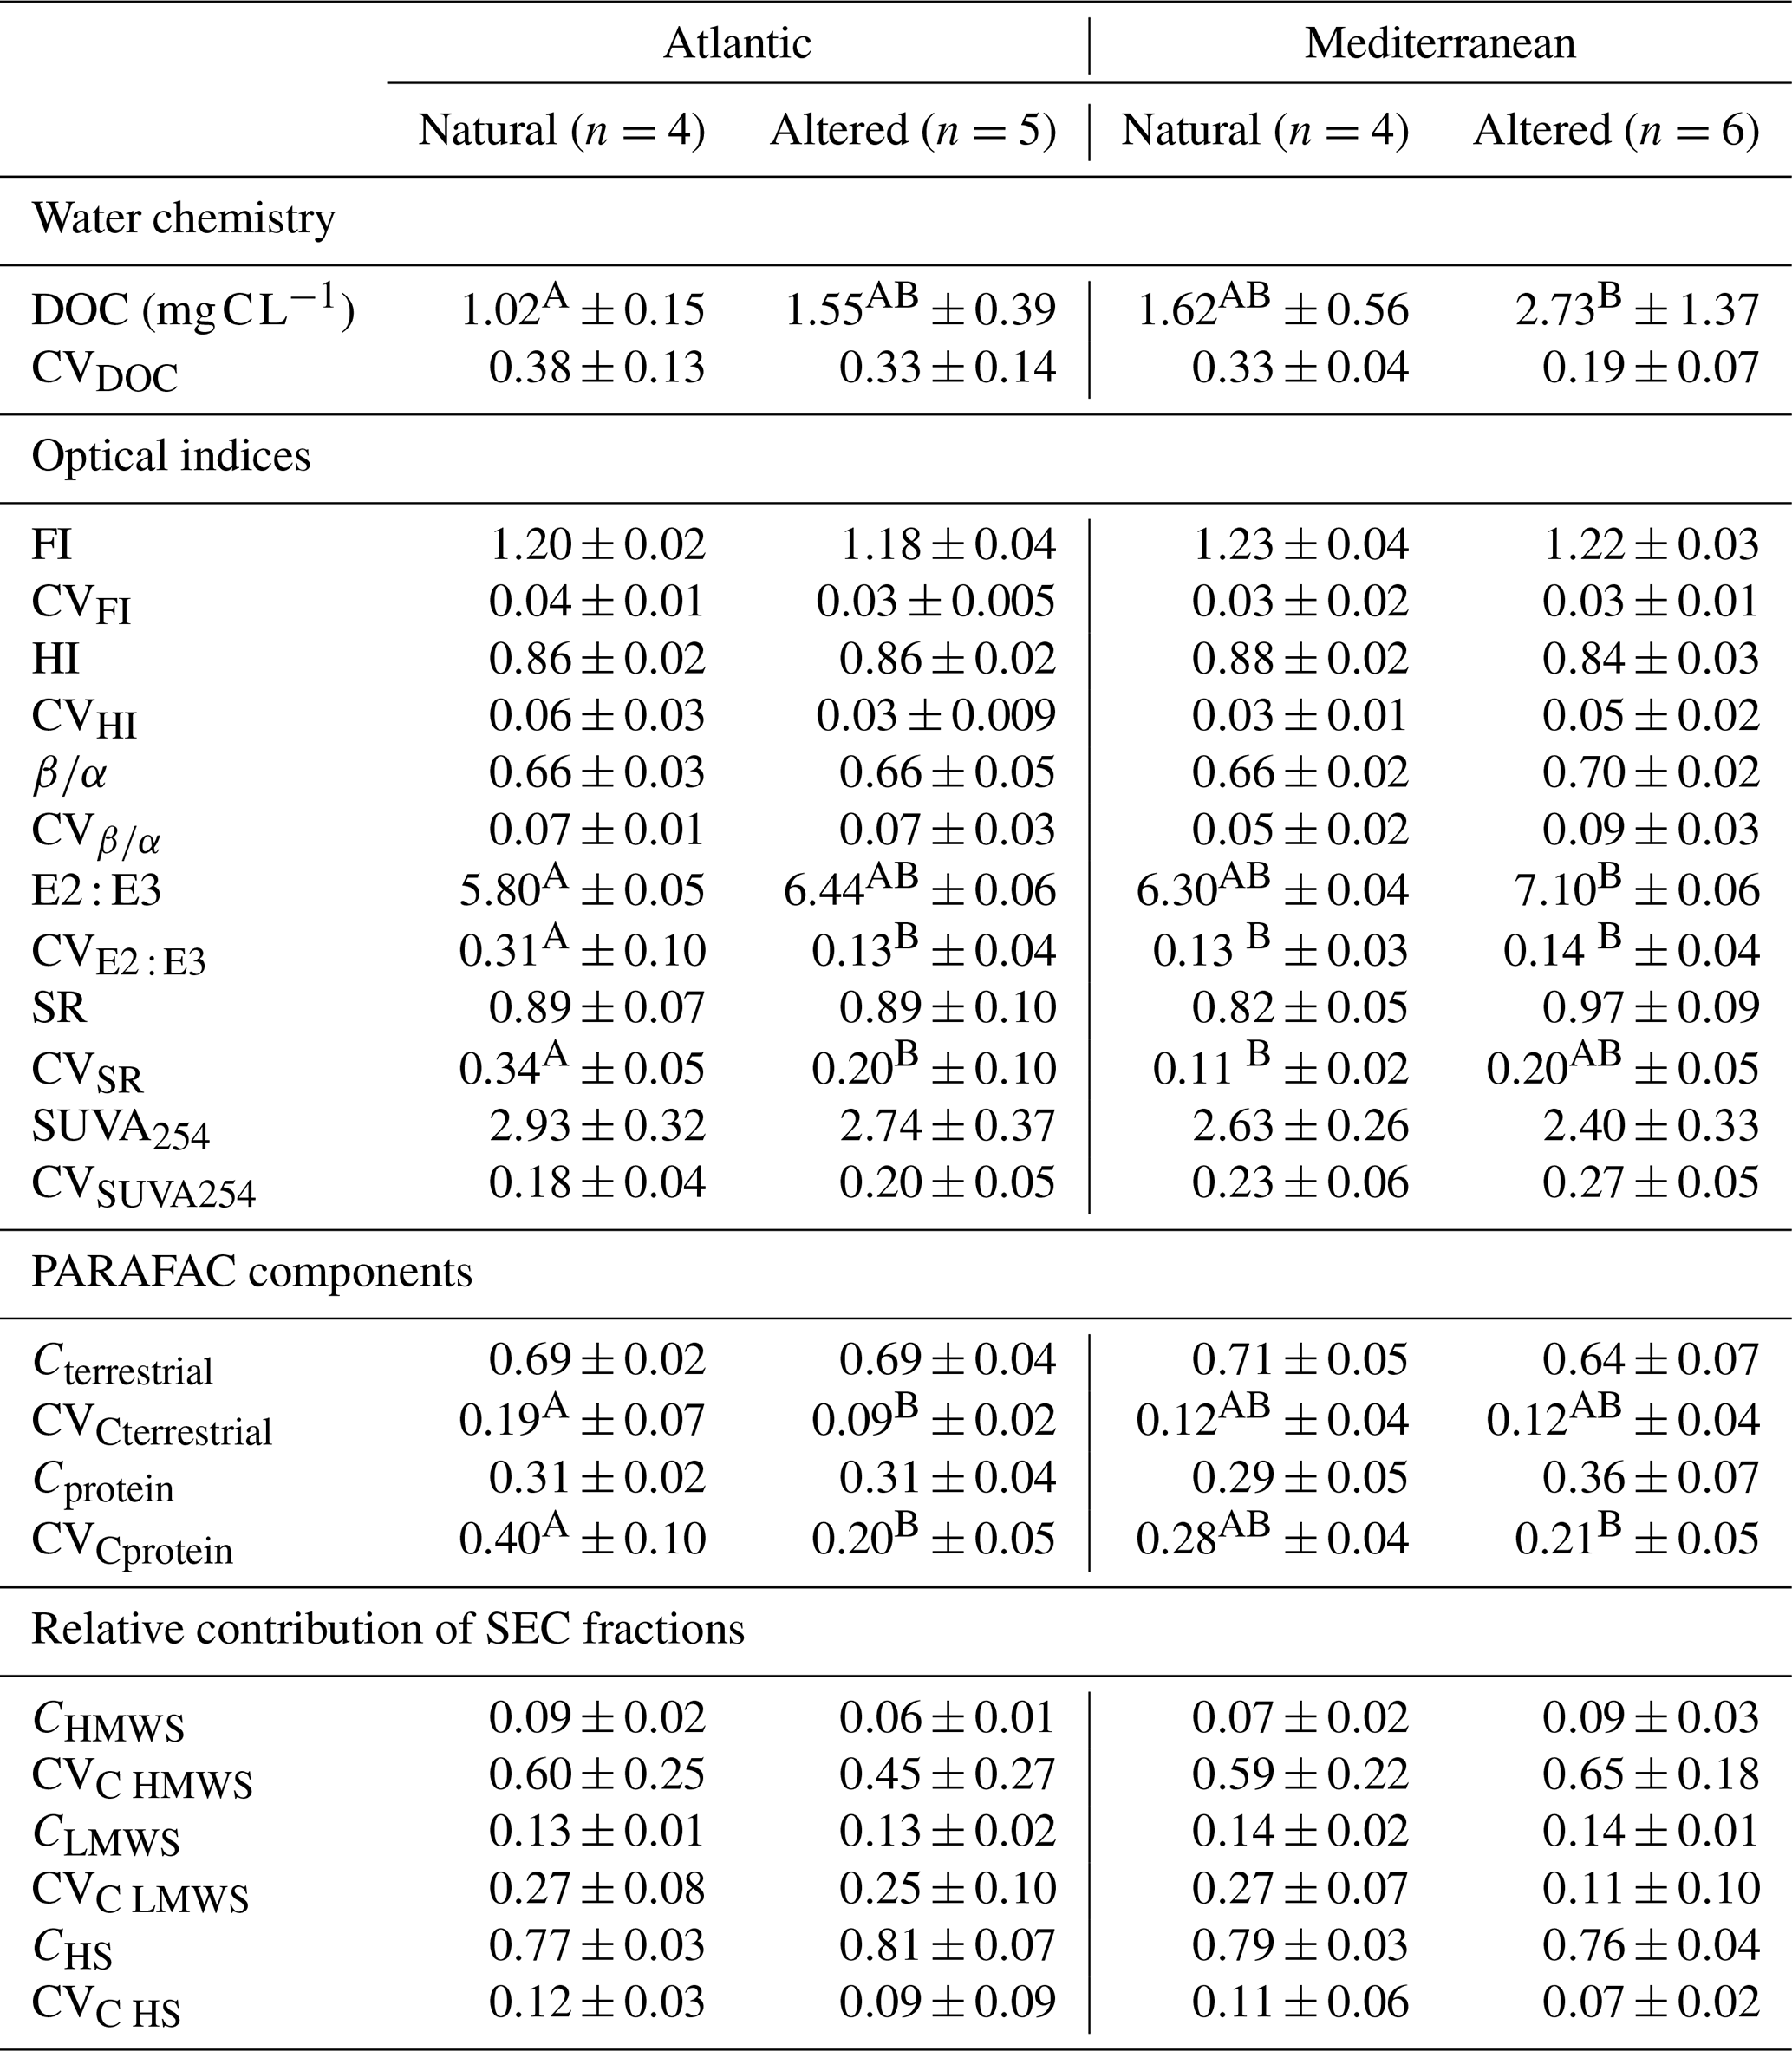
Table 4Means of river-specific annual means and temporal coefficients of variation (CVs) for each of the four flow regimes: natural Atlantic (nA), altered Atlantic (aA), natural Mediterranean (nM), and altered Mediterranean (aM). The table provides means ± standard deviations. Superscripted letters above the values of mean and standard deviation indicate significant differences according to t tests and F tests done pairwise between two flow regimes. These letters allow pairwise comparisons (nA vs. nM, aA vs. nA, and aM vs. nM) between any two flow regimes, but the Bonferroni correction was applied to p values, assuming only three a priori planned tests of relevance (nA vs. nM, nA vs. aA, nM vs. aM). The letters were dropped when the pairwise comparisons did not indicate a significant difference. For the calculations of the mean and CV values, six measurements distributed across 1 year were taken into account. The number of sites (n) for each flow regime is given in the column headlines.
The annual DOC variation in the rivers (CVDOC) ranged from 14 % to 53 %. The two natural regimes (nA–nM) showed no significant differences in CVDOC (Table 4). Looking at the change in DOC through the sampled months in Atlantic rivers (Fig. 5b), we observe that both altered and natural rivers' average DOC time series follow similar paths throughout the year, with the lowest values in August followed by an increase until spring high flows. In Mediterranean rivers, however (Fig. 5c), altered rivers' DOC time series increase in April and June, while most natural rivers have low values in these months.
In both flow regimes, the among-river variation in DOC and CVDOC seems lower in natural rivers than in their altered equivalents, but we could not find any significant difference between any of the tested flow regime pairs (data not shown), likely again because of low statistical power.
3.3 Average DOM composition and its temporal shifts
In all regimes, DOM showed strong terrestrial characteristics throughout the year, with relatively low FI (<1.4) and (<1) and high HI (0.86±0.04) and SUVA254 (>2.4). Also, with values >60 %, the indicator Cterrestrial showed the dominance of soil-derived materials over microbially produced materials (McKnight et al., 2001; Fellman et al., 2010; Hansen et al., 2016). The FI values ranged from 1.09 to 1.38 among the rivers throughout the year, typical of natural waters (Hansen et al., 2016). The SR values were relatively low for all flow regimes (SR<1), indicating the dominance of higher-MW compounds and aromatic plant-derived materials (Oliver et al., 2016). The relative contribution of SEC fractions also indicates that, in all of the regimes, humic substances were most abundant (CHS), followed by simple monomers like sugars and amino acids (CLMWS) and polysaccharides and proteins (CHMWS).
When we compared the two natural regimes of Atlantic and Mediterranean rivers, there was no significant difference in any annual average optical indicator or SEC fraction (Table 4). However, CVSR and CVE2 : E3 were significantly higher in natural Atlantic rivers compared to natural Mediterranean rivers. The F-test results for all annual averages and compositional shift indicators show similar among-river variances between the two natural regimes (nA–nM; data not shown).
When we compared the natural regimes to their altered equivalents in terms of average DOM composition, we could not observe any significant difference in the annual average optical indices (Table 4) in Atlantic or Mediterranean rivers. Among the CV values indicating shifts in DOM composition, we observed that in Atlantic rivers, CVE2 : E3, CVCprotein, and CVCterrestrial were significantly higher in natural rivers compared to their altered equivalents (Table 4). In Mediterranean rivers, CVSR was significantly higher in altered rivers compared to the natural equivalents (could not be shown by the letters). From the F-test results, we observe that all of the average DOM composition and compositional shift indicators showed similar among-river variances between the natural and altered regimes (data not shown).
We further analysed the similarities and differences in the annual average and temporal shifts in DOM composition in a multivariate approach using a PCA. The first and second axes of the PCA (Fig. 6, PC1) explained 47 % and 16 % of the total variation in DOM composition. PC1 was negatively correlated with terrestrial and humic components (Cterrestrial), humic substances (CHS), and HI and was positively correlated with microbially sourced components (Cmicrobial), FI, , and CHMWS, representing non-humic biopolymers (Huber et al., 2011). PC2 was negatively correlated with SR, E2 : E3 and SUVA254 and positively correlated with CLMWS. Taken together, the PCA space from the bottom-left to the top-right corner shows a gradient of terrestrially sourced, aromatic, high-MW, and presumably diagenetically older material to microbially sourced, fresher, low-MW material. Notably, PC1 and PC2 capture indicators of DOM composition described by different methods: PC1 groups mostly fluorescence-based indices (Cmicrobial, Cterrestrial, FI, HI, ), and PC2 groups absorbance indices (E2 : E3, SUVA254, SR) and SEC fractions. The patterns in PCA space were not related to DOC concentration or discharge (data not shown).
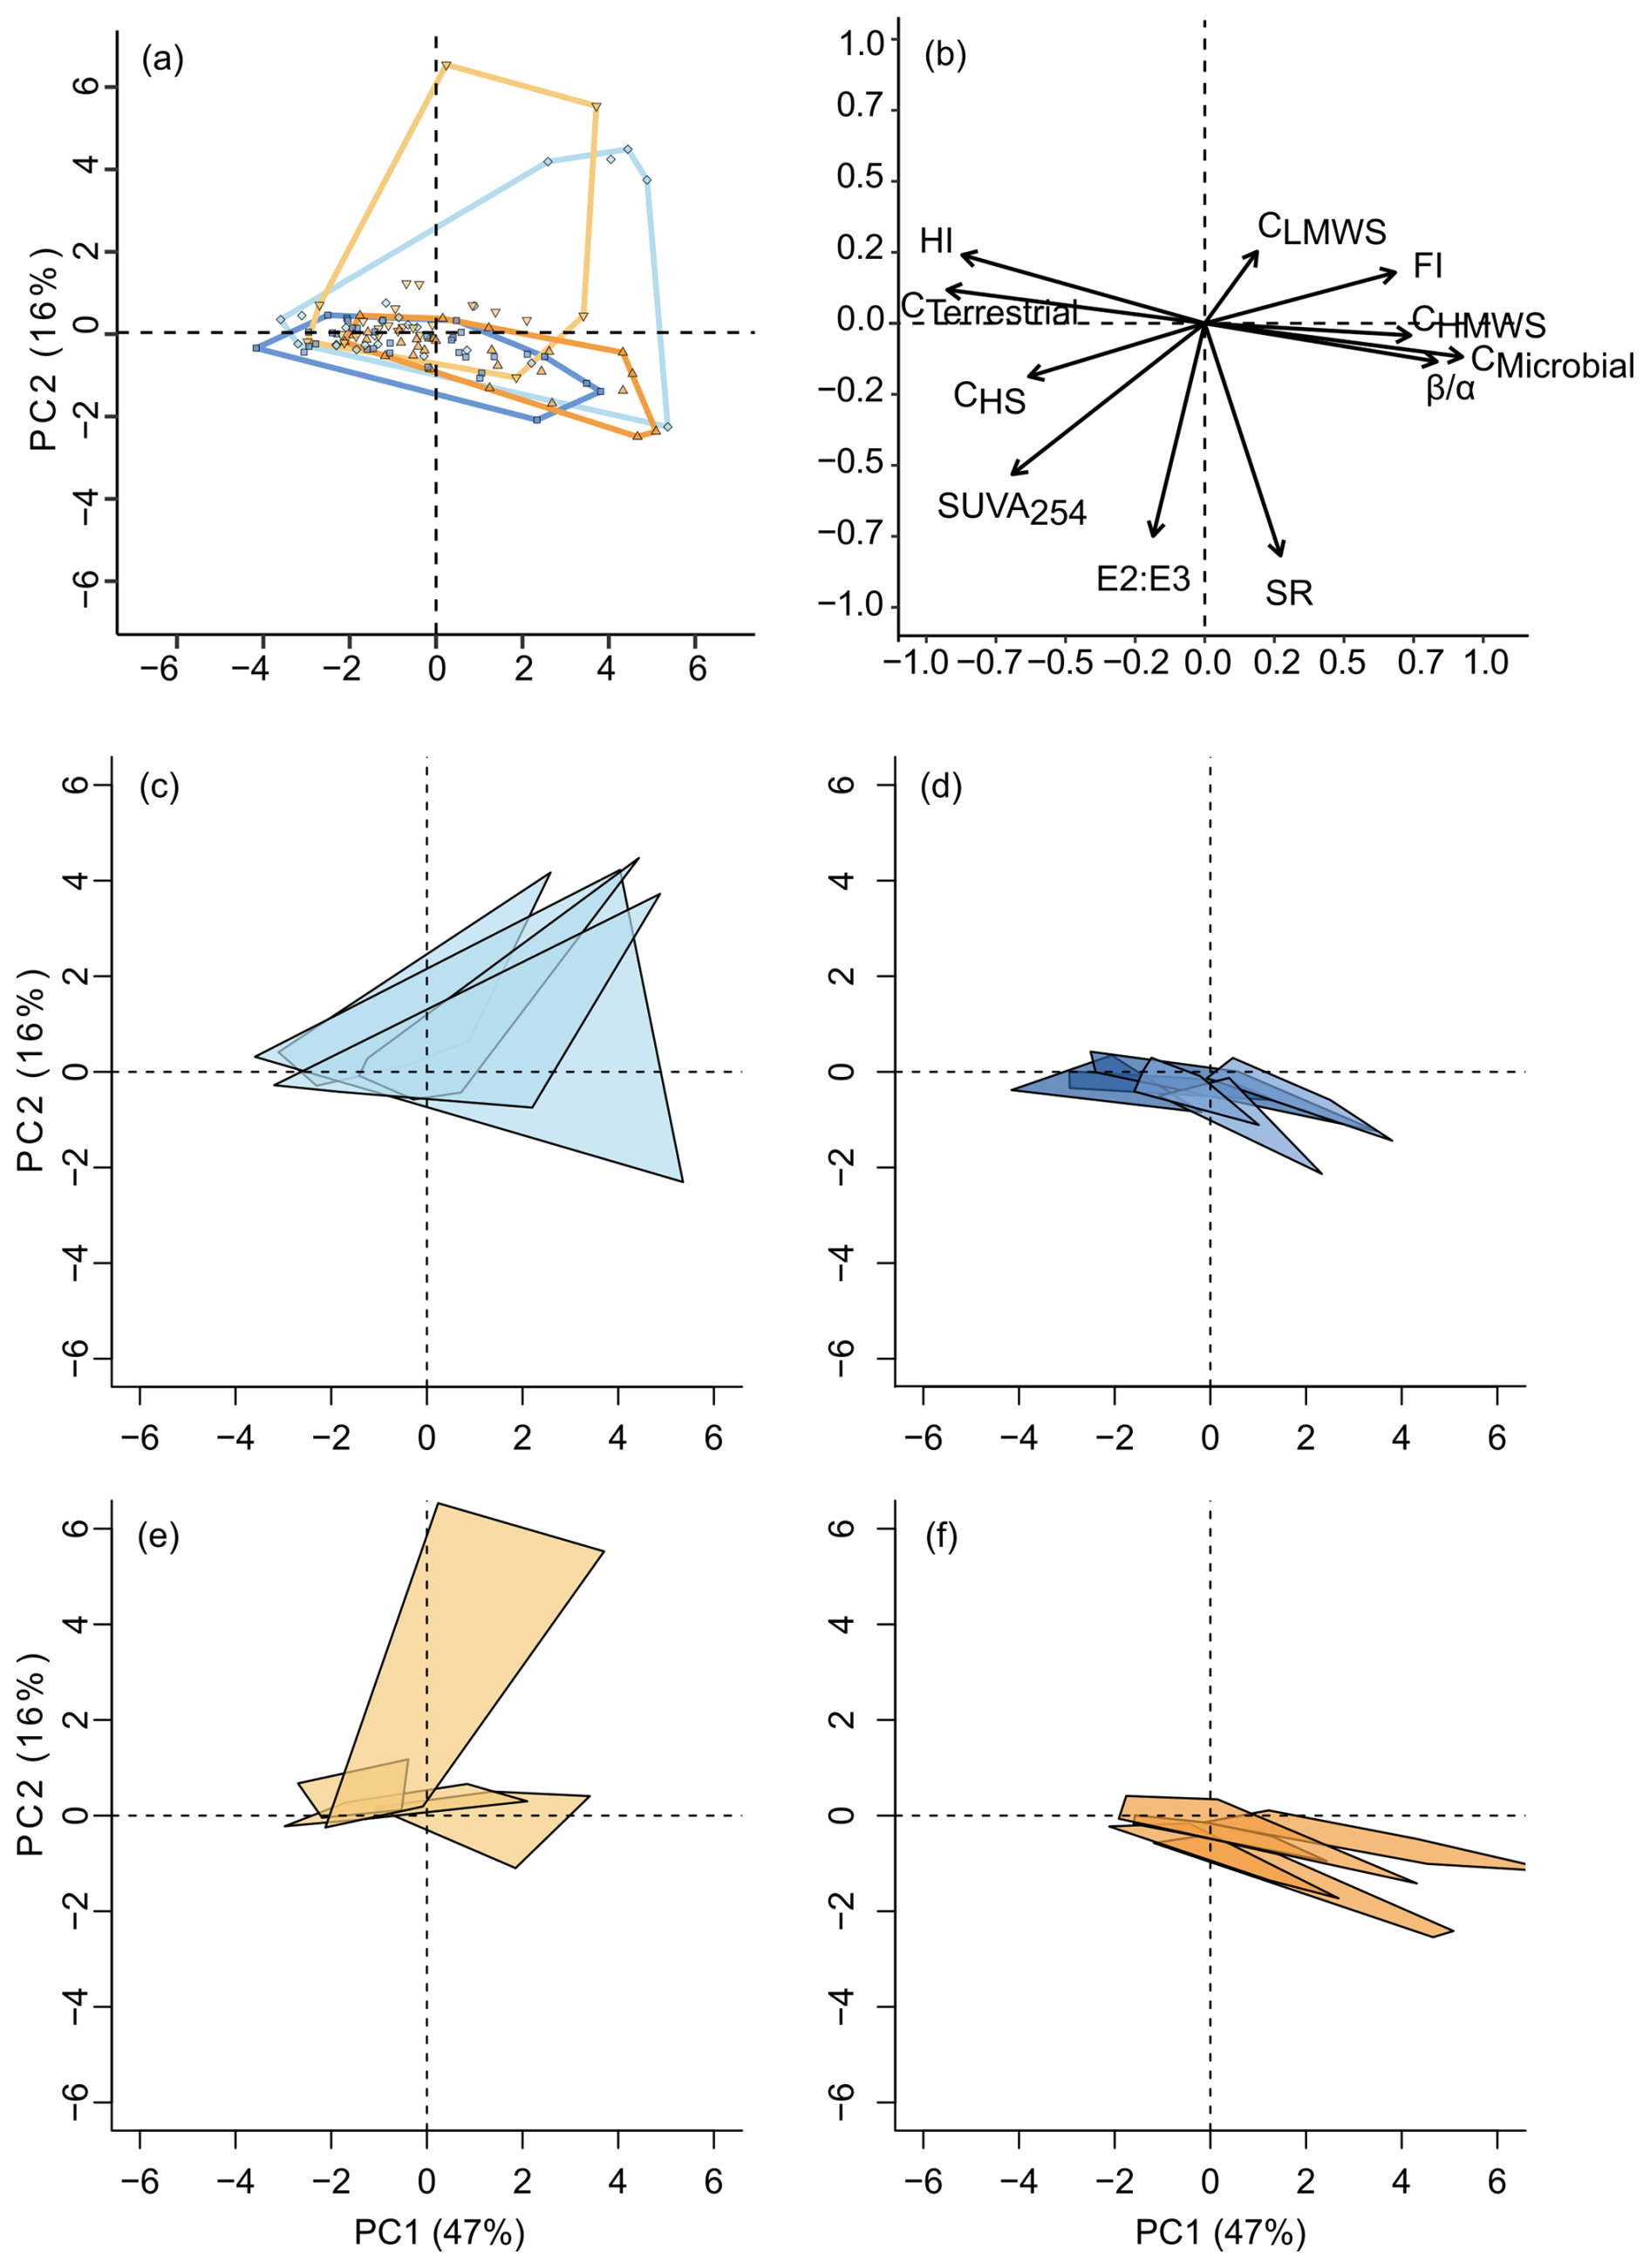
Figure 6Principal component analysis of DOM composition. Graphical representation of (a) scores and (b) loadings of the PCA results where scores of each sampling occasion show a large overlap of flow regimes in the DOM composition. Panels (e) and (f) show the seasonal shifts in DOM composition in each river as a polygon in the same PCA space, whereas in (c) the natural Atlantic rivers (nA) are represented in light blue, in (d) the altered Atlantic (aA) rivers are represented in dark blue, in (e) the natural Mediterranean (nM) rivers are represented in light orange, and in (f) the altered Mediterranean (aM) rivers are represented in dark orange. The PCA is based on absorbance and fluorescence measurements: humic-like components (Cterrestrial), protein-like components (Cmicrobial), specific absorption at 254 nm (SUVA254), the humification index (HIX), the fluorescence index (FI), the freshness index (), the slope ratio (SR), the inverse molecular weight indicator (E2 : E3) and size-exclusion chromatography fractions, which include high-MW biopolymers (CHMWS), humic substances (CHS), and low-MW substances (CLMWS).
We used the centroid location and average distance to the centroid of each river (represented as polygons in 2D space in Fig. 6c–f) as proxies for the annual average and temporal dispersion of DOM composition, respectively. We could not find a significant difference in centroid location, i.e. annual average DOM composition, between any of the compared pairs of flow regimes (Table S2). In terms of temporal dispersions, we could not identify a significant difference between the natural rivers or between the natural and altered Mediterranean rivers, yet we observed that natural Atlantic rivers have a significantly higher average distance to the centroid compared to their altered Atlantic equivalents (Figs. 6c and d, 7a, and Table S2). Thus, in Atlantic rivers, DOM composition was more variable over time when the flow regime was natural. This effect was not as clear in Mediterranean rivers: although DOM regimes appeared to be less temporally variable in all altered Mediterranean rivers, they showed a higher diversity in natural rivers. This higher diversity of DOM regimes in natural Mediterranean rivers, with some being naturally quite dynamic while others show fairly stable DOM composition in time, precluded the identification of a significant flow alteration effect. Notably, however, Mediterranean rivers showed slightly more clear-cut flow alteration effects along the individual PCA axes (see below), with slightly more prominent excursions towards higher PC1 scores and lower PC2 scores in dam-impacted rivers towards late summer and fall.
The global tests comparing the four flow regimes did not show any significant differences in among-river variance regarding the mean centroid location and the mean dispersions from the river centroids (Table S2). Still, DOM regimes did not appear similarly variable among the various flow regimes; specifically, the seasonal shifts in DOM composition in natural Mediterranean rivers were quite variable. Here, by optical assessment, dams caused a homogenization across rivers with invariable DOM throughout the seasons (Fig. 6e and f). Also, seasonal shifts in DOM composition in natural Mediterranean regimes seemed to be more variable than in their Atlantic counterparts.
Since individual PCA axes represent qualitatively distinct shifts in DOM composition, we looked at the timelines, average locations, and variances in rivers along the PC1 and PC2 axes separately as well. Timelines of DOM composition throughout the year showed similar patterns on the PC1 axis for all flow regimes (Fig. S2a and b). On the contrary, on the PC2 axis, natural rivers differ from their altered equivalents in both August and October (Fig. S2c and d). Plotting the index as a particular example, it turned out higher in October in altered Mediterranean rivers than in their natural equivalents; such a difference was not observed in other months or in Atlantic rivers (Fig. S2e and f). We could not find any significant difference in average location along the PC1 or PC2 axis between the two natural regimes or between the altered and natural Mediterranean rivers (Fig. 7b–c and Table S2). However, we can visually see that Atlantic rivers with irrigation dams have the three highest medians on the PC1 axis, while Atlantic rivers with hydropower dams have the three lowest medians.
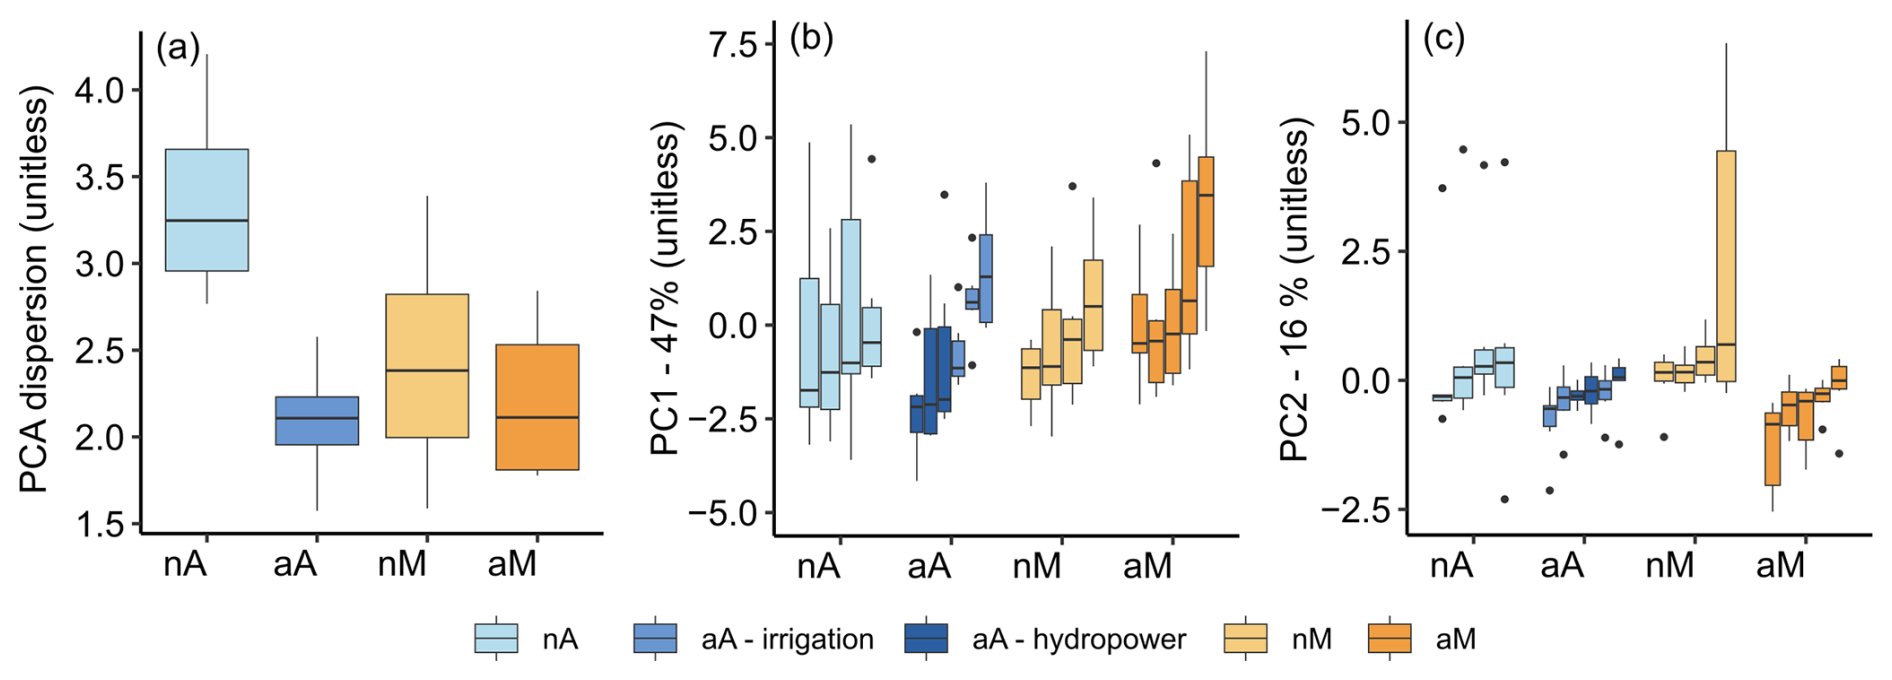
Figure 7Seasonal shifts in DOM composition as average dispersion (distance to river centroid) along all PCA axes (a); the temporal variation in DOM in each river along PC1 (b) and PC2 (c). The rivers are grouped by flow regime: natural Atlantic (nA, light blue), altered Atlantic (aA, dark blues), natural Mediterranean (nM, light orange), and altered Mediterranean (aM, dark orange) rivers. The aA rivers are separated into two reservoir purpose groups, irrigation and hydropower. All aM rivers have reservoirs used for irrigation.
We found that altered Atlantic rivers (Table S2) have lower average PC2 scores than natural Atlantic rivers. We could not find any significant difference in temporal variation along the PC1 or PC2 axis between the two natural rivers or between the altered and natural Mediterranean rivers (nM–aM; Fig. 7b–c and Table S2). However, we found that natural Atlantic flow regimes have significantly higher seasonal shifts in DOM composition than their altered equivalents along both the PC1 and PC2 axes (nA–aA; Table S2).
Moreover, along the PC1 axis, the among-river variation in mean DOM was similar among the rivers. Along the PC2 axis, we found a difference between the natural rivers (nA–nM; Table S2). Similarly, along PC1, among-river variation in seasonal shifts in DOM composition was similar for all the rivers. On the contrary, along the PC2 axis, it was different between both the natural rivers and the natural and altered Atlantic rivers (nA–nM, nA–aA; Table S2). These results confirm our visual assessments (Figs. 6c–f and 7).
3.4 Linking DOM regimes to flow regimes
The first component of the partial least-squares regression (PLSR) models explained 30.9 % of the variance in the dispersion in the entire multidimensional PCA space, 18.7 % of the variance on the PC1 axis, and 24.0 % of the variance on the PC2 axis. For ease of interpretation, only the first component was selected from each of the three PLSR models. Based on VIP >1 as a criterion, 34, 34, and 29 indices were selected to explain the multidimensional dispersion and the variance in the PC1 and PC2 axes, respectively. Mostly, indices identified as important for “multidimensional dispersion” – as the global model of shifts in DOM composition – were then also found to be relevant for explaining variances in PC1, PC2, or both axes. A few indices, however, were identified as relevant in only one of the three models, suggesting that multivariate dispersion may be a noisy but more comprehensive measure of shifts in DOM composition, i.e. capturing shifts in DOM composition that cannot be attributed solely to either PC1 or PC2.
The model for dispersion was driven by high flow in the wet winter and spring months (November, December, and January flow and March, April, and May flow; Fig. 8a) and low flow in the dry summer months (June, July, August, and September flows; Fig. 8a). Standard deviations of these flow magnitude indices showed a similar trend of positive correlation in wet months and negative correlation in dry months. Moreover, the dispersion increased with increasing magnitude and frequency of short-duration high-flow events (1, 3, or 7 d maximum and 1, 3, or 7 d frequency; Fig. 8a). Regarding the rate and frequency of flow change, the count of increasing flow days decreased and the count of decreasing flow days increased this dispersion (no increasing flow days, no decreasing flow days; Fig. 8a). Regarding the timing indices, the later date of the annual minimum flow was related to higher dispersion, whereas variation in this date (i.e. its standard deviation) was related to lower dispersion.
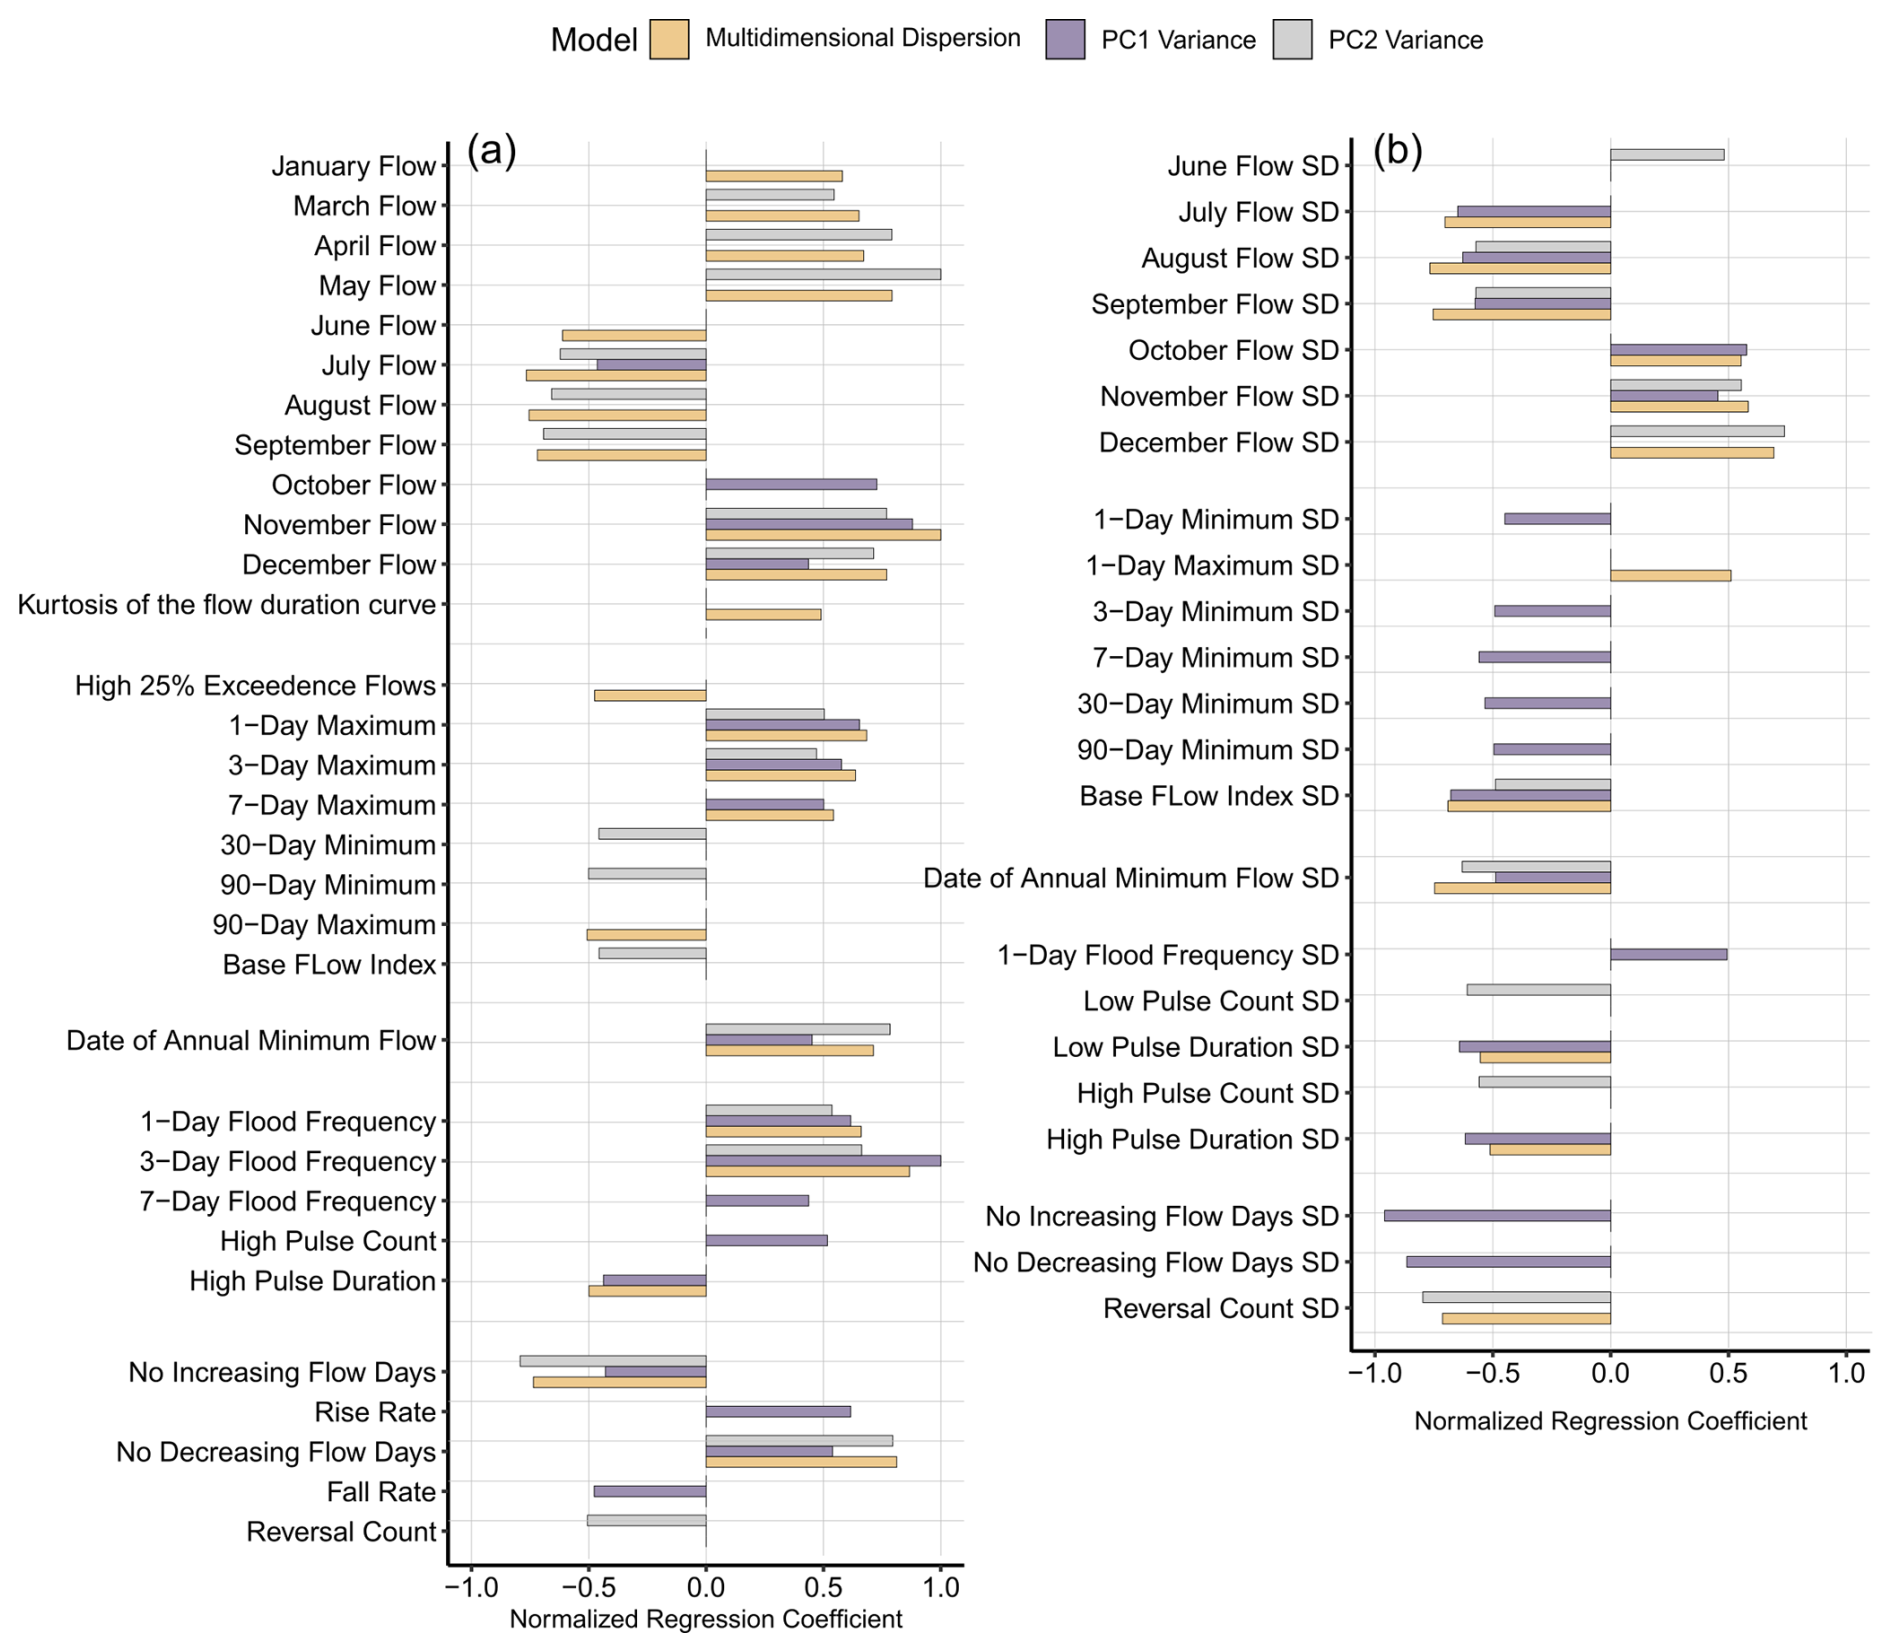
Figure 8Following the PLSR model, the indices with VIP scores higher than 1 were assessed for each model. (a) The mean indices and (b) the intra-annual standard deviation indices are separated for ease of interpretation. The yellow bars represent normalized regression coefficients for the indices in the model explaining multidimensional dispersion; the purple and grey bars represent the regression coefficients for the indices in the models explaining variance along PC1 (ranging from −0.07 to 0.07) and along PC2 (ranging from −0.06 to 0.06), respectively. For better comparison, regression coefficients were normalized to ranges of [−0.02, 0.02], [−0.07, 0.07], and [−0.06, 0.06] for dispersion, PC1, and PC2, respectively. The indices that belong to the same subgroup are grouped together. The complete list of indices used and their abbreviations are given in Table S3.
In addition to identifying the drivers of dispersion, we observed that PC2 variance decreased with increasing long-duration minimum flows, specifically while PC1 variance increased with increasing high flood frequency and counts. Similarly, PC1 variance increased with increasing rise rate and decreased with increasing fall rate. Additionally, we found that PC1 variance decreased with increasing SD of minimum flood-related indices, especially when most SD indices were negatively correlated.
In this study of 20 rivers, we compared the effects of dams altering two distinct natural flow regimes on DOM regimes. The literature suggests that dams do not influence all rivers alike (McManamay et al., 2012), and indeed, the likely high diversity of DOM regimes associated with natural flow regimes makes similar reactions to damming appear improbable. On the other hand, a suite of common ecological effects associated with reservoirs, e.g. the simple fact of increased residence time, may indeed drive commonalities in DOM regime response to a dam-induced alteration of natural flow dynamics. In reality, the natural flow regime forms a baseline, on top of which a dam with a reservoir of a certain size and type of operation may alter the flow, with consequences for the DOM regime. We acknowledged this in our study design by restricting the study rivers to two distinct natural reference flow regimes, namely the Atlantic and the Mediterranean.
Notably, in several aspects, DOM regimes were more variable across the natural and altered Mediterranean rivers, hampering the identification of similar responses to dam-induced flow alteration in Atlantic and Mediterranean regimes by a strict comparison of altered rivers to their natural equivalents. However, DOM regimes showed consistent features in both altered Atlantic and Mediterranean rivers. We suggest that reservoir effects (i.e. hydraulic residence times and operation schemes; Maavara et al., 2020), which cause flow seasonality shifts and flow regime smoothing, may work towards altered DOM regimes in downstream systems along a range of pathways. This may ultimately lead to unique outcomes for each river, yet with some consistencies despite rivers belonging to different reference flow regimes.
4.1 Investigated flow regimes and observed flow alterations
This study benefits from the work of Peñas and Barquín (2019), who classified natural flow regimes on the Iberian Peninsula into 20 distinct regime types (or hydrological classes), of which we selected 2. Indeed, natural rivers in both classes have pretty distinct flow regimes, each with common features. Hence, both natural flow regimes have a low variance of flow descriptors among their rivers (Fig. 1c). On the contrary, the high among-river variations in flow variability boxplots in most altered regimes (Fig. 4) combined with the hydrographs (Fig. 3) indicate little commonality in flow regimes across the altered rivers: while some rivers have smoother hydrographs, others show a tendency towards increased temporal variation in their flow regimes (e.g. introducing summer high flows and/or winter low flows) or show little influence of the dam on the seasonal timescale studied. This is in accordance with the literature suggestions of diverse effects upon damming, and while it may push some rivers outside of their normal hydrological functioning (McManamay et al., 2012), others may still behave similarly to their expected natural flow regimes.
As visible by their higher among-river variation, flow alterations diversified Atlantic rivers more than Mediterranean rivers (Fig. S3). Indeed, both reference flow regimes diversified in different directions, mostly due to various reservoir designs, purposes, and sizes. Altered flow regimes are thus not as easily classified and not as distinct as their natural equivalents. However, we also observed two common features of altered flow regimes: (1) the general loss of dynamics throughout the year through less intense 1 d high flows (Fig. 4a) and more intense seasonal low flows (Fig. 4e and f) and (2) the newly introduced summer high flows resulting in a shift in flow seasonality (Fig. 4b and e). The latter was especially pronounced in Mediterranean rivers, where reservoirs exclusively serve the purpose of irrigation and thus release water to arid downstream regions during summer. Additionally, the reservoir capacity is surpassed in some but not all smaller reservoirs in late winter to early spring, resulting in an unreliably appearing secondary earlier “release”, hence the double-humped shape of some altered flow regimes. Reservoirs in our study ranged in size between 2 and 664 hm3; thus some but not all were big enough to hold high spring flows for storage until release in a single summer peak. A similar seasonal water release does not exist in the altered Atlantic rivers, especially those flowing to the north (Nalon, Nanca, Narcea). These hydropower reservoirs have low storage capacity; hence – at the seasonal timescale studied – they more closely mimic the intense summer low flows of their natural equivalents. We note that hydropower as a purpose does not in principle prevent seasonal water storage for later hydropeaking (Almeida et al., 2020), yet hydropeaking was not observed in the studied rivers.
Thus, in our study, flow regimes diversify through common yet varied types of alteration. Our study design implied the creation of inherently heterogeneous altered flow regime groups, with reservoirs differing in size and residence time, but also facilitated various stratification patterns and showed various kinds of warming potential. One thing our study cannot achieve by design is to look for commonalities in DOM regimes for reasonably categorized, distinct types of flow alteration. In fact, grouping reservoirs by purpose (irrigation vs. hydropower) resulted in little difference between the studied DOM regimes despite their distinct flow features. Thus, we believe that any commonality we find based on a coarser definition of mere “dam-induced flow alteration” may be of prominent importance and strong applicability.
4.2 Responses of annually averaged DOM quantity and composition towards flow regimes
In our comparison of annual averages of DOM quantity (DOC) in natural and altered rivers, tests missed significance likely due to low statistical power despite median values of altered rivers appearing higher, specifically in the Atlantic rivers. Yet, a clear-cut response of DOM quantity to flow regimes or their alteration is maybe naive to expect. The DOM quantity of natural rivers is affected by various environmental factors such as topography, climate, and land cover. In contrast, in altered rivers, it is additionally influenced by factors such as dam operation, reservoir stratification, and reservoir water temperature (Maavara et al., 2020). Various studies have found conflicting results for reservoirs: increasing, decreasing, or not altering DOC concentrations of the downstream systems (Ulseth and Hall, 2015). In rivers from arid regions with high flow variation, for example, upstream reservoirs may act as a carbon source (Parks and Baker, 1997) or a carbon sink (Miller, 2012). In temperate regions, upstream reservoirs may act as a carbon source (Knoll et al., 2013), while no change was observed in the reservoirs of boreal rivers (Nadon et al., 2015; Imtiazy et al., 2024).
The existing diversity of influences makes a common response of DOM quantity to flow alteration across Atlantic and Mediterranean rivers unlikely, especially when considering the highly integrative nature of a variable like annually averaged DOC that integrates DOM across various sources and chemical compositions, as well as over time. Yet, in our study, we observed an increasing trend in DOC from natural to altered rivers when Atlantic and Mediterranean rivers were separated. One explanation for this apparent effect of dams on DOC concentration could reflect a sampling problem associated with the efficient capture, transient storage, and averaging of extreme DOM amounts delivered to the river network from the catchment during short-term flood events (Raymond et al., 2016). In this explanation, dams with large enough reservoirs interfere with the downstream transmission of a DOM pulse during a flood, but more importantly, this DOM pulse is transiently stored in the reservoir and – if not subjected too strongly to bio- and photodegradation – passed on downstream later over a longer time period. Thanks to dams interfering with naturally occurring flow and DOM pulses, downstream DOM composition is “hydrologically averaged” and invariant in time. Thus, sampling at discrete points in time in altered, downstream rivers results in relatively high and stable values, while it is highly unlikely that with just six sampling dates we were able to capture a pulse on any of our natural rivers, whose annual mean DOC then ends up being underestimated. In addition or as an alternative to this effect of temporal smoothing of terrigenous DOM pulses, productivity in reservoirs may contribute additional DOM of autochthonous origin, which could potentially also counteract losses by bio- and photodegradation. All these mechanisms are associated with the residence time of water in the reservoirs, yet they expectedly result in different DOM compositions passed on to downstream river reaches.
Strictly looking at annual average measures for DOM composition between natural and altered flow regimes, we found only limited evidence for differences; we observed a significant flow alteration effect on mean DOM composition only along PC2 for Atlantic rivers. Here, altered rivers appeared on average more humic, with signs of photodegradation (SR). The (further) lack of significant effects between naturally flowing and flow-altered rivers with regard to (average) DOM composition to some extent supports the idea of reservoirs as smoothers of a variable, natural DOM regime, or it may imply that other factors such as hydrology or catchment characteristics have an overriding influence on DOM composition, thereby masking any potential reservoir effect by a lot of noise.
In fact, the literature on linking DOM composition to dams has mixed results. Some studies show that a high export of autochthonous and biolabile DOM caused by increased primary production in reservoirs and tailwaters may result in a shift from terrestrially sourced DOM to protein-like DOM downstream of dams (Imtiazy et al., 2024; Ulseth and Hall, 2015; Nadon et al., 2015). On the contrary, other studies claim that dams of certain sizes and functions may have no significant effect on downstream DOM composition. In boreal rivers, for example, no shift in DOM composition from terrestrial to protein-like was observed downstream of hydropower and storage dams (Nadon et al., 2015). However, another study from the same climatic region observed that increased residence time in a hydropower-producing mesotrophic reservoir shifted the DOM composition from allochthonous to autochthonous (Imtiazy et al., 2024). This diversity of responses again points to a particular source of noise in our study that may have caused difficulties in finding clear-cut effects of flow alteration on DOM composition: the fact that we grouped various dams of different purposes and sizes under the term “flow alteration”. In this respect, reservoir trophic state and dam operations, such as the timing of the reservoir filling or water release, are also of concern, specifically regarding their influence on the composition of DOM transported to downstream reaches by interfering with residence times and the transmission of upstream source signals (Xenopoulos et al., 2021). Indeed, dams can be a carbon source or a carbon sink depending on many such factors related to the dam's nature and operation; potentially, they cause DOM composition to respond to flow alteration in opposite ways.
4.3 DOM regime reactions: Atlantic and Mediterranean rivers show divergent responses to flow regime alterations but with similar outcomes
A DOM regime may be better described than just by annually averaged DOC and DOM composition, especially when these variables are subject to dynamic processes and show pronounced temporal variability. Indeed, when looking at the temporal change in DOM composition indicators (Fig. S2), we observed specific differences in summer and fall months between the natural and altered regimes in both Atlantic and Mediterranean rivers. The divergence between natural and altered rivers is even more obvious in the multivariate analysis, specifically along PC2 as well as in , where in particular during summer, DOM in altered rivers behaved differently than in natural rivers (Fig. S2c–f).
To make use of the temporally spaced information without having to resort to time series analyses, we computed measures of variation in DOC and of shifts in DOM composition on the annual timescale as descriptors of the DOM regime. We reasoned that such integrative measures based on variance can also be quite flexibly computed in cases where the temporal spacing of measurements is uneven, where it is not aligned among rivers, or where sampling is sparse or spread randomly over multiple years.
Hydrological seasonality and event-induced flow variation are the main drivers of annual variation in carbon concentration in natural rivers (Fasching et al., 2016). However, we could not observe an effect of flow regime on the annual DOC variation, nor could we observe any clear differences among annual timelines of DOC (Fig. 5b and c). On the contrary, we found several DOM indices showing differences in their annual variance (CV values) and in multivariate dispersion among natural and altered flow regimes. Specifically, dam-impacted Atlantic rivers showed consistently lower temporal variation in various indices, multivariate dispersion, and PCA axes. Thus, dams in these rivers led to a significant temporal homogenization of DOM in downstream sections. These patterns appeared in Mediterranean rivers as well, most notably when assessing multivariate dispersion (Fig. 6). However, in Mediterranean rivers, the differences between natural and altered flow regimes were insignificant for most indicators, largely because of remarkably higher spatial variation in temporal CVs across the various natural Mediterranean rivers. DOM regimes in naturally flowing Mediterranean rivers were indeed either quite variable over time or fairly stable – a finding that strongly contrasts with the consistently dynamic DOM regimes of natural Atlantic rivers (Figs. 6 and 7). Taken together, our results suggest that dams may lead to fairly consistent and temporally stable DOM regimes in downstream river sections even in climatically different reference flow regimes and contrast the high diversity of DOM regimes potentially appearing in natural flow, especially in Mediterranean rivers.
4.4 Dam- and reservoir-associated mechanisms behind DOM regime reactions to flow alteration
Our PLSR results linking flow regime characteristics to multidimensional dispersion and variance along the PC1 and PC2 axes yield more insights into the mechanisms behind seasonal shifts in DOM composition. Short-duration high-flow events are the key to moving terrestrially stored carbon into the riverine system via increased riparian connectivity. The PLSR results show wider annual shifts in DOM composition, with an increase in indices describing magnitude (1, 3, and 7 d maximum) and frequency (1, 3, and 7 d flood frequency) of such short-duration high-flow events (Fig. 8a). These relationships may be partly driven by natural differences in terrestrial DOM mobilization, but it is likely that they are also associated with the ability of reservoirs to interfere with the downstream transmission of a terrigenous DOM pulse.
Indeed, many reservoirs in northern Spain are associated with a decreased frequency of high-flow events due to the storage of water in the reservoir and downstream flow smoothing (Aristi et al., 2014). In our study, in both natural flow regimes, summer low flows follow high winter and spring flows (with some climate-specific variation, for instance in the exact timing and intensity of drought). Thus, flow alteration largely leads to a more-or-less strong reversal of seasonal dynamics by retaining water in reservoirs in winter and spring for later release during summer. This effect is greater in Mediterranean rivers. This seasonality of the flow regimes in our study is reflected in patterns of shifting DOM composition: PLSR modelling identified a positive effect of mean monthly flows in winter and spring (floods) but a negative effect of mean monthly flows in summer (droughts) on the magnitude of the shifts in DOM composition. This is corroborated by relatively higher terrestrial signals in the rainy spring months in natural rivers (Fig. S2a and b) and also shown by the positive effect of seasonal high flows (March, April, May) on PC1, indicating aromaticity and molecular weight variance. This is in accordance with the current scientific consensus that high flows are generally linked to allochthonous DOM inputs, while low flows promote autochthonous production (Imtiazy et al., 2024). Natural flow regimes allow the transmission of flood-induced terrigenous DOM pulses in spring while such DOM is rare in these rivers during summer low flows, when there is increased opportunity for production of autochthonous DOM. On the other hand, in altered flow regimes, reservoirs pass on seasonally smoothed and thus rather invariable terrigenous DOM to downstream systems long into summer (Fig. S2e and f). The negative effect of summer flows on the magnitude of shifts in DOM composition is likely as much driven by low summer flows in natural flow regimes as by high summer flows in altered flow regimes. In altered flow below dams, the lack of summer drought lowers the natural variation in the DOM composition of a river.
On the other hand, low flow during naturally dry summer months may directly increase the variation in DOM composition through higher microbial signals from autochthonous production of DOM in the barely flowing rivers. This is shown by higher PC1 and PC2 values during summer low flow in the natural Atlantic rivers, while DOM remained comparably invariable in the altered Atlantic rivers (Fig. S2). A similar microbially sourced carbon pulse was observable in altered rivers in October, coinciding with the lowest flow rate for these rivers. This finding still agrees with the earlier interpretation of reservoirs as hydrological smoothers of upstream DOM signals, which, however, may include not only terrigenous DOM but also material produced in stream. Within reservoirs, these two types of material may then be subjected to photo- and bio-degradation, ultimately leaving less labile humic material for continuous downstream export with little compositional variation.
A counter-effect of the lowered autochthonous contribution from upstream rivers to DOM variance in the altered rivers may be the potential production of DOM in the reservoirs, especially when reservoirs have longer residence times (Ulseth and Hall, 2015; Imtiazy et al., 2024), have a reasonable nutrient supply (Maavara et al., 2020), and support warming. For Atlantic rivers, our data do not suggest reservoirs as sources of new autochthonous material. For Mediterranean rivers, summertime excursions of DOM towards higher PC1 scores (i.e. towards more microbial DOM and higher FI and ratios; Fig. S2b, d, and f) suggest some influence of DOM production within reservoirs, even though this effect was not statistically tested. These results agree with the generally good ecological status and thus low trophic state of the reservoirs (Table 1).
Notably, the buffering effect of reservoirs may also imply a change in DOM composition due to higher degradation as a result of longer residence time. We observed that in the August–October measurements, PC2, which is strongly correlated with SR and E2 : E3, diverges between natural and altered rivers in both the Atlantic and Mediterranean regimes. Here, natural rivers have positive values, and altered rivers have negative values. We think that this may be related to the higher irradiation, as SR indicates photodegradation. This might be due to two factors: longer residence times in the reservoir leading up to these moments of sampling and water release from the reservoirs over the summer that decreases water depth and thus increasing light penetration.
The pervasive effects of dams on DOM regimes also had an interesting additional effect, when looking at the spatial variation in DOM regimes across rivers. When assessing DOM composition, we observed that flow alterations homogenized the DOM regime across rivers despite our dams being of differing sizes and purposes, altering flow regimes in various directions (e.g. Fig. 6). This loss of the natural spatial diversity of DOM regimes across rivers indicates that dams have a powerful homogenizing effect on DOM regimes at the landscape scale. Interestingly, we could not find such an effect for the variation in DOC and CVDOC. Here, data inspection (Fig. 5 and Table 4) shows a non-significant trend towards increasing spatial variation across rivers, from natural to altered rivers. This would indicate a spatial diversification of DOM regimes in terms of quantitative behaviour, which parallels the flow regime diversification due to dams.
In our study, we investigated how dams serving various purposes alter flow and DOM regimes in rivers with two distinct natural (reference) flow patterns. We concluded that dams in our study can move rivers outside of their normal river function, in terms of both annual average and annual variance of DOC concentration and composition, towards surprisingly similar outcomes despite differences in underlying natural hydrology. Dam effects, such as high flows during natural seasonal drought and interference with natural high- and low-flow events, are likely the driving factors of the decrease in seasonal shifts in DOM composition. A main mechanism is the prevention of transmission of upstream-sourced terrigenous and autochthonous DOM to downstream-located systems. In conclusion, the often drastic seasonality reversals of the flow regime can strongly impact the seasonality of the DOM composition. It appears that in our study area, reservoirs act as a buffer, where longer residence times average out the naturally occurring shifts in DOM composition by trapping the upstream-sourced carbon inputs in the reservoir for a longer time and subjecting them to bio- and photodegradation, thus sending relatively invariable DOM further downstream. This effect was similar across all altered flow regimes despite the diversity of dam types and purposes.
Flow alterations thus resulted in the homogenization of DOM downstream of dams across time (within each river) and space (across rivers). This may have important consequences for riverine carbon cycling. In natural flow regimes, considerably variable DOM meets benthic bacterial consumers that undergo frequent succession due to disturbance by flow. The likely resulting mismatch between the chemical traits of incoming DOM and the microbial functions needed to process this DOM as a resource limits its metabolism (Talluto et al., 2024). In contrast, in altered flow regimes, there is an increased chance for a match between diverse but stable carbon resources and functions of their heterotrophic consumers in the now-less-disturbed microbial communities. Ultimately, this would translate to increased metabolism of terrigenous DOM and increasingly higher CO2 emissions from rivers downstream of dams. Notably, this yet-to-be-tested effect on riverine carbon cycling comes on top of already-known effects on intensified DOM processing caused by higher residence times in reservoirs. Increasing knowledge on this frontier could also help us to design flow alteration strategies that prevent impacts on ecosystem structure and functioning and move one step forward in restoring natural riverine habitats.
The R code used for the data analysis and visualizations in this paper is openly available on Zenodo at https://doi.org/10.5281/zenodo.14992677 (Kubilay, 2025).
The optical data used in the analysis are openly available on Zenodo at https://doi.org/10.5281/zenodo.13354316 (Kubilay, 2024). Hydrological data is obtained from Pompeu et al. (2022) and Goldenberg-Vilar et al. (2022) and can be obtained from the authors.
The supplement related to this article is available online at https://doi.org/10.5194/bg-22-3279-2025-supplement.
SK – conceptualization, methodology, software, formal analyses, visualization, and writing (original draft and review and editing). EE – conceptualization and data curation. JBO – funding acquisition, conceptualization, and writing (review and editing). GS – funding acquisition, conceptualization, methodology, supervision, and writing (review and editing). All authors have read and agreed to the published version of the paper.
At least one of the (co-)authors is a member of the editorial board of Biogeosciences. The peer-review process was guided by an independent editor, and the authors also have no other competing interests to declare.
Publisher's note: Copernicus Publications remains neutral with regard to jurisdictional claims made in the text, published maps, institutional affiliations, or any other geographical representation in this paper. While Copernicus Publications makes every effort to include appropriate place names, the final responsibility lies with the authors.
We thank our colleagues from IHCantabria for their help in sample collection. We also thank our colleagues from the Leibniz Institute of Freshwater Ecology and Inland Fisheries for sample processing.
This project was funded by the EU H2020 Research and Innovation Program under Marie Skłodowska-Curie grant agreement no. 765553.
This paper was edited by Ji-Hyung Park and reviewed by Ji-Hyung Park and one anonymous referee.
Almeida, R. M., Hamilton, S. K., Rosi, E. J., Barros, N., Doria, C. R. C., Flecker, A. S., Fleischmann, A. S., Reisinger, A. J., and Roland, F.: Hydropeaking operations of two run-of-river mega-dams alter downstream hydrology of the largest Amazon tributary, Frontiers in Environmental Science, 8, 120, https://doi.org/10.3389/fenvs.2020.00120, 2020. a
Anderson, M. J.: A new method for non-parametric multivariate analysis of variance, Austral Ecology, 26, 32–46, https://doi.org/10.1111/j.1442-9993.2001.01070.pp.x, 2001. a
Anderson, M. J.: Distance-based tests for homogeneity of multivariate dispersions, Biometrics, 62, 245–253, https://doi.org/10.1111/j.1541-0420.2005.00440.x, 2006. a
Andrea, B., Francesc, G., Jérôme, L., Eusebi, V., and Francesc, S.: Cross-site comparison of variability of DOC and nitrate c–q hysteresis during the autumn–winter period in three Mediterranean headwater streams: a synthetic approach, Biogeochemistry, 77, 327–349, https://doi.org/10.1007/s10533-005-0711-7, 2006. a, b
Aristi, I., Arroita, M., Larrañaga, A., Ponsatí, L., Sabater, S., von Schiller, D., Elosegi, A., and Acuña, V.: Flow regulation by dams affects ecosystem metabolism in Mediterranean rivers, Freshwater Biol., 59, 1816–1829, https://doi.org/10.1111/fwb.12385, 2014. a
Battin, T. J., Kaplan, L. A., Findlay, S., Hopkinson, C. S., Marti, E., Packman, A. I., Newbold, J. D., and Sabater, F.: Biophysical controls on organic carbon fluxes in fluvial networks, Nat. Geosci., 1, 95–100, https://doi.org/10.1038/ngeo101, 2008. a
Carrascal, L. M., Galván, I., and Gordo, O.: Partial least squares regression as an alternative to current regression methods used in ecology, Oikos, 118, 681–690, https://doi.org/10.1111/j.1600-0706.2008.16881.x, 2009. a
Catalán, N., Marcé, R., Kothawala, D. N., and Tranvik, L. J.: Organic carbon decomposition rates controlled by water retention time across inland waters, Nat. Geosci., 9, 501–504, https://doi.org/10.1038/ngeo2720, 2016. a
Chen, M., He, W., Choi, I., and Hur, J.: Tracking the monthly changes of dissolved organic matter composition in a newly constructed reservoir and its tributaries during the initial impounding period, Environ. Sci. Pollut. R., 23, 1274–1283, https://doi.org/10.1007/s11356-015-5350-5, 2016. a
Coble, A. A., Koenig, L. E., Potter, J. D., Parham, L. M., and McDowell, W. H.: Homogenization of dissolved organic matter within a river network occurs in the smallest headwaters, Biogeochemistry, 143, 85–104, https://doi.org/10.1007/s10533-019-00551-y, 2019. a, b
Derrien, M., Kim, M.-S., Ock, G., Hong, S., Cho, J., Shin, K.-H., and Hur, J.: Estimation of different source contributions to sediment organic matter in an agricultural-forested watershed using end member mixing analyses based on stable isotope ratios and fluorescence spectroscopy, Sci. Total Environ., 618, 569–578, https://doi.org/10.1016/j.scitotenv.2017.11.067, 2018. a
Fasching, C., Ulseth, A. J., Schelker, J., Steniczka, G., and Battin, T. J.: Hydrology controls dissolved organic matter export and composition in an Alpine stream and its hyporheic zone, Limnol. Oceanogr., 61, 558–571, https://doi.org/10.1002/lno.10232, 2016. a
Fellman, J. B., Hood, E., and Spencer, R. G. M.: Fluorescence spectroscopy opens new windows into dissolved organic matter dynamics in freshwater ecosystems: a review, Limnol. Oceanogr., 55, 2452–2462, https://doi.org/10.4319/lo.2010.55.6.2452, 2010. a
Goldenberg-Vilar, A., Delgado, C., Peñas, F. J., and Barquín, J.: The effect of altered flow regimes on aquatic primary producer communities: diatoms and macrophytes, Ecohydrology, 15, e2353, https://doi.org/10.1002/eco.2353, 2022. a, b, c, d
Hansen, A. M., Kraus, T. E. C., Pellerin, B. A., Fleck, J. A., Downing, B. D., and Bergamaschi, B. A.: Optical properties of dissolved organic matter (DOM): effects of biological and photolytic degradation, Limnol. Oceanogr., 61, 1015–1032, https://doi.org/10.1002/lno.10270, 2016. a, b, c
Harjung, A., Perujo, N., Butturini, A., Romaní, A. M., and Sabater, F.: Responses of microbial activity in hyporheic pore water to biogeochemical changes in a drying headwater stream, Freshwater Biol., 64, 735–749, https://doi.org/10.1111/fwb.13258, 2019. a, b
Hayes, D. S., Brändle, J. M., Seliger, C., Zeiringer, B., Ferreira, T., and Schmutz, S.: Advancing towards functional environmental flows for temperate floodplain rivers, Sci. Total Environ., 633, 1089–1104, https://doi.org/10.1016/j.scitotenv.2018.03.221, 2018. a, b
Heinz, M. and Zak, D.: Storage effects on quantity and composition of dissolved organic carbon and nitrogen of lake water, leaf leachate and peat soil water, Water Res., 130, 98–104, https://doi.org/10.1016/j.watres.2017.11.053, 2018. a
Huber, S. A., Balz, A., Abert, M., and Pronk, W.: Characterisation of aquatic humic and non-humic matter with size-exclusion chromatography – organic carbon detection – organic nitrogen detection (LC-OCD-OND), Water Res., 45, 879–885, https://doi.org/10.1016/j.watres.2010.09.023, 2011. a
Imtiazy, M. N., Hunter, K., and Hudson, J. J.: In-reservoir transformation of dissolved organic matter as a function of hydrological flow, J. Environ. Manage., 352, 120099, https://doi.org/10.1016/j.jenvman.2024.120099, 2024. a, b, c, d, e
Jaffé, R., McKnight, D., Maie, N., Cory, R., McDowell, W. H., and Campbell, J. L.: Spatial and temporal variations in DOM composition in ecosystems: the importance of long-term monitoring of optical properties, J. Geophys. Res.-Biogeo., 113, G04032, https://doi.org/10.1029/2008JG000683, 2008. a, b
Kaplan, L. A., Weigner, T. N., Newbold, J. D., Ostrom, P. H., and Gandhi, H.: Untangling the complex issue of dissolved organic carbon uptake: a stable isotope approach, Freshwater Biol., 53, 855–864, https://doi.org/10.1111/j.1365-2427.2007.01941.x, 2008. a
Knoll, L. B., Vanni, M. J., Renwick, W. H., Dittman, E. K., and Gephart, J. A.: Temperate reservoirs are large carbon sinks and small CO2 sources: results from high-resolution carbon budgets, Global Biogeochem. Cy., 27, 52–64, https://doi.org/10.1002/gbc.20020, 2013. a
Kothawala, D. N., von Wachenfeldt, E., Koehler, B., and Tranvik, L. J.: Selective loss and preservation of lake water dissolved organic matter fluorescence during long-term dark incubations, Sci. Total Environ., 433, 238–246, https://doi.org/10.1016/j.scitotenv.2012.06.029, 2012. a, b, c, d, e
Kraus, T., Bergamaschi, B., Hernes, P., Doctor, D., Kendall, C., Downing, B., and Losee, R.: How reservoirs alter drinking water quality: organic matter sources, sinks, and transformations, Lake Reserv. Manage., 27, 205–219, https://doi.org/10.1080/07438141.2011.597283, 2011. a, b
Kubilay, S.: Chemical Data used in the “Riverine dissolved organic matter responds differently to alterations in two distinct hydrological regimes from Northern Spain”, Zenodo [data set], https://doi.org/10.5281/zenodo.13354316, 2024. a
Kubilay, S.: Selkubi/Cantabria-Paper-Data-Analysis-and- Visualisations: v0.0.2, Zenodo [code], https://doi.org/10.5281/zenodo.14992677, 2025. a
Lambert, T., Bouillon, S., Darchambeau, F., Massicotte, P., and Borges, A. V.: Shift in the chemical composition of dissolved organic matter in the Congo River network, Biogeosciences, 13, 5405–5420, https://doi.org/10.5194/bg-13-5405-2016, 2016a. a, b, c, d, e
Lambert, T., Teodoru, C. R., Nyoni, F. C., Bouillon, S., Darchambeau, F., Massicotte, P., and Borges, A. V.: Along-stream transport and transformation of dissolved organic matter in a large tropical river, Biogeosciences, 13, 2727–2741, https://doi.org/10.5194/bg-13-2727-2016, 2016b. a, b
Lambert, T., Bouillon, S., Darchambeau, F., Morana, C., Roland, F. A. E., Descy, J.-P., and Borges, A. V.: Effects of human land use on the terrestrial and aquatic sources of fluvial organic matter in a temperate river basin (The Meuse River, Belgium), Biogeochemistry, 136, 191–211, https://doi.org/10.1007/s10533-017-0387-9, 2017. a
Lehner, B. and Grill, G.: Global river hydrography and network routing: baseline data and new approaches to study the world's large river systems, Hydrol. Process., 27, 2171–2186, https://doi.org/10.1002/hyp.9740, 2013. a
Lin, H. and Guo, L.: Variations in colloidal DOM composition with molecular weight within individual water samples as characterized by flow field-flow fractionation and EEM-PARAFAC analysis, Environ. Sci. Technol., 54, 1657–1667, https://doi.org/10.1021/acs.est.9b07123, 2020. a
Loiselle, S. A., Bracchini, L., Dattilo, A. M., Ricci, M., Tognazzi, A., Cózar, A., and Rossi, C.: The optical characterization of chromophoric dissolved organic matter using wavelength distribution of absorption spectral slopes, Limnol. Oceanogr., 54, 590–597, https://doi.org/10.4319/lo.2009.54.2.0590, 2009. a
Maavara, T., Chen, Q., Van Meter, K., Brown, L. E., Zhang, J., Ni, J., and Zarfl, C.: River dam impacts on biogeochemical cycling, Nature Reviews Earth and Environment, 1, 103–116, https://doi.org/10.1038/s43017-019-0019-0, 2020. a, b, c
McClain, M. E., Boyer, E. W., Dent, C. L., Gergel, S. E., Grimm, N. B., Groffman, P. M., Hart, S. C., Harvey, J. W., Johnston, C. A., Mayorga, E., McDowell, W. H., and Pinay, G.: Biogeochemical hot spots and hot moments at the interface of terrestrial and aquatic ecosystems, Ecosystems, 6, 301–312, https://doi.org/10.1007/s10021-003-0161-9, 2003. a
McKnight, D. M., Boyer, E. W., Westerhoff, P. K., Doran, P. T., Kulbe, T., and Andersen, D. T.: Spectrofluorometric characterization of dissolved organic matter for indication of precursor organic material and aromaticity, Limnol. Oceanogr., 46, 38–48, https://doi.org/10.4319/lo.2001.46.1.0038, 2001. a, b
McManamay, R. A., Orth, D. J., and Dolloff, C. A.: Revisiting the homogenization of dammed rivers in the southeastern US, J. Hydrol., 424–425, 217–237, https://doi.org/10.1016/j.jhydrol.2012.01.003, 2012. a, b, c
Miller, M. P.: The influence of reservoirs, climate, land use and hydrologic conditions on loads and chemical quality of dissolved organic carbon in the Colorado River, Water Resour. Res., 48, W00M02, https://doi.org/10.1029/2012WR012312, 2012. a
Murphy, K. R., Stedmon, C. A., Wenig, P., and Bro, R.: OpenFluor – an online spectral library of auto-fluorescence by organic compounds in the environment, Anal. Meth., 6, 658–661, https://doi.org/10.1039/C3AY41935E, 2014. a
Nadon, M. J., Metcalfe, R. A., Williams, C. J., Somers, K. M., and Xenopoulos, M. A.: Assessing the effects of dams and waterpower facilities on riverine dissolved organic matter composition, Hydrobiologia, 744, 145–164, https://doi.org/10.1007/s10750-014-2069-0, 2015. a, b, c, d
Ohno, T.: Fluorescence inner-filtering correction for determining the humification index of dissolved organic matter, Environ. Sci. Technol., 36, 742–746, https://doi.org/10.1021/es0155276, 2002. a, b
Oksanen, J., Simpson, G. L., Blanchet, F. G., Kindt, R., Legendre, P., Minchin, P. R., O'Hara, R., Solymos, P., Stevens, M. H. H., Szoecs, E., Wagner, H., Barbour, M., Bedward, M., Bolker, B., Borcard, D., Carvalho, G., Chirico, M., De Caceres, M., Durand, S., Evangelista, H. B. A., FitzJohn, R., Friendly, M., Furneaux, B., Hannigan, G., Hill, M. O., Lahti, L., McGlinn, D., Ouellette, M.-H., Ribeiro Cunha, E., Smith, T., Stier, A., Ter Braak, C. J., Weedon, J., and Borman, T.: vegan: Community Ecology Package, r package version 2.6-10, https://CRAN.R-project.org/package=vegan (last access: 8 March 2025), 2025. a
Oliver, A. A., Spencer, R. G. M., Deas, M. L., and Dahlgren, R. A.: Impact of seasonality and anthropogenic impoundments on dissolved organic matter dynamics in the Klamath River (Oregon/California, USA), J. Geophys. Res.-Biogeo., 121, 1946–1958, https://doi.org/10.1002/2016JG003497, 2016. a
Painter, S. C., Lapworth, D. J., Woodward, E. M. S., Kroeger, S., Evans, C. D., Mayor, D. J., and Sanders, R. J.: Terrestrial dissolved organic matter distribution in the North Sea, Sci. Total Environ., 630, 630–647, https://doi.org/10.1016/j.scitotenv.2018.02.237, 2018. a
Parks, S. J. and Baker, L. A.: Sources and transport of organic carbon in an Arizona river-reservoir system, Water Res., 31, 1751–1759, https://doi.org/10.1016/S0043-1354(96)00404-6, 1997. a
Peter, H., Singer, G., Ulseth, A. J., Dittmar, T., Prairie, Y. T., and Battin, T. J.: Travel time and source variation explain the molecular transformation of dissolved organic matter in an Alpine stream network, J. Geophys. Res.-Biogeo., 125, e2019JG005616, https://doi.org/10.1029/2019JG005616, 2020. a, b
Peñas, F. J. and Barquín, J.: Assessment of large-scale patterns of hydrological alteration caused by dams, J. Hydrol., 572, 706–718, https://doi.org/10.1016/j.jhydrol.2019.03.056, 2019. a, b, c, d
Peñas, F. J., Barquín, J., and Álvarez, C.: Assessing hydrologic alteration: evaluation of different alternatives according to data availability, Ecological Indicators, 60, 470–482, https://doi.org/10.1016/j.ecolind.2015.07.021, 2016. a, b
Poff, N. L. and Zimmerman, J. K. H.: Ecological responses to altered flow regimes: a literature review to inform the science and management of environmental flows, Freshwater Biol., 55, 194–205, https://doi.org/10.1111/j.1365-2427.2009.02272.x, 2010. a
Poff, N. L., Allan, J. D., Bain, M. B., Karr, J. R., Prestegaard, K. L., Richter, B. D., Sparks, R. E., and Stromberg, J. C.: The natural flow regime, Bioscience, 47, 769–784, https://doi.org/10.2307/1313099, 1997. a
Poff, N. L., Bledsoe, B. P., and Cuhaciyan, C. O.: Hydrologic variation with land use across the contiguous United States: geomorphic and ecological consequences for stream ecosystems, Geomorphology, 79, 264–285, https://doi.org/10.1016/j.geomorph.2006.06.032, 2006. a
Pompeu, C. R., Peñas, F. J., Goldenberg-Vilar, A., Álvarez Cabria, M., and Barquín, J.: Assessing the effects of irrigation and hydropower dams on river communities using taxonomic and multiple trait-based approaches, Ecol. Indic., 145, 109662, https://doi.org/10.1016/j.ecolind.2022.109662, 2022. a, b, c
Pucher, M., Wünsch, U., Weigelhofer, G., Murphy, K., Hein, T., and Graeber, D.: staRdom: versatile software for analyzing spectroscopic data of dissolved organic matter in R, Water-Sui., 11, 2366, https://doi.org/10.3390/w11112366, 2019. a
Raymond, P. A. and Saiers, J. E.: Event controlled DOC export from forested watersheds, Biogeochemistry, 100, 197–209, https://doi.org/10.1007/s10533-010-9416-7, 2010. a
Raymond, P. A., Saiers, J. E., and Sobczak, W. V.: Hydrological and biogeochemical controls on watershed dissolved organic matter transport: pulse-shunt concept, Ecology, 97, 5–16, https://doi.org/10.1890/14-1684.1, 2016. a, b
R Core Team: R: A Language and Environment for Statistical Computing, R Foundation for Statistical Computing, Vienna, Austria, https://www.R-project.org/ (last access: 8 March 2025), 2020. a
Riedel, T., Biester, H., and Dittmar, T.: Molecular fractionation of dissolved organic matter with metal salts, Environ. Sci. Technol., 46, 4419–4426, https://doi.org/10.1021/es203901u, 2012. a
Stewardson, M. J., Acreman, M., Costelloe, J. F., Fletcher, T. D., Fowler, K. J. A., Horne, A. C., Liu, G., McClain, M. E., and Peel, M. C.: Chapter 3 – Understanding hydrological alteration, in: Water for the Environment, edited by: Horne, A. C., Webb, J. A., Stewardson, M. J., Richter, B., and Acreman, M., Academic Press, https://doi.org/10.1016/B978-0-12-803907-6.00003-6, 37–64, 2017. a
Talluto, L., del Campo, R., Estévez, E., Altermatt, F., Datry, T., and Singer, G.: Towards (better) fluvial meta-ecosystem ecology: a research perspective, npj Biodiversity, 3, 1–10, https://doi.org/10.1038/s44185-023-00036-0, 2024. a
Ulseth, A. J. and Hall Jr., R. O.: Dam tailwaters compound the effects of reservoirs on the longitudinal transport of organic carbon in an arid river, Biogeosciences, 12, 4345–4359, https://doi.org/10.5194/bg-12-4345-2015, 2015. a, b, c
Wagner, S., Fair, J. H., Matt, S., Hosen, J. D., Raymond, P., Saiers, J., Shanley, J. B., Dittmar, T., and Stubbins, A.: Molecular hysteresis: hydrologically driven changes in riverine dissolved organic matter chemistry during a storm event, J. Geophys. Res.-Biogeo., 124, 759–774, https://doi.org/10.1029/2018JG004817, 2019. a
Welch, B. L.: On the comparison of several mean values: an alternative approach, Biometrika, 38, 330–336, https://doi.org/10.2307/2332579, 1951. a
WISE Water Framework Directive Database, https://sdi.eea.europa.eu/catalogue/srv/api/records/dc1b1cdf-5fa0-4535-8c89-10cc051e00db (last access: 30 January 2025), 2021. a
Wilson, H. F. and Xenopoulos, M. A.: Effects of agricultural land use on the composition of fluvial dissolved organic matter, Nat. Geosci., 2, 37–41, https://doi.org/10.1038/ngeo391, 2009. a
Xenopoulos, M. A., Barnes, R. T., Boodoo, K. S., Butman, D., Catalán, N., D'Amario, S. C., Fasching, C., Kothawala, D. N., Pisani, O., Solomon, C. T., Spencer, R. G. M., Williams, C. J., and Wilson, H. F.: How humans alter dissolved organic matter composition in freshwater: relevance for the Earth's biogeochemistry, Biogeochemistry, 154, 323–348, https://doi.org/10.1007/s10533-021-00753-3, 2021. a, b, c
Yang, L., Zhuang, W.-E., Chen, C.-T. A., Wang, B.-J., and Kuo, F.-W.: Unveiling the transformation and bioavailability of dissolved organic matter in contrasting hydrothermal vents using fluorescence EEM-PARAFAC, Water Res., 111, 195–203, https://doi.org/10.1016/j.watres.2017.01.001, 2017. a