the Creative Commons Attribution 4.0 License.
the Creative Commons Attribution 4.0 License.
 | 29 Jul 2025
Soil and biomass carbon storage is much higher in Central American than Andean montane forests
Katherine D. Heineman
María J. Pardo
Camille Piponiot
James W. Dalling
Tropical montane forests (TMFs) play a key role in the global carbon (C) cycle and in climate regulation by sequestering large amounts of aboveground and belowground carbon. Elevation gradients in TMFs have helped reveal the influence of environmental factors on C stocks. Few studies have evaluated the influence of elevation and soil nutrient availability on C stocks in the context of mixed ectomycorrhizal (EM) and non-EM-associated forests in the neotropics, especially in the mountains. We estimated aboveground biomass (AGB), coarse wood debris (CWD), and soil C based on field inventories in ten 1 ha plots along an elevational gradient from 880 to 2920 varying in relative abundance of EM trees in western Panama. Trees with ≥ 10 cm diameter at breast height (DBH) and CWD with ≥ 10 cm diameter were measured to calculate biomass and necromass. Soil C to 1 m depth was estimated. Furthermore, climate and edaphic characteristics were described for each plot to evaluate the influence on these variables on each C pool. AGB, downed CWD, and soil C were strongly positively correlated with elevation. We found exceptionally high AGB up to 574.3 Mg ha−1 and soil C up to 577.9 Mg ha−1 at higher elevations. After controlling for elevation, neither nutrient availability nor EM dominance had an effect on AGB or soil C. Nonetheless, high AGB at high elevations was attributed to the presence of Quercus species. We found previous lidar-derived estimates for our site substantially underestimated the aboveground carbon (AGC) present in the plots, being between 2 and 6 times lower than our field-based estimates. Remarkably high soil C at high elevations might be a consequence of reduced decomposition rates associated with lower temperature, or geological history, where repeated volcanic eruptions buried surface soil organic layers. Our results highlight large regional uncertainty in C pool estimates in neotropical montane forests, with potentially large underestimates for Central American C stocks.
- Article
(2697 KB) - Full-text XML
-
Supplement
(6482 KB) - BibTeX
- EndNote


Tropical forests store ∼ 40 %–55 % of the total carbon (C) in terrestrial ecosystems (Pan et al., 2011, 2013; Meister et al., 2012) and therefore play a key role in the global C cycle and climate regulation (Malhi and Grace, 2000; Keenan and Williams, 2018; Mitchard, 2018). This carbon is sequestered in several pools, consisting of live biomass, necromass (i.e., coarse woody debris or litter), and soil. Estimating the size of each pool is critical to evaluating uncertainty in future global C budget predictions. While it is well known that climate and edaphic processes influence C stocks (Moser et al., 2011; Clark et al., 2002; Girardin et al., 2010), mycorrhizal interactions have also been shown to have a significant impact on C cycling at the global scale (Phillips et al., 2013; Averill et al., 2014; Steidinger et al., 2019). Evaluating the effects of temperature, nutrient availability, and tree mycorrhizal status on tropical forest C stocks is an important step in predicting future atmospheric CO2 levels (Keenan and Williams, 2018).
Studies along elevational gradients in the tropics, especially in the Andes, have been shown to provide powerful natural experiments to understand how the environment directly and indirectly influences processes related to C cycling (Girardin et al., 2014, 2010; Malhi et al., 2017; Nottingham et al., 2015a; Homeier and Leuschner, 2021). Factors such as temperature, cloud cover, precipitation, nutrient availability, and species composition change as elevation increases, affecting aboveground biomass (AGB), woody debris, and the soil C stock. For AGB, a meta-analysis found that AGB tends be higher at lower elevations (Muller-Landau et al., 2020). However, low values of AGB have also been found in the Amazon below 500 due to low fertility (Quesada et al., 2012). High temperatures in the lowlands are typically associated with fast plant growth rates; in the Amazon, studies have shown faster growth rate is associated with lower mean wood density (Malhi et al., 2004; Baker et al., 2004), suggesting low AGB. However, it is important to note that low wood density is not always associated with a reduction in AGB (Phillips et al., 2019b). On the other hand, for soil C stocks, in upper montane forests, C can be accumulated at low temperatures by decreasing microbial decomposition (Nottingham et al., 2015a).
While elevational gradients can help us understand how temperature influences ecosystem C stocks, additional potentially confounding factors vary with elevation. For instance, cloud cover varies from 57 % at low elevations up to 98 % at high elevations (Muller-Landau et al., 2020; Dalling et al., 2021), and precipitation can peak at middle or high elevations (Malhi et al., 2010). In montane forests, soil nutrient availability can vary over short geographic scales, associated with variation in parent material and substrate age (Prada et al., 2017). Soil nutrient availability affects forest productivity in the tropics, but its effect on AGB is less clear, showing a positive, negative, or no relationship (Muller-Landau et al., 2020). Furthermore, soil nutrient availability influences tree tissue nutrient content and therefore litter quality and potentially wood decomposition rate (Aerts and Chapin, 1999). Recalcitrant tissues with low nutrient concentrations decompose slowly and increase soil C sequestration due to their long residence time in soil (De Deyn et al., 2008). However, there is also evidence that fast-decomposing labile tissues can remain in the soil as mineral-associated soil organic matter and thus increase soil C (Cotrufo et al., 2013).
While environmental factors play a critical role in forest structure and function, plant mutualisms with microbes also strongly impact soil C storage. Ectomycorrhizas (EM) and arbuscular mycorrhizas (AM) are thought to influence C stocks via effects on decomposition (De Deyn et al., 2008; Averill et al., 2014; Phillips et al., 2013). Studies have found that forest trees associated with EM fungi promote slow C cycling compared to trees associated with AM fungi (Soudzilovskaia et al., 2019; Phillips et al., 2013). In temperate forests this may be partly due to lower-quality litter in EM trees than in AM trees, resulting in slower decomposition (Craig et al., 2018; Keller and Phillips, 2019). Additionally, the stratification of soil C storage with soil depth also appears to depend on mycorrhizal type; soil under EM trees stores more C in the surface layers, while soil under AM trees stores more C in deep layers (Craig et al., 2018).
In this study we estimated the size of three C pools: – AGB, coarse wood debris (CWD), and soil C – in ten 1 ha plots along an elevational gradient in western Panama and evaluated the influence of climate, edaphic, and biotic factors on each pool. To our knowledge this is the first study in EM-associated forests that integrates both the effect of soil nutrient availability and elevation on C stocks in neotropical montane forests. Studies in western Panama provide new insights into the drivers of C storage because unlike many Andean forests, the dominant ecological group shifts with elevation, from AM-dominated forests at low elevations to EM-dominated forests at high elevation. We hypothesized that (i) a reduction in temperature with increasing elevation results in reduced growth rates, increased wood density and therefore reduced forest turnover rate and CWD, and potentially also AGB (if stand height also declines with elevation as in other neotropical forests; Girardin et al., 2010; Unger et al., 2012) and that (ii) decreasing nitrogen availability with elevation (Marrs et al., 1988; Homeier and Leuschner, 2021) would further favor trees with conservative nutrient cycling strategies (i.e., high wood density and low nutrient concentration; Soong et al., 2020), also resulting in lower canopy turnover rates and CWD. However, wood from low-soil-nutrient-availability sites has lower nutrient concentrations (Heineman et al., 2016), resulting in slower decomposition, which may allow CWD and soil C to accumulate. We also hypothesized that (iii) forests associated with EM-tree species have high overall C storage; EM-tree taxa that form monodominant stands in tropical forests have previously been associated with low-nutrient soils (Hall et al., 2020), tend to have conservative nutrient cycling strategies (Phillips et al., 2013), and have been associated with soils with higher C:N (Lin et al., 2017; Averill et al., 2014). Therefore, following our previous hypothesis, we expected the presence of EM trees to increase AGB relative to forests with non-EM-tree species at similar elevations. Additionally, if EM associations reduce decomposition rates either due to differences in litter quality or nutrient immobilization (McGuire et al., 2010; Read and Perez-Moreno, 2003), then we predict higher accumulation of soil C in EM-dominated forests. Our soil sampling across forests with contrasting edaphic conditions and species composition also allows us to compare C estimates for our sites with previously published data from other neotropical forests along elevation gradients.
Table 1Summary of characteristics of ten 1 ha plots along an elevational gradient in western Panama including trees with ≥ 10 cm DBH. Percent of basal area of species that form ectomycorrhizal associations (EM), N fixing, and palm taxa. FFR: Fortuna Forest Reserve; VBNP: Volcan Baru National Park.
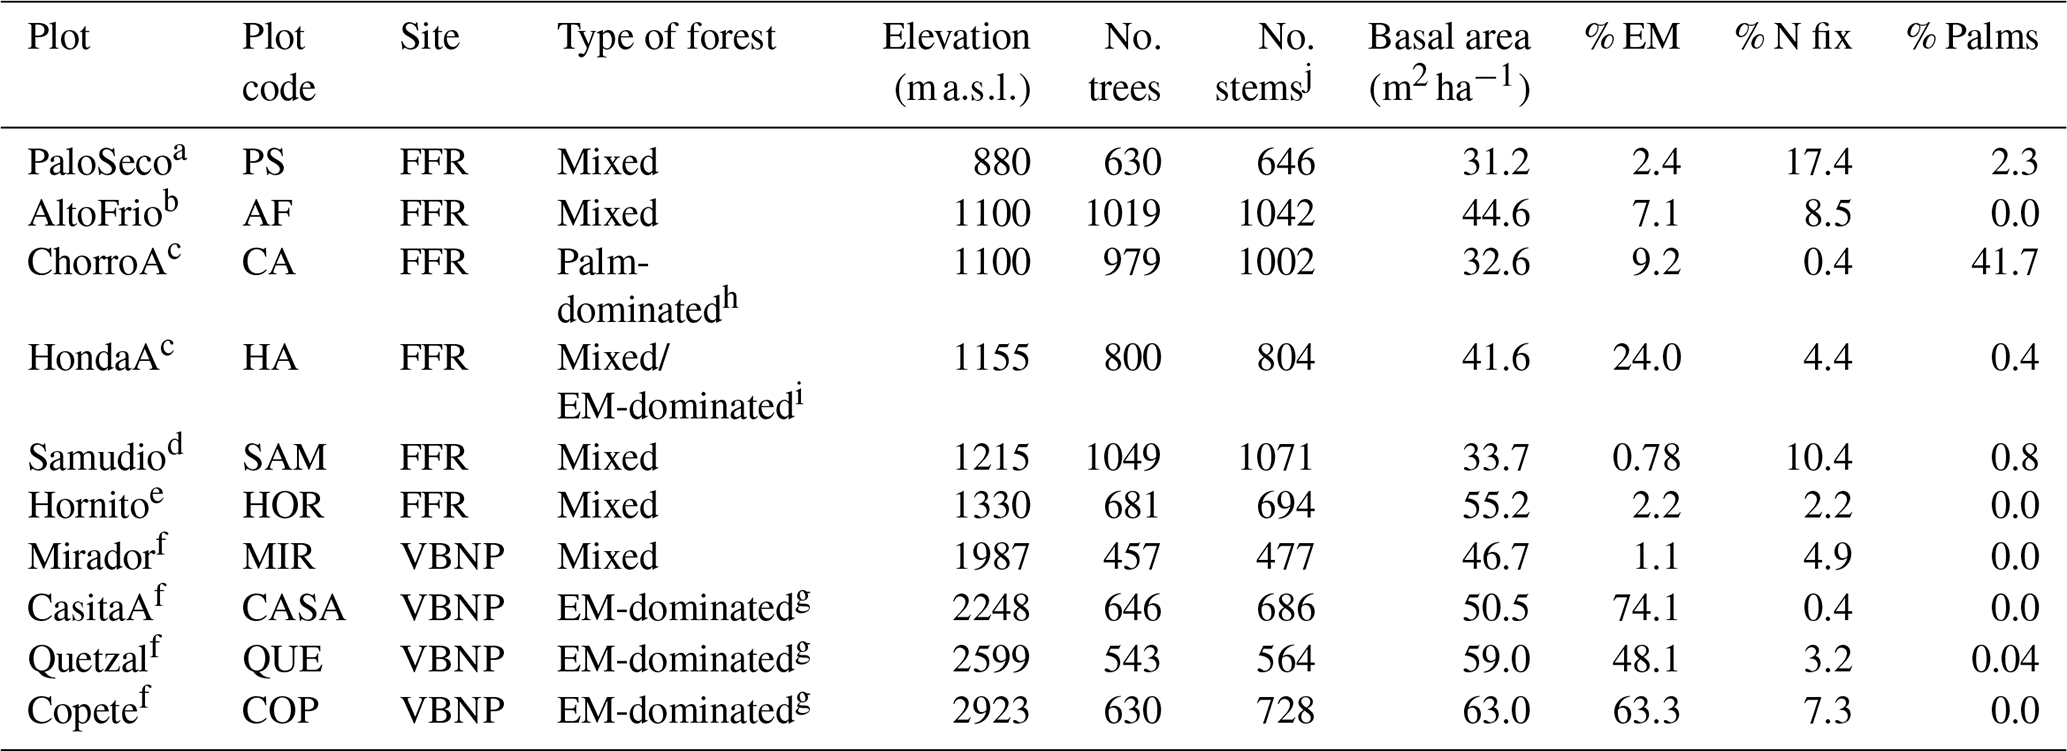
Geology: a mafic volcanic; b undifferentiated volcanics; c rhyolite; d mafic/rhyolite; e dacite; f Holocene lahar flow. Forest type: g Quercus-dominated; h Colpothrinax aphanopetala-dominated; i Oreomunnea mexicana-dominated; j number of stems used for the analyses includes multiple stems of individual trees.
In recent decades, light detection and ranging (lidar) technology has been used broadly to map aboveground carbon stocks at large scales (Saatchi et al., 2011; Zolkos et al., 2013; Carreiras et al., 2017). However, in complex terrains, such as montane tropical forests, lidar using low point densities can result in large AGB uncertainty (Leitold et al., 2014), while models of AGB need to specifically represent montane forests' structure (González-Jaramillo et al., 2018). We highlight this need by comparing the ground-derived estimates of AGB for our plots with an existing prediction of AGB derived from a combination of airborne lidar and more limited ground-truthing datasets of Panama that did not account for structural and compositional variation between lowland and montane forests (Asner et al., 2013).
2.1 Study site
The study was conducted in western Panama along an elevational gradient ranging from 880 to 2920 within the Fortuna Forest Reserve (Fortuna), along the southern edge of the adjacent Palo Seco Forest Reserve (8°45′ N, 82°13′ W), and at Finca El Velo (8°49′′11′ N, 82°28′′58′ W), on the northeastern slope of Volcan Baru National Park (Baru) (Fig. S1 in the Supplement). The elevational gradient extends from super-humid premontane forests (700–1000 ) and lower montane forest (1000–1500 ) (Holdridge, 1947) in Fortuna to mid-elevation montane forests (1700–2000 ) and upper montane cloud forests (> 2000 ) at Baru. At Fortuna, mean annual rainfall ranges between 4600 and 6300 mm (Prada et al., 2017; Dalling et al., 2021), while at 2300 at Baru, mean annual temperature is 14 °C and mean annual rainfall from 2019 to 2021 was 2260 mm. For this study, 10 permanent 1 ha plots were used: six plots established at Fortuna in 2003 and four at Baru in 2015, where all trees with ≥ 5 cm diameter at breast height (DBH) were measured and identified to the lowest taxonomic level possible. When a species identification was not determined, a morphospecies was designated. In this study, to facilitate comparisons with other published datasets, only trees, palms, and tree ferns with ≥ 10 cm DBH were included in the analyses.
Across the elevational gradient, plots vary in relative abundances of different taxonomic and functional groups that are known to have important ecological roles in tropical forests, including trees associated with EM, N fixers, and palms (Table 1). Trees were classified as EM (ectomycorrhizal) based on literature sources and root studies made at the field site (Corrales et al., 2018; Soudzilovskaia et al., 2020; Averill et al., 2019; Corrales et al., 2016). Using the same references, trees that have been classified as forming associations with AM, ericoid mycorrhizas (e.g., Vaccinium), or as non-mycorrhizal trees (e.g., Roupala), as well as species for which the mycorrhizal type is unclear, were classified as non-EM taxa. N-fixing ability was classified following Huss-Daniel (1997) and Sprent (2009). The contribution of these ecological groups (EM, N fixers, and palms) was calculated as their percentage of the total basal area of each plot.
2.2 Soil sampling variables
Soil data are described in detail for the plot network in Fortuna (Dalling et al., 2021; Turner and Dalling, 2021). For this study, soil data were used for six plots from the Fortuna plot network collected in July 2008 or July 2010 (Prada et al., 2017) and from four Baru plots collected in May 2016. Soil from each plot was analyzed for bulk density (BD), pH, resin-extractable P (ResinP), extractable inorganic N (NH4 and NO3), extractable cations (Al, Ca, Fe, K, Mg, Zn), effective cation exchange capacity (ECEC), total exchangeable bases (TEB), and total N and P. Following the protocols described in Prada et al. (2017), soil samples were collected from the surface 0–10 cm of soil after removing the litter layer. Soil samples were collected in a regular grid within each 1 ha plot (center of every other 20 m × 20 m subplot), resulting in 13 sampling locations for each plot.
2.3 Climate variables
To evaluate the climate regime across the elevational gradient, we obtained data from the CHELSA database (http://chelsa-climate.org, last access: 23 July 2020) at 30 arcsec spatial resolution (Karger et al., 2017) for each plot. We obtained 10 variables that have been shown to be important in determining forest structure: MAT (mean annual temperature), MATvar (mean temperature range), MATmax (max temperature), MATmin (min temperature), TS (temperature seasonality), MAP (mean annual precipitation), MPdry (mean of driest month), MPwet (mean of wettest month), ISO (isothermality), and MDR (mean diurnal range) (Hofhansl et al., 2015; Schmitt et al., 2013). Additionally, we extracted the average climatic water deficit (WD) data from a global climate layer for the long term at 2.5 arcmin resolutions (https://jeromechave.github.io/pantropical_allometry.htm#CWD, last access: 23 July 2020). Climatic WD describes seasonal moisture limitation, with very negative WD values indicating strongly seasonally water-stressed sites.
2.4 Carbon stock calculations
2.4.1 Aboveground biomass and aboveground carbon
We used the BIOMASS R package to estimate AGB (Réjou-Méchain et al., 2017); functions in this section are all part of this package. For each plot, all stems with ≥ 10 cm DBH (including multi-stemmed trees) were measured and identified to genus, species, or morphospecies. The DBH used for the analyses was the value from the last re-census measured from Fortuna and Baru (2018 and 2015, respectively). We estimated the height of a subsample of 78 ± 11 trees from each plot using a triangulation approach, measuring the angle to the tree base, the angle to treetop, and the distance to the tree. The angles were measured using a manual clinometer (PM5/360PC, Suunto, Finland). To estimate the height of each tree in each plot, we created a plot-specific height–diameter model using the log 1 equation in the function modelHD() (Fig. S2). Log 1 was the best model for seven of the plots based on the Akaike information criterion (AIC) index compared to the other models proposed in Réjou-Méchain et al. (2017). To estimate the wood density of each tree, we measured the density of 117 species across all plots, with an average of eight individuals measured for each species. Wood volume in the field was quantified with the water displacement method (Chave, 2006). This dataset was incorporated into the function getWoodDensity(), assigning a density to each tree based on our field wood density, and then the nearest species, genus, or family measurement if the field data were missing. Trees without any identification (23 % of the total trees) were assigned the average plot level measurement. To estimate the AGB of trees we used Chave et al.'s (2014) allometric equation (Eq. 1):
where ρ is the wood density, H is the height, and D is the DBH of each tree. We used Avalos et al.'s (2022) allometric equation for palm aboveground C (Eq. 2):
In this case a factor of 2 was used to convert C stock to AGB, and a factor of 1.4 was applied to account for the bias introduced by log transformation as described by Avalos et al. (2022). Finally we used Beets et al.'s (2012) allometric equation for tree fern aboveground C (Eq. 3):
A factor of 2 was used to convert carbon stock to AGB following Beets et al. (2012).
To compare the distribution of AGB values between lowland and montane forests across the region, we used 332 plots from 13 studies in the neotropics, including 10 plots from this study (Table S1 in the Supplement). The distributions of AGB values among forest types and elevation classes were assessed by bootstrapping the AGB with 1000 resamples. Finally, we compared the AGC values obtained in this study, calculated using the same AGBmonteCarlo() function but applied to carbon values (Réjou-Méchain et al., 2017) with a C ratio of 47.1 % (Thomas and Martin, 2012), to those derived from the high-resolution airborne lidar maps of Panama produced by Asner et al. (2013, 2021). Lidar-derived estimates for our site locations were extracted using GPS coordinates and matched to the same 1 ha spatial resolution, ensuring a consistent comparison.
2.4.2 Downed coarse wood debris
To estimate the downed CWD (DCWD) we used a line-intersect sample method following Gora et al. (2019) and Larjavaara and Muller-Landau (2011). Downed CWD was defined as wood debris fallen to ground level that was ≥ 10 cm in diameter and crossed the transect. For each plot, we measured DCWD along 22 transects of 0.1 km. For the PS plot (Table 1) we only conducted 10 transects given the difficulty of traversing this plot. Transects were oriented south to north and east to west every 10 m within and including the edge of the plot. For each piece of DCWD, we used a large caliper to measure the diameter at the point the transect crossed the sample. Using a qualitative classification method, each sample was classified into three decomposition categories: (1) “hard”, if the sample was hard to the touch, (2) “medium”, if the sample was still somewhat solid but soft to the touch, and (3) “soft”, if the sample was visually rotten and collapsed easily. For each decomposition category and for each plot we took destructive samples consisting of a cross-section that was weighed, measured, and dried to estimate the necromass (Gora et al., 2019). With the destructive samples we used linear regressions to estimate the necromass of the samples, where the necromass was a function of diameter, decomposition category, and plot. All cross-section masses were corrected by the random angle correction factor (), summed and divided by the transect length. For the final estimates of the DCWD we calculated the 95 % confidence intervals by bootstrapping over unit samples (10 m; Gora et al., 2019).
2.4.3 Standing coarse wood debris
To estimate the standing CWD (SCWD) we used a plot approach following Gora et al. (2019) and Larjavaara and Muller-Landau (2011). Standing CWD was defined as dead trunks with a DBH ≥ 10 cm. We measured SCWD in five 20 m × 20 m subplots, for a total of 0.2 ha area sampled in each plot. For each SCWD sample we measured the DBH and height (H), classified it in the same decomposition categories as the DCWD, and additionally classified it in two qualitative branch categories: (1) with branches, if the sample retained between 20 %–100 % of branches, and (2) without branches, if the sample retained < 20 % of branches.
We estimated the necromass of the standing dead wood in two ways. For standing dead wood with branches we used the BIOMASS package (Réjou-Méchain et al., 2017) using Eq. (1) in this study. In this case ρ was calculated using the DCWD destructive samples. Since the wood densities differed between DCWD decomposition categories (F(2,326) = 87.35, P = < 0.001), wood density was calculated as the average of each decomposition category by plot. Height was the total height of the sample measured in the field. Necromass was calculated as 87.5 % of the total original AGB estimated (Gora et al., 2019) using Eq. (1).
For standing dead wood without branches, we calculated the volume and density of each sample. We used a taper function to estimate the diameter at the top using the Kozak et al. (1969) equation in Cushman et al. (2014), and the volume was calculated as a truncated cone for samples ≥ 3 m high. For samples < 3 m high we calculated the volume as a cylinder. Densities were calculated in the same way as branched SCWD. We summed the necromass of all the samples in all categories, and we divided by the total area to estimate the SCWD by plot. We calculated the 95 % confidence intervals by bootstrapping over unit samples (20 m × 20 m subplots; Gora et al., 2019).
2.4.4 Soil carbon
To estimate the soil C stocks in each plot we collected mineral soil in four depth increments from 0 to 100 cm at a subset of 5 of the 13 locations sampled for soil nutrients. For the Fortuna network plots the 50–100 cm depth soil C value was based on a single estimate from profile pits adjacent to the plots excavated to 1.5–2.0 m (Turner and Dalling, 2021). The 0–10, 10–20, and 20–50 cm depth samples were taken with a 5 cm diameter corer, and for 50–100 cm depth samples we used a 6.25 cm diameter corer. Total C stock in each depth was calculated as the product of the total C%, bulk density, and the increment of each depth. Total C% was determined by elemental analysis (Thermo Flash 1112 analyzer, Bremen, DE) and bulk density following Prada et al. (2017). The 95 % confidence interval of the total C stock was calculated by bootstrapping over locations for each plot.
2.5 Data analysis
All environmental variables were standardized to a mean of 0 and standard deviation of 1 to perform the analyses. All statistical analyses were conducted in R version 4.2.2 (R Core Team, 2022).
2.5.1 Plot characterization
To explore and visualize the variation of environmental variables among plots, soil and climate variables were analyzed separately with a principal component analysis (PCA).
2.5.2 Effect of soil and mycorrhizal type on trees' wood density
One-way ANOVA was used to evaluate differences among plot soil characteristics and tree wood density. We included mycorrhizal type as a fixed effect and species as a random effect. P values of the main effects were estimated using model simplification (Crawley, 2013).
2.5.3 Effect of environmental variables and mycorrhizal type on C stocks
To examine the relationship between environmental variables and mycorrhizal type across the different carbon pools we used a structural equation model (SEM) to partition the variance of responses. An a priori model was hypothesized based on our predictions and simple linear regressions between environmental variables and each carbon pool (Fig. S3, Table S2). A second set of PCA was performed excluding resin-extractable P, NH4, and temperature variables since we were interested in those direct effects; the first PCA scores were then used as environmental and edaphic parameters in the SEM (Fig. S4a and b). To correct for collinearity the model included the correlation between variables that are highly correlated (r > 0.5, Table S3). Representation of EM-associated trees was incorporated in the model as the percent of plot basal area represented by EM-tree species (Table 1). We then used SEM to evaluate the indirect and direct effect of each independent variable on each carbon pool, using the piecewiseSEM R package (Lefcheck, 2016). To discriminate between models, we followed the approach of Glassmire et al. (2020) for adding and dropping variables. Akaike's information criterion (AIC) was used to compare the alternative models. The best model was the most parsimonious; the fit of the best model was evaluated using Fisher's C statistic (Lefcheck, 2016). Lower values of Fisher's C value indicate smaller differences between the model and the data. Standing CWD was not included in the SEM analysis since it was not correlated with any of the abiotic or biotic factors or with the other carbon pools.
3.1 Edaphic and climate variation
Edaphic characteristics were highly heterogenous across plots – NH4 varied 6-fold, NO3 varied 12-fold, and resin-extractable P varied 87-fold (Table S4). The first two axes of the first soil PCA (Fig. 1a) explained 68.9 % of the variance in the edaphic variables among plots. In the first axis, two plots, MIR and AF, were grouped together by variables associated with high fertility (i.e., effective cation exchange capacity, ECEC). The Fortuna plots CA, HA, PS, and SAM were grouped together and were associated with low pH and high Fe in the soil. The second axis described soil variation with elevation (Fig. 1a). The plots at the highest elevation are at the bottom of the figure and are associated with high values of resin P.
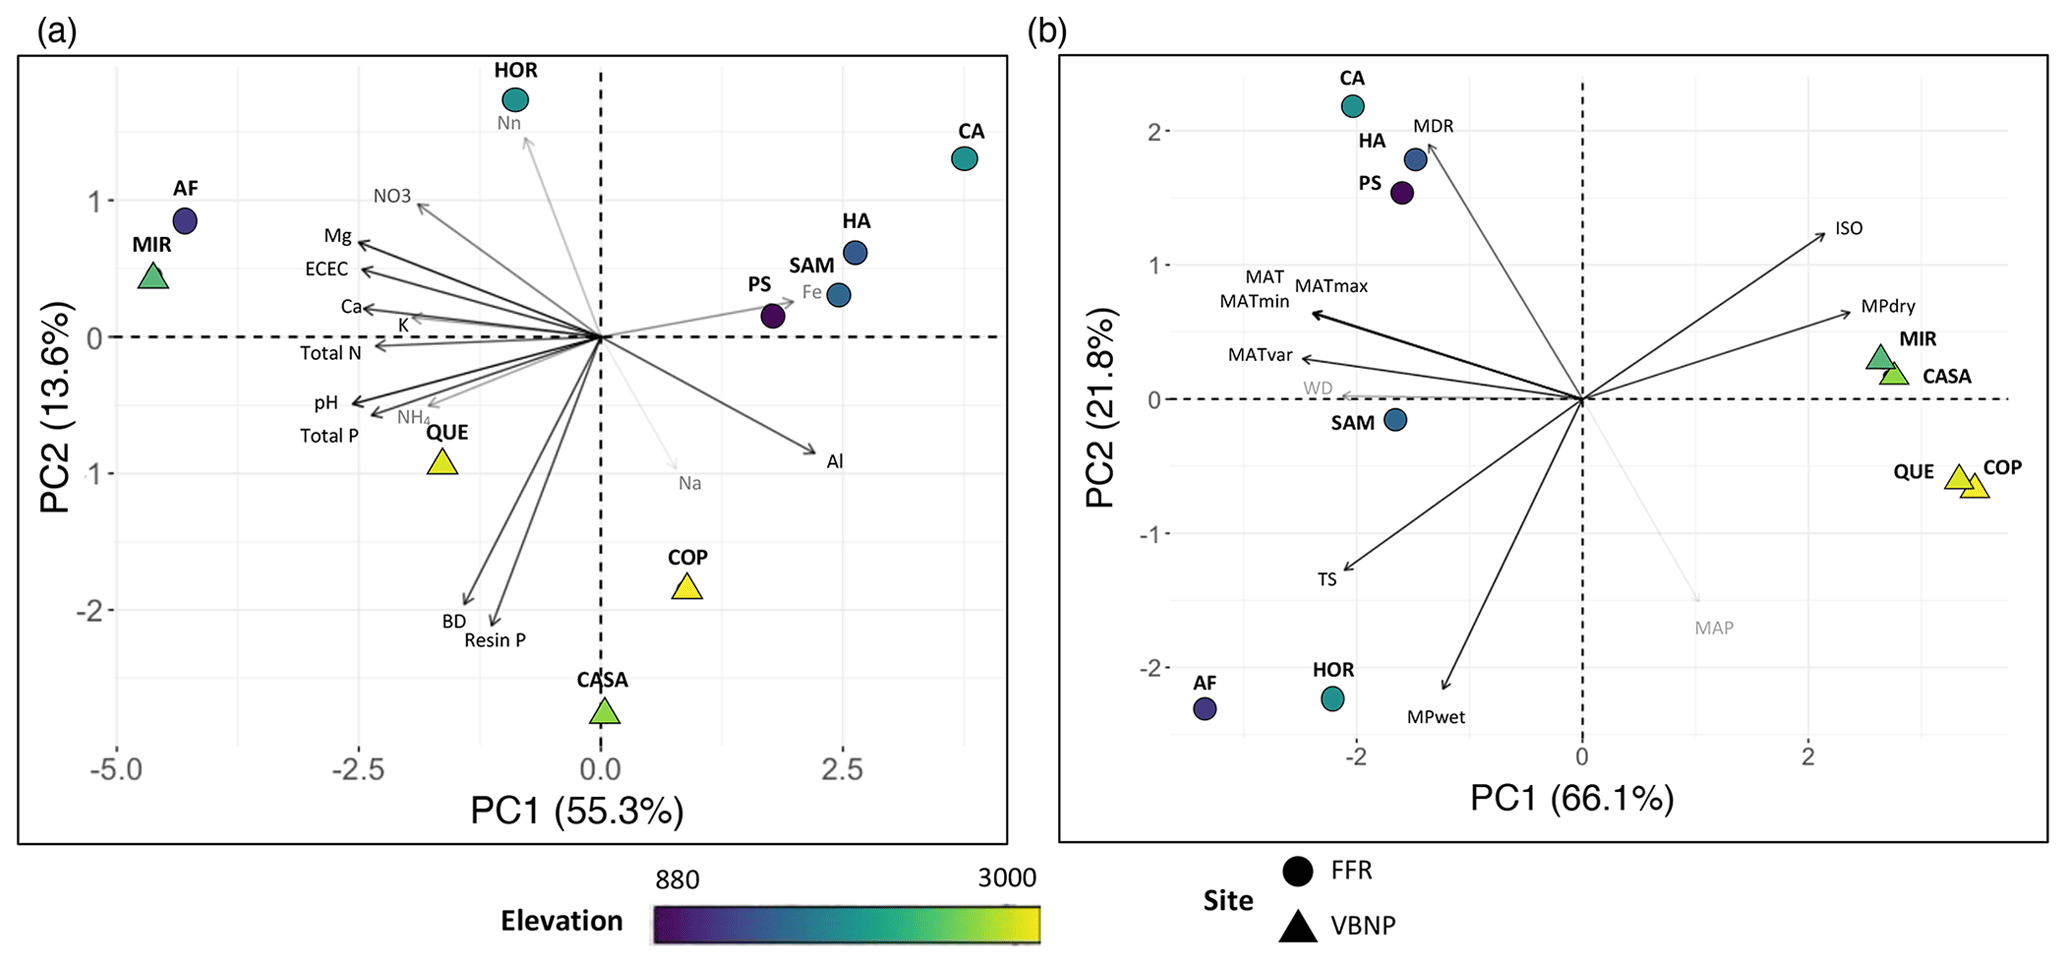
Figure 1Principal component analysis (PCA) for (a) soil variables of 0–10 cm depth and (b) climate variables of ten 1 ha plots (Table 1) in an elevational gradient in Panama. The direction and length of vectors indicate the effect of the variable. Black arrows represent significant effects (p < 0.05), and gray arrows represent non-significant effects. Color represents the elevation of the plot, and the symbols represent the site. BD: bulk density; ResinP: resin-extractable P; ECEC: effective cation exchange capacity; TEB: total exchangeable bases; MAT: mean annual temperature; MATvar: mean temperature range; MATmax: max temperature; MATmin: min temperature; TS: temperature seasonality; MAP: mean annual precipitation; MPdry: mean of driest month; MPwet: mean of wettest month; ISO: isothermality; MDR: mean diurnal range; WD: water deficit; FFR: Fortuna Forest Reserve; VBNP: Volcan Baru National Park. Plot name codes are given in Table 1.
The first two axes of the climate PCA (Fig. 1b) explained 87.9 % of the variance in the climate variables among plots. The first axis grouped plots by the sites Fortuna and Baru and shows the association between climate variation and elevation (Fig. 1b). The plots at the highest elevations are at the right of the figure and are associated with low mean annual temperatures (MAT) and high mean precipitation during the driest month (MPdry). The second axis groups together three plots, CA, HA, and PS, which are associated with high values of mean diurnal range (MDR). The plots HOR and AF were grouped together and were related to high mean precipitation during the wettest month (MPwet). Although there is high variation in seasonal water stress (WD) (Table S4), its contribution to climate variation was low (Fig. 1b).
3.2 Total carbon stock estimates
Total C stocks for the 10 plots ranged from 249.5 to 882.1 Mg ha−1 (Table S5, Fig. 2a). Aboveground carbon and soil C were the most important carbon pools, contributing 23 %–50 % and 32.5 %–70.7 %, respectively, of the total carbon budget of the forest (Fig. 2b). The contribution of CWD to the total carbon budget was highly variable, ranging from 3.8 %–44 % between plots. For example, for the plots QUE and HOR total CWD was nearly 10 times smaller than AGC, while for HA the total CWD contribution was higher than AGC (Fig. 2b).
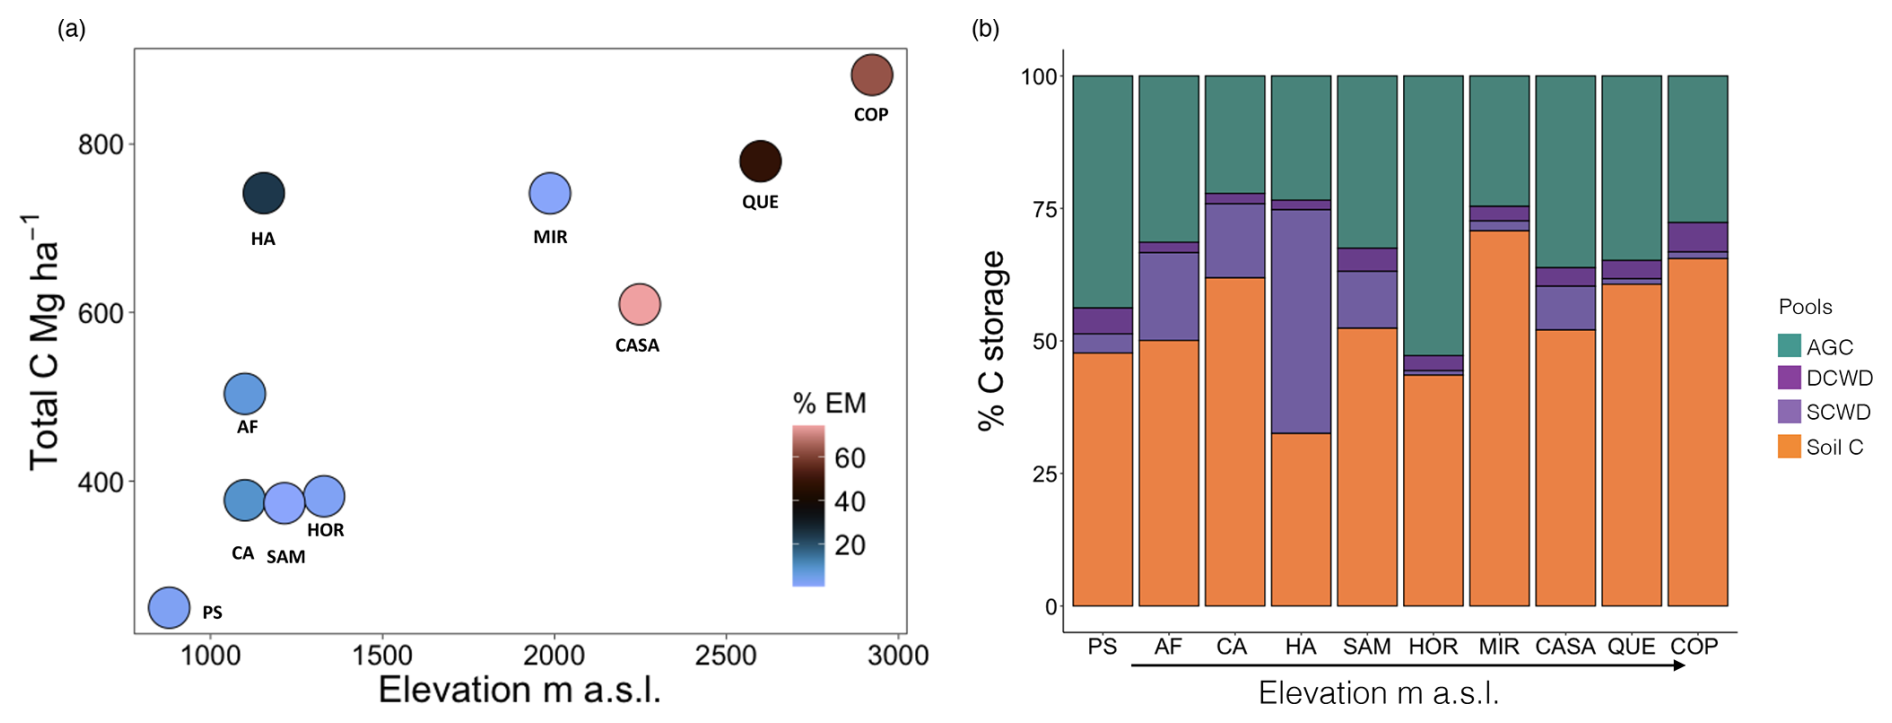
Figure 2Total C stocks (a) and contribution (b) of the different pools to the total carbon stocks for ten 1 ha plots in an elevational gradient in western Panama. AGC: aboveground carbon; DCWD: downed coarse wood debris; SCWD: standing coarse wood debris; % EM: percent of plot basal area occupied by EM trees.
3.2.1 Aboveground biomass
To estimate the AGB, 7434 trees (from 91 plant families) and 780 tree heights were measured across all of the 10 plots. Aboveground biomass varied 3-fold among plots, ranging from 177.6 to 576.1 Mg ha−1 (Table S5). Different taxa contributed to AGB in different plots, with important contributors including Fagaceae (57.0 %–83.8 %), Sapotaceae (22.1 %–38.8 %), and Arecaceae (34.5 %). In addition to taxon differences, contributions of ecological groups to AGB also differed across plots. EM trees ranged from 0.98 %–83.8 % of AGB across plots. EM trees in the genus Quercus were the most important contributors to AGB at the highest-elevation plots (57 %–83.8 %), as well as at the HA plot, where EM trees including Oreomunnea mexicana (Juglandaceae) accounted for 24 % of basal area and 18.4 % of the AGB. N-fixing trees accounted for 0.25 %–19.2 % of the total AGB of the plots. Palms were the most important ecological group in the CA plot, accounting for 34.5 % of AGB, whereas palms contributed < 1 % of total AGB in the remaining plots. EM trees had higher wood density compared to non-EM trees (F(1,259) = 15.32, d.f. = 1, p < 0.001), where mean wood density (g cm3) was 0.71 ± 0.02 for EM trees and 0.54 ± 0.008 (SE) for non-EM trees.
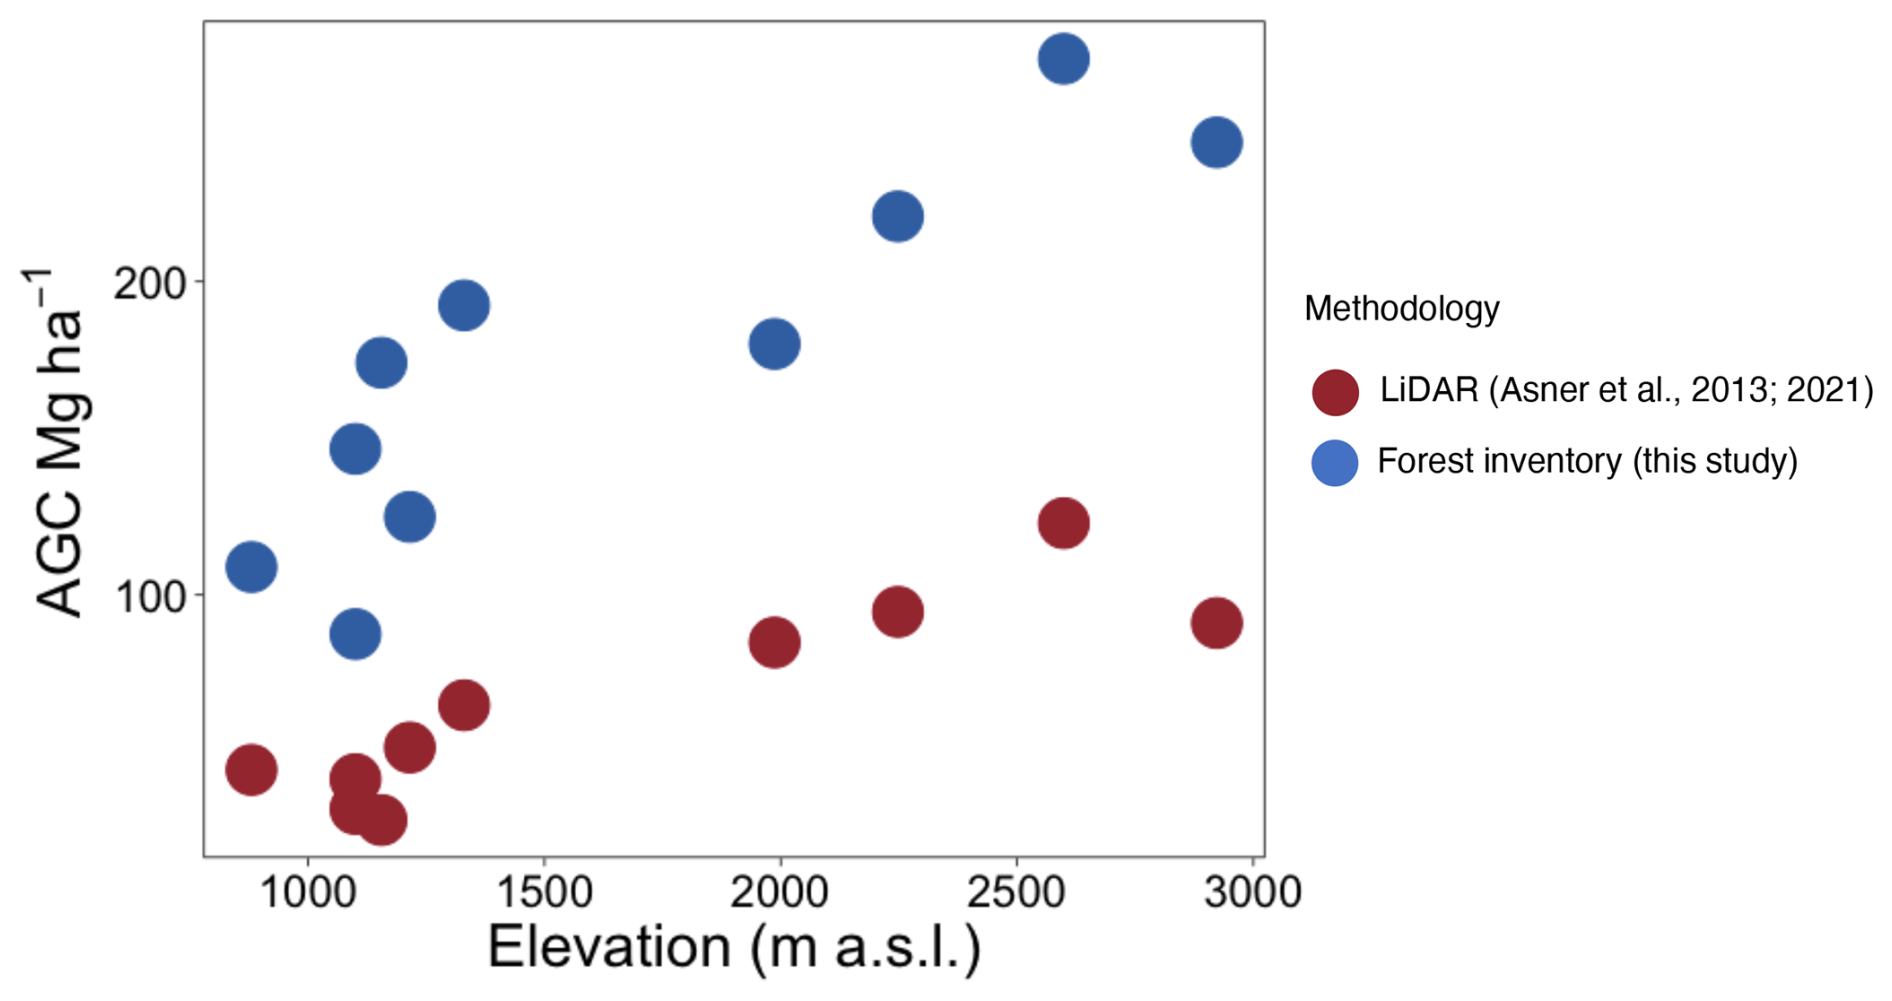
Figure 3Variation in aboveground carbon (AGC) among ten 1 ha plots in western Panama using forest inventories (blue) and (red) airborne light detection and ranging (lidar) data.
Combining data from this study and 12 published studies in neotropical forests (Table S1) we found that variance in AGB for montane forests (1037–3537 ) was exceptionally high compared to lowland forests (41–1000 ) (Fig. S5a and b). We also found that lidar-estimated aboveground carbon (Asner et al., 2013, 2021) and aboveground C in this study exhibited a strong positive correlation (r = 0.83). However, the mean bias error (MBE) of −112.52 Mg C ha−1 indicates that lidar systematically underestimated biomass compared to field measurements. Lidar-based values for AGC were reliant on conversion factors generated from ground-truthing lowland forests and were between 2 and 6 times lower than our field-based estimates (Fig. 3).
3.2.2 Coarse wood debris
In total, 2037 samples of DCWD were found in 20.8 km of transect, and 232 samples of SCWD were measured in 0.2 ha per plot. For DCWD, we found that individual fallen trees were recorded twice on adjacent transects on only 23 occasions. Total CWD varied across plots, ranging from 14.75 to 326.51 Mg ha−1 (Table S5). Across plots there was no clear pattern in the contribution of DCWD and SCWD to the total CWD. For the plots PS, HOR, MIR, QUE, and COP, dead wood was mainly stored in the form of DCWD, contributing 2.7 %–5.5 % to the total C of the plot, while for AF, CA, SAM, CASA, and HA, SCWD was the main CWD pool, contributing 8.2 % to 42.2 %.
3.2.3 Soil carbon
Total soil C calculated from 0–100 cm depth differed among plots and was similar in magnitude and variance to AGB, ranging from 119.0 to 577.9 Mg ha−1 (Table S5). There were differences among plots (F(9,181) = 10.9, p = < 0.001) and depth categories (F(3,181) = 31.5, p = < 0.001). Plots at the highest elevation (1900–2923 ) accumulated notably large amounts of C in the deeper soil layers (50–100 cm), ranging from 92.8 to 246.3 Mg ha−1 (Fig. S6). The percent of C in each depth relative to the total C% in each plot was not correlated with % EM, except in the 10–20 cm depth (Fig. S7). For this layer, percent of C was negatively correlated with the percent of basal area contributed by EM trees (% EM; r2 = 0.36, p < 0.05); however, this effect was not significant after controlling for elevation.
3.2.4 Effect of elevation on abiotic and biotic factors and carbon pools
Most climate variables were strongly correlated with elevation (Table S6); variables related to temperature (MAT, MATmax, MATmin, and MATvar), water deficit, and mean diurnal range were negatively correlated with elevation. Precipitation during the driest month was positively correlated with elevation. Among edaphic variables there was in general no correlation with elevation (Table S6), including inorganic N and total N:P ratio (Fig. 4); however, resin P was strongly positively correlated with elevation (r = 0.88, p < 0.001, Fig. 4). Additionally, % EM was also highly positively correlated with elevation (r = 0.80, p < 0.001). Resin P and % EM were therefore also highly correlated with temperature (r = −0.89, p < 0.001, and r = −0.76, p < 0.05, respectively (Table S6).
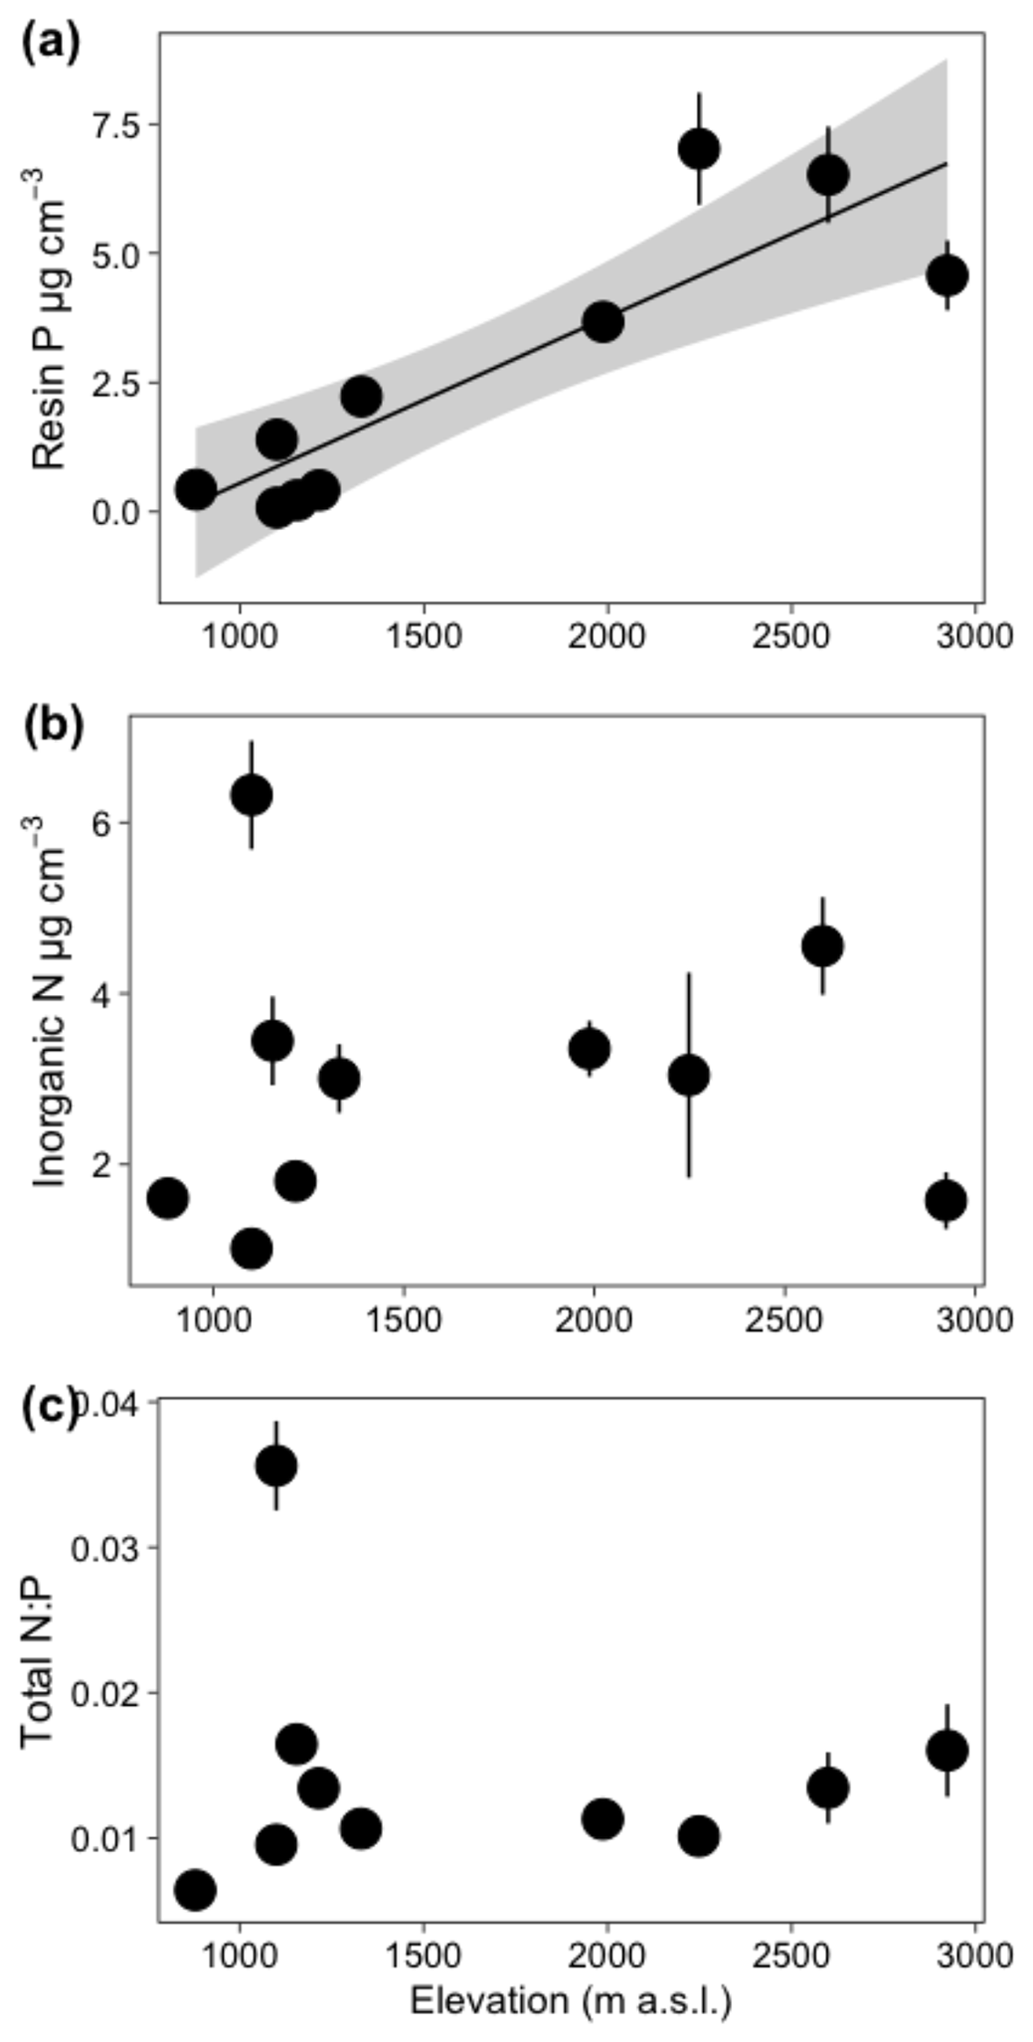
Figure 4Relationship between elevation and soil parameters for ten 1 ha plots. Each point represents the plot mean (±1 SE) of (a) resin P, (b) inorganic N, and (c) total N:P. The solid line indicates a significant relationship, and the shaded area represents the 95 % confidence interval.
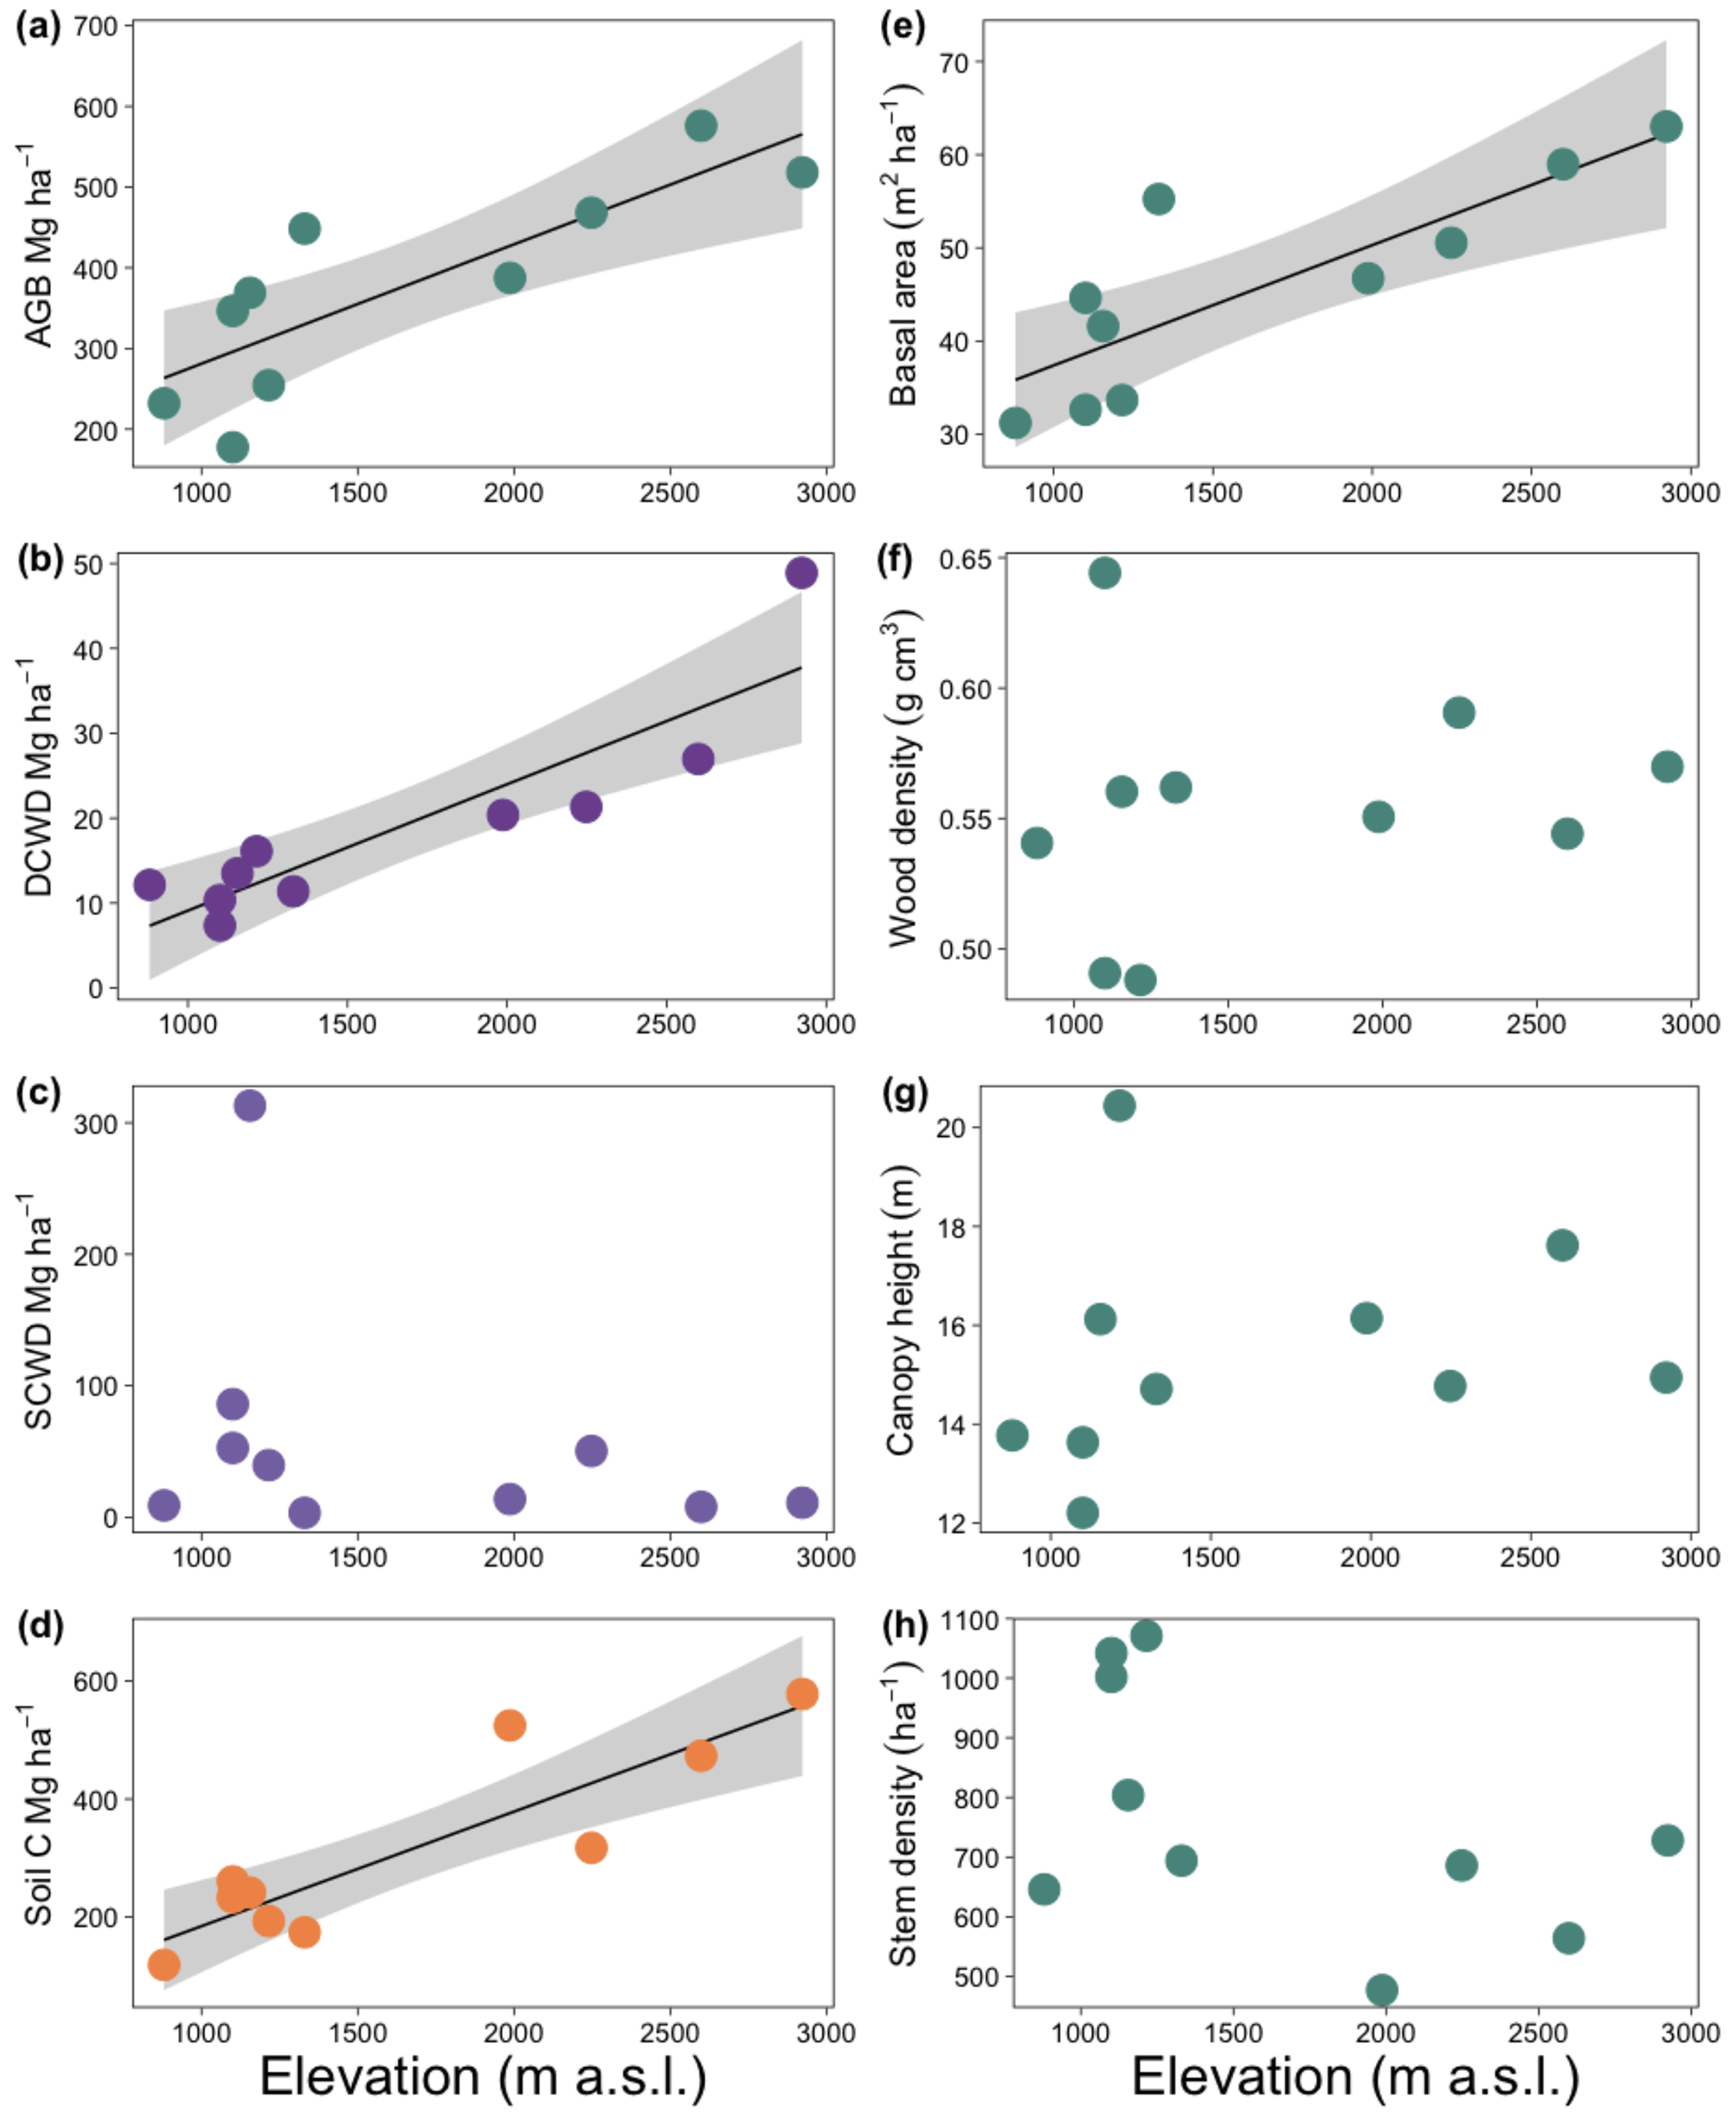
Figure 5Effect of elevation on carbon pools (a–d) and aboveground biomass components (e–h) for ten 1 ha plots in an elevational gradient in western Panama. Lines indicate significant relationships, and shaded areas represent the 95 % confidence intervals. Each point is the mean value for each plot except for panel (e), which is the total basal area of the plot. AGB: aboveground biomass; DCWD: downed coarse wood debris; SCWD: standing coarse wood debris.
Aboveground biomass and soil C showed a significant positive relationship with elevation (r2 = 0.73, p < 0.001, and r2 = 0.76, p < 0.001, respectively, Fig. 5a and b). Total CWD was not correlated with elevation (r2 = −0.06, p = NS), even after removing plot HA, an outlier (r2 = 0.001, p = NS). However, DCWD was positively correlated with elevation (r2 = 0.76, p < 0.001, Fig. 5c). Low values of AGB, DCWD, and soil C are significantly correlated with high values of variables related to temperature, while soil C decreased with increasing wood density (r2 = 0.76, p < 0.001); however, this effect was not significant after controlling for elevation.
Among the AGB components, elevation was correlated with basal area but not with wood density or canopy height (Fig. 5d–f). Basal area was positively correlated with elevation, more than doubling over the elevation range of the study (r2 = 0.65, p < 0.001). The number of stems per plot tended to decrease with elevation but was not significant (r2 = 0.18, p = NS).
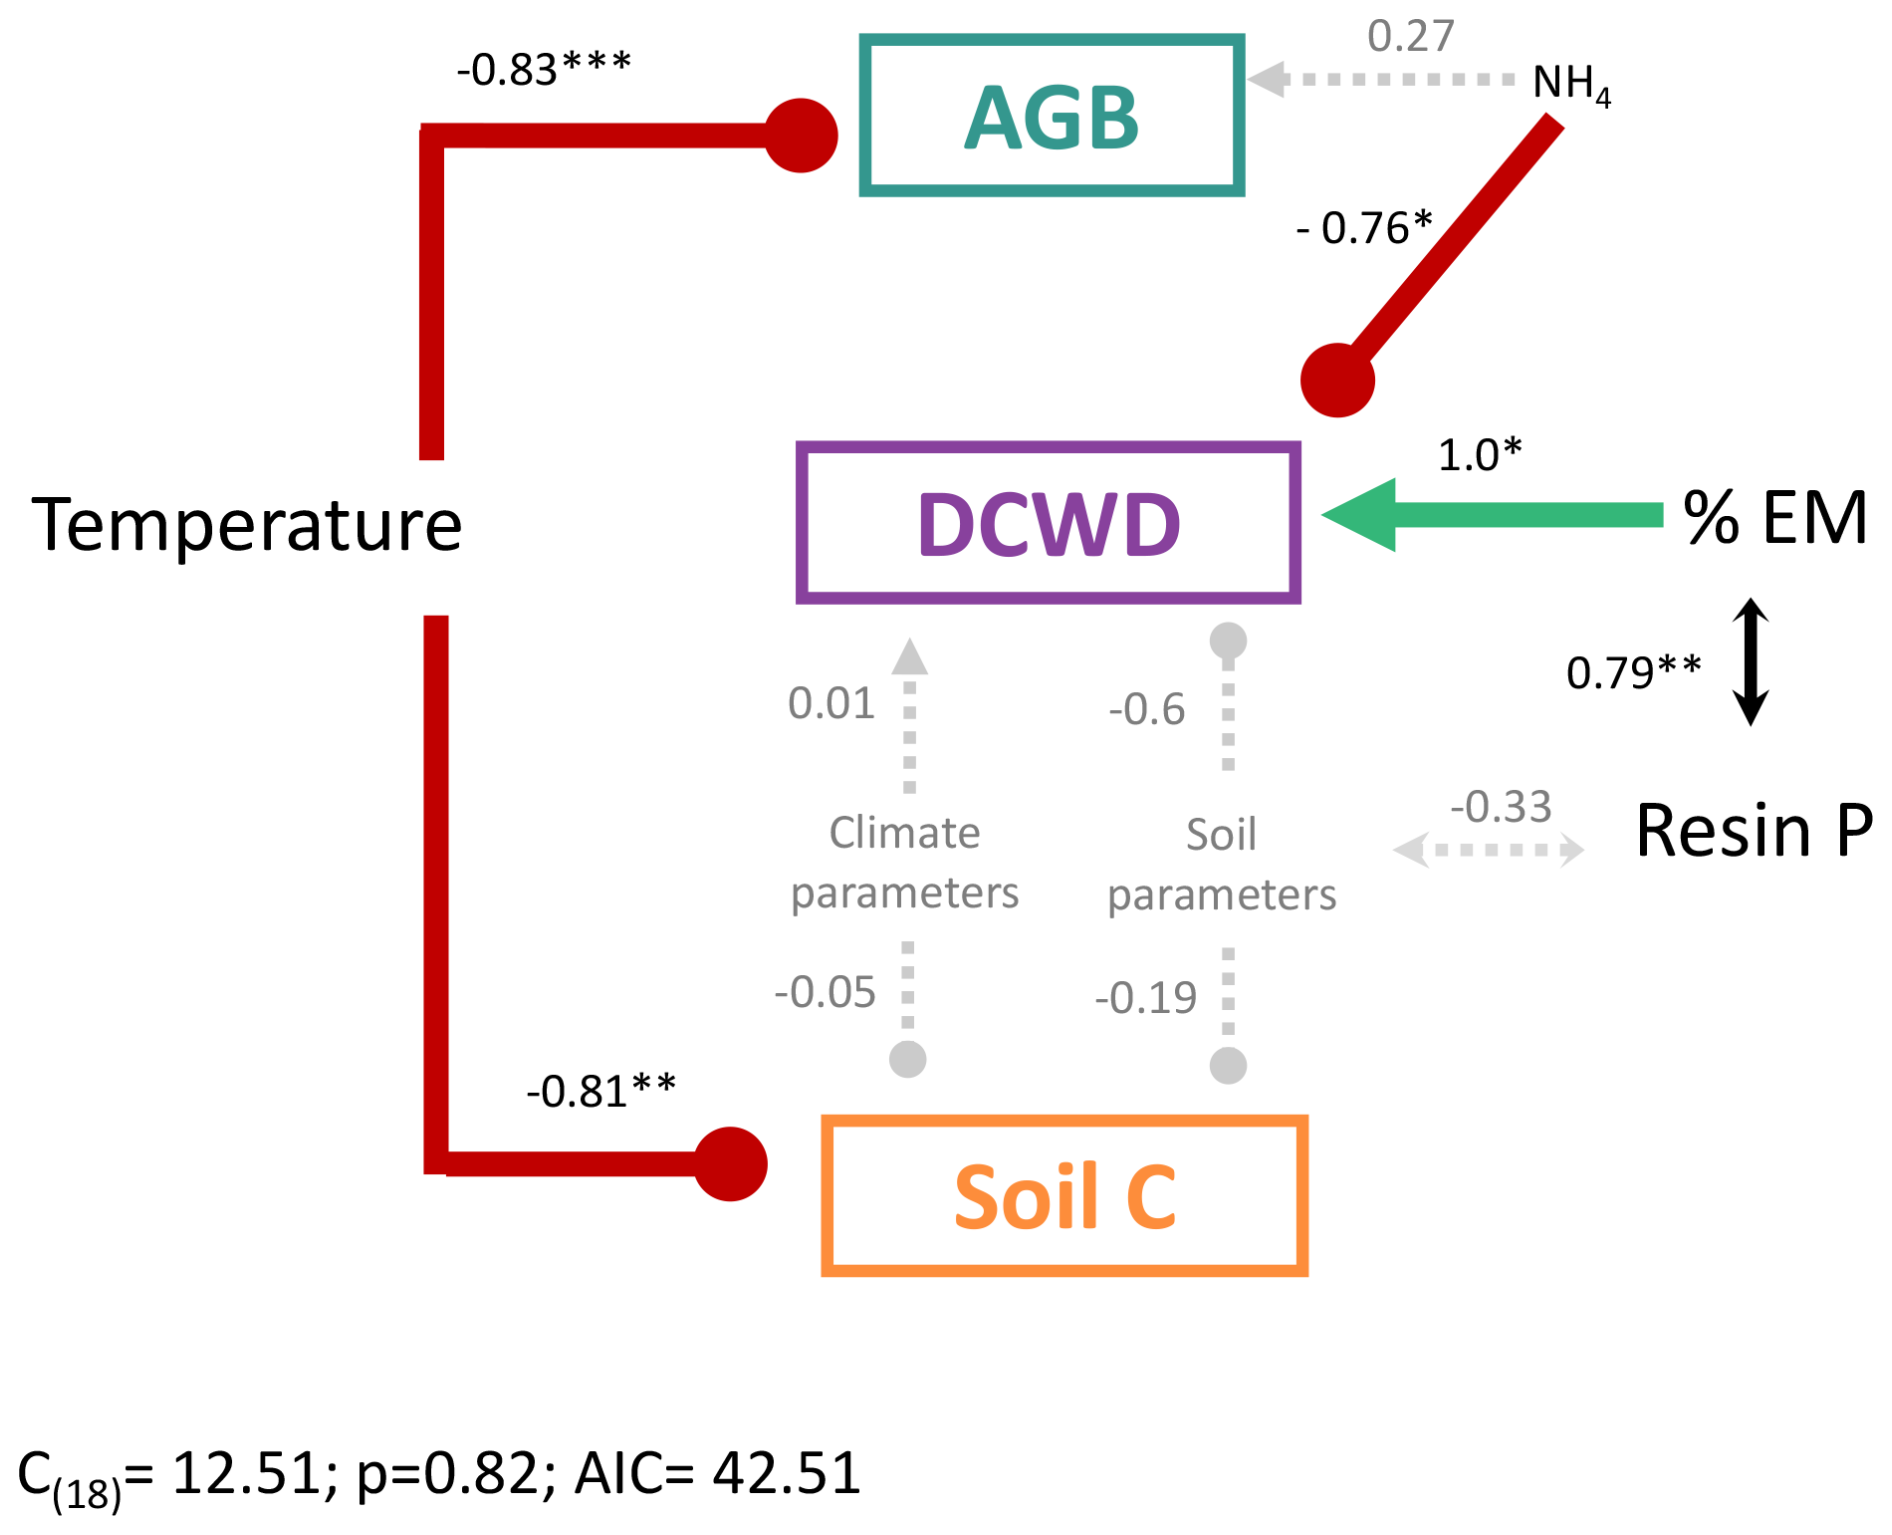
Figure 6Structural equation model to evaluate the effect of environmental and edaphic variables on the different carbon pools in a montane forest. Soil and edaphic parameters are represented by the first axis of a PCA for each group of variables where resin P and NH4 were not included. The best model was selected based on Akaike's information criterion (AIC) comparing alternative models. Positive effects are in green and represented by arrows, and negative effects are in red with blunt-ended lines. Dashed gray arrows represent nonsignificant relationships. Lines with double arrows represent correlations between variables. Numbers are the standardized path coefficients. AGB: aboveground biomass; DCWD: downed coarse wood debris; % EM: percent of plot basal area occupied by EM trees.
From the structural equation model (SEM) that included soil, climate variables, AGB, DCWD, and soil C, we found temperature was the variable that best predicted AGB and soil C, after controlling for soil and other climate parameters (Fig. 6). Temperature was significantly negatively correlated with AGB and soil C. NH4 and % EM showed a significant correlation with DCWD. Downed CWD decreased significantly with high values of NH4 and increased with high values of % EM. Additionally, % EM was significantly positively correlated with resin P. The effect of climate parameters other than temperature and soil except NH4 and resin P (represented in the PCA axis, Fig. S4) did not have a significant effect on C pools. It is important to note that temperature, and consequently elevation, is highly correlated with resin P concentration (Fig. 4). This strong correlation complicates the disentangling of the specific contributions of temperature and resin P to the observed patterns – an issue that will be discussed further in a later section.
Exceptionally high carbon storage was observed along this elevational gradient in Panama. In contrast to most other published data from elevational gradients in TMFs, we found total C stocks were strongly positively correlated with elevation – a pattern associated with the dominance of the EM-tree genus Quercus at most of the high-elevation plots. Although temperature showed a strong negative correlation with resin P, it was a stronger predictor of AGB and soil C. In contrast, we found resin P, indirectly, via the effect of % EM, explained more variation in downed CWD (DCWD) stocks than temperature; DCWD accumulation was associated with increasing % EM and decreasing NH4. Estimates of standing CWD (SCWD) were poorly constrained in this study, with exceptionally high values found in one site. We found high soil C was also associated with high-elevation sites. We predicted soil C storage would be associated with EM trees; however, we found no effect of % EM on total soil C. The plot with patches dominated by the EM tree Oreomunnea mexicana had intermediate values of soil C, while high-elevation plots at the Baru site both with and without EM-associated trees showed the highest values of soil C, possibly reflecting both reduced rates of decomposition and volcanic activity that buried C-rich surface soils beneath layers of volcanic ash in the past.
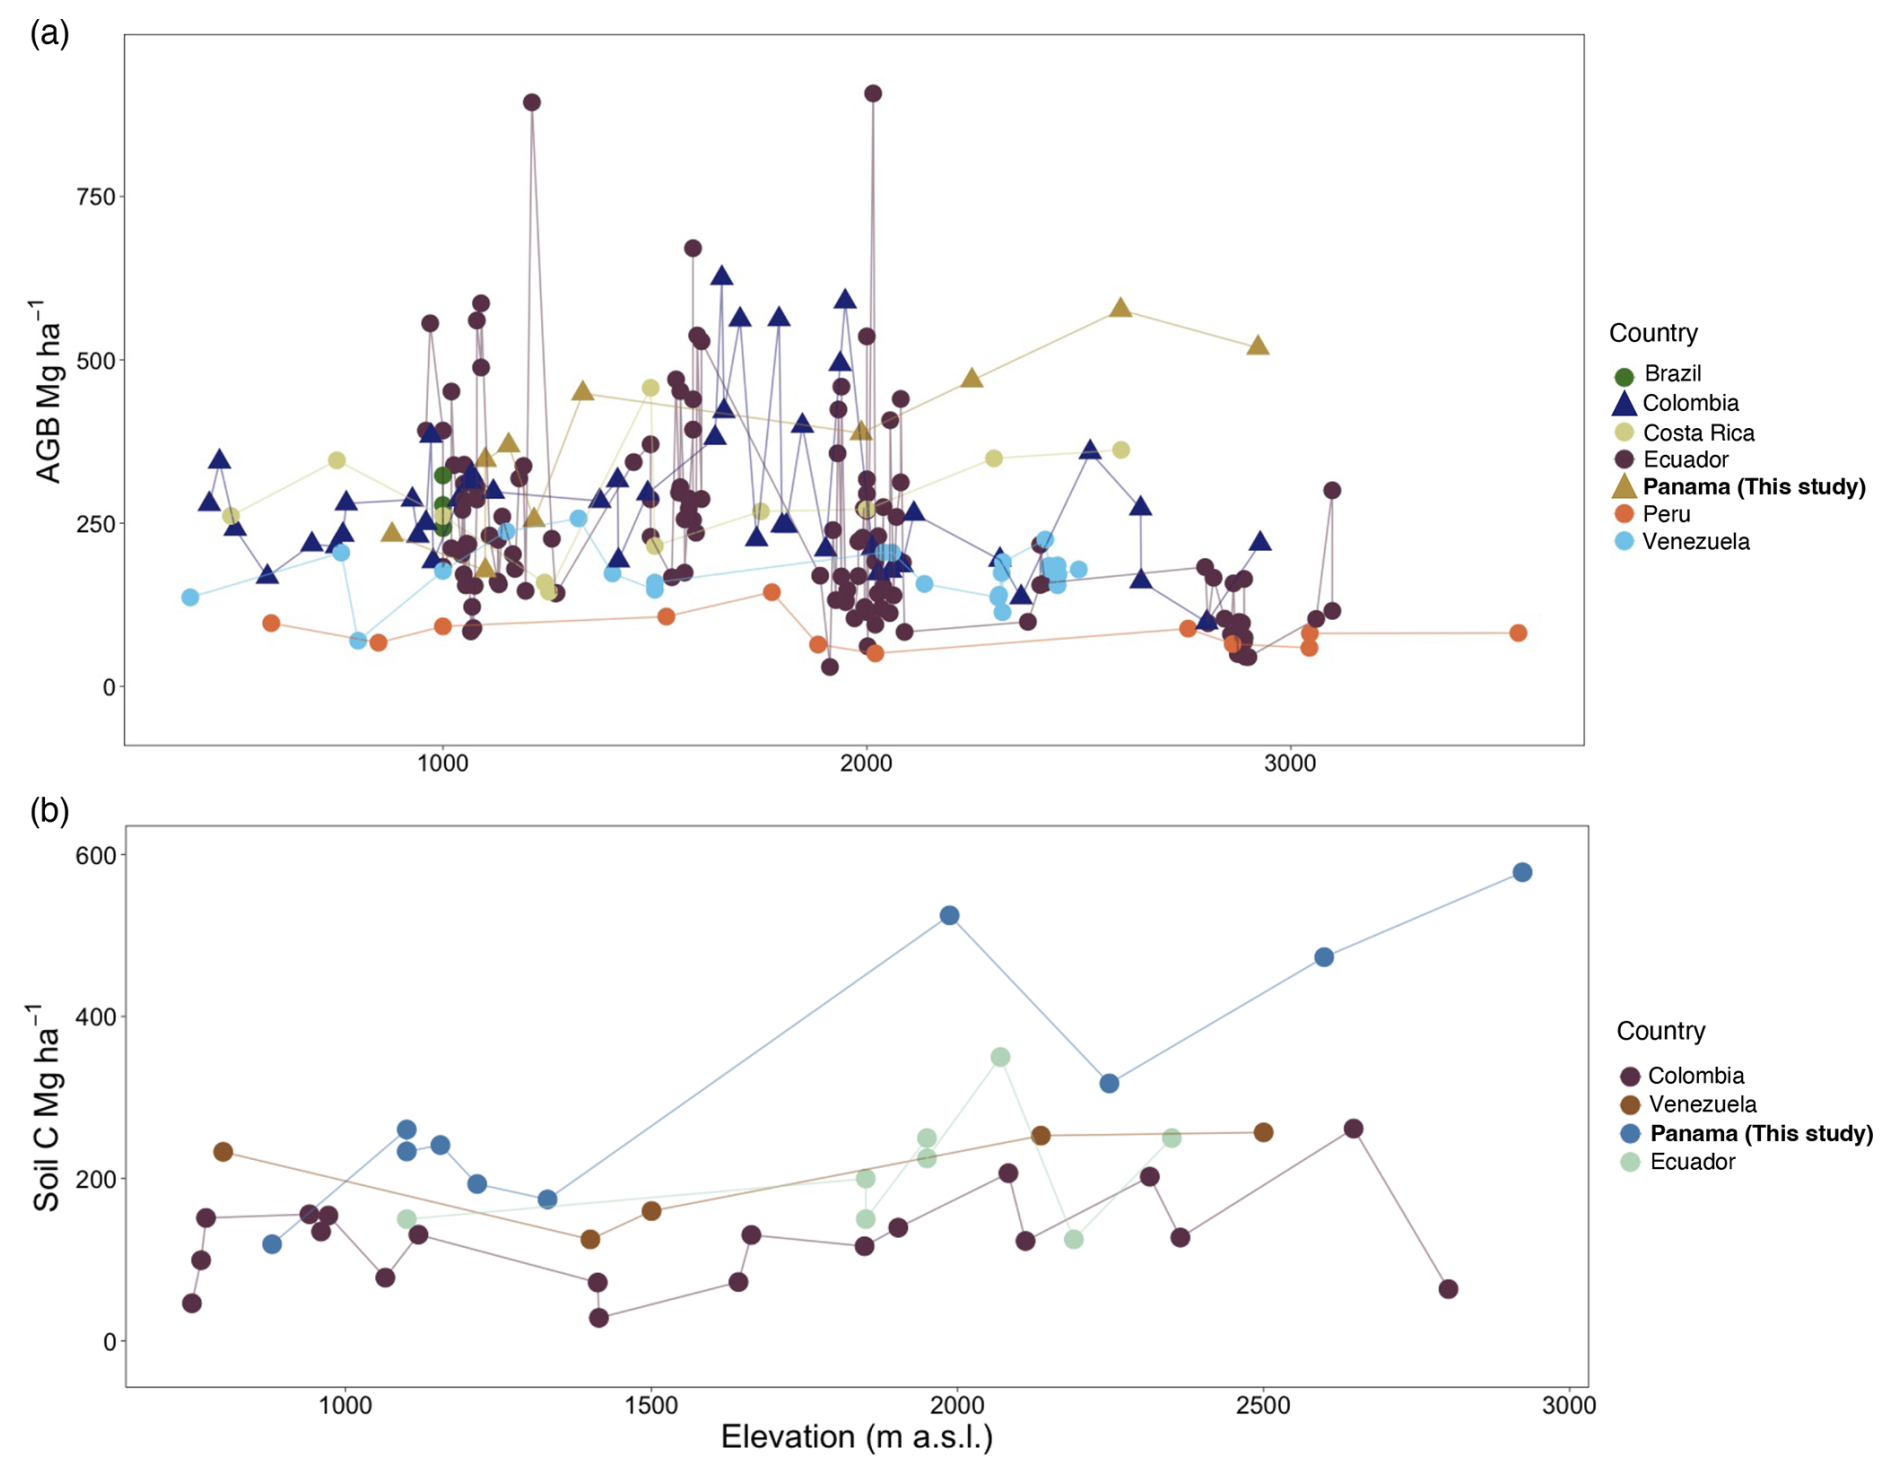
Figure 7Comparison of aboveground biomass (a) and soil C (b) stocks among countries in the neotropics from reports > 400 elevation. (a) Points represent AGB in Mg ha−1 for six countries plus the current study in Panama; symbols indicate sites with reported EM-dominated forests (triangles) or low tree EM presence (less than 10 % or absence) (circles). Studies were performed in Brazil (Alves et al., 2010), Colombia (González-Caro et al., 2020), Costa Rica (Clark et al., 2002; Hofhansl et al., 2020; Lieberman et al., 1996; Tanner et al., 2016), Ecuador (Homeier and Leuschner, 2021; Moser et al., 2008), Peru (Malhi et al., 2017), and Venezuela (Delaney et al., 1997; Vilanova et al., 2018). (b) Points represent soil C in Mg ha−1 at 1 m depth for four countries including this study. Studies were performed in Colombia (Phillips et al., 2019a), Venezuela (Delaney et al., 1997), and Ecuador (Schrumpf et al., 2001).
4.1 Carbon stocks of Panamanian montane forests in a regional and pantropical context
Values for AGB are highly variable across tropical forests. In neotropical lowland forests, plot inventories of trees with ≥ 10 cm DBH indicate that AGB ranges from 160.5 Mg ha−1 at La Selva, Costa Rica (Clark and Clark, 2000); 242.0 to 365.18 in the Área de Conservación Osa, Costa Rica (Hofhansl et al., 2020); 262 on Barro Colorado Island, Panama (Chave et al., 2003); and up to 397 ± 30 in the central Amazon of Brazil (Nascimento and Laurance, 2002). Previous studies along elevational gradients have shown no consistent pattern between elevation and AGB, either in the neotropics (Fig. 7a) or in meta-analyses of neotropical, African, and SE Asian forests (Cuni-Sanchez et al., 2021). In contrast, our study showed a significant increase in AGB with elevation, reaching a maximum value just a few hundred meters beneath the tree line in the Volcan Baru National Park. Comparing this study with four other neotropical elevational gradients indicates sites in Colombia (González-Caro et al., 2020), some sites in Ecuador (Homeier and Leuschner, 2021), and Panama (this study) share relatively high AGB at mid-elevations (1500–2000 m) compared to other sites in Ecuador (Moser et al., 2008; Homeier and Leuschner, 2021), Peru (Malhi et al., 2017), and Venezuela (Vilanova et al., 2018) (Fig. 7a). However, at high elevations, AGB in our study was between 3 and 7 times higher than AGB reported from these other gradients. Our Panama sites, however, do share high AGB with African montane forest plots spanning a similar elevation range. A recent meta-analysis of AGB for 226 African montane forest plots spanning a similar elevation range to our study found on average 326.75 Mg ha−1 (± 28.5 Mg ha−1, 95 % CI; Cuni-Sanchez et al., 2021), a value that is similar to our Panama study sites (372.07 ± 39.7 Mg ha−1) but also to Costa Rican lowland forest that can store up to 365 Mg ha−1 (Hofhansl et al., 2020).
High levels of uncertainty in the magnitude and drivers of AGB across forests (Muller-Landau et al., 2020; Sierra et al., 2007) present considerable challenges for estimating AGC at large spatial scales. Lidar provides a powerful tool that can be used to help estimate C stocks at high resolution across the globe (Réjou-Méchain et al., 2015; Asner et al., 2013). However, applying this approach requires adequate ground referencing to validate calculations. Asner et al. (2013) estimated and mapped aboveground C for the country of Panama using lidar. Although the map was validated with field data from different ecoregions of the country, no montane forest data were used. We found that the Asner et al. (2013) map consistently and substantially underestimated the AGC present in our plots (Fig. 3), with implications for the national C inventory, given the large amount of montane forest cover in the country. These results highlight the need to include inventory data that incorporates elevation-dependent changes in soils, climate, and species composition that underpin elevational changes in AGB–canopy height relationships. Using lidar in combination with field measurements in montane forests in Ecuador (González-Jaramillo et al., 2018) highlights the importance of terrain features (e.g., ridges, depressions, and protection) in estimates of AGB. For example, ravines, a landscape attribute that is usually ignored at large scales, can have high AGB. In lowland forests, high C stocks can be found in ravine forest (163 Mg ha−1) compared to nearby slopes and ridges (154 and 136 Mg ha−1, respectively) (Hofhansl et al., 2020).
As in previous studies, soil C stocks were highly variable in this study. However, unlike other neotropical studies (Fig. 7b), we found the highest soil C stocks in the highest-elevation plots, supporting our initial hypothesis of increases in soil C with elevation. At our highest-elevation site, COP, soil C to 1 m depth (578 Mg ha−1) was more than 4 times higher than comparable measurements in lowland forests in Panama (133 Mg ha−1, Cusack et al., 2018). Similarly, in our study, the soil C stock was 5 times higher in lower montane forest (1500–2000 ) and 2 times higher in upper montane forest (2000–3600 ) compared to studies in Colombia (Phillips et al., 2019a), Ecuador (Schrumpf et al., 2001), and Venezuela (Delaney et al., 1997). Additionally, high levels of soil organic carbon can be found in the organic layer in montane forest, ranging from 11.1 to 75.1 Mg ha−1 (Moser et al., 2011).
Differences in methodologies and sample sizes across studies make comparisons of coarse wood debris difficult. Furthermore, variation in total CWD within and among plots in this study was exceptionally high. One plot, HA, exhibited exceptionally high SCWD biomass (313 Mg ha−1), accompanied by large confidence intervals. This variability was attributed to the presence of two large standing dead oak trees, with some branches included in the subsamples. The presence of a few large standing dead trees can greatly skew estimates of SCWD (Gora et al., 2019), necessitating large sample sizes to capture the true mean pool size. Nonetheless, our study highlights the potential importance of CWD to the ecosystem C budget, as well as adequately constraining SCWD measurements to detect climate change effects on ecosystem carbon storage via elevated tree mortality rates.
Carbon in forests is also stored in pools not included in this study (root biomass and litter), which could contribute significantly to the total C stock. Root biomass estimates are mostly from samples from tropical lowland forests, underrepresenting montane ecosystems (Iversen et al., 2021). Recent findings from old-growth montane forests in Africa, where AGC is very high (Cuni-Sanchez et al., 2021), show that tree roots can store up to 59.3 Mg C ha−1 (Yaffar et al., 2023). Values of AGC of Cuni-Sanchez et al. (2021) are similar to the ones we found in this study; assuming parity with African montane forests, inclusion of root biomass estimates in our system would increase the total C stock by nearly 9 %. In Andean forests in Ecuador, roots can store from 12.46 to 33.14 Mg C ha−1 (Moser et al., 2011). Additionally, at 2900 m elevation, fine roots store approximately 5.5 Mg C ha−1 in Quercus forests in Costa Rica (Hertel et al., 2003) and 5.4 Mg C ha−1 in Andean forests (Moser et al., 2011). Finally, in montane forests, litter production – including leaves, reproductive organs, twigs, and other components – can range from 2 to 5 (Moser et al., 2011). This suggests that total C stocks in our plots could increase by up to approximately 1 % per year when accounting for litter production.
4.2 Responses of carbon pools to environmental and biotic factors
4.2.1 Aboveground biomass
After controlling for elevation, we found no effect of soil fertility (measured as NH4–N and resin P) on AGB. Evaluating the effects of nutrient availability on AGB along elevational gradients is challenging, as direct fertility effects may be masked by the strong correlations between elevation, and therefore temperature, and soil N and P. Neotropical forests have been reported to transition from being phosphorus-limited in lowland areas (Wright, 2019; Vitousek, 1984; Condit et al., 2013) to nitrogen-limited in montane regions (Wright, 2019; Vitousek, 1984; Tanner et al., 1998), influencing plant functioning and therefore forest productivity. In this study, we found that resin P was highly correlated with elevation, consistent with another elevational gradient in Peru (Nottingham et al., 2015a) and indicating P is not a limiting factor in this montane system. Although there is more P available in montane systems, this does not always result in higher productivity. For instance, in an elevational gradient in Ecuador, forest productivity was influenced not by P or N alone, but by a combination of soil fertility factors, which can outweigh the effects of elevation. (Homeier and Leuschner, 2021). With respect to AGB, responses to soil nutrient availability are highly inconsistent among studies (Muller-Landau et al., 2020). For example, in lowland tropical forests in the Guiana Shield (Soong et al., 2020) AGB did not respond to soil P, whereas more broadly across the Amazon basin low AGB was found to be associated with high soil P (Quesada et al., 2012). At the same time, decreasing temperatures could have multiple effects altering AGB. Decreasing temperature can reduce growth rates and is associated with increased wood density (Muller-Landau, 2004; Chave et al., 2009), which may increase AGB; however, it was not the case in our study. Alternatively, lower temperatures are also associated with reduced stand height in other tropical forests, reducing AGB (Wilcke et al., 2008). Here we found there is a positive relationship between elevation and AGB, despite wood density and canopy height not being correlated with elevation, showing basal area was the variable driving the AGB pattern. A positive relationship between elevation and basal area has been seen in other tropical forests (Unger et al., 2012; Lieberman et al., 1996; Clark et al., 2015), and in some cases a peak is attributed to the presence of Quercus spp. (Muñoz Mazón et al., 2020), a genus associated with high wood densities (Cavender-Bares, 2019).
While EM-tree species had higher wood densities compared to non-EM trees and made a large contribution to AGB, the observed positive relationship between elevation and AGB was not dependent on wood density (i.e., the pattern remained if all species were given the same wood density value). In tropical forests in Colombia and Indonesia, relatively high AGB in highland forests is associated with a significant contribution of families such as Fagaceae and Podocarpaceae (Peña et al., 2018; Culmsee et al., 2010; González-Caro et al., 2020). Recent studies have shown that the evolutionary history of tree communities can contribute to tropical forest structure, with phylogenetic signal detected in AGB (de Aguiar-Campos et al., 2021; González-Caro et al., 2020). In Colombia, AGB at intermediate elevation (1800–2200 ) is associated with a high proportion of temperate-affiliated species (González-Caro et al., 2020). Among the most important of these is the genus Quercus (González-Caro et al., 2020; Peña et al., 2018). This aligns with our results, where Quercus was the largest contributor to AGB in three of the four highest-elevation plots. Quercus and related EM genera in the Fagaceae appear to be well adapted to the cool conditions of tropical high-elevation forests in SE Asia, Central America, and northern Colombia, where individuals reach large sizes and high wood densities (Corrales et al., 2018; Cavender-Bares, 2019). However, while we found in this study that there was a strong positive correlation between elevation and the percent of basal area contributed by EM trees, the effect of % EM on AGB was no longer significant after accounting for elevation. Notably, at the Baru site, the MIR plot had an AGB value comparable to Quercus-dominated plots despite very low % EM basal area (1 % versus 48 %–74 % in other Baru plots; Table 1). We propose that non-EM genera (e.g., Magnolia, Cornus, Cedrela, Cinnamomum), which have wood densities ranging from 0.45 to 0.68, may require similar architectural and wood density traits to coexist with oak species, whose wood densities range from 0.68 to 0.81. These results, therefore, contrast with AGB patterns at a smaller spatial scale in a 50 ha plot in a temperate forest in China, where AGB was positively associated with the proportion of EM-basal area in the stand (Mao et al., 2019).
Nonetheless, high AGC for 226 African montane forest plots (Cuni-Sanchez et al., 2021) is also achieved in the absence of EM-tree species (Fagaceae and Juglandaceae are absent from African mountains). The authors concluded that high montane forest C storage in Africa (70 % higher than previous estimates for neotropical forests) could reflect unique structural characteristics of African montane forests resulting from the presence of large herbivores (elephants) or a low frequency of large disturbances (cyclones and landslides). A third potential explanation, where high AGB is associated with the presence of conifers (Podocarpaceae), was not supported by the data (Cuni-Sanchez et al., 2021). However, the same meta-analysis showed that SE Asian montane forests appear to have similar AGC to African forests. In conclusion, our results now suggest that rather than African forests having anomalously high C storage, central Andean forests may instead have anomalously low carbon storage.
4.2.2 Coarse woody debris
Coarse woody debris in tropical forests is a critical component of the C cycle, with highly variable distributions in space and time, rendering it hard to study (Iwashita et al., 2013; Gora et al., 2019). The amount of CWD in the forest can depend on wood quality, climate, and stand turnover rates (Chambers et al., 2001, 2000). Here we found that the responses of CWD to environmental and biotic factors differed between CWD pools – downed CWD and standing CWD. Total CWD and SCWD were not correlated with elevation. After controlling for elevation, we found resin P and NH4 were negatively correlated with DCWD, and % EM was positively correlated with DCWD. Previous studies in the Fortuna site have shown that wood from trees associated with low-nutrient soils had higher wood density and lower wood nutrient concentrations than those of higher-nutrient soils (Heineman et al., 2016). Although climate can be the best predictor of decomposition in neotropical forests (Cusack et al., 2009), litter quality is also important (Zhang et al., 2008). Low litter N and P concentration is associated with slow decomposition (Zhang et al., 2008), which may account for the high accumulation of DCWD on the forest floor on this study. Additionally, in the Amazon, high wood density is associated with lower decomposition rates (Chambers et al., 2000). In this study, DCWD accumulation with increasing % EM may be explained by higher values of wood density in EM-tree species compared to non-EM-tree species and potentially also lower soil N availability in EM-dominated forests (Lin et al., 2017; Phillips et al., 2013; Prada et al., 2022)
4.2.3 Soil carbon
We found that temperature was the most important factor influencing soil C stocks. Soil C accumulated with increases in elevation – a pattern that has been reported previously for tropical montane forests (Kitayama and Aiba, 2002; de la Cruz-Amo et al., 2020; Schrumpf et al., 2011; Girardin et al., 2010; Moser et al., 2011). Continually cool temperatures at high elevation decrease microbial activity, which results in a decrease in decomposition rates and mineralization of soil organic matter (Davidson and Janssens, 2006; Nottingham et al., 2015b). Following the Microbial Efficiency-Matrix Stabilization (MEMS) framework (Cotrufo et al., 2013), slow decomposition rates at high elevations suggest C in the soil would be present as particulate soil organic matter (POM), consistent with the large organic horizon observed at the Baru sites. However, in this study we also found elevation was highly positively correlated with resin P. This strong correlation makes it hard to unravel the true effect of both temperature and P on soil C stocks.
Additionally, in montane forests POM would be expected to increase in EM forests (Craig et al., 2018). In this study, we cannot separate the effect of elevation and mycorrhizal association on POM accumulation. Increasing evidence also shows significantly higher soil C stock near the soil surface beneath EM trees in both temperate and tropical forests (Averill et al., 2014; Craig et al., 2018; Lin et al., 2017; Steidinger et al., 2019), while greater soil C stock may occur at greater soil depths in AM forest (Craig et al., 2018). Mechanisms explaining differences in soil C stock have been attributed to differences in the enzymatic capacity of AM and EM species to mineralize organic matter, differences in litter quality, or in mycorrhizal carbon inputs (McGuire et al., 2010; Read and Perez-Moreno, 2003; Averill, 2016; Huang et al., 2022). In this study the effect of % EM on soil C may have been confounded by the correlation between % EM and elevation. Furthermore, recent work at a wider range of sites at Fortuna has shown that contributions of EM to soil organic matter varies widely among watersheds and is dependent on soil pH (Seyfried et al., 2021). A clear example of how high soil C stocks are not necessarily dependent on the presence of EM trees is provided by the MIR plot – a mixed forest in which EM trees accounted for only 1.1 % of basal area and yet had one of the highest soil C stocks. An additional complication that affects numerous high-elevation sites through Panama and Costa Rica is the impact of the eruptive history of a volcanically active mountain chain. Deep volcanic ash deposits, dating to 7 million years, are apparent at the HA, SAM, and especially the CA plots at Fortuna (Wegner et al., 2011; Turner and Dalling, 2021), while soil pits at Baru show soil C layers that are overlain by much more recent deposits of volcanic ash. At least four eruptions of Volcan Baru have occurred in the last 1600 years (Sherrod et al., 2008). The last episode, 500 years ago, may have included widespread tephra fallout, pyroclastic flows, and lahars across the area occupied by our plots (Sherrod et al., 2008). Volcanic eruptions result in the burial of the existing organic layer at the time of the event and can result in the long-term persistence of significant quantities of soil organic carbon (Chaopricha and Marín-Spiotta, 2014). For example, on Mt. Kilimanjaro, Tanzania, soil organic carbon below 1 m depth ranged from 117 to 627 Mg ha−1 in elevations from 2100 to 2800 (Zech, 2006). High carbon content observed at higher elevations suggests that sampling down to 1 m could offer a more comprehensive understanding of nutrient dynamics and carbon stocks in mountainous ecosystems, especially where significant carbon storage occurs below 50 cm. Particulate soil organic matter is expected to be more vulnerable to disturbance than C that is in mineral-associated organic matter (MAOM) (Poeplau et al., 2018) in lowland forests. Volcanic eruptions may protect POM, increasing soil C accumulation in these montane forests.
4.2.4 Role of tropical elevational gradients in global C stocks
Our results from the Fortuna–Baru gradient highlight the significance of these forests in the global C cycle, as they sequester large amounts of C in tree biomass and in the soil. While tropical forests represent a large proportion of the terrestrial carbon sink (Spracklen and Righelato, 2014; Duque et al., 2021), the importance of the contribution of montane forests (Cuni-Sanchez et al., 2021) and of the temperate family Fagaceae has only been fully recognized more recently (Culmsee et al., 2010; González-Caro et al., 2020; Peña et al., 2018). Nonetheless, factors explaining the dynamics and accumulation of C in the soil are still ambiguous. Large uncertainty in C pool estimates suggests that further research is needed to correctly estimate and evaluate C stocks in tropical montane forests.
R code used in this study is available at https://doi.org/10.13012/B2IDB-7962588_V1 (Dalling, 2025).
The data reported in this study are available at https://doi.org/10.13012/B2IDB-7962588_V1 (Dalling, 2025). In addition, forest census data are accessible through ForestPlots.net under the following plot codes: FOR-01 to FOR-13 and VOL-04 to VOL-10.
The supplement related to this article is available online at https://doi.org/10.5194/bg-22-3615-2025-supplement.
CMP and JWD conceived the ideas; CMP, KH, and MP carried out field data measurements; CP contributed with model analyses; CMP and JWD performed the general data analysis and wrote the paper.
The contact author has declared that none of the authors has any competing interests.
Publisher's note: Copernicus Publications remains neutral with regard to jurisdictional claims made in the text, published maps, institutional affiliations, or any other geographical representation in this paper. While Copernicus Publications makes every effort to include appropriate place names, the final responsibility lies with the authors.
We want to thank the Smithsonian Tropical Research Institute for logistical support. Autoridad Nacional del Ambiente (ANAM) provided research permits to undertake the study. We also want to thank Luke Zehr, Lucas Hernandez, Evidelio Garcia, Fredy Miranda, Marlon Olmiranda, and Marco Arturo Prada for field assistance; Price Peterson and Carlos Espinosa for logistical support; and the STRI Soil Lab for chemical analysis of soil samples.
This study was funded by the Patricia Price Peterson Foundation; Schlumberger Foundation; and Department of Plant Biology, University of Illinois Urbana-Champaign.
This paper was edited by Lucia Fuchslueger and reviewed by Jürgen Homeier, Florian Hofhansl, and one anonymous referee.
Aerts, R. and Chapin, F. S.: The Mineral Nutrition of Wild Plants Revisited: A Re-evaluation, Adv. Ecol. Res., 30, 1–67, 1999.
Alves, L. F., Vieira, S. A., Scaranello, M. A., Camargo, P. B., Santos, F. A. M., Joly, C. A., and Martinelli, L. A.: Forest structure and live aboveground biomass variation along an elevational gradient of tropical Atlantic moist forest (Brazil), Forest Ecol. Manag., 260, 679–691, https://doi.org/10.1016/j.foreco.2010.05.023, 2010.
Asner, G. P., Mascaro, J., Anderson, C., Knapp, D. E., Martin, R. E., Kennedy-bowdoin, T., Breugel, M. Van, Davies, S., Hall, J. S., Muller-landau, H. C., Potvin, C., Sousa, W. P., Wright, J., and Bermingham, E.: High-fidelity national carbon mapping for resource management and REDD+, Carbon Balance and Management, 8, 1–14, https://doi.org/10.1186/1750-0680-8-7, 2013.
Asner, G. P., Mascaro, J., Anderson, C., Knapp, D. E., Martin, R. E., Kennedy-Bowdoin, T., Breugel, M. van, Davies, S., Hall, J. S., Muller-Landau, H. C., Potvin, C., Sousa, W., Wright, J., and Bermingham, E.: Global Airborne Observatory: Forest canopy height and carbon stocks of Panama (Version 1.0) [Data set], Zenodo, https://doi.org/10.5281/zenodo.4624240, 2021.
Avalos, G., Cambronero, M., and Alvarez-Vergnani, C.: Allometric Models to Estimate Carbon Content in Arecaceae Based on Seven Species of Neotropical Palms, Frontiers in Forests and Global Change, 5, 867912, https://doi.org/10.3389/ffgc.2022.867912, 2022.
Averill, C.: Slowed decomposition in ectomycorrhizal ecosystems is independent of plant chemistry, Soil Biol. Biochem., 102, 52–54, https://doi.org/10.1016/j.soilbio.2016.08.003, 2016.
Averill, C., Turner, B. L., and Finzi, A. C.: Mycorrhiza-mediated competition between plants and decomposers drives soil carbon storage, Nature, 505, 543–545, https://doi.org/10.1038/nature12901, 2014.
Averill, C., Bhatnagar, J. M., Dietze, M. C., Pearse, W. D., and Kivlin, S. N.: Global imprint of mycorrhizal fungi on whole-plant nutrient economics, P. Natl. Acad. Sci. USA, 116, 23163–23168, https://doi.org/10.1073/pnas.1906655116, 2019.
Baker, T. R., Phillips, O. L., Malhi, Y., Almeida, S., Arroyo, L., Di Fiore, A., Erwin, T., Killeen, T. J., Laurance, S. G., Laurance, W. F., Lewis, S. L., Lloyd, J., Monteagudo, A., Neill, D. A., Patino, S., Pitman, N. C. A., Silva, J. N. M., and Martínez, R. V.: Variation in wood density determines spatial patterns in Amazonian forest biomass, Glob. Change Biol., 10, 545–562, https://doi.org/10.1111/j.1365-2486.2004.00751.x, 2004.
Beets, P. N., Kimberley, M. O., Oliver, G. R., Pearce, S. H., Graham, J. D., and Brandon, A.: Allometric equations for estimating carbon stocks in natural forest in New Zealand, Forests, 3, 818–839, https://doi.org/10.3390/f3030818, 2012.
Carreiras, J. M. B., Quegan, S., Le Toan, T., Ho Tong Minh, D., Saatchi, S. S., Carvalhais, N., Reichstein, M., and Scipal, K.: Coverage of high biomass forests by the ESA BIOMASS mission under defense restrictions, Remote Sens. Environ., 196, 154–162, https://doi.org/10.1016/j.rse.2017.05.003, 2017.
Cavender-Bares, J.: Diversification, adaptation, and community assembly of the American oaks (Quercus), a model clade for integrating ecology and evolution, New Phytol., 221, 669–692, https://doi.org/10.1111/nph.15450, 2019.
Chambers, J. Q., Higuchi, N., Schimel, J. P., Ferreira, L. V., and Melack, J. M.: Decomposition and carbon cycling of dead trees in tropical forests of the central Amazon, Oecologia, 122, 380–388, https://doi.org/10.1007/s004420050044, 2000.
Chambers, J. Q., Schimel, J. P., and Nobre, A. D.: Respiration from coarse wood litter in central Amazon forests, Biogeochemistry, 52, 115–131, https://doi.org/10.1023/A:1006473530673, 2001.
Chaopricha, N. T. and Marín-Spiotta, E.: Soil burial contributes to deep soil organic carbon storage, Soil Biol. Biochem., 69, 251–264, https://doi.org/10.1016/j.soilbio.2013.11.011, 2014.
Chave, J.: Measuring wood density for tropical forest trees: a field manual for the CTFS sites, Lab. Toulouse: Evolution et Diversité Biologique, Université Paul Sabatier, 1–6, https://afritron.org/upload/en/manuals/wood_density_english[1].pdf (last access: 18 July 2019), 2006.
Chave, J., Condit, R., Lao, S., Caspersen, J. P., Foster, R. B., and Hubbell, S. P.: Spatial and temporal variation of biomass in a tropical forest: Results from a large census plot in Panama, J. Ecol., 91, 240–252, https://doi.org/10.1046/j.1365-2745.2003.00757.x, 2003.
Chave, J., Coomes, D., Jansen, S., Lewis, S. L., Swenson, N. G., and Zanne, A. E.: Towards a worldwide wood economics spectrum, Ecol. Lett., 12, 351–366, https://doi.org/10.1111/j.1461-0248.2009.01285.x, 2009.
Chave, J., Réjou-Méchain, M., Búrquez, A., Chidumayo, E., Colgan, M. S., Delitti, W. B. C., Duque, A., Eid, T., Fearnside, P. M., Goodman, R. C., Henry, M., Martínez-Yrízar, A., Mugasha, W. A., Muller-Landau, H. C., Mencuccini, M., Nelson, B. W., Ngomanda, A., Nogueira, E. M., Ortiz-Malavassi, E., Pélissier, R., Ploton, P., Ryan, C. M., Saldarriaga, J. G., and Vieilledent, G.: Improved allometric models to estimate the aboveground biomass of tropical trees, Glob. Change Biol., 20, 3177–3190, https://doi.org/10.1111/gcb.12629, 2014.
Clark, D. B. and Clark, D. A.: Landscape-scale variation in forest structure and biomass in a tropical rain forest, Forest Ecol. Manag., 137, 185–198, https://doi.org/10.1016/S0378-1127(99)00327-8, 2000.
Clark, D. B., Clark, D. A., Brown, S., Oberbauer, S. F., and Veldkamp, E.: Stocks and flows of coarse woody debris across a tropical rain forest nutrient and topography gradient, Forest Ecol. Manag., 164, 237–248, https://doi.org/10.1016/S0378-1127(01)00597-7, 2002.
Clark, D. B., Hurtado, J., and Saatchi, S. S.: Tropical rain forest structure, tree growth and dynamics along a 2700-m elevational transect in Costa Rica, PLOS ONE, 10, 1–18, https://doi.org/10.1371/journal.pone.0122905, 2015.
Condit, R., Engelbrecht, B. M. J., Pino, D., Pérez, R., and Turnera, B. L.: Species distributions in response to individual soil nutrients and seasonal drought across a community of tropical trees, P. Natl. Acad. Sci. USA, 110, 5064–5068, https://doi.org/10.1073/pnas.1218042110, 2013.
Corrales, A., Mangan, S. A., Turner, B. L., and Dalling, J. W.: An ectomycorrhizal nitrogen economy facilitates monodominance in a neotropical forest, Ecol. Lett., 19, 383–392, https://doi.org/10.1111/ele.12570, 2016.
Corrales, A., Henkel, T. W., and Smith, M. E.: Ectomycorrhizal associations in the tropics – biogeography, diversity patterns and ecosystem roles, New Phytol., 220, 1076–1091, https://doi.org/10.1111/nph.15151, 2018.
Cotrufo, M. F., Wallenstein, M. D., Boot, C. M., Denef, K., and Paul, E.: The Microbial Efficiency-Matrix Stabilization (MEMS) framework integrates plant litter decomposition with soil organic matter stabilization: Do labile plant inputs form stable soil organic matter?, Glob. Change Biol., 19, 988–995, https://doi.org/10.1111/gcb.12113, 2013.
Craig, M. E., Turner, B. L., Liang, C., Clay, K., Johnson, D. J., and Phillips, R. P.: Tree mycorrhizal type predicts within-site variability in the storage and distribution of soil organic matter, Glob. Change Biol., 24, 3317–3330, https://doi.org/10.1111/gcb.14132, 2018.
Crawley, M. J.: The R Book, Wiley, Chichester, West Sussex, United Kingdom, ISBN 978-1-118-44890-8, 2013.
Culmsee, H., Leuschner, C., Moser, G., and Pitopang, R.: Forest aboveground biomass along an elevational transect in Sulawesi, Indonesia, and the role of Fagaceae in tropical montane rain forests, J. Biogeogr., 37, 960–974, https://doi.org/10.1111/j.1365-2699.2009.02269.x, 2010.
Cuni-Sanchez, A., Sullivan, M., Platts, P., Lewis, S., Marchant, R., Imani, G., Hubau, W., Abiem, I., Adhikari, H., Albrecht, T., Altman, J., Amani, C., Aneseyee, A., Avitabile, V., Banin, L., Batumike, R., Bauters, M., Beeckman, H., Begne, S., Bennett, A., Bitariho, R., Boeckx, P., Bogaert, J., Bräuning, A., Bulonvu, F., Burgess, N., Calders, K., Chapman, C., Chapman, H., Comiskey, J., de Haulleville, T., Decuyper, M., DeVries, B., Dolezal, J., Droissart, V., Ewango, C., Feyera, S., Gebrekirstos, A., Gereau, R., Gilpin, M., Hakizimana, D., Hall, J., Hamilton, A., Hardy, O., Hart, T., Heiskanen, J., Hemp, A., Herold, M., Hiltner, U., Horak, D., Kamdem, M., Kayijamahe, C., Kenfack, D., Kinyanjui, M., Klein, J., Lisingo, J., Lovett, J., Lung, M., Makana, J., Malhi, Y., Marshall, A., Martin, E., Mitchard, E., Morel, A., Mukendi, J., Muller, T., Nchu, F., Nyirambangutse, B., Okello, J., Peh, K., Pellikka, P., Phillips, O., Plumptre, A., Qie, L., Rovero, F., Sainge, M., Schmitt, C., Sedlacek, O., Ngute, A., Sheil, D., Sheleme, D., Simegn, T., Simo-Droissart, M., Sonké, B., Soromessa, T., Sunderland, T., Svoboda, M., Taedoumg, H., Taplin, J., Taylor, D., Thomas, S., Timberlake, J., Tuagben, D., Umunay, P., Uzabaho, E., Verbeeck, H., Vleminckx, J., Wallin, G., Wheeler, C., Willcock, S., Woods, J., and Zibera, E.: High aboveground carbon stock of African tropical montane forests, Nature, 596, 536–542, https://doi.org/10.1038/s41586-021-03728-4, 2021.
Cusack, D. F., Chou, W. W., Yang, W. H., Harmon, M. E., and Silver, W. L.: Controls on long-term root and leaf litter decomposition in neotropical forests, Glob. Change Biol., 15, 1339–1355, https://doi.org/10.1111/j.1365-2486.2008.01781.x, 2009.
Cusack, D. F., Markesteijn, L., Condit, R., Lewis, O. T., and Turner, B. L.: Soil carbon stocks across tropical forests of Panama regulated by base cation effects on fine roots, Biogeochemistry, 137, 253–266, https://doi.org/10.1007/s10533-017-0416-8, 2018.
Cushman, K. C., Muller-Landau, H. C., Condit, R. S., and Hubbell, S. P.: Improving estimates of biomass change in buttressed trees using tree taper models, Methods Ecol. Evol., 5, 573–582, https://doi.org/10.1111/2041-210X.12187, 2014.
Dalling, J. W.: Data for “Soil and Biomass Carbon Storage is Much Higher in Central American than Andean Montane Forests”, University of Illinois Urbana-Champaign [data set] and [code], https://doi.org/10.13012/B2IDB-7962588_V1, 2025.
Dalling, J. W., Prada, C. M., Heineman, K. D., Andersen, K. M., Morris, A., Pardo, J., Hollenbeck, E., Caballero, P., Espinosa, C., García, E., and Turner, B. L.: Introduction to the Fortuna Forest Reserve: Soil and Climate Effects on the Tree Communities of a Premontane Tropical Forest, in: Fortuna Forest Reserve, Panama, Interacting Effects of Climate and Soils on the Biota of a Wet Premontane Tropical Forest, edited by: Dalling, J. W. and Turner, B. L., Smithsonian Scholarly Press, Washington, DC, Methods in Ecology and Evolution, 1–28, https://scholarlypress.si.edu/store/life-sciences-biodiversity/fortuna-forest-reserve-panama-interacting-effects/ (last access: 26 January 2022), 2021.
Davidson, E. A. and Janssens, I. A.: Temperature sensitivity of soil carbon decomposition and feedbacks to climate change, Nature, 440, 165–173, https://doi.org/10.1038/nature04514, 2006.
de Aguiar-Campos, N., Coelho de Souza, F., Maia, V. A., Rezende, V. L., de Souza, C. R., de Paula, G. G. P., Santos, P. F., de Oliveira Menino, G. C., da Silva, W. B., and dos Santos, R. M.: Evolutionary constraints on tree size and above-ground biomass in tropical dry forests, J. Ecol., 109, 1690–1702, https://doi.org/10.1111/1365-2745.13589, 2021.
De Deyn, G. B., Cornelissen, J. H. C., and Bardgett, R. D.: Plant functional traits and soil carbon sequestration in contrasting biomes, Ecol. Lett., 11, 516–531, https://doi.org/10.1111/j.1461-0248.2008.01164.x, 2008.
de la Cruz-Amo, L., Bañares-de-Dios, G., Cala, V., Granzow-de la Cerda, Í., Espinosa, C. I., Ledo, A., Salinas, N., Macía, M. J., and Cayuela, L.: Trade-Offs Among Aboveground, Belowground, and Soil Organic Carbon Stocks Along Altitudinal Gradients in Andean Tropical Montane Forests, Front. Plant Sci., 11, 1–11, https://doi.org/10.3389/fpls.2020.00106, 2020.
Delaney, M., Brown, S., Lugo, A. E., Torres-Lezama, A., and Quintero, N. B.: The distribution of organic carbon in major components of forests located in five life zones of Venezuela, J. Trop. Ecol., 13, 697–708, https://doi.org/10.1017/S0266467400010877, 1997.
Duque, A., Peña, M. A., Cuesta, F., González-caro, S., Kennedy, P., Phillips, O. L., Calderón-loor, M., Blundo, C., Carilla, J., Cayola, L., Farfán-ríos, W., Fuentes, A., Grau, R., Homeier, J., Loza-rivera, M. I., Malhi, Y., Malizia, A., Malizia, L., Martínez-villa, J. A., Myers, J. A., Osinaga-acosta, O., Peralvo, M., Pinto, E., and Saatchi, S.: Mature Andean forests as globally important carbon sinks and future carbon refuges, Nat. Commun., 1–10, https://doi.org/10.1038/s41467-021-22459-8, 2021.
Girardin, C. A. J., Malhi, Y., Aragão, L. E. O. C., Mamani, M., Huaraca Huasco, W., Durand, L., Feeley, K. J., Rapp, J., Silva-Espejo, J. E., Silman, M., Salinas, N., and Whittaker, R. J.: Net primary productivity allocation and cycling of carbon along a tropical forest elevational transect in the Peruvian Andes, Glob. Change Biol., 16, 3176–3192, https://doi.org/10.1111/j.1365-2486.2010.02235.x, 2010.
Girardin, C. A. J., Farfan-Rios, W., Garcia, K., Feeley, K. J., Jørgensen, P. M., Murakami, A. A., Cayola Pérez, L., Seidel, R., Paniagua, N., Fuentes Claros, A. F., Maldonado, C., Silman, M., Salinas, N., Reynel, C., Neill, D. A., Serrano, M., Caballero, C. J., La Torre Cuadros, M. de los A., Macía, M. J., Killeen, T. J., and Malhi, Y.: Spatial patterns of above-ground structure, biomass and composition in a network of six Andean elevation transects, Plant Ecol. Divers., 7, 161–171, https://doi.org/10.1080/17550874.2013.820806, 2014.
Glassmire, A. E., Zehr, L. N., and Wetzel, W. C.: Disentangling dimensions of phytochemical diversity: alpha and beta have contrasting effects on an insect herbivore, Ecology, 101, 1–12, https://doi.org/10.1002/ecy.3158, 2020.
González-Caro, S., Duque, Á., Feeley, K. J., Cabrera, E., Phillips, J., Ramirez, S., and Yepes, A.: The legacy of biogeographic history on the composition and structure of Andean forests, Ecology, 101, 1–11, https://doi.org/10.1002/ecy.3131, 2020.
González-Jaramillo, V., Fries, A., Zeilinger, J., Homeier, J., Paladines-Benitez, J., and Bendix, J.: Estimation of above ground biomass in a tropical mountain forest in southern Ecuador using airborne LiDAR data, Remote Sens.-Basel, 10, 660, https://doi.org/10.3390/rs10050660, 2018.
Gora, E. M., Kneale, R. C., Larjavaara, M., and Muller-Landau, H. C.: Dead Wood Necromass in a Moist Tropical Forest: Stocks, Fluxes, and Spatiotemporal Variability, Ecosystems, 22, 1189–1205, https://doi.org/10.1007/s10021-019-00341-5, 2019.
Hall, J. S., Harris, D. J., Saltonstall, K., Medjibe, V. de P., Ashton, M. S., and Turner, B. L.: Resource acquisition strategies facilitate Gilbertiodendron dewevrei monodominance in African lowland forests, J. Ecol., 108, 433–448, https://doi.org/10.1111/1365-2745.13278, 2020.
Heineman, K. D., Turner, B. L., and Dalling, J. W.: Variation in wood nutrients along a tropical soil fertility gradient, New Phytol., 211, 440–454, https://doi.org/10.1111/nph.13904, 2016.
Hertel, D., Leuschner, C., and Hölscher, D.: Size and Structure of Fine Root Systems in Old-growth and Secondary Tropical Montane Forests (Costa Rica), Biotropica, 35, 143, https://doi.org/10.1646/02022, 2003.
Hofhansl, F., Schnecker, J., Singer, G., and Wanek, W.: New insights into mechanisms driving carbon allocation in tropical forests, New Phytol., 205, 137–146, https://doi.org/10.1111/nph.13007, 2015.
Hofhansl, F., Chacón-Madrigal, E., Fuchslueger, L., Jenking, D., Morera-Beita, A., Plutzar, C., Silla, F., Andersen, K. M., Buchs, D. M., Dullinger, S., Fiedler, K., Franklin, O., Hietz, P., Huber, W., Quesada, C. A., Rammig, A., Schrodt, F., Vincent, A. G., Weissenhofer, A., and Wanek, W.: Climatic and edaphic controls over tropical forest diversity and vegetation carbon storage, Sci. Rep., 10, 1–11, https://doi.org/10.1038/s41598-020-61868-5, 2020.
Holdridge, L. R.: Determination of world plant formations from simple climatic data, Science, 105, 2727, https://doi.org/10.1126/science.105.2727.367, 1947.
Homeier, J. and Leuschner, C.: Factors controlling the productivity of tropical Andean forests: climate and soil are more important than tree diversity, Biogeosciences, 18, 1525–1541, https://doi.org/10.5194/bg-18-1525-2021, 2021.
Huang, W., van Bodegom, P. M., Declerck, S., Heinonsalo, J., Cosme, M., Viskari, T., Liski, J., and Soudzilovskaia, N. A.: Mycelium chemistry differs markedly between ectomycorrhizal and arbuscular mycorrhizal fungi, Communications Biology, 5, 1–8, https://doi.org/10.1038/s42003-022-03341-9, 2022.
Huss-Daniel, K.: Tansley Review No. 93, Actinorhizal symbioses and their N2 fixation, New Phytol., 136, 375–405, https://doi.org/10.1046/j.1469-8137.1997.00755.x, 1997.
Iversen, C. M., Powell, A. S., McCormack, M. L., Blackwood, C. B., Freschet, G. T., Kattge, J., Roumet, C., Stover, D. B., Soudzilovskaia, N. A., Valverde-Barrantes, O. J., van Bodegom, P. M., and Violle, C.: Fine-Root Ecology Database (FRED): A Global Collection of Root Trait Data with Coincident Site, Vegetation, Edaphic, and Climactic Data, Version 3, Oak Ridge National Laboratory, TES SFA, U.S. Department of Energy, Oak Ridge, Tennessee, USA, https://roots.ornl.gov/sites/default/files/2021-01/FRED_3_User_Guidance_Doc_2021.pdf (last access: 30 March 2024), 2021.
Iwashita, D. K., Litton, C. M., and Giardina, C. P.: Coarse woody debris carbon storage across a mean annual temperature gradient in tropical montane wet forest, Forest Ecol. Manag., 291, 336–343, https://doi.org/10.1016/j.foreco.2012.11.043, 2013.
Karger, D. N., Conrad, O., Böhner, J., Kawohl, T., Kreft, H., Soria-Auza, R. W., Zimmermann, N. E., Linder, H. P., and Kessler, M.: Climatologies at high resolution for the earth's land surface areas, Scientific Data, 4, 1–20, https://doi.org/10.1038/sdata.2017.122, 2017.
Keenan, T. F. and Williams, C. A.: The Terrestrial Carbon Sink, Annu. Rev. Env. Resour., 43, 219–243, https://doi.org/10.1146/annurev-environ-102017-030204, 2018.
Keller, A. B. and Phillips, R. P.: Leaf litter decay rates differ between mycorrhizal groups in temperate, but not tropical, forests, New Phytol., 222, 556–564, https://doi.org/10.1111/nph.15524, 2019.
Kitayama, K. and Aiba, S. I.: Ecosystem Structure and Productivity of Tropical Rain Forests along Altitudinal Gradients with Contrasting Soil Phosphorus Pools on Mount Kinabalu, Borneo, J. Ecol., 90, 37–51, 2002.
Kozak, A., Munro, D. D., and Smith, J. H. G.: Taper Functions and their application in forest inventory, Forest Chron., 45, 4, https://doi.org/10.5558/tfc45278-4, 1969.
Larjavaara, M. and Muller-Landau, H. C.: Cross-section mass: An improved basis for woody debris necromass inventory, Silva Fenn., 45, 291–296, https://doi.org/10.14214/sf.119, 2011.
Lefcheck, J. S.: piecewiseSEM: Piecewise structural equation modelling in r for ecology, evolution, and systematics, Methods Ecol. Evol., 7, 573–579, https://doi.org/10.1111/2041-210X.12512, 2016.
Leitold, V., Keller, M., Morton, D. C., Cook, B. D., and Shimabukuro, Y. E.: Airborne lidar-based estimates of tropical forest structure in complex terrain: Opportunities and trade-offs for REDD+, Carbon Balance and Management, 10, 3, https://doi.org/10.1186/s13021-015-0013-x, 2014.
Lieberman, D., Lieberman, M., Peralta, R., and Hartshorn, G. S.: Tropical Forest Structure and Composition on a Large-Scale Altitudinal Gradient in Costa Rica, J. Ecol., 84, 137, https://doi.org/10.2307/2261350, 1996.
Lin, G., McCormack, M. L., Ma, C., and Guo, D.: Similar below-ground carbon cycling dynamics but contrasting modes of nitrogen cycling between arbuscular mycorrhizal and ectomycorrhizal forests, New Phytol., 213, 1440–1451, https://doi.org/10.1111/nph.14206, 2017.
Malhi, Y. and Grace, J.: Tropical forests and atmospheric carbon dioxide, Trends Ecol. Evol., 15, 332–337, https://doi.org/10.1016/S0169-5347(00)01906-6, 2000.
Malhi, Y., Baker, T. R., Phillips, O. L., Almeida, S., Alvarez, E., Arroyo, L., Chave, J., Czimczik, C. I., Di Fiore, A., Higuchi, N., Killeen, T. J., Laurance, S. G., Laurance, W. F., Lewis, S. L., Montoya, L. M. M., Monteagudo, A., Neill, D. A., Vargas, P. N., Patino, S., Pitman, N. C. A., Quesada, C. A., Salomao, R., Silva, J. N. M., Lezama, A. T., Martínez, R. V., Terborgh, J., Vinceti, B., and Lloyd, J.: The above-ground coarse wood productivity of 104 Neotropical forest plots, Glob. Change Biol., 10, 563–591, https://doi.org/10.1111/j.1529-8817.2003.00778.x, 2004.
Malhi, Y., Silman, M., Salinas, N., Bush, M., Meir, P., and Saatchi, S.: Introduction: Elevation gradients in the tropics: Laboratories for ecosystem ecology and global change research, Glob. Change Biol., 16, 3171–3175, https://doi.org/10.1111/j.1365-2486.2010.02323.x, 2010.
Malhi, Y., Girardin, C. A. J., Goldsmith, G. R., Doughty, C. E., Salinas, N., Metcalfe, D. B., Huaraca Huasco, W., Silva-Espejo, J. E., del Aguilla-Pasquell, J., Farfán Amézquita, F., Aragão, L. E. O. C., Guerrieri, R., Ishida, F. Y., Bahar, N. H. A., Farfan-Rios, W., Phillips, O. L., Meir, P., and Silman, M.: The variation of productivity and its allocation along a tropical elevation gradient: a whole carbon budget perspective, New Phytol., 214, 1019–1032, https://doi.org/10.1111/nph.14189, 2017.
Mao, Z., Corrales, A., Zhu, K., Yuan, Z., Lin, F., Ye, J., Hao, Z., and Wang, X.: Tree mycorrhizal associations mediate soil fertility effects on forest community structure in a temperate forest, New Phytol., 223, 475–486, https://doi.org/10.1111/nph.15742, 2019.
Marrs, R. H., Proctor, J., Heaney, A., and Mountford, M. D.: Changes in Soil Nitrogen-Mineralization and Nitrification Along an Altitudinal Transect in Tropical Rain Forest in Costa Rica, J. Ecol., 76, 466–482, https://doi.org/10.2307/2260606, 1988.
McGuire, K. L., Zak, D. R., Edwards, I. P., Blackwood, C. B., and Upchurch, R.: Slowed decomposition is biotically mediated in an ectomycorrhizal, tropical rain forest, Oecologia, 164, 785–795, https://doi.org/10.1007/s00442-010-1686-1, 2010.
Meister, K., Ashton, M. S., Craven, D., and Heather, G.: Carbon Dynamics of Tropical Forests, in: Managing Forest Carbon in a Changing Climate, edited by: Ashton, M. S., Tyrrell, M. L., Spalding, D., and Gentry, B., Springer Science+Business Media B. V. Family, https://doi.org/10.1007/978-94-007-2232-3_4, 1–414, 2012.
Mitchard, E. T. A.: The tropical forest carbon cycle and climate change, Nature, 559, 527–534, https://doi.org/10.1038/s41586-018-0300-2, 2018.
Moser, G., Röderstein, M., Soethe, N., Hertel, D., and Leuschner, C.: Altitudinal Changes in Stand Structure and Biomass Allocation of Tropical Mountain Forests in Relation to Microclimate and Soil Chemistry, in: Gradients in a Tropical Mountain Ecosystem of Ecuador, Ecological Studies, vol 198, edited by: Beck, E., Bendix, J., Kottke, I., Makeschin, F., and Mosandl, R., Springer, Berlin, Heidelberg, 229–242, https://doi.org/10.1007/978-3-540-73526-7_22, 2008.
Moser, G., Leuschner, C., Hertel, D., Graefe, S., Soethe, N., and Iost, S.: Elevation effects on the carbon budget of tropical mountain forests (S Ecuador): The role of the belowground compartment, Glob. Change Biol., 17, 2211–2226, https://doi.org/10.1111/j.1365-2486.2010.02367.x, 2011.
Muller-Landau, H.: Interspecific and Inter-site Variation in Wood Specific Gravity of Tropical Trees, Biotropica, 36, 20–32, 2004.
Muller-Landau, H. C., Cushman, K. C., Arroyo, E. E., Martinez Cano, I., Anderson-Teixeira, K. J., and Backiel, B.: Patterns and mechanisms of spatial variation in tropical forest productivity, woody residence time, and biomass, New Phytol., 229, 3065–3087, https://doi.org/10.1111/nph.17084, 2020.
Muñoz Mazón, M., Klanderud, K., Finegan, B., Veintimilla, D., Bermeo, D., Murrieta, E., Delgado, D., and Sheil, D.: How forest structure varies with elevation in old growth and secondary forest in Costa Rica, Forest Ecol. Manag., 469, 118191, https://doi.org/10.1016/j.foreco.2020.118191, 2020.
Nascimento, H. E. M. and Laurance, W. F.: Total aboveground biomass in central Amazonian rainforests: A landscape-scale study, Forest Ecol. Manag., 168, 311–321, https://doi.org/10.1016/S0378-1127(01)00749-6, 2002.
Nottingham, A. T., Whitaker, J., Turner, B. L., Salinas, N., Zimmermann, M., Malhi, Y., and Meir, P.: Climate Warming and Soil Carbon in Tropical Forests: Insights from an Elevation Gradient in the Peruvian Andes, BioScience, 65, 906–921, https://doi.org/10.1093/biosci/biv109, 2015a.
Nottingham, A. T., Turner, B. L., Whitaker, J., Ostle, N. J., McNamara, N. P., Bardgett, R. D., Salinas, N., and Meir, P.: Soil microbial nutrient constraints along a tropical forest elevation gradient: a belowground test of a biogeochemical paradigm, Biogeosciences, 12, 6071–6083, https://doi.org/10.5194/bg-12-6071-2015, 2015b.
Pan, Y., Birdsey, R. A., Fang, J., Houghton, R., Kauppi, P. E., Kurz, W. A., Phillips, O. L., Shvidenko, A., Lewis, S. L., Canadell, J. G., Ciais, P., Jackson, R. B., Pacala, S. W., McGuire, A. D., Piao, S., Rautiainen, A., Sitch, S., and Hayes, D.: A Large and Persistent Carbon Sink in the World's Forests, Science, 333, 4, 2011.
Pan, Y., Birdsey, R. A., Phillips, O. L., and Jackson, R. B.: The structure, distribution, and biomass of the world's forests, Annu. Rev. Ecol. Evol. S., 44, 593–622, https://doi.org/10.1146/annurev-ecolsys-110512-135914, 2013.
Peña, M. A., Feeley, K. J., and Duque, A.: Effects of endogenous and exogenous processes on aboveground biomass stocks and dynamics in Andean forests, Plant Ecol., 219, 1481–1492, https://doi.org/10.1007/s11258-018-0895-2, 2018.
Phillips, J., Ramirez, S., Wayson, C., and Duque, A.: Differences in carbon stocks along an elevational gradient in tropical mountain forests of Colombia, Biotropica, 51, 490–499, https://doi.org/10.1111/btp.12675, 2019a.
Phillips, O. L., Sullivan, M. J. P., Baker, T. R., Monteagudo Mendoza, A., Vargas, P. N., and Vásquez, R.: Species Matter: Wood Density Influences Tropical Forest Biomass at Multiple Scales, Surv. Geophys., 40, 913–935, https://doi.org/10.1007/s10712-019-09540-0, 2019b.
Phillips, R. P., Brzostek, E., and Midgley, M. G.: The mycorrhizal-associated nutrient economy: A new framework for predicting carbon-nutrient couplings in temperate forests, New Phytol., 199, 41–51, https://doi.org/10.1111/nph.12221, 2013.
Poeplau, C., Don, A., Six, J., Kaiser, M., Benbi, D., Chenu, C., Cotrufo, M. F., Derrien, D., Gioacchini, P., Grand, S., Gregorich, E., Griepentrog, M., Gunina, A., Haddix, M., Kuzyakov, Y., Kühnel, A., Macdonald, L. M., Soong, J., Trigalet, S., Vermeire, M.-L., Rovira, P., van Wesemael, B., Wiesmeier, M., Yeasmin, S., Yevdokimov, I., and Nieder, R.: Isolating organic carbon fractions with varying turnover rates in temperate agricultural soils – A comprehensive method comparison, Soil Biol. Biochem., 125, 10–26, https://doi.org/10.1016/j.soilbio.2018.06.025, 2018.
Prada, C. M., Morris, A., Andersen, K. M., Turner, B. L., Caballero, P., and Dalling, J. W.: Soils and rainfall drive landscape-scale changes in the diversity and functional composition of tree communities in premontane tropical forest, J. Veg. Sci., 28, 859–870, https://doi.org/10.1111/jvs.12540, 2017.
Prada, C. M., Turner, B. L., and Dalling, J. W.: Growth responses of ectomycorrhizal and arbuscular mycorrhizal seedlings to low soil nitrogen availability in a tropical montane forest, Funct. Ecol., 36, 107–119, https://doi.org/10.1111/1365-2435.13901, 2022.
Quesada, C. A., Phillips, O. L., Schwarz, M., Czimczik, C. I., Baker, T. R., Patiño, S., Fyllas, N. M., Hodnett, M. G., Herrera, R., Almeida, S., Alvarez Dávila, E., Arneth, A., Arroyo, L., Chao, K. J., Dezzeo, N., Erwin, T., di Fiore, A., Higuchi, N., Honorio Coronado, E., Jimenez, E. M., Killeen, T., Lezama, A. T., Lloyd, G., López-González, G., Luizão, F. J., Malhi, Y., Monteagudo, A., Neill, D. A., Núñez Vargas, P., Paiva, R., Peacock, J., Peñuela, M. C., Peña Cruz, A., Pitman, N., Priante Filho, N., Prieto, A., Ramírez, H., Rudas, A., Salomão, R., Santos, A. J. B., Schmerler, J., Silva, N., Silveira, M., Vásquez, R., Vieira, I., Terborgh, J., and Lloyd, J.: Basin-wide variations in Amazon forest structure and function are mediated by both soils and climate, Biogeosciences, 9, 2203–2246, https://doi.org/10.5194/bg-9-2203-2012, 2012.
R Core Team: R: A language and environment for statistical computing, https://www.r-project.org/ (last access: 21 December 2024), 2022.
Read, D. J. and Perez-Moreno, J.: Mycorrhizas and nutrient cycling in ecosystems – A journey towards relevance?, New Phytol., 157, 475–492, https://doi.org/10.1046/j.1469-8137.2003.00704.x, 2003.
Réjou-Méchain, M., Tymen, B., Blanc, L., Fauset, S., Feldpausch, T. R., Monteagudo, A., Phillips, O. L., Richard, H., and Chave, J.: Using repeated small-footprint LiDAR acquisitions to infer spatial and temporal variations of a high-biomass Neotropical forest, Remote Sens. Environ., 169, 93–101, https://doi.org/10.1016/j.rse.2015.08.001, 2015.
Réjou-Méchain, M., Tanguy, A., Piponiot, C., Chave, J., and Hérault, B.: Biomass: an R Package for Estimating Above-Ground Biomass and Its Uncertainty in Tropical Forests, Methods Ecol. Evol., 8, 1163–1167, https://doi.org/10.1111/2041-210X.12753, 2017.
Saatchi, S. S., Harris, N. L., Brown, S., Lefsky, M., Mitchard, E. T. A., Salas, W., Zutta, B. R., Buermann, W., Lewis, S. L., Hagen, S., Petrova, S., White, L., Silman, M., and Morel, A.: Benchmark map of forest carbon stocks in tropical regions across three continents, P. Natl. Acad. Sci. USA, 108, 9899–9904, https://doi.org/10.1073/pnas.1019576108, 2011.
Schmitt, C. B., Senbeta, F., Woldemariam, T., Rudner, M., and Denich, M.: Importance of regional climates for plant species distribution patterns in moist Afromontane forest, J. Veg. Sci., 24, 553–568, https://doi.org/10.1111/j.1654-1103.2012.01477.x, 2013.
Schrumpf, M., Guggenberger, G., Schubert, C., Valarezo, C., and Zech, W.: Tropical montane rain forest soils: development and nutrient status along an altitudinal gradient in the south Ecuadorian Andes, Die Erde, 132, 43–59, 2001.
Schrumpf, M., Schulze, E. D., Kaiser, K., and Schumacher, J.: How accurately can soil organic carbon stocks and stock changes be quantified by soil inventories?, Biogeosciences, 8, 1193–1212, https://doi.org/10.5194/bg-8-1193-2011, 2011.
Seyfried, G. S., Canham, C. D., Dalling, J. W., and Yang, W. H.: The effects of tree-mycorrhizal type on soil organic matter properties from neighborhood to watershed scales, Soil Biol. Biochem., 161, 108385, https://doi.org/10.1016/j.soilbio.2021.108385, 2021.
Sherrod, D. R., Vallance, J. W., Tapia Espinosa, A., and McGeehin, J. P.: Volcan Baru: Eruptive History and Volcano-Hazards Assessment, Open-File Report, U.S. Geological Survey, https://doi.org/10.3133/ofr20071401, 1–33, 2008.
Sierra, C. A., del Valle, J. I., Orrego, S. A., Moreno, F. H., Harmon, M. E., Zapata, M., Colorado, G. J., Herrera, M. A., Lara, W., Restrepo, D. E., Berrouet, L. M., Loaiza, L. M., and Benjumea, J. F.: Total carbon stocks in a tropical forest landscape of the Porce region, Colombia, Forest Ecol. Manag., 243, 299–309, https://doi.org/10.1016/j.foreco.2007.03.026, 2007.
Soong, J. L., Janssens, I. A., Grau, O., Margalef, O., Stahl, C., Van Langenhove, L., Urbina, I., Chave, J., Dourdain, A., Ferry, B., Freycon, V., Herault, B., Sardans, J., Peñuelas, J., and Verbruggen, E.: Soil properties explain tree growth and mortality, but not biomass, across phosphorus-depleted tropical forests, Sci. Rep., 10, 1–13, https://doi.org/10.1038/s41598-020-58913-8, 2020.
Soudzilovskaia, N. A., van Bodegom, P. M., Terrer, C., Zelfde, M. van't, McCallum, I., McCormack, M. ., Fisher, J. B., Brundrett, M. C., de Sá, N. C., and Tedersoo, L.: Global mycorrhizal plant distribution linked to terrestrial carbon stocks, Nat. Commun., 10, 1–10, https://doi.org/10.1038/s41467-019-13019-2, 2019.
Soudzilovskaia, N. A., Vaessen, S., Barcelo, M., He, J., Rahimlou, S., Abarenkov, K., Brundrett, M. C., Gomes, S. I. F., Merckx, V., and Tedersoo, L.: FungalRoot: global online database of plant mycorrhizal associations, New Phytol., 227, 955–966, https://doi.org/10.1111/nph.16569, 2020.
Spracklen, D. V. and Righelato, R.: Tropical montane forests are a larger than expected global carbon store, Biogeosciences, 11, 2741–2754, https://doi.org/10.5194/bg-11-2741-2014, 2014.
Sprent, J. I.: Legume Nodulation: A Global Perspective, Wiley, Germany, ISBN 978-1-405-18175-4, 105–156, 2009.
Steidinger, B. S., Crowther, T. W., Liang, J., Van Nuland, M. E., Werner, G. D. A., Reich, P. B., Nabuurs, G., de-Miguel, S., Zhou, M., Picard, N., Herault, B., Zhao, X., Zhang, C., Routh, D., Peay, K. G., Abegg, M., Adou Yao, C. Y., Alberti, G., Almeyda Zambrano, A., Alvarez-Davila, E., Alvarez-Loayza, P., Alves, L. F., Ammer, C., Antón-Fernández, C., Araujo-Murakami, A., Arroyo, L., Avitabile, V., Aymard, G., Baker, T., Bałazy, R., Banki, O., Barroso, J., Bastian, M., Bastin, J. F., Birigazzi, L., Birnbaum, P., Bitariho, R., Boeckx, P., Bongers, F., Bouriaud, O., Brancalion, P. H. H. S., Brandl, S., Brearley, F. Q., Brienen, R., Broadbent, E., Bruelheide, H., Bussotti, F., Cazzolla Gatti, R., Cesar, R., Cesljar, G., Chazdon, R., Chen, H. Y. H., Chisholm, C., Cienciala, E., Clark, C. J., Clark, D., Colletta, G., Condit, R., Coomes, D., Cornejo Valverde, F., Corral-Rivas, J. J., Crim, P., Cumming, J., Dayanandan, S., de Gasper, A. L., Decuyper, M., Derroire, G., DeVries, B., Djordjevic, I., Iêda, A., Dourdain, A., Obiang, N. L. E., Enquist, B., Eyre, T., Fandohan, A. B., Fayle, T. M., Feldpausch, T. R., Finér, L., Fischer, M., Fletcher, C., Fridman, J., Frizzera, L., Gamarra, J. G. P., Gianelle, D., Glick, H. B., Harris, D., Hector, A., Hemp, A., Hengeveld, G., Herbohn, J., Herold, M., Hillers, A., Honorio Coronado, E. N., Huber, M., Hui, C., Cho, H., Ibanez, T., Jung, I., Imai, N., Jagodzinski, A. M., Jaroszewicz, B., Johannsen, V., Joly, C. A., Jucker, T., Karminov, V., Kartawinata, K., Kearsley, E., Kenfack, D., Kennard, D., Kepfer-Rojas, S., Keppel, G., Khan, M. L., Killeen, T., Kim, H. S., Kitayama, K., Köhl, M., Korjus, H., Kraxner, F., Laarmann, D., Lang, M., Lewis, S., Lu, H., Lukina, N., Maitner, B., Malhi, Y., Marcon, E., Marimon, B. S., Marimon-Junior, B. H., Marshall, A. R., Martin, E., Martynenko, O., Meave, J. A., Melo-Cruz, O., Mendoza, C., Merow, C., Monteagudo Mendoza, A., Moreno, V., Mukul, S. A., Mundhenk, P., Nava-Miranda, M. G., Neill, D., Neldner, V., Nevenic, R., Ngugi, M., Niklaus, P., Oleksyn, J., Ontikov, P., Ortiz-Malavasi, E., Pan, Y., Paquette, A., Parada-Gutierrez, A., Parfenova, E., Park, M., Parren, M., Parthasarathy, N., Peri, P. L., Pfautsch, S., Phillips, O., Piedade, M. T., Piotto, D., Pitman, N. C. A., Polo, I., Poorter, L., Poulsen, A. D., Poulsen, J. R., Pretzsch, H., Ramirez Arevalo, F., Restrepo-Correa, Z., Rodeghiero, M., Rolim, S., Roopsind, A., Rovero, F., Rutishauser, E., Saikia, P., Saner, P., Schall, P., Schelhaas, M.-J., Schepaschenko, D., Scherer-Lorenzen, M., Schmid, B., Schöngart, J., Searle, E., Seben, V., Serra-Diaz, J. M., Salas-Eljatib, C., Sheil, D., Shvidenko, A., Silva-Espejo, J., Silveira, M., Singh, J., Sist, P., Slik, F., Sonké, B., Souza, A. F., Stereńczak, K., Svenning, J.-C., Svoboda, M., Targhetta, N., Tchebakova, N., Ter Steege, H., Thomas, R., Tikhonova, E., Umunay, P., Usoltsev, V., Valladares, F., van der Plas, F., Van Do, T., Vasquez Martinez, R., Verbeeck, H., Viana, H., Vieira, S., von Gadow, K., Wang, H.-F., Watson, J., Westerlund, B., Wiser, S., Wittmann, F., Wortel, V., Zagt, R., Zawila-Niedzwiecki, T., Zhu, Z.-X., and Zo-Bi, I. C.: Climatic controls of decomposition drive the global biogeography of forest-tree symbioses, Nature, 569, 404–408, https://doi.org/10.1038/s41586-019-1128-0, 2019.
Tanner, E. V. J., Vitousek, P. M., and Cuevas, E.: Experimental Investigation of Nutrient Limitation of Forest Growth on Wet Tropical Mountains, Ecology, 79, 10–22, https://doi.org/10.1890/0012-9658(1998)079[0010:EIONLO]2.0.CO;2, 1998.
Tanner, L. H., Wilckens, M. T., Nivison, M. A., and Johnson, K. M.: Biomass and Soil Carbon Stocks in Wet Montane Forest, Monteverde Region, Costa Rica: Assessments and Challenges for Quantifying Accumulation Rates, International Journal of Forestry Research, 2016, 5812043, https://doi.org/10.1155/2016/5812043, 2016.
Thomas, S. C. and Martin, A. R.: Carbon content of tree tissues: A synthesis, Forests, 3, 332–352, https://doi.org/10.3390/f3020332, 2012.
Turner, B. L. and Dalling, J. W.: Soils of the Fortuna Forest Reserve, in: Fortuna Forest Reserve, Panama. Interacting Effects of Climate and Soils on the Biota of a Wet Premontane Tropical Forest, edited by: Dalling, J. W. and Turner, B. L., Smithsonian Scholarly Press, Washington, DC, 47–135, https://scholarlypress.si.edu/store/life-sciences-biodiversity/fortuna-forest-reserve-panama-interacting-effects/ (last access: 26 January 2022), 2021.
Unger, M., Homeier, J., and Leuschner, C.: Effects of soil chemistry on tropical forest biomass and productivity at different elevations in the equatorial Andes, Oecologia, 170, 263–274, https://doi.org/10.1007/s00442-012-2295-y, 2012.
Vilanova, E., Ramírez-Angulo, H., Torres-Lezama, A., Aymard, G., Gámez, L., Durán, C., Hernández, L., Herrera, R., van der Heijden, G., Phillips, O. L., and Ettl, G. J.: Environmental drivers of forest structure and stem turnover across Venezuelan tropical forests, PLOS ONE, 13, 1–27, https://doi.org/10.1371/journal.pone.0198489, 2018.
Vitousek, P. M.: Litterfall, nutrient cycling, and nutrient limitation in tropical forests, Ecology, 65, 285–298, 1984.
Wegner, W., Wörner, G., Harmon, R. S., and Jicha, B. R.: Magmatic history and evolution of the Central American Land Bridge in Panama since Cretaceous times, Bull. Geol. Soc. Am., 123, 703–724, https://doi.org/10.1130/B30109.1, 2011.
Wilcke, W., Oelmann, Y., Schmitt, A., Valarezo, C., Zech, W., and Homeier, J.: Soil properties and tree growth along an altitudinal transect in Ecuadorian tropical montane forest, J. Plant Nutr. Soil Sc., 171, 220–230, https://doi.org/10.1002/jpln.200625210, 2008.
Wright, S. J.: Plant responses to nutrient addition experiments conducted in tropical forests, Ecol. Monogr., 89, 1–18, https://doi.org/10.1002/ecm.1382, 2019.
Yaffar, D., Addo-Danso, S. D., Powers, J. S., and Meier, I. C.: Fundamental but underrepresented: root carbon stocks in African montane forests, Frontiers in Forests and Global Change, 6, 1–4, https://doi.org/10.3389/ffgc.2023.1273996, 2023.
Zech, M.: Evidence for Late Pleistocene climate changes from buried soils on the southern slopes of Mt. Kilimanjaro, Tanzania, Palaeogeogr. Palaeocl., 242, 303–312, https://doi.org/10.1016/j.palaeo.2006.06.008, 2006.
Zhang, D., Hui, D., Luo, Y., and Zhou, G.: Rates of litter decomposition in terrestrial ecosystems: global patterns and controlling factors, J. Plant Ecol., 1, 85–93, https://doi.org/10.1093/jpe/rtn002, 2008.
Zolkos, S. G., Goetz, S. J., and Dubayah, R.: A meta-analysis of terrestrial aboveground biomass estimation using lidar remote sensing, Remote Sens. Environ., 128, 289–298, https://doi.org/10.1016/j.rse.2012.10.017, 2013.