the Creative Commons Attribution 4.0 License.
the Creative Commons Attribution 4.0 License.
Impact of chemical treatments on the molecular and stable carbon isotopic composition of sporomorphs
Yannick F. Bats
Klaas G. J. Nierop
Alice Stuart-Lee
Joost Frieling
Linda van Roij
Gert-Jan Reichart
Appy Sluijs
The stable carbon isotope composition (δ13C) of plants and algae is influenced by environmental factors, such as pCO2, water availability, and altitude. To effectively use the δ13C of fossil material as a proxy for these parameters, it is essential to understand the chemical and isotopic effects of diagenesis and conventional chemical treatments. In this study, we subject various species of pollen and spores of higher plants to different chemical treatments simulating diagenesis and chemical alteration in the environment as well as palynological processing. We analyze changes in the molecular and isotopic composition using pyrolysis–gas chromatography–mass spectrometry (Py-GC-MS) and both elemental analyzer–isotope ratio mass spectrometry (EA-IRMS) and laser ablation–isotope ratio mass spectrometry (LA-IRMS), respectively. We find that saponification removes extractable and ester-bound lipids, which increases the δ13C value of the sporomorphs. Treatment with HF and HCl (HF–HCl) removed most hydrolyzable polysaccharides and proteins, causing a drop in δ13C values. Acetolysis produced aromatic-rich residual sporomorphs with the lowest δ13C values compared to other treatments, likely representing the diagenetically resistant sporopollenin polymer. These findings imply a successional depletion of 13C during fossil maturation, where aliphatic lipids are diagenetically removed in the process, until only the relatively 13C-depleted sporopollenin remains. To adequately compare fossil and extant sporomorph δ13C values, we advise the use of HF–HCl and a lipid removal step other than acetolysis as the palynological treatment, as acetolysis treats the material non-uniformly. Lastly, LA-IRMS shows promise for targeted isotopic analysis of individual specimens of various types of palynomorphs.
- Article
(1705 KB) - Full-text XML
-
Supplement
(1158 KB) - BibTeX
- EndNote
The stable carbon isotopic composition (δ13C) of (sub-)fossil organic microfossils – such as pollen, dinoflagellate cysts, larval eggshells, acritarchs, and chironomid head capsules – is increasingly being used as a proxy in environmental and ecological reconstructions – for example, to infer C4 vs. C3 grass abundance, atmospheric pCO2, and diet (e.g., Kaufman and Xiao, 2003; Nelson et al., 2007; Schilder et al., 2018; Sluijs et al., 2018; van Hardenbroek et al., 2018). The mechanistic and statistical underpinning of δ13C-based proxies is often based on controlled-growth experiments or field studies linking the isotopic composition of the source organism to a specific variable (e.g., Loader and Hemming, 2004; van Hardenbroek et al., 2010; Hoins et al., 2015). However, when these organisms transform into their fossilizable remains during taphonomy, they undergo postmortem chemical alteration, also referred to as diagenetic alteration, which potentially affects their δ13C composition (e.g., Benner et al., 1987; Loader and Hemming, 2004). In addition, these fossil remains typically undergo some type of palynological treatment before analysis, which often includes strong acids and might further affect their macromolecular composition and, hence, δ13C values (e.g., Amundson et al., 1997; Müller et al., 2021). As a consequence, the molecular composition of a processed fossil is typically biased towards the most resistant organic compounds. Therefore, laboratory experiments and modern calibration field studies must include similar chemical treatments to link the δ13C values measured on extant and fossil sporomorphs.
Organic microfossils are comprised of organic macromolecular structures such as sporopollenin (the main component of exine – the outer wall of pollen and spores), residual labile compounds (e.g., polysaccharides and proteins), and diagenetically produced “geopolymers” that become enriched over time and are only susceptible to strong oxidation (De Leeuw et al., 2006; Quilichini et al., 2015). However, in addition to the exine, extant sporomorphs often also contain pectin and (hemi)cellulose as well as attached lipids, proteins, and sugars (Fan et al., 2019). Such components all have their own inherent stable isotopic signature which may differ strongly in δ13C from the mean exine value. Although this implies that their relative contribution potentially strongly impacts the overall stable isotopic composition, these more labile components are typically consumed or oxidized in the environment before sporomorphs are buried in sediments so that only the exine is preserved. Furthermore, it has been suggested that lipids may bind to the microfossils postmortem in the sedimentary record (Van Bergen et al., 1993; De Leeuw et al., 2006; Versteegh et al., 2007), influencing the integrated stable carbon isotopic signal.
Palynological treatment is commonly required to concentrate organic microfossils from sediments. Treatments typically include HCl to dissolve inorganic carbon phases and HF to dissolve siliceous materials. Acetolysis (acetic acid used together with acetic anhydride and H2SO4), KOH, and NaClO are sometimes used, notably in terrestrial settings, to remove (amorphous) organic matter components and stain pollen walls. Several studies have shown that acetolysis strongly changes sporomorph δ13C (Amundson et al., 1997; Descolas-Gros and Schölzel, 2007; Müller et al., 2021). Furthermore, other steps, including HF–HCl and oxidants, may remove labile organic components and, therefore, potentially affect the δ13C of the remaining palynomorphs (Müller et al., 2021). Such steps, therefore, also essentially simulate the effects of natural aging and environmental oxidation.
After early δ13C analyses of spores (Murphey and Nier, 1941), it took decades before pollens were targeted for δ13C analyses, notably with the aim of distinguishing C3 from C4 carbon acquisition pathways using total combustion isotope ratio mass spectrometry (IRMS) (Amundson et al., 1997). Such early work needed large numbers of specimens for precise and accurate analyses. More recent work has optimized cryotrapping and subsequent release of CO2 following combustion in an elemental analyzer (EA) so that much less material is needed for analyses (Polissar et al., 2009). Other devices utilize a continuous (helium, He) flow approach, thereby further minimizing blank contamination before CO2 is introduced into the IRMS. These include the use of a moving wire to introduce pollen – stuck to the wire – into an oxidation furnace, after which CO2 is carried on a He flow to an IRMS (Sessions et al., 2005; Nelson et al., 2007). More recently, a continuous-flow technique was developed that carries molecular fragments derived from microfossil laser ablation (LA) on a He flow into a capillary to a micro combustion oven, in which they are oxidized, followed by gas chromatography (GC) and IRMS (Van Roij et al., 2017). The latter technique allows for single-specimen δ13C analyses – similar to the ion microprobe technique used by Kaufman and Xiao (2003) – and has been applied to pollen (Van Roij et al., 2017), lacustrine Daphnia resting eggshells (Schilder et al., 2018), and marine dinoflagellate cysts (Frieling et al., 2023; Sluijs et al., 2018).
Here, we aim to contribute to the existing literature regarding chemically induced δ13C change in raw sporomorphs by carrying out a series of experiments on raw pollen derived from multiple species. We apply acetolysis, HF–HCl, and saponification to study the individual effects of these common palynological treatment steps and also evaluate this in relation to similar transformation that might occur during taphonomy (diagenesis). We assess the character of chemical alteration resulting from the treatments using pyrolysis–gas chromatography–mass spectrometry (Py-GC-MS). Finally, we analyze sporomorphs using a conventional elemental analyzer–isotope ratio mass spectrometer (EA-IRMS) as well as LA–nano-combustion (nC)–GC–IRMS to assess analytical consistency.
2.1 Samples
Six sporomorph species were selected for this study. Concentrated pollen samples of a C3 grass (Lolium perenne), a C4 grass (Zea mays), a gymnosperm tree (Pinus echinata), and two angiosperm trees (Betula pendula and Eucalyptus globulus) were obtained from Greer Laboratories (Lenoir, USA). A spore sample (Lycopodium clavatum) was obtained from Baldwins (London, UK). For the rest of this article, the species are referred to by their respective genus names.
2.2 Treatments
Three different treatments were carried out on each sporomorph species in triplicate. These treatments included HF–HCl, a common acid treatment in palynology to concentrate sporomorphs from mineral samples; saponification, to remove ester-bound fatty acids (see Nierop et al., 2019); and acetolysis, to remove polysaccharides and proteins to yield sporopollenin only (Erdtman, 1960; Hesse and Waha, 1989).
2.2.1 Saponification
In accordance with Nierop et al. (2019), sporomorphs were saponified in 1 M KOH in MeOH at 70 °C for 2 h in an oven. After cooling to room temperature, the solution was acidified to pH 3 using 2 N HCl. Next, dichloromethane (DCM) was added, and the whole mixture was then thoroughly shaken using a Wilten Vortex-Genie apparatus. After phase separation, both the aqueous and the organic layers were removed, and both water and DCM were added to purify the remaining sporomorphs. After thorough shaking by the vortex apparatus followed by phase separation, both layers were removed again; this procedure was repeated twice. MeOH was added to the sporomorphs to remove traces of both water and DCM. This was done twice, after which the remaining sporomorphs were dried using a very gentle stream of N2.
2.2.2 HF–HCl
Samples of 200 mg of untreated pollen were treated with 15 mL of 38 %–40 % HF. The samples were placed on a platform shaker for 120 min and centrifuged for 5 min at 2200 rpm. The supernatant was removed with a glass pipette and the pellet disintegrated on a vortexer. A total of 15 mL of 30 % HCl was added to each, followed by a further centrifuge step and separation of the liquid fraction. Distilled water rinses and centrifugation steps were repeated until the samples tested pH neutral, after which they were dried in an oven at 60 °C for 72 h and subsequently stored at room temperature until analyses.
2.2.3 Acetolysis
Samples of 200 mg of untreated pollen were treated with 5 mL of 99.6 % acetic acid, and the samples were then centrifuged for 5 min at 2000 rpm. A total of 5 mL of a mixture of pure acetic anhydride and 95 %–97 % sulfuric acid (9:1 ) was added, and the samples were then placed in a hot water bath at 100 °C for 5 min; from there, the samples were transferred to a cold water bath for 5 min. Following centrifugation, the solution was decanted and the vials vortexed. Four rinsing steps were carried out, adding 12 mL of water, centrifuging, decanting, and vortexing. Samples were then dried in an oven at 60 °C for 72 h and stored at room temperature until analyses.
2.3 Pyrolysis–gas chromatography–mass spectrometry (Py-GC-MS)
Analytical pyrolysis was carried out on a Horizon Instruments Curie-point pyrolyzer. Samples (typically 0.5 mg) were pressed onto Ni/Fe Curie-point wires and subsequently heated for 5 s at 600 °C. The pyrolysis unit was directly connected to a Carlo Erba GC8060 gas chromatograph, and the products were separated by a fused-silica column (Varian, 30 m, 0.32 mm inner diameter) coated with CP-Sil5 (film thickness 0.40 µm). Helium was used as the carrier gas. The GC column was directly connected to the pyrolysis unit through a splitless injector set at 280 °C. The oven was initially kept at 40 °C for 1 min; it was then heated at a rate of 7 °C min−1 to 320 °C and maintained at that temperature for 15 min. The column was coupled to a Fisons MD800 mass spectrometer (mass range 45–650, ionization energy 70 eV, cycle time 0.7 s). Identification of compounds was carried out based on their mass spectra using a NIST library or by interpretation of the spectra, by their retention times, and/or by comparison with literature data.
All samples were run at least in duplicate. Semi-quantification of the compounds identified was performed by integration of peaks using one or two target fragment ions. Correction for this to match total ion chromatogram (TIC) peaks was achieved using the relative response of the fragment ions relative to TIC peaks by integration of well-resolved TIC peaks in the chromatograms of the samples. The standard (milled oak roots) run was used to check the performance of the Py-GC-MS. The relative abundance of each pyrolysis product was calculated from the sum of all integrated and corrected peak areas. All correction factors and relative abundances can be found in the Supplement. These data reflect the averages of all replicates per pollen and treatment type.
2.4 Stable carbon isotopic analyses
2.4.1 EA-IRMS
For each untreated and treated replicate, 50 µg was weighed in tin capsules for bulk δ13C analysis on an elemental analyzer (Thermo Scientific FLASH 2000) coupled to an IRMS (Thermo Finnigan DELTA V Advantage IRMS; hereafter, EA-IRMS) at the NIOZ Royal Netherlands Institute for Sea Research. Series of analyses were bracketed by blanks (empty capsules), and VPDB-calibrated (where VPDB denotes Vienna Pee Dee Belemnite) internal standards (nicotinamide, δ13C −33.48 ‰, and a sediment standard graphite quartzite (GQ), δ13C −26.68 ‰) were utilized for calibration to the VPDB scale and to correct for drift. The standard deviation (SD) of the GQ standard (0.07 ‰) represents the analytical error of the EA-IRMS method and is incorporated into the total uncertainty of the sporomorph δ13C measurements. Considering that other authors (e.g., Hemsley et al., 1993) have suggested acetolysis to treat material non-homogeneously, the acetolyzed Pinus, Lolium, and Zea replicates were measured in triplicate (i.e., a triplicate of the triplicates) to assess the treatment's uniformity.
2.4.2 LA-nC-GC-IRMS
One sample for each species–treatment combination (i.e., one of the triplicates) was blindly chosen and analyzed using the approach first described in Van Roij et al. (2017): laser ablation–nano-combustion–gas chromatography–isotope ratio mass spectrometry (LA-nC-GC-IRMS; hereafter, LA-IRMS). Sporomorph grains from each sample were pressed onto a nickel disk using a hydraulic press. A polyethylene (PE) standard (IAEA-CH-7, δ13C −32.15 ‰) was added, and the disk was placed into an ablation chamber specifically designed for the purpose (Van Roij et al., 2017). Individual grains were targeted using a deep-ultraviolet (DUV) ArF laser (COMPex 102, Lambda Physik, Göttingen, Germany; COMPexPro 102, Elemental Scientific Lasers LLC, Bozeman, USA; see Table S6 in the Supplement for information on which laser was used for each sample) to fragment the organic matter, with the ablated particles then being combusted in a micro-furnace and the released CO2 transported to a GC and IRMS (Thermo Finnigan Delta V Advantage IRMS). At least five PE standard measurements were done with each LA-IRMS run, to calibrate δ13C values using standard bracketing. Van Roij et al. (2017) suggested that mismatches between EA- and LA-IRMS measurements possibly result from single-standard bracketing, which prevents the user from correcting for linear mass bias over the full range of δ13C data. Therefore, to test the linear mass bias of the LA-IRMS method, some samples (Fig. S8 in the Supplement) were additionally corrected with a new VPDB-calibrated internal polylactic acid (PLA) standard (Premium Eco Clear Bags, ClearBags, North Las Vegas, USA; −12.63 ‰). Furthermore, Van Roij et al. (2017) showed measurements to be reliable (i.e., small offset from the value determined by EA-IRMS analyses and smaller standard deviation) with peak areas > ∼ 2 Vs. Therefore some measurements were done by ablating multiple grains.
The standard deviations of the LA-IRMS measurements represent both inter-specimen variation within the samples – which is averaged out with the bulk EA-IRMS method – and the analytical error of the LA-IRMS method. The internal analytical error is predicted using the standard deviation of PE measurements with a similar peak area to that of the respective sporomorph sample (Van Roij et al., 2017) and will be compared with the spread in values observed for the samples.
2.5 Data analysis
All data analyses were conducted in R (R Core Team, 2023) using the dplyr (Wickham et al., 2023a), tidyr (Wickham et al., 2023b), ggplot2 (Wickham, 2016), ggridges (Wilke, 2025), and boot (Canty and Ripley, 2022) packages. For the EA-IRMS δ13C measurements, the total uncertainty for each species–treatment combination was determined by combining the standard deviation (σ) of the replicate measurements with the analytical error (0.07 ‰) using quadrature addition (). Treated and untreated EA-IRMS samples were compared using Student's t test.
LA-IRMS δ13C measurements of each species–treatment combination were weighted according to their peak area (Vs) for two reasons: firstly, the peak area relates directly to the amount of ablated material in a single measurement (Van Roij et al., 2017), which implies that a weighted mean more accurately represents the true sample mean; secondly, measurements become more precise as the peak areas increase (Van Roij et al., 2017; Frieling et al., 2023), which implies that measurements with a higher peak area are statistically more meaningful. The weighted δ13C measurements of each species–treatment combination were bootstrapped (n=1000) in order to elude effects of non-normality in further statistical testing. Bootstrapped means and the standard error of the mean (SEM) values were used to compare measurements statistically between the treated and untreated LA-IRMS samples and between LA- and EA-IRMS using Welch's t test. For each species–treatment combination, note that the EA-IRMS data are based on triplicates that underwent the treatment separately, whereas the LA-IRMS data come from a single, randomly chosen triplicate. Therefore, Welch's t test assesses the probability that a randomly drawn LA-IRMS sample matches the EA-IRMS-based population mean, which encompasses the range of δ13C values across the three separate treatments. Lastly, standard deviations between LA-IRMS sporomorph and PE measurements were compared using an F test.
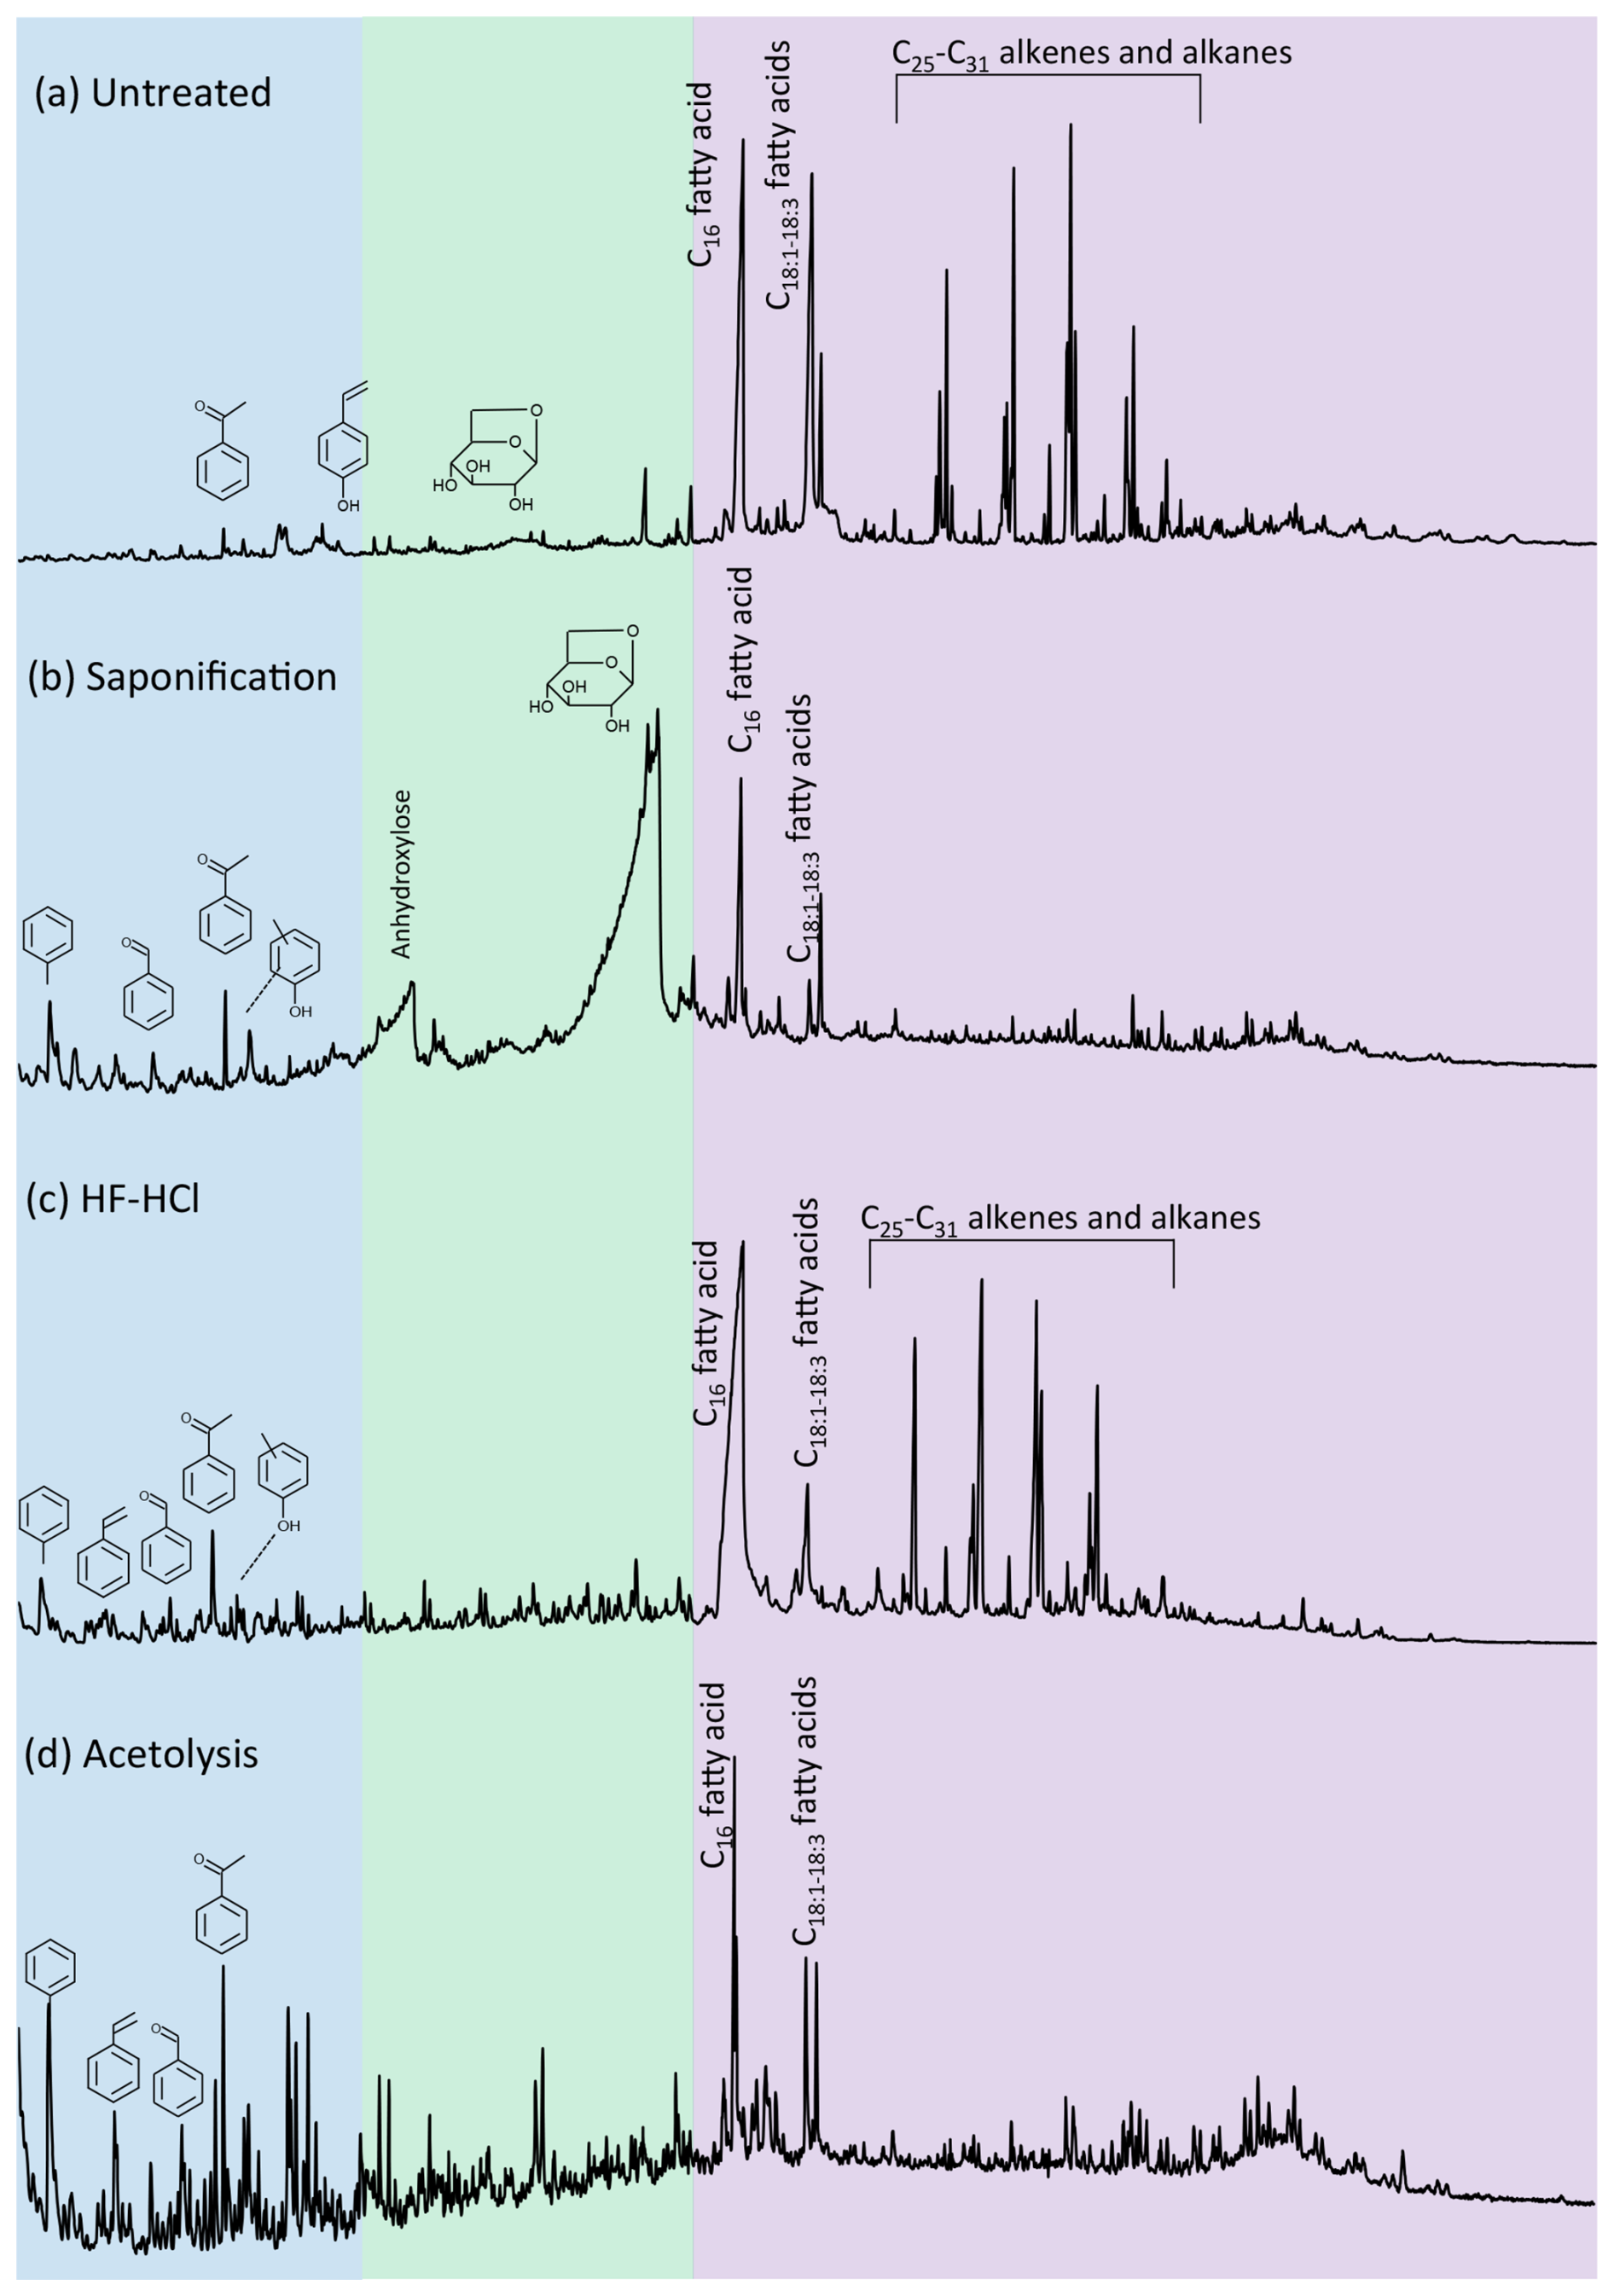
Figure 1Pyrolysis–gas chromatograms of Lolium pollen that was (a) untreated, (b) saponified, (c) HF–HCl-treated, and (d) acetolyzed. Colors reflect the retention time intervals with predominantly aromatic (blue), polysaccharide-derived (green), and lipid (purple) pyrolysis products.
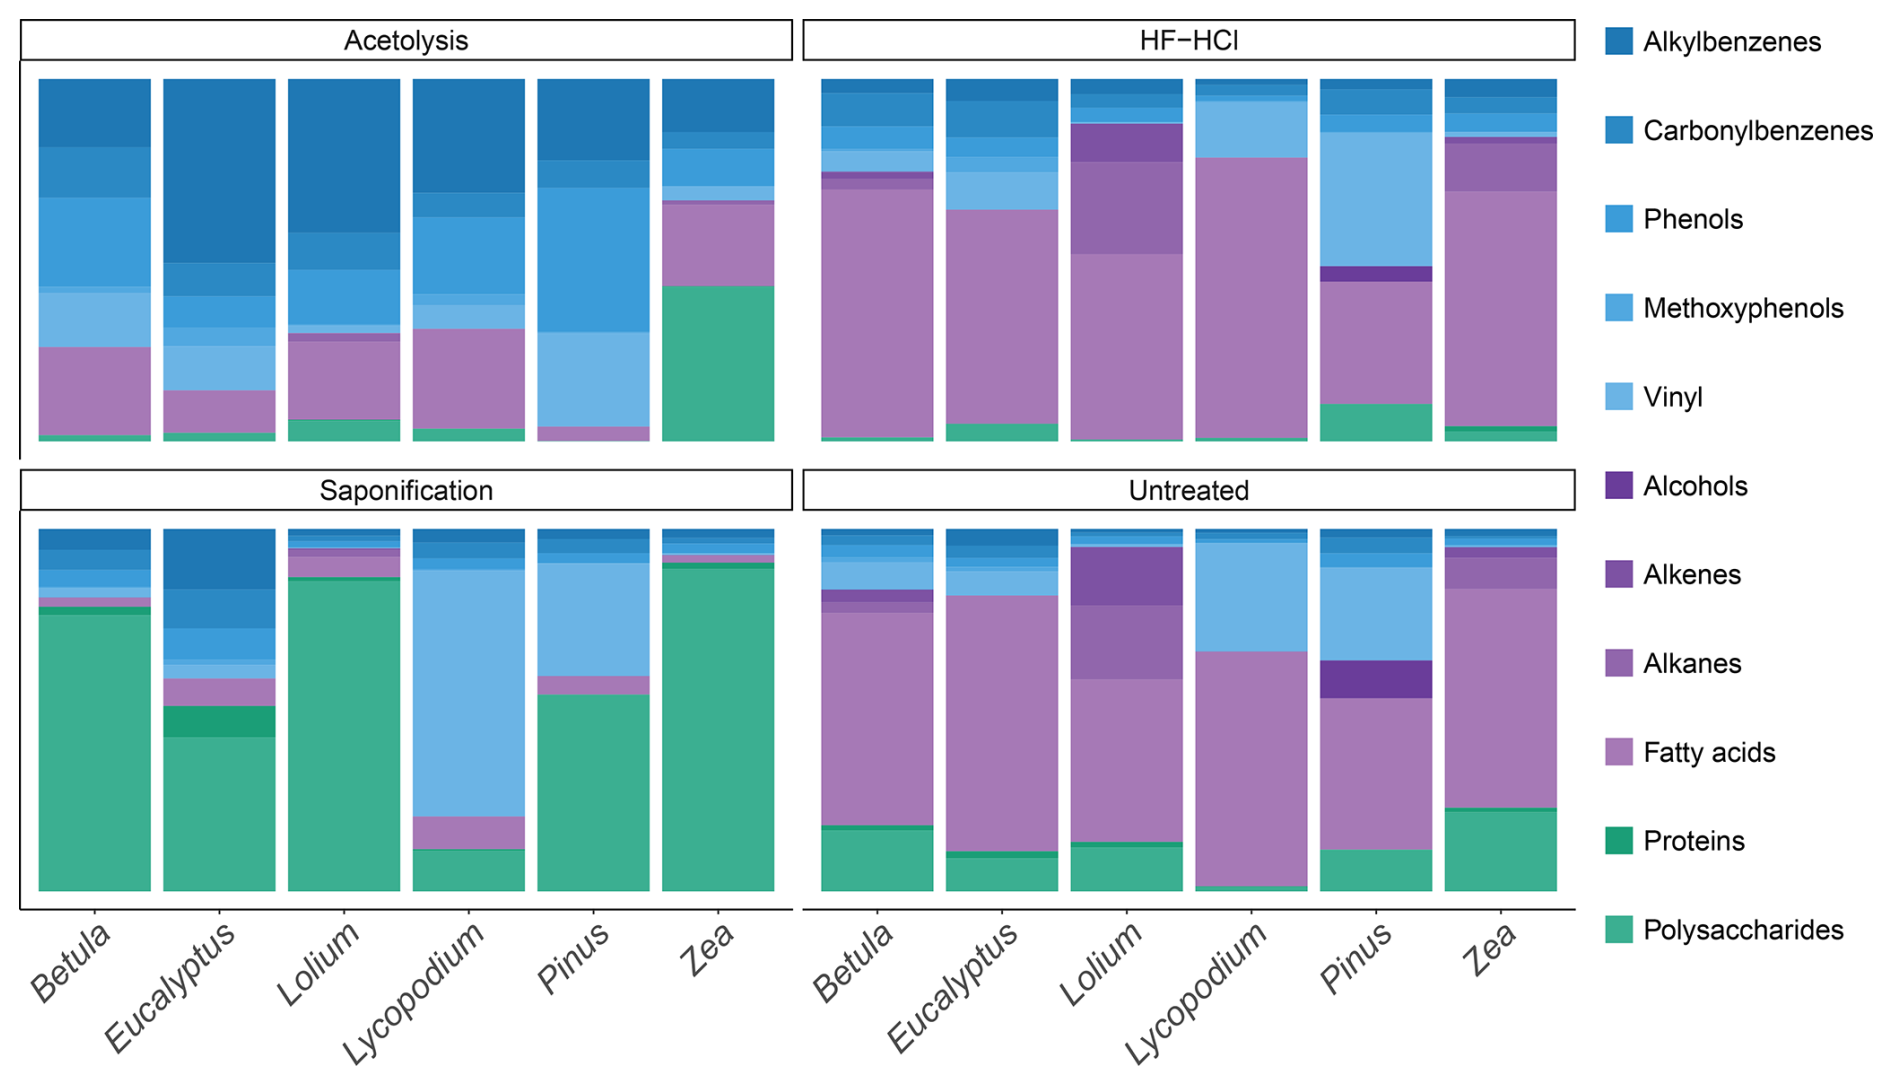
Figure 2The composition of the various aromatic (blue tints), polysaccharide- and protein-derived (green tints), and lipid (purple tints) pyrolysis products for each species–treatment combination.
3.1 Sporomorph pyrolysis products upon treatment
3.1.1 Untreated
The pyrolysis products of the sporomorphs studied consist of an array of molecules broadly divided into lipids, aromatic compounds, and polysaccharide- and protein-derived components; here, the latter two are grouped because of their similar hydrolyzable nature. The pyrolysis products of the sporomorphs consist predominantly (65 %–81 %) of lipids, between 5 % and 36 % of aromatics, and between 1 % and 23 % of polysaccharides and proteins (Figs. 1 and 2 and Fig. S1 in the Supplement).
For lipids, fatty acids such as C16 and unsaturated C18 fatty acids dominate all untreated sporomorphs (Fig. 2). Other lipids such as odd-numbered n-alkenes and n-alkanes in the range of C25–C31 are observed in the pollen of Betula, Zea, and particularly Lolium (Fig. S2 in the Supplement). Pinus pollen contains some even-numbered n-alcohols (C24–C28) (Fig. S2 in the Supplement and Table S2 in the Supplement).
Polysaccharide-derived products predominantly represent levoglucosan (Fig. S3 and Table S3 in the Supplement). Anhydropentose and levomannosan represent pyrolysis markers of the monosaccharides xylose and mannose (Fig. S3). The relative abundance of polysaccharide-derived pyrolysis products is smallest for intact Lycopodium spores (∼ 1 %) and largest for Zea pollen (∼ 22 %), with similar intermediate values for the other pollen types. Nitrogen-bearing pyrolysis products include benzyl nitrile, methylbenzyl nitrile, indole, and 3-methylindole, and they are detected in all species (Fig. S3), although in small amounts (maximum of ∼ 2 % for Eucalyptus).
For aromatics, typical sporopollenin-derived pyrolysis components are the propionic-acid- and vinyl-containing (i.e., ethenyl) compounds phloretic acid, hydrocaffeic acid, hydroferulic acid, 4-vinylcatechol, 4-vinylphenol, and 4-vinylguaiacol (Fig. S4 and Table S4 in the Supplement). The latter two are identified for all species, whereas 4-vinylcatechol is only identified for Lycopodium. Phloretic acid is detected in Pinus pollen in small amounts, but it is absent in all other sporomorph species. Hydrocaffeic and hydroferulic acid are detected in relatively large amounts in Lycopodium spores, but they are absent in other species. Furthermore, the carbonylbenzenes benzaldehyde and acetophenone are consistently observed for all species (Fig. S4). Other aromatic components present in all species are the methoxyphenols guaiacol (2-methoxyphenol) and 4-methyl- and 4-ethylguaiacol (Fig. S4). The alkylbenzenes styrene, toluene, and benzene are also detected for all species (Fig. S4). Alkylphenols detected in all species consisted of phenol, 2-methylphenol, 3/4-methylphenol, and 4-ethylphenol (Fig. S4).
3.1.2 Saponification
Saponified sporomorphs lose most of their free and ester-bound lipids. Moreover, a large relative increase in polysaccharide-derived components is seen upon saponification, to values of 11 % for Lycopodium spores, up to 87 % for Lolium, and 89 % for Zea pollen (Figs. 2 and S1). Moreover, the N-bearing components increase relatively (e.g., to ∼ 8 % for Eucalyptus). A relative increase in aromatic compounds is also witnessed upon saponification, although to a smaller degree than is the case for polysaccharides, suggesting that some aromatic compounds are removed by saponification.
3.1.3 HF–HCl
Most, if not all, polysaccharides are removed from the sporomorphs by HF–HCl treatment. Furthermore, the N-bearing components are not detected anymore (Fig. 1 and Fig. S3 in the Supplement for Lolium). Lipids and aromatics remain similarly abundant in the chemical make-up of the sporomorphs (Fig. 2).
3.1.4 Acetolysis
Acetolysis removes most, if not all, n-alkanes, n-alkenes, and alcohols, and it reduces the amount of fatty acids substantially. Most polysaccharides are removed upon acetolysis, and N-bearing compounds are also not detected anymore. Only Zea retains relatively high amounts of polysaccharides after acetolysis (Fig. 2). A large relative increase in aromatics is observed upon acetolysis. Especially the relative amount of alkylbenzenes and phenol compounds increases with respect to their untreated counterparts (Fig. S4).
Table 1The table presents the EA-IRMS stable carbon isotope (δ13C) measurements of each species–treatment combination and the respective δ13C difference with untreated samples of the same species. Student's t test was performed to compare these differences. Only a single replicate underwent treatment for HF–HCl-treated Lycopodium and Pinus; therefore, no t test was performed for these samples.
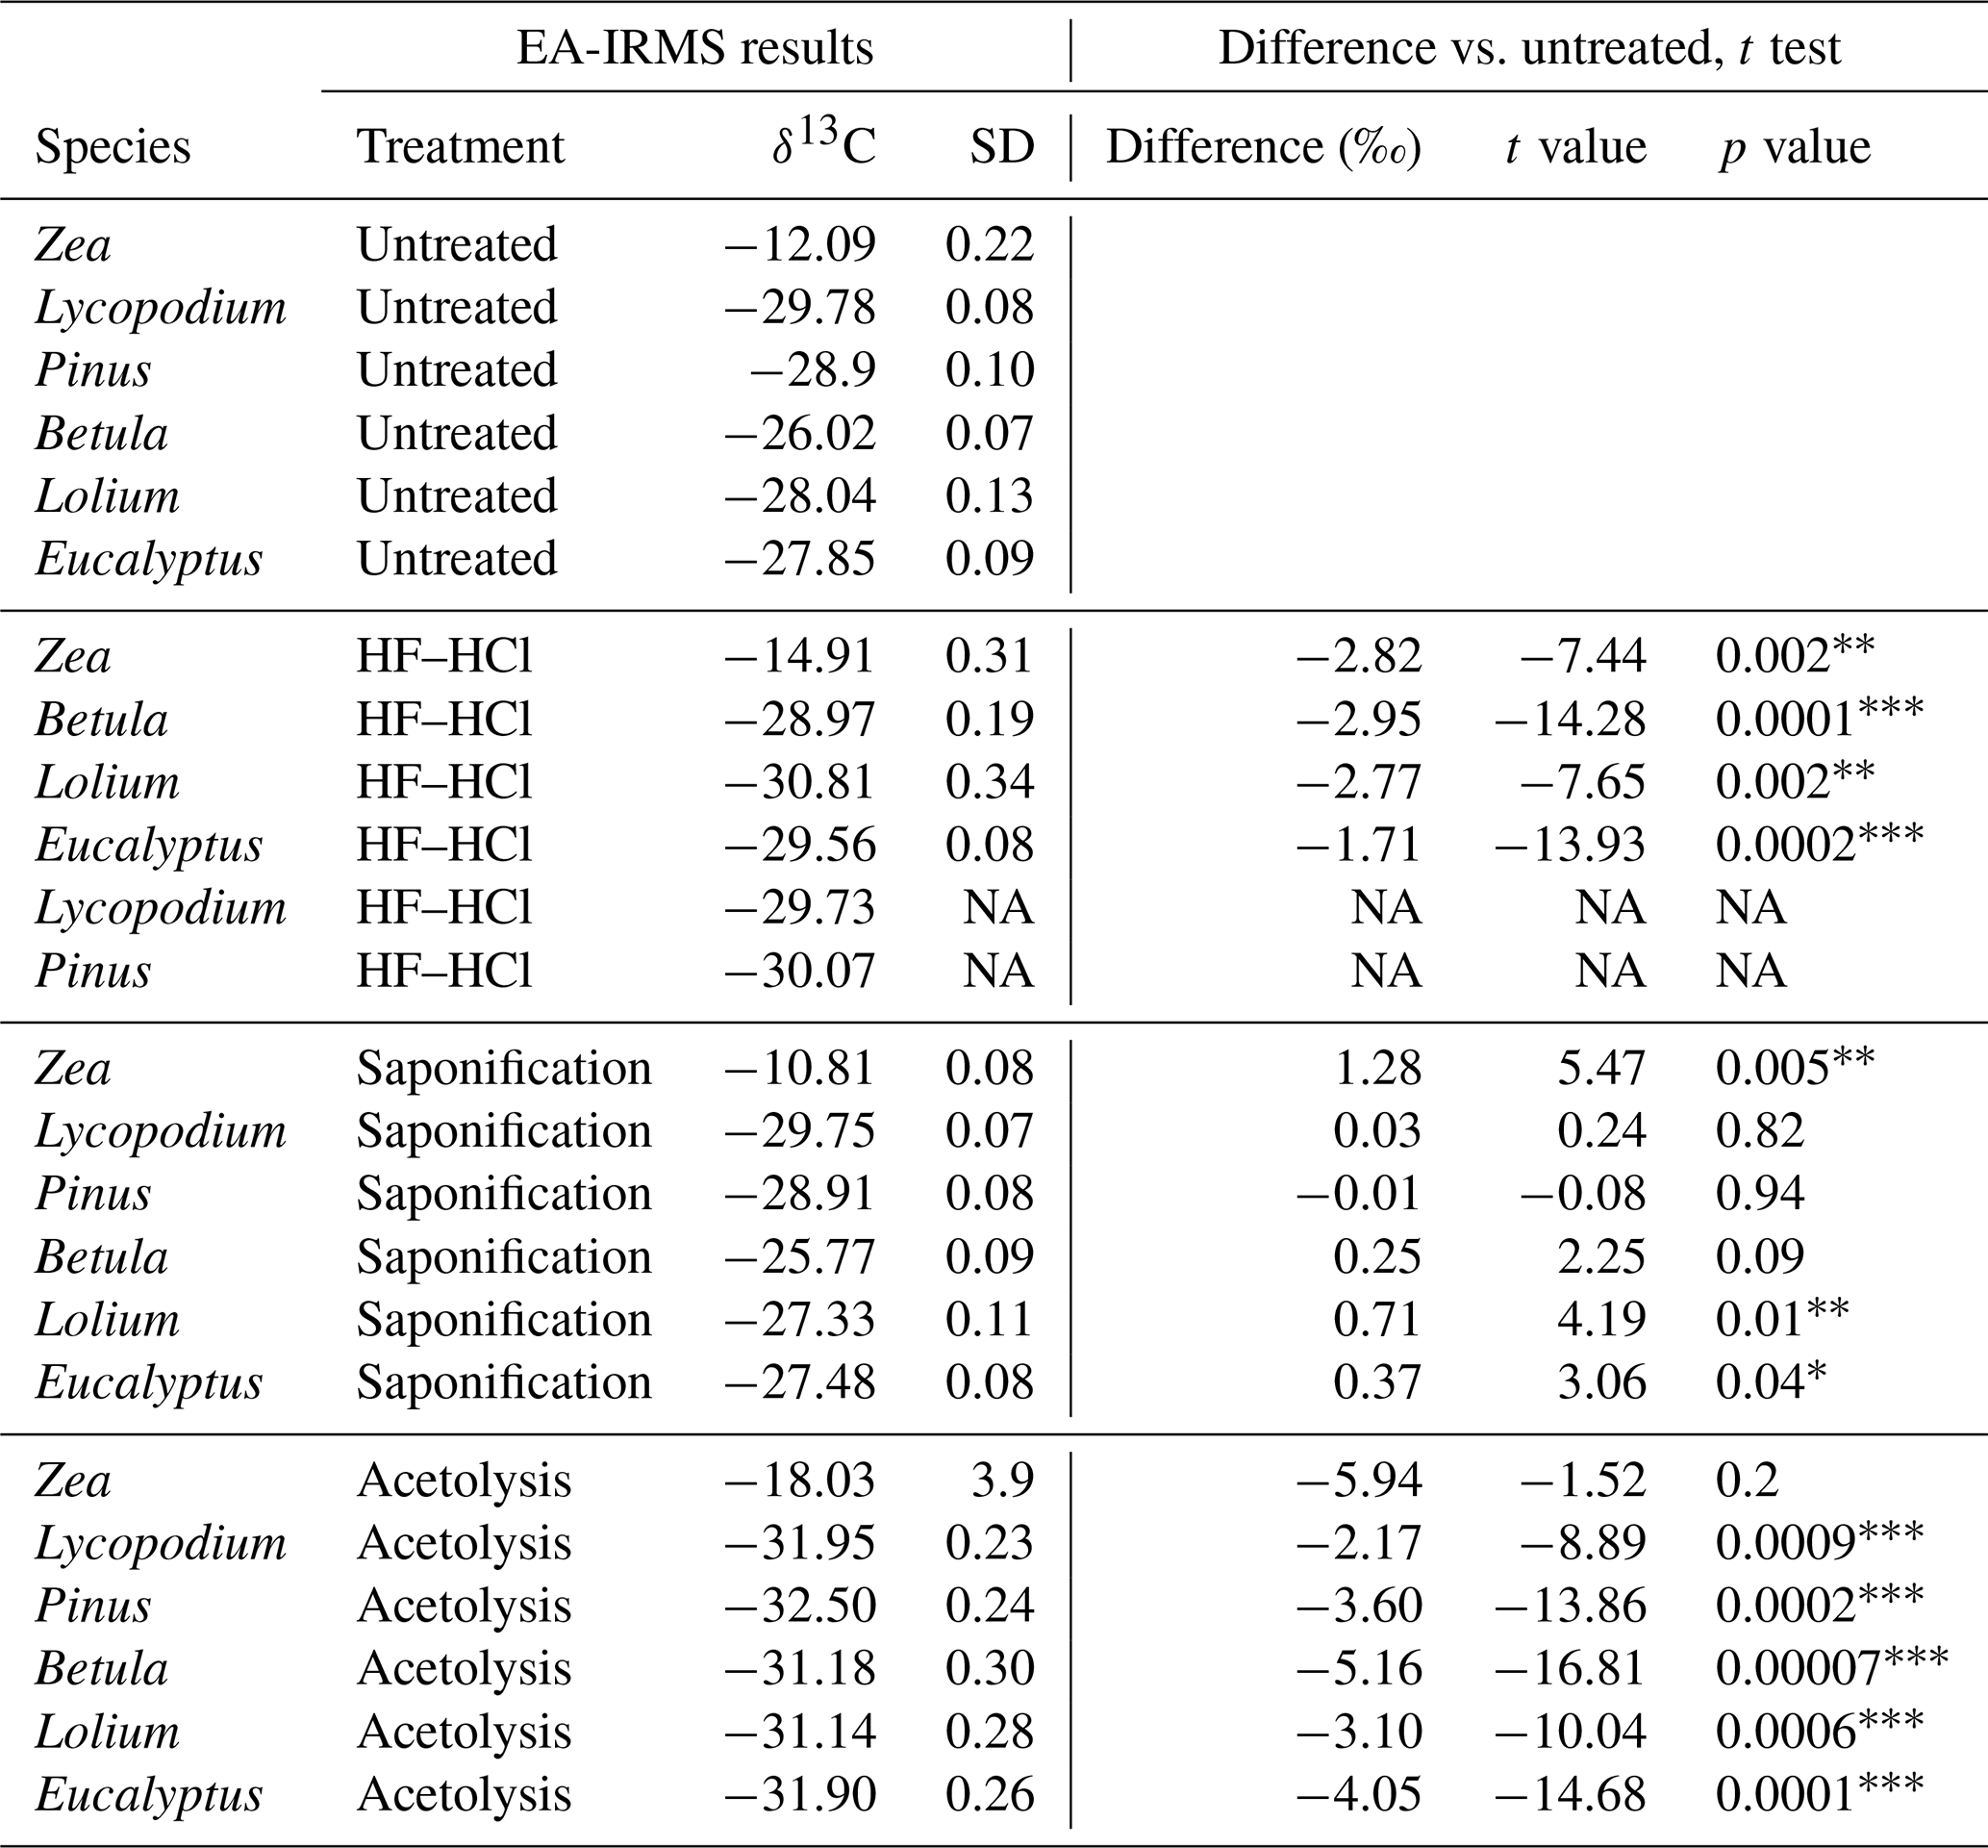
∗ = p < 0.05. = p < 0.01. = p < 0.001. NA represents “not applicable”.
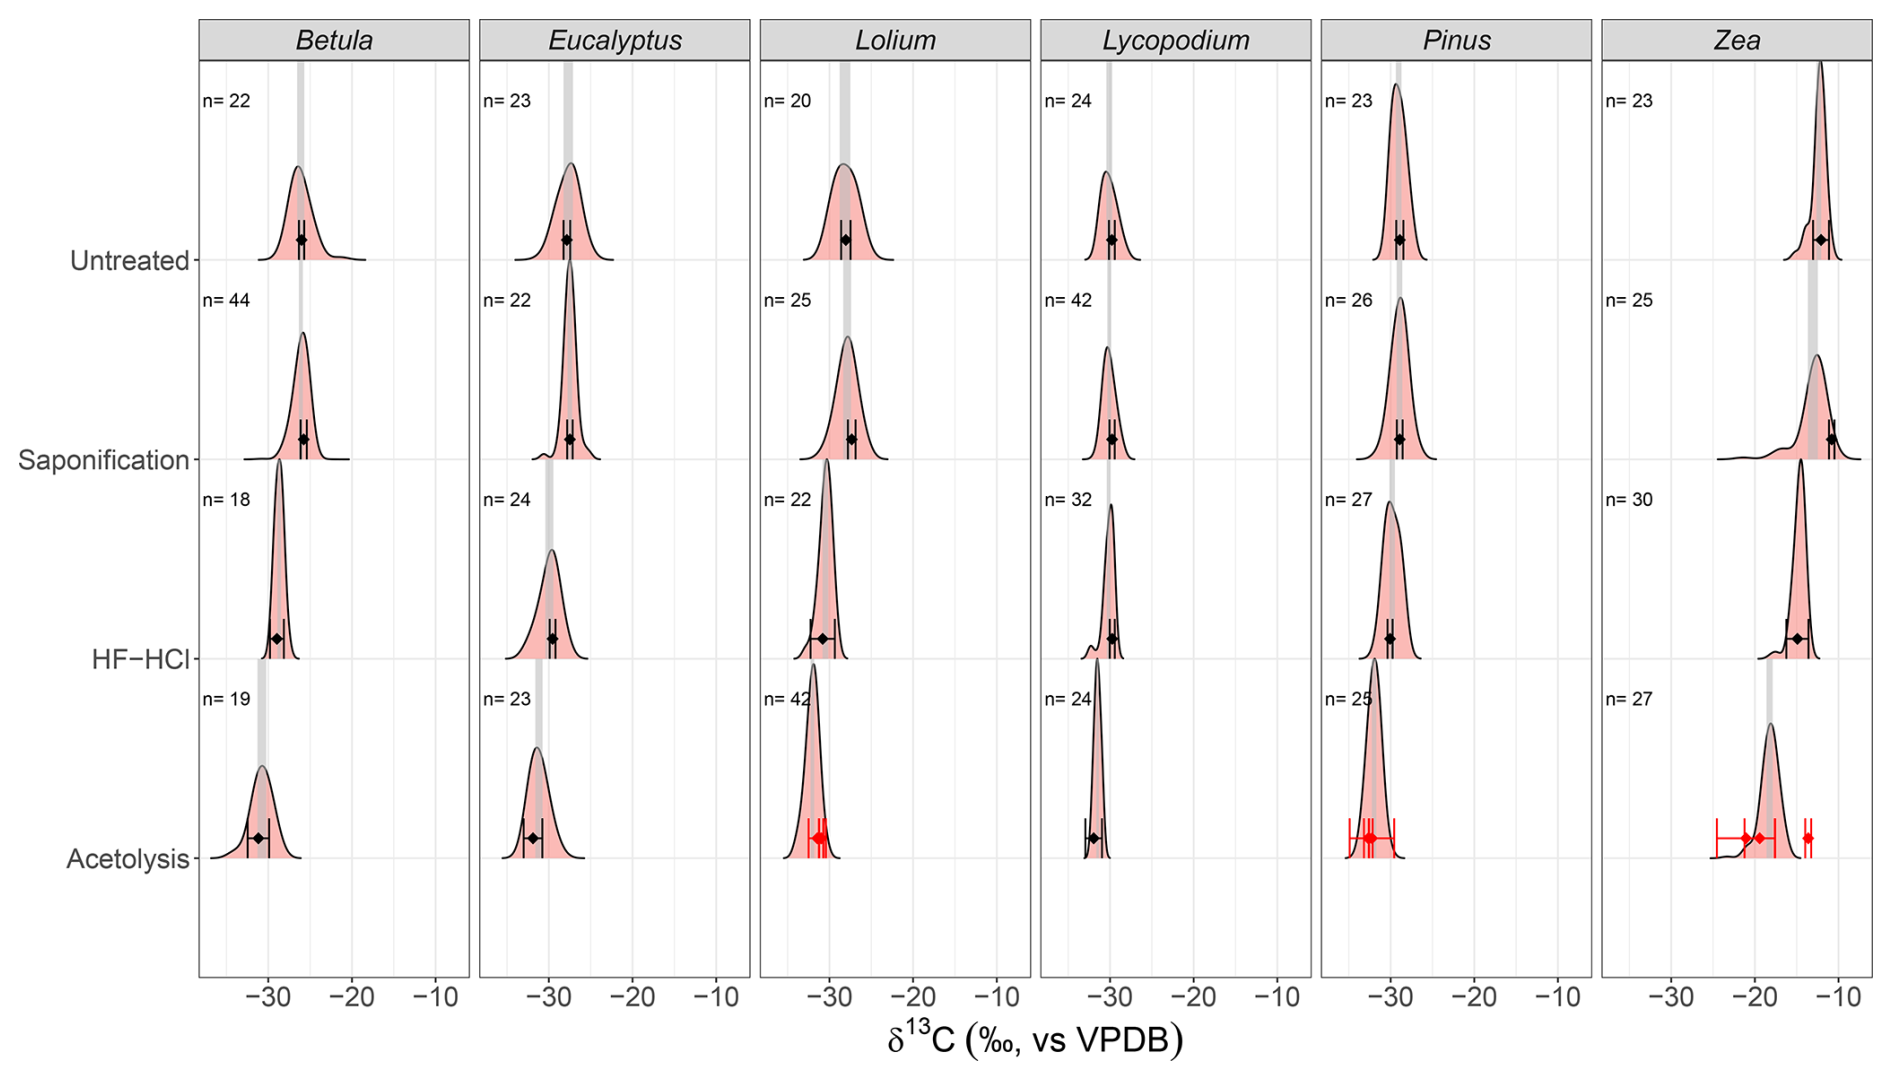
Figure 3The mean stable carbon isotope (δ13C) and 95 % confidence interval (CI) of the EA-IRMS measurements (black points and error bars, respectively) and the δ13C distributions of the LA-IRMS measurements (density plots) for each species–treatment combination. Gray shaded areas represent the 95 % CI of the mean of the LA-IRMS measurements. Numbers above density plots represent the sample size (i.e., number of LA measurements) of each LA-IRMS sample. The red points and error bars represent the respective mean stable carbon isotope (δ13C) and 95 % CI of triplicates of replicates, showing the non-homogeneous treatment of acetolysis. Note that for HF–HCl-treated Lycopodium and Pinus, only a single EA-IRMS measurement was done (a single replicate); therefore, their respective 95 % CIs are based on the 0.07 ‰ analytical error (see Sect. 2.4.1).
3.2 Sporomorph carbon isotope values
3.2.1 EA-IRMS
Untreated
The sporomorph mean δ13C values of the six studied species are presented in Table 1. All untreated sporomorph species have significantly (t test, all p < 0.05) different mean δ13C values compared to each other, except for Lolium and Eucalyptus (t(4)=−1.52, p>0.05) (Table S5 in the Supplement and Fig. 3).
Saponification
Saponification significantly increases δ13C values relative to untreated samples for Betula, Lolium, Eucalyptus, and Zea (t test, all p < 0.05; Table 1). In contrast, the δ13C values for Pinus and Lycopodium do not significantly differ between saponified and untreated pollen (t test, all p > 0.05; Table 1) (Fig. 3).
HF–HCl
The HF–HCl treatment significantly (t test, p < 0.05) decreases δ13C values across all pollen types compared to untreated sporomorphs (Table 1, Fig. 3). It should be noted that only a single replicate was measured for Lycopodium and Pinus.
Acetolysis
Acetolysis significantly decreases δ13C values for all sporomorphs compared to the untreated sporomorphs, except for Zea (Table 1, Fig. 3). The triplicates show a substantial range of δ13C values (Fig. 3), especially for Zea (−13.5 ‰ to 22.0 ‰), which is the reason that there is no statistically significant difference between the acetolyzed and untreated Zea sporomorphs.
Table 2The table presents the LA-IRMS stable carbon isotope (δ13C) measurements of each species–treatment combination, the respective δ13C difference with untreated samples of the same species, and the difference with each sample's corresponding EA-IRMS measurement. Welch's t tests were performed to compare these differences. “df” represents the degrees of freedom of the t test.
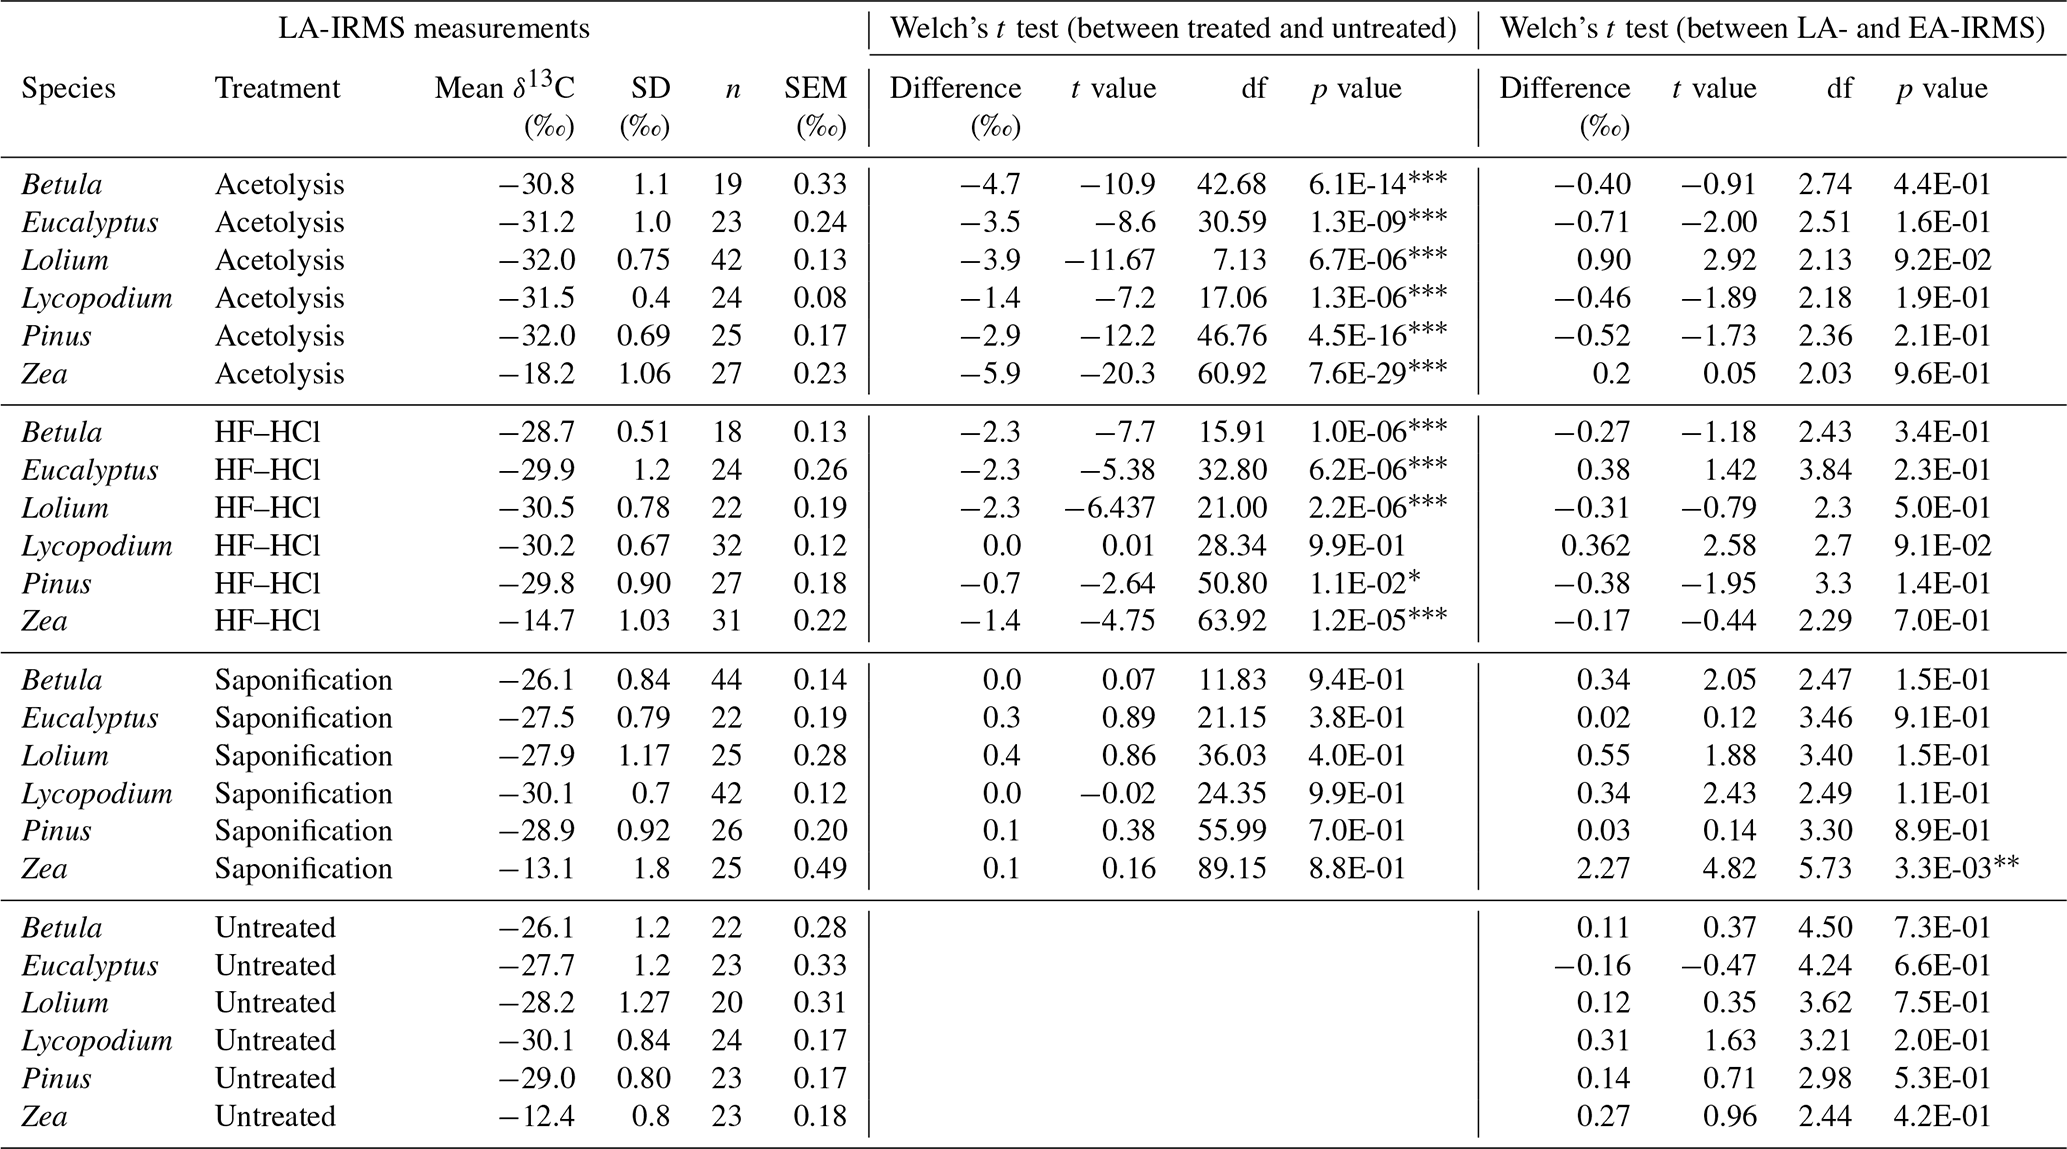
∗ = p < 0.05. = p < 0.01. = p < 0.001.
Table 3The table presents the LA-IRMS mean peak area and standard deviation (SD) for each species–treatment combination and the SD of the PE standard corresponding to the respective mean peak area (Van Roij et al., 2017). An F test was performed to compare the sample SD with the PE standard SD.
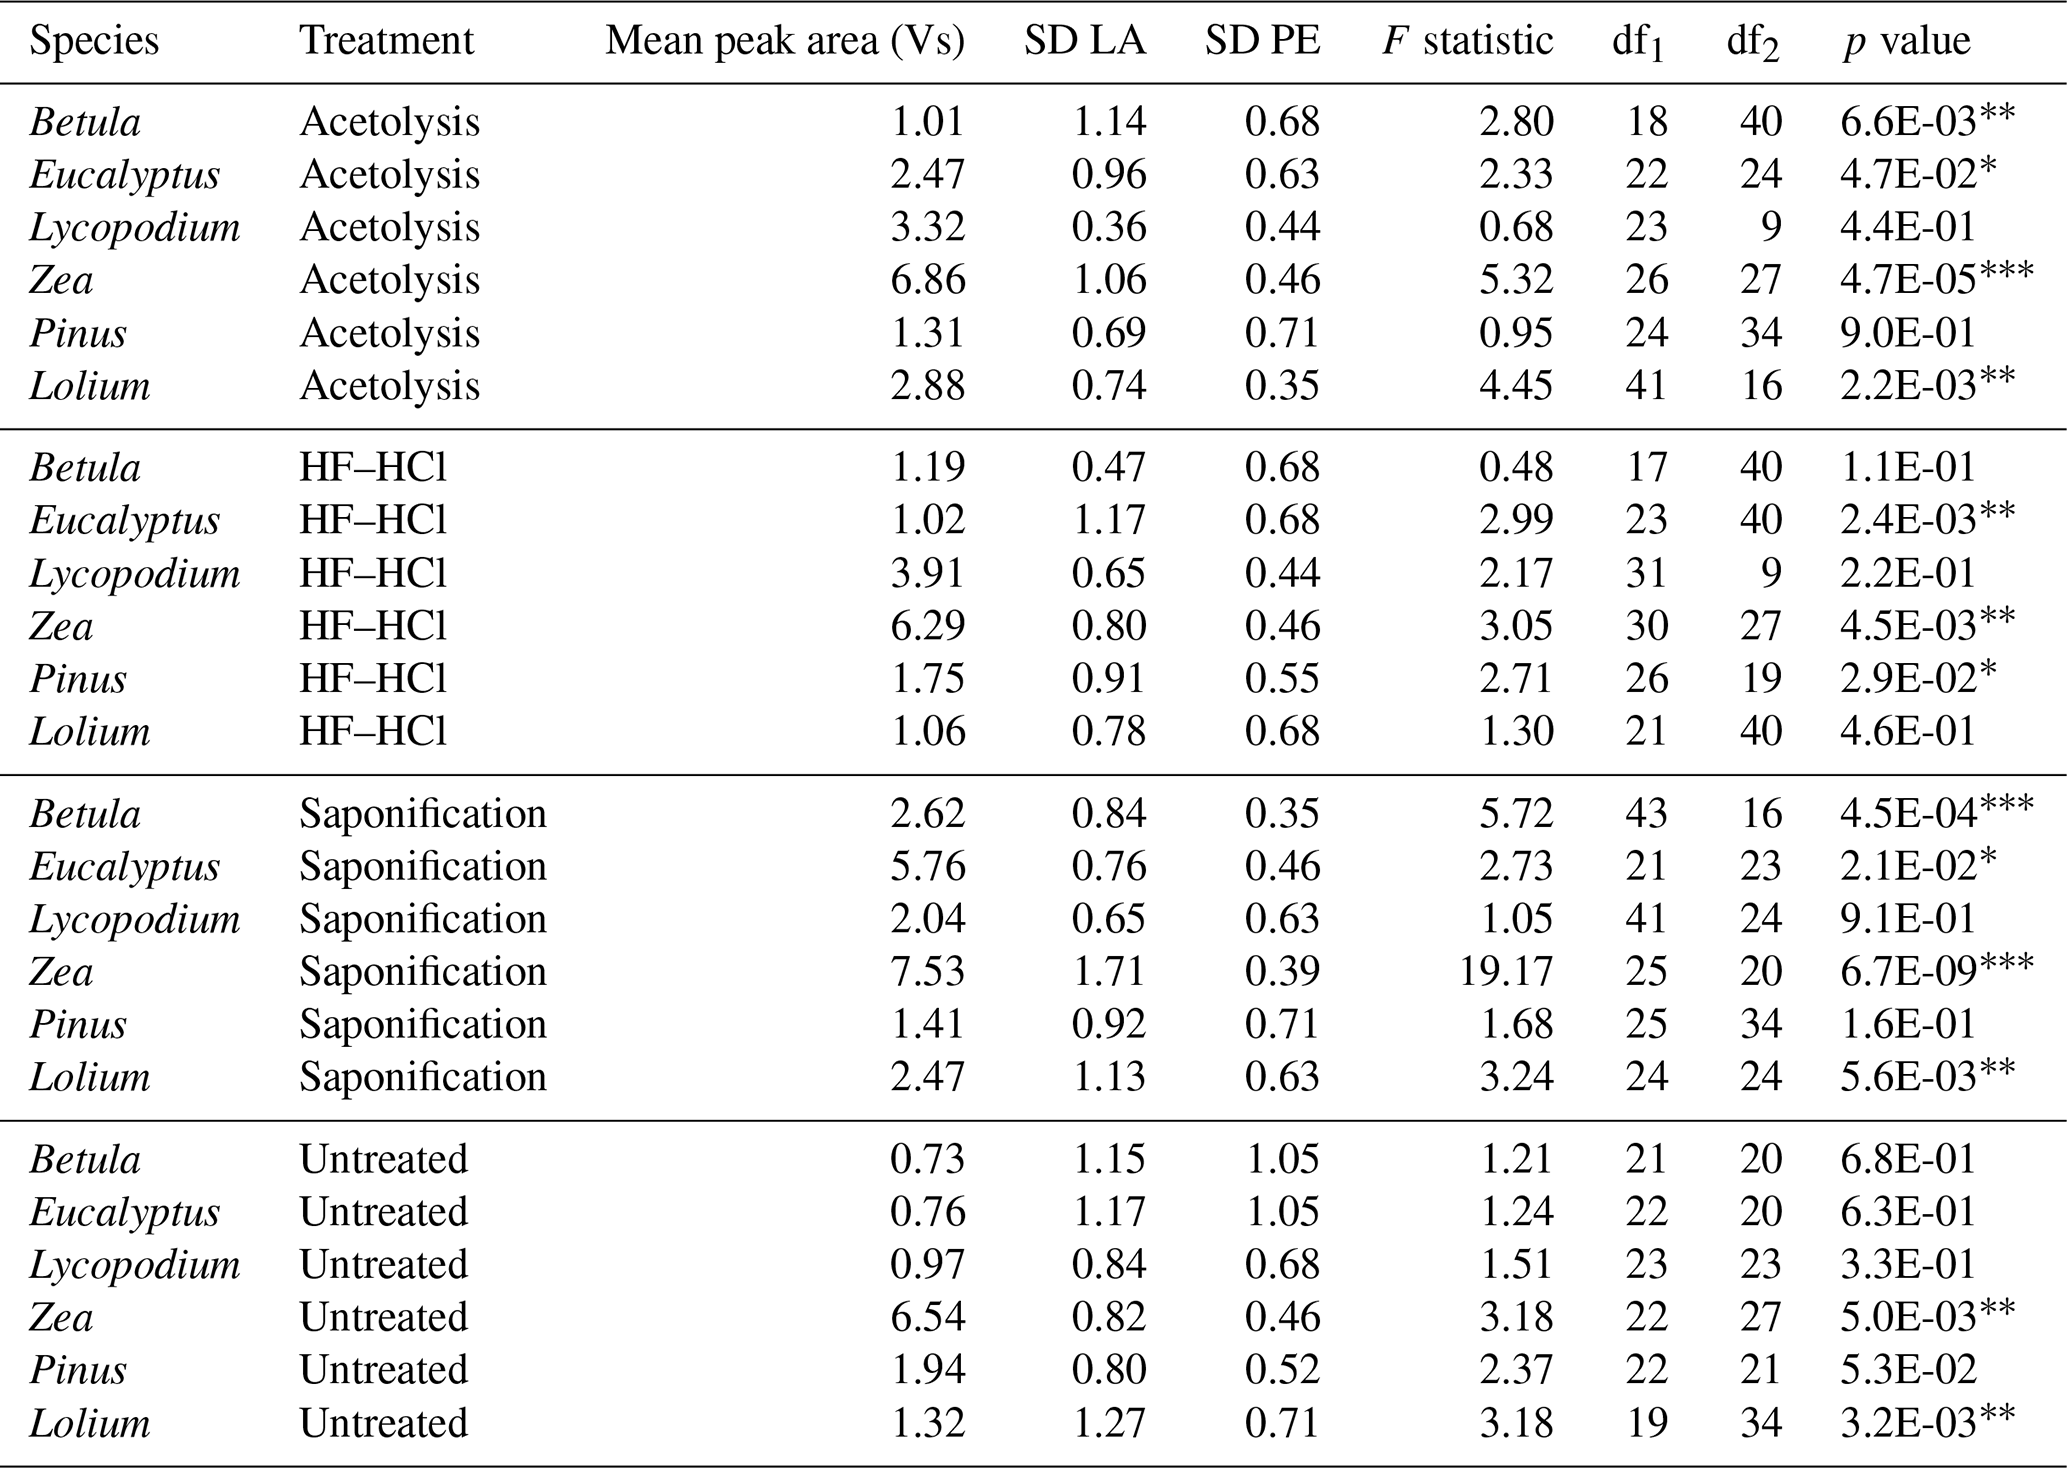
∗ = p < 0.05. = p < 0.01. = p < 0.001.
3.2.2 LA-IRMS
Table 2 shows the results of the LA-IRMS δ13C measurements as compared to the EA-IRMS measurements. Table 3 shows the F test results of the LA-IRMS standard deviations compared to the analytical error. LA-IRMS samples that are additionally corrected with PLA do not show significantly different results compared to EA-IRMS, with respect to when they are solely corrected using PE (Fig. S8 in the Supplement), although there is a linear mass bias involved with the LA-IRMS method (Fig. S9 in the Supplement).
Untreated
For each species, the LA-IRMS-based δ13C means of untreated specimens are not significantly different from the δ13C means obtained using EA-IRMS (t test, all p > 0.05; Table 2). Standard deviations are only significantly larger than the analytical error for Zea and Lolium (F test, p < 0.05; Table 3).
Saponification
For Zea, the δ13C means obtained from saponified specimens using LA-IRMS are significantly (t test, p < 0.05; Table 2) lower than those obtained using EA-IRMS, with a mean difference of 2.27 ‰ (Fig. 3). The mean LA-IRMS δ13C values do not significantly differ between saponified and untreated sporomorphs (t test, all p > 0.05; Table 2), even though the EA-IRMS method did reveal a difference for Zea, Lolium, and Eucalyptus (Sect. 3.2.1). Standard deviations are significantly larger than the analytical error for Betula, Eucalyptus, Zea, and Lolium (F test, p < 0.05; Table 3).
HF–HCl
For each species, the LA-IRMS-based δ13C means of HF–HCl-treated specimens are not significantly different from the δ13C means obtained using EA-IRMS (t test, all p > 0.05; Table 2). Standard deviations are significantly larger than the analytical error for Eucalyptus, Zea, and Pinus (F test, p < 0.05; Table 3).
Acetolysis
For each species, the LA-IRMS-based δ13C means of acetolyzed specimens are not significantly different from the δ13C means obtained using EA-IRMS (t test, all p > 0.05; Table 2). All acetolyzed samples have a significantly lower δ13C than the untreated samples for LA-IRMS (Table 2). Standard deviations are significantly larger than the analytical error for Betula, Eucalyptus, Zea, and Lolium (F test, p < 0.05; Table 3).
4.1 The overall chemical composition of (un)treated sporomorphs
4.1.1 Untreated
All of the untreated sporomorphs are richest in lipids when examined by flash pyrolysis, mostly consisting of C16 and C18 fatty acids. Polysaccharide- and protein-derived products are the second most abundant compound group in the pollen of Betula, Lolium, and Zea, while they are relatively small in Eucalyptus and Pinus, with only traces found in Lycopodium spores. Almost in opposite order are the relative abundances of aromatic pyrolysis products: the richest in Lycopodium and Pinus, intermediate abundances in Betula and Eucalyptus, and very small abundances in the pollen of Lolium and Zea (Fig. 2).
Aromatics consist of various alkyl- and methoxyphenols, alkyl- and carbonylbenzenes, and vinyl-containing compounds (see Sect. 4.2). Polysaccharides are dominated by levoglucosan (Fig. S3), a well-known pyrolysis product of cellulose (Pouwels et al., 1987), which forms the main component of the intine of sporomorphs (Shim et al., 2022). Moreover, the presence of xylose- and mannose-derived pyrolysis products suggests that the sporomorphs potentially contain a large variety of polysaccharides in addition to cellulose, considering this suite of monosaccharide building blocks. The N-bearing pyrolysis products are all well-known pyrolysis products of proteins (Tsuge and Matsubara, 1985).
It is important to note that the Py-GC-MS method used in this study has a bias toward detecting apolar structures (i.e., the lipids) due to the apolar GC column used. Consequently, polar sugars are under-detected. Whether aromatics are under-represented depends on the degree of polar groups (e.g., COOH, CO, and OH) associated with the molecule. However, considering that pyrolysis is a well-established method for assessing the chemical composition of organic material, we consider this a robust representation of sporomorph composition, especially when comparing our work to other studies using pyrolysis.
In summary, untreated sporomorphs are dominated by lipids (i.e., fatty acids) followed by polysaccharides and a mixture of aromatics, with the exact composition varying among the studied species.
4.1.2 Saponification
Upon saponification, relative abundances of the extractable and esterified lipids decrease substantially compared to other pyrolysis products (Fig. 2). This treatment not only eliminates alkenes, alkanes, alcohols, and fatty acids but also removes some aromatic acids, to varying extents, across all pollen types (Fig. S4). However, in Lycopodium, the aromatic acids (i.e., hydrocaffeic and hydroferulic acid) appear to be relatively persistent (Fig. S4). The mixture of aliphatic and aromatic compounds removed likely constitutes a significant component of pollenkitt, the sticky substance on pollen and spores that plays a crucial role in, for example, the formation of pollen clumps and the adherence to pollinators (Pacini and Hesse, 2005).
4.1.3 HF–HCl
When the sporomorphs are treated with HF–HCl, the relative contribution of polysaccharides and proteins becomes small to very small for all HF–HCl-treated sporomorphs (Fig. 2), supposedly due to acid-catalyzed hydrolysis of the glycosidic and peptide bonds, respectively. This implies that the HF–HCl treatment effectively removes polysaccharides and proteins. The relative amounts of the lipids detected are hardly affected, likely due to the very polar solvent that prevents solubilization of the lipids, which prefer to stay in the vicinity of the hydrophobic sporomorphs rather than in the aqueous solution.
4.1.4 Acetolysis
Due to the acidic conditions of acetolysis, polysaccharides and proteins are removed, resembling the HF–HCl treatment. Moreover, extractable and hydrolyzed lipids are removed with methanol in the water removal step, leaving sporomorphs rich in aromatic compounds (Fig. 2). These aromatic components detected after acetolysis therefore likely predominantly reflect the pyrolysis products of sporopollenin.
4.2 The aromatic make-up of sporopollenin
Given that the aromatic components present after acetolysis primarily reflect the pyrolysis products of sporopollenin, a more detailed examination of the aromatic composition of sporopollenin is insightful. Nierop et al. (2019) showed that Lycopodium spores are rich in cinnamic acid derivatives, such as p-coumaric acid, caffeic acid, and ferulic acid, and their respective saturated analogues, phloretic acid, hydrocaffeic acid, and hydroferulic acid. These components reflect typical sporopollenin-derived components (Jardine et al., 2017, 2021; Li et al., 2019; Lutzke et al., 2020).
Hydroferulic and hydrocaffeic acid are relatively polar structures, which do not have optimal interactions with the apolar GC column used. However, Lycopodium apparently produces these compounds in such abundances (Nierop et al., 2019) that they were still detected (Fig. S4).
Upon pyrolysis, the unsaturated acids (i.e., p-coumaric acid, caffeic acid, and ferulic acid) decarboxylate or, when ester-bound, yield 4-vinylphenol, 4-vinylcatechol, and 4-vinylguaiacol, respectively, in contrast to the saturated acids (Moldoveanu, 1998). Thus, the presence of 4-vinylphenol and 4-vinylguaiacol in all sporomorphs studied here suggests their precursors p-coumaric acid and ferulic acid to be a consistent component of the sporopollenin polymer for all species. The relative contribution of 4-vinylphenol and 4-vinylguaiacol varied across sporomorph species–treatment combinations in such a way that their precursors p-coumaric and ferulic acid must occur in hydrolyzable and non-hydrolyzable forms.
Based on thermally assisted hydrolysis and methylation–GC–MS (TMH-GC-MS) analyses of spores from eight species of moss, clubmoss, horsetail, and fern as well as pollen from a single cycad species, Nierop et al. (2019) assumed that caffeic acid synthesis in sporomorphs might have been lost during Cycadophyta evolution but was retained in Magnoliophyta (angiosperms). However, 4-vinylcatechol, and thus its precursor caffeic acid, was only found in the clubmoss Lycopodium, whereas it was absent from the four angiosperms (Betula, Lolium, Zea, and Eucalyptus) as well as from the gymnosperm Pinus (this study) and Zamia floridana (Nierop et al., 2019). These findings suggest that caffeic acid synthesis in sporopollenin is specific to spore-producing seedless embryophytes (mosses, clubmosses, liverworts, hornworts, horsetails, and ferns) as opposed to pollen-producing seed plants. However, considering the limited number of taxa studied here, more research is needed to confirm this.
Two other components, benzaldehyde and acetophenone, have been regularly identified in all kinds of samples upon pyrolysis in relatively small abundances (Moldoveanu, 1998). In our spores and pollen, these components are found in remarkably high abundances independent of the treatment, and they are most enriched in the pyrolysates after acetolysis, except for Eucalyptus (Fig. S3). Moreover, in the extant megaspores of the lycophyte Isoëtes killipii (Boom, 2004); in the megaspores and massulae of the water fern Azolla caroliniana (Nierop et al., 2011); and, in particular, in the fossil spores of Azolla and Salvinia (Van Bergen et al., 1993), both pyrolysis products are prominently present. Furthermore, Boom (2004) synthesized a sporopollenin-like dehydrogenation polymer based on p-coumaric acid. Upon pyrolysis, this dehydrogenation polymer yielded almost the same pyrolysis product as purified megaspores of I. killipii but lacked both benzaldehyde and acetophenone. This suggests that, although p-coumaric acid is indeed an important constituent, additional aromatic components, associated with acetophenone and benzaldehyde as pyrolysates, must also be part of the sporopollenin structure (see Li et al., 2019).
Another series of components identified, guaiacol (2-methoxyphenol), 4-methyl- and 4-ethylguaiacol, and the aforementioned 4-vinylguaiacol (Fig. S4), are typical products found when lignin is present. However, the most distinct pyrolysis products of intact lignin, the three isomers of 4-propenylguaiacol, were not detected (Sáiz-Jiménez and De Leeuw, 1984; Ralph and Hatfield, 1991). Hence, guaiacol, 4-methylguaiacol, and 4-ethylguaiacol likely originate from another polyphenol source. The most probable contributors are ferulic-acid-rich sporopollenin (Lycopodium) or tannin-rich species such as Betula and Eucalyptus (Galletti and Reeves, 1992). These compounds are present in the other three species in substantially lower amounts (Fig. S4).
Alkylbenzenes and alkylphenols can have multiple sources, such as tannins and proteins (Tsuge and Matsubara, 1985; Bracewell and Robertson, 1984; Galletti and Reeves, 1992). Since all N-bearing components (i.e., proteins) were absent after HF–HCl and acetolysis treatments, the relative accumulation of alkylbenzenes and alkylphenols upon treatment implies a major sporopollenin source of these pyrolysis products.
4.3 The δ13C composition of (un)treated sporomorphs
4.3.1 Overall isotopic composition
The δ13C value of the sporomorphs is essentially a weighted average of the δ13C of all of the aforementioned chemical components, broadly divided into polysaccharides/sugars, lipids, proteins, and aromatic structures (see Hayes, 2001). Except for Eucalyptus and Lolium, untreated sporomorph species differ significantly from each other with respect to their mean δ13C values (Fig. 3), reflecting the different chemical compositions among the studied species as well as differences in altitude, humidity, photosynthetic pathways (C4 (Zea) vs. C3 (other species)), and other environmental growth conditions that influence carbon isotope fractionation, from the CO2 that is taken up to the sporomorph formed (Diefendorf et al., 2010; Farquhar et al., 1982; O'Leary, 1981).
4.3.2 Saponification
The general δ13C increase in saponified sporomorphs compared to untreated samples aligns with the fact that lipids typically have δ13C values that are 3 ‰–6 ‰ lower than bulk biomass (Abelson and Hoering, 1961; Hayes, 2001). This offset reflects the fractionation along the metabolic pathways involved in lipid synthesis which uses acetyl co-enzyme A (acetyl-CoA) as the carbon donor for the lipid skeleton (Hayes, 2001). Acetyl-CoA is produced through pyruvate dehydrogenase, which is known to generate substantial isotopic fractionation (DeNiro and Epstein, 1977; Melzer and Schmidt, 1987). Removal of lipids thus results in the δ13C value of the remaining material increasing. This isotopic effect of saponification contrasts with the findings of Müller et al. (2021), who found a relative δ13C drop in pollen after KOH treatment. Evidently, the use of methanol and DCM in addition to KOH during our saponification treatment resulted in a more effective extraction of lipids, causing the observed δ13C increase. The LA-IRMS measurements of saponified samples show no significant rise in δ13C relative to untreated pollen, which is likely due to the relatively small sample size (n = ∼ 30, as compared to the EA-IRMS method, which measures > 1000 sporomorphs in a single measurement), causing the standard errors of the means to be too large to statistically detect a potential significant offset.
4.3.3 HF–HCl
Considering that most of the hydrolyzable compounds of the sporomorph consist of polysaccharides, which are generally 13C-enriched compared to total biomass (Hayes, 2001; van Dongen et al., 2002), HF–HCl treatment logically results in lower sporomorph δ13C. Proteins generally have high δ13C compared that of total biomass (Hayes, 2001; Abelson and Hoering, 1961). However, the δ13C variation among individual amino acids is large (up to 25 ‰; Abelson and Hoering, 1961; Macko et al., 1987). This variation arises from the interplay between the sources of the carbon skeletons (e.g., the tricarboxylic acid cycle, pyruvate, or phosphoglycerate) and the isotopic fractionation occurring at metabolic branch points during amino acid biosynthesis (see Hayes, 2001, for an in-depth discussion on 13C fractionation during amino acid biosynthesis). Polypeptide δ13C can, therefore, theoretically be higher, lower, or similar to total biomass δ13C values (Blair et al., 1985; Abelson and Hoering, 1961; Benner et al., 1987). Due to the relatively small amount of N-bearing compounds present in the sporomorphs, the isotopic effect of HF–HCl is rather dominated by the removal of polysaccharides, i.e., a depletion of the residual sporomorph. The removal of polysaccharides clearly has a substantial effect on δ13C values (HF–HCl treatment in Fig. 3), even though the pyrolysis-based chemical compositions of HF–HCl-treated and untreated samples appear similar (Fig. 2). This is likely due to the aforementioned under-detection of polysaccharides with the Py-GC-MS method applied.
4.3.4 Acetolysis
Interestingly, for all species, acetolysis results in even more 13C-depleted sporomorphs than HF–HCl (Fig. 3), in line with Müller et al. (2021). This depletion suggests that the residual aromatic components in the sporomorph have a lower δ13C value than the extractable lipids. Genetic studies (Grienenberger et al., 2011; Zhu et al., 2021) in plants have identified specific genes involved in exine formation. These genes encode reductase and synthase enzymes that catalyze the production of tetraketide α-pyrone, a cyclic compound, from medium- to long-chain fatty acids. Tetraketide α-pyrone is believed to serve as an important precursor for sporopollenin, suggesting that the precursor of sporopollenin is a fatty acid (Grienenberger et al., 2011; Kim and Douglas, 2013; Zhu et al., 2021). Like fatty acids and other lipids, the biosynthesis of tetraketide α-pyrones relies metabolically on acetyl-CoA, which, as described above, generates substantial 13C fractionation through the pyruvate dehydrogenase reaction involved in its production (DeNiro and Epstein, 1977; Melzer and Schmidt, 1987). Therefore, the relatively low δ13C values of the aromatic compounds compared to lipids can be explained by this additional acetyl-CoA-induced fractionation.
4.4 EA-IRMS vs. LA-IRMS
For the EA-IRMS measurements, some natural and analytical variability in δ13C values is evident from the spread in the untreated samples. Particularly for Zea and Lolium, which have a substantially larger spread than the standard deviation of the GQ standard (0.07 ‰), it is clear the untreated pollens were not entirely homogeneous before measurement, resulting in some natural variability contributing to the observed variability in the EA-IRMS measurements. However, the even larger spread recorded for acetolyzed pollen (e.g., Pinus and Zea) is likely due to non-uniform treatment of the material when, for example, the duration of contact between sporomorphs and the acetolysis solution differs for individual sporomorphs, affecting both the composition and amount of removed substances (Hemsley et al., 1993). Except for saponified Zea the mean LA- and EA-IRMS δ13C measurements are not significantly different.
For saponified Zea, the significant difference between the LA- and EA-IRMS means suggests that something is measured differently among the two methods. Light microscopy photos show the coloration of the saponified pollen to be more variable than untreated pollen (Fig. S6 in the Supplement), which is possibly represented by the skew to lower δ13C values witnessed for the distribution of saponified Zea. However, the reason behind this EA–LA mismatch remains elusive. An additional PLA correction does not significantly change this result (Fig. S9).
Overall, LA-IRMS is the preferred method to study the mean δ13C of sporomorph populations due to the more direct targeting of individual or very few specimens, avoiding the isotopic incorporation of non-sporomorph material (e.g., anther fragments) also present in samples. Furthermore, the advantage of LA-IRMS over EA-IRMS is that it enables the analysis of inter-specimen variability and community structure. This is exemplified by the – larger than analytical error – spread of untreated Zea and Lolium in this study, representing intraspecific differences in carbon isotope ecology, and further highlighted by Frieling et al. (2023), Sluijs et al. (2018), and Van Roij et al. (2017).
4.5 Implications for fossil sporomorphs
The sporopollenin-rich sporomorph left behind after acetolysis can be considered similar to diagenetically altered sporomorphs from the geological record: most labile and hydrolyzable components are removed, and only the most durable material remains. However, sporopollenin is also known to be chemically altered during thermal maturation (Watson et al., 2012; Yule et al., 2000). Hydrous pyrolysis (Watson et al., 2012) – simulating thermal maturation – and micro Fourier-transform infrared (FT-IR) analysis (Yule et al., 2000) of gradually heated Lycopodium spores reveal a stepwise change in the composition of sporopollenin during thermal maturation. Firstly, the ester-bound n-carboxylic acids – as represented by the abundant fatty acids found on the exine – are hydrolyzed and polymerized into alkyl groups, increasing the aliphatic proportion of sporopollenin. Secondly, at higher temperature, these aliphatic components are thermally cracked, resulting in a relative enrichment of the more stable aromatic components within the residual sporopollenin. Therefore, the stage of maturation determines whether the sporopollenin geopolymer is aliphatic- or aromatic-dominated.
Considering our results, this implies that sporomorph diagenesis may result in stable carbon isotopic fractionation in fossil sporomorphs between that observed in HF–HCl-treated (i.e., early stage of maturation, dominated by lipids and aromatics) and acetolyzed (i.e., late mature stage, dominated by aromatics) sporomorphs. According to our results, this means that fossilized sporomorphs, irrespective of the stage of maturation, are always 13C-depleted relative to fresh specimens (Fig. 3).
However, it should be emphasized that the acetolysis procedure affects the material non-uniformly (Hemsley et al., 1993), which increases variation between individual sporomorphs and, hence, the observed variability in our δ13C measurements (Fig. 3). Moreover, acetolysis has been shown to alter the sporopollenin structure by the removal and addition of C-bearing compounds (Domínguez et al., 1998; Jardine et al., 2017, 2023; Wang et al., 2023), and this is reflected by the substantial decrease in δ13C associated with acetolysis (Fig. 3), also in comparison to methods that specifically isolate sporopollenin – which acetolysis does not do per se (Amundson et al., 1997; Loader and Hemming, 2000). These methods include (1) a cellulase-containing enzymic treatment (Li et al., 2019; Lutzke et al., 2020) and (2) acidolysis using sulfuric acid (Loader and Hemming, 2000) and phosphoric acid (Lutzke et al., 2020) – which we advise to use instead of acetolysis, as these do not introduce C-bearing compounds.
However, considering that the removal of lipids only minimally affects δ13C values, as witnessed for saponified compared to untreated sporomorphs (Fig. 3), we propose that the δ13C depletion associated with the HF–HCl treatment generally corresponds to the carbon isotopic fractionation associated with the fossilization of sporomorphs. This implies that the HF–HCl procedure is an appropriate treatment when comparing δ13C values among modern and fossil sporomorphs.
The chemical composition of modern sporomorphs as determined by flash pyrolysis is dominated by lipids (i.e., mostly C16 and C18 fatty acids), followed by aromatics and polysaccharides, the order of which depends on plant species, with minimal amounts of proteins. After the removal of extractable and esterified lipids and hydrolyzable polysaccharides and proteins, the sporomorph is dominated by aromatic compounds, which are thought to represent the components of the resistant sporopollenin structure. In addition to the present literature, our study shows that the composition of this sporopollenin is variable among species. However, p-coumaric and ferulic acid are consistent building blocks, whereas the carbonylbenzenes benzaldehyde and acetophenone seem to be unique markers of sporopollenin upon pyrolysis.
Overall, the LA- and EA-IRMS methods agree, meaning that the average δ13C of individually measured sporomorphs is in line with the bulk value. However, LA-IRMS is the preferred method for δ13C measurements due to more accurate targeting of the sporomorphs, the possibility to study inter-specimen variability and community structure, and the low amounts of material needed to get an accurate measurement. To take linear mass bias into account when correcting the data, we do advise one to use multiple standards across a range of δ13C values that ideally bracket the range of the data (e.g., PE and PLA).
Both LA- and EA-IRMS illustrate that saponification slightly increases δ13C values via the removal of surface-bound lipids, HF–HCl decreases δ13C values via the removal of polysaccharides and proteins, and acetolysis causes an even more pronounced decrease in δ13C values by concentrating the relatively 13C-depleted sporopollenin. A combination of HF–HCl treatment and a lipid removal step appears to be the most effective method for investigating the δ13C value of sporopollenin specifically, as acetolysis seems to chemically alter sporopollenin. Fossil sporomorphs likely have a δ13C value somewhere between HF–HCl-treated and acetolyzed samples of fresh sporomorphs, depending on the stage of maturation, which influences the relative amount of aliphatic lipids as compared to aromatics.
All newly generated data are available via a permanent online repository: https://doi.org/10.5281/zenodo.15174422 (Bats, 2025).
The supplement related to this article is available online at https://doi.org/10.5194/bg-22-4689-2025-supplement.
AS and KGJN designed the study. LvR, ASL, JF, KGJN, and YFB processed samples and generated data. YFB, KGJN, and AS analyzed data. YFB wrote the original draft. AS, KGJN, JF, and GJR reviewed and edited the manuscript. AS and GJR received funding for this study.
The contact author has declared that none of the authors has any competing interests.
Publisher's note: Copernicus Publications remains neutral with regard to jurisdictional claims made in the text, published maps, institutional affiliations, or any other geographical representation in this paper. While Copernicus Publications makes every effort to include appropriate place names, the final responsibility lies with the authors.
We thank Arnold van Dijk, Desmond Eefting, Natasja Welters, and Giovanni Dammers (Utrecht University), for technical and analytical assistance, and Francien Peterse, for valuable discussions.
Appy Sluijs received unfettered research funding from the Ammodo Foundation. Appy Sluijs received funding from the European Research Council (ERC; consolidator grant no. 771497, SPANC). This work was supported by EMBRACER (Summit grant no. SUMMIT.1.034), financed by the Netherlands Organization for Scientific Research (NWO). This work was carried out within the framework of the Netherlands Earth System Science Centre (NESSC) program; has been financially supported by the Ministry of Education, Culture, and Science (OCW) through Gravitation (grant no. 024.002.001); and has received funding from the European Union's Horizon 2020 Research and Innovation program under the Marie Skłodowska-Curie Actions (grant no. 847504).
This paper was edited by Sebastian Naeher and reviewed by two anonymous referees.
Abelson, P. H. and Hoering, T. C.: Carbon isotope fractionation in formation of amino acids by photosynthetic organisms, Proceedings of the National Academy of Sciences, 47, 623–632, https://doi.org/10.1073/pnas.47.5.623, 1961.
Amundson, R., Evett, R. R., Jahren, A. H., and Bartolome, J.: Stable carbon isotope composition of Poaceae pollen and its potential in paleovegetational reconstructions, Review of Palaeobotany and Palynology, 99, 17–24, https://doi.org/10.1016/S0034-6667(97)00031-6, 1997.
Bats, Y. F.: Pyrolysis and EA- and LA-IRMS measurements of chemically treated pollen, Zenodo [data set], https://doi.org/10.5281/zenodo.15174422, 2025.
Benner, R., Fogel, M. L., Sprague, E. K., and Hodson, R. E.: Depletion of 13C in lignin and its implications for stable carbon isotope studies, Nature, 329, 708–710, https://doi.org/10.1038/329708a0, 1987.
Blair, N. E. A. L., Leu, A., Olsen, J., Kwong, E., and Des Marais, D.: Carbon isotopic fractionation in heterotrophic microbial metabolism, Applied and Environmental Microbiology, 50, 996–1001, https://doi.org/10.1128/aem.50.4.996-1001.1985, 1985.
Boom, A.: p-Coumaric acid-based sporopollenin of Isoëtes killipii megaspores, in: A geochemical study of lacustrine sediments: towards palaeo-climatic reconstructions of high Andean biomes in Colombia, PhD thesis, University of Amsterdam, pp. 89-101, ISBN 90-76894-44-2, 2004.
Bracewell, J. M. and Robertson, G. W.: Quantitative comparison of the nitrogen-containing pyrolysis products and amino acid composition of soil humic acids, Journal of Analytical and Applied Pyrolysis, 6, 19–29, https://doi.org/10.1016/0165-2370(84)80002-9, 1984.
Canty, A. and Ripley, B.: Boot: Bootstrap R (S-Plus) Functions, R Package Version 1.3-28.1, https://cran.r-project.org/web/packages/boot/boot.pdf (last access: 16 April 2025), 2022.
De Leeuw, J. W., Versteegh, G. J. M., and Van Bergen, P. F.: Biomacromolecules of algae and plants and their fossil analogues, Plant Ecol., 182, 20–233, https://doi.org/10.1007/978-1-4020-4443-4_14, 2006.
DeNiro, M. J. and Epstein, S.: Mechanism of Carbon Isotope Fractionation Associated with Lipid Synthesis, Science, 197, 261–263, https://doi.org/10.1126/science.327543, 1977.
Descolas-Gros, C. and Schölzel, C.: Stable isotope ratios of carbon and nitrogen in pollen grains in order to characterize plant functional groups and photosynthetic pathway types, New Phytologist, 176, 390–401, https://doi.org/10.1111/j.1469-8137.2007.02176.x, 2007.
Diefendorf, A. F., Mueller, K. E., Wing, Scott. L., Koch, P. L., and Freeman, K. H.: Global patterns in leaf13 C discrimination and implications for studies of past and future climate, Proceedings of the National Academy of Sciences, 107, 5738–5743, https://doi.org/10.1073/pnas.0910513107, 2010.
Domínguez, E., Mercado, J. A., Quesada, M. A., and Heredia, A.: Isolation of intact pollen exine using anhydrous hydrogen fluoride, Grana, 37, 93–96, https://doi.org/10.1080/00173139809362649, 1998.
Erdtman, G.: The acetolysis method. A revised description, Svensk Bot. Tidskr., 54, 561–564, 1960.
Fan, T.-F., Potroz, M. G., Tan, E.-L., Ibrahim, M. S., Miyako, E., and Cho, N.-J.: Species-Specific Biodegradation of Sporopollenin-Based Microcapsules, Scientific Reports, 9, 9626, https://doi.org/10.1038/s41598-019-46131-w, 2019.
Farquhar, G., O'Leary, M., and Berry, J.: On the Relationship Between Carbon Isotope Discrimination and the Intercellular Carbon Dioxide Concentration in Leaves, Functional Plant Biology, 9, 121, https://doi.org/10.1071/PP9820121, 1982.
Frieling, J., van Roij, L., Kleij, I., Reichart, G.-J., and Sluijs, A.: Single-species dinoflagellate cyst carbon isotope fractionation in core-top sediments: environmental controls, CO2 dependency and proxy potential, Biogeosciences, 20, 4651–4668, https://doi.org/10.5194/bg-20-4651-2023, 2023.
Galletti, G. C. and Reeves, J. B.: Pyrolysis/gas chromatography/ion trap detection of polyphenols (vegetable tannins): preliminary results, Organic Mass Spectrometry 27, 226–230, https://doi.org/10.1002/oms.1210270313, 1992.
Grienenberger, E., Kim, S. S., Lallemand, B., Geoffroy, P., Heintz, D., Souza, C. de A., Heitz, T., Douglas, C. J., and Legrand, M.: Analysis of TETRAKETIDE α-PYRONE REDUCTASE Function in Arabidopsis thaliana Reveals a Previously Unknown, but Conserved, Biochemical Pathway in Sporopollenin Monomer Biosynthesis, Plant Cell, 22, 4067–4083, https://doi.org/10.1105/tpc.110.080036, 2011.
Hayes, J. M.: Fractionation of the Isotopes of Carbon and Hydrogen in Biosynthetic Processes, Reviews in Mineralogy and Geochemistry, 43, 225–273, https://doi.org/10.2138/gsrmg.43.1.225, 2001.
Hemsley, A. R., Barrie, P. J., Chaloner, W. G., and Scott, A. C.: The composition of sporopollenin and its use in living and fossil plant systematics, Grana, 32, 2–11, https://doi.org/10.1080/00173139309427446, 1993.
Hesse, M. and Waha, M.: A new look at the acetolysis method, Pl. Syst. Evol., 163, 147–152, 1989.
Hoins, M., Van de Waal, D. B., Eberlein, T., Reichart, G.-J., Rost, B., and Sluijs, A.: Stable carbon isotope fractionation of organic cyst-forming dinoflagellates: Evaluating the potential for a CO2 proxy, Geochim. Cosmochim. Ac., 160, 267–276, https://doi.org/10.1016/j.gca.2015.04.001, 2015.
Jardine, P. E., Abernethy, F. A. J., Lomax, B. H., Gosling, W. D., and Fraser, W. T.: Shedding light on sporopollenin chemistry, with reference to UV reconstructions, Review of Palaeobotany and Palynology, 238, 1–6, https://doi.org/10.1016/j.revpalbo.2016.11.014, 2017.
Jardine, P. E., Hoorn, C., Beer, M. A. M., Barbolini, N., Woutersen, A., Bogota-Angel, G., Gosling, W. D., Fraser, W. T., Lomax, B. H., Huang, H., Sciumbata, M., He, H. and Dupont-Nivet: Sporopollenin chemistry and its durability in the geological record: an integration of extant and fossil chemical data across the seed plants, Palaeontology, 64, 285–305, https://doi.org/10.1111/pala.12523, 2021.
Jardine, P. E., Kent, M. S., Fraser, W. T., Knorr, K. H., and Lomax, B. H.: Uncovering a phylogenetic signal in plant biopolymer chemistry: a comparison of sporopollenin isolation approaches for use in palynological research, Palaeontology, 66, e12683, https://doi.org/10.1111/pala.12683, 2023.
Kaufman, A. J. and Xiao, S.: High CO2 levels in the Proterozoic atmosphere estimated from analyses of individual microfossils, Nature, 425, 279–282, https://doi.org/10.1038/nature01902, 2003.
Kim, S. S. and Douglas, C. J.: Sporopollenin monomer biosynthesis in arabidopsis, Journal of Plant Biology, 56, 1–6, https://doi.org/10.1007/s12374-012-0385-3, 2013.
Li, F.-S., Phyo, P., Jacobowitz, J., Hong, M., and Weng, J.-K.: The molecular structure of plant sporopollenin, Nat. Plants, 5, 41–46, https://doi.org/10.1038/s41477-018-0330-7, 2019.
Loader, N. J. and Hemming, D. L.: Preparation of pollen for stable carbon isotope analyses, Chemical Geology, 165, 339–344, https://doi.org/10.1016/S0009-2541(99)00176-X, 2000.
Loader, N. J. and Hemming, D. L.: The stable isotope analysis of pollen as an indicator of terrestrial palaeoenvironmental change: a review of progress and recent developments, Quaternary Science Reviews, 23, 893–900, https://doi.org/10.1016/j.quascirev.2003.06.015, 2004.
Lutzke, A., Morey, K. J., Medford, J. I. and Kipper, M. J.: Detailed characterization of Pinus ponderosa sporopollenin by infrared spectroscopy, Phytochemistry, 170, 112195, https://doi.org/10.1016/j.phytochem.2019.112195, 2020.
Macko, S. A., Fogel, M. L., Hare, P. E., and Hoering, T. C.: Isotopic fractionation of nitrogen and carbon in the synthesis of amino acids by microorganisms, Chemical Geology: Isotope Geoscience Section, 65, 79–92, https://doi.org/10.1016/0168-9622(87)90064-9, 1987.
Melzer, E. and Schmidt, H. L.: Carbon isotope effects on the pyruvate dehydrogenase reaction and their importance for relative carbon-13 depletion in lipids, Journal of Biological Chemistry, 262, 8159–8164, https://doi.org/10.1016/S0021-9258(18)47543-6, 1987.
Moldoveanu, S. C.: Analytical pyrolysis of natural organic polymers, 20, Elsevier, ISBN 0-444-82203-8, 1998.
Müller, C., Hennig, J., Riedel, F., and Helle, G.: Quantifying the impact of chemicals on stable carbon and oxygen isotope values of raw pollen, Journal of Quaternary Science, 36, 441–449, https://doi.org/10.1002/jqs.3300, 2021.
Murphey, B. F. and Nier, A. O.: Variations in the Relative Abundance of the Carbon Isotopes, Physical Review, 59, 771–772, https://doi.org/10.1103/PhysRev.59.771.2, 1941.
Nelson, D. M., Hu, F. S., Mikucki, J. A., Tian, J., and Pearson, A.: Carbon-isotopic analysis of individual pollen grains from C3 and C4 grasses using a spooling-wire microcombustion interface, Geochim. Cosmochim. Ac., 71, 4005–4014, 2007.
Nierop, K. G. J., Speelman, E. E., De Leeuw, J. W., and Reichart, G. J.: The omnipresent water fern Azolla caroliniana does not contain lignin, Organic Geochemistry, 42, 846–850, https://doi.org/10.1016/j.orggeochem.2011.05.001, 2011.
Nierop, K. G. J., Versteegh, G. J. M., Filley, T. R., and De Leeuw, J. W.: Quantitative analysis of diverse sporomorph-derived sporopollenins, Phytochemistry, 162, 207–215, https://doi.org/10.1016/j.phytochem.2019.03.023, 2019.
O'Leary, H.: CARBON ISOTOPE FRACTIONATION IN PLANTS, Phytochemistry, 20, 553–567, https://doi.org/10.1016/0031-9422(81)85134-5, 1981.
Pacini, E. and Hesse, M.: Pollenkitt – its composition, forms and functions, Flora – Morphology, Distribution, Functional Ecology of Plants, 200, 399–415, https://doi.org/10.1016/j.flora.2005.02.006, 2005.
Polissar, P. J., Fulton, J. M., Junium, C. K., Turich, C. C., and Freeman, K. H.: Measurement of 13C and 15N Isotopic Composition on Nanomolar Quantities of C and N, Analytical Chemistry, 81, 755–763, https://doi.org/10.1021/ac801370c, 2009.
Pouwels, A. D., Tom, A., Eijkel, G. B., and Boon, J. J.: Characterisation of beech wood and its holocellulose and xylan fractions by pyrolysis-gas chromatography-mass spectrometry. Journal of Analytical and Applied Pyrolysis, 11, 417–436, https://doi.org/10.1016/0165-2370(87)85045-3, 1987.
Quilichini, T. D., Grienenberger, E., and Douglas, C. J.: The biosynthesis, composition and assembly of the outer pollen wall: A tough case to crack, Phytochem., 113, 170–182, https://doi.org/10.1016/j.phytochem.2014.05.002, 2015.
Ralph, J., and Hatfield, R. D.: Pyrolysis-GC-MS characterization of forage materials, Journal of Agricultural and Food Chemistry, 39, 1426–1437, https://doi.org/10.1021/jf00008a014, 1991.
R Core Team: R: A Language and Environment for Statistical Computing, R Foundation for Statistical Computing, Vienna, Austria, https://www.R-project.org/ (last access: 11 September 2025), 2023.
Sáiz-Jiménez, C., and De Leeuw, J. W.: Pyrolysis-gas chromatography-mass spectrometry of isolated, synthetic and degraded lignins, Organic Geochemistry, 6, 417–422, https://doi.org/10.1016/0146-6380(84)90064-0, 1984.
Schilder, J., Van Roij, L., Reichart, G.-J., Sluijs, A., and Heiri, O.: Variability in δ13C values between individual Daphnia ephippia: Implications for palaeo-studies, Quaternary Science Reviews, 189, 127–133, https://doi.org/10.1016/j.quascirev.2018.04.007, 2018.
Sessions, A. L., Sylva, S. P., and Hayes, J. M.: Moving-Wire Device for Carbon Isotopic Analyses of Nanogram Quantities of Nonvolatile Organic Carbon, Analytical Chemistry, 77, 6519–6527, https://doi.org/10.1021/ac051251z, 2005.
Shim, S.-H., Mahong, B., Lee, S.-K., Kongdin, M., Lee, C., Kim, Y.-J., Qu, G., Zhang, D., Ketudat Cairns, J. R., and Jeon, J.-S.: Rice β-glucosidase Os12BGlu38 is required for synthesis of intine cell wall and pollen fertility, Journal of Experimental Botany, 73, 784–800, https://doi.org/10.1093/jxb/erab439, 2022.
Sluijs, A., van Roij, L., Frieling, J., Laks, J., and Reichart, G.-J.: Single-species dinoflagellate cyst carbon isotope ecology across the Paleocene-Eocene Thermal Maximum, Geology, 46, 79–82, https://doi.org/10.1130/G39598.1, 2018.
Tsuge, S. and Matsubara, H.: High-resolution pyrolysis-gas chromatography of proteins and related materials, Journal of Analytical and Applied Pyrolysis, 8, 49–64, https://doi.org/10.1016/0165-2370(85)80014-0, 1985.
Van Bergen, P. F., Collinson, M. E., and De Leeuw, J. W.: Chemical composition and ultrastructure of fossil and extant salvinialean microspore massulae and megaspores, Grana, 32, 18–30, https://doi.org/10.1080/00173139309427448, 1993.
Van Dongen, B., Schouten, S., and Sinninghe Damsté, J.: Carbon isotope variability in monosaccharides and lipids of aquatic algae and terrestrial plants, Marine Ecology Progress Series, 232, 83–92, https://doi.org/10.3354/meps232083, 2002.
Van Hardenbroek, M., Heiri, O., Grey, J., Bodelier, P. L. E., Verbruggen, F., and Lotter, A. F.: Fossil chironomid δ13C as a proxy for past methanogenic contribution to benthic food webs in lakes?, Journal of Paleolimnology, 43, 235–245, https://doi.org/10.1007/s10933-009-9328-5, 2010.
Van Hardenbroek, M., Chakraborty, A., Davies, K. L., Harding, P., Heiri, O., Henderson, A. C. G., Holmes, J. A., Lasher, G. E., Leng, M. J., Panizzo, V. N., Roberts, L., Schilder, J., Trueman, C. N., and Wooller, M. J.: The stable isotope composition of organic and inorganic fossils in lake sediment records: Current understanding, challenges, and future directions, Quaternary Science Reviews, 196, 154–176, https://doi.org/10.1016/j.quascirev.2018.08.003, 2018.
Van Roij, L., Sluijs, A., Laks, J. J., and Reichart, G.-J.: Stable carbon isotope analyses of ng quantities of particulate organic carbon (pollen) with laser ablation nano combustion gas chromatography isotope ratio mass spectrometry, Rapid Communications in Mass Spectrometry, 31, 47–58, https://doi.org/10.1002/rcm.7769, 2017.
Versteegh, G. J. M., Blokker, P., Marshall, C., and Pross, J.: Macromolecular composition of the dinoflagellate cyst Thalassiphora pelagica (Oligocene, SW Germany), Org. Geochem., 38, 1643–1656, 2007.
Wang, T., Bell, B. A., Fletcher, W. J., Ryan, P. A., and Wogelius, R. A.: Influence of common palynological extraction treatments on ultraviolet absorbing compounds (UACs) in sub-fossil pollen and spores observed in FTIR spectra, Frontiers in Ecology and Evolution, 11, 1096099, https://doi.org/10.3389/fevo.2023.1096099, 2023.
Watson, J. S., Fraser, W. T., and Sephton, M. A.: Formation of a polyalkyl macromolecule from the hydrolysable component within sporopollenin during heating/pyrolysis experiments with Lycopodium spores, Journal of Analytical and Applied Pyrolysis, 95, 138–144, https://doi.org/10.1016/j.jaap.2012.01.019, 2012.
Wickham, H.: ggplot2: Elegant Graphics for Data Analysis, Springer-Verlag New York, ISBN 978-3-319-24275-0, 2016.
Wickham, H., François, R., Henry, L., Müller, K., and Vaughan, D.: dplyr: A Grammar of Data Manipulation, R package version 1.1.4, https://CRAN.R-project.org/package=dplyr (last access: 16 April 2025), 2023a.
Wickham, H., Vaughan, D., and Girlich, M.: tidyr: Tidy Messy Data, R package version 1.3.0, https://CRAN.R-project.org/package=tidyr (last access: 16 April 2025), 2023b.
Wilke, C.: ggridges: Ridgeline Plots in 'ggplot2', R package version 0.5.6, Claus O. Wilke, https://cran.r-project.org/web/packages/ggridges/index.html (last access: 11 September 2025), 2025.
Yule, B. L., Roberts, S., and Marshall, J. E. A.: The thermal evolution of sporopollenin, Organic Geochemistry, 31, 859–870, https://doi.org/10.1016/S0146-6380(00)00058-9, 2000.
Zhu, L., Zhang, T., and Teeri, T. H.: Tetraketide α-pyrone reductases in sporopollenin synthesis pathway in Gerbera hybrida: Diversification of the minor function, Horticulture Research, 8, 207, https://doi.org/10.1038/s41438-021-00642-8, 2021.