the Creative Commons Attribution 4.0 License.
the Creative Commons Attribution 4.0 License.
 | 31 Jan 2025
Contrasting seasonal patterns in particle aggregation and dissolved organic matter transformation in a sub-Arctic fjord
Maria G. Digernes
Yasemin V. Bodur
Martí Amargant-Arumí
Oliver Müller
Jeffrey A. Hawkes
Stephen G. Kohler
Ulrike Dietrich
Marit Reigstad
Maria L. Paulsen
Particulate (POM) and dissolved (DOM) organic matter in the ocean are important components of the Earth's biogeochemical cycle. The two are in a constant state of dynamic change as a result of physical and biochemical processes; however, they are mostly treated as two distinct entities, separated operationally by a filter. We studied the seasonal transition of DOM and POM pools and their drivers in a sub-Arctic fjord by means of monthly environmental sampling and by performing experiments at selected time points. For the experiments, surface water (5 m) was either pre-filtered through a GF/F filter (0.7 µm) or left unfiltered, followed by 36 h incubations. Before and after incubation, samples were collected for dissolved and particulate organic carbon concentrations (DOC, POC), extracellular polymeric substances (EPSs), microbial community (flow cytometry), and molecular composition of DOM (high-performance liquid chromatography coupled to high-resolution mass spectrometry – HPLC-HRMS). During the biologically productive period, when environmental POC concentrations were high (April, June, September), the filtered water showed an increase in POC concentrations. While POC concentrations increased in September, DOM lability decreased based on changes in the average hydrogen saturation and aromaticity of DOM molecules. In contrast, during the winter period (December and February), when environmental POC concentrations were low, lower concentrations of POC were measured at the end of the experiments compared to at the start. The change in POC concentrations was significantly different between the biologically productive period and the winter period (t test; p<0.05). Simultaneously, the DOM pool became more labile during the incubation period, as indicated by changes in the average hydrogen saturation, aromaticity, and oxygen saturation, with implications for carbon cycling. The change in POC was not directly associated with an antagonistic change in DOC concentrations, highlighting the complexity of organic matter transformations, making the dynamics between POC and DOC difficult to quantify. However, in both periods, bacterial activity and EPS concentrations increased throughout the incubations, showing that bacterial degradation and physical DOM aggregation drive the transformations of POM and DOM in concert but at varying degrees under different environmental conditions.
- Article
(3632 KB) - Full-text XML
-
Supplement
(1480 KB) - BibTeX
- EndNote


Dissolved organic carbon (DOC) and particulate organic carbon (POC) play an important role in Earth's biogeochemical cycling, and their availability and variation are strongly driven by seasonal ecosystem dynamics. In the ocean, dissolved organic matter (DOM) makes up 97 % of total organic matter, while only 3 % is in particulate form (Hansell et al., 2009). Marine DOM is one of the largest stocks of organic carbon on Earth, contributing to long-term carbon storage in the ocean's interior. Particulate organic matter (POM) also aids in carbon sequestration by sinking to the seafloor and transporting carbon from the ocean surface (Iversen, 2023; Turner, 2015). POM (usually defined as being > 0.4–0.7 µm up to several millimeters in size) is mostly composed of protist cells, fecal pellets, biogenic leftovers such as mucilaginous feeding nets, and DOM that sticks together to form large marine snow aggregates. DOM and POM are separated operationally merely by size (nominal filter pore size between 0.2 and 0.7 µm; Carlson et al., 2015) and are often studied independently despite the constant dynamic change between the two fractions (He et al., 2016; Verdugo et al., 2004; Wells, 1998). DOM does not sink gravitationally; however, it can contribute to the export of biogenic carbon by means of downward mixing (Hopkinson and Vallino, 2005), aggregation to POM, or formation of a sticky matrix for particles (Engel et al., 2004; Hansell et al., 2009; Iversen, 2023; Wells, 1998). Consequently, DOM provides a particle source which is well known but often overlooked in ecosystem studies (Engel et al., 2004).
DOM is primarily generated and secreted by phytoplankton during their growth as they release 2 %–50 % of the photosynthetically fixed carbon as DOM (Thornton, 2014; Paulsen et al., 2018). DOM can also be produced by zooplankton during grazing and excretion, as well as by bacterial and viral processes, such as lysis and excretory release, and through the dissolution of particles (Carlson and Hansell, 2015; Riley, 1963; Wagner et al., 2020). Freshly produced labile DOM exhibits temporal fluctuations in accordance with the seasonal and spatial variations in phytoplankton abundance, microbial communities, and inorganic nutrient availability (Osterholz et al., 2014; Paulsen et al., 2019; Retelletti Brogi et al., 2019; Vernet et al., 1998). Labile DOM, which constitutes less than 1 % of the overall DOM reservoir, displays relatively short turnover times, typically ranging from hours to days (Hansell, 2013). Conversely, semi-labile and recalcitrant DOM persists in the ocean over more extended timescales, ranging from months to millennia (Flerus et al., 2012; Hertkorn et al., 2006). Efforts have been made to characterize the seasonal DOM pool; however, the bulk of DOM characterization studies are mostly conducted in spring and autumn (Flerus et al., 2012; Osterholz et al., 2014; Retelletti Brogi et al., 2019), and, thus, there is presently a need for winter DOM characterization studies.
Depending on physicochemical and biological conditions, DOM can undergo various transformations, such as aggregation, dissolution, adsorption, resorption, autoxidation, and (photo-)chemical and biological degradation (Carlson and Hansell, 2015). These transformations result in alterations to DOM molecular composition, abundance, and size, with implications for the ecosystem and the carbon cycle. DOM that is channeled through the microbial loop can be transformed to more recalcitrant forms (Jiao et al., 2010) or converted back to carbon dioxide, while particles that are formed through DOM aggregation can potentially sink and lead to carbon export. Dissolution of POM to DOM removes OM from the classical food web, decreases the particulate pool, leads to a longer turnover time of OM in the water column, and decreases the sinking potential. Despite the strong dependency of DOM and POM transformations on ecosystem processes, not much is known about changes in the DOM–POM continuum under contrasting environmental and seasonal conditions.
Precursor material such as colloids or gels act as the “gray zone” between the dissolved and the particulate fractions (Orellana and Leck, 2015). They can be characterized as high-molecular-weight (HMW) DOM (>1 kDa) but are also often quantified as particulate material as they can remain on filters due to their sticky, flexible properties. More than one-quarter of oceanic DOC can be in colloidal form (Kepkay, 1994). Transparent exopolymer particles (TEPs) are sticky gels formed from extracellular polymeric substances (EPSs) composed of carbohydrate-rich phytoplankton exudates (Passow et al., 1994; Passow, 2002b). Spontaneous assembly of smaller molecules can lead to the abiotic formation of gels (Chin et al., 1998; Passow, 2000). These processes can be triggered by small changes in ambient pH, ionic concentration, temperature, or light (He et al., 2016; Timko et al., 2015; Verdugo et al., 2004). Colloids or gels can aggregate to particulate matter through chemical coagulation or physical flocculation (Engel et al., 2004). These aggregated particles can form again after the filtration of seawater, indicated by the presence of POC in dissolved samples at filtration timescales (Riley, 1963; Sheldon et al., 1967; Valdes Villaverde et al., 2020; Xu and Guo, 2018), and their measurement often appears as an analytical artifact.
High-latitude ecosystems are characterized by a strong seasonality, creating contrasting environmental conditions (Petersen and Curtis, 1980). Arctic and sub-Arctic fjords can be periodic hotspots for biological productivity and locations of high carbon production, turnover, and export. With the beginning of spring, the return of sunlight and replenished nutrients in the upper water column fuel intense phytoplankton blooms and, with that, the production of fresh POM and DOM (Paulsen et al., 2018; Walker et al., 2022; Wetz and Wheeler, 2007). Spring is influenced by autochthonous labile DOM production composed of low oxygen and high hydrogen saturation (Hansell, 2013). Late spring and early summer are subject to high freshet, with allochthonous DOM inputs from river sources composed of oxygen-rich DOM compounds (Koch et al., 2005; Sleighter and Hatcher, 2008). Towards summer, nutrients become depleted at the surface, and the system is dominated by heterotrophic processes and increasing carbon turnover (Carlson et al., 2015; Repeta, 2015). With decreasing nutrient concentrations and increasing abundance of senescent cells, EPSs can be excreted at high concentrations and trigger flocculation events during post-bloom conditions in summer (Alldredge and Gotschalk, 1989; Engel, 2000; Hellebust, 1965; Mague et al., 1980; Mari and Burd, 1998; Myklestad, 1995; Passow, 2002a; Thornton, 2014). In autumn, DOM is converted to more recalcitrant compounds with lower hydrogen saturation (Osterholz et al., 2014), and there is a decrease in TEPs (von Jackowski et al., 2020). Autumn mixing in fjords can redistribute nutrients in the water column and fuel autumn blooms later in the year (Vonnahme et al., 2022). During winter, low-light conditions limit primary production, and the water column is subjected to an increase in vertical mixing. Organic matter concentrations are at their lowest during this period and are seemingly recalcitrant due to dissolved organic carbon accumulation (Hansell, 2013). However, microbial degradation of organic matter can still take place (Vonnahme et al., 2022; Wietz et al., 2021).
Studies of the DOM–POM continuum in aquatic environments have mostly been interpreted from either an ecological or a chemical point of view. We are aware of some studies based on laboratory and field observations in rivers (Attermeyer et al., 2018; Keskitalo et al., 2022), in permafrost thaw (Shakil et al., 2022), and on the Atlantic coast (Riley, 1963) and the Pacific coast (Sheldon et al., 1967), as well as studies that are focused on the associated changes in the DOM–POM continuum in boreal peatlands (Einarsdóttir et al., 2020) and rivers (Xu and Guo, 2018). The overarching aim of this study is to document the effect of DOM–POM processes under contrasting ecological conditions and to shed light on the involved processes. This is relevant in a highly seasonal and drastically changing Arctic, specifically to understand possible implications for the carbon cycle and carbon burial. We hypothesize that the biologically active period with higher POM and DOM concentrations has a higher potential for the aggregation of DOM in comparison to the winter period. To test the hypothesis, we closely followed the DOM and POM concentrations and characteristics, along with a range of environmental parameters, during a full annual cycle in the surface water of a sub-Arctic fjord. Additionally, we investigated the behavior of extracellular polymeric substances and its link to biological processes and DOM aggregation. We designed experiments to examine the partitioning between DOM and POM by incubating (1) filtered (0.7 µm) fjord water, where biological activity was strongly reduced and particles were removed, and (2) unfiltered water, where pre-formed gels, microorganisms, and other POM sources were kept under natural conditions. This allowed us to simultaneously obtain insights into the net aggregation processes in the filtered water and into the sum of the aggregation, dissolution, and biological processes in the unfiltered controls during contrasting seasons. We further aimed to understand (a) how the bioavailability of the vast DOM pool was affected by seasonal transformations of the POM pool and (b) how biological processes impacted the DOM–POM continuum.
2.1 Sampling of standard and experimental parameters
Fieldwork was conducted monthly in the mouth of an Arctic fjord close to Tromsø/Romsa in Ramfjorden/Gáranasvuotna (69°31′34′′ N, 19°1′33.0′′ E) between 16 September 2020 and 24 August 2021 with RV Hyas (Fig. 1). Ramfjorden is a sidearm of the larger Balsfjorden, which is influenced mainly by Norwegian Coastal Water and seasonally by the inflow of Atlantic Water in spring (Eilertsen et al., 1981). Ramfjorden receives allochthonous input mainly through the inflows from two rivers (Storelva and Sørbotnelva). During winter, the inner part of the fjord freezes and is covered by sea ice (O'Sadnick et al., 2020). Sampling for this study occurred in the mouth of the fjord, which was ice-free year-round. In the beginning of each sampling event, a CTD (conductivity, temperature, and depth) instrument equipped with fluorescence, oxygen, and turbidity sensors was deployed. Water samples were taken at 5 m depth with a GO-FLO (General Oceanics, 20 L). Due to lack of research vessel access in July, we sampled in the beginning and at the end of June (8 and 30 June 2021) and hence refer to these sampling events throughout the paper as “June” and “July”.
From the GO-FLO, 15 L was subsampled into a plastic canister for later processing in the lab every month (Fig. 2a–c) for the following biogeochemical parameters: Chlorophyll a (Chl a), total particulate matter and particulate inorganic matter (TPM and PIM), protist taxonomy, extracellular polymeric substances (EPSs), and flow cytometry (FCM). For dissolved organic matter (DOM) characterization, water from the same GO-FLO was subsampled into a separate acid-washed 3 L canister. Three triplicate samples for dissolved organic carbon (DOC) and total dissolved nitrogen (TDN) were taken with muffled glass vials, and samples for nutrients were taken with 50 mL falcon tubes directly from the GO-FLO. All tubing used was acid-cleaned prior to use, and sample containers were pre-rinsed with sample water before sampling.
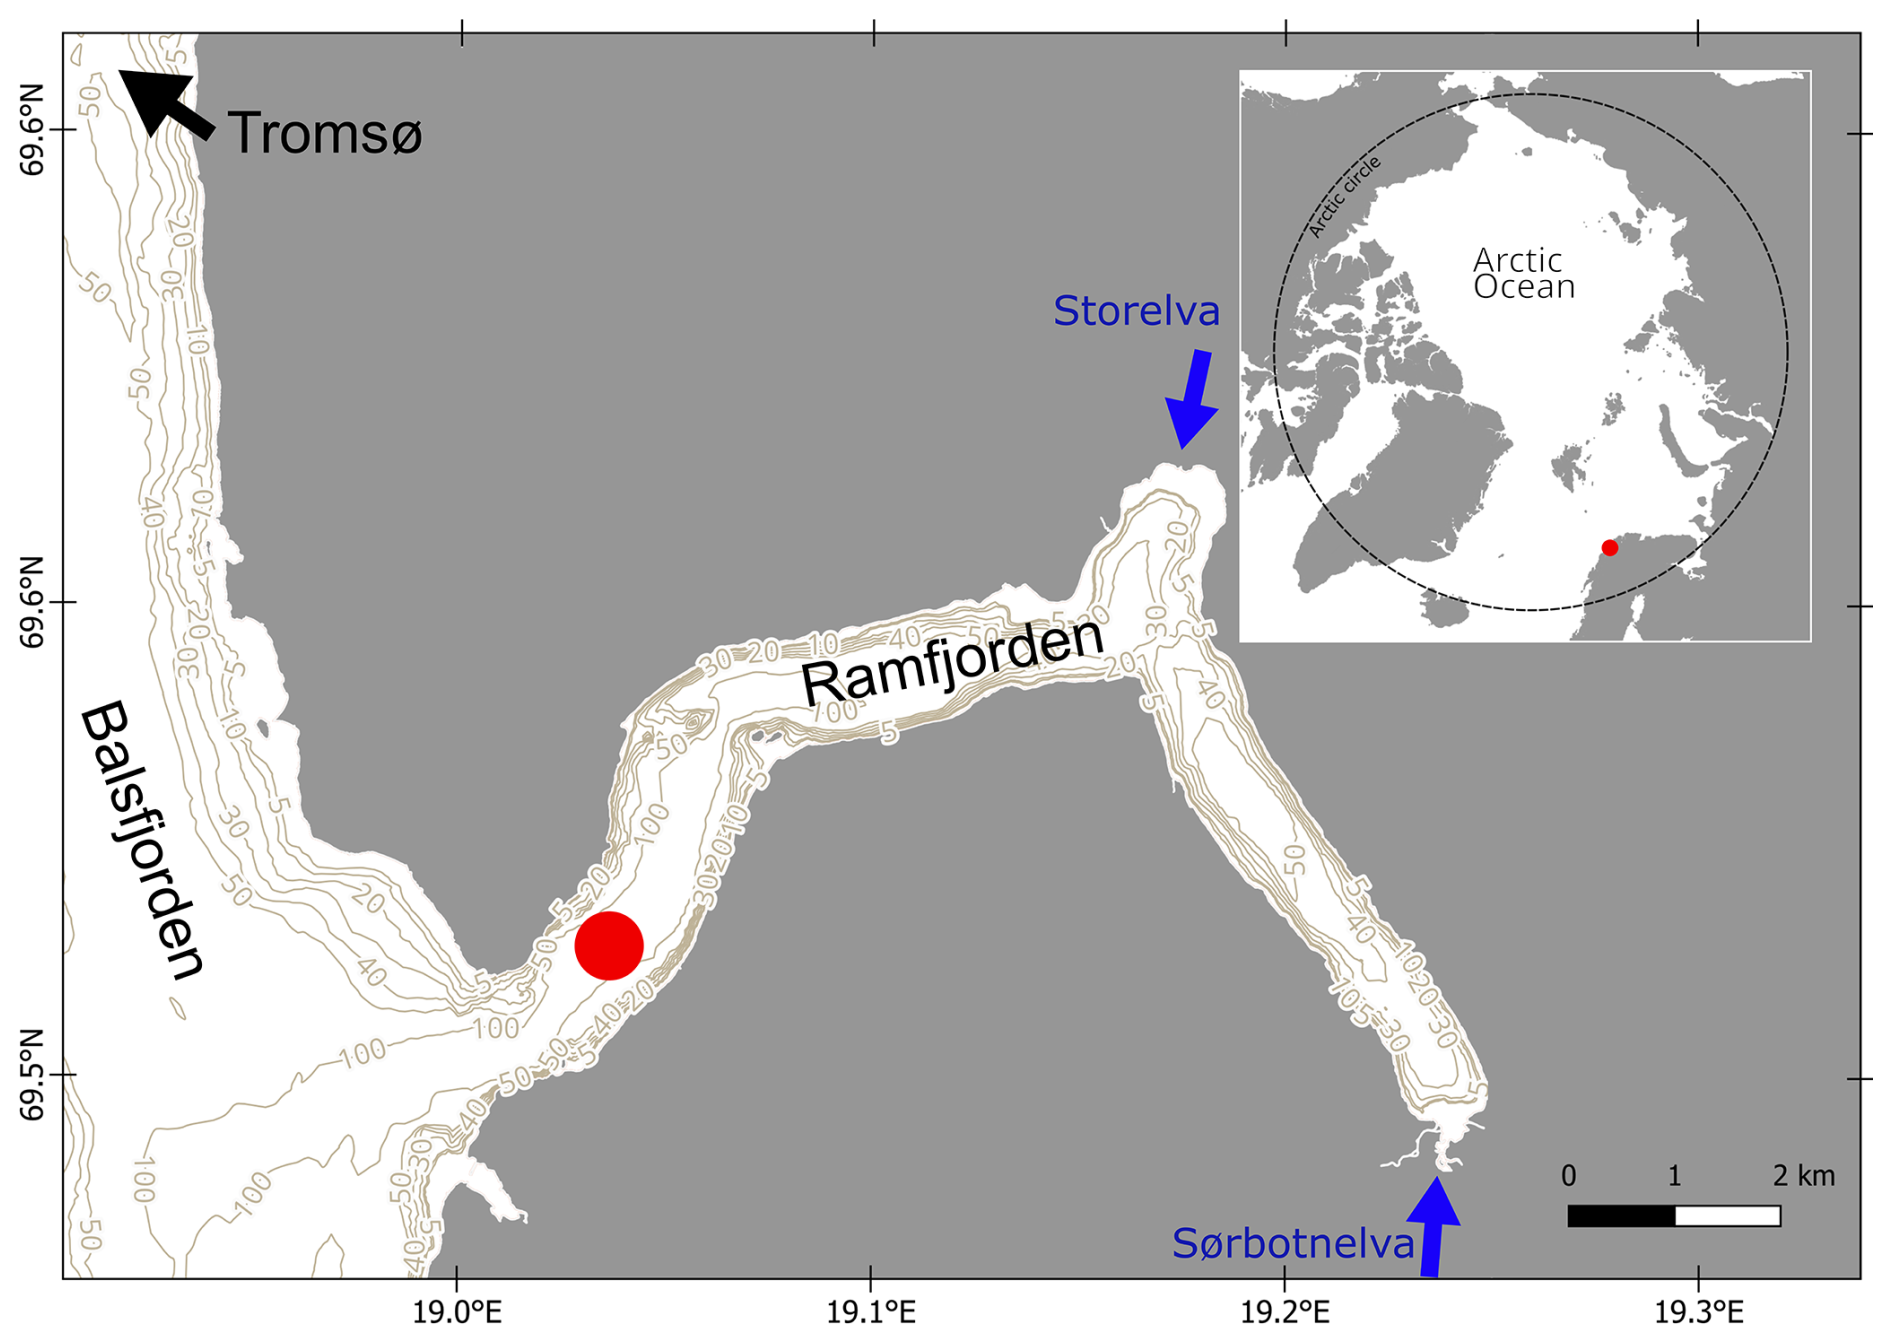
Figure 1Position of Ramfjorden/Gáranasvuotna within the Arctic Circle and sampling location (red dot) within the fjord. Land area and depth contours of Ramfjorden were retrieved from https://kartkatalog.geonorge.no (last access: 26 July 2022).
2.2 Aggregation experiment
To demonstrate seasonal contrasts of the aggregation potential of DOM in the fjord, experiments were conducted every 2 months (Fig. 2d–f). The water from three GO-FLOs was filtered through a 90 µm mesh to remove large grazers and was evenly distributed among three acid-washed 20 L canisters after being pre-rinsed with sample water through staggered filling. The canisters were covered with black plastic bags to minimize light exposure. After bringing them onshore, the canisters were stored in a controlled temperature room kept dark at 5 °C, where the experiments were carried out using headlamps with red light to reduce the possibility of biological production. Prior to each of the experiments, all surfaces and the floor in the cold room were washed with CitraNOX® acid detergent and distilled water to remove dust and to minimize carbon contamination. Any handling of the samples was carried out wearing microporous laminated clean suits (Tyvek®, DuPont, USA), and all used equipment and tubing were acid-rinsed (plastic equipment), combusted (glass equipment), or cleaned in an ultrasonic cleaner (metal equipment) prior to use.
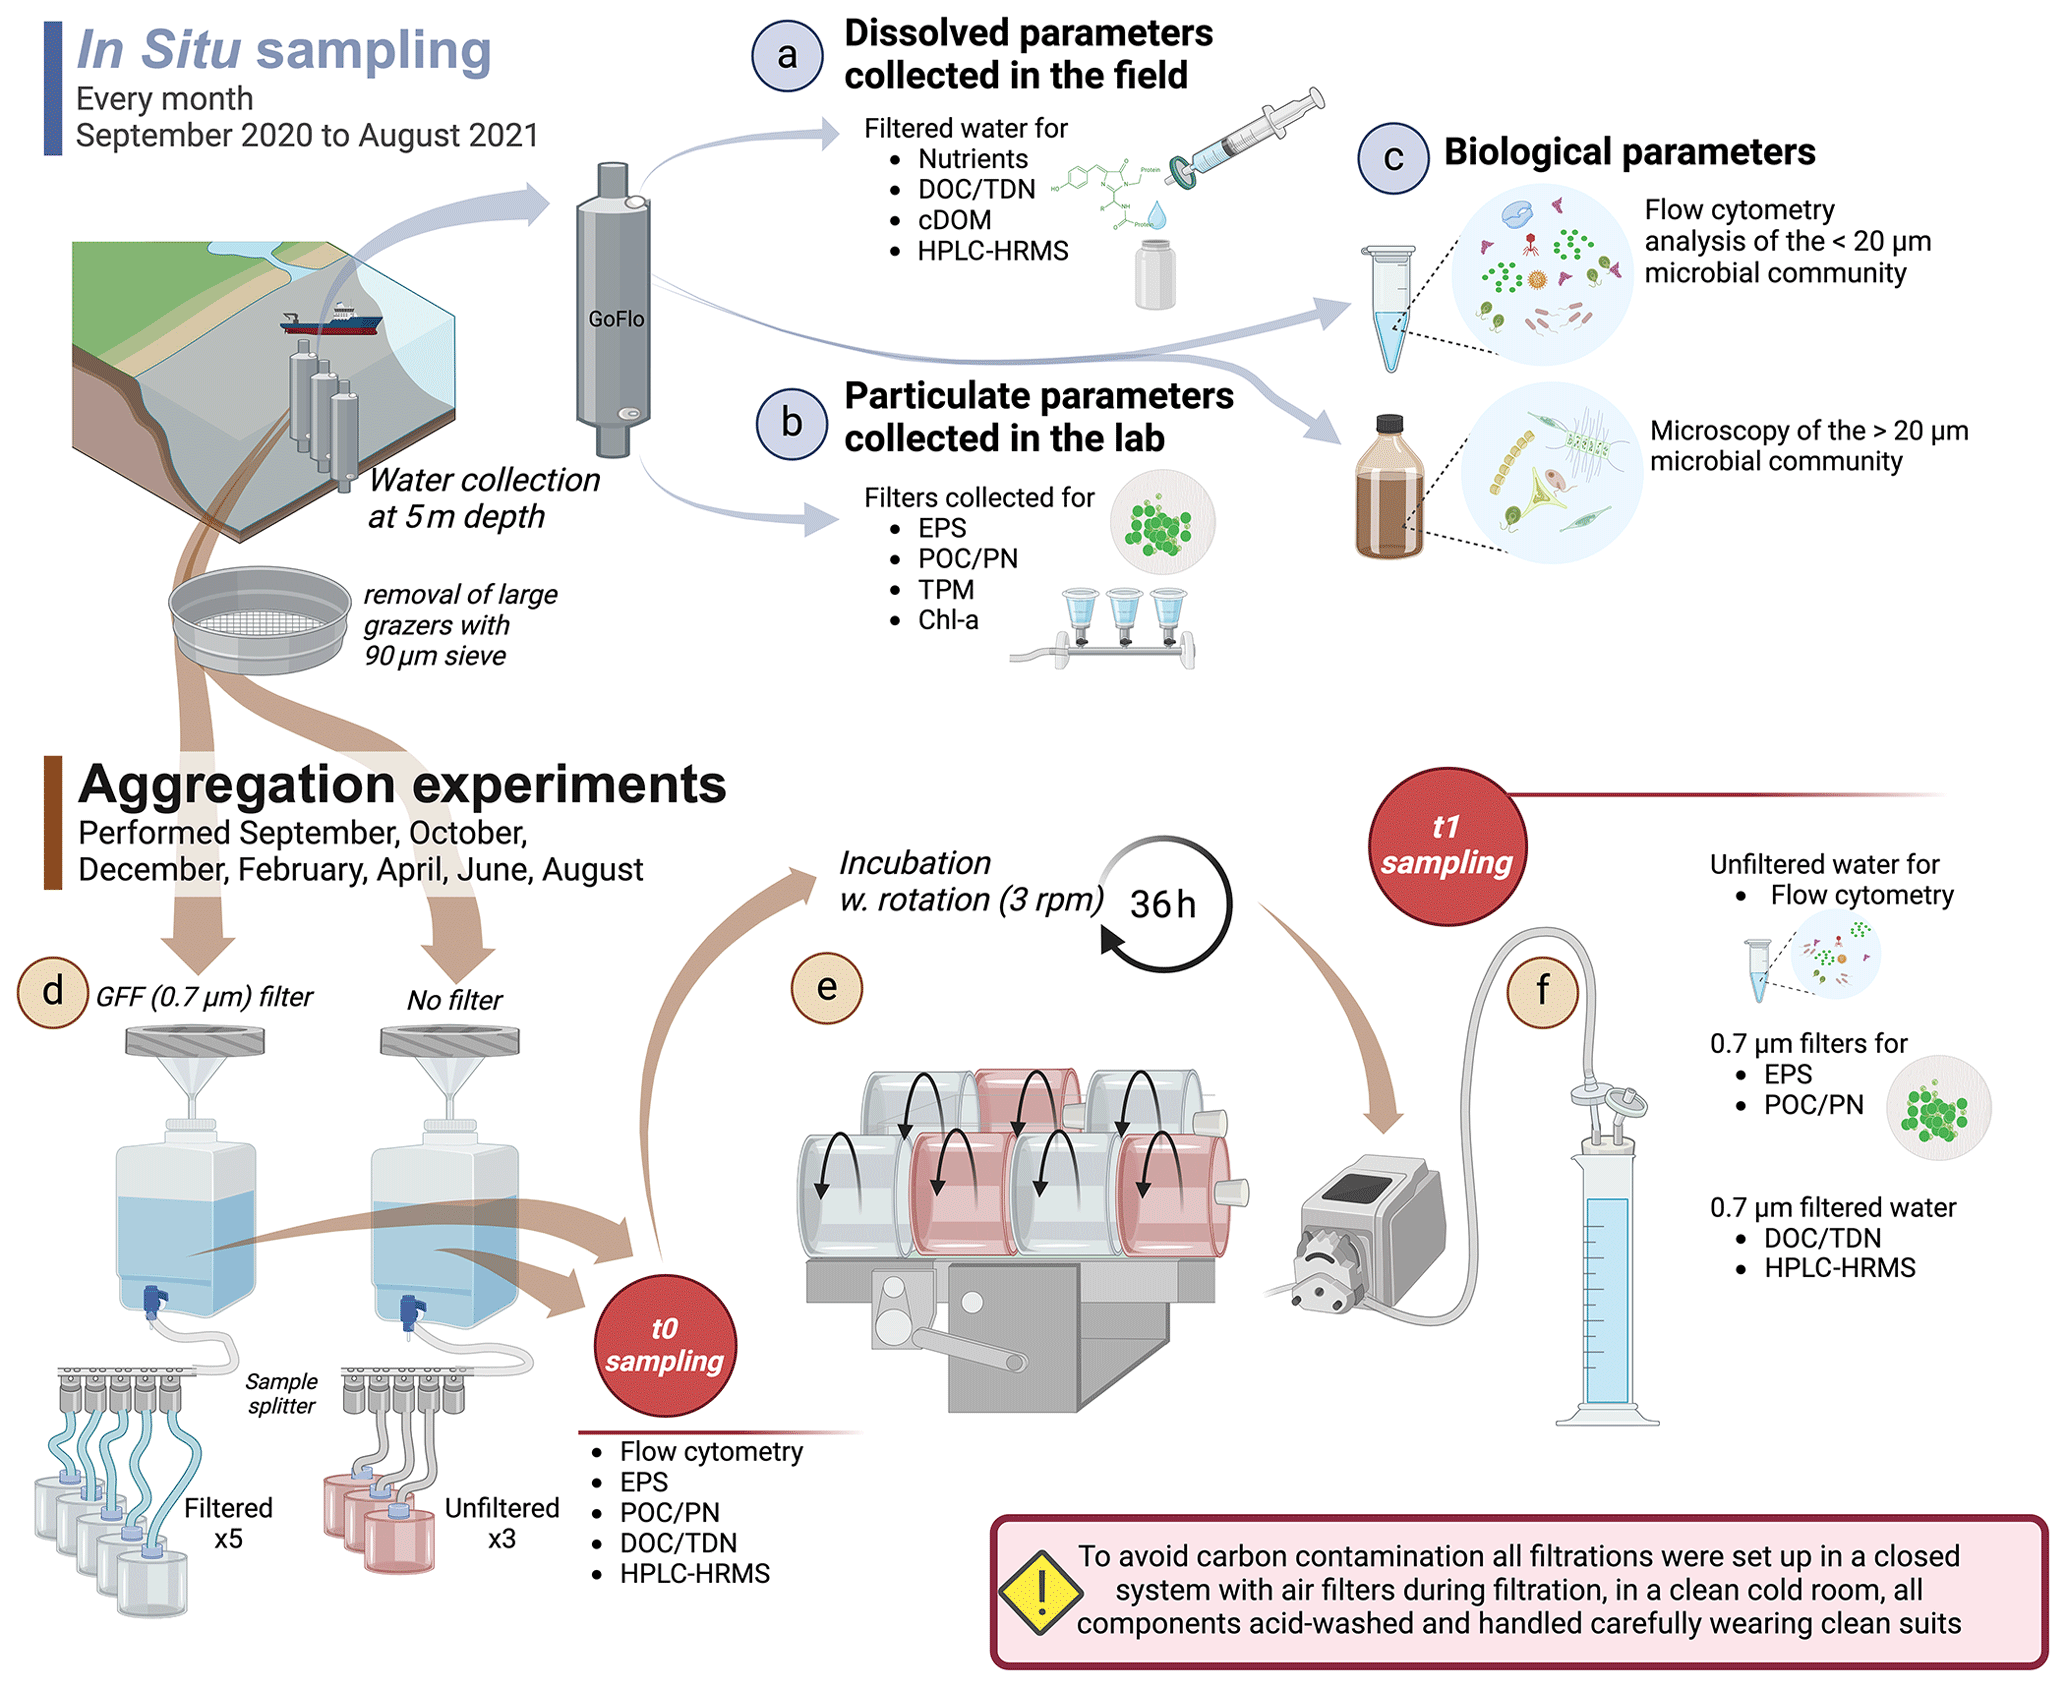
Figure 2Sampling scheme and experimental setup. Water was sampled with 20L GO-FLOs at 5 m depth, and the following standard parameters (STD) were collected: (a) nutrients, dissolved organic carbon (DOC), total dissolved nitrogen (TDN), dissolved organic matter characterization (HPLC-HRMS), and colored DOM (cDOM) were taken directly from the field; (b) filters for the analysis of extracellular polymeric substances (EPSs), particulate organic carbon and particulate nitrogen (POC and PN), total particulate matter (TPM), and Chlorophyll a (Chl a) were collected in the lab; and (c) water samples were preserved for protist taxonomy and flow cytometry (FCM). The experimental water was collected from 3 × 20 L GO-FLOs, funneled through a 90 µm sieve and distributed equally among three canisters. The experiment was set up as in (d): the experimental water was channeled through a pressure filtration system with a GF/F filter (filtered; F) and without a GF/F filter (unfiltered; UF), and then samples for EPSs, FCM, DOM, DOC, TDN, and POC were taken. Afterwards, the F and UF water were distributed evenly among roller tanks with a sample splitter. (e) During a 36 h incubation period, the tanks were rolled at 3 rpm. (f) After the termination of the incubation, each tank was subsampled for EPSs and FCM. Subsequently, the tanks were connected to a peristaltic filtration system with in-line filters that were used for the sampling of POC. The filtrate was collected in graduated cylinders, which was then subsampled for DOC and DOM characterization.
The water from two canisters was pressure filtered through a single layer (September, October, December) or a double layer (February, April, June) of pre-combusted GF/F filters (0.7 µm, Whatman; diameter: 130 mm), placed on an acid-washed plexiglass filter holder, and collected in another canister (filtered, F; Fig. 2d). The effect of a double or a single layer on POC concentrations was tested in January; for the results and a short discussion, see Fig. S1 in the Supplement. To compare the aggregation behavior of the filtrate to the behavior of the seasonally changing natural unfiltered water, we left the water from the third canister unfiltered (UF). The water from the third canister was streamlined through the filtration system in the same way but without a filter to account for possible hydraulic stress during the filtration procedure and to treat the UF samples in the same way as filtered treatment samples. Filtered treatment (F) samples were collected for POC and PN, EPSs, FCM, DOC, and DOM characterization immediately after this step (t0 samples). UF treatment samples for t0 were collected for POC and PN, EPSs, and FCM. It should be noted that, for DOC and DOM characterization, UF treatment at t0 was equivalent to F treatment at t0. Also, in September, the triplicate field samples of DOC were used as t0. Subsequently, the F and UF water was distributed evenly into cylindrical plexiglass tanks (self-manufactured, 1.8 L, 18 cm inner diameter, 6 cm height) by using a splitter. The tanks were filled to the top, and air bubbles were removed before they were closed with silicone stoppers. Eight tanks (three UF and five F) were placed on two rolling tables in a randomized order and were rolled for 36 h at 3 rpm to ensure a homogenized distribution of the waterbody throughout incubation (Fig. 2e).
After 36 h, incubation was stopped, and samples (t1) were taken from each tank for EPSs and FCM after gently homogenizing the tanks by turning them slowly 20 times. Afterwards, all tanks were connected, airtight (to minimize contamination), to a peristaltic filtration system where GF/F (Whatman, 0.7 µm, pre-combusted) filters were connected in-line, and the filtrate was collected in acid-washed and equally airtight graduated cylinders (Fig. 2f). After rinsing the whole system and the graduated cylinders with sample water, the filters were replaced, and the subsequently collected filtrate was used for the subsampling of DOC and DOM. After each tank was emptied completely, the filters were collected for POC and PN analyses in the following way: the tubing of the lower part of the filter holder was removed, and any excess water in the tubing or in the filter holder was sucked into the filter with a syringe. Subsequently, the dry filters were folded, packed into pre-combusted aluminum foil, and frozen at −20 °C. The exact volume used for the subsampling of all the parameters was read from the graduated cylinders. EPSs, FCM, DOC, DOM, and POC and PN were analyzed as described in the following section.
After the experiment was finalized, all used equipment was soaked in acid for several hours, rinsed three times with Milli-Q, dried in a drying oven at 60 °C, and finally stored in airtight zip bags or boxes until the next sampling to prevent carbon contamination.
2.3 Processing of samples
In situ samples for particulate organic carbon (POC) and particulate nitrogen (PN) were filtered in triplicates, and experimental samples, as described in Sect. 2.2, were placed onto pre-combusted GF/F filters (0.7 µm, Whatman), packed in combusted aluminum foil, and frozen at −20 °C. POC samples were dried for 24 h at 60 °C, subsequently acid-fumed (HCl) in a desiccator for 24 h to remove all inorganic carbon, and finally dried again for 24 h at 60 °C. The filters were transferred into tin capsules and measured with a CE440 CHN Elemental Analyzer (Exeter Analytical), and acetanilide was used as the standard.
Samples for the colorimetric determination of extracellular polymeric substances (EPSs) were taken in situ between November 2018–September 2019 and then again between February–August 2021 in situ and for the experiment. We measured EPSs instead of transparent exopolymer particles (TEPs) because the EPS measurement has a higher detection accuracy for all carbohydrates in a sample (including TEP + TEP precursors) compared to the Alcian blue method following Passow and Alldredge (1995; Bittar et al., 2018; Li et al., 2018). The sampled water (150 mL) was filtered onto 0.4 µm polycarbonate filters. Following the colorimetric method by Dubois et al. (1956), a mixture of phenol and concentrated sulfuric acid was used to extract material from the filter to determine total carbohydrates in the sample. A spectrophotometer (UV-6300PC, VWR) was used to measure the absorbance of the solution at 485 nm. Since concentrations were too low to be calculated reliably with a standard curve against xanthan gum concentrations, relative EPS concentrations are depicted as “absorption at 485 nm”.
Flow cytometry was used for the determination of bacteria, virus, pico- and nano-sized phytoplankton abundances in situ and in the experiment. Unfiltered samples of 5 mL were fixed in duplicates with glutaraldehyde (0.5 % final concentration) and frozen at −80 °C until analysis within 3 months. The samples were thawed, and pico- and nanophytoplankton were analyzed directly on an Attune® acoustic focusing flow cytometer (Applied Biosystems by Life Technologies). The populations of phytoplankton were grouped based on their pigmentation on biplots of green vs. red fluorescence. Before counting bacteria and viruses, the DNA was stained with SYBR Green I, and groups were discriminated on biplots of side scatter vs. green fluorescence. Actively dividing bacterial cells contain more DNA; therefore, the ratio of high-nucleic-acid (HNA) bacteria to low-nucleic-acid (LNA) bacteria is used here as an indicator of the relative activity of the bacterial community. The following conversion factors were used to convert various microorganism groups into carbon (pg C cell−1): bacteria (0.02), Synechococcus sp. (0.29), pico-eukaryotes (0.57), and nanophytoplankton (7).
Samples for dissolved organic carbon (DOC) and total dissolved nitrogen (TDN) were filtered on GF/F filters (0.7 µm, Whatman, pre-combusted) and were acidified to a pH of 2 (HCl, double-distilled, AnalaR NORMAPUR, VWR chemicals). Samples were stored at 6 °C until analysis. DOC and TDN determination was executed via a high-temperature catalytic oxidation method using a total organic carbon analyzer (TOC-L CPH/CPN™, Shimadzu). Potassium hydrogen phthalate (KHP, Merck) was used for external calibration. Seawater reference samples from the University of Miami (Hansell Laboratory) were analyzed throughout sample runs (repeatability >95 %, n=78).
In situ nutrient samples were syringe-filtered through a 0.2 µm filter upon arrival onshore, the filtrate was collected in a second falcon tube, and the samples were immediately frozen at −20 °C until further analysis. Concentrations of dissolved silicate, nitrate, nitrite, and phosphate were measured with a QuAAtro nutrient analyzer (SEAL Analytical).
For the determination of in situ total particulate matter (TPM), particulate inorganic matter (PIM), and particulate organic matter (POM), part of the water from the 15 L canister was filtered in triplicates through pre-combusted and pre-weighted GF/F filters (0.7 µm, Whatman). After filtration, the filters were placed on a pre-combusted aluminum dish and dried for 24 h at 60 °C in a drying oven. The dry weight was measured on a microscale (METTLER TOLEDO MX5) to obtain the weight of TPM, and this was subsequently combusted in the muffle oven at 450 °C for 7 h. Finally, the samples were weighed again to obtain the weight of the remaining inorganic material on the filters. POM was calculated from the difference between the dry weight (TPM) and the combusted weight (PIM) of the material.
For the determination of Chl a and phaeopigments, water was filtered in triplicates through GF/F filters (0.7 µm, Whatman). To quantify the contribution of large (>10 µm) photosynthetic cells, one sample was filtered through a 10 µm polycarbonate filter. Immediately after filtration, the filters were extracted in 100 % methanol at 4 °C and in darkness for between 12–24 h. Afterwards, the samples were measured with a pre-calibrated Turner Trilogy fluorometer before and after acidification with 5 % HCl (Parsons et al., 1984). In May, samples were measured with a pre-calibrated Turner AU-10 fluorometer. Ratios of Chl a to phaeopigment were calculated as an indicator of the degradation state of the algal material.
For the in situ determination of protist taxonomy (microphytoplankton and heterotrophic protists), 100 mL was filled into a brown glass bottle and fixed with a mixture of glutaraldehyde-lugol for subsequent identification and counting. Protists were identified to the lowest possible taxonomic level, verified through the World Register of Marine Species (WoRMS) and counted with an inverted light microscope (Nikon Eclipse TE-300 and Ti-S) using the Utermöhl method (Edler and Elbrächter, 2010; Utermöhl, 1958).
2.4 DOM sample processing
DOM extraction was performed using solid-phase extraction (SPE) following the procedure of Dittmar et al. (2008), with the addition of pre-soak of SPE sorbent with methanol (HiPerSolv CHROMANORM, 99.8 % VWR chemicals) 4–6 h prior to extraction. Fjord water samples were filtered (GF/F Whatman, 0.7 µm, pre-combusted) and acidified (pH 2 with HCl, double-distilled, AnalaR NORMAPUR, VWR chemicals). Filtered and acidified samples (1 L) were extracted (at 15 mL min−1) with a modified styrene-divinylbenzene polymer sorbent (500 mg PPL, Agilent Bond Elut™), and 0.1 % formic acid (HiPerSOLV CHROMANORM VWR chemicals) was used for salt removal. Final elution was achieved using methanol (HiPerSOLV CHROMANORM, 99.8 % VWR chemicals) and was stored at −20 °C in the dark. SPE–DOC recovery was processed by evaporating methanol extracts and redissolving in ultrapure water (31 %–85 % DOC recovery F treatment; Fig. S9). Procedural blanks were processed using ultrapure water (HiPerSOLV CHROMANORM®, VWR chemicals) and followed the same procedure as samples.
2.4.1 Mass spectrometry analysis
DOM samples were analyzed by means of high-performance liquid chromatography coupled to high-resolution mass spectrometry (HPLC-HRMS). Liquid chromatography was performed using an Agilent 1100 Series system with a polar C18 column (Kinetex®, 2.1 × 150 mm, 2.6 µm bead size, 100 Å pore size) with mobile phase A (0.1 % formic acid in LCMS-grade water) and mobile phase B (0.1 % formic acid in 80 : 20 acetonitrile : LCMS-grade water ()). Samples were diluted in 5 % acetonitrile solution (LiChrosolv, Merck) and 20 µL was injected at an initial flow rate of 150 µL min−1 with mobile phase A at 95 % and mobile phase B at 5 %. After 10 min, the acetonitrile mobile phase B was increased to 95 % for 2 min and then was decreased to 5 %, where it was held to be isocratic until 15 min. Mass spectrometric analysis was completed via an LTQ Velos Pro Orbitrap MS (Thermo Scientific, Germany) using an electrospray ionization source (ESI) operating in negative mode (spray voltage: −3.1 kV, capillary temperature: 275 °C). Blanks consisting of mobile phase A were injected periodically between samples. Each spectrum was internally calibrated in lock mass mode using three expected compounds, namely capsaicin, fusidic acid sodium, and glycyrrhizic acid ammonium salt, with 304.1921, 515.3378, and 821.3965 negative , respectively, providing suitable accuracy and precision (<1 ppm) in the mass range of 150–800. Data were collected at a resolution mode of 100 000. More detailed instrumentation parameters are reported elsewhere (Fonvielle et al., 2023).
2.4.2 DOM data processing
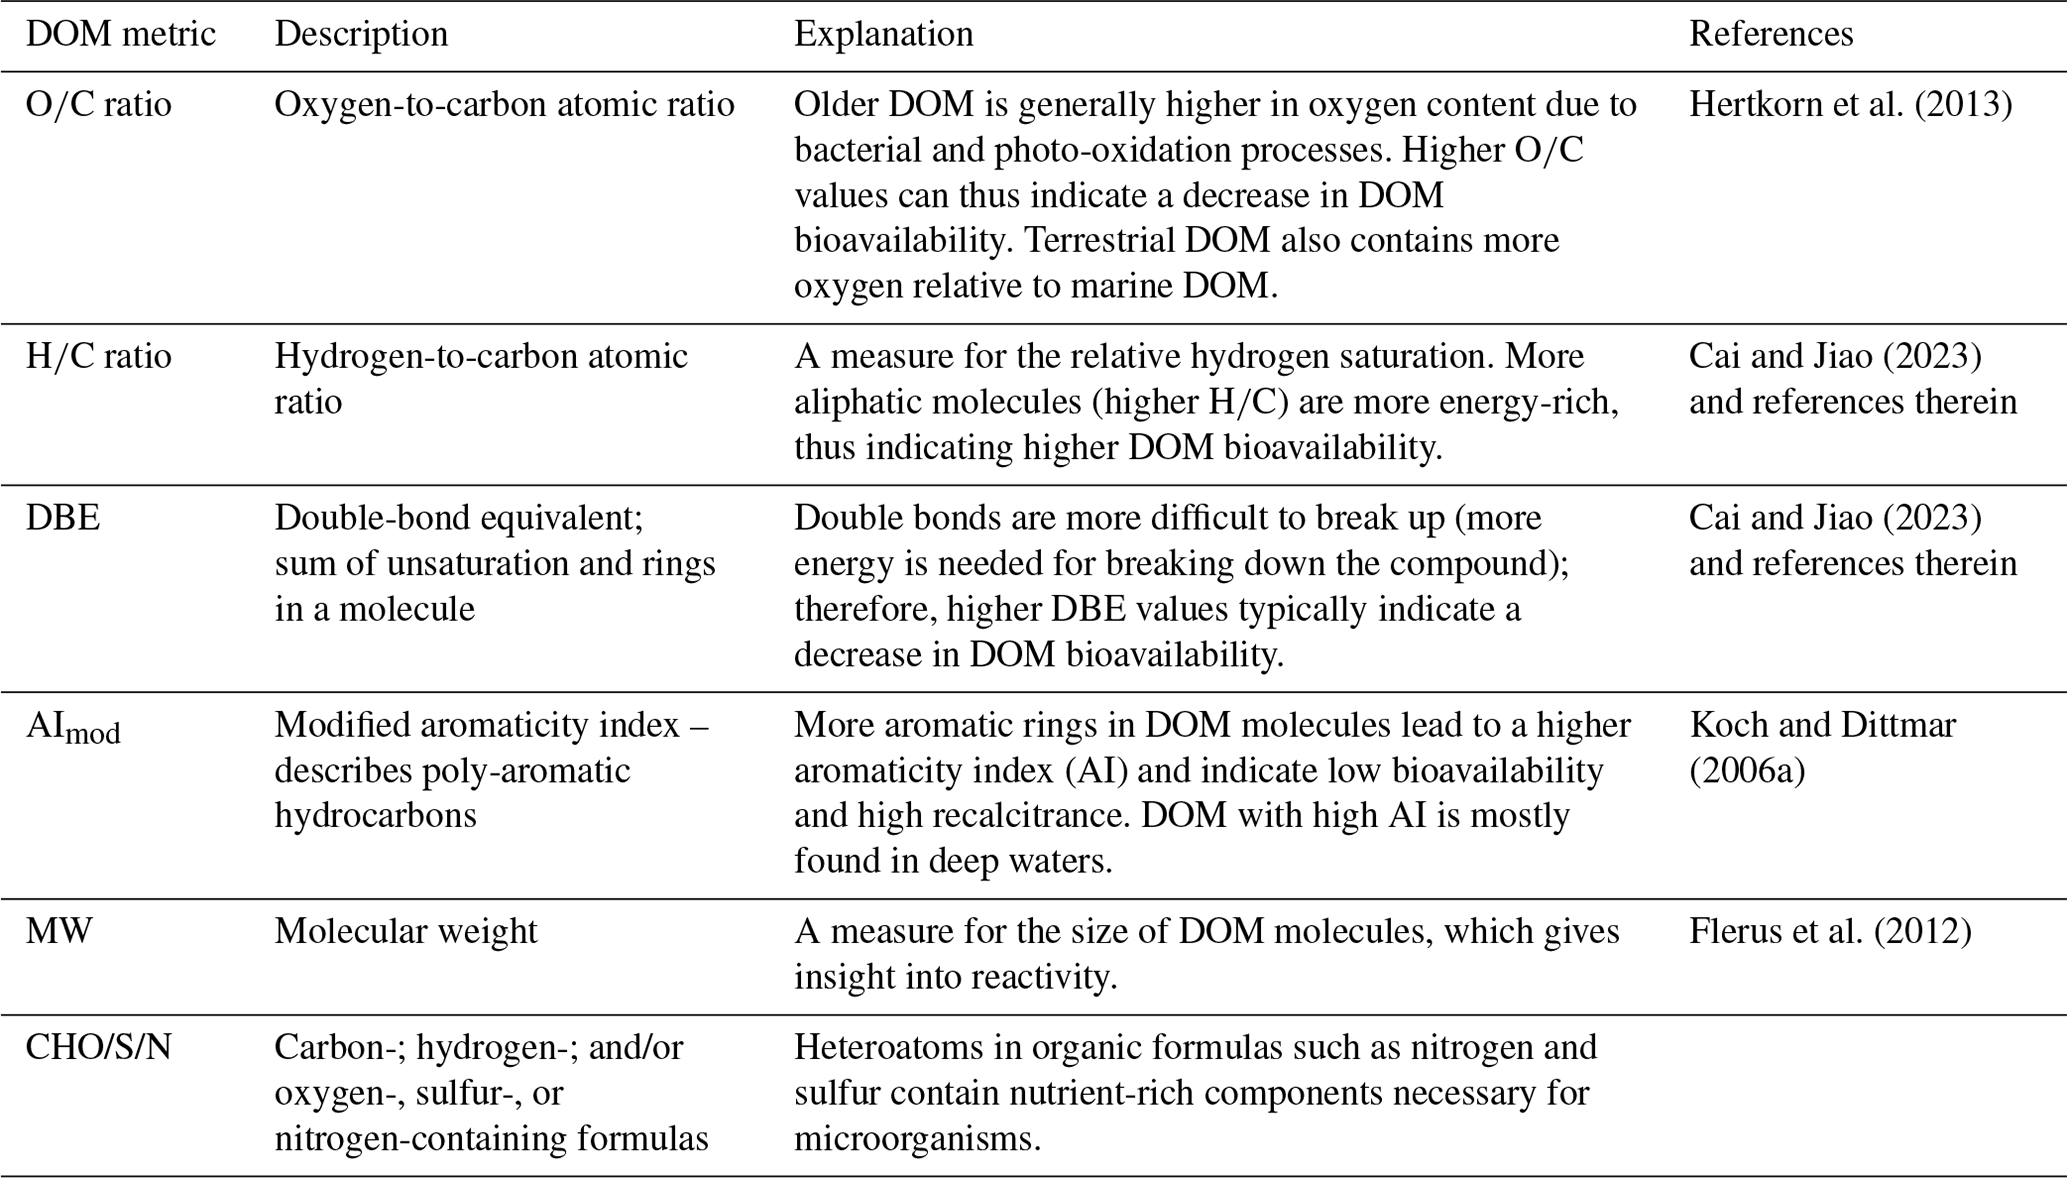
Mass spectrometry data were exported from the mass spectrometer and converted to mzXML files with ReAdW and then were processed further using MATLAB (version 2019b). A MATLAB routine was developed in-house and is available with raw mzXML files. Molecular formulas were assigned between 150–800 Da masses. Formulas were limited with the following criteria: carbon of 4–50, hydrogen of 4–100, oxygen of 2–40, nitrogen of 0–2, sulfur of 0–1, = 0.3 to 2.2, = 0 to 1, and double-bond-equivalent oxygen (DBE-O) = −10 to 10. In addition, the valence electron needed to be equal to an even number, and formulas which contained both nitrogen and sulfur, 13C and nitrogen, or sulfur and 13C were removed. A mass error of 0.7 ppm was allowed for formula assignment. Peak intensities with formula assignments were normalized to sum up to 1×10⁶ for each sample. Further descriptions for the different DOM parameters are given in Table 1. Compounds known as terrestrial peaks (referred to as “t-Peaks”), commonly found in rivers (Medeiros et al., 2016), are identified in our experimental mass spectrometry data by matching their molecular formulas and molecular masses to those of reported t-Peaks.
2.5 Statistical analyses
To visualize the seasonal biogeochemical cycle in Ramfjorden, a principal component analysis (PCA) was performed on standardized biological (POC, POC and PN, protist abundance and biomass, FCM data, Chl a) and environmental (temperature, salinity) variables which were available for all months (except November) between September 2020 and August 2021. Subsequently, a similarity profile routine (SIMPROF) analysis (Clarke et al., 2008) was applied to the same dataset to identify significant clusters of the sampling months (significance α level = 0.05) based on the biogeochemical parameters. This allowed us to divide the seasonal cycle in Ramfjorden into distinct biogeochemical periods without prior grouping of the samples. To test our main hypothesis on whether biologically active periods with higher POM concentrations have a higher potential for aggregation of DOM in comparison to the winter period, we performed a t test on the difference (t1−t0) in experimental POC concentrations between the two biogeochemical periods delineated by the SIMPROF test (“winter” and “productive” period).
Statistical analyses were performed with the computing environment R (version 4.2.2) (R Core Team, 2018), with MATLAB (version 2019b), and with the software Past 4 (version 4.14, 2022; Hammer et al., 2001).
The equation for the weighted average for DOM metrics (, , AImod wa, MWwa) is shown below. Here, Ii is the signal normalized intensities for a given formula, Ai represents the DOM metric value for that formula, and F is the total number of formulas per sample.
The standard deviation shown in Table 2 is calculated for the mean DOM metric in each treatment. Here, wai is the intensity weighted average for each sample, N represents the total number of samples per treatment, and is the sampling mean for the treatment.
Additionally, the weighted standard deviation (SDw) for compounds in each sample is estimated using the following equation and is shown in Table S2. Normalized intensities for a given formula are represented by Ii. The DOM metric value is represented by Ai, and F is the total number of formulas per sample. The weighted average (wa) equation is the same as in Eq. (1).
The standard error of a single mean's true estimated value (and not the distribution of the population, which is estimated by the SD) is approximated with the standard error of the mean (SEM), using the following equation, where the weighted standard deviation SDw is divided by the square root of the number of identified formulas F.
The following equation is used for calculating the standard error of the difference in means () between treatments, as shown in Table 2. Here, the standard deviations are divided by the number of samples N for each treatment.
3.1 The seasonal biogeochemical cycle in Ramfjorden
In winter, fluorescence was low throughout the whole water column (0.7–1 RFU, where RFU denotes relative fluorescence units), and density, turbidity, and oxygen saturation did not show changes with depth (Fig. S3). PIM values were slightly higher in the winter months (around 0.5 µg mL−1 between October–February, except for December) compared to the rest of the year (0.12–0.32 µg mL−1; Fig. S2a1). Nutrients increased from November onwards and peaked in March: from 2.75 to 6 µM (nitrate), from 0.2 to 0.5 µM (phosphate), and from 2.1 to 4.6 µM (silicate; Fig. S2g–i). By contrast, nitrite peaked in October with 0.1 µM, decreased until January (0.05 µM), and increased again until April (0.08 µM). Chl a phaeopigment values were lowest in December and January and started to increase already in March (Fig. S2w). In April, DOC, fluorescence, turbidity, TPM, POC, Chl a, protist abundance, bacterial abundance and activity, and nano- and pico-phytoplankton abundances increased sharply, along with a strong drawdown of nutrients (nitrate: 0.4 µM, phosphate: 0.1 µM, silicate: 1.5 µM; Fig. S2). Nitrite followed this trend later in May (0.03 µM; Fig. S2f). Hereafter, nutrient concentrations remained low (nitrate < 1 µM, phosphate < 0.3 µM) throughout the summer. In April, over 80 % of the total Chl a was > 10 µm. Chl a and POC decreased in May (0.9 mg m−3 and 10 µM, respectively), coinciding with a sharp peak in virus abundance, but increased again in June (6.62 mg m−3 and 35 µM, respectively) when bacterial abundance and activity were also highest. DOC and Chl a phaeopigments followed this trend. DOC peaked in August (233 µM). Another, lower peak in Chl a and POC was observed in September (4.4 mg m−3 and 18 µM, respectively). POC made up less than 17 % of the total OC during the whole year, with the highest percentages in June, July, and September. ratios were highest in March (>10) and lowest in April (∼ 5; Fig. S2z). Between May and October, rations remained comparable.
For most of the year, the microphytoplankton community was dominated by the diatom genus Chaetoceros (Fig. S2x). In April, communities were dominated by both Chaetoceros sp. and the prymnesiophyte Phaeocystis pouchetii (up to 4×10⁵ cells mL−1); in June, they were dominated by by Chaetoceros filiformis and by the genera Thalassiosira and Pseudo-nitzschia; and in July, they were mainly dominated by Pseudo-nitzschia. Unidentified flagellates and Chaetoceros laciniosus dominated in August, while September was dominated by ciliates (especially Strombidium conicum) and various dinoflagellates that can be mixotrophs. The contribution of picophytoplankton was relatively low, with the highest abundance of Synechococcus sp. being observed in autumn (maximum of 15 000 cells mL−1, Fig. S2r), while the highest abundance of picoeukaryotes was observed in April (9000 cells mL−1).
The PCA based on the described environmental and biological variables shows a clear seasonal pattern in Ramfjorden (Fig. 3a). Along PC1, which explained 51.28 % of the total variance, a clear distinction between winter–autumn–spring was present. During winter, there were elevated levels of nutrients and ratios, with the highest concentrations of silicate and phosphate occurring prior to the bloom in March. In April, POC levels, bacterial activity (HNA LNA), and protist abundance reached their peak with the onset of the spring bloom. The second peak in June was characterized by the highest bacterial abundance and high Chl a phaeopigment ratios. Along the second PC axis (explaining 17.3 % of the variance), spring and winter were separated from summer and autumn (August, September, October). Here, the biological production became increasingly regenerated and was characterized by the highest virus abundances, bacteria with low HNA LNA, and dead phytoplankton. During this time, the water temperatures were highest (Fig. S3), and nitrite concentrations exhibited a peak (Fig. S2f). Moreover, salinity was lowest, most likely due to increased runoff from land and precipitation (Fig. S3).
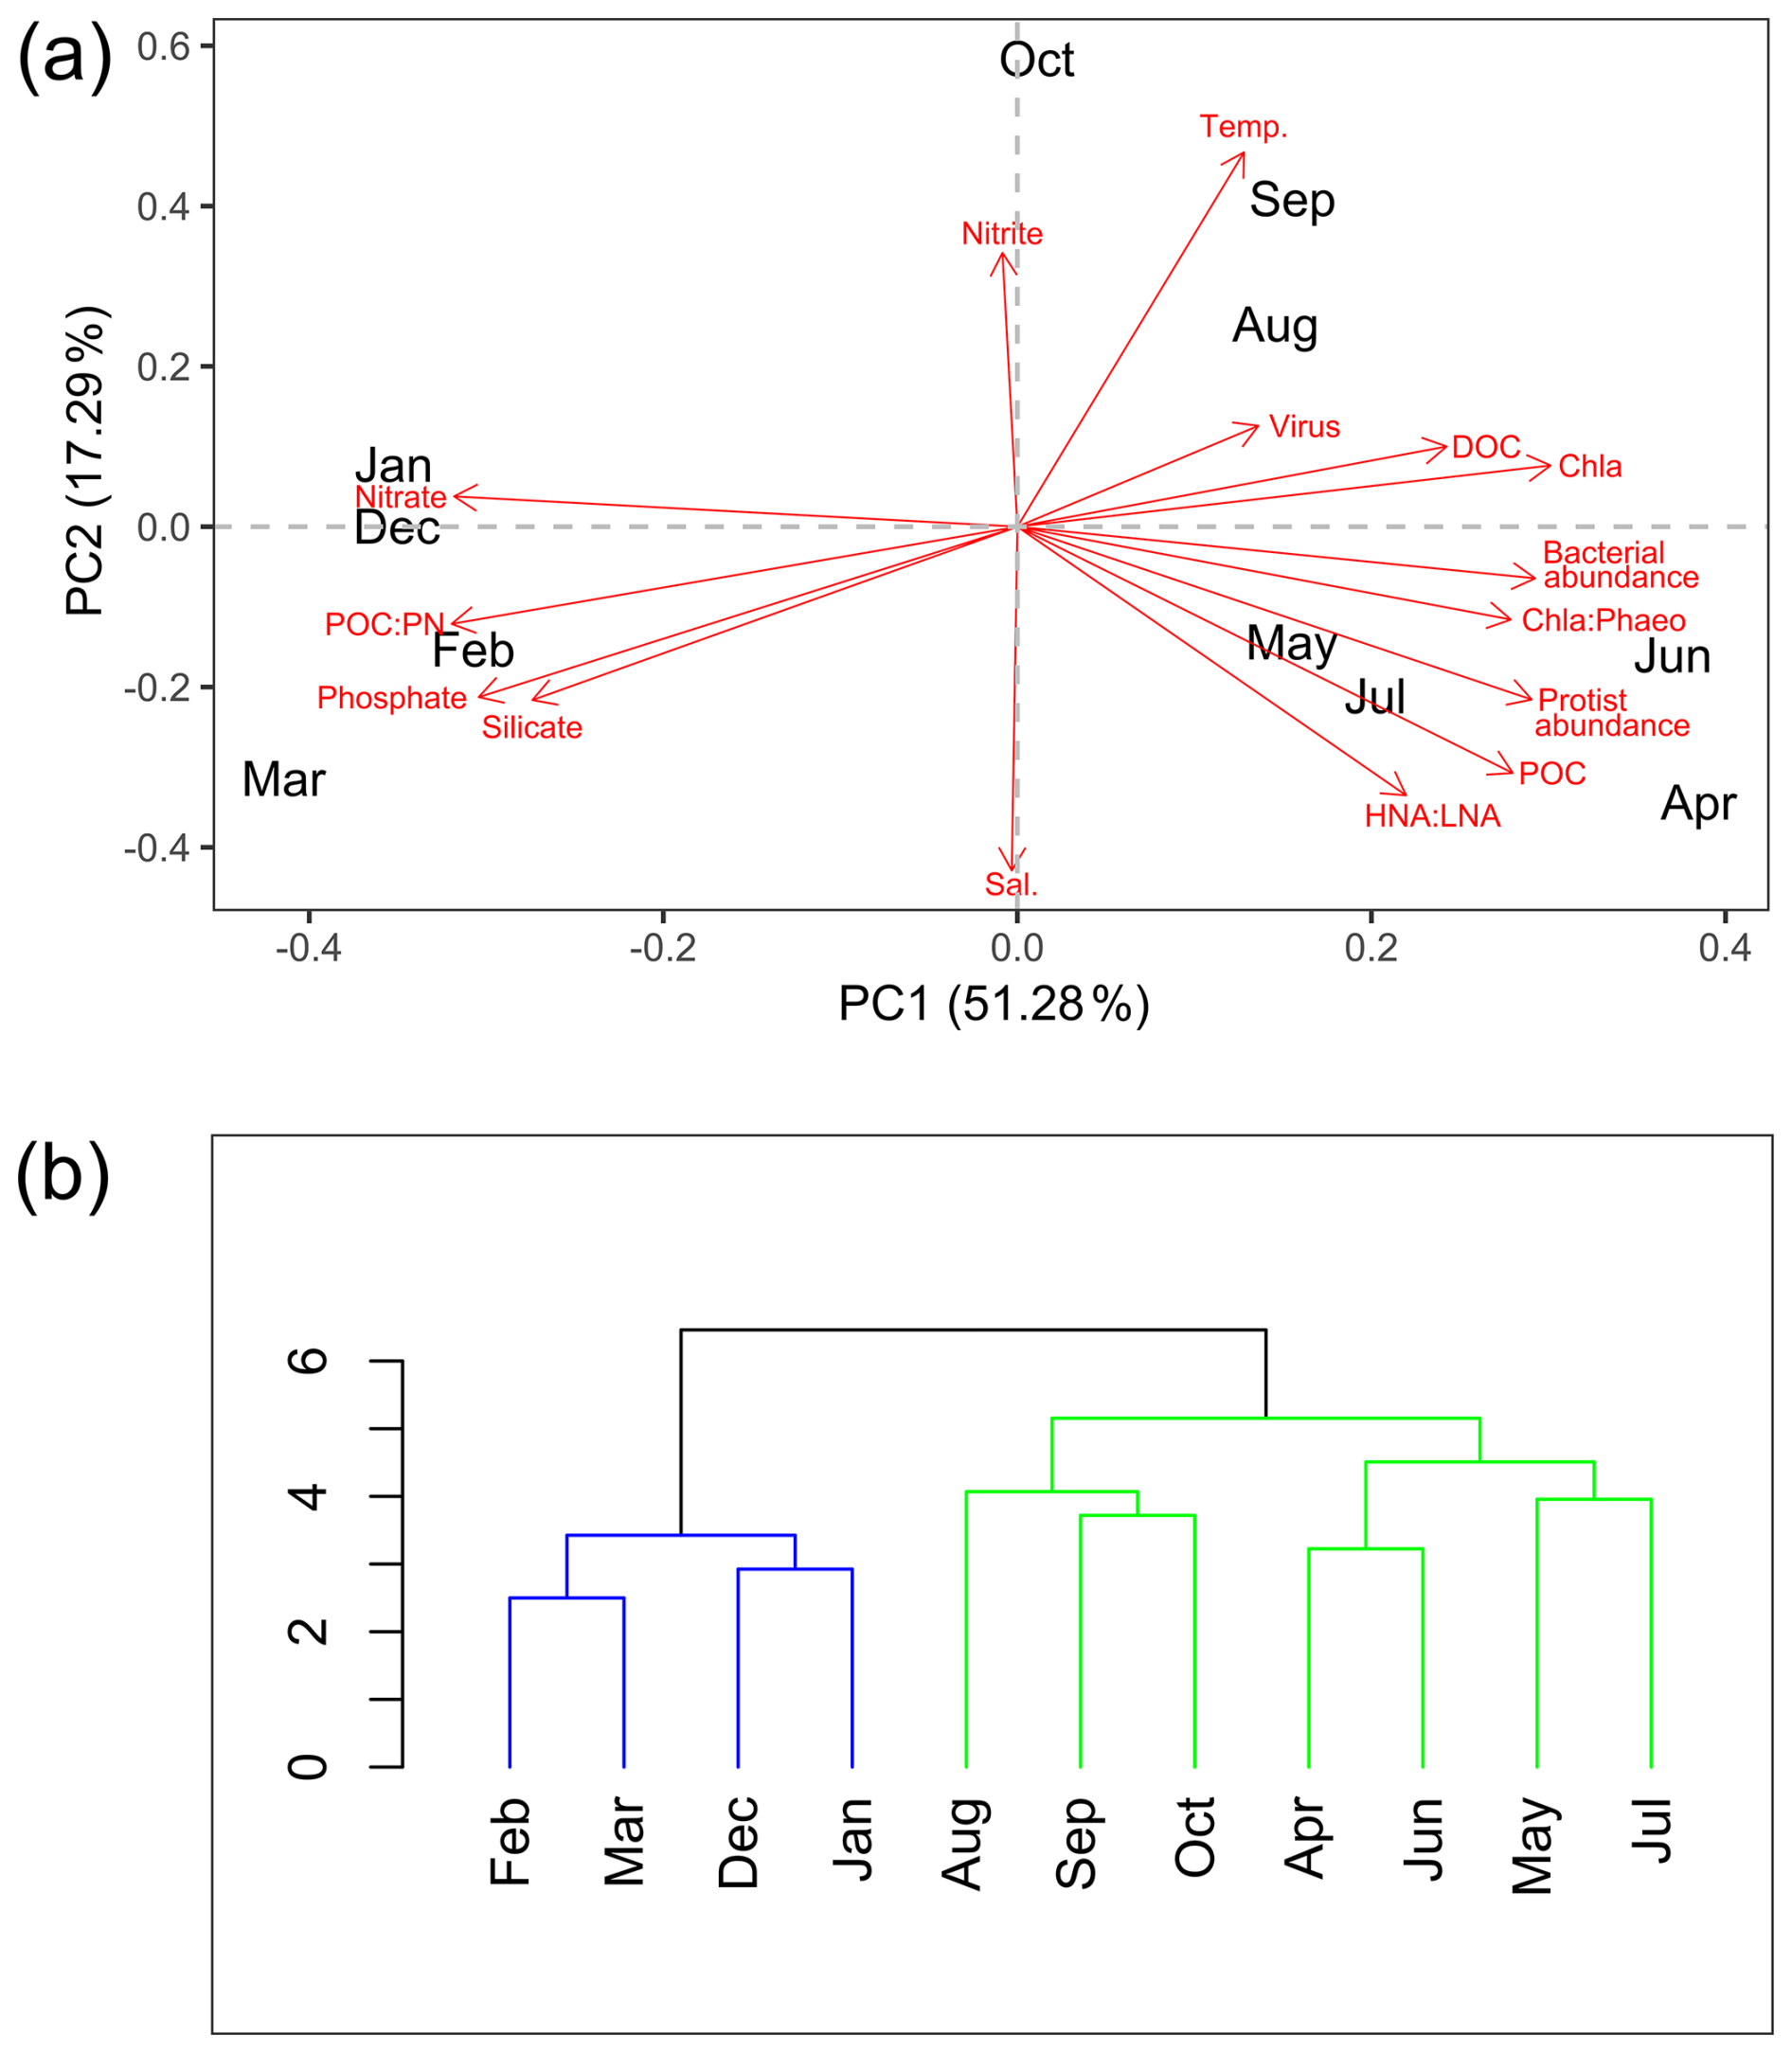
Figure 3The environmental and biological characterization of Ramfjorden (Tromsø, Norway) between September 2020 and August 2021. (a) Visualization of the principal component analysis (PCA) performed on environmental and biological data (in red) collected every month between September 2020 and August 2021 in Ramfjorden. (b) Visualization of the similarity profile routine analysis (SIMPROF) based on the same environmental parameters (Euclidian-distance based, significance threshold α = 0.05).
The SIMPROF analysis in Fig. 3b, based on environmental and biological data, delineates two seasonal phases of the Ramfjorden ecosystem: a period of high biological activity between April–October (hereafter referred to as the productive period) and a period with limited light availability for phytoplankton production between November–March (hereafter referred to as the winter period). Within the productive period, a spring scenario (April, June, July) is separated from a summer–autumn scenario (August, September, October); however, this separation is not significant in the SIMPROF analysis. In the following, we describe the processes in the DOM–POM continuum as observed in our experiment during the two contrasting scenarios (productive period and winter period) in the fjord environment.
3.2 Experimental results
3.2.1 Changes in particulate organic carbon (POC) concentrations and related parameters
The change in POC concentrations from the start (t0) to the end of incubation (t1) of filtered (F) and unfiltered (UF) treatments followed a generally similar pattern (relative increase or decrease) throughout the year (Fig. 4). In winter (December and February), after 36 h of incubation, we measured lower POC concentrations in F water at t1 compared to at t0 (a decrease in the mean POC concentration of −2.55 µM ± 0.8 (around −50 % relative to t0)). There was an increase in POC during the incubation period in the filtered water (F) of April, June, and September, with a mean of +1.6 µM ± 0.5 (Fig. 4; April: 76 % increase relative to t0; June: 88 %; September: 70 %). The decrease in POC in winter and the relative increase in April followed in a similar manner in UF water (t0 is not available for UF in September). However, in June, the relative increase in POC concentrations was 4 times higher in UF compared to in F. For the F treatment, a t test revealed significant differences in the changes in POC concentrations between the winter and productive periods (p = 0.04, t value = 4.6, degrees of freedom (df) = 3), whereas this difference was not significant for the UF treatment (p>0.05, t value = 1.6, df = 1).
Bacterial biomass in F water did not show large differences after incubation relative to the start (t0) from September until April; however, it increased in June and August (Fig. 4b). The patterns were different in UF water, where, in winter, a decrease in bacterial biomass was observed, while, in spring and summer, there was an increase (Fig. S4). Despite performing the incubation in darkness, there was an increase in pico-sized phytoplankton cells in the unfiltered (UF) fraction in August. At this time the system had the highest concentrations of small phytoplankton (<2 µm). Picoeukaryotes and Synechococcus increased in August from 4000 cells at t0 to 24 000 cells mL−1 after 36 h (Fig. S4), equalling a biomass increase of approximately 2 µM carbon (Fig. 4c).
In F water, bacterial activity (HNA LNA) increased relatively constantly throughout the year; however, in UF water, little change was observed in winter and August, while April was characterized by a sharp increase in activity (Fig. 4d). Similarly to bacterial activity, EPSs always increased in both treatments and throughout the whole year (sampling apart from February; Fig. 4e). Conspicuously, while, for UF water, the highest increase in POC was observed in June, the highest increase in EPSs was observed in April. In F water, the highest increase in EPSs was present in June.
Initial (t0) DOC concentrations followed a similar pattern to the concentrations in the field (Figs. S2, S4). In September, concentrations increased in both F and UF water (about +60 µM in F and +180 µM in UF; Fig. 4f). In October and December, DOC concentrations still increased in F water (+73.6 and +27.2 µM, respectively) but increased very little or even decreased in UF water. In April and June, DOC concentrations decreased in F but increased in UF water (Fig. 4f).
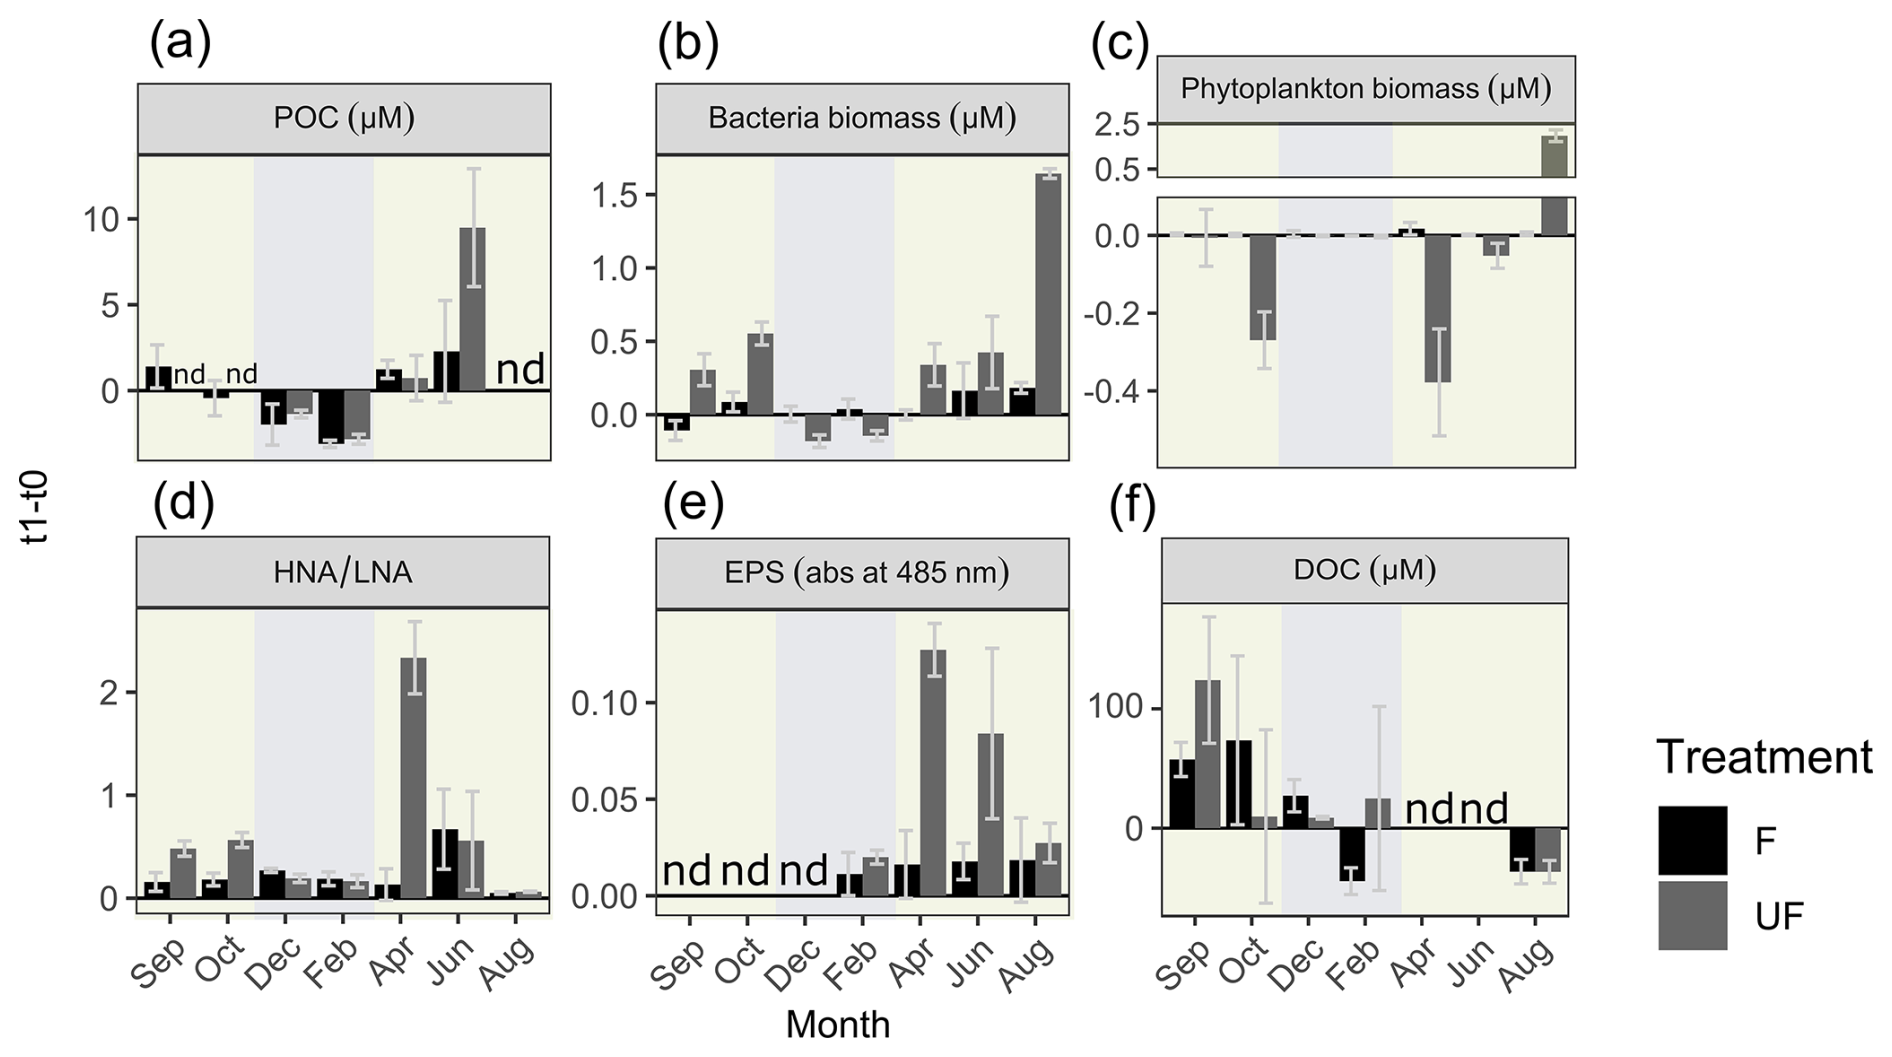
Figure 4Change in experimental parameters over the course of the incubation. Change in concentrations from the start relative to the end of incubations (and their standard deviations; n = 2–5) of (a) particulate organic carbon (POC), (b) bacteria biomass (µM), (c) phytoplankton biomass (µM), (d) ratios of high-nucleic-acid to low-nucleic-acid bacteria (HNA/LNA), (e) extracellular polymeric substances (EPSs; in relative absorption at 485 nm), and (f) dissolved organic carbon (DOC) (µM). F denotes filtered water, UF denotes unfiltered water, and nd denotes no data. The background colors indicate the statistically identified winter (blue) and biologically productive (green) periods.
3.2.2 DOM patterns in autumn and winter
The molecular composition of DOM was analyzed at the beginning and end of incubation experiments conducted during contrasting periods of the year. September incubations represent a productive period, whereas experiments in December and February indicate a winter period. Additionally, October incubations were also analyzed for DOM composition to assess the transitional period. Metrics for DOM composition were reported as signal intensity weighted average (wa) values of hundreds of DOM formulas per treatment (Table 2). A table presenting the individual mean values per sample for each DOM metric is provided in the Supplement (Table S2).
Table 2High-resolution mass spectrometry results of DOM metrics showing intensity weighted means of hydrogen to carbon (), oxygen to carbon (), molecular weight (MWwa), and modified aromaticity index (AImod wa). The standard deviation (SD) is computed (Eq. 2) for the start (t0) and the end (t1) of incubation of the 36 h incubation for the filtered (F) fjord water treatment (N=3). The standard error of the difference in the means () is computed (Eq. 5) for each experiment.
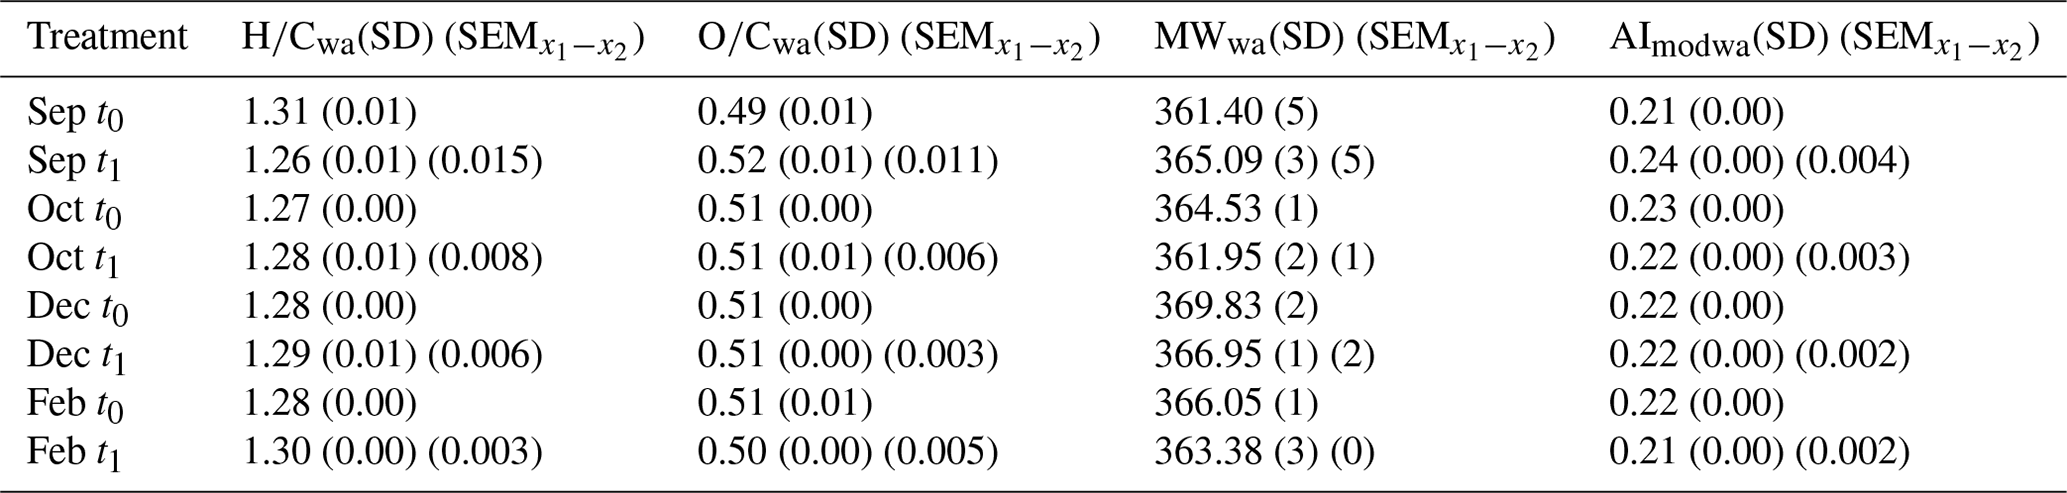
During the productive period, studied in the September incubations, average hydrogen-to-carbon atomic ratios () decreased for both UF and F treatments (Fig. 5). Simultaneously, the average aromaticity (AImod wa) and oxygen-to-carbon atomic ratios () increased for both F and UF treatments (Fig. 5). Average molecular weight (MWwa) increased at the end of incubation in the F treatment and decreased at the end of incubation in the UF treatment. Notably, a removal of more saturated compounds ( > 1.5) is observed at the end of incubation (t1) for the F (Fig. 6a) and UF (Fig. S5) treatments in September. Additionally, low SPE–DOC recoveries were observed in September and October (Fig. S9). This indicates a higher proportion of hydrophilic material (Kirchman et al., 2001; Goldberg et al., 2009), which is made up of compounds that are not well retained by our SPE sorbent (Grasset et al., 2023).
Molecular weight patterns are shown in mass spectra (Fig. 7b) where a decrease in the relative intensities of low-molecular-weight compounds is observed from the start (t0) to the end (t1) of the September incubations for the F treatment. These low-molecular-weight compounds ( < 250) are highlighted in Fig. S6 and show formulas with higher relative intensities at ratios greater than 1.3.
Winter month (December and February) incubations showed a contrasting pattern, with an increase in hydrogen-saturated formulas () in both F and UF treatments (Fig. 5a). During the same period, a decrease in average aromaticity (AImod wa) and in oxygen-rich formulas () was observed in both F and UF treatments (Fig. 5). Molecular weight (MWwa) decreased during the incubation period in the F treatment and increased during the UF incubation (Fig. 5). Moreover, there was a decrease in less saturated formulas ( < 1.5) in both the F treatment (Fig. 6) and the UF treatment (Fig. S5) and slight increase in the intensities of more saturated formulas for the F (Fig. 6) and UF treatment (Fig. S5) at the end of incubation (t1). Additionally, the highest SPE–DOC recovery, ranging from 74 % to 85 %, occurred in December t0 (Fig. S9).
Additionally, changes in DOM metrics for October incubation show transitional patterns from spring to winter months (Fig. 5) with the decrease in formulas with lower ratios (Fig. 6b).
Molecular weight patterns are shown in mass spectra for winter incubations (Fig. 7c), where a decrease in the relative intensities of higher-molecular-weight compounds is observed at the end of incubation (t1). The molecular ratios of formulas higher than 570 are shown in Fig. S6, composed of formulas in the middle and region of the van Krevelen diagram.
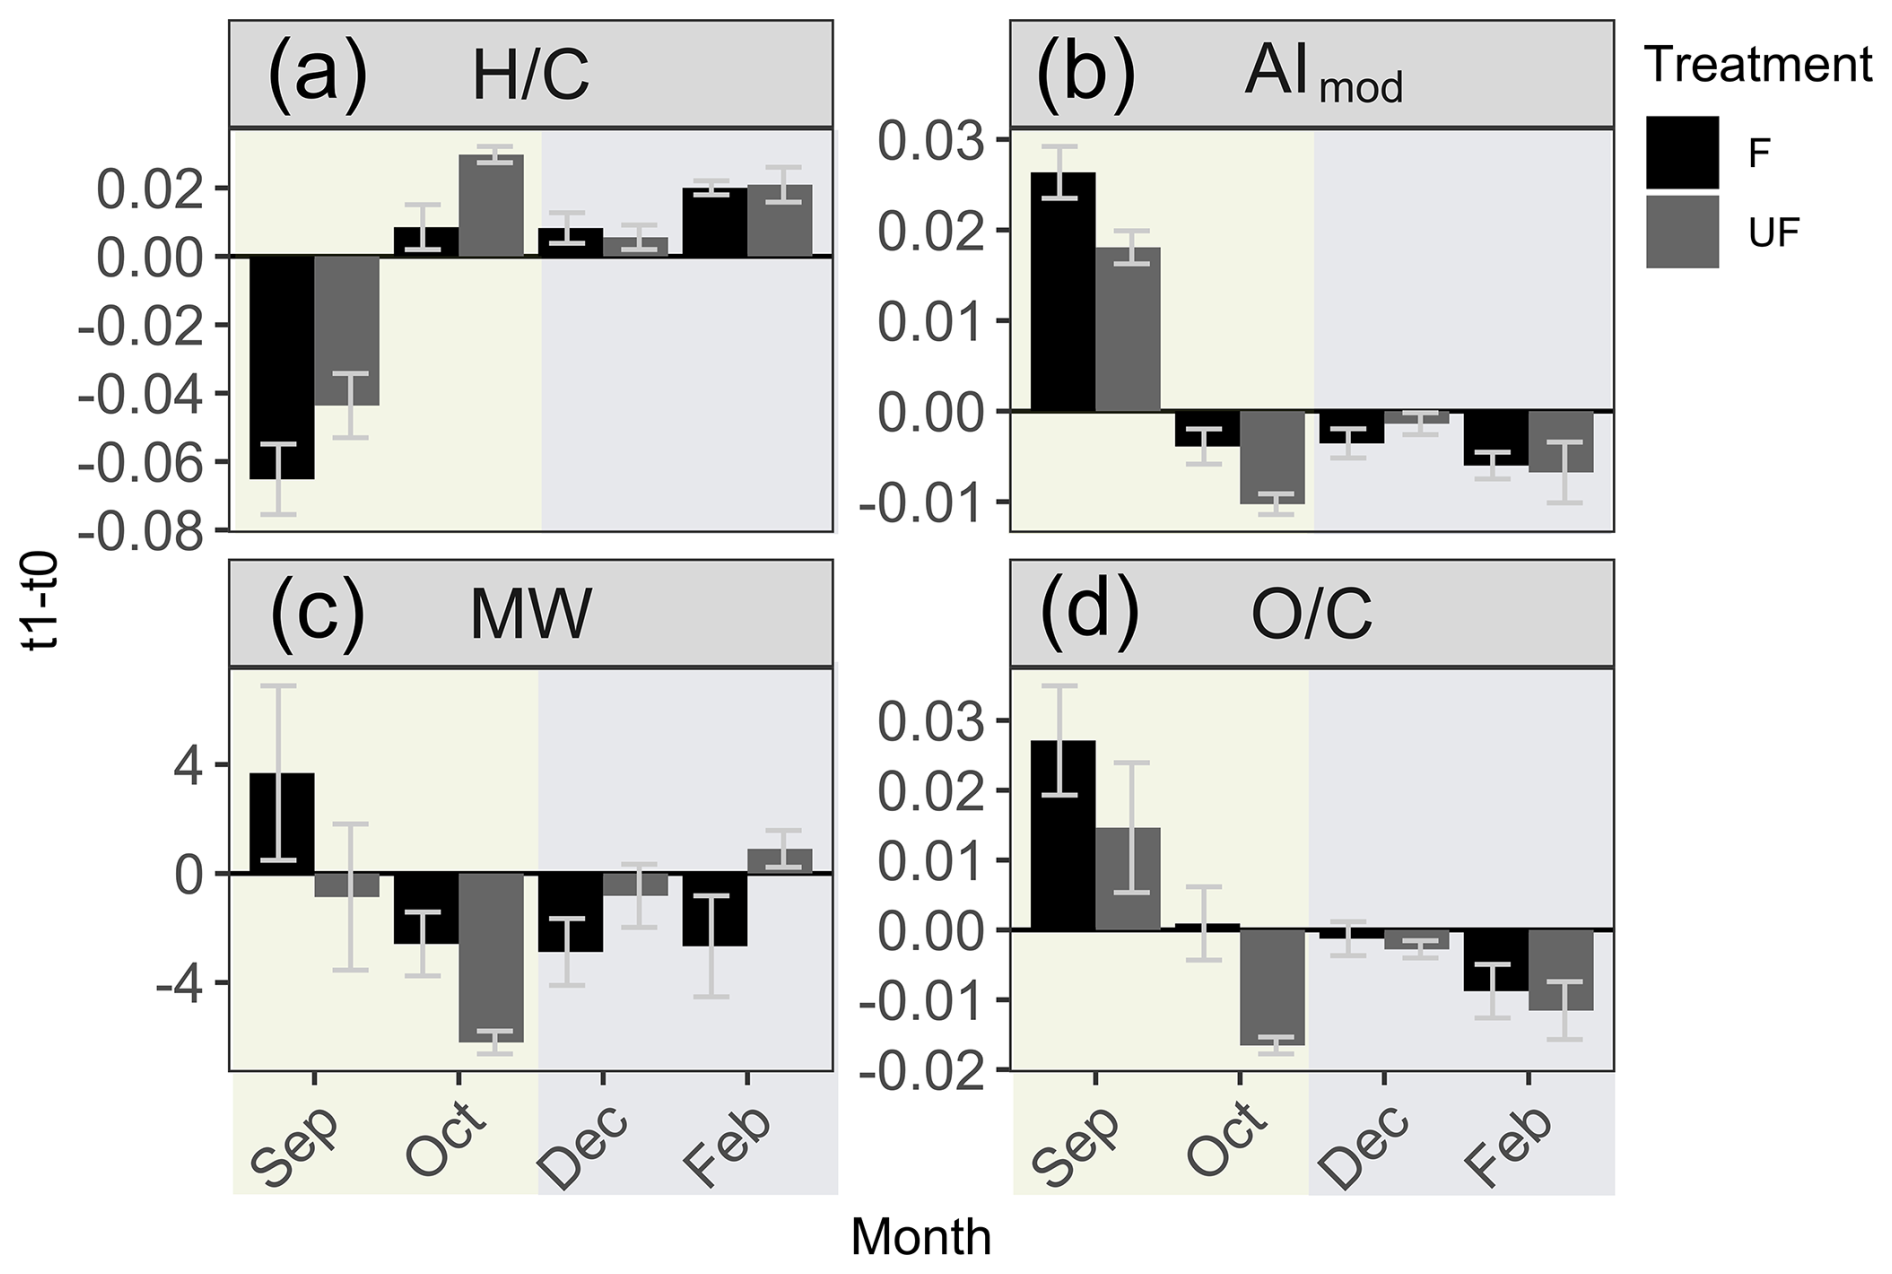
Figure 5Change in DOM metrics during experiment incubations. (a) Change in intensity weighted average DOM metrics in seawater at t1 relative to t0. (a) Hydrogen-to-carbon ratio (), (b) modified aromaticity index (AImod), (c) molecular weight (MW), (d) oxygen-to-carbon ratio (). The first treatment is filtered (F) seawater at the start and end of incubation (t1–t0), and the second treatment is unfiltered (UF) seawater for the duration of incubation, which is then filtered immediately prior to sampling and is compared to the filtered water at the start (t0) of incubation (t1–t0). Error bars show the standard error of the difference in the means. The background colors indicate the statistically identified winter (blue) and biologically productive (green) periods (SIMPROF; p<0.05).
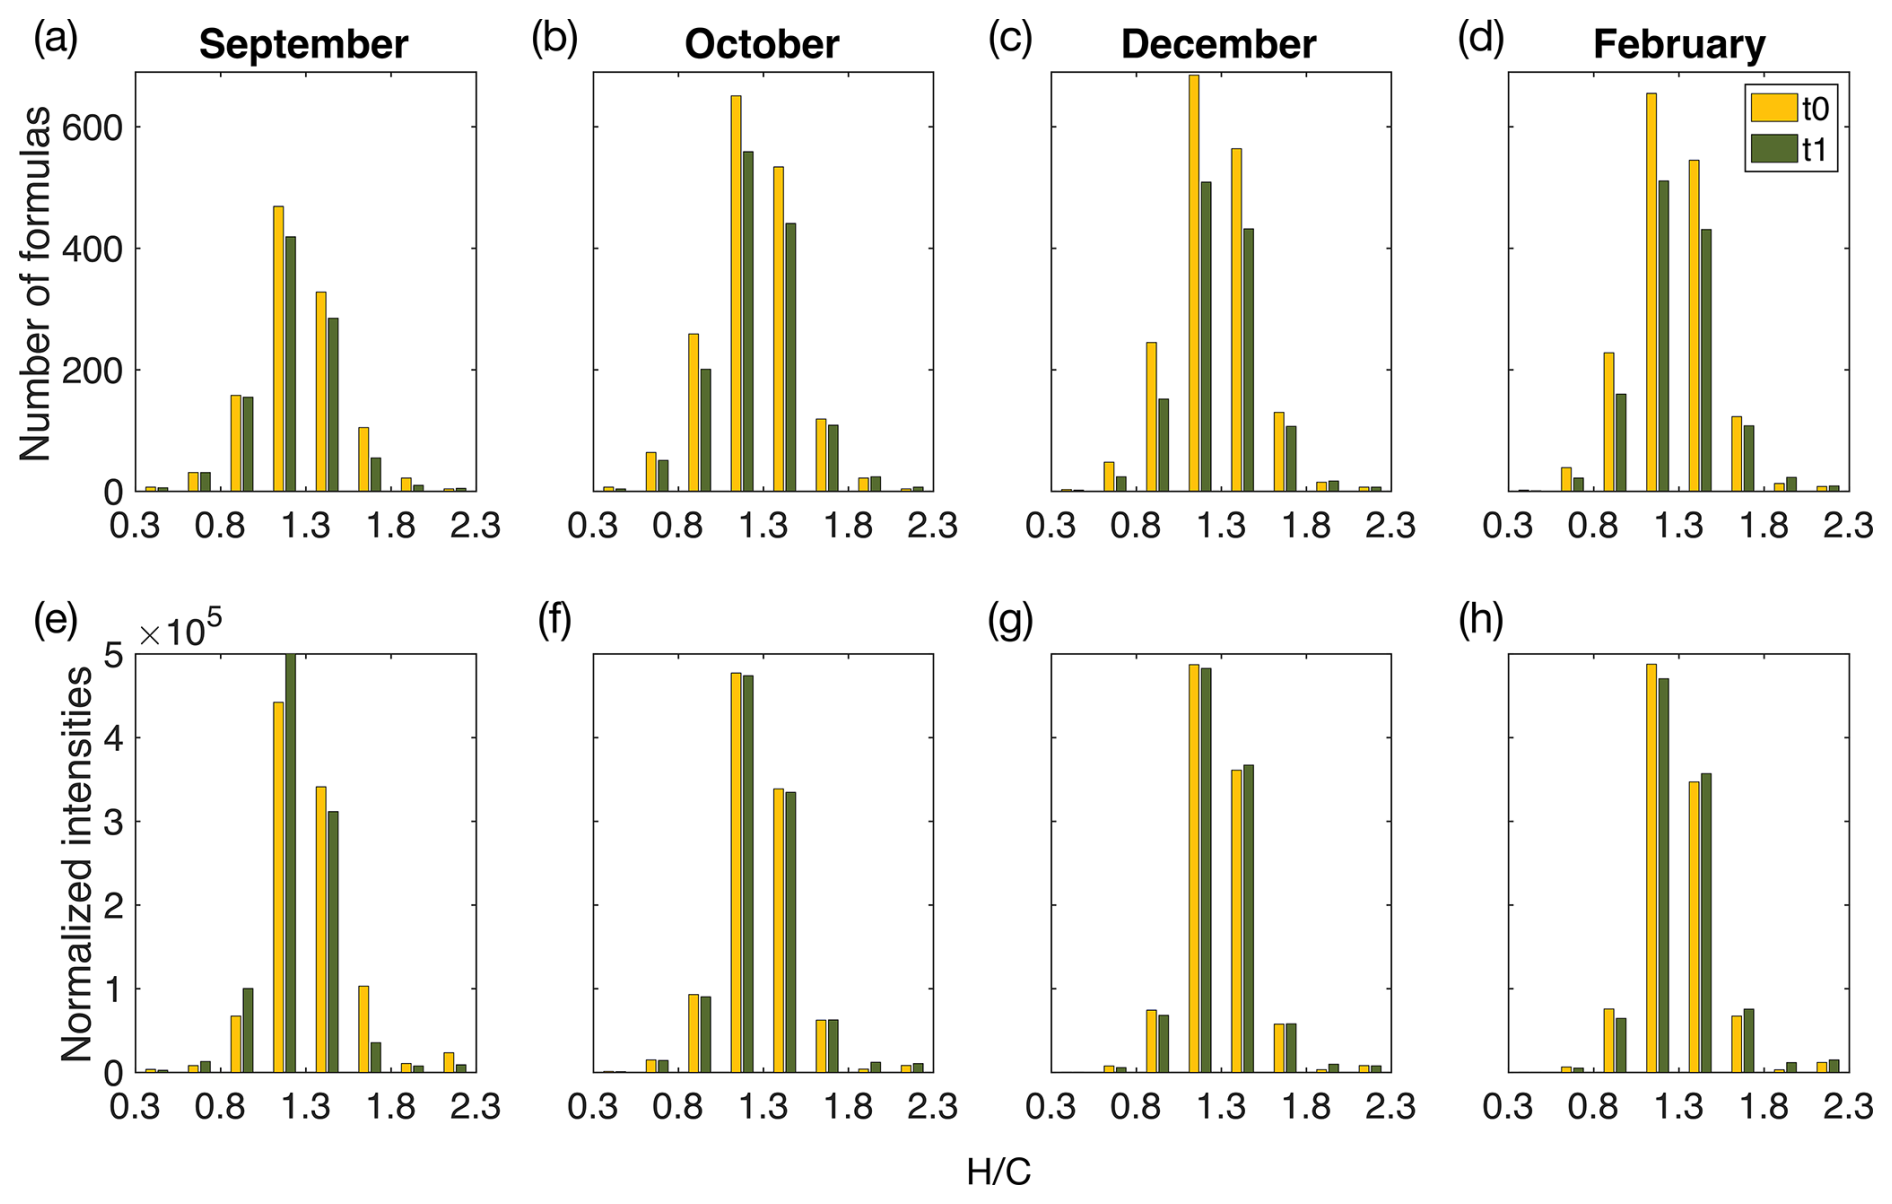
Figure 6Histograms of identified organic matter formulas and normalized intensities determined by high-resolution mass spectrometry during the start (t0) and end (t1) of the incubations of the F treatment water. Histograms of all identified molecular formulas are plotted according to the hydrogen-to-carbon () atomic ratio for incubation experiments in (a) September, (b) October, (c) December, and (d) February. Histograms of normalized intensities of identified formulas are shown according to the hydrogen-to-carbon () atomic ratio for incubation experiments in (e) September, (f) October, (g) December, and (h) February. The start of incubation (t0) is shown in yellow, and the end of incubation (t1) is shown in green. F treatment refers to filtered water (0.7 µm) at the start and end of incubation (36 h). September shows a decrease in formulas and intensities, with relatively higher ratios, whereas winter months (December and February) show a decrease in formulas with low- and middle-range ratios during the incubation period. October indicates a transition period, with the loss of formulas across ratios. Changes in intensities and formulas for the UF treatment can be found in Fig. S5.
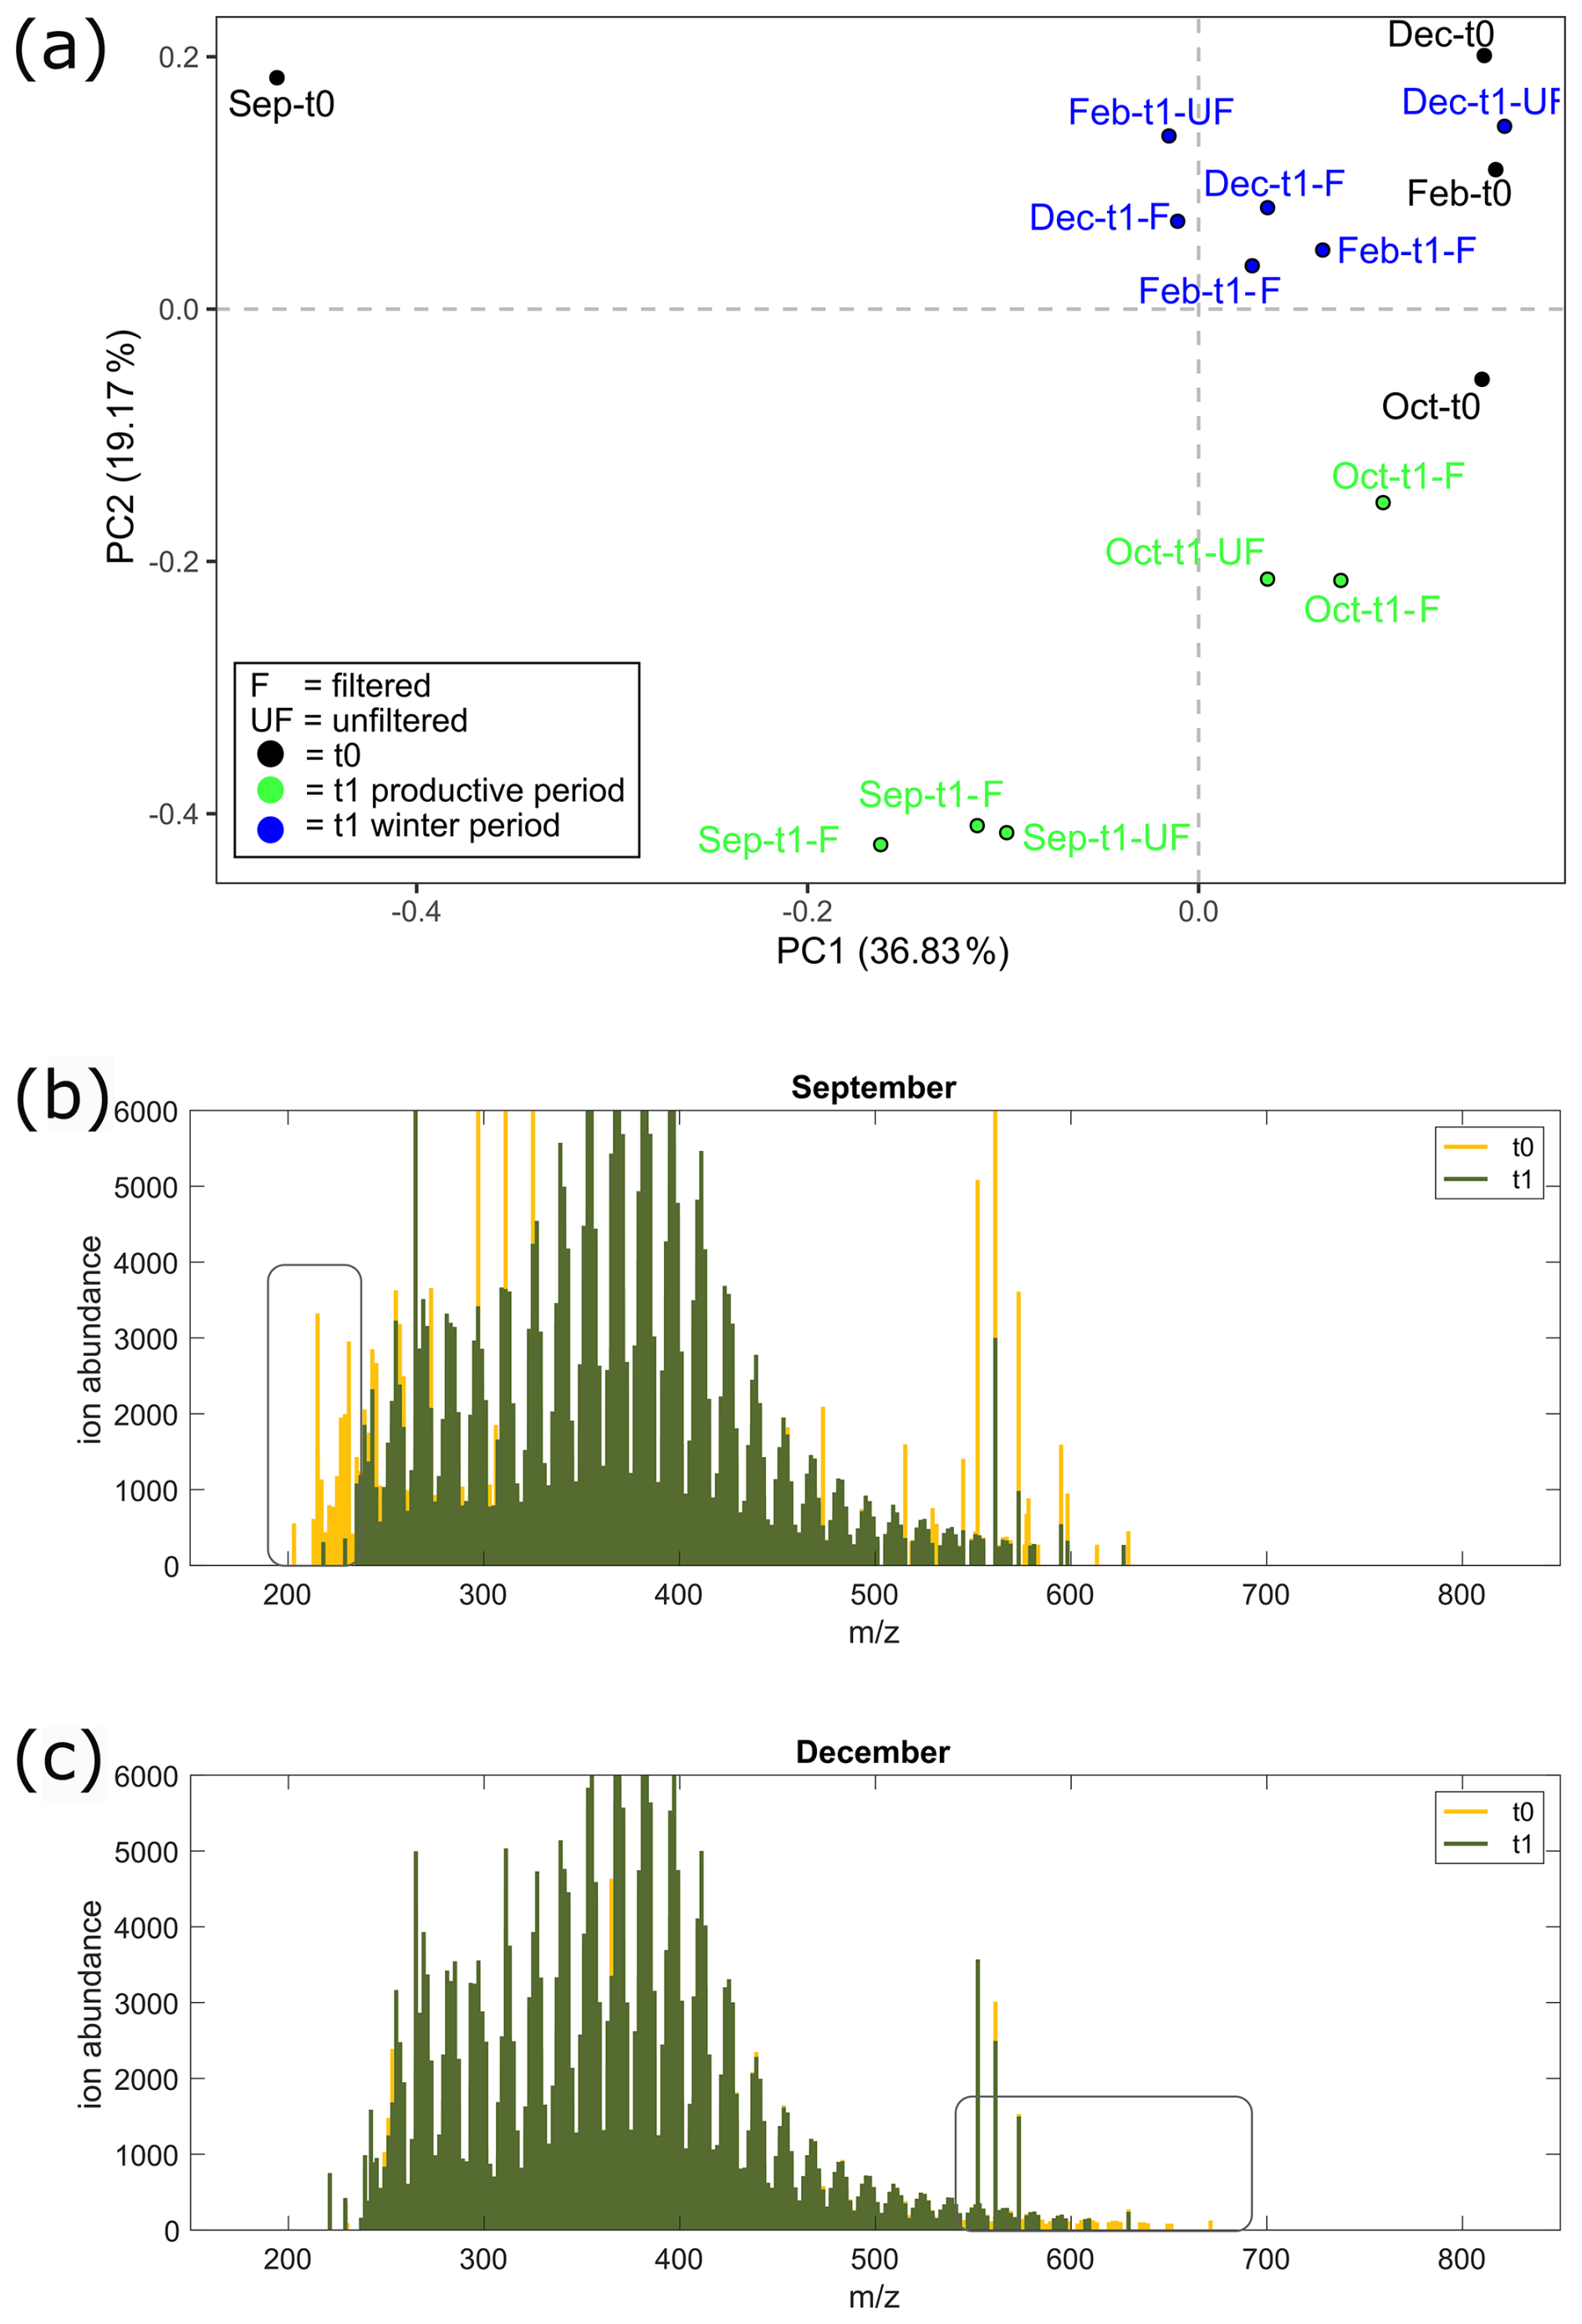
Figure 7Mass spectra results from the aggregation experiment. (a) Visualization of PCA performed on DOM mass spectra from all samples from the experiment; t0 (black) and t1 samples from winter (blue) and the biologically productive period (green) are distinguished by color. Mass spectra of filtered treatment samples from (b) September t0 (yellow) and overlay t1 (green) and (c) December t0 (yellow) and overlay t1 (green). Changes between incubation periods are highlighted in the rectangles, with a decrease in molecular weight ( < 250 Da) in September from the start of incubation (t0) relative to the end of incubation (t1) and a decrease in high molecular weight ( > 600 Da) in December from the start (t0) relative to the end of incubation (t1).
4.1 The seasonal biogeochemical cycle in Ramfjorden
The spring bloom in Ramfjorden and other nearby fjords is initiated at the end of March or beginning of April within a deeply mixed water column (Riebesell et al., 1995; Vonnahme et al., 2022; Walker et al., 2022). The sharp increase in DOC, fluorescence, turbidity, TPM, POC, Chl a, protist abundance, bacterial abundance and activity (HNA LNA), and nano- and pico-phytoplankton abundances in April, along with a strong drawdown of nutrients, demonstrates the onset of the spring bloom. Consequently, the water became turbid due to the increase in organic particles (Figs. S2 and S3), and the photosynthetic activity elevated oxygen concentrations, which were consumed in the following months due to increasing heterotrophic activity (Fig. S3). Hereafter, nutrient concentrations remained low (nitrate < 1 µM, phosphate <0.3 µM) throughout the summer. In September, an autumn bloom can develop (Vonnahme et al., 2022), and high zooplankton biomass can occur (Coguiec et al., 2021). Presumably, an autumn bloom developed in September during our study as well because POC concentrations; standing stocks of total Chl a; contributions of large phytoplankton, mostly dinoflagellates (Chl a > 10 µm); and ciliate abundance were similar to those in April and July (Fig. S2u, v, x, y).
During winter (December–March), photosynthetic activity was inhibited due to the polar night, and, accordingly, particulate organic matter, protist abundance and biomass, and Chl a concentrations were at their minimum (Fig. S2u, x). The water column is deeply mixed between December and April (Fig. S3), displaying no changes in density, turbidity, and oxygen saturation with depth, and nutrients were redistributed, as demonstrated by elevated nutrient concentrations in the surface water. Despite low biological activity, bacteria continue to decompose the available algal remains during this period (Vonnahme et al., 2022). This is also supported by the high POC PN and low Chl a phaeopigment ratios of organic particles during winter, which demonstrate that they were in a regenerated state (Fig. S2w, z).
4.2 DOM and POM transformations in the biologically active period
The experiments showed a decrease in POC concentrations in both filtered (F) and unfiltered (UF) water during winter (December and February), suggesting a net dissolution or degradation of particles. In contrast, we measured an increase in POC concentrations in filtered (F) water during the productive period (April–September). This suggests aggregation of DOM under high biological activity. Aggregation is promoted when primary production occurs, and phytoplankton exudates increase DOM concentrations in the aquatic environment, as described in numerous studies (Alldredge and Jackson, 1995; Burd and Jackson, 2009; Engel et al., 2004; He et al., 2016, and references therein; Orellana and Leck, 2015, and references therein; Passow, 2002b, and references therein). The increase in POC, however, did not result in a corresponding decrease in DOC (Fig. 4), likely due to the sticky nature of extracellular polymeric substances (EPSs), predominantly produced during the biologically active season (Chen et al., 2021). EPSs can promote the adsorption of both DOC and POC into filters and containers, leading to complex changes in the dissolved and particulate carbon budget (see further discussion in Sect. 5.3.2). The increase in EPS concentrations during both the productive and winter periods demonstrates that the behaviors of gels and colloids as precursor material play an important role in aggregation–dissolution processes. Although changes in POC concentrations in F water between the end and the beginning of incubation were difficult to quantify due to high variability in individual tanks and the short incubation time (36 h), the mean changes in the POC pool between the two contrasting seasons (winter: December and February and productive period: September, April, June) were significantly different from each other (p = 0.04, t value = 4.6, df = 3). Simultaneously, DOM was characterized by more recalcitrant DOM at the end of September incubations (see Sect. 5.2.2), with opposite trends observed during winter (Sect. 5.3).
4.2.1 Mechanisms of the transformations of DOM and POM
Previous studies have shown that large (up to 5 µm) polymer gels and particulate material can be reformed quickly after they have been removed from filtered seawater and river water despite consecutive filtrations and different filter sizes (0.2, 0.4, or 0.7 µm; Chin et al., 1998; He et al., 2016; Kerner et al., 2003; Passow, 2000, 2002b; Sheldon et al., 1967). Even when bacteria are killed, microgels of sizes between 200 nm to 1 µm can form within 30 min and up to 5 µm after 50 h (Chin et al., 1998; Kerner et al., 2003; Sheldon et al., 1967). The same process cannot be observed in filtered artificial seawater, but the addition of dissolved carbon enhances aggregation (Gruber et al., 2006; Sheldon et al., 1967). Several studies and reviews have pointed out the ability of DOM to assemble spontaneously into polymer gels, which can aggregate to particles (Chin et al., 1998; Engel and Passow, 2001; Passow, 2000). We suggest that the same process occurs during the present study, when we observe an increase in POC after 36 h in filtered (F) water taken during the biologically productive period between April and September. Although the change in POC concentration was small (between −3.10 to +2.28 µM) and varied across individual tanks (Fig. S4; most likely due to the short incubation time), we show, for the first time, the contrasting seasonality of this aggregation process.
DOM concentrations are elevated through phytoplankton production, which is likely why aggregation was observed during the biologically productive period. In situ EPS concentrations, representative for large sugars (> 0.4 µm), follow the same seasonal pattern as protist abundance (Fig. S2t, x). Diatoms dominated the phytoplankton community during the peak Chl a periods in April and June (Fig. S2x). In April, the mucous colony forming prymnesiophyte P. pouchetii also comprised a major fraction of the phytoplankton community of Ramfjorden, and, during this period, EPSs were elevated (0.84 relative absorption at 485 nm; Fig. S2t). It was also in April that we saw the largest increase in EPSs during the 36 h incubation, indicating that the residues from P. pouchetii are especially prone to reform into EPSs. In contrast, in June, when only diatoms dominated (Pseudo-nitzschia sp. and Chaetoceros filiformis), the experimental production of EPSs was approximately 30 % lower despite peak in situ concentrations of EPSs in June (1.91 relative absorption at 485 nm, Fig. S2t).
Table 3Percentage of particulate organic carbon (POC) contribution from aggregation of filtered (F) and unfiltered (UF) treatments relative to the in situ POC concentrations. ΔF and ΔUF refer to the value of the end of incubation subtracted from the value of the start of incubation for each treatment (F and UF).
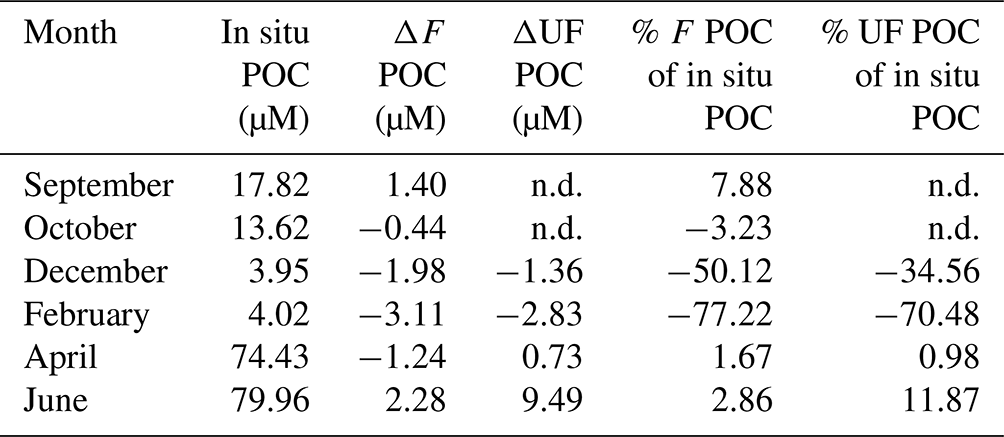
n.d.: no data.
The increase in POC concentrations in F water accounted for between 1.7 % (April) and 7.9 % (September) of the POC concentrations measured in the field (Table 3), and although our data do not show an antagonistic relationship between POC and DOC, its source is likely to be aggregation from the dissolved pool. Phase shifts from DOM to POM are mainly driven by physical processes such as Brownian motion, chemical changes (e.g., ambient pH, ionic concentrations, temperature, light, bridging with divalent cations) and/or physical stress such as turbulent shear (e.g., filtration), differential settling, surface coagulation (e.g., bubbling), or bacterial motility (Engel and Passow, 2001; He et al., 2016; Kepkay, 1994; Passow, 2000; Timko et al., 2015; Verdugo et al., 2004). During our experiment, shear was probably only introduced during the filtration and at the beginning and the end of the rotation. During incubation, the rotation merely ensured the equal distribution of the material within the tank. Still, within a short amount of time (36 h), POC concentrations increased in F water during the biologically productive period of the year. Other studies showed that up to 35 % of particulate matter present in situ can be formed in filtered water through aggregation (Riley, 1963; Sheldon et al., 1967; Valdes Villaverde et al., 2020); however, this occurred over longer timescales (several days vs. 36 h in our experiment) and through the addition of shear. Keskitalo et al. (2022) demonstrate net aggregation of POC during spring freshet in an Arctic river and POC degradation of between 3–12 d during summer. These examples indicate that, next to environmental conditions, different incubation timescales probably affect DOM–POM processes differently, and more studies are needed to disentangle these effects. For the current study, we focus on the “immediate” behavior of the DOM–POM interactions within a short timescale compared to other experiments.
DOM–POM processes are usually driven by bacterial degradation (dissolution of POM) and physical processes (DOM aggregation to POM, adsorption of DOM to particles, or defragmentation). Our study shows that, although bacterial activity increased during incubation in both seasonal periods, microbial processes during the productive period seem to play a lesser role in the DOM–POM transition compared to physical aggregation. Other studies have similarly shown that, while POC concentrations remain constant after consecutive re-filtrations, bacterial abundances decrease, bacterial activity remains low, and substrates that are preferred over bacterial degradation can accumulate (Engel et al., 2004; Valdes Villaverde et al., 2020). The addition of sodium azide to inhibit microbial activity does not change the coagulation behavior of polymers, but the addition of ethylenediaminetetraacetic acid (EDTA), which disperses microgels and polymers, inhibits coagulation (Chin et al., 1998). These examples support that aggregation mainly stems from physical rather than biological transformation. Similarly, Engel and Passow (2001) and Passow (2000) show that gels > 0.4 µm in size form efficiently under shear and hydraulic stress. Overall, during the biologically productive period, a substantial fraction of particulate material can originate from the DOM pool, and changes in the DOM–POM continuum, in the direction of aggregation, have shown to be dominated by aggregation processes uncoupled from bacterial activity.
Changes in DOM composition during the incubation period for F and UF treatments were similar compared to the start of incubation (t0) and indicated little effect of larger organic size fractions (0.7–90 µm) on the composition of DOM during the 36 h incubations (Figs. 6 and S5). However, DOM compositional changes at t1 relative to t0 were contrasting for the productive versus winter periods regardless of treatment, thus indicating that DOM compositional changes were driven by abiotic process and/or microbial communities in the dissolved fraction (<0.7 µm). Due to similarities between F and UF treatments (Figs. 6 and S5), we primarily focus on discussing F treatment in sections concerning DOM composition unless otherwise stated.
4.2.2 Decreased DOM lability during September
Molecular composition analysis of DOM in September F treatment incubations indicates the removal of more saturated formulas and a decrease in the intensities of these formulas ( > 1.4; Fig. 6a), which indicates a decrease in the overall lability of DOM compounds (D'Andrilli et al., 2015, 2023). These changes could be explained by microbial degradation and/or abiotic aggregation of the saturated compounds. Simultaneously, an increase in the average aromaticity (AImod wa) of DOM compounds was observed during incubation and is likely due to the removal of saturated molecules, which tend to be low in aromaticity (Koch and Dittmar, 2006a). Additionally, the removal of low-molecular-weight compounds (< 250 Da) was also observed in mass spectra at the start of incubation (t0) versus at the end of incubation (t1; Fig. 7). These low-molecular-weight compounds are mainly composed of higher saturation ( > 1.3; Fig. S6); thus, removal of these compounds could explain the lower average ratios observed. Microbial degradation of these compounds (<250 Da) is contrary to the size reactivity continuum, which proposes a higher reactivity of DOM as molecular weight increases (Benner and Amon, 2015).
Previous work has shown the formation of POM via adsorption of hydrophilic and low aromatic DOM (Einarsdóttir et al., 2020). The decrease in the average saturation and the increase in the aromaticity of DOM compounds observed during September incubations could be due to the adsorption of these compounds to POM. However, aggregation of highly saturated DOM is typically observed for larger size fractions, such as polysaccharides (Passow, 2000; Passow et al., 1994), which are outside of our mass spectrometry analysis window. These low-molecular-weight compounds could point to DOM precursor molecules of the larger hydrophilic POM compounds (Orellana and Leck, 2015; Verdugo et al., 2004). The low SPE–DOC percentage recovery observed during September incubations (Fig. S9) supports the increase in these hydrophilic fractions. Although these dissolved fractions were not extracted in our DOM method, their presence could contribute to increases in POC concentrations, as observed during the biologically productive period.
Average oxygenation of molecules () also increased during incubations in September. This could be due to the removal of formulas of low ratios (<0.5) and high ratios (>1.5), as seen in Fig. S8, instead of the production of highly oxygenated compounds. The preferential biological degradation of compounds with low oxygen numbers compared to oxygen-rich compounds was also observed by Riedel et al. (2016). Additionally, Maie et al. (2008) have shown aggregation of highly oxygenated tannin compounds; however, our experimental results did not show an increase in highly oxygenated compounds, likely due to a limited tannin source in this region, as shown by the low seasonality in the tannin region (Fig. S8).
4.2.3 Enhanced aggregation under post-bloom conditions
POC aggregation during the experiment was higher in June compared to in April (increase of 1.2 µM POC in April vs. 2.6 µM in June for F water and an increase of 0.7 µM in April vs. 9.5 µM in June for UF water). Higher aggregation under post-bloom conditions in June compared to in April were not surprising as EPSs accumulate under increasing nutrient limitation and/or with increasing concentrations of senescent cells, as is the case during post-bloom conditions in summer (Engel, 2000; Hellebust, 1965; Mague et al., 1980; Myklestad, 1995; Passow, 2002b; Riebesell et al., 1995; Thornton, 2002). EPSs are released already in the growth phase of phytoplankton during the initiation of a bloom; however, most EPSs are probably present in the form of low-molecular-weight (LMW) compounds in the beginning of a spring bloom (Paulsen et al., 2018). This is supported by higher field DOC concentrations in April than in June, while field concentrations of EPSs, which are representative for large polysaccharides (>0.4 µm), were lower in April compared to in June (Fig. S2t). This might also explain why, in April, both the F and UF treatments had similar increases in POC levels relative to the start of incubation (increases of 1.24 and 0.73 µM, respectively), although initial POC concentrations at the start of incubation (t0) were 11 times higher in UF water than in F water. Despite particle concentrations being high, little precursor material was probably present in UF water to promote aggregation in the beginning of a bloom compared to a post-bloom scenario.
Later, in June, we observed a 9-times-higher aggregation potential of UF water compared to in April, while we only observed a 2-times-higher aggregation potential of F water (Fig. 4a). In summer, towards the end of a bloom, the field concentration of EPSs increase and there is also an increase in the concentration of suspended particles, as shown by an increase in POC and TPM in the field (Fig. S2y, a1). Because coagulation becomes more likely when a critical concentration of particles is reached, aggregation is usually enhanced under post-bloom conditions (Burd and Jackson, 2009; Dam and Drapeau, 1995; Mague et al., 1980; Passow, 2002b; Thornton, 2014). Colloids can be scavenged by larger particles (Druffel et al., 1992; Kepkay, 1994) and can even lead to enhanced carbon sedimentation (Forest et al., 2013; Riebesell et al., 1995). Higher POC and EPS concentrations in the field during June likely increased the chance of organic matter to coagulate in UF water. Interestingly, however, experimental POC concentrations in UF water were higher in April compared to in June. This might indicate that the concentration of precursor material plays a more critical role for aggregation than particle concentration. Our experiment suggests a higher contribution of DOM to the POM pool during summer compared to during spring and a higher aggregation potential in general (as seen in UF water) during a post-bloom scenario compared to during a peak-bloom scenario. It should be noted, however, that experimental EPS concentrations at the start of incubation (t0) in UF water were consistently 1 order of magnitude lower than the respective field EPS concentrations, which indicates that a large fraction of EPSs were retained on the 90 µm sieve and were therefore not included in the experiment, probably because of their sticky nature. Therefore, we likely did not adequately replicate aggregation in truly unfiltered water, and our measurements can be considered to be conservative estimates for aggregation in unfiltered water.
4.3 DOM and POM transformations in winter
Our experiment shows a decrease in POC concentrations in F and UF water after incubation during winter (December and February). In the ocean, particles are usually remineralized in the pelagic zone due to solubilization by bacteria, sloppy feeding by zooplankton, or fragmentation (Iversen, 2023; Kiørboe, 2001; Svensen and Vernet, 2016). Photo-dissolution can also turn POM into dissolved material, especially in surface waters under direct light influence (Pisani et al., 2011). Since large grazers were filtered out and the experiments were carried out in the dark, we propose that bacterial degradation was responsible for the observed dissolution patterns of organic matter that was present in the winter water. This is also supported by the increase in bacterial activity in the experiment at t1 relative to the start of incubations (t0) throughout the year and by the fact that a decrease in POC (particle dissolution) was observed in F and UF water.
Other aggregation experiments conducted in temperate regions where light is still available during winter show that particles form from filtered water during this time of the year (Riley, 1963; Sheldon et al., 1967). Our study, however, measured a decrease in POC concentrations during winter and changes in DOM composition (see Sect. 4.3.1) at the end of incubation (t1) compared to at the start of incubation (t0), which could indicate that this dissolution process occurs in the Arctic polar night but not in temperate regions. However, we also measured an increase in experimental EPS concentrations in the F water during February. This is supported by the low SPE–DOC percentage recovery observed in February (Fig. S9). As a result, several processes might occur simultaneously within the DOM–POM continuum throughout the winter. Our results indicate that dissolved EPS molecules (<0.45 µm) are aggregating, while, at the same time, POM is degraded by bacteria. Similarly, Xu and Guo (2018) showed that DOM compounds in a certain size range aggregated simultaneously, while other DOM compounds were degraded by bacteria.
Experimental POC concentrations at the start of incubation (4.7–5.3 µM in F water and 5.6–6.0 in UF water; Fig. S4) were similar to field POC concentrations in winter (around 4 µM, Fig. S2y), which suggests that particles were of extremely low abundance and size during the winter period (Table S1). Throughout the whole sampling period (September–August), experimental POC concentrations at t0 in UF water largely followed a similar seasonal pattern to field POC concentrations, although at lower levels. Note that the water collected for the UF treatment was sieved through a 90 µm mesh, while the water collected for field measurements was not sieved. However, experimental POC concentrations at t0 in F water seemingly followed opposite patterns, with low concentrations in September (2 µM) increasing in winter until February (5.3 µM) and sharply declining in April (1.6 µM; Fig. S4). A possible explanation is that, during filtration of water with high particle and EPS abundances, as is the case in the productive period, small molecules are retained on the filter because they get trapped in the sticky matrix or aggregates and therefore do not pass the filter pores and lead to lower POC concentrations in F water at t0 during the productive period compared to higher POC concentrations at t0 in the winter period.
4.3.1 Increased DOM lability during winter incubations
DOM molecular composition analysis during winter incubations (December and February) indicates a decrease in unsaturated DOM (Fig. 6) and an increase in the relative intensities of more saturated DOM (; Fig. S8). Moreover, average aromaticity (AImod wa) decreased during this period, which could be due to the removal of low- DOM, which is typically of higher aromaticity (Koch and Dittmar, 2006b). These observations indicate an increase in the average lability of DOM and could be partially due to the dissolution of organic particles observed during this period as this can lead to the production of more labile DOM. This is supported by the reduction in SPE–DOC percentage recovery observed during December incubations (Fig. S9), which indicates hydrophilic material at the end of incubation. Additionally, there was a significant decrease in a group of low- compounds referred to as terrestrial peaks (t-Peaks) in February (t test, p = 0.04, t value = 2.96, df = 4) and October (t test, p = 0.04, t value = 3.02, df = 4). These t-Peaks are a group of compounds that are commonly present in vastly different rivers, as reported by Medeiros et al. (2016; Fig. S7). Removal of these compounds could contribute to the increase in average ratios observed in February and October incubations. This suggests a potential degradation of t-Peak compounds during February and October, which is in contrast to September (t test, p = 0.08, t value = −2.31, df = 4) and December (t test, p = 0.09, t value = 2.21, df = 4), when t-Peaks did not significantly change during incubation (Fig. S7). Arctic winter microbial communities differ substantially from spring, summer, and autumn communities (Marquardt et al., 2016; Vonnahme et al., 2022; Wietz et al., 2021); therefore, the winter community is likely to be better adapted to degrade various carbon sources, while summer communities are specialized in degrading phytoplankton-derived DOM, as shown in Wilson et al. (2017). These findings support that terrestrial DOM is an important carbon source for bacteria during less productive periods in Ramfjorden (Vonnahme et al., 2022), which has implications for the fate of riverine DOM in sub-Arctic fjords and a freshening Arctic Ocean. Additionally, the winter presents a period where heterotrophs have less competition from photoautotrophs for essential nutrients, which could promote degradation of seemingly recalcitrant DOM (Dittmar, 2015).
There was also a removal of relatively higher-molecular-weight compounds (570–700 Da), as shown in mass spectra (Fig. 7c). These higher-molecular-weight compounds were in the middle and ratio regions of the van Krevelen diagram (Fig. S6), which are typically rich in carboxyl groups (Broek et al., 2020; Hertkorn et al., 2006). We suggest that the decrease in these compounds could indicate colloid formation through the adsorption of higher-molecular-weight compounds (>700 Da), as has been previously observed for carboxyl-rich organic matter (Chin et al., 1998). This corresponds to the increase in EPS molecules (<0.45 µm) observed in February incubations. Notably, experimental POC concentrations during the incubations indicate a dissolution and not an aggregation of particles during the winter. This could be due to the low relative intensity of these higher-molecular-weight compounds (570–700 Da); thus, there is no detection of increased POC concentrations during this period.
4.3.2 Carbon budget
Throughout the experiment, we expected that DOC and POC would behave antagonistically and, thus, that an increase in POC would see a corresponding decrease in DOC, resulting in a stable amount of total organic carbon (TOC; sum of DOC and POC). However, this was not always the case during our experiments; the most pronounced change in the carbon budget was an increase in both DOC (+180 µM in UF treatment) and POC (+1 µM) in September. This suggests either that our experiment was not a closed system or that there was an interchange with the inorganic C pool. Other studies also report synergistic relationships between POC and DOC during summer incubations and antagonistic relationships during freshet incubations (Keskitalo et al., 2022). This indicates a seasonal component to POC–DOC dynamics. Additionally, other incubation studies report large variability in changes in POC and DOC concentrations (Shakil et al., 2022). These findings highlight the challenges in organic carbon measurements as reported elsewhere (Gardner et al., 2003; Chow et al., 2022) and are likely due to the complex dynamics between POC and DOC, such as the sticky nature of EPS material which can be adsorbed into experimental containers (Chen et al., 2021). Notably, experimental DOC values of ultra-pure water blanks show average DOC concentrations of 31 µM ± 13 (mean ± SD), and DOM molecular analyses of ultrapure water experimental blanks reveal a relatively low number of contamination peaks (average number of peaks: 123 ± 33, mean ± SD), thus not affecting DOM characterization results and ruling out contamination as a source of significant carbon addition. Moreover, the DOC concentrations measured in the experiment are well within the range of the in situ measurements (ranging from 87 to 233 µM; Fig. S2k).
During the winter months, the carbon budget had a net loss of TOC (POC + DOC), as observed in February, which was most likely due to bacterial respiration of OM to CO2. In both October and December, a decrease in POC (−0.4 and −2 µM, respectively) did reflect an increase in DOC (+74 and +27 µM, respectively); however, this indicates a substantial additional source of DOC. The high increase in TOC observed in September, October, and December could be partly explained by carbon fixation in the dark by phytoplankton, with Vonnahme et al. (2022) and Hoppe et al. (2024) describing low but measurable primary production during winter. This may play a role in the increase in carbon observed in the unfiltered treatments where phytoplankton was abundant. In the filtered treatments, we did, however, observe a rapid increase in the activity of bacteria, presumably due to the fact that, in this fraction, they were released from the grazing pressure from bactivorous protists. Further, viruses are present in the filtered treatment and are at their peak abundance (up to 1.3×10⁷) in autumn. Viruses have a significant role in controlling microbial population (Suttle, 2007), which, during the lytic stage, can lead to a substantial production of DOM through viral lysis of microorganisms (Chen et al., 2022). We suggest that the production of DOC observed in September and October in the filtered treatment may be due to viral lysis of the otherwise rapidly growing bacterial community (relieved from grazing pressure and limited by neither carbon nor nutrients). In the unfiltered treatment, the presence of phytoplankton (new production) may explain the increase in DOC.
With its sharp seasonal gradients, the Arctic presents a suitable place to study the influence of different environmental factors on DOM and POM dynamics. Our results confirm our initial hypothesis that the aggregation potential of POM is higher in the productive period (an average increase in POC of +1.6 µM ± 0.5 within 36 h) compared to in the winter period, during which there was an average POC decrease of −2.55 µM ± 0.8. Our findings also reveal that the molecular characteristics of DOM during short-timescale incubations are influenced by contrasting seasonal conditions at high latitudes, with distinct transformations occurring during the biologically productive period and the winter period. It is important to note, however, that the POC and DOC pools did not behave antagonistically during our seasonal incubations, similarly to findings in other studies. This underlines the complexity of OM transitions, with colloids, gels, and biological communities likely playing an important role in these transformations, and more studies are needed to disclose the underlying mechanisms.
In winter (December and February), we observed an increase in average DOM lability that may be partially attributed to the solubilization of particles and colloids, supported by the dissolution of POC. However, the decrease in POC concentrations was much smaller than the observed changes in DOC, suggesting that the changes in DOM characterization are more likely to be driven by microbial degradation of DOM. The microbial communities may play a crucial role in driving these distinct processes as competition from autotrophs for essential nutrients is reduced during this period (Dittmar, 2015, and references therein). Additionally, during winter, there was a decrease in DOM compounds within the 570–700 Da molecular weight range in the middle and region of the van Krevelen diagram, indicating the removal of carboxyl-rich compounds. This has implications for carbon cycling through the removal of recalcitrant DOM components. Winter incubations also showed a significant decrease in so-called terrestrial peaks, with implications for the removal of river DOM. Dissolution, aggregation and microbial exchange of organic matter are not unique to the Arctic but rather are universal to all aquatic systems. With its seasonal extremes, our chosen study site provides unique insights into the switching between dominant mechanisms.
During the productive period (April–September), we observed an increase in POC concentrations, which is likely to be attributable to the aggregation processes of the colloid and dissolved pool. DOM characterization during incubations in this period showed reduced lability, suggesting microbial degradation of bioavailable DOM. October incubations showed a transitional period between the productive and winter months, with a decrease in labile DOM and an increase in recalcitrant compounds. These findings underline that changes during short time frames in the POM and DOM pools are highly subject to seasonal transformations and that biotic and abiotic processes drive these changes. A substantial fraction of POM can potentially originate from the DOM pool through aggregation, although the POC and DOC concentration dynamics indicate more complex processes taking place within the system. Additionally, aggregation within short time frames in the productive period (within 36 h, as we have shown) demonstrate that standard POC measurements in the field under periods of high production likely underestimate actual in situ POC concentrations as they do not account for the dynamic exchange with the DOM and colloidal pool.
All data are available on the NIRD research data archive (https://archive.sigma2.no, last access: 24 January 2025). Field data can be found under the following DOIs: https://doi.org/10.11582/2024.00096 (CDOM, Paulsen, 2024), https://doi.org/10.11582/2024.00116 (POC and PN, Bodur et al., 2024a), https://doi.org/10.11582/2024.00117 (Chl a, Amargant-Arumí et al., 2024a), https://doi.org/10.11582/2024.00118 (TPM, Amargant-Arumí et al., 2024b), https://doi.org/10.11582/2024.00119 (EPSs, Dietrich et al., 2024), https://doi.org/10.11582/2024.00120 (nutrients, Dubourg et al., 2024), https://doi.org/10.11582/2024.00131 (protists, Dąbrowska et al., 2024), and https://doi.org/10.11582/2024.00132 (FCM, Paulsen et al., 2024). Experimental data can be found under https://doi.org/10.11582/2024.00121 (POC, FCM, and EPSs, Bodur et al., 2024b) and https://doi.org/10.11582/2024.00098 (DOC and TDN, Digernes et al., 2024). The mass spectrometry raw files (mzXML) and MATLAB code for the DOM data can be found under https://doi.org/10.5281/zenodo.14272939 (Digernes and Hawkes, 2024).
The supplement related to this article is available online at: https://doi.org/10.5194/bg-22-601-2025-supplement.
MGD and YVB lead the study design, field work, data analysis, and writing of the article in equal measure. MLP and MAA contributed to the study design and sample analysis. MAA took part in the field work and was responsible for the sampling and analysis of the field parameters. MGD was responsible for the dissolved parameters of the experiments, and YVB was responsible for the particulate and biological parameters of the experiment. MLP analyzed the FCM and colored-DOM samples. JAH contributed to the sampling and data analysis of DOM, and UD analyzed the EPS samples. SGK contributed to the field work and sample analysis. The draft of the paper was written by YVB, MGD, and MLP, and all the authors contributed to the interpretation of the data and commented on the paper. All the authors read and approved the final paper.
The contact author has declared that none of the authors has any competing interests.
Publisher’s note: Copernicus Publications remains neutral with regard to jurisdictional claims made in the text, published maps, institutional affiliations, or any other geographical representation in this paper. While Copernicus Publications makes every effort to include appropriate place names, the final responsibility lies with the authors.
We would like to thank the crew of RV Hyas, who made it possible to collect samples every month. We thank Reidar Kaasa and Per Gjerp for manufacturing the experimental equipment and Evald Nordli for the logistics. We thank Camilla Svensen, Lena Seuthe, Rolf Gradinger, and Tobias Vonnahme for their input regarding the experimental setup and fieldwork, and we thank Tobias Kielland, Lena Seuthe, Elisabeth Halvorsen, and Anna Miettinen for their help in the field and in the lab. We also would like to thank Anna Maria Dąbrowska for the taxonomic identification of protists. We thank Murat Ardelan and Morten Iversen for the valuable scientific discussions.
This study was funded by the Research Council of Norway (grant no. 276730), through the Nansen Legacy project (Maria G. Digernes, Yasemin V. Bodur, Martí Amargant-Arumí, Stephen G. Kohler, Oliver Müller, and Marit Reigstad); the Norwegian University of Science and Technology (NTNU; Maria G. Digernes, Stephen G. Kohler); UiT The Arctic University of Norway (Yasemin V. Bodur, Martí Amargant-Arumí); and the EU Horizon 2020 MSCA-IF FlocDOM project (grant no. 800371 to Maria L. Paulsen).
This paper was edited by Yuan Shen and reviewed by two anonymous referees.
Alldredge, A. L. and Gotschalk, C. C.: Direct observations of the mass flocculation of diatom blooms: characteristics, settling velocities and formation of diatom aggregates, Deep-Sea Res. Pt. A, 36, 159–171, https://doi.org/10.1016/0198-0149(89)90131-3, 1989.
Alldredge, A. L. and Jackson, G.: Aggregation in marine systems, Deep-Sea Res. Pt. II, 42, 1–7, 1995.
Amargant-Arumí, M., Bodur, Y. V., Miettinen, A., Dietrich, U., Seuthe, L., and Halvorsen, E.: Monthly measurements of size-fractionated Chlorophyll-a and phaeopigments in a sub-Arctic fjord, Ramfjord in Tromsø, Norway between September 2020 and August 2021, Norstore [data set], https://doi.org/10.11582/2024.00117, 2024a.
Amargant-Arumí, M., Miettinen, A., Dietrich, U., Bodur, Y. V., Seuthe, L., and Halvorsen, E.: Monthly measurements of total particulate matter and its organic and inorganic compartment in a sub-Arctic fjord, Ramfjord in Tromsø, Norway between September 2020 and August 2021, Norstore [data set], https://doi.org/10.11582/2024.00118, 2024b.
Attermeyer, K., Catalán, N., Einarsdóttir, K., Freixa, A., Groeneveld, M., Hawkes, J. A., Bergquist, J., and Tranvik, L. J.: Organic Carbon Processing During Transport Through Boreal Inland Waters: Particles as Important Sites, J. Geophys. Res.-Biogeo., 123, 2412–2428, https://doi.org/10.1029/2018JG004500, 2018.
Benner, R. and Amon, R. M.: The size-reactivity continuum of major bioelements in the ocean, Annu. Rev. Mar. Sci., 7, 185–205, https://doi.org/10.1146/annurev-marine-010213-135126, 2015.
Bittar, T. B., Passow, U., Hamaraty, L., Bidle, K. D., and Harvey, E. L.: An updated method for the calibration of transparent exopolymer particle measurements: Updated TEP calibration method, Limnol. Oceanogr. Meth., 16, 621–628, https://doi.org/10.1002/lom3.10268, 2018.
Bodur, Y. V., Dubourg, P., Amargant-Arumí, M., Miettinen, A., Dietrich, U., Seuthe, L., and Halvorsen, E.: Monthly measurements of particulate organic carbon and nitrogen concentrations in a sub-Arctic fjord, Ramfjord in Tromsø, Norway between September 2020 and August 2021, Norstore [data set], https://doi.org/10.11582/2024.00116, 2024a.
Bodur, Y. V., Digernes, M. G., Paulsen, M. L., Dubourg, P., and Dietrich, U.: Measurements of particulate organic carbon and nitrogen concentrations, extracellular polymeric substance concentrations and flow cytometry measurements from an aggregation experiment in a sub-Arctic fjord, Ramfjord in Tromsø, Norway, Norstore [data set], https://doi.org/10.11582/2024.00121, 2024b.
Broek, T. A. B., Walker, B. D., Guilderson, T. P., Vaughn, J. S., Mason, H. E., and McCarthy, M. D.: Low Molecular Weight Dissolved Organic Carbon: Aging, Compositional Changes, and Selective Utilization During Global Ocean Circulation, Global Biogeochem. Cy., 34, e2020GB006547, https://doi.org/10.1029/2020GB006547, 2020.
Burd, A. B. and Jackson, G. A.: Particle Aggregation, Annu. Rev. Mar. Sci., 1, 65–90, https://doi.org/10.1146/annurev.marine.010908.163904, 2009.
Cai, R. and Jiao, N.: Recalcitrant dissolved organic matter and its major production and removal processes in the ocean, Deep-Sea Res. Pt. I, 191, 103922, https://doi.org/10.1016/j.dsr.2022.103922, 2023.
Carlson, C. A. and Hansell, D. A.: Chapter 3 – DOM Sources, Sinks, Reactivity, and Budgets, in: Biogeochemistry of Marine Dissolved Organic Matter, 2nd Edn., edited by: Hansell, D. A. and Carlson, C. A., Academic Press, Boston, 65–126, https://doi.org/10.1016/B978-0-12-405940-5.00003-0, 2015.
Carlson, C. A., Hansell, D. A., Hansell, D. A., and Carlson, C. A.: DOM Sources, Sinks, Reactivity, and Budgets, in: Biogeochemistry of Marine Dissolved Organic Matter, Elsevier, 65–126, https://doi.org/10.1016/B978-0-12-405940-5.00003-0, 2015.
Chen, C.-S., Shiu, R.-F., Hsieh, Y.-Y., Xu, C., Vazquez, C. I., Cui, Y., Hsu, I. C., Quigg, A., Santschi, P. H., and Chin, W.-C.: Stickiness of extracellular polymeric substances on different surfaces via magnetic tweezers, Sci. Total Environ., 757, 143766, https://doi.org/10.1016/j.scitotenv.2020.143766, 2021.
Chen, X., Wei, W., Xiao, X., Wallace, D., Hu, C., Zhang, L., Batt, J., Liu, J., Gonsior, M., Zhang, Y., LaRoche, J., Hill, P., Xu, D., Wang, J., Jiao, N., and Zhang, R.: Heterogeneous viral contribution to dissolved organic matter processing in a long-term macrocosm experiment, Environment Int., 158, 106950, https://doi.org/10.1016/j.envint.2021.106950, 2022.
Chin, W.-C., Orellana, M. V., and Verdugo, P.: Spontaneous assembly of marine dissolved organic matter into polymer gels, Nature, 391, 568–572, https://doi.org/10.1038/35345, 1998.
Chow, A. T.-S., Ulus, Y., Huang, G., Kline, M. A., and Cheah, W.-Y. Challenges in quantifying and characterizing dissolved organic carbon: Sampling, isolation, storage, and analysis, J. Environ. Qual., 51, 837–871, https://doi.org/10.1002/jeq2.20392, 2022.
Clarke, K. R., Somerfield, P. J., and Gorley, R. N.: Testing of null hypotheses in exploratory community analyses: similarity profiles and biota-environment linkage, J. Exp. Mar. Biol. Ecol., 366, 56–69, https://doi.org/10.1016/j.jembe.2008.07.009, 2008.
Coguiec, E., Ershova, E. A., Daase, M., Vonnahme, T. R., Wangensteen, O. S., Gradinger, R., Præbel, K., and Berge, J.: Seasonal Variability in the Zooplankton Community Structure in a Sub-Arctic Fjord as Revealed by Morphological and Molecular Approaches, Front. Mar. Sci., 8, 705042, https://doi.org/10.3389/fmars.2021.705042, 2021.
Dąbrowska, A. M., Bodur, Y. V., Amargant-Arumí, M., Wiktor, J. M., and Institute of Oceanology of the Polish Academy of Sciences: Monthly resolution of suspended protist taxonomy and abundance in Ramfjorden/Gáranasvuotna (Northern Norway) between September 2020–August 2021, Norstore [data set], https://doi.org/10.11582/2024.00131, 2024.
Dam, H. G. and Drapeau, D. T.: Coagulation efficiency, organic-matter glues and the dynamics of particles during a phytoplankton bloom in a mesocosm study, Deep-Sea Res. Pt. II, 42, 111–123, https://doi.org/10.1016/0967-0645(95)00007-D, 1995.
D'Andrilli, J., Cooper, W. T., Foreman, C. M., and Marshall, A. G.: An ultrahigh-resolution mass spectrometry index to estimate natural organic matter lability, Rapid Commun. Mass Sp., 29, 2385–2401, https://doi.org/10.1002/rcm.7400, 2015.
D'Andrilli, J., Romero, C. M., Zito, P., Podgorski, D. C., Payn, R. A., Sebestyen, S. D., Zimmerman, A. R., and Rosario-Ortiz, F. L.: Advancing chemical lability assessments of organic matter using a synthesis of FT-ICR MS data across diverse environments and experiments, Org. Geochem., 184, 104667, https://doi.org/10.1016/j.orggeochem.2023.104667, 2023.
Dietrich, U., Amargant-Arumi, M., Bodur, Y. V., Miettinen, A., Seuthe, L., and Halvorsen, E.: Monthly measurements of extracellular polymeric substances in a sub-Arctic fjord, Ramfjord in Tromsø, Norway between September 2020 and August 2021, Norstore [data set], https://doi.org/10.11582/2024.00119, 2024.
Digernes, M. G. and Hawkes, J.: Raw mass spectrometry data (mzXML) and MATLAB code for DOM in- Contrasting seasonal patterns in particle aggregation and DOM transformation in a sub-Arctic fjord (v1.0.0), Zenodo [data set], https://doi.org/10.5281/zenodo.14272939, 2024.
Digernes, M. G., Bodur, Y. V., and Kielland, T.: Dissolved organic carbon concentration and total dissolved nitrogen measurements in aggregation experiment in a sub-Arctic fjord, Ramfjord in Tromsø, Norway, Norstore [data set], https://doi.org/10.11582/2024.00098, 2024.
Dittmar, T.: Chapter 7 – Reasons Behind the Long-Term Stability of Dissolved Organic Matter, in: Hansell, D. A. and Carlson, C. A., Biogeochemistry of Marine Dissolved Organic Matter, 2nd Edn., 369–388, Academic Press, https://doi.org/10.1016/B978-0-12-405940-5.00007-8, 2015.
Dittmar, T., Koch, B., Hertkorn, N., and Kattner, G.: A simple and efficient method for the solid-phase extraction of dissolved organic matter (SPE-DOM) from seawater, Limnol. Oceanogr. Meth., 6, 230–235, https://doi.org/10.4319/lom.2008.6.230, 2008.
Druffel, E. R. M., Williams, P. M., Bauer, J. E., and Ertel, J. R.: Cycling of dissolved and particulate organic matter in the open ocean, J. Geophys. Res.-Oceans, 97, 15639–15659, https://doi.org/10.1029/92JC01511, 1992.
Dubois, M., Gilles, K. A., Hamilton, J. K., Rebers, P. A., and Smith, F.: Colorimetric Method for Determination of Sugars and Related Substances, Anal. Chem., 28, 350–356, https://doi.org/10.1021/ac60111a017, 1956.
Dubourg, P., Amargant-Arumí, M., Bodur, Y. V., Miettinen, A., Seuthe, L., and Halvorsen, E.: Monthly measurements of dissolved nutrients (nitrate, nitrite, phosphate, silicate) in a sub-Arctic fjord, Ramfjord in Tromsø, Norway between September 2020 and August 2021, Norstore [data set], https://doi.org/10.11582/2024.00120, 2024.
Edler, L. and Elbrächter, M.: The Utermöhl method for quantitative phytoplankton analysis, in: Microscopic and molecular methods for quantitative phytoplankton analysis, Vol. 110, Unesco Pub., 13–20, Intergovernmental Oceanographic Commission, IOC/2010/MG/55, https://unesdoc.unesco.org/ark:/48223/pf0000187824 (last access: 24 January 2025), 2010.
Eilertsen, H. C., Falk-Petersen, S., Hopkins, C. C. E., and Tande, K.: Ecological investigations on the plankton community of Balsfjorden, northern Norway: program for the project, study area, topography, and physical environment, Sarsia, 66, 25–34, 1981.
Einarsdóttir, K., Attermeyer, K., Hawkes, J. A., Kothawala, D., Sponseller, R. A., and Tranvik, L. J.: Particles and Aeration at Mire-Stream Interfaces Cause Selective Removal and Modification of Dissolved Organic Matter, J. Geophys. Res.-Biogeo., 125, e2020JG005654, https://doi.org/10.1029/2020JG005654, 2020.
Engel, A.: The role of transparent exopolymer particles (TEP) in the increase in apparent particle stickiness (α) during the decline of a diatom bloom, J. Plankton Res., 22, 485–497, 2000.
Engel, A. and Passow, U.: Carbon and nitrogen content of transparent exopolymer particles (TEP) in relation to their Alcian Blue adsorption, Mar. Ecol.-Prog. Ser., 219, 1–10, https://doi.org/10.3354/meps219001, 2001.
Engel, A., Thoms, S., Riebesell, U., Rochelle-Newall, E., and Zondervan, I.: Polysaccharide aggregation as a potential sink of marine dissolved organic carbon, Nature, 428, 929–932, https://doi.org/10.1038/nature02453, 2004.
Flerus, R., Lechtenfeld, O. J., Koch, B. P., McCallister, S. L., Schmitt-Kopplin, P., Benner, R., Kaiser, K., and Kattner, G.: A molecular perspective on the ageing of marine dissolved organic matter, Biogeosciences, 9, 1935–1955, https://doi.org/10.5194/bg-9-1935-2012, 2012.
Fonvielle, J. A., Felgate, S. L., Tanentzap, A. J., and Hawkes, J. A.: Assessment of sample freezing as a preservation technique for analysing the molecular composition of dissolved organic matter in aquatic systems, RSC Advances, 13, 24594–24603, https://doi.org/10.1039/D3RA01349A, 2023.
Forest, A., Babin, M., Stemmann, L., Picheral, M., Sampei, M., Fortier, L., Gratton, Y., Bélanger, S., Devred, E., Sahlin, J., Doxaran, D., Joux, F., Ortega-Retuerta, E., Martín, J., Jeffrey, W. H., Gasser, B., and Carlos Miquel, J.: Ecosystem function and particle flux dynamics across the Mackenzie Shelf (Beaufort Sea, Arctic Ocean): an integrative analysis of spatial variability and biophysical forcings, Biogeosciences, 10, 2833–2866, https://doi.org/10.5194/bg-10-2833-2013, 2013.
Gardner, W. D., Richardson, M. J., Carlson, C. A., Hansell, D., and Mishonov, A. V. Determining true particulate organic carbon: Bottles, pumps and methodologies, US Southern Ocean JGOFS Program (AESOPS): Part III, 50, 655–674, https://doi.org/10.1016/S0967-0645(02)00589-1, 2003.
Goldberg, S. J., Carlson, C. A., Hansell, D. A., Nelson, N. B., and Siegel, D. A.: Temporal dynamics of dissolved combined neutral sugars and the quality of dissolved organic matter in the Northwestern Sargasso Sea, Deep-Sea Res. Pt. I, 56, 672–685, https://doi.org/10.1016/j.dsr.2008.12.013, 2009.
Grasset, C., Groeneveld, M., Tranvik, L. J., Robertson, L. P., and Hawkes, J. A.: Hydrophilic Species Are the Most Biodegradable Components of Freshwater Dissolved Organic Matter, Environ. Sci. Technol., 57, 13463–13472, https://doi.org/10.1021/acs.est.3c02175, 2023.
Gruber, D. F., Simjouw, J. P., Seitzinger, S. P., and Taghon, G. L.: Dynamics and characterization of refractory dissolved organic matter produced by a pure bacterial culture in an experimental predator-prey system, Appl. Environ. Microb., 72, 4184–4191, https://doi.org/10.1128/aem.02882-05, 2006.
Hammer, Ø., Harper, D. A. T., and Ryan, P. D.: PAST: Paleontological statistics software package for education and data analysis (Version 4.15, Vol. 4, p. 9), Palaeontologia Electronica [computer software], https://www.nhm.uio.no/english/research/resources/past/ (last access: 24 January 2025), 2001.
Hansell, D. A.: Recalcitrant Dissolved Organic Carbon Fractions, Annu. Rev. Mar. Sci., 5, 421–445, https://doi.org/10.1146/annurev-marine-120710-100757, 2013.
Hansell, D. A., Carlson, C., Repeta, D., and Schlitzer, R.: Dissolved Organic Matter in the Ocean: A Controversy Stimulates New Insights, Oceanography, 22, 202–211, https://doi.org/10.5670/oceanog.2009.109, 2009.
He, W., Chen, M., Schlautman, M. A., and Hur, J.: Dynamic exchanges between DOM and POM pools in coastal and inland aquatic ecosystems: A review, Sci. Total Environ., 551–552, 415–428, https://doi.org/10.1016/j.scitotenv.2016.02.031, 2016.
Hellebust, J. A.: Excretion of Some Organic Compounds by Marine Phytoplankton, Limnol. Oceanogr., 10, 192–206, https://doi.org/10.4319/lo.1965.10.2.0192, 1965.
Hertkorn, N., Benner, R., Frommberger, M., Schmitt-Kopplin, P., Witt, M., Kaiser, K., Kettrup, A., and Hedges, J. I.: Characterization of a major refractory component of marine dissolved organic matter, Geochim. Cosmochim. Ac., 70, 2990–3010, https://doi.org/10.1016/j.gca.2006.03.021, 2006.
Hertkorn, N., Harir, M., Koch, B. P., Michalke, B., and Schmitt-Kopplin, P.: High-field NMR spectroscopy and FTICR mass spectrometry: powerful discovery tools for the molecular level characterization of marine dissolved organic matter, Biogeosciences, 10, 1583–1624, https://doi.org/10.5194/bg-10-1583-2013, 2013.
Hopkinson, C. S. and Vallino, J. J.: Efficient export of carbon to the deep ocean through dissolved organic matter, Nature, 433, 142–145, https://doi.org/10.1038/nature03191, 2005.
Hoppe, C. J. M., Fuchs, N., Notz, D., Anderson, P., Assmy, P., Berge, J., Bratbak, G., Guillou, G., Kraberg, A., Larsen, A., Lebreton, B., Leu, E., Lucassen, M., Müller, O., Oziel, L., Rost, B., Schartmüller, B., Torstensson, A., and Wloka, J.: Photosynthetic light requirement near the theoretical minimum detected in Arctic microalgae, Nat. Commun., 15, 7385, https://doi.org/10.1038/s41467-024-51636-8, 2024.
Iversen, M. H.: Carbon export in the ocean: A biologist's perspective, Annu. Rev. Mar. Sci., 15, 357–381, https://doi.org/10.1146/annurev-marine-032122-035153, 2023.
Jiao, N., Herndl, G. J., Hansell, D. A., Benner, R., Kattner, G., Wilhelm, S. W., Kirchman, D. L., Weinbauer, M. G., Luo, T., Chen, F., and Azam, F.: Microbial production of recalcitrant dissolved organic matter: long-term carbon storage in the global ocean, Nat. Rev. Microbiol., 8, 593–599, https://doi.org/10.1038/nrmicro2386, 2010.
Kepkay, P. E.: Particle aggregation and the biological reactivity of colloids, Mar. Ecol.-Prog. Ser., 109, 293–304, https://doi.org/10.3354/meps109293, 1994.
Kerner, M., Hohenberg, H., Ertl, S., Reckermann, M., and Spitzy, A.: Self-organization of dissolved organic matter to micelle-like microparticles in river water, Nature, 422, 150–154, https://doi.org/10.1038/nature01469, 2003.
Keskitalo, K. H., Bröder, L., Jong, D., Zimov, N., Davydova, A., Davydov, S., Tesi, T., Mann, P. J., Haghipour, N., Eglinton, T. I., and Vonk, J. E.: Seasonal variability in particulate organic carbon degradation in the Kolyma River, Siberia, Environ. Res. Lett., 17, 034007, https://doi.org/10.1088/1748-9326/ac4f8d, 2022.
Kirchman, D. L., Meon, B., Ducklow, H. W., Carlson, C. A., Hansell, D. A., and Steward, G. F.: Glucose fluxes and concentrations of dissolved combined neutral sugars (polysaccharides) in the Ross Sea and Polar Front Zone, Antarctica, US Southern Ocean JGOFS Program (AESOPS) – Part II, 48, 4179–4197, https://doi.org/10.1016/S0967-0645(01)00085-6, 2001.
Kiørboe, T.: Formation and fate of marine snow: small-scale processes with large-scale implications, Sci. Mar., 65, 57–71, https://doi.org/10.3989/scimar.2001.65s257, 2001.
Koch, B. P. and Dittmar, T.: From mass to structure: an aromaticity index for high-resolution mass data of natural organic matter, Rapid Commun. Mass Sp., 20, 926–932, https://doi.org/10.1002/rcm.2386, 2006a.
Koch, B. P. and Dittmar, T.: From mass to structure: an aromaticity index for high-resolution mass data of natural organic matter, Rapid Commun. Mass Sp., 20, 926–932, https://doi.org/10.1002/rcm.2386, 2006b.
Koch, B. P., Witt, M., Engbrodt, R., Dittmar, T., and Kattner, G.: Molecular formulae of marine and terrigenous dissolved organic matter detected by electrospray ionization Fourier transform ion cyclotron resonance mass spectrometry, Geochim. Cosmochim. Ac., 69, 3299–3308, https://doi.org/10.1016/j.gca.2005.02.027, 2005.
Li, X., Skillman, L., Li, D., and Ela, W. P.: Comparison of Alcian blue and total carbohydrate assays for quantitation of transparent exopolymer particles (TEP) in biofouling studies, Water Res., 133, 60–68, https://doi.org/10.1016/j.watres.2017.12.021, 2018.
Mague, T. H., Friberg, E., Hughes, D. J., and Morris, I.: Extracellular release of carbon by marine phytoplankton; a physiological approach1, Limnol. Oceanogr., 25, 262–279, https://doi.org/10.4319/lo.1980.25.2.0262, 1980.
Maie, N., Pisani, O., and Jaffé, R.: Mangrove tannins in aquatic ecosystems: Their fate and possible influence on dissolved organic carbon and nitrogen cycling, Limnol. Oceanogr., 53, 160–171, https://doi.org/10.4319/lo.2008.53.1.0160, 2008.
Mari, X. and Burd, A.: Seasonal size spectra of transparent exopolymeric particles (TEP) in a coastal sea and comparison with those predicted using coagulation theory, Mar. Ecol.-Prog. Ser., 163, 63–76, https://doi.org/10.3354/meps163063, 1998.
Marquardt, M., Vader, A., Stübner, E. I., Reigstad, M., and Gabrielsen, T. M.: Strong Seasonality of Marine Microbial Eukaryotes in a High-Arctic Fjord (Isfjorden, in West Spitsbergen, Norway), Appl. Environ. Microb., 82, 1868–1880, https://doi.org/10.1128/AEM.03208-15, 2016.
Medeiros, P. M., Seidel, M., Niggemann, J., Spencer, R. G. M., Hernes, P. J., Yager, P. L., Miller, W. L., Dittmar, T., and Hansell, D. A.: A novel molecular approach for tracing terrigenous dissolved organic matter into the deep ocean, Global Biogeochem. Cy., 30, 689–699, https://doi.org/10.1002/2015GB005320, 2016.
Myklestad, S. M.: Release of extracellular products by phytoplankton with special emphasis on polysaccharides, Sci. Total Environ., 165, 155–164, https://doi.org/10.1016/0048-9697(95)04549-G, 1995.
Orellana, M. V. and Leck, C.: Marine Microgels, in: Biogeochemistry of Marine Dissolved Organic Matter, edited by: Hansell, D. A. and Carlson, C. A., Elsevier, 451–480, https://doi.org/10.1016/B978-0-12-405940-5.00009-1, 2015.
O'Sadnick, M., Petrich, C., Brekke, C., and Skarðhamar, J.: Ice extent in sub-arctic fjords and coastal areas from 2001 to 2019 analyzed from MODIS imagery, Ann. Glaciol., 61, 210–226, https://doi.org/10.1017/aog.2020.34, 2020.
Osterholz, H., Dittmar, T., and Niggemann, J.: Molecular evidence for rapid dissolved organic matter turnover in Arctic fjords, Mar. Chem., 160, 1–10, https://doi.org/10.1016/j.marchem.2014.01.002, 2014.
Parsons, T. R., Maita, Y., and Lalli, C. M.: Fluorometric Determination of Chlorophylls, in: A Manual of Chemical & Biological Methods for Seawater Analysis, edited by: Parsons, T. R., Maita, Y., and Lalli, C. M., Pergamon, Amsterdam, 107–109, https://doi.org/10.1016/B978-0-08-030287-4.50034-7, 1984.
Passow, U.: Formation of transparent exopolymer particles, TEP, from dissolved precursor material, Mar. Ecol.-Prog. Ser., 192, 1–11, https://doi.org/10.3354/meps192001, 2000.
Passow, U.: Production of transparent exopolymer particles (TEP) by phyto- and bacterioplankton, Mar. Ecol.-Prog. Ser., 236, 1–12, https://doi.org/10.3354/meps236001, 2002a.
Passow, U.: Transparent exopolymer particles (TEP) in aquatic environments, Prog. Oceanogr., 55, 287–333, https://doi.org/10.1016/S0079-6611(02)00138-6, 2002b.
Passow, U. and Alldredge, A. L.: A dye-binding assay for the spectrophotometric measurement of transparent exopolymer particles (TEP), Limnol. Oceanogr., 40, 1326–1335, https://doi.org/10.4319/lo.1995.40.7.1326, 1995.
Passow, U., Alldredge, A. L., and Logan, B. E.: The role of particulate carbohydrate exudates in the flocculation of diatom blooms, Deep-Sea Res. Pt. I, 41, 335–357, https://doi.org/10.1016/0967-0637(94)90007-8, 1994.
Paulsen, M. L.: Ramfjord cdom absorbance at 350 nm Tromsø Norway, Norstore [data set], https://doi.org/10.11582/2024.00096, 2024.
Paulsen, M. L., Seuthe, L., Reigstad, M., Larsen, A., Cape, M., and Vernet, M.: Asynchronous Accumulation of Organic Carbon and Nitrogen in the Atlantic Gateway to the Arctic Ocean, Front. Mar. Sci., 5, 2296–7745, https://doi.org/10.3389/fmars.2018.00416, 2018.
Paulsen, M. L., Müller, O., Larsen, A., Møller, E. F., Middelboe, M., Sejr, M. K., and Stedmon, C.: Biological transformation of Arctic dissolved organic matter in a NE Greenland fjord, Limnol. Oceanogr., 64, 1014–1033, https://doi.org/10.1002/lno.11091, 2019.
Paulsen, M. L., Bodur, Y. V., and Amargant-Arumí, M.: Monthly flow cytometry measurements in a sub-Arctic fjord, Ramfjord in Tromsø, Norway between September 2020 and August 2021, Norstore [data set], https://doi.org/10.11582/2024.00132, 2024.
Petersen, G. H. and Curtis, M. A.: Differences in energy flow through major components of subarctic, temperate and tropical marine sheif ecosystems, Dana, 1, 53–64, 1980.
Pisani, O., Yamashita, Y., and Jaffé, R.: Photo-dissolution of flocculent, detrital material in aquatic environments: Contributions to the dissolved organic matter pool, Water Res., 45, 3836–3844, https://doi.org/10.1016/j.watres.2011.04.035, 2011.
R Core Team: R: A Language and Environment for Statistical Computing, R Foundation for Statistical Computing, Vienna, Austria [software], https://www.r-project.org/ (last access: 24 January 2025), 2018.
Repeta, D. J.: Chemical Characterization and Cycling of Dissolved Organic Matter, in: Biogeochemistry of Marine Dissolved Organic Matter, Elsevier, 21–63, https://doi.org/10.1016/B978-0-12-405940-5.00002-9, 2015.
Retelletti Brogi, S., Jung, J. Y., Ha, S.-Y., and Hur, J.: Seasonal differences in dissolved organic matter properties and sources in an Arctic fjord: Implications for future conditions, Sci. Total Environ., 694, 133740, https://doi.org/10.1016/j.scitotenv.2019.133740, 2019.
Riebesell, U., Reigstad, M., Wassmann, P., Noji, T., and Passow, U.: On the trophic fate of Phaeocystis pouchetii (hariot): VI. Significance of Phaeocystis-derived mucus for vertical flux, Neth. J. Sea Res., 33, https://doi.org/10.1016/0077-7579(95)90006-3, 1995.
Riedel, T., Zark, M., Vähätalo, A. V., Niggemann, J., Spencer, R. G. M., Hernes, P. J., and Dittmar, T.: Molecular Signatures of Biogeochemical Transformations in Dissolved Organic Matter from Ten World Rivers, Front. Earth Sci., 4, 85, https://doi.org/10.3389/feart.2016.00085, 2016.
Riley, G. A.: Organic Aggregates in Seawater and the Dynamics of Their Formation and Utilization, Limnol. Oceanogr., 8, 372–381, https://doi.org/10.4319/lo.1963.8.4.0372, 1963.
Shakil, S., Tank, S. E., Vonk, J. E., and Zolkos, S.: Low biodegradability of particulate organic carbon mobilized from thaw slumps on the Peel Plateau, NT, and possible chemosynthesis and sorption effects, Biogeosciences, 19, 1871–1890, https://doi.org/10.5194/bg-19-1871-2022, 2022.
Sheldon, R. W., Evelyn, T. P. T., and Parsons, T. R.: On the Occurrence and Formation of Small Particles in Seawater, Limnol. Oceanogr., 12, 367–375, https://doi.org/10.4319/lo.1967.12.3.0367, 1967.
Sleighter, R. L. and Hatcher, P. G.: Molecular characterization of dissolved organic matter (DOM) along a river to ocean transect of the lower Chesapeake Bay by ultrahigh resolution electrospray ionization Fourier transform ion cyclotron resonance mass spectrometry, Mar. Chem., 110, 140–152, https://doi.org/10.1016/j.marchem.2008.04.008, 2008.
Suttle, C. A.: Marine viruses – major players in the global ecosystem, Nat. Rev. Microbiol., 5, 801–812, https://doi.org/10.1038/nrmicro1750, 2007.
Svensen, C. and Vernet, M.: Production of dissolved organic carbon by Oithona nana (Copepoda: Cyclopoida) grazing on two species of dinoflagellates, Mar. Biol., 163, 237, https://doi.org/10.1007/s00227-016-3005-9, 2016.
Thornton, D. C. O.: Diatom aggregation in the sea: mechanisms and ecological implications, Euro. J. Phycol., 37, 149–161, https://doi.org/10.1017/S0967026202003657, 2002.
Thornton, D. C. O.: Dissolved organic matter (DOM) release by phytoplankton in the contemporary and future ocean, Eur. J. Phycol., 49, 20–46, https://doi.org/10.1080/09670262.2013.875596, 2014.
Timko, S. A., Gonsior, M., and Cooper, W. J.: Influence of pH on fluorescent dissolved organic matter photo-degradation, Water Res., 85, 266–274, https://doi.org/10.1016/j.watres.2015.08.047, 2015.
Turner, J. T.: Zooplankton fecal pellets, marine snow, phytodetritus and the ocean's biological pump, Prog. Oceanogr., 130, 205–248, https://doi.org/10.1016/j.pocean.2014.08.005, 2015.
Utermöhl, H.: Zur Vervollkommnung der quantitativen Phytoplankton-Methodik, SIL Communications, 9, 1953–1996, https://doi.org/10.1080/05384680.1958.11904091, 1958.
Valdes Villaverde, P., Almeda Jauregui, C., and Maske, H.: Rapid abiotic transformation of marine dissolved organic material to particulate organic material in surface and deep waters, Biogeosciences Discuss. [preprint], https://doi.org/10.5194/bg-2020-291, 2020.
Verdugo, P., Alldredge, A. L., Azam, F., Kirchman, D. L., Passow, U., and Santschi, P. H.: The oceanic gel phase: a bridge in the DOM–POM continuum, Mar. Chem., 92, 67–85, https://doi.org/10.1016/j.marchem.2004.06.017, 2004.
Vernet, M., Matrai, P. A., and Andreassen, I.: Synthesis of particulate and extracellular carbon by phytoplankton at the marginal ice zone in the Barents Sea, J. Geophys. Res.-Oceans, 103, 1023–1037, https://doi.org/10.1029/97JC02288, 1998.
Vonnahme, T. R., Klausen, L., Bank, R. M., Michellod, D., Lavik, G., Dietrich, U., and Gradinger, R.: Light and freshwater discharge drive the biogeochemistry and microbial ecology in a sub-Arctic fjord over the Polar night, Front. Mar. Sci., 9, 915192, https://doi.org/10.3389/fmars.2022.915192, 2022.
von Jackowski, A., Grosse, J., Nothig, E. M., and Engel, A.: Dynamics of organic matter and bacterial activity in the Fram Strait during summer and autumn, Philos. T. R. Soc. A, 378, 20190366, https://doi.org/10.1098/rsta.2019.0366, 2020.
Wagner, S., Schubotz, F., Kaiser, K., Hallmann, C., Waska, H., Rossel, P. E., Hansman, R., Elvert, M., Middelburg, J. J., Engel, A., Blattmann, T. M., Catalá, T. S., Lennartz, S. T., Gomez-Saez, G. V., Pantoja-Gutiérrez, S., Bao, R., and Galy, V.: Soothsaying DOM: A Current Perspective on the Future of Oceanic Dissolved Organic Carbon, Front. Mar. Sci., 7, 341, https://doi.org/10.3389/fmars.2020.00341, 2020.
Walker, E. Z., Wiedmann, I., Nikolopoulos, A., Skarðhamar, J., Jones, E. M., and Renner, A. H. H.: Pelagic ecosystem dynamics between late autumn and the post spring bloom in a sub-Arctic fjord, Elementa, 10, 00070, https://doi.org/10.1525/elementa.2021.00070, 2022.
Wells, M. L.: Marine colloids: A neglected dimension, Nature, 391, 530–531, https://doi.org/10.1038/35248, 1998.
Wetz, M. S. and Wheeler, P. A.: Release of dissolved organic matter by coastal diatoms, Limnol. Oceanogr., 52, 798–807, https://doi.org/10.4319/lo.2007.52.2.0798, 2007.
Wietz, M., Bienhold, C., Metfies, K., Torres-Valdés, S., von Appen, W.-J., Salter, I., and Boetius, A.: The polar night shift: seasonal dynamics and drivers of Arctic Ocean microbiomes revealed by autonomous sampling, ISME Commun., 1, 1–12, https://doi.org/10.1038/s43705-021-00074-4, 2021.
Wilson, B., Müller, O., Nordmann, E.-L., Seuthe, L., Bratbak, G., and Øvreås, L.. Changes in Marine Prokaryote Composition with Season and Depth Over an Arctic Polar Year, Frontiers in Marine Science, 4, 95, https://doi.org/10.3389/fmars.2017.00095, 2017.
Xu, H. and Guo, L.: Intriguing changes in molecular size and composition of dissolved organic matter induced by microbial degradation and self-assembly, Water Res., 135, 187–194, https://doi.org/10.1016/j.watres.2018.02.016, 2018.