the Creative Commons Attribution 4.0 License.
the Creative Commons Attribution 4.0 License.
 | 14 Nov 2025
Relationships between phytoplankton pigments and DNA- or RNA-based abundances support ecological applications
Robert H. Lampe
Ariel J. Rabines
Steffaney M. Wood-Rocca
Anne Schulberg
Ralf Goericke
Pratap Venepally
Hong Zheng
Michael R. Stukel
Michael R. Landry
Andrew D. Barton
Andrew E. Allen
Observations of phytoplankton abundances and community structure are critical towards understanding marine ecosystems. Common approaches to determine group-specific abundances include measuring phytoplankton pigments with high-performance liquid chromatography and DNA-based metabarcoding. Increasingly, mRNA abundances with metatranscriptomics are also employed. As phytoplankton pigments are used to develop and validate remote sensing algorithms, further comparisons between pigments and other metrics are needed to validate the extent to which these measurements agree for group-specific abundances; however, most previous comparisons have been hindered by metabarcoding and metatranscriptomics solely producing relative abundance data. By employing quantitative approaches that express both 18S rRNA genes (DNA) and total mRNA as concentrations, we show that these measurements are related for several eukaryotic phytoplankton groups. We further propose that integration of these can be used to examine ecological patterns more deeply. For example, productivity-diversity relationships of both the whole community and individual groups show a dinoflagellate-driven negative trend rather than the commonly found unimodal pattern. Pigments are also shown to relate to certain harmful algal bloom-forming taxa as well as the expression of sets of genes. Altogether, these results suggest that potential models of pigment concentrations via hyperspectral remote sensing may enable improved assessments of global phytoplankton community structure. These assessments may further support the detection of harmful algal blooms and the development of Earth system models.
- Article
(6341 KB) - Full-text XML
-
Supplement
(3996 KB) - BibTeX
- EndNote


Marine phytoplankton comprise both prokaryotic cyanobacteria and diverse lineages of eukaryotes with distinct evolutionary histories (Pierella Karlusich et al., 2020). Collectively, they are responsible for approximately 50 % of global primary production, support marine food webs, and extensively contribute to biogeochemical cycling (Huang et al., 2021). Their distinct evolutionary trajectories have also given rise to different traits, functional roles, and niches. For example, diatoms (Bacillariophyta) tend to dominate under well-mixed, nutrient-rich conditions, are considered principal contributors to carbon export with fast sinking rates, and are a significant component of the silicon cycle due to their formation of silica cell walls (Guidi et al., 2016; Agusti et al., 2015; Bowler et al., 2010) Dinoflagellates (Dinoflagellata) may be major contributors to carbon export in oligotrophic regions, and many species are mixotrophs, which enables them to serve multiple important roles in marine food webs (Guidi et al., 2016; Stoecker et al., 2017). Prymnesiophytes (Haptophyta) include coccolithophores with calcium carbonate shells, the formation of which influences upper ocean alkalinity and air-sea carbon dioxide exchange (Rost and Riebesell, 2004). The prymnesiophytes also include the bloom-forming Phaeocystis spp. which are a major source of the sulfur compound, dimethylsulfoniopropanate (DMSP), that is hypothesized to influence cloud formation and climate (Smith and Trimborn, 2023). Cryptophytes (Cryptophyta) are considered to be ubiquitous and may be highly abundant in the Sargasso Sea and Southern Ocean (Richardson, 2022; Cotti-Rausch et al., 2016; Mendes et al., 2018). Lastly, prominent chlorophytes (Chlorophyta) and pelagophytes (Pelagophyceae) are additional picoeukaryotes that are important primary producers, particularly in the open ocean (Worden et al., 2012; Not et al., 2012; Lopes dos Santos et al., 2017; Guérin et al., 2022).
Due to these contributions to ecosystem function and differing roles, assessing phytoplankton abundances and disentangling phytoplankton community composition (PCC) is necessary to understand marine environments (Cetinić et al., 2024). For example, current Earth system models (ESMs) are unable to confidently project if primary productivity will increase or decrease under future climate scenarios (Kwiatkowski et al., 2020). By examining the effects of natural climate variability and anthropogenic change on phytoplankton communities as well as their physiology, more accurate and detailed representation of different groups can be generated to improve these model predictions (Tagliabue, 2023; Cetinić et al., 2024). Knowledge of PCC may also further help estimate carbon export flux (Kramer et al., 2025). Additionally, monitoring for harmful algal blooms (HABs) is important for human health as well as understanding their impacts on fisheries and ecosystems (Anderson et al., 2012), and fisheries managers may benefit from knowledge of PCC to aid stock assessments and identify suitable fishing zones (Satterthwaite et al., 2023; Sathyendranath et al., 2023).
A common approach to estimate phytoplankton abundances and determine PCC is the measurement of phytoplankton pigments via high-performance liquid chromatography (HPLC). Specifically, certain accessory pigments can be used as proxies, or diagnostic pigments, to determine the abundances of specific groups, even though some of these pigments are shared among groups (Jeffrey et al., 2011; Kramer and Siegel, 2019). As pigments directly alter the shapes and magnitudes of remote sensing reflectance spectra, HPLC-measured pigments are also extensively used to develop and validate satellite-based remote sensing algorithms. Given the recent availability of hyperspectral remote sensing reflectance data from NASA's Plankton, Aerosol, Cloud, ocean Ecology (PACE) mission, the continued development of remote sensing algorithms based on HPLC pigments may enable global scale estimation of phytoplankton pigment concentrations and PCC (Kramer et al., 2022; Cetinić et al., 2024).
As a result, it is important to compare phytoplankton pigments to other metrics of PCC. If other metrics agree with pigments, they may also be useful for validating remote sensing algorithms. Conversely, it is important to compare other metrics of PCC to phytoplankton pigments as it remains uncertain whether indirect approaches such as DNA and RNA sequencing are reflective of phytoplankton biomass. DNA metabarcoding is increasingly being used to determine PCC, primarily by sequencing hypervariable regions of the 16S gene for prokaryotes and phytoplankton plastids or the 18S gene for eukaryotes (Lopes dos Santos et al., 2022), and it is increasingly common to use environmental mRNA sequencing, or metatranscriptomics, to determine PCC (Cohen et al., 2022).
Initial comparisons between phytoplankton pigments and DNA indicate that the metrics are correlated in some cases; however, these comparisons have been hindered by the compositional nature of sequencing data (Catlett et al., 2023; Kramer et al., 2024). By default, DNA and RNA sequencing produce relative abundance data, which complicates their interpretability and can lead to spurious correlations (Gloor et al., 2017). This is because there are multiple scenarios that could lead to a taxonomic group having the same or different relative abundances among samples, and potential differences in relative abundances are not necessarily reflective of differences in their true abundances. For example, one group's true abundance could be the same in two samples while another group's is lower in just one sample leading to a higher relative abundance of the first group even though the two abundances are equal. Alternatively, both groups' true abundances could be higher in one sample but to different degrees, resulting in lower relative abundances in one group even though its true abundance has increased.
To compare phytoplankton pigments and relative DNA abundances, previous studies have normalized diagnostic pigment concentrations to total chlorophyll a (TChl a) concentrations or the sum of diagnostic pigments, thereby making both DNA and pigment data relative quantities (Catlett et al., 2023; Kramer et al., 2024). However, the use of these approaches while only using relative abundances of prokaryotic or eukaryotic taxa presents other issues. As an example, high TChl a could be driven by relatively high cyanobacterial abundances that would not be captured in 18S sequencing, which targets eukaryotes. If the eukaryotic phytoplankton community is then dominated by one group, this group would have a high relative abundance that is coupled to low concentrations of their diagnostic pigment relative to TChl a. The use of 16S alone to capture both prokaryotic cyanobacteria and eukaryotic plastids may circumvent this issue, but references for plastid 16S sequences are not as comprehensive and are influenced by potentially greater variability in plastid copy number (Lopes dos Santos et al., 2022; Decelle et al., 2015). Alternatively, simultaneous metabarcoding of the 16S and 18S rRNA gene with three domain primers addresses this issue, but it may also require greater sequencing depth to capture the diversity of the eukaryotic community (Yeh et al., 2021). Even if eukaryotic relative abundances are only compared to the sum of eukaryotic diagnostic pigments, the DNA-based relative abundances are still influenced by non-photosynthetic taxa. Altogether, these problems with normalization and potential discrepancies between true abundances and relative metrics can be severe issues that produce misleading correlations.
The estimation of absolute abundances via internal standards avoids these issues and enables comparisons between gene or transcript concentrations and phytoplankton pigment concentrations (Lin et al., 2019; Cohen et al., 2022). This approach was used in a study in the Western Antarctic Peninsula to compare 18S rRNA gene concentrations to group-specific chlorophyll a concentrations (Lin et al., 2019). With a small sample size (n=16) and cryptophyte-dominated communities, strong relationships with cryptophytes and Phaeocystis were observed, but not with diatoms. Other groups were not examined, and it remains unclear if these relationships persist with larger sample sizes, other regions with different communities, or across the entire spectrum of phytoplankton abundances within eukaryotic phytoplankton.
Quantitative 16S sequencing has previously been shown to strongly agree with cell abundances of the prokaryotic genera Prochlorococcus and Synechococcus measured with flow cytometry (Jones-Kellett et al., 2024), although a separate comparison of Prochloroccocus abundances from flow cytometry only showed moderate correlations with pigment concentrations indicating that pigment concentrations may be decoupled from 16S rRNA genes and cell abundances (Kramer et al., 2024). Furthermore, it remains unclear if absolute quantities of mRNA from metatranscriptomics and phytoplankton pigments relate to one another; however, total mRNA concentrations have also been shown to agree with imaging flow cytometry-derived carbon biomass estimates with eukaryotic phytoplankton, indicating that total mRNA is reflective of phytoplankton biomass (Coesel et al., 2025).
To further explore these potential relationships, we compare phytoplankton pigments with quantitative DNA- or RNA-based abundances from paired samples collected over a seven-year period on seasonal California Cooperative Oceanic Fisheries Investigations (CalCOFI) surveys. Within cyanobacteria, flow cytometry was also used to measure Prochloroccocus and Synechococcus cell abundances. The CalCOFI sampling area is within the California Current Ecosystem, a coastal upwelling biome associated with an eastern boundary current. Although the sampling area is largely restricted to the southern California Current (Fig. 1A and B), it includes a major biogeographic boundary at Point Conception and phytoplankton taxa commonly associated with both the central North Pacific Subtropical Gyre and the subarctic Northeast Pacific, that is, communities associated with the broader region (Checkley and Barth, 2009; Venrick, 1998). The range in phytoplankton abundances closely aligns with those observed globally and is captured by sampling the gradients from nearshore stations influenced by upwelling to offshore oligotrophic stations (Deutsch et al., 2021; James et al., 2022; Venrick, 2002). CalCOFI also conducts four cruises per year; therefore, the samples include potential differences from seasonal and interannual variability. Beyond examining PCC, we explore additional applications stemming from relationships between phytoplankton pigments and DNA- or RNA-based abundances including investigating productivity-diversity relationships, forecasting harmful algal blooms, and inferring expression of specific genes.
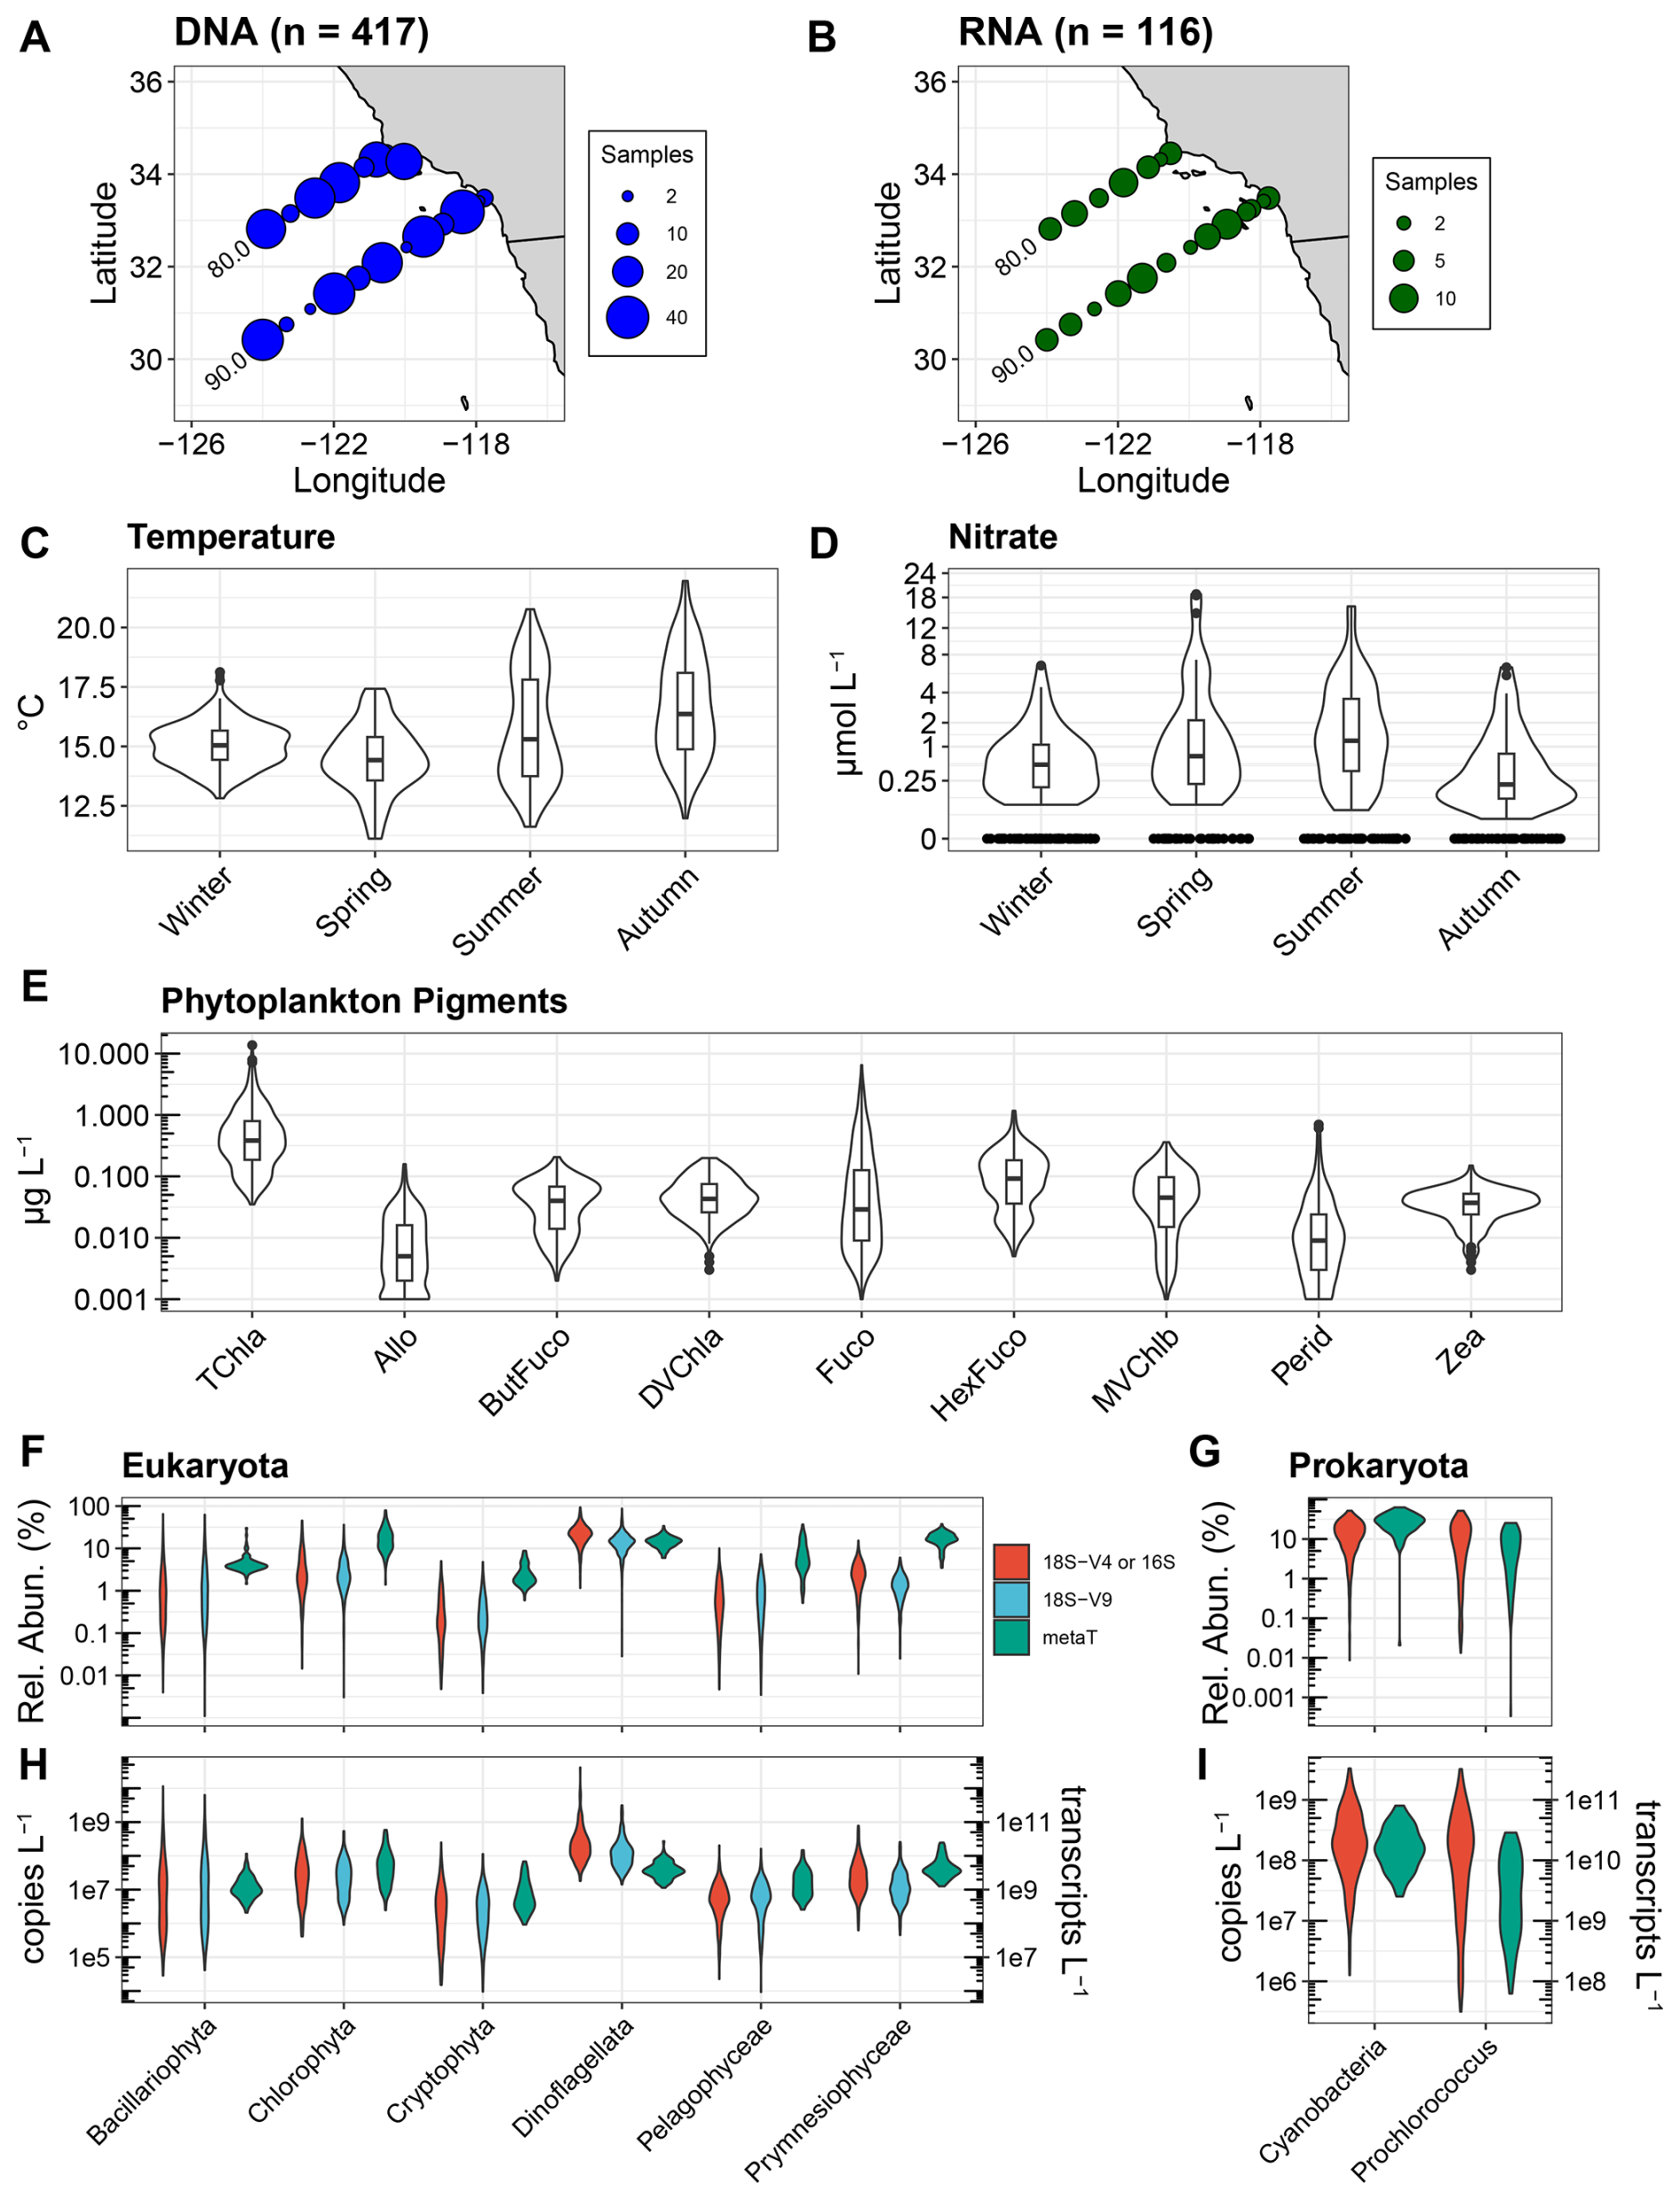
Figure 1Overview of CalCOFI samples used in this study. (A, B) Locations and quantity of samples for DNA and RNA with corresponding phytoplankton pigment samples. (C, D) Temperature (°C) and nitrate concentrations (µmol L−1) across seasons for the paired DNA and pigment samples used here. Corresponding data for the RNA samples are shown in Fig. S1 in the Supplement. Nitrate concentrations are shown on a cube-root scale. (E) Phytoplankton pigment concentrations. Pigment abbreviations: TChl a, total chlorophyll a; Allo, alloxanthin; ButFuco, 19′-butanoyloxyfucoxanthin; DVChl a, divinyl chlorophyll a; Fuco, fucoxanthin; HexFuco; 19′-hexanoyloxyfucoxanthin; MVChlb, monovinyl chlorophyll b; Perid, Peridinin; Zea, zeaxanthin. (F, G) Relative abundances of different phytoplankton groups using 18S-V4 rRNA gene (red), 18S-V9 rRNA gene (blue), or transcript (metaT, green) abundances. For prokaryota, the 16S V4-V5 region was used and is shown in red. (H, I) Absolute abundances for 18S or 16S rRNA genes (copies L−1, left y-axis) and transcripts (transcripts L−1, right y-axis). Different metrics are colored as in panels (F) and (G).
2.1 Sample collection and biogeochemical measurements
From select stations on seasonal CalCOFI cruises from 2014 to 2020, 417 DNA and 118 RNA samples were collected concurrently with phytoplankton pigments within the euphotic zone along CalCOFI lines 80.0 and 90.0 and at the Santa Barbara Basin (Station 81.8 46.9) (Fig. 1A and B). These data represent only a subset of the on-going NOAA-CalCOFI Ocean Genomics (NCOG) time series, and are restricted to samples where quantitative approaches for DNA and RNA were employed with phytoplankton pigment samples (James et al., 2022). As such, no DNA samples from 2017 are included and RNA samples only span from 2017 to 2020.
CalCOFI cruises survey the California Current Ecosystem in a standardized grid pattern with most stations in the southern California Current region. During this time period, winter cruises occurred during January and February, spring cruises occurred during April, summer cruises occurred in July and August, and autumn cruises occurred in October and November. There was no Spring cruise during 2020 due to the COVID-19 pandemic. At each station, seawater was collected from the near-surface (normally 10 m) and the subsurface chlorophyll maximum layer (SCML) with a CTD rosette for pigments, DNA, RNA, and flow cytometry. For the DNA samples, 219 were from the near-surface (0–14 m, mean = 10 m), and 198 were from the SCML (18– 130 m, mean = 53 m). Temperature data are derived from duplicate Seabird SBE 3Plus sensors on a Seabird 911+ CTD. Macronutrient concentrations were measured on a QuAAtro continuous segmented flow autoanalyzer (SEAL Analytical) alongside reference materials (KANSO technos) (Armstrong et al., 1967; Gordon et al., 1992). The nitracline depth is defined as the depth where nitrate first exceeds 1 µM.
Primary productivity was estimated via 14C uptake at select stations. Briefly, seawater was collected from six depths representing 56 %, 30 %, 10 %, 3 %, 1 %, and 0.3 % surface light levels shortly before local apparent noon. Light levels were estimated with a Secchi disk with the assumptions that the 1 % light level is three times the Secchi depth and that the extinction coefficient is constant. Following collection, seawater was dispensed into triplicate 250 mL polycarbonate bottles (two light bottles and one dark control). Bottles were then inoculated with a 200 µL solution containing NaH14CO3 that was prepared by diluting 50 mL of NaH14CO3 (approximately 50–57 µCi mmol−1; MP Biomedicals, LLC) with 350 mL of 2.8 mM Na2CO3 and then adjusting the pH to ∼ 10 with 1 N NaOH (Fitzwater et al., 1982). Bottles were then incubated until civil twilight in tubes with flow-through seawater and neutral-density screens to simulate in situ light levels. Following incubation, samples were filtered onto 0.45 µm mixed-cellulose ester filters (type HA, Millipore), acidified with 0.5 mL of 10 % HCl, immersed in scintillation fluor, and measured with a scintillation counter once back onshore. As the incubations occurred from local noon until civil twilight, half light-day productivity at each depth was calculated by averaging the two light bottles corrected with the dark uptake bottle. Half light-day productivity was then multiplied by 1.8 to obtain 24 h productivity as determined by Eppley (1992). When comparing productivity to diversity from DNA, samples from the entire NCOG dataset (2014 to 2020) that were within 20 m of productivity samples were used (n=434). The average vertical distance between DNA and productivity samples was 1.79 m.
2.2 High-performance liquid chromatography pigment analysis
Phytoplankton pigment concentrations were determined with HPLC. Samples were collected with 0.5, 1.04, or 2.2 L opaque brown bottles depending on the fluorescence measured by the CTD and filtered onto 25 mm GF/F filters under low vacuum pressure (≤ 40 mm Hg). Once completed filtering, the filters were carefully folded in half, blotted on a paper towel to remove excess water, and stored in 2 mL cryovials in liquid nitrogen until analysis at the Horn Point Analytical Services Laboratory (HPL) at the University of Maryland with the HPL method as described in Hooker (2005). Briefly, filters were extracted in 95 % acetone and sonicated on ice for 30 s with an output of 40 W. Samples were then clarified by filtering them through a HPLC syringe cartridge filter (0.45 µm) and a glass-fiber prefilter. Extracts were then analyzed with an automated HP 1100 HPLC system with external calibration standards that were either purchased or isolated from naturally occurring sources as described in Van Heukelem and Thomas (2001). The pigments that were measured and used here are Peridinin, 19′-butanoyloxyfucoxanthin, fucoxanthin, neoxanthin, prasinoxanthin, violaxanthin, 19′-hexanoyloxyfucoxanthin, alloxanthin, zeaxanthin, divinyl chlorophyll a, and TChl a. The precision including filter extraction and analysis of TChl a is estimated to be 5.1 %. As described later in the results and discussion, several of these pigments are diagnostic pigments for certain phytoplankton lineages. Although other pigments are measured with HPLC, they do not provide as much specificity as the diagnostic pigments used here; therefore, they were not included in the analysis (Kramer and Siegel, 2019). In addition to use diagnostic pigments directly, taxon-specific contributions to TChl a concentrations based on the aforementioned pigment concentrations were determined with phytoclass v2.0.0 (Hayward et al., 2023). To account for potential differences in pigment ratios due to environmental conditions, surface and SCML samples were analyzed with phytoclass separately.
2.3 Nucleic acid sample collection and extraction
For DNA samples, 0.2 to 10.4 L (mean = 3.3 L) of seawater was filtered onto 0.22 µm Sterivex™ filters. RNA samples were collected simultaneously following the same approach but with generally higher volumes (2.0 to 4.8 L, mean = 4.0 L). RNA samples were only collected near local apparent noon to minimize bias from the diel cycle.
Following filtration, samples were immediately flash frozen in liquid nitrogen and stored at −80 °C. DNA was extracted with the Macherey-Nagel NucleoMag Plant kit on an Eppendorf epMotion 5075TMX and assessed on a 1.8 % agarose gel. At the start of DNA extraction during the addition of lysis buffer, 1.74 to 3.78 ng of Schizosaccharomyces pombe genomic DNA and 3.36 to 7.09 ng of Thermus thermophilus genomic DNA was added to each sample as an internal standard (Lin et al., 2019). RNA was also extracted on the Eppendorf epMotion but with the Machery-Nagel NucleoMag RNA kit. As an internal standard, 2 to 5 billion copies of Invitrogen™ ArrayControl™ RNA Spikes #1 and #8 were added to the lysis buffer of each sample at a 2.66:1 ratio.
2.4 Amplicon library preparation and sequencing
Amplicon libraries separately targeting the V4–V5 region of the 16S rRNA gene, the V4 and V9 regions of the 18S rRNA gene, and the ITS2 gene from the diatom genus Pseudo-nitzschia were constructed via a one-step PCR with the TruFi DNA Polymerase PCR kit to simultaneously amplify the region of interest and barcode each sample. For 16S, the 515F-Y (5′-GTG YCA GCM GCC GCG GTA A-3′) and 926R (5′-CCG YCA ATT YMT TTR AGT TT-3′) primer set was used (Parada et al., 2016). For 18S-V4, the V4F (5′-CCA GCA SCY GCG GTA ATT CC-3′) and V4RB (5′-ACT GTT CTT GAT YR-3′) primer set based on those used by Berdjeb et al. (2018) was used. For 18S-V9, the 1389F (5′-TTG TAC ACA CCG CCC-3′) and 1510R (5′-CCT TCY GCA GGT TCA CCT AC-5′) primer set was used (Amaral-Zettler et al., 2009). For Pseudo-nitzschia ITS2, the 5.8SF (5′-TGC TTG TCT GAG TGT CTG TGG A-3′) and 28SR (5′-TAT GCT TAA ATT CAG CGG GT-3′) primer set was used (Lim et al., 2018). Each reaction was performed with an initial denaturing step at 95 °C for 1 min followed by 30 cycles of 95 °C for 15 s, 56 °C for 15 s, and 72 °C for 30 s. 2.5 µL of each PCR reaction was run on a 1.8 % agarose gel to confirm amplification, then PCR products were purified with Beckman Coulter AMPure XP beads following the manufacturer's instructions. PCR quantification was performed in duplicate using the Invitrogen Quant-iT PicoGreen dsDNA Assay kit. Samples were then combined in equal proportions into multiple pools followed by another 0.8× AMPure XP bead purification on the final pool. DNA quality of each pool was evaluated on an Agilent 2200 TapeStation, and quantification was performed with the Qubit HS dsDNA kit. Each 16S or 18S pool was sequenced on an Illumina MiSeq (2×300 bp for 16S and V4 or 2×150 bp for V9) except for the one pool for the 2014–2016 euphotic zone V9 samples, which was run on an Illumina NextSeq (Mid Output, 2×150 bp). The Pseudo-nitzschia ITS2 pool was sequenced on a single lane of an Illumina NovaSeq 6000 with a SP flow cell (2×250 bp). For all 16S and 18S libraries, mock communities were included as described in Yeh et al. (2021). The results from the mock community samples are shown in James et al. (2022), which validate the absence of taxon disappearance observed in previous studies. In addition to the mock communities, PCR blank samples and unused barcodes were also analyzed to confirm minimal index hopping.
2.5 Analysis of amplicon sequence data
Amplicons were first analyzed with QIIME2 v2019.10 for the 16S and 18S data or QIIME2 v2021.2 for the Pseudo-nitzschia ITS2 data (Bolyen et al., 2019). Briefly, paired-end reads were trimmed to remove adapter and primer sequences with cutadapt (Martin, 2011). Trimmed reads were then denoised with DADA2 to produce amplicon sequence variants (ASVs). Each MiSeq run was denoised with DADA2 separately to account for different error profiles in each run then merged. Taxonomic annotation of ASVs was performed with the q2-feature-classifier naïve bayes classifier using the SILVA database (Release 138) for 16S ASVs and the PR2 database (v4.13.0) for 18S ASVs (Bokulich et al., 2018; Pedregosa et al., 2011; Guillou et al., 2012; Pruesse et al., 2007). For ITS2 ASVs, annotation was performed using BLAST (classify-consensus-blast) with Pseudo-nitzschia ITS2 sequences database as references (Brunson et al., 2024; Lim et al., 2018). When examining 16S relative abundances, all eukaryotic, plastid, and mitochondrial ASVs were removed, and when examining 18S relative abundances, dinoflagellates excludes Syndiniales and prymnesiophytes refers to all Prymnesiophyceae unless otherwise noted. The Shannon Diversity Index was calculated for each group with the QIIME2 diversity plugin.
To estimate absolute abundances of 16S and 18S ASVs, recovery of the aforementioned internal standards was used (Lin et al., 2019). For each ASV within each sample, the number of reads was divided by the ratio of T. thermophilus or S. pombe reads to the number of rRNA copies added. The total number of copies was then normalized to the volume filtered for each sample to estimate copies L−1.
2.6 Metatranscriptome sequencing, assembly, and analysis
To examine eukaryotic mRNA sequences, poly-A selected RNA-Seq libraries were created. Poly-A selected cDNA from total RNA was generated with the SMART-Seq® v4 Ultra® Low Input RNA Kit for Sequencing (Takara Bio USA, Inc.), which was then sheared with a Covaris® E210 focused-ultrasonicator targeting 300 bp fragments. The final sequencing library was then constructed with the NEB NEBNext® Ultra™ II DNA Library Kit with NEBNext® Multiplex Oligos for Illumina® and sequenced on three lanes of a NovaSeq 6000 with a S4 flow cell (2×150 bp).
For prokaryotic sequences, sequencing libraries were constructed following ribosomal RNA (rRNA) depletion. For samples from 2014–2019, rRNA was depleted with a mixture of Ribo-Zero Plant, Bacteria, and Human/Mouse/Rat (Illumina) following the manufacturer's low input protocol. For samples from 2020, rRNA depletion was performed with siTOOLs riboPOOLs with a mixture of the pan-prokaryote, pan-plant, and pan-mammal riboPOOLs following the manufacturer's instructions for low inputs. rRNA depletion was confirmed with all samples on an Agilent TapeStation 2200 with High Sensitivity RNA ScreenTape. cDNA was then synthesized using the Ovation RNA-Seq System V2 kit (NuGEN) using both poly-A and random hexamer primers followed by fragmentation with a Covaris® E210 focused-ultrasonicator targeting 300 bp fragments. cDNA was then purified with Agencourt RNAClean XP beads, and library preparation was performed with the Ovation Ultralow System V2 with unique dual indexes (NuGEN). After end repair, ligation, and amplification, the libraries were assessed on an Agilent TapeStation 2200 with High Sensitivity DNA ScreenTape. A subset of samples from 2014–2016 were sequenced separately in four pools on an Illumina HiSeq 4000 (2×150 bp). The remaining libraries were sequenced across five pools on an Illumina NovaSeq 6000 with a S4 flow cell (2×150 bp).
For both types of libraries, the resulting raw reads were trimmed for quality and to remove Illumina adaptors. Ribosomal RNA sequences were also removed with Ribopicker v0.4.3 (Schmieder et al., 2011). Trimmed and filtered reads were then used for assembly into contigs, and abundances were quantified by mapping these reads to the assembly. Both assembly and read mapping were performed with CLC Bio Genomics Server v21.0.3. Gene prediction was performed with FragGeneScan v1.16, and rRNA removal was performed again with Ribopicker (Rho et al., 2010). Predicted proteins were further filtered to remove those less than 10 amino acids long or with greater than or equal to 20 % stop codons. Gene clusters were generated from the predicted proteins with MCL with the inflation option (-I) set to 4 and scheme option (-scheme) set to 6 (Enright et al., 2002).
With the final assemblies, taxonomic annotation of each protein coding gene was assigned via DIAMOND BLASTP alignments using PhyloDB v1.076 as a reference database (Bertrand et al., 2015). Final taxonomic assignments were based on highest Lineage Probability Index values (Podell and Gaasterland, 2007). For functional annotation, DIAMOND BLASTP alignments were performed with the Kyoto Encyclopedia of Genes and Genomes (KEGG; Release 94.1) (Kanehisa et al., 2017). KEGG Ortholog (KO) assignment was performed with KofamKOALA, which uses hmmsearch against KOfam, an HMM database of KOs (Aramaki et al., 2019). E-value cutoffs of were used throughout.
To normalize read counts, raw reads were first converted to transcripts per million (TPM) (Li et al., 2009). Absolute quantities (transcripts L−1) were then calculated based on the average recovery of the aforementioned Invitrogen™ ArrayControl™ RNA Spikes and the volume of sample filtered as described in Cohen et al. (2022). For performing correlations with individual genes, transcripts L−1 within each taxonomic group and sample were summed by KO annotation, and if KO annotation was absent, the KEGG gene annotation was used. The domoic acid biosynthesis gene, dabA, was annotated using the sequences reported in Brunson et al. (2018).
2.7 Flow Cytometry
To measure Prochlorococcus and Synechococcus cell abundances with flow cytometry, providing an additional metric of comparison, two mL samples of seawater were collected in cryovials and fixed with 100 µL of 0.2 µm filtered 10 % paraformaldehyde for a 0.5 % final concentration. Fixation was allowed to occur for 10 min before freezing the sample in liquid nitrogen. Once onshore, samples were stored at −80 °C or on dry ice until analysis at the SOEST Flow Cytometry Facility, University of Hawaii at Manoa.
Prior to analysis, thawed samples were stained with Hoechst 33342 (1 µg mL−1, , final concentration) at room temperature in the dark for 1 h (Monger and Landry, 1993). Aliquots (100 µL) were analyzed using a Beckman-Coulter EPICS Altra flow cytometer with a Harvard Apparatus syringe pump for volumetric sample delivery. Simultaneous (co-linear) excitation of the plankton was provided by two argon ion lasers, tuned to 488 nm (1 W) and the UV range (200 mW). The optical filter configuration distinguished Prochlorococcus and Synechococcus populations based on chlorophyll a (red fluorescence, 680 nm), phycoerythrin (orange fluorescence, 575 nm), DNA (blue fluorescence, 450 nm), and forward and 90° side-scatter signatures. Blue-fluorescence and red-fluorescence signals were used to distinguish DNA-containing heterotrophic (non-pigmented) from phototrophic (chlorophyll-containing) cells (Monger and Landry, 1993). Standardized fluorescence and scatter parameters were determined relative to 0.5 and 1.0 µm yellow-green calibration beads and 0.5 µm UV calibration beads run in each sample. Bead-normalized red-fluorescence values are also used as a measure of cellular chlorophyll a (Landry et al., 2003). Raw data (listmode files) were processed using the software FlowJo (Treestar Inc.). Cell abundance estimates were then calculated accounting for the volume dilutions from the added preservative and stain solutions.
2.8 Statistics
All correlations and models were generated with R v4.3.2. Specifically, Pearson correlations were performed with the function cor.test(x, y, method = "pearson"). Linear regressions were performed with the function lm(y ∼ x), and residuals from the linear models were calculated with the resid function. Generalized additive models (GAMs) were fit using the function gam(y ∼ x, method = "REML") from the mgcv package v 1.9-1 (Wood, 2017). When examining multiple gene correlations, P-values were adjusted using the Benjamini and Hochberg procedure using the p.adjust(p, method = "BH") function (Benjamini and Hochberg, 1995).
3.1 Quantitative relationships among pigments, DNA, and RNA
As the sampling locations span nearshore stations influenced by coastal upwelling to offshore oligotrophic conditions (James et al., 2022; Venrick, 2002), the paired phytoplankton pigment and DNA or RNA samples encompass a wide range of environmental conditions (Figs. 1A–D and S1). Seasonal and interannual variability were also captured with notably lower temperatures and higher nutrients in the Spring season relating to seasonal upwelling as well as an unprecedented marine heatwave from mid-2014 to 2016 associated with El Niño in 2015 (Di Lorenzo and Mantua, 2016; Jacox et al., 2018). Concurrent with the wide-ranging environmental conditions, TChl a and accessory pigment concentrations often spanned several orders of magnitude with all accessory pigments detected in concentrations as low as 0.001 to 0.005 µg L−1 (Fig. 1E). Fucoxanthin (Fuco) exhibited the greatest range with concentrations ranging from 0.001 to 6.81 µg L−1. While 19′-hexanoyloxyfucoxanthin (HexFuco) concentrations ranged from 0.005 to 1.170 µg L−1, all other pigment concentrations examined here were always less than 0.697 µg L−1.
DNA metabarcoding of both the V4 and V9 regions of the 18S rRNA gene for eukaryotes as well as the V4–V5 regions of the 16S rRNA gene for prokaryotes similarly showed wide ranges in relative abundances (Fig. 1F and G). Among eukaryotes, diatoms exhibited the greatest range in accordance with their known dominance during blooms in the region (Goericke, 2011; Venrick, 2012; Taylor and Landry, 2018). Chlorophytes also exhibited a wide range of relative abundances, and their average abundance exceeded that of diatoms. Dinoflagellates were also found in high abundances, and while they indeed bloom in the region (Kahru et al., 2021; Anderson et al., 2008), their high abundances via 18S metabarcoding may be due to bias from high 18S gene copy numbers (Martin et al., 2022). Other eukaryotic phytoplankton groups were typically less than 10 % of the total eukaryotic community. In particular, cryptophytes were less than 1 % of the community on average but were found to be as high as 5 %. Within eukaryotic mRNA expressed as relative abundances [transcripts per million (TPM)], intragroup variability was less pronounced, and most groups displayed higher relative abundances compared to their 18S DNA abundances (Fig. 1F). The sole exception was with dinoflagellates which had lower relative abundances with RNA compared to DNA, further suggesting bias in their DNA relative abundances due to high 18S DNA copy numbers.
Within prokaryotes, all cyanobacteria combined and the cyanobacterial genus Prochlorococcus displayed similar distributions, indicating that Prochlorococcus was often the dominant member of the cyanobacterial community (Fig. 1G and I). Cell abundances measured via flow cytometry also show that Prochlorococcus is dominant in these samples, with Prochlorococcus displaying higher abundances than Synechococcus in 76 % of samples (Fig. S2). On average, Prochlorococcus and Synechococcus accounted for 99.2 % of 16S reads, with only minor contributions from ASVs that were either not resolved to lower taxonomic levels or cyanobacterial diazotrophs such as Richelia and UCYN-A. Cyanobacteria as a whole and Prochlorococcus also displayed lower relative abundances from transcripts compared to 16S rRNA genes (Fig. 1G).
When converted to absolute abundances based on the recovery of internal standards and normalizing to the volume filtered (gene copies L−1 or transcripts L−1), differences and distributions among groups were similar to those observed with relative abundances (Fig. 1F–I). However, such quantitative approaches have not been widely adopted, and most metabarcoding data are solely expressed as relative abundances. As previously described, other studies have normalized phytoplankton pigments to TChl a concentrations in an attempt to make DNA-based relative abundances and phytoplankton pigments comparable (Catlett et al., 2023; Kramer et al., 2024). When using pigments directly, diagnostic pigments used for specific phytoplankton groups include monovinyl chlorophyll b (MVChlb) for chlorophytes, alloxanthin (Allo) for cryptophytes, fucoxanthin (Fuco) for diatoms, Peridinin (Perid) for dinoflagellates, 19′-butanoyloxyfucoxanthin (ButFuco) for pelagophytes, 19′-hexanoyloxyfucoxanthin (HexFuco) for prymnesiophytes, zeaxanthin (Zea) for cyanobacteria, and divinyl chlorophyll a (DVChl a) for Prochlorococcus (Catlett et al., 2023; Kramer and Siegel, 2019).
Within eukaryotic taxa, comparisons between TChl a-normalized pigment concentrations and DNA-based relative abundances showed moderate to strong correlations (Pearson) for several groups (Fig. 2A). In particular, the relative abundances of diatoms and Fuco displayed the strongest agreement (r=0.79–0.82) followed by pelagophytes and ButFuco (r=0.71–0.77). Cryptophytes with Allo and chlorophytes with MVChlb were also moderately well correlated (r=0.51–0.65) whereas dinoflagellates with Perid and prymnesiophytes with HexFuco were weakly correlated (r=0.32–0.42). Previous studies using samples from the California Current (Plumes and Blooms), North Atlantic Ocean (NAAMES), and Northeast Pacific Ocean (EXPORTS) have shown similar results where relationships are notable for chlorophytes, cryptophytes and pelagophytes, weak for prymnesiophytes and dinoflagellates, and inconsistent among the studies for diatoms (Catlett et al., 2023; Kramer et al., 2024). In another previous study in the Western Antarctic Peninsula where a chemotaxonomic approach that partitions TChl a (CHEMTAX) was used rather than diagnostic pigments directly, cryptophytes were moderately well correlated between the measurements whereas diatoms were not (Lin et al., 2019; Mackey et al., 1996). Within these studies, abundances for some groups were also too low to be included.
Although these results suggest that there are moderately strong relationships between pigments and DNA-based relative abundances for several phytoplankton groups, these analyses are hindered by the compositional nature of relative abundance data as previously described. The estimation of absolute abundances via internal standards removes compositionality and enables the comparison of DNA- or RNA-based concentrations (copies L−1 or transcripts L−1) to phytoplankton pigment concentrations (µg L−1). By doing so here, all correlations were stronger than those with relative abundances for eukaryotic phytoplankton taxa (Fig. 2B). In particular, the relationships between dinoflagellates and Perid were dramatically stronger with both marker genes (r=0.77–0.79). The relationships for prymnesiophytes were also stronger but not to the same degree (r=0.46–0.51). Furthermore, all groups were most strongly correlated with their diagnostic pigments except prymnesiophytes, which had similarly strong correlations with Perid (Fig. S3). By using taxon-specific biomass as chlorophyll a concentrations with a chemotaxonomic approach (phytoclass) (Hayward et al., 2023), correlations were often similar (Fig. S4). Moreover, strong correlations were also observed among absolute transcript abundances and pigment concentrations (r=0.66–0.88) except for prymnesiophytes which had a similar correlation when using their DNA-based abundances (r=0.43) (Fig. 2C).
These results indicate that abundances of diagnostic phytoplankton pigments and phytoplankton DNA or RNA often agree. Furthermore, they suggest that the aforementioned issues with compositionality or normalization of pigments to TChl a may lead to misleading conclusions about these relationships, particularly for dinoflagellates. Besides compositionality, DNA- and RNA-based abundances have other biases that can also lead to discrepancies. Copies of 18S DNA can vary orders of magnitude among closely related phytoplankton species (Zhu et al., 2005), and DNA sequencing may also capture deceased cells that have lost some or all of their pigments. RNA abundances may be variable within a cell, instead reflecting overall activity or differential transcription rates in response to environmental stimuli (Moran et al., 2012). Both metrics are also influenced by the comprehensiveness of reference databases where unknown phytoplankton sequences may be unassigned (Krinos et al., 2024).
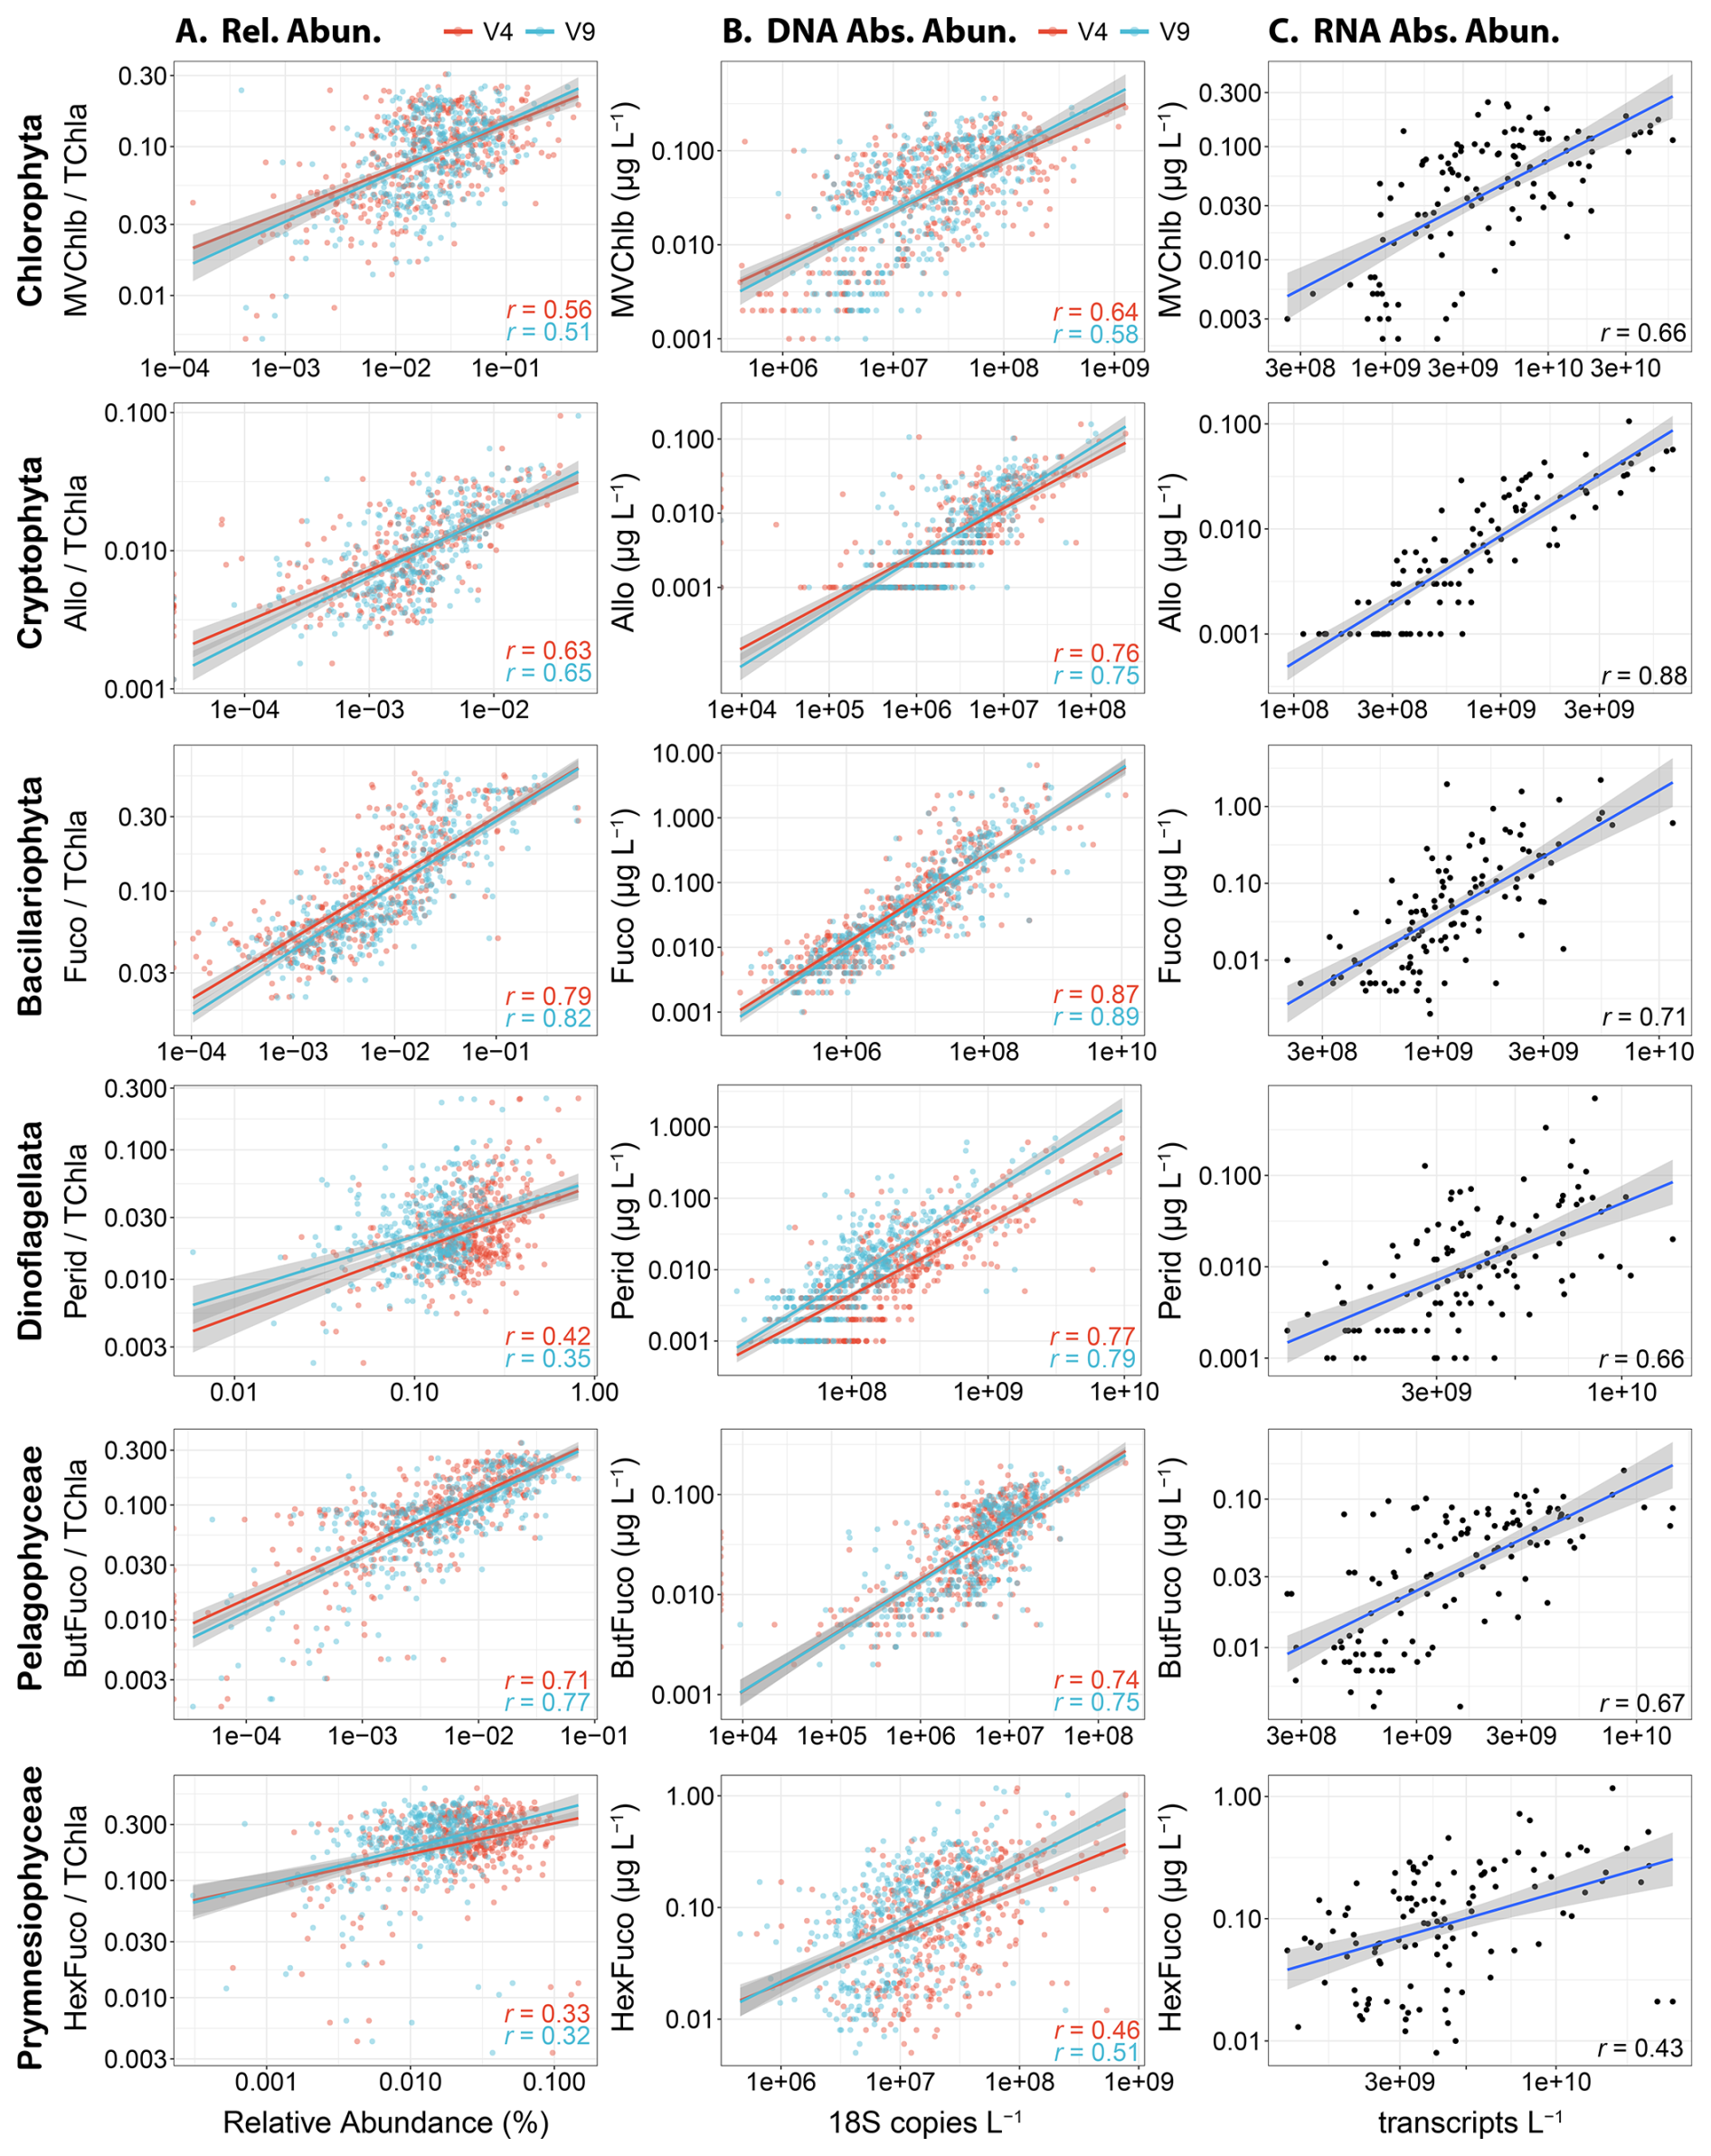
Figure 2Correlations among abundance metrics for each major eukaryotic phytoplankton group. Pearson correlations are all significant (P<0.05) and coefficients are displayed in each panel. Lines with 95 % confidence intervals show linear models with significant relationships between variables (P<0.05). (A) Diagnostic pigments normalized to total chlorophyll a (TChl a) against relative abundances of either the 18S-V4 (red) and 18S-V9 (blue) rRNA gene abundance. (B) Diagnostic pigment concentrations against absolute abundances of the 18S-V4 (red) and 18S-V9 (blue) rRNA genes (copies L−1). (C) Diagnostic pigment concentrations against absolute abundances of mRNA (transcripts L−1).
Differences in pigment abundances may also be a source of variability. For example, reduced light availability may lead to cellular increases in all accessory pigments examined here (Henriksen et al., 2002). Using mixed layer depth as a proxy for light history, decreased light availability has been shown to have a small but significant effect on discrepancies between phytoplankton pigments and DNA relative abundances (Catlett et al., 2023). To examine the effects of light history, we performed linear regressions on the residuals from linear models for absolute abundances with depth as a predictor variable and coarse proxy for reduced light availability (Fig. S5). Besides with cryptophytes, depth was found to positively and significantly predict residuals, aligning with an increase in pigments at depth which may be attributed to reduced light. High variability in near-surface samples was also observed and may reflect large differences in light conditions from sampling throughout the diel cycle.
To further examine the effects of light and depth on these relationships, separate correlations were performed with the absolute abundances from near-surface (≤ 14 m) or SCML (≥ 18 m) samples. For chlorophytes, cryptophytes, diatoms, dinoflagellates, and prymnesiophytes, the strength of the correlations were similar or higher for both depth categories when separated compared to all samples combined (Figs. 2 and S6). Only pelagophyte correlations were consistently lower when separated, albeit the differences were relatively minor (r=0.65–0.70 versus r=0.74–0.75). Linear regressions also displayed similar results between depth categories, except for chlorophytes and prymnesiophytes, where the slope of the regressions were 46 %–49 % lower with SCML samples. In these cases, pigment concentrations exhibited a reduced range, where concentrations were elevated at lower DNA abundances but reached similar concentrations at higher DNA abundances, indicating that pigment concentrations for these taxa are elevated under lower abundance regimes within the SCML.
Some pigments are also shared among certain groups; therefore, the presence of one group may influence pigment concentrations that are diagnostic of a different group. Fucoxanthin, for example, is not only found in diatoms but also other photosynthetic eukaryotes with red algal-derived plastids (Jeffrey et al., 2011; Kramer and Siegel, 2019). Previous studies suggest that shared pigments are an important source of disagreement between the two measurements, but the strong correlations for many groups, particularly with diatoms, suggests that it may be a less prevalent issue in certain cases (Catlett et al., 2023; Kramer et al., 2024).
Intragroup variability in pigment composition may also be a contributing factor with different species having different pigment concentrations (Zapata et al., 2004; Neeley et al., 2022). In particular, dinoflagellates may be influenced by taxa that no longer have Perid. The previously shown dinoflagellate correlations were performed without Syndiniales, an early branching clade that are likely parasitic and have lost their plastid altogether (Decelle et al., 2022; Guillou et al., 2008). Overall, Syndiniales accounted for 30 % to 34 % of dinoflagellate 18S copies in our data, and their removal considerably increased the strength of dinoflagellate-Perid correlations (Fig. S7 and Table S1). Other dinoflagellate taxa appear to have instead replaced their plastids with others via kleptoplasty, integration of a new plastid, or obtaining endosymbionts (Novák Vanclová and Dorrell, 2024). For example, the Kareniaceae family (e.g., the genera Karenia, Karlodinium, and Takayama) and Kryptoperidiniceae family (e.g., the genus Durinskia) contain fucoxanthin from an ancestral haptophyte or diatom endosymbiont respectively, members of the genus Dinophysis have a complex kleptoplastidic relationship with a cryptophyte, and the genus Lepidodinium contains plastids originating from a chlorophyte (Novák Vanclová and Dorrell, 2024; Kamikawa et al., 2015; Zapata et al., 2012). However, neither Kryptoperidiniceae nor Lepidodinium were detected in these data with either 18S marker, and filtering of other groups did not alter the strength of the correlation between Dinoflagellates and Perid indicating that besides Syndiniales, these groups do not influence the dinoflagellate-Perid relationship in this region (Table S1). The prymnesiophyte Phaeocystis globosa has also been suggested to contain ButFuco rather than HexFuco (Wang et al., 2022; Antajan et al., 2004), and while filtering ASVs annotated as this species marginally improved the strength of the correlation for prymnesiophytes with the V4 data (from r=0.46 to r=0.48), it was lower in the V9 data (from r=0.51 to r=0.45).
For cyanobacteria, correlations were strong when using relative abundances (r=0.86, Fig. 3A and C), but unlike the eukaryotic data, the strengths of the correlations were lower when using absolute abundances (Fig. 3B and D). DVChl a, which is the diagnostic pigment for Prochlorococcus, was also not detected in 12.4 % of samples, generally corresponding to where Prochlorococcus 16S abundances were lower (Fig. 3C and D). As previously observed in the greater region, Prochlorococcus cell abundances measured with flow cytometry and DNA-based absolute abundances strongly agreed (r=0.78, Fig. 3F), demonstrating that the 16S copies reflect cell abundances (Jones-Kellett et al., 2024). However, cell abundances were only moderately correlated with DVChl a (r=0.43, Fig. 3E), further indicating that DVChl a may be less reflective of changes in Prochlorococcus abundances.
Within Prochlorococcus, chlorophyll a content per cell significantly increased with depth, indicating that pigments increase as light availability is reduced (Fig. S8). However, there was also high chlorophyll a variability within each depth, suggesting that Prochloroccous pigment content is highly dynamic and can be decoupled from cell abundances leading to the weaker correlations observed with absolute abundances. Although separating near-surface and SCML samples showed stronger correlations than all samples together except for all cyanobacteria and Zea (r=0.55), the relationships were still weaker than with relative abundances (Fig. S9).
The variation in pigments in Prochlorococcus may be normalized when dividing by TChl a, thereby producing higher correlations with relative abundances. Some of the discrepancy with absolute abundances may also be caused by Prochlorococcus cell sizes which are smaller than the pore size of the GF/F filters used for pigments here (nominally 0.7 µm), leading to some Prochlorococcus cells being missed while being captured by flow cytometry or DNA that used a smaller pore size (0.2 µm) (Ting et al., 2007; Partensky et al., 1999). As in eukaryotic phytoplankton, the absolute abundances of transcripts were also moderately well correlated for cyanobacteria with Zea and Prochloroccocus with DVChl a, but still lower than with the 16S relative abundances (Fig. S10).
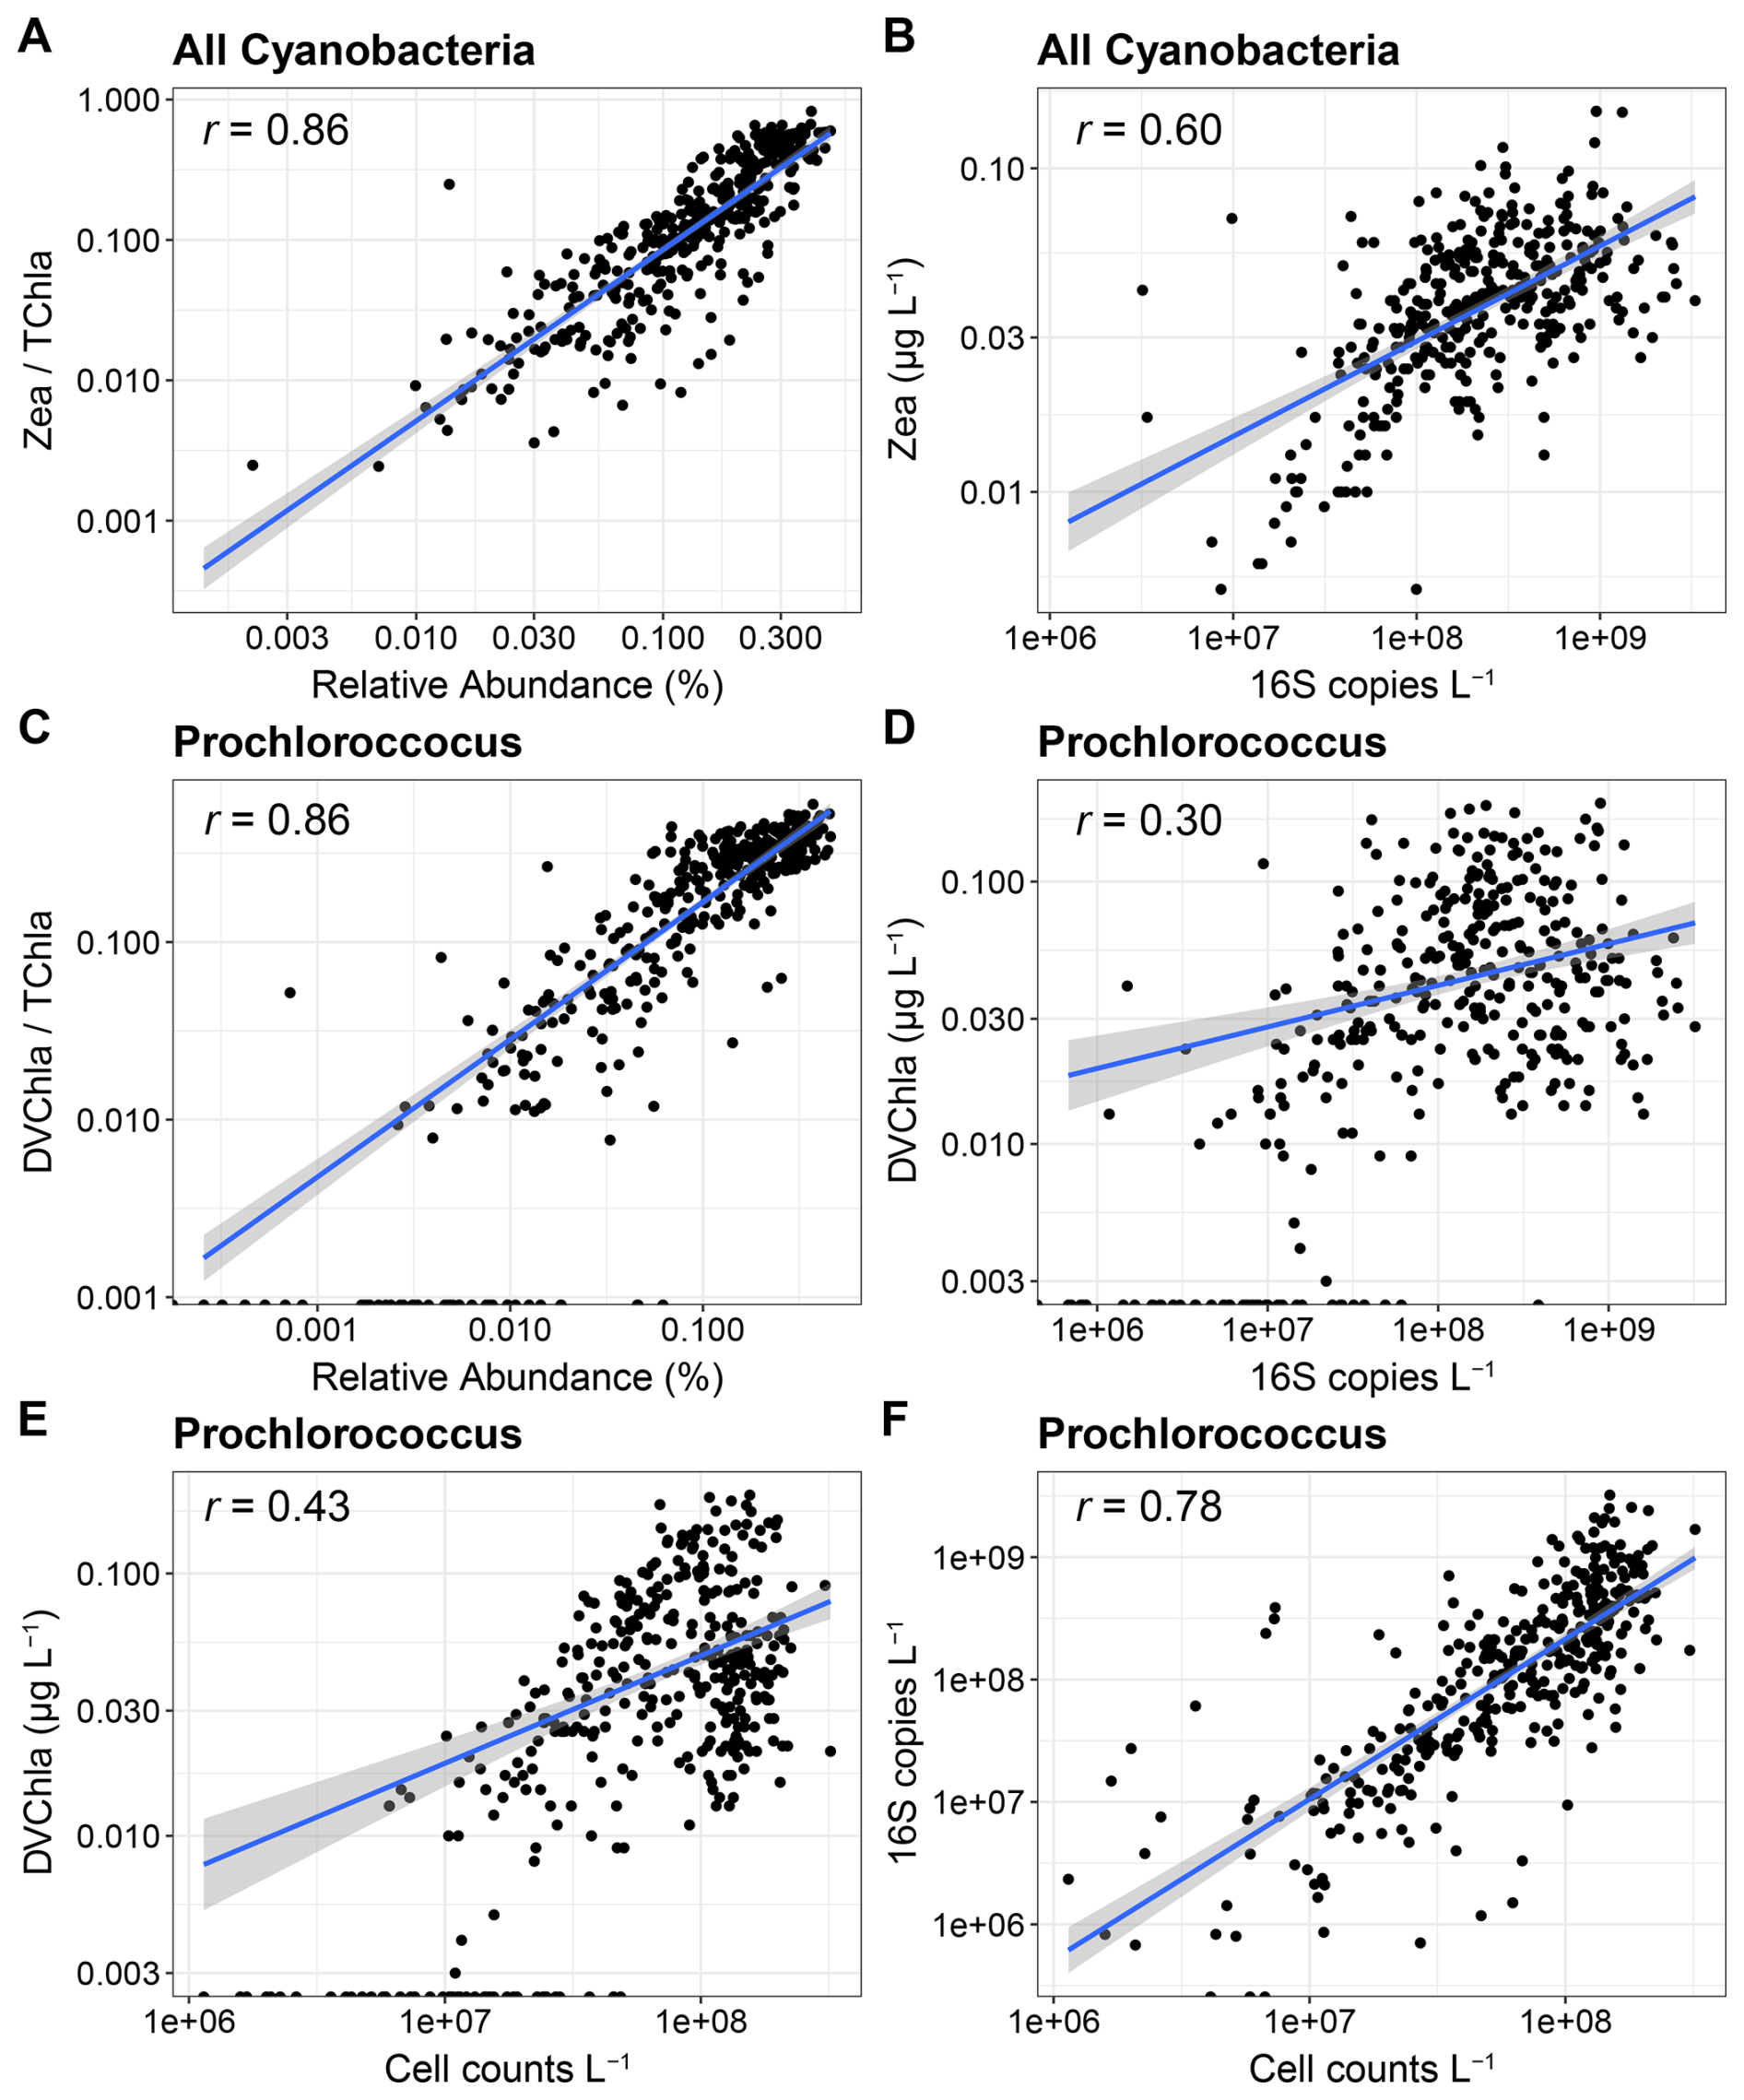
Figure 3Correlations among abundance metrics for cyanobacteria. (A, B) Relative and absolute abundance comparisons between all cyanobacteria and zeaxanthin (Zea). (C, D) Relative and absolute abundance comparisons between Prochlorococcus and divinyl chlorophyll a (DVChl a). (E) Comparison between Prochlorococcus cell abundances from flow cytometry and DVChl a concentrations. (F) Comparison between Prochlorococcus cell abundances from flow cytometry and absolute abundances of 16S rRNA genes.
3.2 Applications from integrating phytoplankton pigments with molecular data
The strong agreement among eukaryotic phytoplankton pigments and DNA or RNA for several groups indicates that these metrics are comparable proxies for phytoplankton abundances and community composition. As phytoplankton pigments directly impact remote sensing reflectance spectra, these results further support that potential models for phytoplankton pigment concentrations via remote sensing may be able to provide comparable global estimates of PCC (Kramer et al., 2022). While HPLC pigments are used for validating remote-sensing algorithms, these results also suggest that the absolute abundances of DNA or RNA may be useful metrics to validate for model development of PCC as well. In the following sections, we further examine relationships gleaned by integrating phytoplankton pigments and DNA- or RNA-based metrics to demonstrate potential applications for addressing ecological questions, monitoring harmful algal blooms, or inferring phytoplankton group-specific activity.
3.2.1 Increased taxonomic resolution with biomass estimation in ecological assessments
Phytoplankton pigments and DNA-based metabarcoding have separate strengths that can be leveraged when integrated: phytoplankton contributions to TChl a can be estimated with chemotaxonomic approaches, such as phytoclass (Hayward et al., 2023), providing a standardized estimate of biomass for each group, and DNA offers marker gene-level resolution into the composition of each sample. This increased resolution is possible even when the DNA-based data are expressed solely as relative abundances.
To illustrate this combined approach, diversity expressed as the Shannon index (H′) was compared to both TChl a and taxon-specific chlorophyll a concentrations as proxies for phytoplankton biomass (Fig. 4). Biomass is often used as a proxy for productivity, thus enabling investigation of productivity-diversity relationships (PDRs) (Smith, 2007; Irigoien et al., 2004). PDRs may exhibit different trends, but marine phytoplankton are presumed to exhibit a unimodal distribution with maximum diversity at an intermediate level of productivity, including within models of phytoplankton communities in the California Current Ecosystem (Irigoien et al., 2004; Li, 2002; Goebel et al., 2013). PDRs may also be positive, negative, or flat, with other studies suggesting that there is no relationship when accounting for potentially inadequate sampling (Cermeño et al., 2013; Smith, 2007). Examination of these relationships is particularly important for understanding how environmental change may impact diversity and productivity.
When comparing TChl a concentrations and the diversity of all six eukaryotic phytoplankton groups examined here, the PDR for the region was negative rather than unimodal, with diversity remaining high at low and intermediate biomass levels before declining at high biomass (Fig. 4A). During the same cruises, additional samples concurrently measured DNA abundances and net primary productivity (NPP, mg C m−3 d−1). When comparing diversity and NPP directly, the relationship was similarly flat then negative (Fig. S11A). The Shannon index considers both richness and evenness, thereby downweighing the influence of rare taxa in comparison to richness, defined here as the number of ASVs (Ibarbalz et al., 2019; Ma, 2018). Despite substantially more variability, richness also displayed a negative trend including when adding cyanobacterial richness (Figs. S11B and S12).
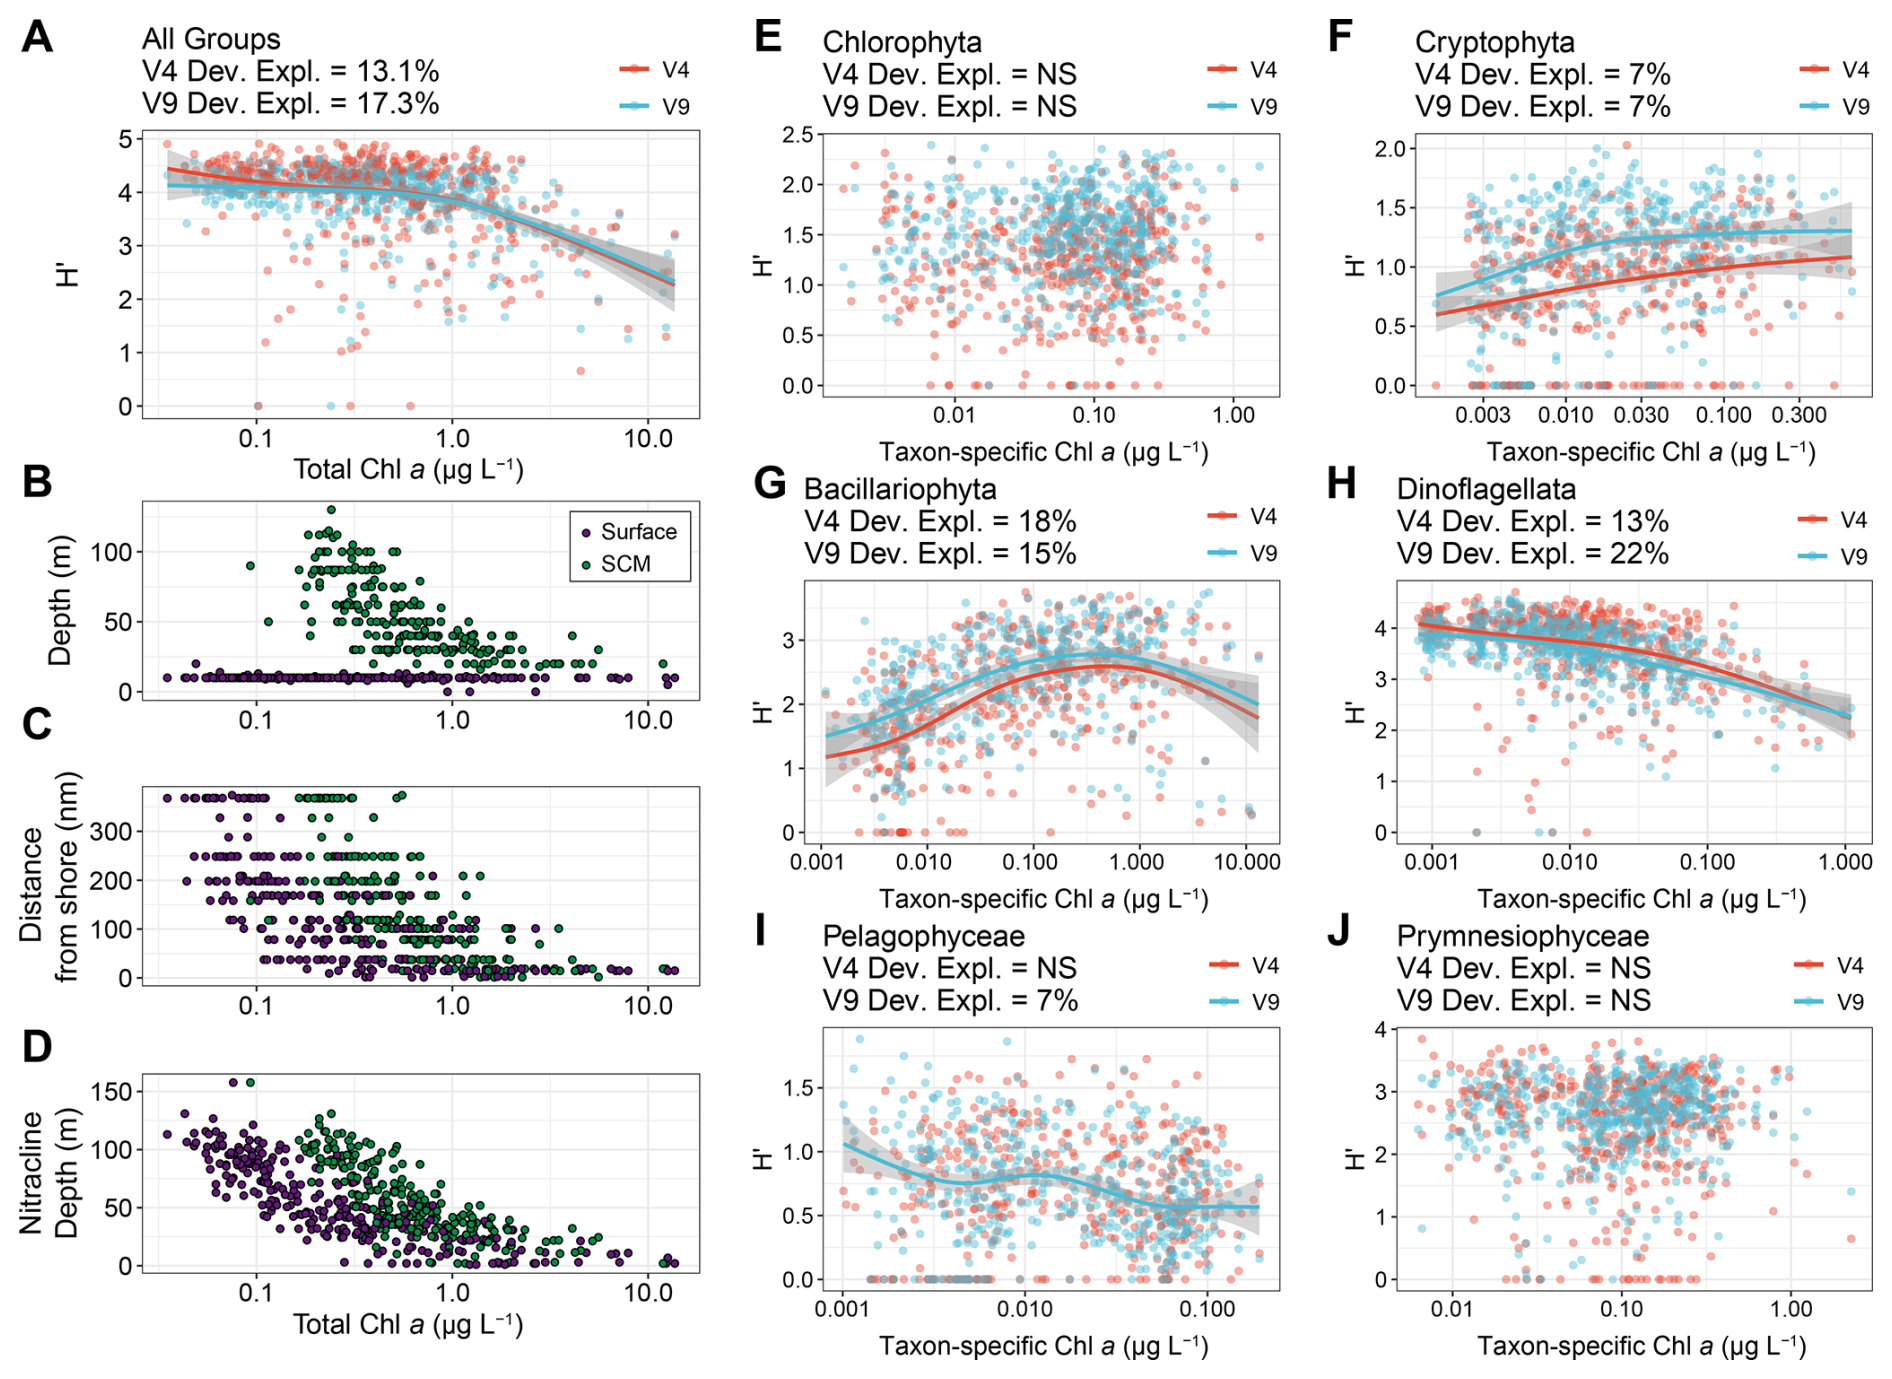
Figure 4Productivity-diversity relationships in the region with biomass (chlorophyll a concentrations) as a proxy for productivity and diversity expressed as the Shannon Index (H′) for both the 18S-V4 (red) and 18S-V9 (blue) data. (A) The diversity of all eukaryotic phytoplankton groups and total chlorophyll a concentrations. (B–D) Environmental variables against total chlorophyll a concentrations colored by near-surface (purple) or subsurface chlorophyll max (SCM, green) samples. (E–J) Diversity of individual phytoplankton groups against their taxon-specific chlorophyll aconcentrations estimated with phytoclass. Lines represent GAMs and corresponding 95 % confidence intervals where significant (P<0.05). The deviance explained by each GAM or “NS” for not significant (P>0.05) is shown above each panel for each amplicon.
By partitioning TChl a concentrations into separate eukaryotic phytoplankton groups and leveraging the high taxonomic resolution of the DNA-based data, PDRs were examined within each group (Fig. 4). Dinoflagellates, diatoms, and cryptophytes displayed significant relationships whereas other groups did not for both amplicons. Furthermore, diatoms and dinoflagellates displayed opposing trends, where diatoms displayed the expected unimodal relationship while dinoflagellates displayed a negative relationship. When considering richness, the trend for diatoms was largely positive, indicating a decline in evenness at the highest levels of biomass leading to lower diversity, and for cryptophytes, the relationship was slightly positive with both metrics (Figs. 4 and S13). Dinoflagellates had the highest richness with as many as 353 ASVs, while diatoms had a maximum of 93 ASVs (Fig. S13). Cryptophytes and pelagophytes had low richness with maxima of 15 and 9 ASVs, respectively (Fig. S13). For pelagophytes, the relatively low richness and lack of trend may be due to dominance of a single species, Pelagomonas calceolata, that is highly prevalent in SCMLs (Guérin et al., 2022; Coale et al., 2025). Meanwhile, chlorophytes and prymnesiophytes did not display significant relationships between biomass and richness. Considering the relatively high richness and sole negative trend, dinoflagellates appear to be the primary drivers of the community-wide trend, besides at high biomass where diatoms have a high influence. This dominance by dinoflagellates is further evidenced by a shift to a more unimodal distribution by examining the community in the absence of dinoflagellates (Fig. S14).
The observations of unimodal PDRs have led to hypotheses for the mechanisms underlying them. Indeed, our observed negative trend aligns with the negative side of unimodal PDRs where diversity decreases with increased productivity. This decline is predicted to be associated with high productivity nearshore upwelling conditions where there is strong competition for light and opportunist large cells such as diatoms escape grazing (Goebel et al., 2013; Irigoien et al., 2004; Vallina et al., 2014). In agreement, the observed low diversity aligns with the nearshore environment, shallow nitracline depths, and increase in diatom biomass relative to dinoflagellates (Figs. 4 and S15). However, increased diatom richness with biomass indicates that the negative trend is not entirely driven by the dominance of a few opportunist diatom taxa that escape predation (Fig. S13C). Rather, many diatoms appear to flourish when competition for nutrients is minimized under upwelling conditions, although evenness likely declines at the highest levels.
High diversity at intermediate productivity has been suggested to be associated with offshore oligotrophic conditions (Goebel et al., 2013). Although offshore oligotrophic samples aligned with the lowest biomass levels, they were in part responsible for intermediate NPP along with SCMLs at intermediate depths, in agreement with model predictions (Figs. 4 and S10). The low productivity and low diversity end of the unimodal distribution is expected to be caused by light limitation (Goebel et al., 2013), and while chlorophyll a concentrations suggest that the deepest SCML samples align with intermediate biomass, they are influenced by reduced light causing elevated chlorophyll content (Cullen, 2015). As predicted, the deepest SCML samples displayed the lowest NPP rates; however, diversity and richness remained high in these samples resulting in an absence of the positive side of a unimodal distribution that phytoplankton communities are expected to display (Fig. S10) (Irigoien et al., 2004; Li, 2002; Goebel et al., 2013).
The low productivity and diversity end of unimodal distributions have also been attributed to selective grazing with the dominance of a few slow-growing nutrient specialists (Vallina et al., 2014). As diversity and richness instead remained high, many phytoplankton taxa, particularly dinoflagellates, appear to coexist within low productivity regimes. With low nutrient availability as inferred by deeper nitracline depths (Fig. 4D), diverse phytoplankton taxa within these regimes may be sustained by recycled nutrients including nitrogen and iron as well as nitrogen fixation (Boyd et al., 2017; Zehr and Ward, 2002). Within dinoflagellates, this coexistence may be further supported by mixotrophy or diel vertical migrations where nutrient availability at depth is exploited at night and photosynthesis in the near-surface occurs during the day (Zheng et al., 2023; Stoecker et al., 2017). Within prymnesiophytes, there may also be some mixotrophic taxa (Koppelle et al., 2022). Small cells such as chlorophytes, pelagophytes, and prymnesiophytes are also at an advantage under oligotrophic conditions due to more effective resource acquisition and use (Raven, 1998), although their diversity is maintained across their biomass ranges (Fig. 4). Even though diatom diversity is lower under oligotrophic conditions, certain diatoms such as those that form symbiotic relationships with diazotrophs may be favored under these conditions and contribute to the increased diversity (Kemp and Villareal, 2018).
Overall, these results highlight the contrasting strategies of different phytoplankton groups and align with the classical view of diatoms and dinoflagellates on opposite ends of the r-selected vs K-selected continuum (Margalef, 1978). However, these results may differ from other regions that exhibit greater stability or experience frequent blooms of groups besides diatoms. Continued warming in the region is anticipated to lead to increased stratification resulting in conditions analogous to those in the offshore oligotrophic region with deeper nitraclines (Ducklow et al., 2022; Lund, 2024). These projections imply that increased stratification leads to low productivity but high phytoplankton community diversity, although diatom diversity will be lower. In such a scenario, the high level of diversity will instead be driven by dinoflagellates and supplemented by a variety of picoeukaryotes, contrasting with predictions of lower diversity in ecosystem models of open ocean regions (Henson et al., 2021).
3.2.2 Monitoring and forecasting harmful algal blooms
The strong relationships between pigments and abundances of certain groups may also be useful for monitoring or forecasting harmful algal blooms (HABs). For example, certain species in the diatom genus, Pseudo-nitzschia, produce the neurotoxin domoic acid (DA) resulting in HABs worldwide (Bates et al., 2018). They are also commonly responsible for HABs in our study region and California Current at large (Lewitus et al., 2012).
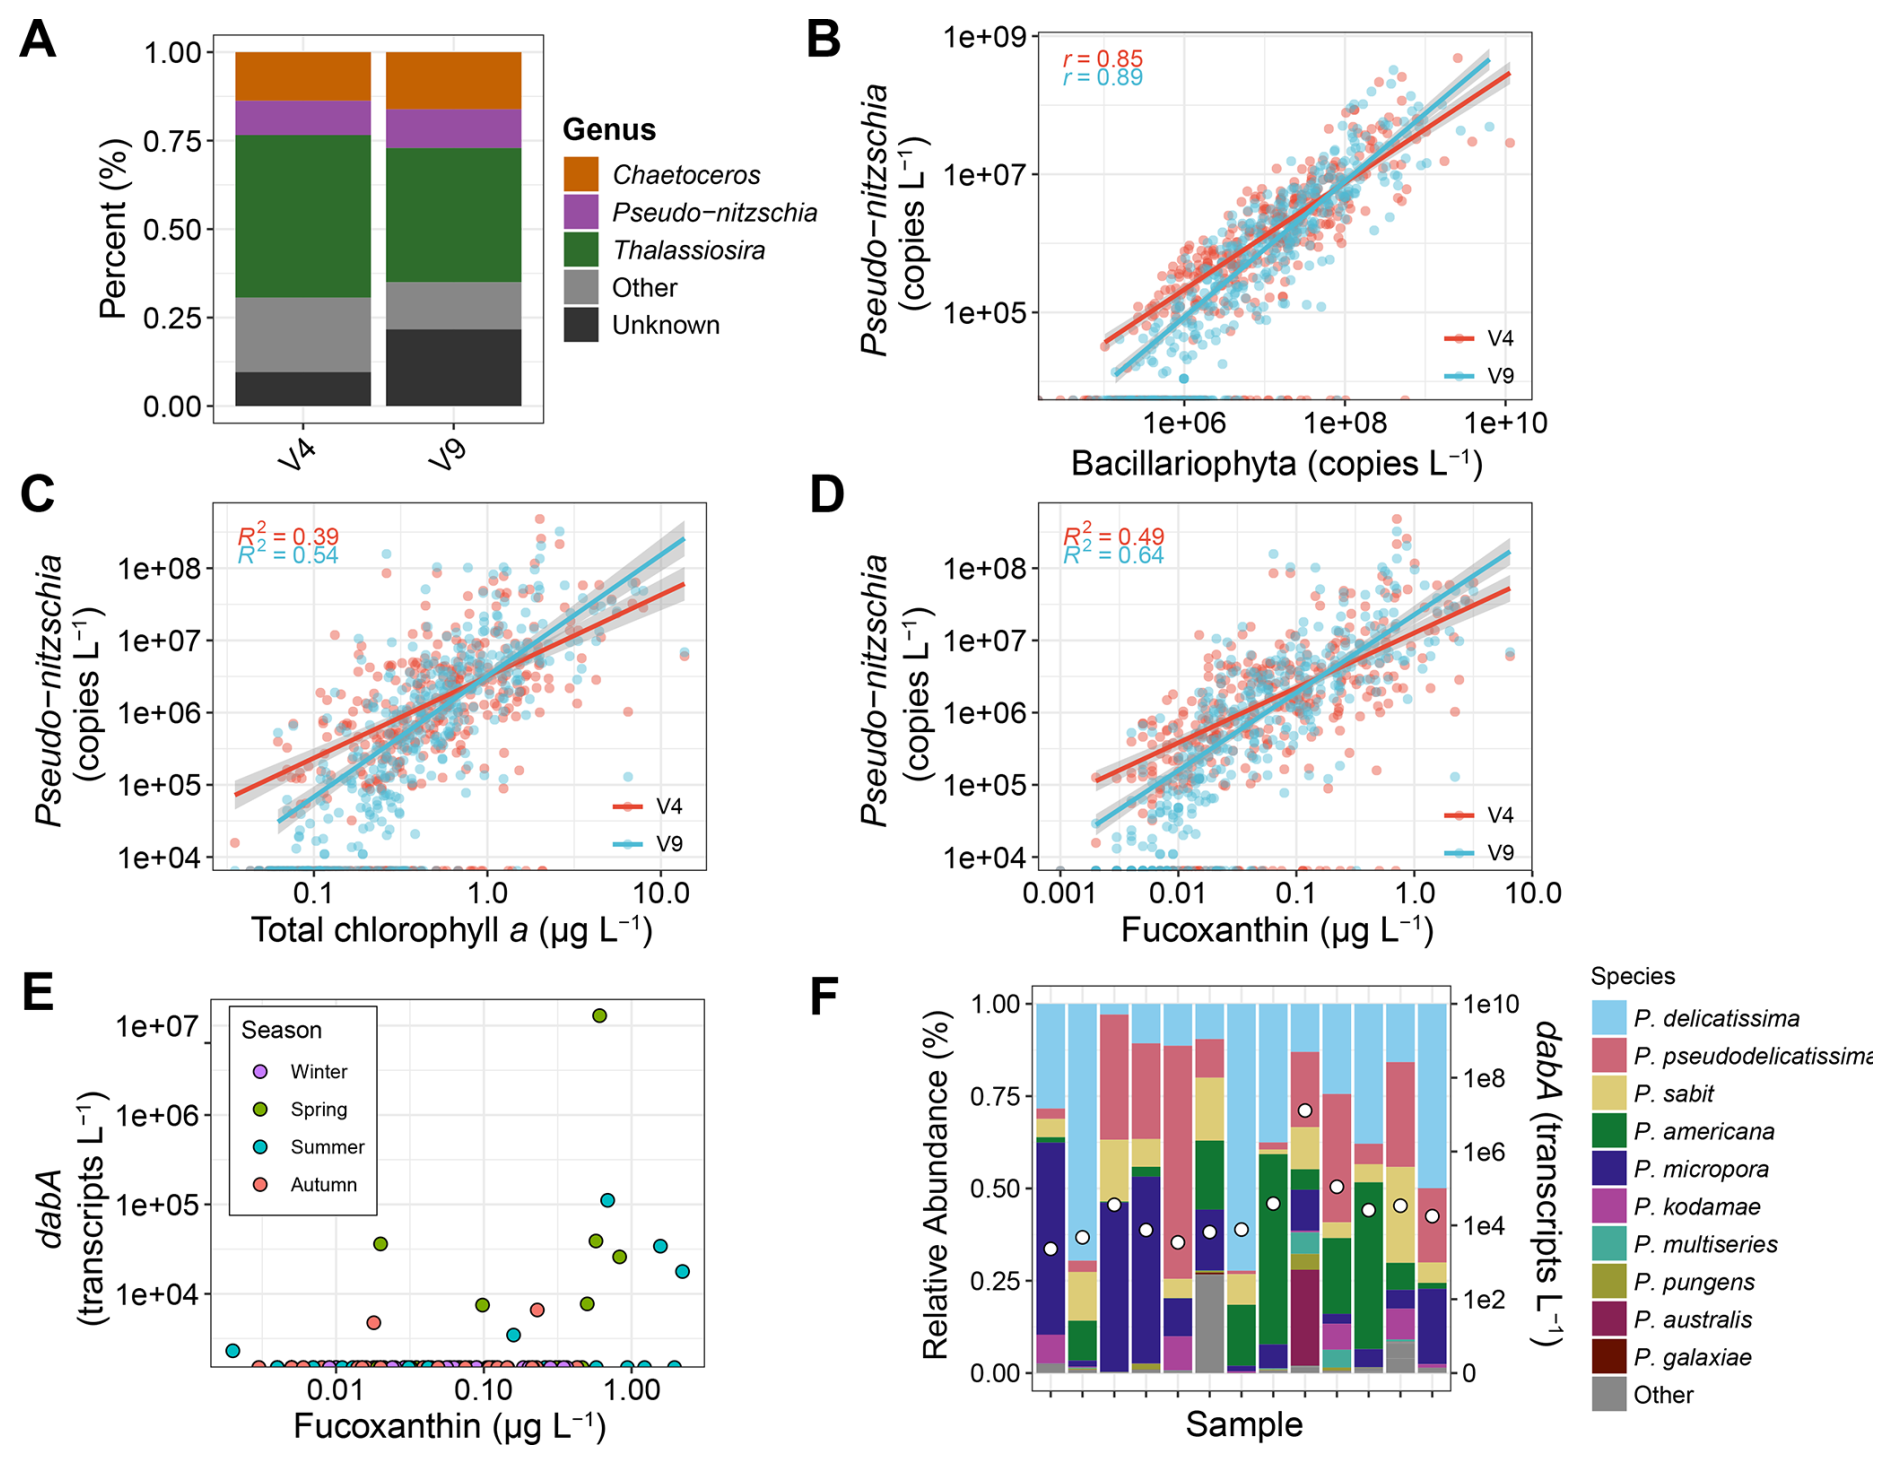
Figure 5Pseudo-nitzschia abundances. (A) Relative abundances of the top three diatom genera based on total copies L−1. (B) Pseudo-nitzschia absolute abundances against diatom (Bacillariophyta) absolute abundances. (C) Pseudo-nitzschia absolute abundances against total chlorophyll a concentrations (D) Pseudo-nitzschia absolute abundances against fucoxanthin concentrations. (E) Total dabA expression against fucoxanthin concentrations. (F) Relative abundances of Pseudo-nitzschia species from ITS2 sequencing (left y-axis) and total dabA expression (right y-axis) for samples where dabA was detected. Samples are ordered by fucoxanthin concentrations as shown in Panel (E).
In the California Current region, Pseudo-nitzschia abundances and DA production are forecasted by the California Harmful Algae Risk Mapping (C-HARM) system, which uses satellite remote-sensing data and a regional ocean circulation model. Specifically, the remote-sensing data used as inputs are chlorophyll a concentrations and reflectance at 488 and 555 nm from the S-NPP NOAA VIIRS instrument. As Fuco offers greater specificity for diatoms, substituting Fuco for chlorophyll a may improve model predictions, particularly if Pseudo-nitzschia is a dominant diatom overall.
With the absolute abundance data here, Pseudo-nitzschia was indeed among the most dominant diatom genera, accounting for 10 % to 11 % of diatom 18S copies and only exceeded by Thalassiosira and Chaetoceros (Fig. 5A). Pseudo-nitzschia was also detected in 74 % to 79 % of samples when diatoms were present with an equivalent number when Fuco was detected. Overall, a strong positive relationship between Pseudo-nitzschia and total diatom abundances was observed, and Fuco concentrations explained 10 % more of the variance in Pseudo-nitzschia abundances than TChl a concentrations (Fig. 5). Expression of dabA, the first gene in the domoic acid biosynthetic pathway (Brunson et al., 2018), was also detected in 13 metatranscriptomics samples, and 7 of the 11 samples with greater than 0.5 µg L−1 concentrations of Fuco had detectable dabA expression (Fig. 5E). These samples comprised diverse Pseudo-nitzschia species with an overall dominance of P. delicatissima; however, the highest dabA expression occurred when P. australis relative abundances were elevated (Fig. 5F).
Not all species of Pseudo-nitzschia have been shown to produce DA, and DA production is influenced by environmental conditions (Bates et al., 2018). Similarly, expression of dabA does not always confer detectable particulate DA (Brunson et al., 2024). However, the stronger relationship between Pseudo-nitzschia abundances and Fuco compared to TChl a as well as the increased detection of dabA where Fuco concentrations are elevated implies that substitution of chlorophyll a with Fuco within C-HARM may improve model accuracy. Pending the development and implementation of models for remotely-sensed Fuco concentrations (Kramer et al., 2022), such potential improvements for Pseudo-nitzschia forecasts will require validation with in situ measurements. Moreover, the utility of remotely-sensed Fuco concentrations for Pseudo-nitzschia HAB monitoring would only apply to other regions where Pseudo-nitzschia is a dominant diatom.
Some dinoflagellates, including certain members of the genera Alexandrium, Dinophysis, and Gonyaulax as well as the species Gymnodinium catenatum and Lingulodinium polyedra, may also cause HABs in both this region and others (Anderson et al., 2021; Trainer et al., 2010; Ternon et al., 2023; Anderson et al., 2012). These genera were also among the most dominant dinoflagellate genera detected, although 39 % of V4 and 55 % of V9 18S copies for dinoflagellates were unassigned on a genus level (Fig. S7B). Despite dinoflagellate diversity declining with increasing biomass, dinoflagellate richness was the highest among phytoplankton groups, including where the highest dinoflagellate biomass was observed (Figs. 4 and S13). As a result, the samples with high dinoflagellate abundances still comprise many genera. Considering that Perid concentrations did not exceed 1 µg L−1, an intense dinoflagellate bloom that may have resulted in even lower diversity was not captured here. Nevertheless, Perid concentrations and V4-based abundances of the dinoflagellate genera Alexandrium, Gonyaulax, and Gymnodinium were significantly related (Fig. S13). Perid concentrations also explained 9 %–16 % more of the variance in the abundances of these genera compared to TChl a concentrations. In contrast, no significant relationships were observed for Lingulodinium and Dinophysis, the latter of which does not contain Perid. As in Pseudo-nitzschia, there are non-toxic members of these genera, and their presence does not imply the production of their respective toxins (Anderson et al., 2012). Again however, the potential ability to distinguish either increased Perid or Fuco concentrations with remote sensing suggests increases in the genera identified here in this region, and may aid HAB monitoring efforts where high pigment concentrations largely correspond to an increase in HAB-forming taxa.
3.2.3 Towards increased inference of biogeochemical or metabolic activity
Current ESMs are unable to confidently predict climate-driven changes to NPP, and improving these models to better account for phytoplankton abundances and functions is a critical component to address this uncertainty (Kwiatkowski et al., 2020; Tagliabue, 2023). ESM parameters include biological rates and biogeochemical fluxes, and there is increasing interest in the ability to connect omics data with rates such that the omics can inform these model parameters (Strzepek et al., 2022; Saito et al., 2024). The absolute quantities of certain proteins have shown promise for inferring rates of nitrite oxidation and carbon fixation (Saito et al., 2020; Roberts et al., 2024), although it is unclear if absolute transcript abundances will be able to serve a similar purpose (McCain et al., 2025).
The strong correlations between pigments and total transcript abundances in most groups examined here suggest that pigment abundances may also relate to the expression of specific genes (Fig. 2C). Within each group, the absolute abundances of genes clustered by KEGG annotations (Sect. 2.6) were correlated with their respective diagnostic pigments (Fig. 6). In chlorophytes, there was only one strongly significant correlation with a light-harvesting chlorophyll-binding protein (LHCB) and Prochlorococcus had no significant correlations. In other groups however, 67 to 2312 genes were strongly correlated with their respective groups' diagnostic pigments (r>0.60, FDR < 0.05). For some taxa, specific genes displayed stronger correlations than both 18S rRNA genes and all transcripts combined (Fig. 2), indicating that they may individually be used as indicators of abundances. These include the pentose phosphate pathway genes 6-phosphogluconate dehydrogenase (PGD) and glucose-6-phosphate dehydrogenase (G6PD) in dinoflagellates as well as several accessory light harvesting complex (LHCF) proteins in prymnesiophytes. With 34 % to 65 % of genes with no assigned function, the remaining genes fall into diverse sets of metabolic categories (Fig. 6).
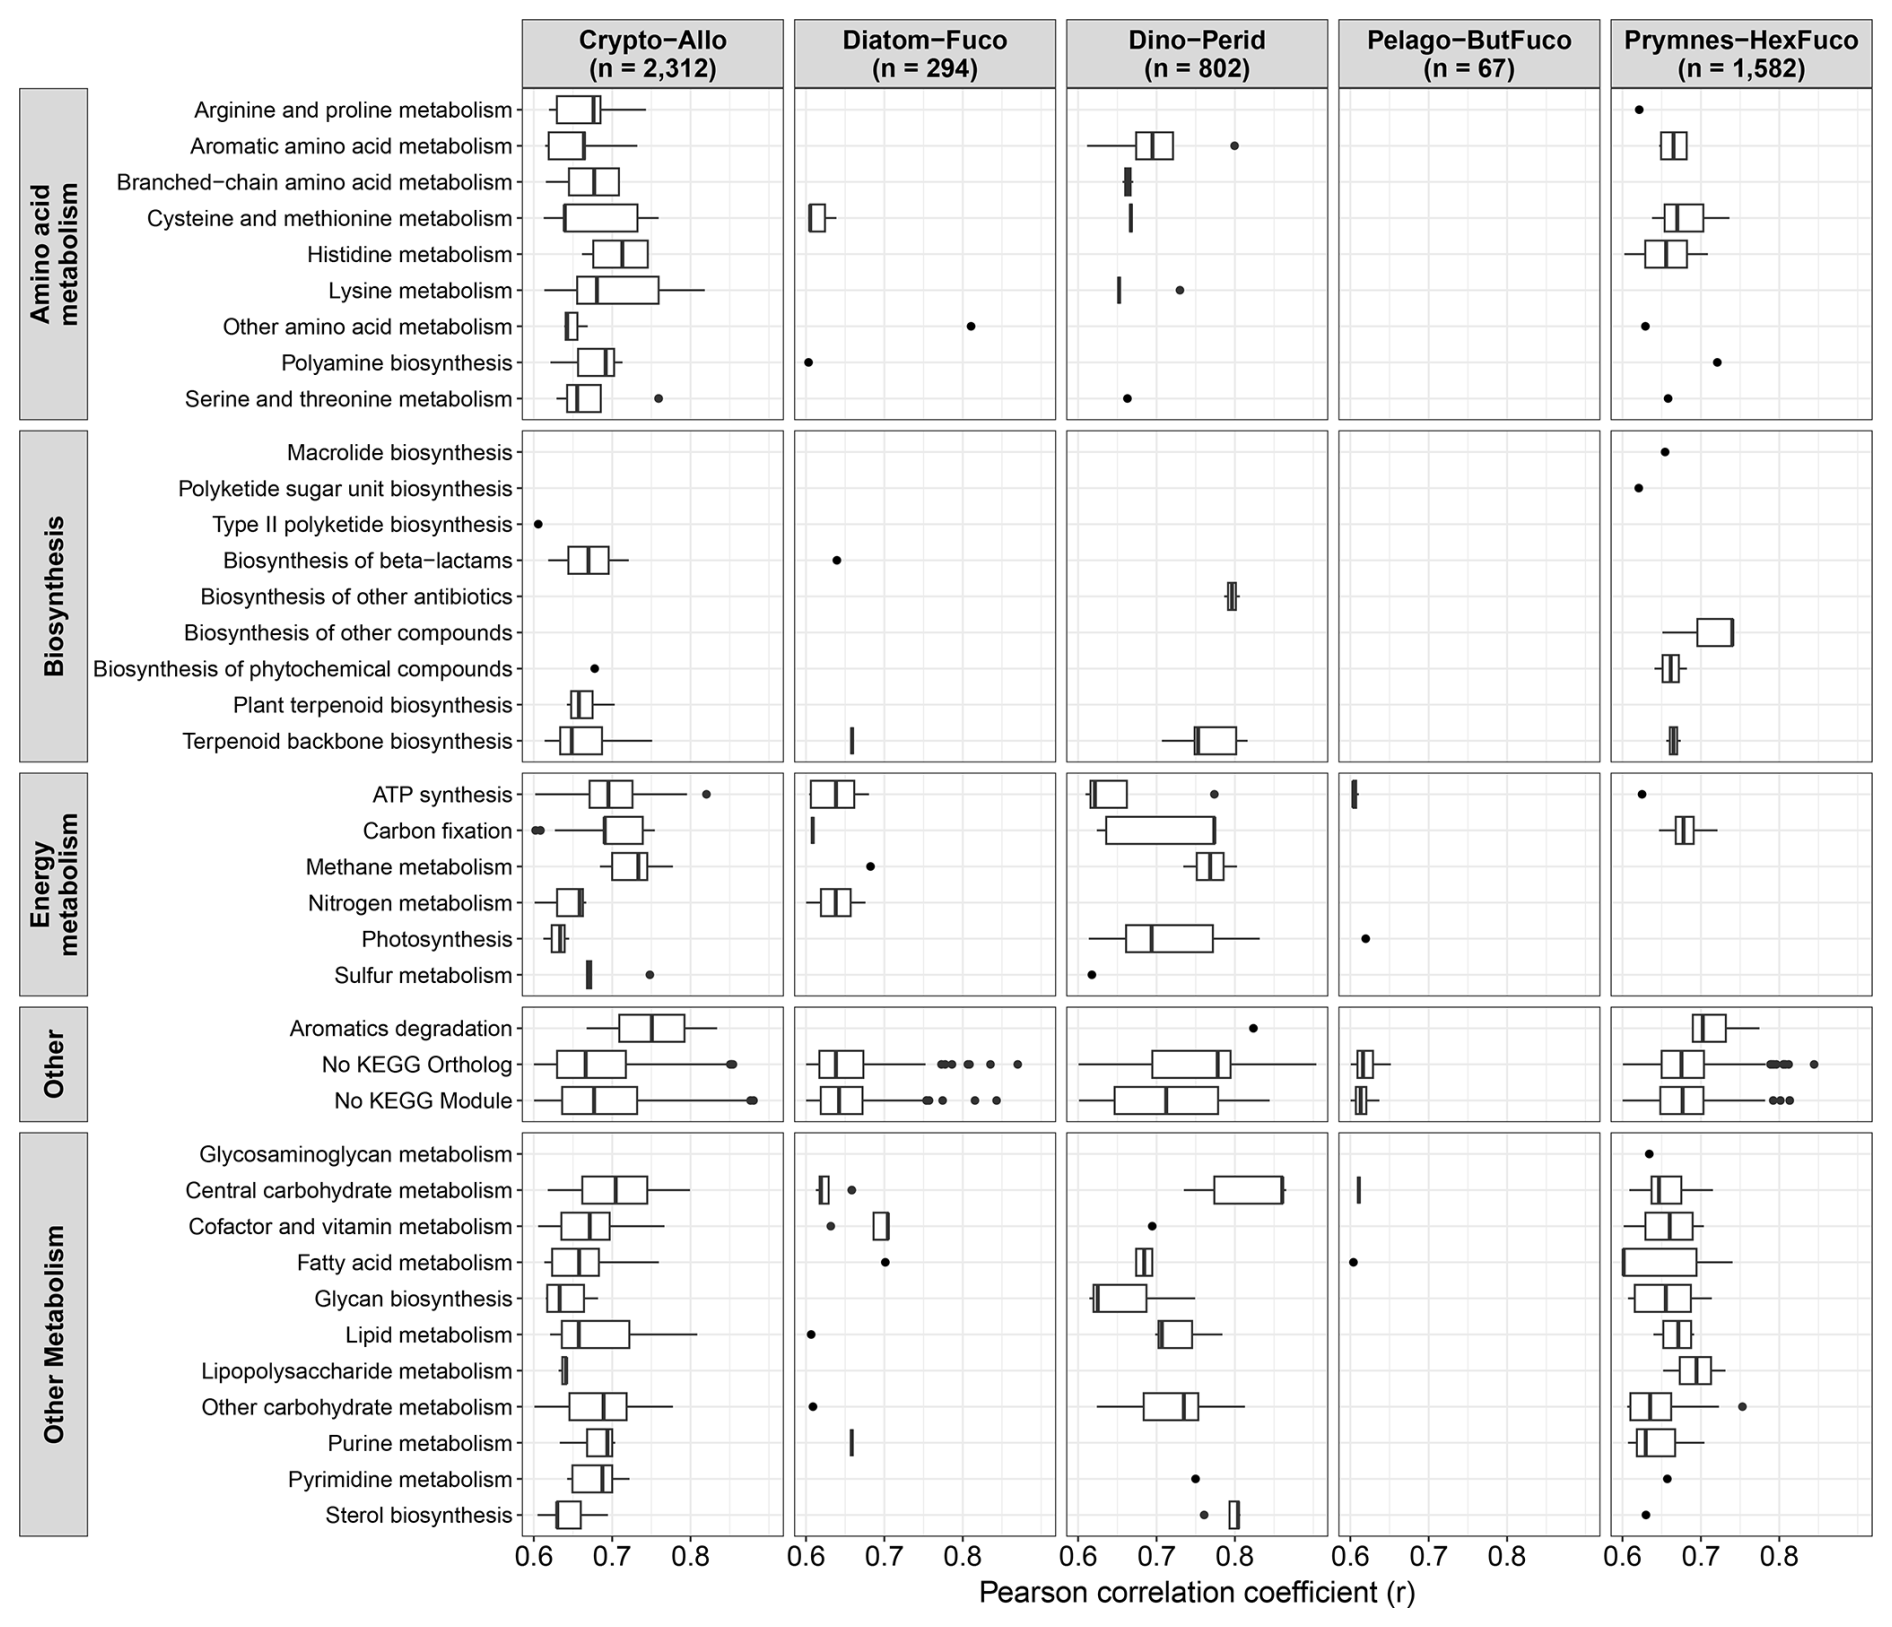
Figure 6Strongly significant correlations between diagnostic pigments and gene expression (transcripts L−1) associated with each respective group (r>0.60, FDR < 0.05) and organized by KEGG module classes. To examine correlations, genes were aggregated by KEGG Ortholog annotations and if not present, the KEGG gene annotations were used.
In cryptophytes and dinoflagellates, several genes related to carbon fixation and photosynthesis were strongly correlated (Fig. 6). Cryptophytes and diatoms also showed strong correlations with several nitrogen metabolism genes. In baker's yeast (Saccharomyces cerevisiae), the abundances of individual proteins are generally poor predictors of their corresponding reaction rates but the combined abundances of functional units of genes, i.e. modules or subsystems, that are responsible for specific pathways may more accurately predict rates (McCain et al., 2025). Similarly, increases in the abundances of specific pigments here correlates with the expression of certain pathways. If the expression of these pathways are also found to correspond to changes in group-specific reaction rates, then the detection of these pigments with remote sensing may be useful for inferring group-specific activities, which could better constrain ESM parameters leading to more accurate predictions.
Although these relatively strong correlations between pigments and transcripts indicates that this application has potential use to infer activity, direct relationships with rates remain to be demonstrated, and establishing these relationships would require extensive additional validation with field-based studies that integrate these measurements. Moreover, as a large percentage of these genes remain of unknown function, improved characterization of their function may provide insight into how to better leverage the pigments with which they correlate.
By integrating phytoplankton pigments with quantitative abundances of 18S rRNA genes and total mRNA via metabarcoding and metatranscriptomics respectively, we demonstrate that diagnostic pigments for specific eukaryotic phytoplankton groups correlate with both their DNA- and RNA-based abundances. Although there are inherent biases associated with each of these measurements, their relationships suggest that they are comparable and may all individually be useful for validating potential models of PCC from hyperspectral remote sensing reflectance with satellites such as PACE. These relationships also suggest that the potential development of models for remotely sensed pigment concentrations will provide reasonable estimates for the abundances of different phytoplankton groups (Kramer et al., 2022). When coupled to other satellite, glider, or float-based measurements of photophysiology (Lin et al., 2016; Ryan-Keogh et al., 2023), phytoplankton group-specific abundances, community composition, and physiological assessments may be able to be remotely and collectively assembled.
Although this assessment was only performed in the California Current Ecosystem, these relationships may extend to other regions. Previous use of quantitative metabarcoding in the Western Antarctic Peninsula with relatively high abundances of cryptophytes showed that their chemotaxonomic abundances were well correlated with their DNA-based abundances (Lin et al., 2019). Diatoms were not strongly correlated, but this result may be an artifact from a small sample size that did not capture a large range of diatom abundances in the region. Considering that the strengths of correlations in all eukaryotic groups improved when translating relative abundances into absolute abundances here, previous studies in the California Current, North Atlantic and Northeast Pacific that used relative abundances were likely affected by issues when correlating compositional data, and we hypothesize that stronger correlations would be observed had quantitative approaches been employed. In particular, dinoflagellates displayed relatively low correlations with relative abundances (Kramer et al., 2024; Catlett et al., 2023), but the strength of these correlations dramatically improved by using quantitative approaches here (Fig. 2A). For cyanobacterial abundances, pigment and transcriptional variability likely contributed to weaker correlations when using absolute abundances. Smaller filter pore sizes such as those obtained by combusting GF/F filters may also need to be considered when drawing these comparisons in future studies (Nayar and Chou, 2003).
The existence of relationships among these metrics also creates possibilities for several applications beyond simply assessing phytoplankton abundances and community composition. For example, PDRs can be examined in detail with not only the whole phytoplankton community but also within individual phytoplankton groups. By doing so, we show that the PDR for the whole community in the region is negative rather than the expected unimodal distribution (Fig. 4A). By partitioning biomass into separate groups and leveraging the high resolution provided by DNA, we show that this negative trend is driven by dinoflagellates while diatoms largely show the opposite trend (Fig. 4G and H). These differences in PDRs align with the classical view of diatoms and dinoflagellates on opposite ends of the r- and K-selected continuum, while also showing that diatom richness increases under bloom scenarios rather than selecting for a small number of opportunists (Margalef, 1978). The results also suggest that a shift to a more stratified less productive regime from climate change may support a more diverse phytoplankton community, but one that has low diatom diversity.
Increases in diatom and dinoflagellate pigments also align with increases in genera that contain harmful bloom-forming taxa (Figs. 5 and S12). With the harmful diatom genus Pseudo-nitzschia, gene expression for toxin biosynthesis was also often elevated under higher Fuco concentrations (Fig. 5E). Although increases in these genera does not always imply that there is toxin production, the detection of these pigments, and in particular, the substitution of remotely-sensed chlorophyll a for phytoplankton pigments such as Fuco may improve HAB detection and forecasts, specifically in regions where HAB-forming taxa dominate their respective groups. Increases in pigments also corresponds to higher expression of genes specific to their respective group besides with chlorophytes. These genes fall into diverse metabolic categories, and as connections between gene expression and rate processes may emerge as shown in the laboratory with model organisms and quantitative protein measurements (McCain et al., 2025), the detection of pigments may aid the inference of group-specific metabolic activity and help constrain phytoplankton activity within ESMs. However, for both HAB forecasts and the inference of phytoplankton activity, significant additional validation will be required.
Phytoplankton pigment and flow cytometry data are available on CCE-LTER Datazoo: https://oceaninformatics.ucsd.edu/datazoo/catalogs/ccelter/datasets (last access: 29 June 2024). The DNA and RNA sequence data reported in this study have been deposited in the National Center for Biotechnology (NCBI) sequence read archive under the BioProject accession numbers PRJNA555783, PRJNA665326, and PRJNA804265.
The supplement related to this article is available online at https://doi.org/10.5194/bg-22-6787-2025-supplement.
RHL, RG, and AEA designed the study approach. RHL, AJR, SMW, AS, and HZ performed the nucleic acid sample collection, processing, and DNA-based analyses. RHL and PV analyzed the metatranscriptomics data. MRL provided the flow cytometry data. RHL, RG, and MRS analyzed the phytoplankton pigment data. RHL, ADB, and AEA synthesized the results. RHL performed the statistical analyses and wrote the manuscript with input from all authors.
The contact author has declared that none of the authors has any competing interests.
Publisher’s note: Copernicus Publications remains neutral with regard to jurisdictional claims made in the text, published maps, institutional affiliations, or any other geographical representation in this paper. While Copernicus Publications makes every effort to include appropriate place names, the final responsibility lies with the authors. Views expressed in the text are those of the authors and do not necessarily reflect the views of the publisher.
We thank the CCE-LTER scientists, Shonna Dovel and Megan Roadman, and the captains and crews of all research vessels involved. We also thank Mark Ohman and Kathy Barbeau as former and current Lead PIs of the California Current Ecosystem Long-Term Ecological Research (CCE-LTER) site and Brice Semmens as the director of CalCOFI. Zoltán Füssy also assisted in the submission of this manuscript.
This research has been supported by the National Oceanic and Atmospheric Administration (grant nos. NA15OAR4320071 and NA19NOS4780181), the National Science Foundation Directorate for Geosciences (grant nos. OCE-1026607, OCE-1637632, and OCE-2224726), the National Science Foundation Directorate for STEM Education (grant no. DGE-1650112), the Gordon and Betty Moore Foundation (grant no. GBMF3828), the Simons Foundation Collaboration on Principles of Microbial Ecosystems (PriME) (grant no. 970820), and the LaVerne Noyes Foundation.
This paper was edited by Koji Suzuki and reviewed by Elisabetta Canuti, Robert F. Strzepek, and one anonymous referee.
Agusti, S., González-Gordillo, J. I., Vaqué, D., Estrada, M., Cerezo, M. I., Salazar, G., Gasol, J. M., and Duarte, C. M.: Ubiquitous healthy diatoms in the deep sea confirm deep carbon injection by the biological pump, Nat. Comm., 6, 7608, https://doi.org/10.1038/ncomms8608, 2015.
Amaral-Zettler, L. A., McCliment, E. A., Ducklow, H. W., and Huse, S. M.: A Method for Studying Protistan Diversity Using Massively Parallel Sequencing of V9 Hypervariable Regions of Small-Subunit Ribosomal RNA Genes, PLoS ONE, 4, e6372, https://doi.org/10.1371/journal.pone.0006372, 2009.
Anderson, C. R., Siegel, D. A., Brzezinski, M. A., and Guillocheau, N.: Controls on temporal patterns in phytoplankton community structure in the Santa Barbara Channel, California, J. Geophys. Res.-Oceans, 113, C04038, https://doi.org/10.1029/2007JC004321, 2008.
Anderson, D. M., Cembella, A. D., and Hallegraeff, G. M.: Progress in understanding harmful algal blooms: paradigm shifts and new technologies for research, monitoring, and management, Annu. Rev. Mar. Sci., 4, 143–176, 2012.
Anderson, D. M., Fensin, E., Gobler, C. J., Hoeglund, A. E., Hubbard, K. A., Kulis, D. M., Landsberg, J. H., Lefebvre, K. A., Provoost, P., and Richlen, M. L.: Marine harmful algal blooms (HABs) in the United States: History, current status and future trends, Harmful Algae, 102, 101975, https://doi.org/10.1016/j.hal.2021.101975, 2021.
Antajan, E., Chrétiennot-Dinet, M. J., Leblanc, C., Daro, M. H., and Lancelot, C.: 19'-hexanoyloxyfucoxanthin may not be the appropriate pigment to trace occurrence and fate of Phaeocystis: the case of P. globosa in Belgian coastal waters, J. Sea Res., 52, 165–177, https://doi.org/10.1016/j.seares.2004.02.003, 2004.
Aramaki, T., Blanc-Mathieu, R., Endo, H., Ohkubo, K., Kanehisa, M., Goto, S., and Ogata, H.: KofamKOALA: KEGG Ortholog assignment based on profile HMM and adaptive score threshold, Bioinformatics, 36, 2251–2252, https://doi.org/10.1093/bioinformatics/btz859, 2019.
Armstrong, F., Stearns, C., and Strickland, J.: The measurement of upwelling and subsequent biological process by means of the Technicon Autoanalyzer® and associated equipment, Deep Sea Research and Oceanographic Abstracts, 381–389, https://doi.org/10.1016/0011-7471(67)90082-4, 1967.
Bates, S. S., Hubbard, K. A., Lundholm, N., Montresor, M., and Leaw, C. P.: Pseudo-nitzschia, Nitzschia, and domoic acid: New research since 2011, Harmful Algae, 79, 3–43, https://doi.org/10.1016/j.hal.2018.06.001, 2018.
Benjamini, Y. and Hochberg, Y.: Controlling the False Discovery Rate: A Practical and Powerful Approach to Multiple Testing, J. R. Stat. Soc. B, 57, 289–300, 1995.
Berdjeb, L., Parada, A., Needham, D. M., and Fuhrman, J. A.: Short-term dynamics and interactions of marine protist communities during the spring–summer transition, ISME J., 12, 1907–1917, https://doi.org/10.1038/s41396-018-0097-x, 2018.
Bertrand, E. M., McCrow, J. P., Moustafa, A., Zheng, H., McQuaid, J. B., Delmont, T. O., Post, A. F., Sipler, R. E., Spackeen, J. L., Xu, K., Bronk, D. A., Hutchins, D. A., and Allen, A. E.: Phytoplankton–bacterial interactions mediate micronutrient colimitation at the coastal Antarctic sea ice edge, P. Natl. Acad. Sci. USA, 112, 9938–9943, https://doi.org/10.1073/pnas.1501615112, 2015.
Bokulich, N. A., Kaehler, B. D., Rideout, J. R., Dillon, M., Bolyen, E., Knight, R., Huttley, G. A., and Gregory Caporaso, J.: Optimizing taxonomic classification of marker-gene amplicon sequences with QIIME 2's q2-feature-classifier plugin, Microbiome, 6, 90, https://doi.org/10.1186/s40168-018-0470-z, 2018.
Bolyen, E., Rideout, J. R., Dillon, M. R., Bokulich, N. A., Abnet, C., Al-Ghalith, G. A., Alexander, H., Alm, E. J., Arumugam, M., Asnicar, F., Bai, Y., Bisanz, J. E., Bittinger, K., Brejnrod, A., Brislawn, C. J., Brown, C. T., Callahan, B. J., Caraballo-Rodríguez, A. M., Chase, J., Cope, E., Da Silva, R., Dorrestein, P. C., Douglas, G. M., Durall, D. M., Duvallet, C., Edwardson, C. F., Ernst, M., Estaki, M., Fouquier, J., Gauglitz, J. M., Gibson, D. L., Gonzalez, A., Gorlick, K., Guo, J., Hillmann, B., Holmes, S., Holste, H., Huttenhower, C., Huttley, G., Janssen, S., Jarmusch, A. K., Jiang, L., Kaehler, B., Kang, K. B., Keefe, C. R., Keim, P., Kelley, S. T., Knights, D., Koester, I., Kosciolek, T., Kreps, J., Langille, M. G. I., Lee, J., Ley, R., Liu, Y.-X., Loftfield, E., Lozupone, C., Maher, M., Marotz, C., Martin, B. D., McDonald, D., McIver, L. J., Melnik, A. V., Metcalf, J. L., Morgan, S. C., Morton, J., Naimey, A. T., Navas-Molina, J. A., Nothias, L. F., Orchanian, S. B., Pearson, T., Peoples, S. L., Petras, D., Preuss, M. L., Pruesse, E., Rasmussen, L. B., Rivers, A., Robeson, I. I. M. S., Rosenthal, P., Segata, N., Shaffer, M., Shiffer, A., Sinha, R., Song, S. J., Spear, J. R., Swafford, A. D., Thompson, L. R., Torres, P. J., Trinh, P., Tripathi, A., Turnbaugh, P. J., Ul-Hasan, S., van der Hooft, J. J. J., Vargas, F., Vázquez-Baeza, Y., Vogtmann, E., von Hippel, M., Walters, W., Wan, Y., Wang, M., Warren, J., Weber, K. C., Williamson, C. H. D., Willis, A. D., Xu, Z. Z., Zaneveld, J. R., Zhang, Y., Zhu, Q., Knight, R., and Caporaso, J. G.: Reproducible, interactive, scalable, and extensible microbiome data science using QIIME 2, Nat. Biotechnol., 37, 852–857, 2019.
Bowler, C., Vardi, A., and Allen, A. E.: Oceanographic and Biogeochemical Insights from Diatom Genomes, Annu. Rev. Mar. Sci., 2, 333–365, https://doi.org/10.1146/annurev-marine-120308-081051, 2010.
Boyd, P. W., Ellwood, M. J., Tagliabue, A., and Twining, B. S.: Biotic and abiotic retention, recycling and remineralization of metals in the ocean, Nat. Geosci., 10, 167, https://doi.org/10.1038/ngeo2876, 2017.
Brunson, J. K., McKinnie, S. M. K., Chekan, J. R., McCrow, J. P., Miles, Z. D., Bertrand, E. M., Bielinski, V. A., Luhavaya, H., Oborník, M., Smith, G. J., Hutchins, D. A., Allen, A. E., and Moore, B. S.: Biosynthesis of the neurotoxin domoic acid in a bloom-forming diatom, Science, 361, 1356–1358, https://doi.org/10.1126/science.aau0382, 2018.
Brunson, J. K., Thukral, M., Ryan, J. P., Anderson, C. R., Kolody, B. C., James, C. C., Chavez, F. P., Leaw, C. P., Rabines, A. J., Venepally, P., Fussy, Z., Zheng, H., Kudela, R. M., Smith, G. J., Moore, B. S., and Allen, A. E.: Molecular forecasting of domoic acid during a pervasive toxic diatom bloom, P. Natl. Acad. Sci. USA, 121, e2319177121, https://doi.org/10.1073/pnas.2319177121, 2024.
Catlett, D., Siegel, D. A., Matson, P. G., Wear, E. K., Carlson, C. A., Lankiewicz, T. S., and Iglesias-Rodriguez, M. D.: Integrating phytoplankton pigment and DNA meta-barcoding observations to determine phytoplankton composition in the coastal ocean, Limnol. Oceanogr., 68, 361–376, https://doi.org/10.1002/lno.12274, 2023.
Cermeño, P., Rodríguez-Ramos, T., Dornelas, M., Figueiras, F. G., Marañón, E., Teixeira, I. G., and Vallina, S. M.: Species richness in marine phytoplankton communities is not correlated to ecosystem productivity, Mar. Ecol. Prog. Ser., 488, 1–9, 2013.
Cetinić, I., Rousseaux, C. S., Carroll, I. T., Chase, A. P., Kramer, S. J., Werdell, P. J., Siegel, D. A., Dierssen, H. M., Catlett, D., Neeley, A., Soto Ramos, I. M., Wolny, J. L., Sadoff, N., Urquhart, E., Westberry, T. K., Stramski, D., Pahlevan, N., Seegers, B. N., Sirk, E., Lange, P. K., Vandermeulen, R. A., Graff, J. R., Allen, J. G., Gaube, P., McKinna, L. I. W., McKibben, S. M., Binding, C. E., Calzado, V. S., and Sayers, M.: Phytoplankton composition from sPACE: Requirements, opportunities, and challenges, Remote Sens. Environ., 302, 113964, https://doi.org/10.1016/j.rse.2023.113964, 2024.
Checkley, D. M. and Barth, J. A.: Patterns and processes in the California Current System, Prog. Oceanogr., 83, 49–64, https://doi.org/10.1016/j.pocean.2009.07.028, 2009.
Coale, T., Lampe, R., Tan, M., Rowland, E., Füssy, Z., Venepally, P., Zheng, H., McCrow, J., Bertrand, E., and Allen, A.: Molecular and Physiological Acclimation to Low Light and Iron Scarcity in Globally Abundant Oceanic Pelagophyte, Research Square [preprint], https://doi.org/10.21203/rs.3.rs-6701642/v1, 2025.
Coesel, S. N., van Creveld, S. G., Dugenne, M., Henderikx-Freitas, F., White, A. E., and Armbrust, E. V.: Proportional relationship between transcript concentrations and carbon biomass for open ocean plankton groups, ISME J., 19, https://doi.org/10.1093/ismejo/wraf079, 2025.
Cohen, N. R., Alexander, H., Krinos, A. I., Hu, S. K., and Lampe, R. H.: Marine Microeukaryote Metatranscriptomics: Sample Processing and Bioinformatic Workflow Recommendations for Ecological Applications, Front. Mar. Sci., 9, 867007, https://doi.org/10.3389/fmars.2022.867007, 2022.
Cotti-Rausch, B. E., Lomas, M. W., Lachenmyer, E. M., Goldman, E. A., Bell, D. W., Goldberg, S. R., and Richardson, T. L.: Mesoscale and sub-mesoscale variability in phytoplankton community composition in the Sargasso Sea, Deep-Sea Res. Pt. I, 110, 106–122, 2016.
Cullen, J. J.: Subsurface Chlorophyll Maximum Layers: Enduring Enigma or Mystery Solved?, Annu. Rev. Mar. Sci., 7, 207–239, https://doi.org/10.1146/annurev-marine-010213-135111, 2015.
Decelle, J., Kayal, E., Bigeard, E., Gallet, B., Bougoure, J., Clode, P., Schieber, N., Templin, R., Hehenberger, E., Prensier, G., Chevalier, F., Schwab, Y., and Guillou, L.: Intracellular development and impact of a marine eukaryotic parasite on its zombified microalgal host, ISME J., 16, 2348–2359, https://doi.org/10.1038/s41396-022-01274-z, 2022.
Decelle, J., Romac, S., Stern, R. F., Bendif, E. M., Zingone, A., Audic, S., Guiry, M. D., Guillou, L., Tessier, D., Le Gall, F., Gourvil, P., Dos Santos, A. L., Probert, I., Vaulot, D., de Vargas, C., and Christen, R.: PhytoREF: a reference database of the plastidial 16S rRNA gene of photosynthetic eukaryotes with curated taxonomy, Mol. Ecol. Resour., 15, 1435–1445, https://doi.org/10.1111/1755-0998.12401, 2015.
Deutsch, C., Frenzel, H., McWilliams, J. C., Renault, L., Kessouri, F., Howard, E., Liang, J.-H., Bianchi, D., and Yang, S.: Biogeochemical variability in the California Current System, Prog. Oceanogr., 196, 102565, https://doi.org/10.1016/j.pocean.2021.102565, 2021.
Di Lorenzo, E. and Mantua, N.: Multi-year persistence of the 2014/15 North Pacific marine heatwave, Nat. Clim. Change, 6, 1042–1047, https://doi.org/10.1038/nclimate3082, 2016.
Ducklow, H., Cimino, M., Dunton, K. H., Fraser, W. R., Hopcroft, R. R., Ji, R., Miller, A. J., Ohman, M. D., and Sosik, H. M.: Marine Pelagic Ecosystem Responses to Climate Variability and Change, BioScience, 72, 827–850, https://doi.org/10.1093/biosci/biac050, 2022.
Enright, A. J., Van Dongen, S., and Ouzounis, C. A.: An efficient algorithm for large-scale detection of protein families, Nucleic Acids Res., 30, 1575–1584, https://doi.org/10.1093/nar/30.7.1575, 2002.
Eppley, R. W.: Chlorophyll, photosynthesis and new production in the Southern California Bight, Prog. Oceanogr., 30, 117–150, https://doi.org/10.1016/0079-6611(92)90010-W, 1992.
Fitzwater, S. E., Knauer, G. A., and Martin, J. H.: Metal contamination and its effect on primary production measurements, Limnol. Oceanogr., 27, 544–551, https://doi.org/10.4319/lo.1982.27.3.0544, 1982.
Gloor, G. B., Macklaim, J. M., Pawlowsky-Glahn, V., and Egozcue, J. J.: Microbiome datasets are compositional: and this is not optional, Front Microbiol, 8, 2224, https://doi.org/10.3389/fmicb.2017.02224, 2017.
Goebel, N., Edwards, C., Zehr, J., Follows, M., and Morgan, S.: Modeled phytoplankton diversity and productivity in the California Current System, Ecol. Model., 264, 37–47, 2013.
Goericke, R.: The structure of marine phytoplankton communities-patterns, rules, and mechanisms, California Cooperative Oceanic Fisheries Investigations Report, 52, 182–197, 2011.
Gordon, L. I., Jennings Jr, J. C., Ross, A. A., and Krest, J. M.: A suggested protocol for continuous flow automated analysis of seawater nutrients (phosphate, nitrate, nitrite and silicic acid) in the WOCE Hydrographic Program and the Joint Global Ocean Fluxes Study. WOCE hydrographic program office, methods manual WHPO, (68/91), 1–52 pp., 1993.
Guérin, N., Ciccarella, M., Flamant, E., Frémont, P., Mangenot, S., Istace, B., Noel, B., Belser, C., Bertrand, L., Labadie, K., Cruaud, C., Romac, S., Bachy, C., Gachenot, M., Pelletier, E., Alberti, A., Jaillon, O., Wincker, P., Aury, J.-M., and Carradec, Q.: Genomic adaptation of the picoeukaryote Pelagomonas calceolata to iron-poor oceans revealed by a chromosome-scale genome sequence, Commun. Biol., 5, 983, https://doi.org/10.1038/s42003-022-03939-z, 2022.
Guidi, L., Chaffron, S., Bittner, L., Eveillard, D., Larhlimi, A., Roux, S., Darzi, Y., Audic, S., Berline, L., Brum, J. R., Coelho, L. P., Espinoza, J. C. I., Malviya, S., Sunagawa, S., Dimier, C., Kandels-Lewis, S., Picheral, M., Poulain, J., Searson, S., Stemmann, L., Not, F., Hingamp, P., Speich, S., Follows, M., Karp-Boss, L., Boss, E., Ogata, H., Pesant, S., Weissenbach, J., Wincker, P., Acinas, S. G., Bork, P., de Vargas, C., Iudicone, D., Sullivan, M. B., Raes, J., Karsenti, E., Bowler, C., Gorsky, G., and Tara Oceans Consortium, C.: Plankton networks driving carbon export in the oligotrophic ocean, Nature, 532, 465–470, https://doi.org/10.1038/nature16942, 2016.
Guillou, L., Viprey, M., Chambouvet, A., Welsh, R. M., Kirkham, A. R., Massana, R., Scanlan, D. J., and Worden, A. Z.: Widespread occurrence and genetic diversity of marine parasitoids belonging to Syndiniales (Alveolata), Environ. Microbiol., 10, 3349–3365, https://doi.org/10.1111/j.1462-2920.2008.01731.x, 2008.
Guillou, L., Bachar, D., Audic, S., Bass, D., Berney, C., Bittner, L., Boutte, C., Burgaud, G., de Vargas, C., Decelle, J., del Campo, J., Dolan, J. R., Dunthorn, M., Edvardsen, B., Holzmann, M., Kooistra, W. H. C. F., Lara, E., Le Bescot, N., Logares, R., Mahé, F., Massana, R., Montresor, M., Morard, R., Not, F., Pawlowski, J., Probert, I., Sauvadet, A.-L., Siano, R., Stoeck, T., Vaulot, D., Zimmermann, P., and Christen, R.: The Protist Ribosomal Reference database (PR2): a catalog of unicellular eukaryote Small Sub-Unit rRNA sequences with curated taxonomy, Nucleic Acids Res., 41, D597–D604, https://doi.org/10.1093/nar/gks1160, 2012.
Hayward, A., Pinkerton, M. H., and Gutierrez-Rodriguez, A.: phytoclass: A pigment-based chemotaxonomic method to determine the biomass of phytoplankton classes, Limnol. Oceanogr.-Meth., 21, 220–241, https://doi.org/10.1002/lom3.10541, 2023.
Henriksen, P., Riemann, B., Kaas, H., Sørensen, H. M., and Sørensen, H. L.: Effects of nutrient-limitation and irradiance on marine phytoplankton pigments, J. Plankton Res., 24, 835–858, https://doi.org/10.1093/plankt/24.9.835, 2002.
Henson, S. A., Cael, B. B., Allen, S. R., and Dutkiewicz, S.: Future phytoplankton diversity in a changing climate, Nat. Commun., 12, 5372, https://doi.org/10.1038/s41467-021-25699-w, 2021.
Hooker, S. B.: The second SeaWiFS HPLC analysis round-robin experiment (SeaHARRE-2), National Aeronautics and Space Administration, Goddard Space Flight Center, 2005.
Huang, Y., Nicholson, D., Huang, B., and Cassar, N.: Global Estimates of Marine Gross Primary Production Based on Machine Learning Upscaling of Field Observations, Global Biogeochem. Cy., 35, e2020GB006718, https://doi.org/10.1029/2020GB006718, 2021.
Ibarbalz, F. M., Henry, N., Brandão, M. C., Martini, S., Busseni, G., Byrne, H., Coelho, L. P., Endo, H., Gasol, J. M., Gregory, A. C., Mahé, F., Rigonato, J., Royo-Llonch, M., Salazar, G., Sanz-Sáez, I., Scalco, E., Soviadan, D., Zayed, A. A., Zingone, A., Labadie, K., Ferland, J., Marec, C., Kandels, S., Picheral, M., Dimier, C., Poulain, J., Pisarev, S., Carmichael, M., Pesant, S., Acinas, S. G., Babin, M., Bork, P., Boss, E., Bowler, C., Cochrane, G., de Vargas, C., Follows, M., Gorsky, G., Grimsley, N., Guidi, L., Hingamp, P., Iudicone, D., Jaillon, O., Kandels, S., Karp-Boss, L., Karsenti, E., Not, F., Ogata, H., Pesant, S., Poulton, N., Raes, J., Sardet, C., Speich, S., Stemmann, L., Sullivan, M. B., Sunagawa, S., Wincker, P., Babin, M., Boss, E., Iudicone, D., Jaillon, O., Acinas, S. G., Ogata, H., Pelletier, E., Stemmann, L., Sullivan, M. B., Sunagawa, S., Bopp, L., de Vargas, C., Karp-Boss, L., Wincker, P., Lombard, F., Bowler, C., and Zinger, L.: Global Trends in Marine Plankton Diversity across Kingdoms of Life, Cell, 179, 1084–1097 https://doi.org/10.1016/j.cell.2019.10.008, 2019.
Irigoien, X., Huisman, J., and Harris, R. P.: Global biodiversity patterns of marine phytoplankton and zooplankton, Nature, 429, 863–867, https://doi.org/10.1038/nature02593, 2004.
Jacox, M. G., Alexander, M. A., Mantua, N. J., Scott, J. D., Hervieux, G., Webb, R. S., and Werner, F. E.: Forcing of multi-year extreme ocean temperatures that impacted California Current living marine resources in 2016, Bull. Amer. Meteor. Soc., 99, S27–S33, https://doi.org/10.1175/BAMS-D-17-0119.1, 2018.
James, C. C., Barton, A. D., Allen, L. Z., Lampe, R. H., Rabines, A., Schulberg, A., Zheng, H., Goericke, R., Goodwin, K. D., and Allen, A. E.: Influence of nutrient supply on plankton microbiome biodiversity and distribution in a coastal upwelling region, Nat. Commun., 13, 2448, https://doi.org/10.1038/s41467-022-30139-4, 2022.
Jeffrey, S. W., Wright, S. W., and Zapata, M.: Microalgal classes and their signature pigments, in: Phytoplankton Pigments: Characterization, Chemotaxonomy and Applications in Oceanography, edited by: Roy, S., Llewellyn, C. A., Egeland, E. S., and Johnsen, G., Cambridge Environmental Chemistry Series, Cambridge University Press, Cambridge, 3–77, https://doi.org/10.1017/CBO9780511732263.004, 2011.
Jones-Kellett, A. E., McNichol, J. C., Raut, Y., Cain, K. R., Ribalet, F., Armbrust, E. V., Follows, M. J., and Fuhrman, J. A.: Amplicon sequencing with internal standards yields accurate picocyanobacteria cell abundances as validated with flow cytometry, ISME Commun., 4, https://doi.org/10.1093/ismeco/ycae115, 2024.
Kahru, M., Anderson, C., Barton, A. D., Carter, M. L., Catlett, D., Send, U., Sosik, H. M., Weiss, E. L., and Mitchell, B. G.: Satellite detection of dinoflagellate blooms off California by UV reflectance ratios, Elementa: Sci. Anthropocene, 9, https://doi.org/10.1525/elementa.2020.00157, 2021.
Kamikawa, R., Tanifuji, G., Kawachi, M., Miyashita, H., Hashimoto, T., and Inagaki, Y.: Plastid Genome-Based Phylogeny Pinpointed the Origin of the Green-Colored Plastid in the Dinoflagellate Lepidodinium chlorophorum, Genome Biol. Evol., 7, 1133–1140, https://doi.org/10.1093/gbe/evv060, 2015.
Kanehisa, M., Furumichi, M., Tanabe, M., Sato, Y., and Morishima, K.: KEGG: new perspectives on genomes, pathways, diseases and drugs, Nucleic Acids Res., 45, D353–D361, https://doi.org/10.1093/nar/gkw1092, 2017.
Kemp, A. E. S. and Villareal, T. A.: The case of the diatoms and the muddled mandalas: Time to recognize diatom adaptations to stratified waters, Prog. Oceanogr., 167, 138–149, https://doi.org/10.1016/j.pocean.2018.08.002, 2018.
Koppelle, S., López-Escardó, D., Brussaard, C. P. D., Huisman, J., Philippart, C. J. M., Massana, R., and Wilken, S.: Mixotrophy in the bloom-forming genus Phaeocystis and other haptophytes, Harmful Algae, 117, 102292, https://doi.org/10.1016/j.hal.2022.102292, 2022.
Kramer, S. J. and Siegel, D. A.: How Can Phytoplankton Pigments Be Best Used to Characterize Surface Ocean Phytoplankton Groups for Ocean Color Remote Sensing Algorithms?, J. Geophys. Res.-Oceans, 124, 7557–7574, https://doi.org/10.1029/2019JC015604, 2019.
Kramer, S. J., Siegel, D. A., Maritorena, S., and Catlett, D.: Modeling surface ocean phytoplankton pigments from hyperspectral remote sensing reflectance on global scales, Remote Sens Environ, 270, 112879, https://doi.org/10.1016/j.rse.2021.112879, 2022.
Kramer, S. J., Bolaños, L. M., Catlett, D., Chase, A. P., Behrenfeld, M. J., Boss, E. S., Crockford, E. T., Giovannoni, S. J., Graff, J. R., Haëntjens, N., Karp-Boss, L., Peacock, E. E., Roesler, C. S., Sosik, H. M., and Siegel, D. A.: Toward a synthesis of phytoplankton community composition methods for global-scale application, Limnol. Oceanogr.-Meth., 22, 217–240, https://doi.org/10.1002/lom3.10602, 2024.
Kramer, S. J., Jones, E. L., Estapa, M. L., Paul, N. L., Rynearson, T. A., Santoro, A. E., Sudek, S., and Durkin, C. A.: Sinking particles exporting diatoms and Hacrobia predict the magnitude of oceanic POC flux, ISME J., 19, wraf105, https://doi.org/10.1093/ismejo/wraf105, 2025.
Krinos, A. I., Brisbin, M., Hu, S. K., Cohen, N. R., Rynearson, T. A., Follows, M. J., Schulz, F., and Alexander, H.: Missing microbial eukaryotes and misleading meta-omic conclusions, Nat. Commun., 15, 9873, https://doi.org/10.1038/s41467-024-52212-w, 2024.
Kwiatkowski, L., Torres, O., Bopp, L., Aumont, O., Chamberlain, M., Christian, J. R., Dunne, J. P., Gehlen, M., Ilyina, T., John, J. G., Lenton, A., Li, H., Lovenduski, N. S., Orr, J. C., Palmieri, J., Santana-Falcón, Y., Schwinger, J., Séférian, R., Stock, C. A., Tagliabue, A., Takano, Y., Tjiputra, J., Toyama, K., Tsujino, H., Watanabe, M., Yamamoto, A., Yool, A., and Ziehn, T.: Twenty-first century ocean warming, acidification, deoxygenation, and upper-ocean nutrient and primary production decline from CMIP6 model projections, Biogeosciences, 17, 3439–3470, https://doi.org/10.5194/bg-17-3439-2020, 2020.
Landry, M. R., Brown, S. L., Neveux, J., Dupouy, C., Blanchot, J., Christensen, S., and Bidigare, R. R.: Phytoplankton growth and microzooplankton grazing in high-nutrient, low-chlorophyll waters of the equatorial Pacific: Community and taxon-specific rate assessments from pigment and flow cytometric analyses, J. Geophys. Res.-Oceans, 108, https://doi.org/10.1029/2000JC000744, 2003.
Lewitus, A. J., Horner, R. A., Caron, D. A., Garcia-Mendoza, E., Hickey, B. M., Hunter, M., Huppert, D. D., Kudela, R. M., Langlois, G. W., Largier, J. L., Lessard, E. J., RaLonde, R., Jack Rensel, J. E., Strutton, P. G., Trainer, V. L., and Tweddle, J. F.: Harmful algal blooms along the North American west coast region: History, trends, causes, and impacts, Harmful Algae, 19, 133–159, https://doi.org/10.1016/j.hal.2012.06.009, 2012.
Li, B., Ruotti, V., Stewart, R. M., Thomson, J. A., and Dewey, C. N.: RNA-Seq gene expression estimation with read mapping uncertainty, Bioinformatics, 26, 493–500, https://doi.org/10.1093/bioinformatics/btp692, 2009.
Li, W. K. W.: Macroecological patterns of phytoplankton in the northwestern North Atlantic Ocean, Nature, 419, 154–157, https://doi.org/10.1038/nature00994, 2002.
Lim, H. C., Tan, S. N., Teng, S. T., Lundholm, N., Orive, E., David, H., Quijano-Scheggia, S., Leong, S. C. Y., Wolf, M., Bates, S. S., Lim, P. T., and Leaw, C. P.: Phylogeny and species delineation in the marine diatom Pseudo-nitzschia (Bacillariophyta) using cox1, LSU, and ITS2 rRNA genes: A perspective in character evolution, J. Phycol., 54, 234–248, https://doi.org/10.1111/jpy.12620, 2018.
Lin, H., Kuzminov, F. I., Park, J., Lee, S., Falkowski, P. G., and Gorbunov, M. Y.: The fate of photons absorbed by phytoplankton in the global ocean, Science, 351, 264–267, https://doi.org/10.1126/science.aab2213, 2016.
Lin, Y., Gifford, S., Ducklow, H., Schofield, O., and Cassar, N.: Towards Quantitative Microbiome Community Profiling Using Internal Standards, Appl. Enviro. Microbiol., 85, e02634–02618, https://doi.org/10.1128/aem.02634-18, 2019.
Lopes dos Santos, A., Gourvil, P., Tragin, M., Noël, M.-H., Decelle, J., Romac, S., and Vaulot, D.: Diversity and oceanic distribution of prasinophytes clade VII, the dominant group of green algae in oceanic waters, ISME J., 11, 512–528, https://doi.org/10.1038/ismej.2016.120, 2017.
Lopes dos Santos, A., Gérikas Ribeiro, C., Ong, D., Garczarek, L., Shi, X. L., Nodder, S. D., Vaulot, D., and Gutiérrez-Rodríguez, A.: Chapter 11 – Phytoplankton diversity and ecology through the lens of high throughput sequencing technologies, in: Advances in Phytoplankton Ecology, edited by: Clementson, L. A., Eriksen, R. S., and Willis, A., Elsevier, 353–413, https://doi.org/10.1016/B978-0-12-822861-6.00020-0, 2022.
Lund, S.: California Current temperatures adjacent to Southern California: 1949–2020, Quaternary International, 705, 104–108, https://doi.org/10.1016/j.quaint.2024.07.004, 2024.
Ma, Z. S.: Measuring microbiome diversity and similarity with Hill numbers, in: Metagenomics, Elsevier, 157–178, https://doi.org/10.1016/B978-0-08-102268-9.00008-2, 2018.
Mackey, M., Mackey, D., Higgins, H., and Wright, S.: CHEMTAX-a program for estimating class abundances from chemical markers: application to HPLC measurements of phytoplankton, Mar. Ecol. Prog. Ser., 144, 265–283, 1996.
Margalef, R.: Life-forms of phytoplankton as survival alternatives in an unstable environment, Oceanol. Acta, 1, 493–509, 1978.
Martin, J. L., Santi, I., Pitta, P., John, U., and Gypens, N.: Towards quantitative metabarcoding of eukaryotic plankton: an approach to improve 18S rRNA gene copy number bias, Metabarcoding Metagenomics, 6, https://doi.org/10.3897/mbmg.6.85794, 2022.
Martin, M.: Cutadapt removes adapter sequences from high-throughput sequencing reads, EMBnet Journal, 17, 10–12, 2011.
McCain, J. S. P., Britten, G. L., Hackett, S. R., Follows, M. J., and Li, G.-W.: Microbial reaction rate estimation using proteins and proteomes, ISME J., wraf018, https://doi.org/10.1093/ismejo/wraf018, 2025.
Mendes, C. R. B., Tavano, V. M., Dotto, T. S., Kerr, R., De Souza, M. S., Garcia, C. A. E., and Secchi, E. R.: New insights on the dominance of cryptophytes in Antarctic coastal waters: a case study in Gerlache Strait, Deep-Sea Res. Pt. II, 149, 161–170, 2018.
Monger, B. C. and Landry, M. R.: Flow Cytometric Analysis of Marine Bacteria with Hoechst 33342, Appl. Enviro. Microbiol., 59, 905–911, https://doi.org/10.1128/aem.59.3.905-911.1993, 1993.
Moran, M. A., Satinsky, B., Gifford, S. M., Luo, H., Rivers, A., Chan, L.-K., Meng, J., Durham, B. P., Shen, C., Varaljay, V. A., Smith, C. B., Yager, P. L., and Hopkinson, B. M.: Sizing up metatranscriptomics, ISME J., 7, 237–243, https://doi.org/10.1038/ismej.2012.94, 2012.
Nayar, S. and Chou, L. M.: Relative efficiencies of different filters in retaining phytoplankton for pigment and productivity studies, Estuar. Coast. Shelf. Sci., 58, 241–248, https://doi.org/10.1016/S0272-7714(03)00075-1, 2003.
Neeley, A. R., Lomas, M. W., Mannino, A., Thomas, C., and Vandermeulen, R.: Impact of Growth Phase, Pigment Adaptation, and Climate Change Conditions on the Cellular Pigment and Carbon Content of Fifty-One Phytoplankton Isolates, J. Phycol., 58, 669–690, https://doi.org/10.1111/jpy.13279, 2022.
Not, F., Siano, R., Kooistra, W. H. C. F., Simon, N., Vaulot, D., and Probert, I.: Chapter One – Diversity and Ecology of Eukaryotic Marine Phytoplankton, in: Advances in Botanical Research, edited by: Piganeau, G., Academic Press, 1–53, https://doi.org/10.1016/B978-0-12-391499-6.00001-3, 2012.
Novák Vanclová, A. M. and Dorrell, R. G.: Complex plastids across the eukaryotes: an overview of inherited and convergently evolved characters, Endosymbiotic Organelle Acquisition: Solutions to the Problem of Protein Localization and Membrane Passage, 39–88, https://doi.org/10.1007/978-3-031-57446-7_2, 2024.
Parada, A. E., Needham, D. M., and Fuhrman, J. A.: Every base matters: assessing small subunit rRNA primers for marine microbiomes with mock communities, time series and global field samples, Environ. Microbiol., 18, 1403–1414, https://doi.org/10.1111/1462-2920.13023, 2016.
Partensky, F., Hess, W. R., and Vaulot, D.: Prochlorococcus, a Marine Photosynthetic Prokaryote of Global Significance, Microbiol. Mol. Biol. Rev., 63, 106–127, https://doi.org/10.1128/mmbr.63.1.106-127.1999, 1999.
Pedregosa, F., Varoquaux, G., Gramfort, A., Michel, V., Thirion, B., Grisel, O., Blondel, M., Prettenhofer, P., Weiss, R., and Dubourg, V.: Scikit-learn: Machine learning in Python, J. Mach. Learn. Res., 12, 2825–2830, 2011.
Pierella Karlusich, J. J., Ibarbalz, F. M., and Bowler, C.: Phytoplankton in the Tara Ocean, Annu. Rev. Mar. Sci., 12, 233–265, https://doi.org/10.1146/annurev-marine-010419-010706, 2020.
Podell, S. and Gaasterland, T.: DarkHorse: a method for genome-wide prediction of horizontal gene transfer, Genome Biol, 8, R16, https://doi.org/10.1186/gb-2007-8-2-r16, 2007.
Pruesse, E., Quast, C., Knittel, K., Fuchs, B. M., Ludwig, W., Peplies, J., and Glöckner, F. O.: SILVA: a comprehensive online resource for quality checked and aligned ribosomal RNA sequence data compatible with ARB, Nucleic Acids Res., 35, 7188–7196, https://doi.org/10.1093/nar/gkm864, 2007.
Raven, J.: The twelfth Tansley Lecture. Small is beautiful: the picophytoplankton, Funct. Ecol., 12, 503–513, 1998.
Rho, M., Tang, H., and Ye, Y.: FragGeneScan: predicting genes in short and error-prone reads, Nucleic Acids Res., 38, e191, https://doi.org/10.1093/nar/gkq747, 2010.
Richardson, T. L.: The colorful world of cryptophyte phycobiliproteins, J. Plankton Res., 44, 806–818, 2022.
Roberts, M. E., Bhatia, M. P., Rowland, E., White, P. L., Waterman, S., Cavaco, M. A., Williams, P., Young, J. N., Spence, J. S., Tremblay, J.-É., Montero-Serrano, J.-C., and Bertrand, E. M.: Rubisco in high Arctic tidewater glacier-marine systems: A new window into phytoplankton dynamics, Limnol. Oceanogr., 69, 802–817, https://doi.org/10.1002/lno.12525, 2024.
Rost, B. and Riebesell, U.: Coccolithophores and the biological pump: responses to environmental changes, in: Coccolithophores: from molecular processes to global impact, Springer, 99–125, https://doi.org/10.1007/978-3-662-06278-4_5, 2004.
Ryan-Keogh, T. J., Thomalla, S. J., Monteiro, P. M. S., and Tagliabue, A.: Multidecadal trend of increasing iron stress in Southern Ocean phytoplankton, Science, 379, 834–840, https://doi.org/10.1126/science.abl5237, 2023.
Saito, M. A., McIlvin, M. R., Moran, D. M., Santoro, A. E., Dupont, C. L., Rafter, P. A., Saunders, J. K., Kaul, D., Lamborg, C. H., and Westley, M.: Abundant nitrite-oxidizing metalloenzymes in the mesopelagic zone of the tropical Pacific Ocean, Nat. Geosci., 13, 355–362, 2020.
Saito, M. A., Alexander, H., Benway, H. M., Boyd, P. W., Gledhill, M., Kujawinski, E. B., Levine, N. M., Maheigan, M., Marchetti, A., Obernosterer, I., Santoro, A. E., Shi, D., Suzuki, K., Tagliabue, A., Twining, B. S., and Maldonado, M. T.: The Dawn of the BioGeoSCAPES Program: Ocean Metabolism and Nutrient Cycles on a Changing Planet, Oceanography, 37, 162–166, 2024.
Sathyendranath, S., Brewin, R. J. W., Ciavatta, S., Jackson, T., Kulk, G., Jönsson, B., Vicente, V. M., and Platt, T.: Ocean Biology Studied from Space, Surveys in Geophysics, 44, 1287–1308, https://doi.org/10.1007/s10712-023-09805-9, 2023.
Satterthwaite, E. V., Allen, A. E., Lampe, R. H., Gold, Z., Thompson, A. R., Bowlin, N., Swalethorp, R., Goodwin, K. D., Hazen, E. L., and Bograd, S. J.: Toward identifying the critical ecological habitat of larval fishes, Oceanography, 36, 90–93, 2023.
Schmieder, R., Lim, Y. W., and Edwards, R.: Identification and removal of ribosomal RNA sequences from metatranscriptomes, Bioinformatics, 28, 433–435, https://doi.org/10.1093/bioinformatics/btr669, 2011.
Smith, V. H.: Microbial diversity–productivity relationships in aquatic ecosystems, FEMS Microbiol. Ecol., 62, 181–186, https://doi.org/10.1111/j.1574-6941.2007.00381.x, 2007.
Smith Jr., W. O. and Trimborn, S.: Phaeocystis: A global enigma, Annu. Rev. Mar. Sci., 16, 417–441, https://doi.org/10.1146/annurev-marine-022223-025031, 2023.
Stoecker, D. K., Hansen, P. J., Caron, D. A., and Mitra, A.: Mixotrophy in the marine plankton, Annu. Rev. Mar. Sci., 9, 311–335, 2017.
Strzepek, R. F., Nunn, B. L., Bach, L. T., Berges, J. A., Young, E. B., and Boyd, P. W.: The ongoing need for rates: can physiology and omics come together to co-design the measurements needed to understand complex ocean biogeochemistry?, J. Plankton Res., 44, 485–495, https://doi.org/10.1093/plankt/fbac026, 2022.
Tagliabue, A.: “Oceans are hugely complex”: modelling marine microbes is key to climate forecasts, Nature, 623, 250–252, 2023.
Taylor, A. G. and Landry, M. R.: Phytoplankton biomass and size structure across trophic gradients in the southern California Current and adjacent ocean ecosystems, Mar. Ecol. Prog. Ser., 592, 1–17, 2018.
Ternon, E., Carter, M. L., Cancelada, L., Lampe, R. H., Allen, A. E., Anderson, C. R., Prather, K. A., and Gerwick, W. H.: Yessotoxin production and aerosolization during the unprecedented red tide of 2020 in southern California, Elementa: Sci. Anthropocene, 11, 00021, https://doi.org/10.1525/elementa.2023.00021, 2023.
Ting, C. S., Hsieh, C., Sundararaman, S., Mannella, C., and Marko, M.: Cryo-Electron Tomography Reveals the Comparative Three-Dimensional Architecture of Prochlorococcus, a Globally Important Marine Cyanobacterium, J. Bacteriol., 189, 4485–4493, https://doi.org/10.1128/jb.01948-06, 2007.
Trainer, V. L., Pitcher, G., Reguera, B., and Smayda, T.: The distribution and impacts of harmful algal bloom species in eastern boundary upwelling systems, Prog. Oceanogr., 85, 33–52, 2010.
Vallina, S. M., Follows, M. J., Dutkiewicz, S., Montoya, J. M., Cermeno, P., and Loreau, M.: Global relationship between phytoplankton diversity and productivity in the ocean, Nat. Commun., 5, 4299, https://doi.org/10.1038/ncomms5299, 2014.
Van Heukelem, L. and Thomas, C. S.: Computer-assisted high-performance liquid chromatography method development with applications to the isolation and analysis of phytoplankton pigments, J. Chromatogr. A, 910, 31–49, 2001.
Venrick, E.: Spring in the California Current: the distribution of phytoplankton species, April 1993 and April 1995, Mar. Ecol. Prog. Ser., 167, 73–88, 1998.
Venrick, E.: Floral patterns in the California Current System off southern California: 1990–1996, J. Mar. Res., 60, 171–189, 2002.
Venrick, E. L.: Phytoplankton in the California Current system off southern California: Changes in a changing environment, Prog. Oceanogr., 104, 46–58, https://doi.org/10.1016/j.pocean.2012.05.005, 2012.
Wang, J.-X., Kong, F.-Z., Geng, H.-X., Zhao, Y., Guan, W.-B., He, C., Kang, Z.-J., Guo, W., Zhou, Z.-X., Zhang, Q.-C., and Yu, R.-C.: Pigment Characterization of the Giant-Colony-Forming Haptophyte Phaeocystis globosa in the Beibu Gulf Reveals Blooms of Different Origins, Appl. Enviro. Microbiol., 88, e01654–01621, https://doi.org/10.1128/aem.01654-21, 2022.
Wood, S. N.: Generalized additive models: an introduction with R, Chapman and hall/CRC, https://doi.org/10.1201/9781315370279, 2017.
Worden, A. Z., Janouskovec, J., McRose, D., Engman, A., Welsh, R. M., Malfatti, S., Tringe, S. G., and Keeling, P. J.: Global distribution of a wild alga revealed by targeted metagenomics, Curr. Biol., 22, R675–R677, https://doi.org/10.1016/j.cub.2012.07.054, 2012.
Yeh, Y.-C., McNichol, J., Needham, D. M., Fichot, E. B., Berdjeb, L., and Fuhrman, J. A.: Comprehensive single-PCR 16S and 18S rRNA community analysis validated with mock communities, and estimation of sequencing bias against 18S, Environ. Microbiol., 23, 3240–3250, https://doi.org/10.1111/1462-2920.15553, 2021.
Zapata, M., Jeffrey, S. W., Wright, S. W., Rodríguez, F., Garrido, J. L., and Clementson, L.: Photosynthetic pigments in 37 species (65 strains) of Haptophyta: implications for oceanography and chemotaxonomy, Mar. Ecol. Prog. Ser., 270, 83–102, 2004.
Zapata, M., Fraga, S., Rodríguez, F., and Garrido, J. L.: Pigment-based chloroplast types in dinoflagellates, Mar. Ecol. Prog. Ser., 465, 33–52, 2012.
Zehr, J. P. and Ward, B. B.: Nitrogen Cycling in the Ocean: New Perspectives on Processes and Paradigms, Applied and Environmental Microbiology, 68, 1015–1024, https://doi.org/10.1128/AEM.68.3.1015-1024.2002, 2002.
Zheng, B., Lucas, A. J., Franks, P. J. S., Schlosser, T. L., Anderson, C. R., Send, U., Davis, K., Barton, A. D., and Sosik, H. M.: Dinoflagellate vertical migration fuels an intense red tide, P. Natl. Acad. Sci. USA, 120, e2304590120, https://doi.org/10.1073/pnas.2304590120, 2023.
Zhu, F., Massana, R., Not, F., Marie, D., and Vaulot, D.: Mapping of picoeucaryotes in marine ecosystems with quantitative PCR of the 18S rRNA gene, FEMS Microbiol. Ecol., 52, 79–92, https://doi.org/10.1016/j.femsec.2004.10.006, 2005.