the Creative Commons Attribution 4.0 License.
the Creative Commons Attribution 4.0 License.
 | 12 Feb 2025
What controls planktic foraminiferal calcification?
Ruby Barrett
Joost de Vries
Daniela N. Schmidt
Planktic foraminifera are key producers of pelagic carbonate, and their shell weight is suggested to have been influenced by the environment in which they calcify. However, there is debate about the use of size-normalised weight (SNW) as a proxy, as some authors invoke a carbonate system control on calcification (and by extension SNW as a pCO2 proxy), while others suggest that species optimum conditions, nutrient concentration, or temperature drive shell weight. To better understand this proxy, we investigate what drives SNW and whether discrepancies in the proposed control on weight are due to differing data collection methodologies and/or regionally different drivers. We integrate new and published SNW data with environmental hindcast data from the CMIP6 modelling suite. Using Bayesian regression modelling, we find that the environment alone does not explain the variability in SNW across species. Although physiology likely modulates the response to the environment, we find little evidence of a unifying driver at the ecogroup level. Instead, we identify species-specific responses associated with drivers including (but not limited to) the carbonate system, which are likely different between ocean basins. We hypothesise that this is partly influenced by cryptic species and regional phenotypic plasticity in changes to shell weight that are not well understood, such as the thickness of calcite deposited during some species' reproductive phases. Consequently, which species to use as a pCO2 proxy or whether multiple species should be used in parallel to reduce uncertainty should be carefully considered. We strongly encourage the regional testing and calibration of pCO2–SNW relationships.
- Article
(2293 KB) - Full-text XML
-
Supplement
(8830 KB) - BibTeX
- EndNote


The unprecedented rise in CO2 and temperature is altering our oceans and impacting marine ecosystems and their functioning (such as marine biogeochemical cycles). In the case of planktic foraminifera (a calcifying zooplankton which lives in the surface ocean), ocean acidification, sea surface warming, and changing nutrient availability are all projected to impact their calcification (IPCC, 2022; Leung et al., 2022). Currently, these zooplankton contribute approximately one-quarter of modern pelagic carbonate production (Buitenhuis et al., 2019; Langer, 2008) and 23 %–56 % of total carbonate flux (Neukermans et al., 2023; Schiebel, 2002). The amount of carbonate produced by individual planktic foraminifers in the first order determines this flux to depth and is a function of their abundance, size, and weight (Barrett et al., 2023). While research generally agrees on what drives foraminiferal size (Schmidt et al., 2004; cf. Rillo et al., 2020) and abundance (Bé and Tolderlund, 1971), the controls on the size-normalised weight (SNW) of planktic foraminifers are debated (e.g. Aldridge et al., 2012; Barker and Elderfield, 2002; de Villiers, 2004; Lombard et al., 2010).
As well as resolving what controls SNW to understand how carbonate production could be impacted by environmental change, it is also important for the interpretation of SNW as a proxy for past ocean conditions – that is, whether SNW should be used to reconstruct carbonate saturation from bottom waters (Lohmann, 1995) and/or as proxy for surface ocean carbonate and, by extension, atmospheric pCO2 (Barker and Elderfield, 2002). The former stipulates that SNW records dissolution post-deposition rather than environmental conditions during life. The latter supports the opposite: that SNW is controlled by carbonate ion concentration [CO] and records changes in the environment during life and that the impact of post-depositional processes are minimal (Russell et al., 2004). If variables other than the carbonate system control SNW, the use of this proxy should be reassessed.
There is evidence of a carbonate system control on foraminiferal calcification, with some studies showing a positive relationship between SNW and [CO], pH, and calcite saturation (Ω) (Barker and Elderfield, 2002; Beer et al., 2010b; Bijma et al., 1999, 2002; Broecker and Clark, 2001; Davis et al., 2017; de Moel et al., 2009; Dong et al., 2022; Lombard et al., 2010; Manno et al., 2012; Moy et al., 2009; Russell et al., 2004; Weinkauf et al., 2013). However, this response is not uniform between or even within species, with some studies reporting no response to [CO] (Béjard et al., 2023; Gonzalez-Mora et al., 2008; Henehan et al., 2017; Mallo et al., 2017; Naik et al., 2011; Pak et al., 2018; Song et al., 2022; Weinkauf et al., 2016). Others suggest that different environmental parameters are the primary control on SNW, such as temperature (Marr et al., 2011; Pak et al., 2018; Qin et al., 2020; Song et al., 2022), nutrient concentration (Aldridge et al., 2012), optimum growth conditions (de Villiers, 2004), and seawater density (Zarkogiannis et al., 2019). Importantly, many studies identify multivariate environmental controls on foraminiferal calcification, such as surface ocean carbonate chemistry, temperature, productivity, nutrient availability, and salinity (Béjard et al., 2023; Mallo et al., 2017; Marshall et al., 2013; Pallacks et al., 2023; Weinkauf et al., 2016), which can be species-specific and vary between and within ocean basins.
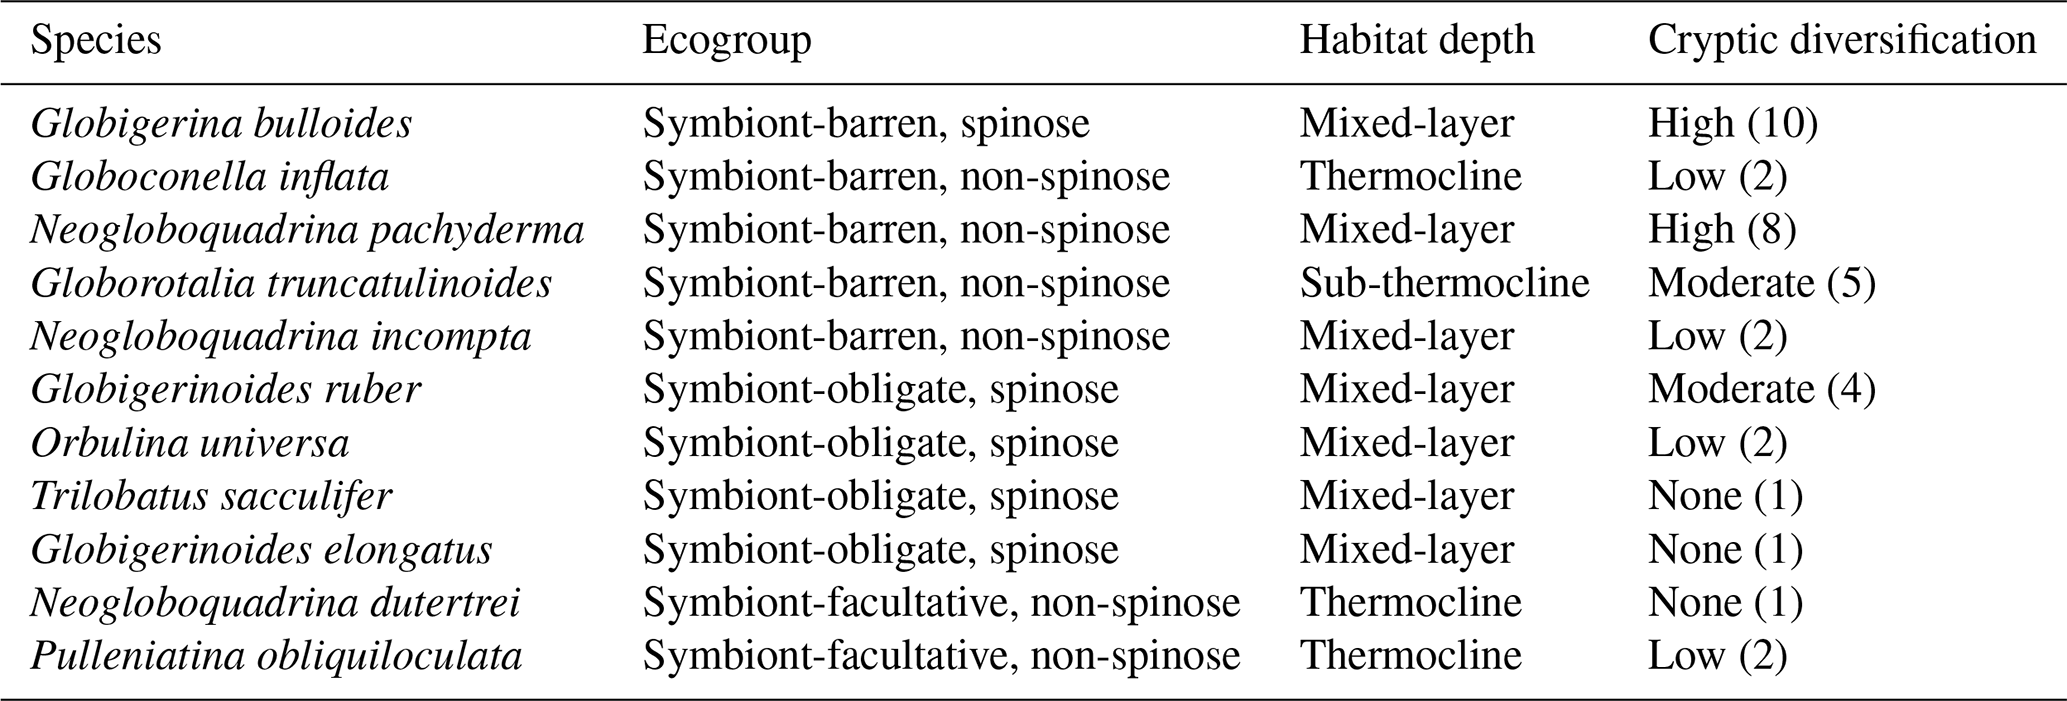
Physiology and ecological mechanisms, such as biogeography or symbiosis, may modulate the environmental response; hence different ecogroups (i.e. species grouped by their ecology that have functional traits such as spines in common; Table 1; Aze et al., 2011) may respond differently to the environment. For example, in symbiont-bearing species, the negative impact of low carbonate ion concentration could be reduced due to CO2 uptake by symbionts in the foraminifer's microenvironment (Jørgensen et al., 1985; Köhler-Rink and Kühl, 2005; Rink et al., 1998). Species with spines may capture food better than non-spinose species (Gaskell et al., 2019; Spindler et al., 1984), providing energy for metabolic processes that support calcification.
SNW could additionally be variable between species due to potential differences in biomineralisation pathways. Models suggest different biological controls, such as the intracellular storage of inorganic carbon and calcium ions (Erez, 2003), pH regulation (Lastam et al., 2023; de Nooijer et al., 2009; Toyofuku et al., 2017), and active transport of calcium and/or magnesium pumping (Bentov and Erez, 2006; Nehrke et al., 2013). These different pathways could have different sensitivities to environmental change. Furthermore, SNW measurements taken at the morphospecies level (i.e. a species designated based on morphological features) could mask differences in the individual genotypes within cryptic species (i.e. organisms that look identical but represent distinct evolutionary lineages) if these have different environmental preferences (Darling et al., 2000; Morard et al., 2024).
Furthermore, the SNW response may vary spatially. For example, at higher latitudes, where carbonate saturation is close to undersaturation (Mikis et al., 2019), a foraminifera may be at its limit of tolerance and therefore more vulnerable to small changes in carbonate ion concentration than low-latitude dwellers, akin to observations of the responses of coralline algae species to temperature changes at the trailing and leading edges of their distribution (Kolzenburg et al., 2023).
Additionally, the wide range in methodology used to collect weight measurements could also complicate our understanding of what drives SNW. Results are generated either with a sieve-based weight (SBW) approach, in which planktic foraminifers are sieved through a narrow size fraction before the average specimen weight is taken, or through the measurement-based weight (MBW) approach, where the additional step of normalising to a measured size parameter (diameter or area) is taken (Eq. 1). MBW is a more rigorous approach, as the use of sieve fractions (SBW) can be unreliable due to size variability within the sieve fraction itself (Aldridge et al., 2012; Beer et al., 2010a; Béjard et al., 2023).
Finally, different sample collection methodologies (i.e. whether results are derived from culture, plankton tow, core-top, or sediment trap samples) could further complicate our understanding of what drives calcification. Some authors have analysed foraminiferal SNW from plankton tow samples (Aldridge et al., 2012; Beer et al., 2010b; Mallo et al., 2017). However, foraminifers living in the water column are likely juvenile and have not completed calcification, meaning that anomalously light tests could be measured in comparison to the same size class derived from sediments. The SNW of sediment trap or core-top samples could be impacted by dissolution as foraminifera fall through the water column; however, this can be largely accounted for if samples are derived from above the lysocline. Culture experiments are useful in circumventing these limitations, but they do not reflect real-world conditions, as many are grown in artificial seawater and the metadata collected are variable between publications, limiting the aggregation of studies.
Here, we apply Bayesian regression to statistically infer what drives SNW (measurement-based). We hypothesise that (1) the environment alone does not explain variability in foraminiferal SNW across species. Instead, (2) physiology modulates the foraminiferal SNW response to the environment; hence the SNW response will be similar within ecogroups. (3) Species-specific SNW sensitivities may overprint the ecogroup response.
To infer which environmental variables drive SNW across species (i.e. all foraminifers in this study pooled together) and at the ecogroup and species level, we conducted an exhaustive literature review, pre-processed our data to ensure data quality, and then statistically analysed our data using Bayesian regression modelling. Details for each step are provided below.
2.1 Compilation of planktic foraminiferal SNW data
This study gathers articles on foraminiferal SNW published until 31 October 2023, and includes 770 samples covering 11 species from seven published datasets and a new dataset (n=209; Fig. 1). The full article list is available in the Supplement (Sect. S1), where the new SNW data can also be found.
A literature search for planktic foraminiferal SNW was conducted on Google Scholar. Publications with the key words “planktic foraminifera”, “size-normalised weight”, “weight”, and “calcification” were included. The results were expanded by exploring citations of key papers and identifying additional studies from the reference list of review articles. Articles were initially screened considering title relevance, then abstract content, and finally full-text content.
Data were only included if SNW was normalised by the measurement-based weight (MBW) method as in Eq. (1) (Aldridge et al., 2012; Barker and Elderfield, 2002), using diameter or silhouette area (Béjard et al., 2023; Marshall et al., 2013). Because the count of foraminifera collected can be low in sediment traps, selecting narrow size classes was not always possible for this data type, as restricting sieve size would have resulted in a very small number of specimens. Data from plankton tows were removed from analysis, as these may contain juvenile foraminifers. Given typical sedimentation rates in the open ocean and bioturbation, core-top data were considered preindustrial (unless the publication stated otherwise). Core samples were considered preindustrial if dated between 1000 and 1900 AD, as CO2 remained fairly stable over the Holocene (IPCC, 2021). Globigerinoides ruber white and G. ruber pink are combined to increase sample size.
Additionally, we included our own unpublished SNW measurements, which significantly increased data coverage in high latitudes and the subtropical Atlantic (Fig. 1). For these new data, SNW measurements were collected from Atlantic core-tops and sediment cores for G. truncatulinoides, G. ruber, O. universa, N. pachyderma, N. incompta, and G. bulloides. The former three were analysed from a 300–355 µm sieve size fraction, G. bulloides was analysed from a 250–300 µm sieve size fraction, and the latter two were analysed from a 200–250 µm sieve size fraction. SNW data were collected through the measurement-based weight (MBW) approach (Eq. 1). Approximately 20–30 individuals were analysed per sample. Samples were weighed using a Mettler Toledo MT5 microbalance (error of ± 0.5 µg), and the mean weight was calculated. Size measurements were taken for each individual foraminifera test at 125× magnification using a Leica MZ12.5 microscope. Individual tests were aligned in the same orientation, and the longest axis of the test (Feret's diameter) was measured using Fiji (Schindelin et al., 2012). The average Feret's diameter was calculated for each sample and tests were size-normalised using Eq. (1).
For all data, samples were omitted if the dissolution of foraminifera specimens was reported or if the water depth was more than 4500 m, thereby approaching the carbonate compensation depth (CCD; Broecker and Clark, 2009). Due to sampling effort and preservation (i.e. the CCD being shallower in the Pacific), data are focused on the Atlantic, with only some Pacific data. Measurements span a wide latitudinal gradient (54° S to 78° N; Fig. 1). Planktic foraminifers were assigned to one of three ecogroups following Aze et al. (2011) (Table 1).
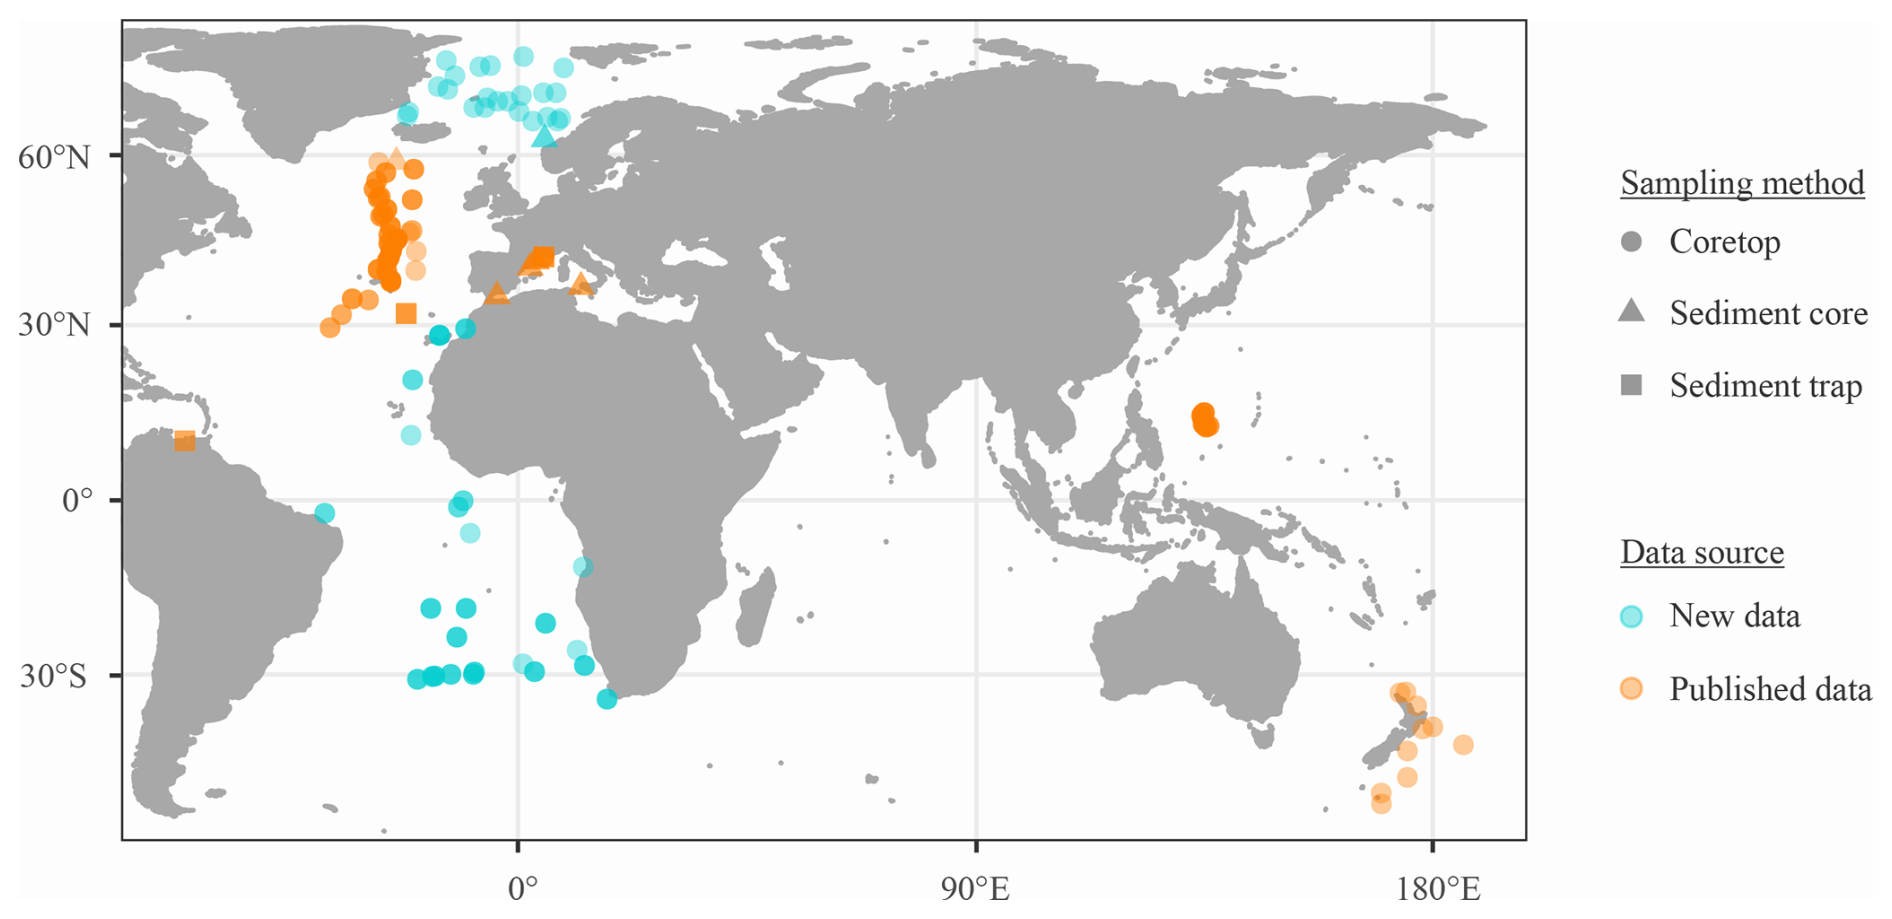
Figure 1Location of SNW data. See Fig. S1 for sample count per data type and Fig. S2 for a breakdown of species by location. nsamples=770.
Table 1Planktic foraminifera species and their features which determine their ecogroup (Aze et al., 2011). The numbers in brackets indicate the genotype counts from Morard et al. (2024).
2.2 CMIP6 data extraction: compilation of environmental data
For all SNW data, corresponding environmental data were extracted from models in the CMIP6 ensemble for the modern and preindustrial. Using environmental data from Earth system models (ESMs) rather than the environmental output reported in publications enables us to fill data gaps and ensure harmonisation of environmental data. Environmental data include 1°×1° gridded decadal averages for seawater temperature, phosphate concentration, nitrate concentration, salinity, chlorophyll a concentration, net primary productivity (NPP), alkalinity, CO, dissolved inorganic carbon (DIC), calcite Ω, and pH.
Although some species (e.g. G. truncatulinoides, G. inflata, N. dutertrei, P. obliquiloculata) in our analysis are considered deep-dwelling (i.e. live at the thermocline), we use surface ocean environmental data (≤ 20 m depth). This approach is in part due to the challenges of estimating exact habitat depth given its variability. Some of these challenges are listed below. (1) The habitat depth of a foraminifera changes through its lifetime; hence it would be difficult to determine the most suitable average depth. (2) Even if an average habitat depth were determined, there is uncertainty about how much calcification happens at which depth. (3) Thermocline depth, which is frequently used to describe habitats, is different in different parts of the ocean (Mulitza et al., 1997). (4) Habitat depth can vary with the seasons (Waterson et al., 2017). For further discussion and analysis of habitat depth, see Sect. S3. In future SNW analysis, we recommend that oxygen isotope values are measured on individual specimens and combined with SNW to calculate the exact habitat depth.
Carbonate system, salinity, and temperature data were derived from Jiang et al. (2023), in which 14 CMIP6 Earth system models (ESMs) were corrected for bias and model drift (see Table S1 and Jiang et al., 2023). Environmental data for the Mediterranean were not available from Jiang et al. (2023). For this region, sea surface temperature (SST), sea surface salinity (SSS), dissolved inorganic carbon (DIC), and total alkalinity (TA) were extracted from CESM2 (Danabasoglu et al., 2020) (Fig. S3), as the carbonate system output from CESM2 was closest to the median of the global average for the 14 ESMs (see Tables S4 and S5 in Jiang et al., 2023).
The CESM2 data used in this article were manipulated in the same way as those of other ESMs in Jiang et al. (2023). For consistency with other models, CESM2 outputs were converted from moles per cubic metre (mol m−3) to micromoles per kilogram (µmol kg −1) using a density function calculated from the Thermodynamic Equation of Seawater (TEOS-10; IOC et al., 2010; McDougall and Barker, 2011). Interannual variability was reduced by calculating a 10-year average for each decade. Model bias was removed by correcting to DIVA-gridded (Troupin et al., 2012) GLODAP (Lauvset et al., 2022) observational data, and model drift was removed using the relevant CESM2 preindustrial control (piControl). The adjusted SST, SSS, DIC, and TA were then used to calculate the rest of the OA indicators (CO, calcite Ω, and pH) using CO2System (van Heuven et al., 2011; Lewis and Wallace, 1998). Ice-core-based atmospheric CO2 data (Etheridge et al., 1996; MacFarling Meure et al., 2006) were used to approximate the oceanic fCO2 change from 1750 to 1850, thereby enabling estimation of the carbonate system for the preindustrial (1750), assuming that all locations are in equilibrium with the atmosphere (Takahashi et al., 2014).
Five Earth system models were used to extract phosphate concentration, nitrate concentration, chlorophyll a concentration, and net primary productivity (NPP) data to determine “optimum conditions” (Table S1; Fig. S4). NPP and chlorophyll are indicators of the algal biomass concentration, which is a large part of some foraminifera species' diets (Schiebel and Hemleben, 2017). Nutrient concentration is a step detached from this and represents the food available for their prey. Additionally, there is some evidence that phosphate can inhibit calcification in some other calcifiers (Demes et al., 2009; Kinsey and Davies, 1979; Lin and Singer, 2006; Paasche and Brubak, 1994). Decadal averages were calculated for these variables. For comparison to existing data and to improve data readability, phosphate and nitrate were converted from moles per cubic metre (mol m−3) to micromoles per kilogram (µmol kg −1), and chlorophyll a was converted from kilograms per cubic metre (kg m−3) to milligrams per cubic metre (mg m−3). These data were not corrected to observational data, as the data coverage is insufficient. The median of the non-corrected environmental outputs was calculated, and the preindustrial (1750) values were assumed to be the same as in 1850. Although species' abundance is also often used to inform optimum conditions, these data were not available for the same locations.
2.3 Statistical modelling
2.3.1 Data cleaning: addressing size fraction bias and collinearity in environmental data
All statistical analyses were carried out using R version 4.2.1 (R Core Team, 2018). To remove size fraction bias in SNW, the size fractions 250–300 and 300–350 were merged into one size fraction, and (unless stated otherwise) this was used. These size fractions were chosen because of their large sample number, because they are in the middle of the size range, and because they allow us to cover a wide environmental gradient (Fig. 2). This resulted in the statistical analysis of 491 samples covering seven species from four published datasets and our data (Sect. S1).
We included 4 of the initial 10 environmental parameters in the analysis: phosphate concentration, salinity, NPP, and CO. We were unable to analyse the impact of sea surface temperature due to collinearity, which would inflate the variance and standard error of coefficient estimates (Dormann et al., 2013). Nitrate was excluded, as phosphate and nitrate concentrations are highly correlated (ρ = 0.83, p=<0.000). We chose to keep phosphate, as it is more commonly assessed in the literature. Similarly, the carbonate system parameters are highly correlated (Fig. S5), but, as carbonate ion concentration is often used in the literature, we use this to represent the carbonate system. Because NPP is more directly linked with plankton biomass than chlorophyll a concentration, the former is analysed here. Due to this data cleaning, it is important to note that, while in the following we emphasise the parameter we analysed, the impacts on SNW could also be driven by the highly correlated driver.
2.3.2 Model specification
All models were fitted using the Bayesian regression model package, brms (Bürkner, 2017), which uses the probabilistic programming language Stan (Carpenter et al., 2017). The models were specified to be gamma-distributed and were fitted using the NUTS (Hoffman and Gelman, 2014) sampler with four chains and 2000 iterations, the first 1000 of which are a warmup to calibrate the sampler, thus leading to 4000 posterior samples.
All models were checked with appropriate tests before interpretation to ensure model assumptions were not violated. Variables were centred and standardised, and a QR decomposition term added to models to reduce the effect of correlation between variables. To check for any remaining collinearity, pairs plots were visually assessed and variance inflation factors (VIFs) were verified using the package “performance”, which passes the brms model to its frequentist counterpart. A VIF of 10 or less indicates that collinearity is not problematic (Marcoulides and Raykov, 2019; Table S3). For the species G. truncatulinoides, G. elongatus, and N. incompta, VIF values suggested collinearity was problematic. As such, we decompose the data into non-correlated factors using principal component analysis (PCA; see Sect. S2) and use these principal components instead of individual environmental drivers in the Bayesian models. For all Bayesian analysis, outliers were checked for using Pareto's k, for which a value of 0.7 or higher indicated an unduly influential observation. Visual posterior predictive checks were carried out to assess model fit and chain mixing (Fig. S6). An R-hat value close to 1 (i.e. less than 1.1) indicates the chains have converged (Bürkner, 2017). All models had an R-hat of 1.01 or 1 and a Pareto's k of less than 0.7.
2.3.3 Modelling: can the environment explain foraminiferal SNW across species?
To assess whether there is a universal driver and how much variability in SNW across all foraminifers can be explained by the environment, a “group-level” (i.e. foraminifera species pooled together; nsamples=491) Bayesian multi-level model was fitted (Bürkner, 2018). The full model included carbonate ion concentration (CO), salinity, phosphate concentration, and net primary productivity (NPP) as fixed environmental effects and species as a random effect (intercept only; Table S3). Data type (i.e. sediment trap, sediment core, and core-top) was added as a fixed effect, not a random effect, because data type had fewer than five levels (Harrison et al., 2018). Because the range of variance was unequal (“heteroscedastic”) between species (Fig. S7), we include the gamma distribution shape term in the model, which allows the variance between each species to vary.
The full model was compared to a “null” model that included fixed environmental effects and sampling method but did not consider species. Both models were compared using leave-one-out (LOO) cross-validation (Vehtari et al., 2017), a measure which informs which model is performing best. LOO indicated that adding species as a random effect improved model fit ( improved by 247.5±19.4; see details in results; Table S3). As such, we fit models for individual species to assess their association with the environment.
2.3.4 Modelling: is the SNW response to the environment similar between ecogroups or species-specific?
The size fraction restriction imposed for analysis of SNW across species (250–350 µm only) was relaxed (Sect. S1), as it is less relevant at the species level, which recognises the size ranges of taxa. Only sieve size fractions that are 50 µm in range were used (unless data were from sediment traps). Similar to the group-level (i.e. across species) model, data type was added as a fixed effect for each species-level model. Globoconella inflata, T. sacculifer, N. dutertrei, P. obliquiloculata, and O. universa were not modelled because of their low number of observations (n=<30). To remove the impact of collinearity for G. truncatulinoides, G.elongatus, and N. incompta, principal components (PCs) were used in place of the individual environmental variables (Sect. S2). Bayesian models were fitted to the remaining six species. To assess how much of the variability in foraminiferal SNW for different species can be explained by the environment and sampling method, the effect size and credible interval (i.e. Bayesian confidence interval) of coefficients (environmental variables) were extracted from each model.
3.1 Qualitative assessment of existing data
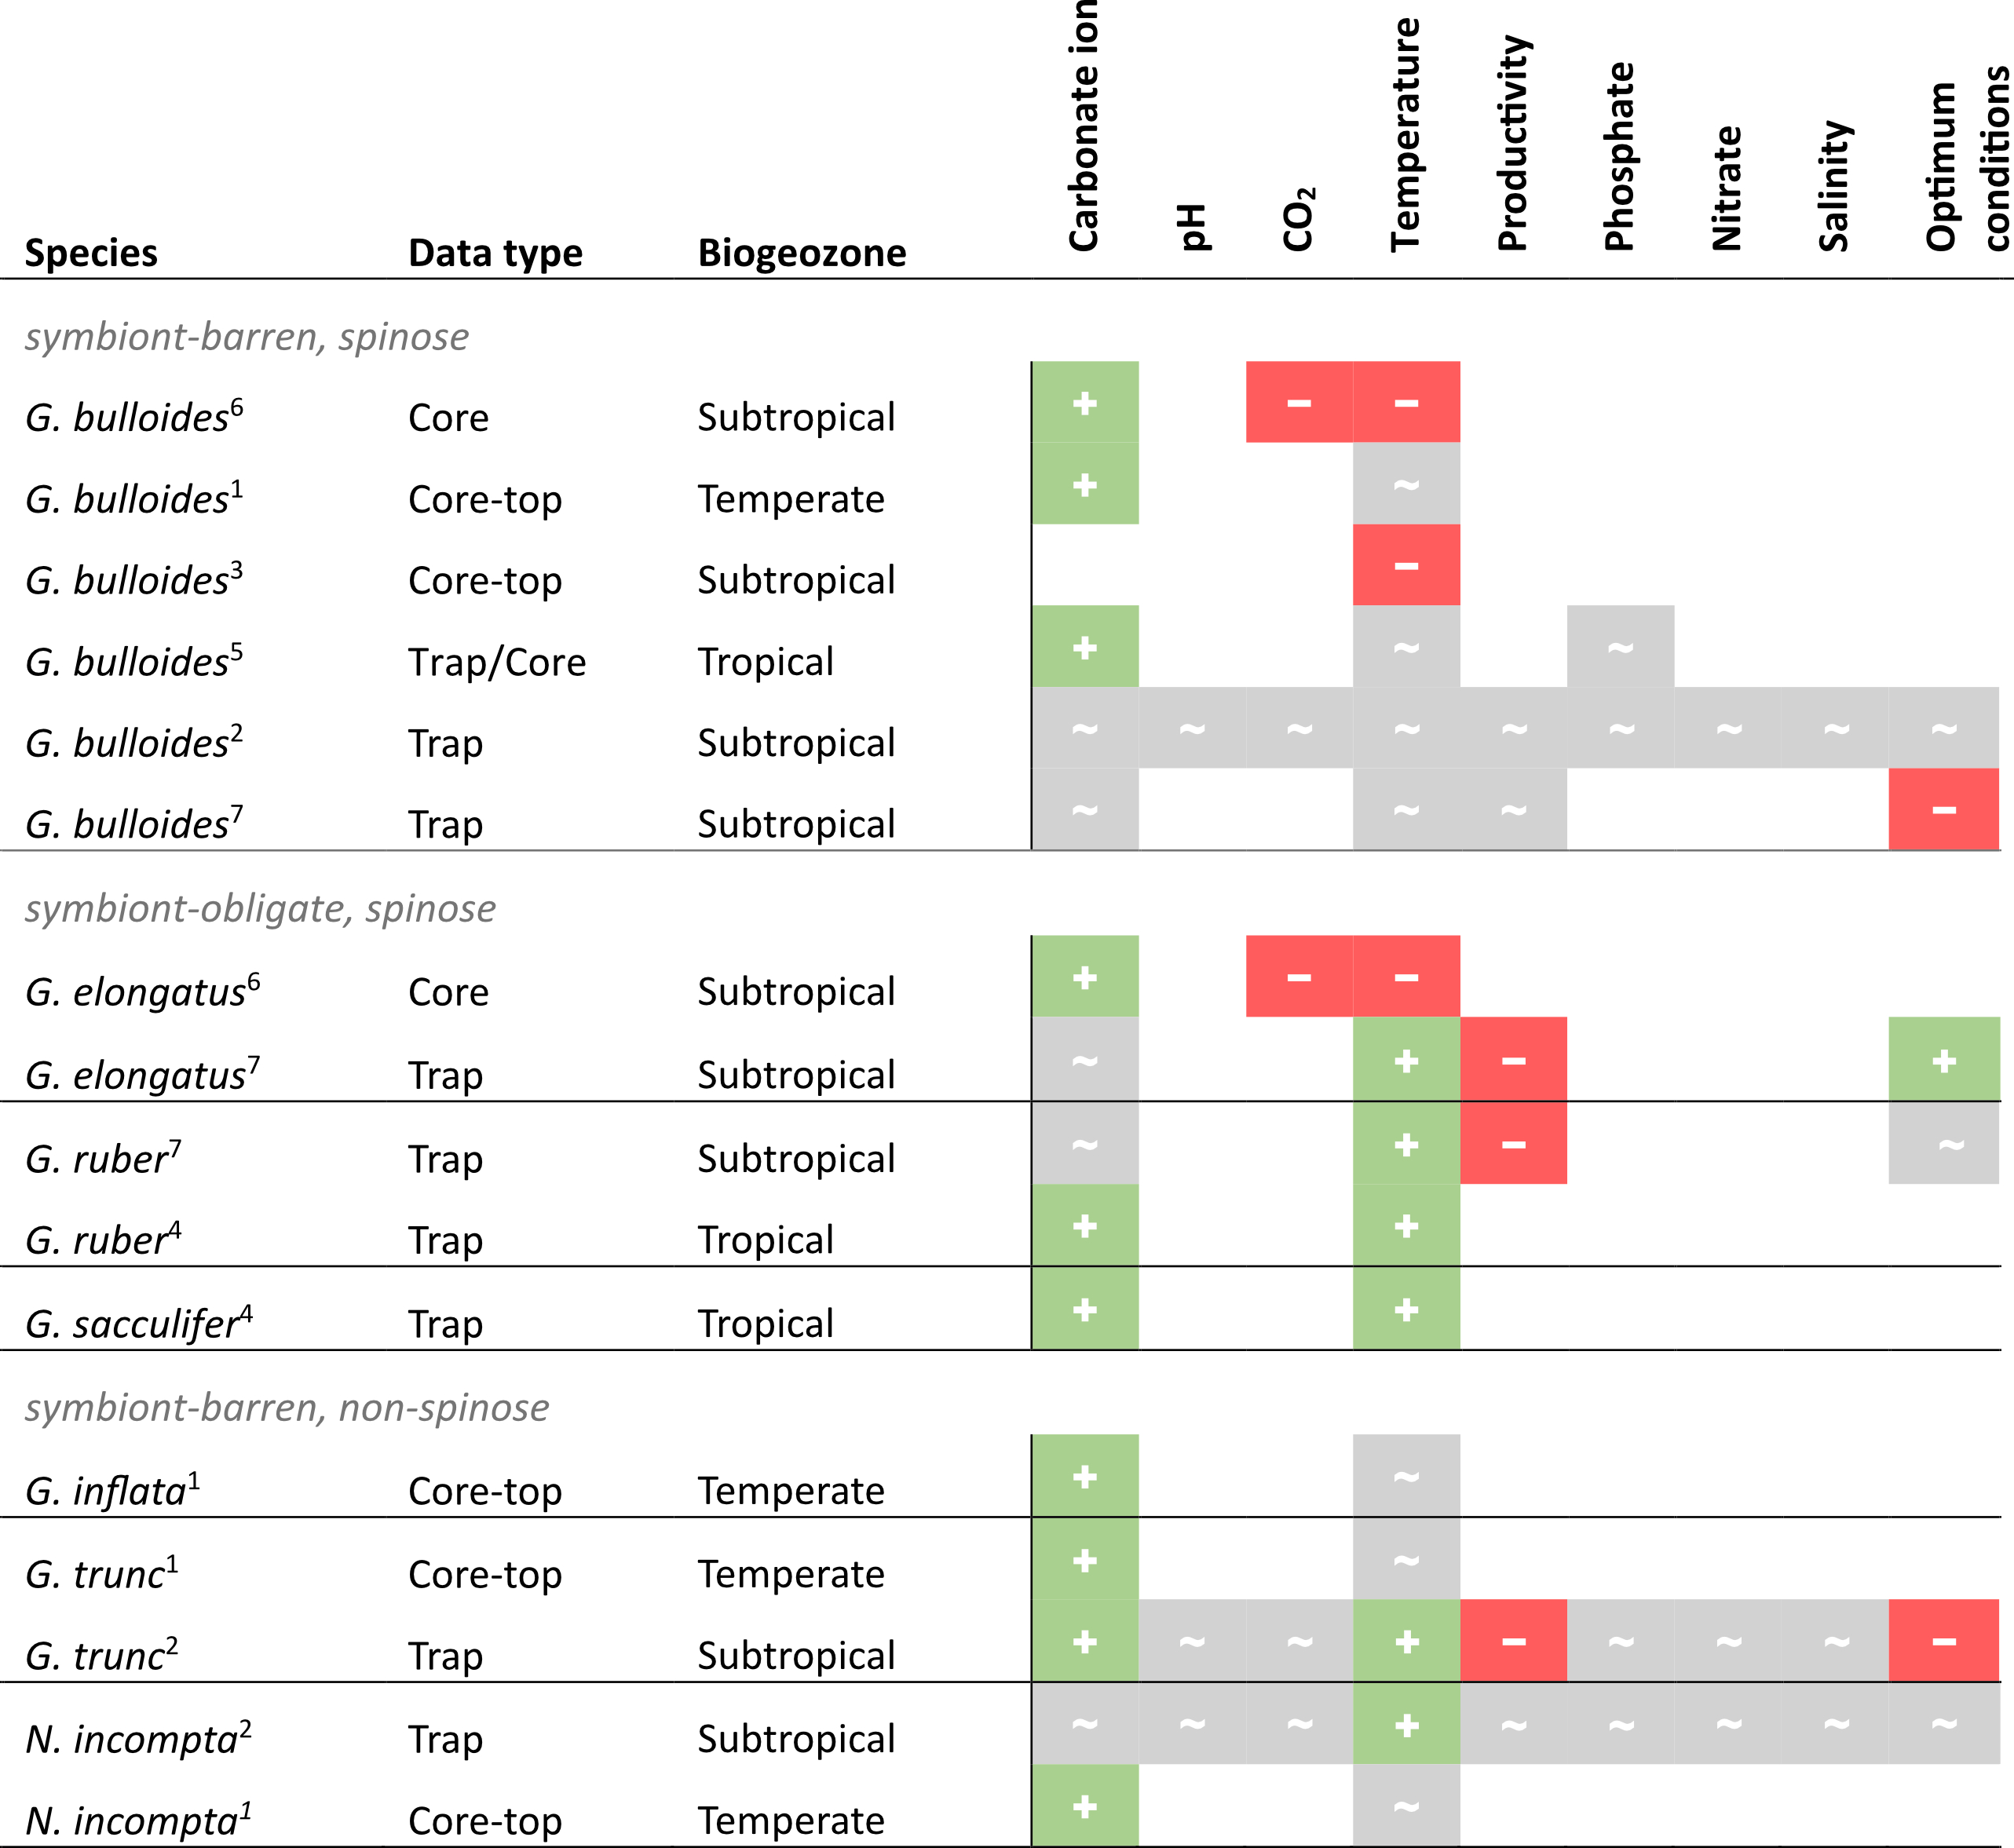
Assessing the available SNW data and their suggested drivers in the literature, there is no single environmental control on foraminiferal size-normalised weight across species (Table 2). Although this summary suggests that a negative correlation between carbonate ion concentration and SNW is unlikely, it is inconclusive as to whether an increase in carbonate ion concentration has no impact on shell weight or increases it. For other environmental variables, it is either a mixed response or there is too little information to determine a direction of response. However, it is important to note that, where no significant effect is reported in Table 2, this could possibly reflect the lack of statistical power rather than no response.
Table 2Compilation of results from previous studies assessing the relationship between planktonic foraminiferal size-normalised weight (SNW) and the environment. + is positive correlation, − is negative correlation, and ∼ is no response. This table summarises information from measurement-based SNW (i.e. silhouette area or diameter-normalised) studies only and omits those which only normalised to size by sieving (i.e. sieve-based weights, SBWs) or use plankton tow data. See Table S2 in the Supplement for details on the SNW measurement method. (1) Barker and Elderfield (2002), (2) Béjard et al. (2023), (3) Marr et al. (2011), (4) Marshall et al. 2013), (5) Osborne et al. (2016), (6) Pallacks et al. (2023), (7) Weinkauf et al. (2016).
3.2 Qualitative assessment of reanalysed data
Here we qualitatively assess the integrated published SNW and new SNW dataset alongside the environmental output from the CMIP6 modelling suite. Generally, larger foraminifers (e.g. 425–850 µm) have heavier tests (average 40.14 µg) and smaller foraminifers (e.g. 200–250 µm) have lighter tests (average 5.49 µg; Fig. 2a). The 300–350 µm size fraction shows greatest variability in weight (standard deviation [σ] 7.96; Fig. 2a), likely as it has a higher species diversity (n=5) compared to other size fractions (n=1to4). Interestingly, the second highest variability in weight is for the 400–500 µm size fraction (σ 6.77; Fig. 2a) and is linked to only one species, G. truncatulinoides, from one publication (Béjard et al., 2023; Fig. S8). The species is atypical, as a very large proportion of the weight is in the gametogenic calcite covering the entire test (Schmidt et al., 2008), whose thickness might be driven by environmental parameters as well. Furthermore, the species has a year-long life cycle (whilst other species analysed here have lunar cycles and peak in a specific season), meaning that G. truncatulinoides is exposed to greater environmental variability throughout the year. The lack of environmental variability shown here for these samples likely reflects averaging of the seasons in this annual environmental record.
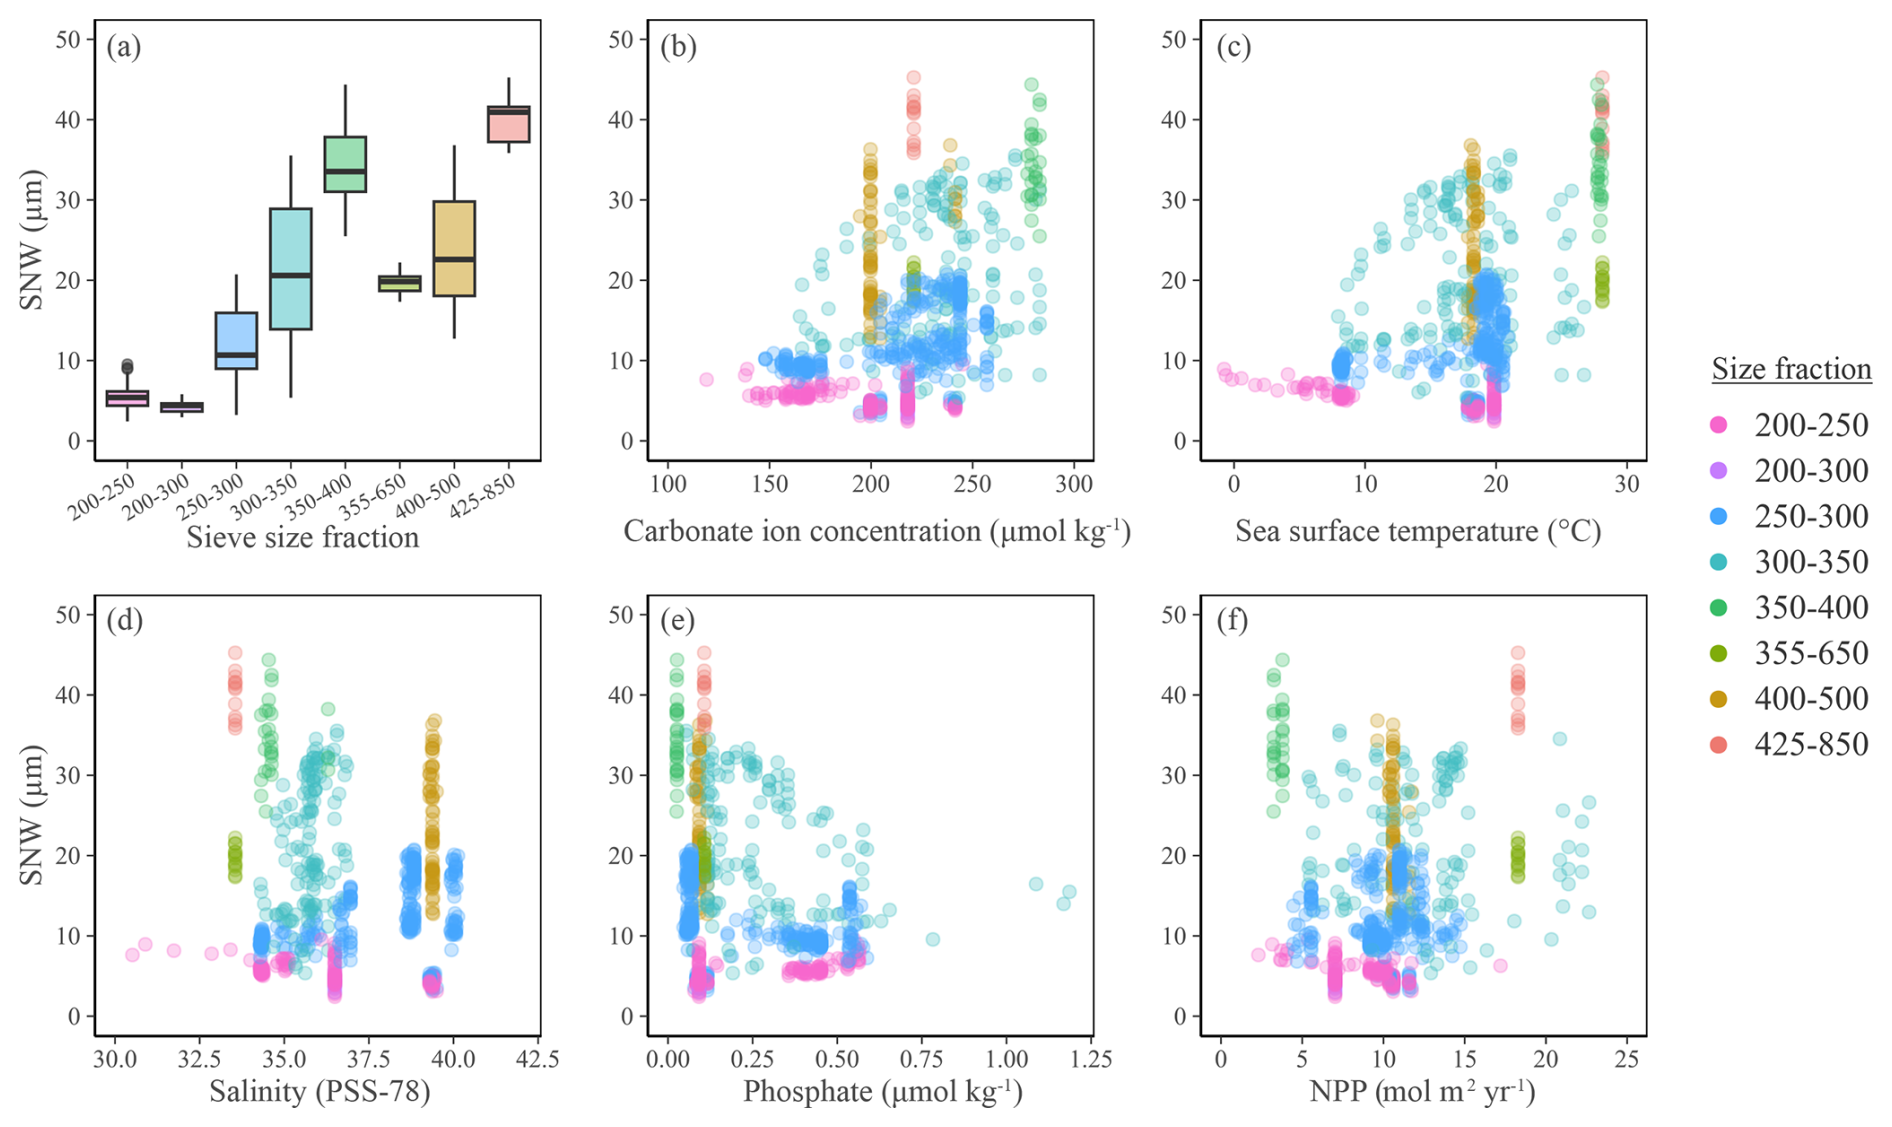
Figure 2(a) Boxplot showing SNW distribution across sieve size fractions. (b–f) Planktic foraminiferal size-normalised weight (using the measurement-based weight approach) against environmental variables extracted from the CMIP6 modelling suite (see Methods). Colours indicate the size fraction foraminifers were initially sieved at before being normalised to their length or area. See Fig. S8 for planktic foraminiferal SNW separated by species, with sieve size fraction information and Fig. S9 for panel (a) separated by data type.
The smallest size fractions must be interpreted with caution (Fig. 2), as they have not been systematically assessed in warm regions (where carbonate ion concentration is higher) due to a preference for using larger sieve size fractions in these regions. As such, although the smaller size fractions are meaningful in polar and subpolar areas (as foraminifers are smaller at the poles), they must be interpreted with caution in warm, high-calcite-saturation regions where including smaller size fractions might result in the selection of species which have not undergone a full developmental cycle and hence might miss final calcification, such as the cortex or gametogenic calcite. The absence of heavy foraminifer in low carbonate ion saturation (Fig. 2b) and cool (Fig. 2c) environments suggests that these environments limit foraminiferal weight. To take out size fraction bias, all size fractions other than 250–300 and 300–350 µm were removed and these two remaining size fractions were merged to create a dataset sufficient for statistical analysis. Unless stated otherwise, the following statistics were performed on this reduced dataset.
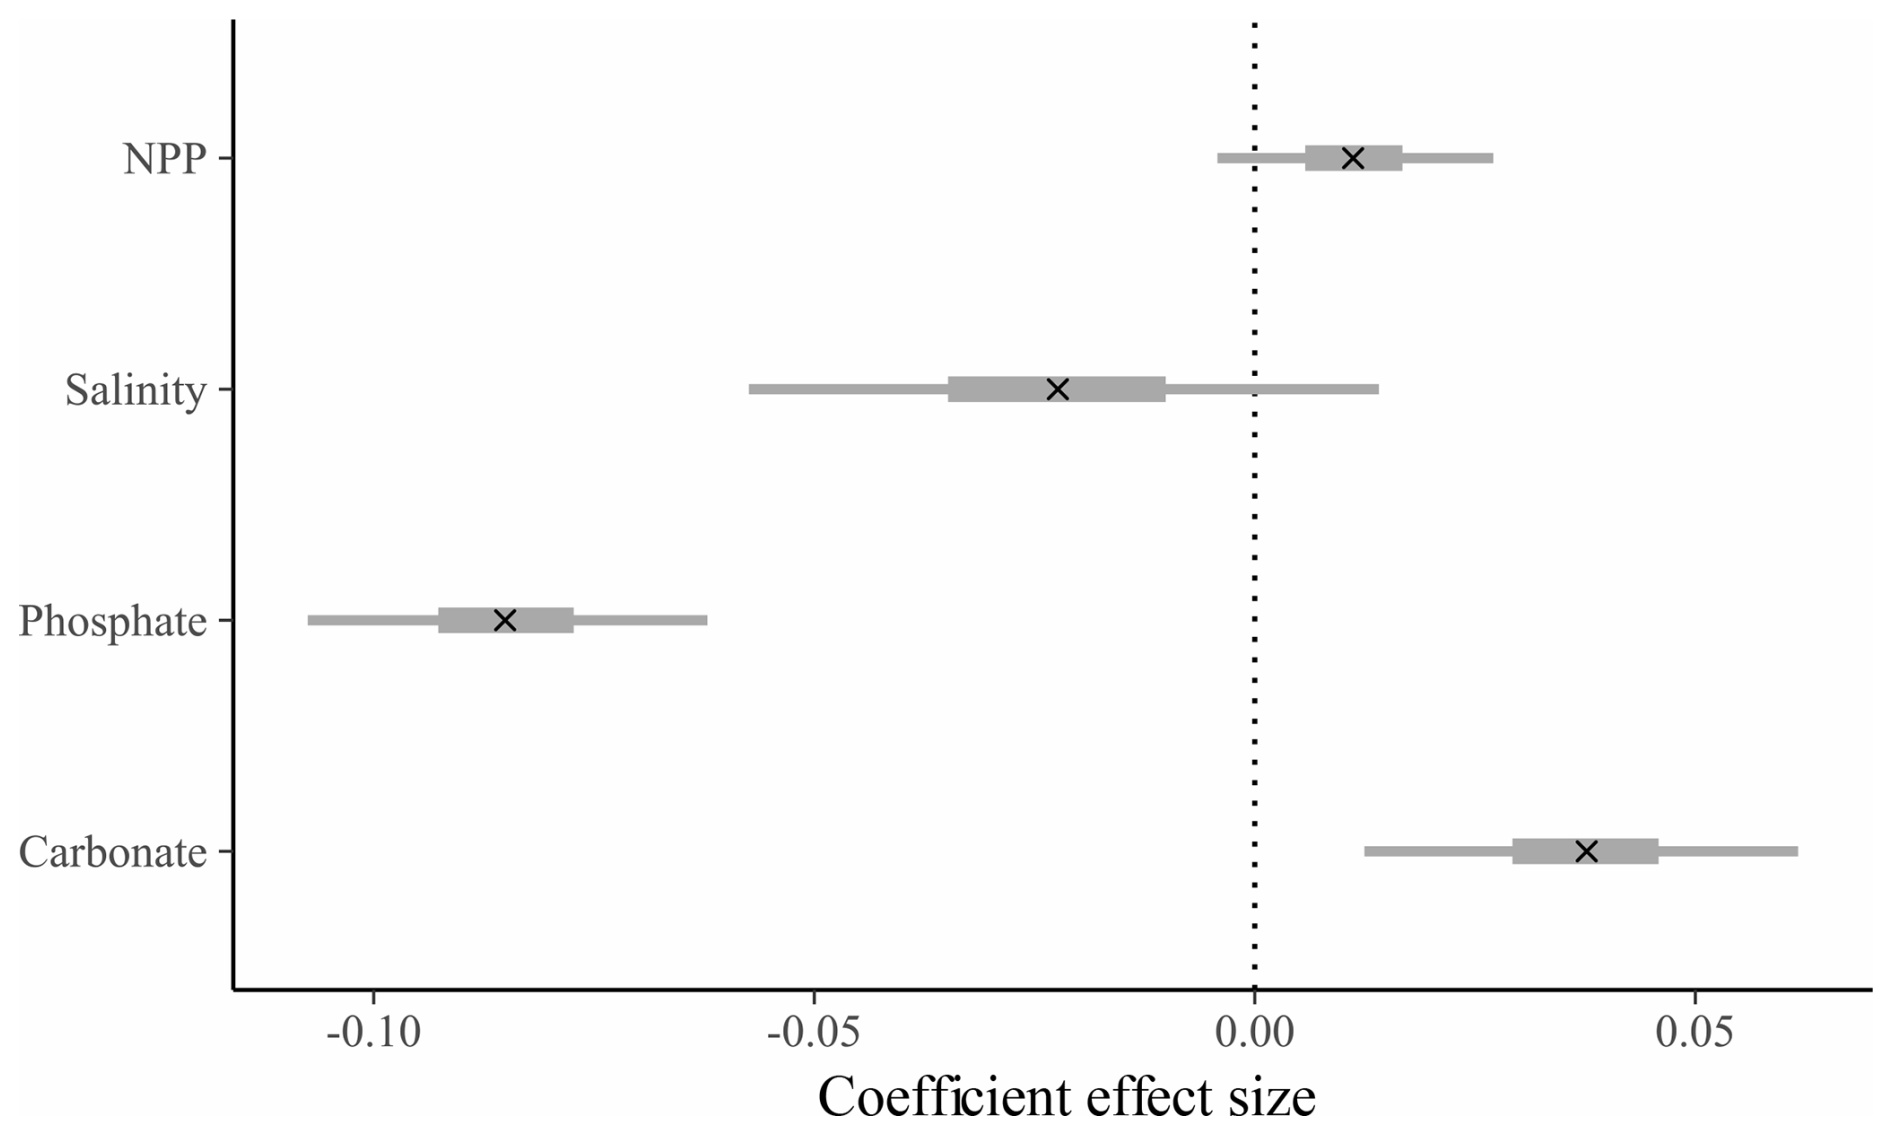
Figure 3Effect size and credible intervals for the association between SNW and the environment for the group-level (across species, “full”) model (see Table S4). A cross (x) represents the median value, the thicker line represents the 50 % interval (i.e. where 50 % of the posterior probability lies), and the thinner line represents the 95 % interval. If the 95 % interval does not cross zero, then there is a 95 % probability there is an effect of the environmental variable. A negative value represents a negative correlation between SNW and the coefficient. Note that the modelled dataset is slightly different to the species-level dataset. The group-level model dataset includes species which were omitted from species-level models due to their low sample size, and the size fraction ranges are more restricted for the group-level model due to a bias against larger size fractions in cooler environments (see Methods).
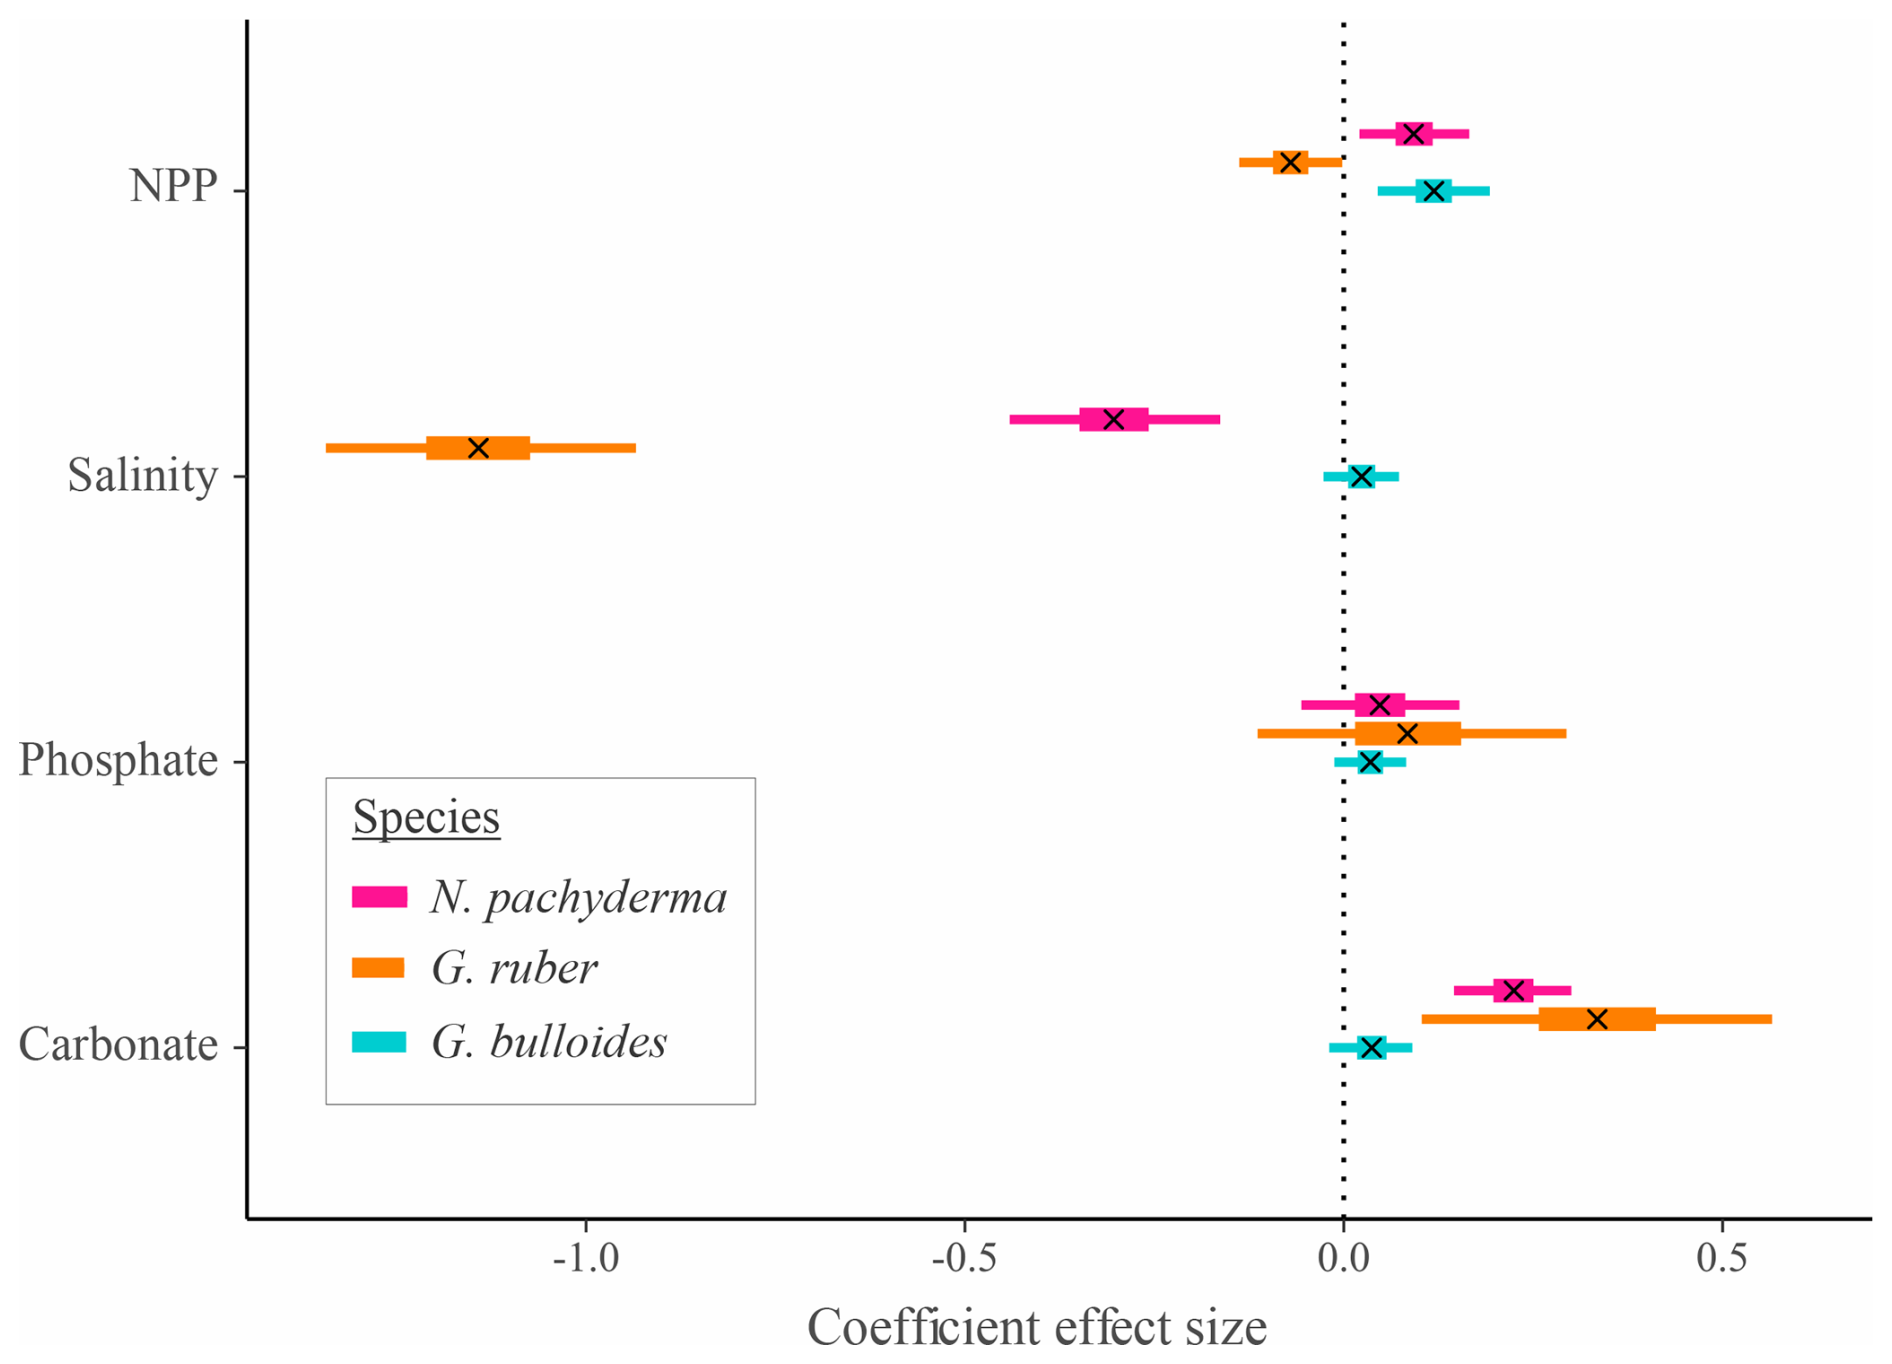
Figure 4Effect size and credible intervals for the association between SNW and the environment for the species-level Bayesian modelling. A cross (x) represents the median value, the thicker line represents the 50 % interval (i.e. where 50 % of the posterior probability lies), and the thinner line represents the 95 % interval. If the 95 % interval does not cross zero, then there is a 95 % probability there is an effect of the environmental variable. A negative value represents a negative correlation between SNW and the environmental variable. Ecogroups are grouped by colour. G. bulloides is a symbiont-barren, spinose species. G. ruber is a symbiont-obligate, spinose species. N. pachyderma is a symbiont-barren, non-spinose species.
3.3 Is there an environmental control on SNW across species?
We use Bayesian regression to determine whether there is an environmental control on SNW at the “group level” (i.e. across species). A model that is “environment-only” explains 20 % of the variability in SNW (Bayes R2; Table S3; Gelman et al., 2019). The addition of sampling method (i.e. the “null model”) improves model performance ( improved by 114.4 [±23.7]) and explains variance increases to 60 % (Table S3). The “full” model (i.e. environment, sampling method, and species) performs better than the “null” model ( improved by 247.5 [±19.4]) and explains variance increases to 90 % (Table S3). Together, this shows that the choice of sampling method can influence the SNW recorded and that species-specific responses are important in determining SNW. Results from the “full” model highlight that higher SNWs are associated with a higher carbonate ion concentration (0.04 [0.01, 0.06]; effect size and 95 % credible interval [lower, upper]; Fig. 3; Table S4) and a lower phosphate concentration (−0.08 [−0.11, −0.06]; Fig. 3; Table S4), though the effect size is small. To dive deeper into the link between SNW and the environment, Bayesian models were fitted at the species level.
3.4 Is there a species-specific or an ecogroup response?
Due to collinearity, we are unable to assess the impact of sea surface temperature (SST) on SNW. However, we could expect an increase in SNW with warming, as warmer water decreases the solubility of atmospheric CO2, which elevates surface water carbonate ion concentration, and also increases enzymatic activity, which promotes growth and calcification rate (Lombard et al., 2009; Spero et al., 1991). Although some past research has identified an increase in SNW with warming (Béjard et al., 2023; Davis et al., 2013; Gonzalez-Mora et al., 2008; Marshall et al., 2013; Osborne et al., 2016; Qin et al., 2020; Song et al., 2022; Weinkauf et al., 2016), there is also evidence for the reverse (Mallo et al., 2017; Naik et al., 2010, 2011; Pallacks et al., 2023). This dichotomy has been attributed to the overriding effect of decreasing carbonate ion concentration on SNW due to ocean carbon input (Naik et al., 2010; Pallacks et al., 2023), temperature-induced sea surface stratification, and lower food availability (Mallo et al., 2017).
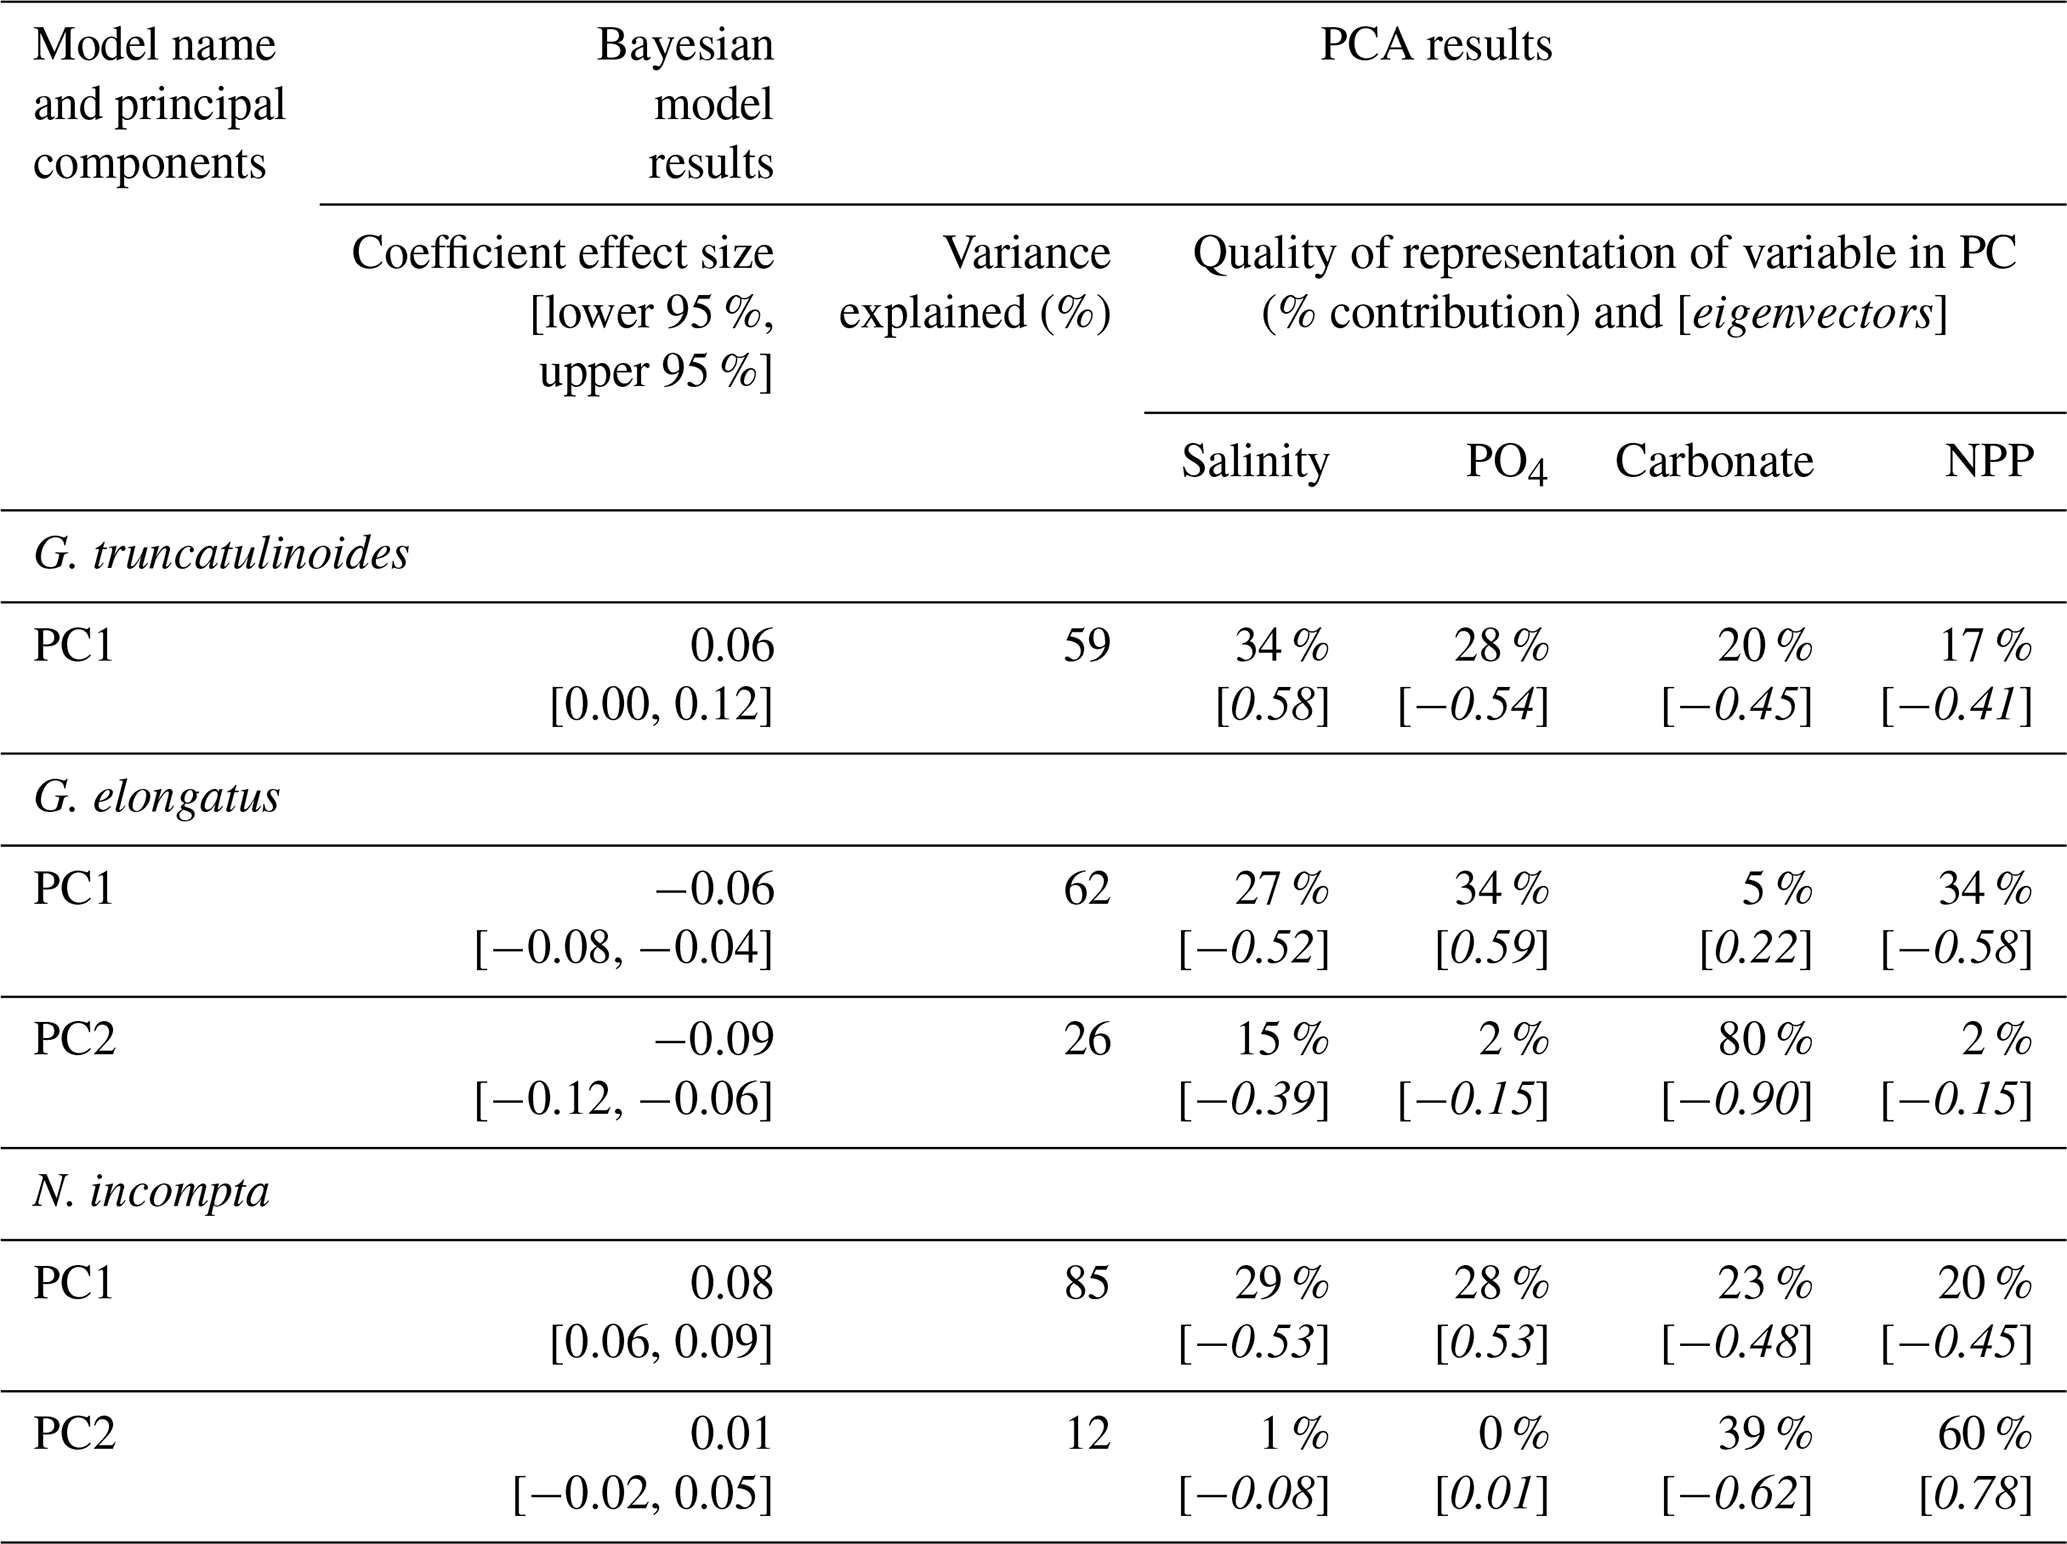
In agreement with the published literature (Aldridge et al., 2012; Barker and Elderfield, 2002; Béjard et al., 2023; Marshall et al., 2013; Osborne et al., 2016; Pallacks et al., 2023), an increase in carbonate ion concentration does not negatively impact SNW (Fig. 4; Table S4). The relationship is not always positive, though, with G. bulloides exhibiting no notable response to a change in carbonate ion concentration (0.04 [−0.01, 0.09]; Fig. 4; i.e. 95 % interval crosses zero). PC1 for G. truncatulinoides is associated with a decrease in carbonate ion concentration (eigenvector −0.45) that results in an increase in SNW (i.e. positive coefficient effect size; 0.06 [0.00, 0.12]; Table 3). Carbonate only contributes approximately one-fifth to PC1, which only explains 59 % of the variance in environmental data. Moreover, attributing the relative impact of environmental drivers is difficult given the contributions of salinity, PO4, and NPP to PC1 (34 %, 28 %, and 17 %, respectively; Table 3). The positive eigenvector associated with G. elongatus PC1 for carbonate that contributes to a decrease in SNW (coefficient effect size −0.06 [−0.08, −0.04]; Table 3) should not be overinterpreted considering that carbonate only contributes 5 % to PC1 in G. elongatus. Otherwise, the contributions of carbonate are as expected (a negative loading for carbonate in combination with the other environmental variables results in a negative coefficient effect size for SNW, i.e. a lower SNW).
It remains up for debate which part of the carbonate system exerts control on calcification. It has been suggested that the HCO H+ ratio (where HCO (bicarbonate ions) is the inorganic carbon substrate and H+ (protons) is a calcification inhibitor) controls calcification and that CO correlates because of a proportionality between CO and this ratio (Bach, 2015). However, even if this is the case, this implies that CO can be a proxy for the HCO H+ ratio; hence it is still important for calcification.
An increase in phosphate concentration is unlikely (< 95 % probability) to impact the SNW of N. pachyderma, G. ruber, and G. bulloides (Fig. 4; Table S4; 95 % interval crosses zero). Higher phosphate concentration is associated with lower SNWs for G. truncatulinoides and G. elongatus. For the former, weights are higher when phosphate concentration is lower (eigenvector −0.54 and a positive coefficient effect size for PC1; Table 3), and, for the latter, weights are lower with increased phosphate (eigenvector 0.59 and a negative coefficient effect size for PC1; Table 3). However, for both species, phosphate only represents about one-third of PC1; hence this impact cannot be separated from other environmental variables due to similar percent representations. Although N. incompta is also a symbiont-barren, non-spinose species, its response is different to G. truncatulinoides. Increased phosphate (in combination with other environmental drivers; eigenvector 0.53; Table 3) is associated with a higher SNW (a positive coefficient effect size for PC1).
Given the evidence for calcification inhibition in high-phosphate conditions (Lin and Singer, 2006) for other calcifiers, such as corals (Kinsey and Davies, 1979), coccolithophores (Paasche and Brubak, 1994), and calcifying green algae (Demes et al., 2009), it is interesting that we do not observe a stronger detrimental effect of phosphate on these foraminiferal species. However, this disparity could be explained by the different calcification mechanisms. For example, foraminifers biomineralise extracellularly by engulfing calcite-forming materials through seawater vacuolisation (potentially assisted by transmembrane ion transport; Bentov et al., 2009; de Nooijer et al., 2014; Erez, 2003; Nehrke et al., 2013). In contrast, coccolithophores biomineralise by forming coccoliths in intracellular organelles called “coccolith-forming vesicles” (Brownlee and Taylor, 2004).
Table 3Summary of Bayesian model results for species that required principal component analysis to remove collinearity from models. The coefficient effect size and credible intervals (lower and upper 95 % credible interval) for the association between SNW and the environment. Variance explained (%) indicates how well the principal component explains the environmental data. Percentage contribution shows how well a particular environmental variable is represented in the principal component. Loadings (eigenvectors) are indicative of the correlation between variables. G. elongatus is a symbiont-obligate, spinose species. G. truncatulinoides and N. incompta are symbiont-barren, non-spinose species. See Sect. S2 for a discussion of the PCA results and Table S5 for extended data.
There is no consensus on the impact of phosphate on calcification even within a taxon, with a recent study on coccolithophores not showing calcification inhibition but instead showing decreased calcification with phosphate limitation (Gerecht et al., 2018), hence pointing to other taxa exhibiting similar responses to our species-level modelling. Our G. bulloides result conflicts with a study of North Atlantic G. bulloides, in which a decrease in SNW with increased phosphate was recorded (Aldridge et al., 2012), though Béjard (2023) and Mallo et al. (2017) did not observe this in the Mediterranean. This disparity could be due to the use of shallow plankton tows in Aldridge et al. (2012), which is likely to complicate the SNW signal, as juveniles which had not completed their development may have been measured. Additionally, G. bulloides has several cryptic species (Morard et al., 2024) which have their own ecological adaptation and spatial variability; hence the geographic difference might further complicate the interpretation of data in these studies (Fig. S2). However, in our group-level model (i.e. all foraminifers), we observe a negative impact of phosphate on SNW (−0.08 [−0.11, −0.06]; Fig. 3; Table S4). This is unlikely an effect of sampling bias toward the Atlantic, as the Atlantic has near-even sampling (n=242) to the Mediterranean (n=239). Instead, as the group-level model contains some different species than the species-level modelling, we suggest that this difference reflects that certain species of foraminifera are sensitive to phosphate, while others are not.
Salinity has a mixed impact on foraminiferal SNW. For G. ruber, SNW is lighter at high salinity (−1.14 [−1.35, −0.93]). Neogloboquadrina pachyderma has a similar but weaker response (−0.30 [−0.44, −0.16]; Fig. 4; Table S4), and G. bulloides shows no response (0.03 [−0.01, 0.08]; Fig. 4; Table S4). Globorotalia truncatulinoides and G. elongatus have the same direction of response to salinity, with SNWs being heavier when salinity is higher (Table 3). For G. truncatulinoides, this presents as higher salinity (eigenvector 0.58) being associated with heavier weights, i.e. a positive coefficient effect size (0.06 [0.00, 0.12]), and, for G. elongatus, this presents as lighter weights (−0.06 [−0.08, −0.04] under lower salinity (eigenvector −0.52; Table 3). The opposite is true for N. incompta, for which, in combination with other drivers, weight increases (0.08 [0.06, 0.09]) under lower salinity (eigenvector −0.53; Table 3).
Laboratory experiments that exposed foraminifers to a wider salinity range than observed under normal ocean conditions concluded that G. ruber was most tolerant to changes in salinity out of the seven species analysed (Bijma et al., 1990). For other foraminiferal species, they found that, under low salinity, growth rate reduced and the final test size was smaller. The difference in the G. ruber response here and in Bijma et al. (1990) could be because salinity values reported by Bijma et al. (1990) were more extreme than normal ocean conditions or that growth rate and size are impacted differently from weight; i.e. foraminifers could be smaller but have a thicker test. Unfortunately, weight was not recorded in the study, so this cannot be tested.
A higher NPP (food availability) is associated with heavier SNWs for N. pachyderma and G. bulloides and is likely to be associated with a lighter SNW for G. ruber (Fig. 4; Table S4). Lower NPP is associated with heavier SNWs on PC1 for G. truncatulinoides and N. incompta (negative eigenvectors associated with positive coefficient effect sizes; Table 3), though it is important to note that the percent representation of NPP is one-fifth or less of the total contribution to the PC. For G. elongatus, SNW is lighter with lower NPP (eigenvector −0.58 and coefficient effect size −0.06 [−0.08, −0.04]), though this interpretation is similarly limited by NPP being in combination with other environmental variables.
Given that G. bulloides and G. ruber have spines which could make it easier for them to capture prey and therefore be less reliant on NPP compared to non-spinose types, it is surprising that these species (though in opposite directions) are associated with NPP. For the asymbiotic non-spinose N. pachyderma, SNW increases with productivity (0.09 [0.02, 0.16]; Fig. 4, Table S4). It is interesting that, despite constructing a secondary calcite crust (which could overprint the primary SNW signal), N. pachyderma (Kohfeld et al., 1996) still exhibits a response to the environment. Given that asymbiotic species (N. pachyderma and G. bulloides) show a positive impact on SNW with increased food, while the opposite is true for the symbiont-bearing G. ruber, this could hint at light attenuation due to high plankton standing stocks reducing symbiotic activity (Bijma et al., 1992; Ortiz et al., 1995), thereby reducing this additional energy source used to support growth and calcification (LeKieffre et al., 2018).
Due to limited shell flux data, we were unable to investigate how optimum growth conditions (OGCs) impacted SNW. Although NPP may facilitate OGCs by making food available for growth, we cannot assume that high NPP results in optimum conditions, as it also hinders photosynthesis and excludes species (Ortiz et al., 1995). There is some evidence of SNW increasing where a species is at its OGC (i.e. where shell flux for that species is high; de Villiers, 2004), but there is no consensus in the data (Table 2), with some observing a negative correlation between OGCs and SNW (Béjard et al., 2023; Weinkauf et al., 2016).
A tentative evaluation of ecogroup responses can be made despite the interpretation of PCA factors being limited. Interpretation is limited because PCA represents a gradient that includes multiple environmental drivers; hence the impact of a single driver cannot be separated from other environmental drivers. The SNW response to the environment is largely species-specific and shows little evidence of an overriding ecologically driven response. Although an increase in carbonate ion concentration is likely linked to heavier SNWs, this is true across all species and not ecogroup-dependent. Otherwise, ecogroups do not have a unifying driver. For example, the symbiont-barren, non-spinose species (N. pachyderma, and G. truncatulinoides) lack a unifying driver linked to their ecology and have the lowest Bayes R2 scores (55 % and 33 %, respectively). This could be because the SNWs of these species are likely to be more heavily impacted by the production of a secondary calcite crust than other species analysed here (Kohfeld et al., 1996; Schmidt et al., 2008).
3.5 Impact of sampling type
The choice of sampling method is important for the resulting weight of foraminifers. Despite attempting to minimise the impact of sampling method by removing (1) plankton tow data, (2) data for which dissolution is reported, and (3) samples approaching the CCD, the impact of sampling method on SNW is still evident. In all models (excluding N. pachyderma, which only had one sampling method), the lightest SNWs were recorded from sediment traps (Fig. S10). Sediment core data are lighter than core-top data, hinting towards questions of preservation not visible externally, but are more similar to each other than to sediment trap data (Fig. S10). We additionally split data by location to check whether sediment trap data are still lighter when the ocean basin is explicitly accounted for (Fig. S11). This separation shows (1) no clear trends for N. incompta, a relatively thick specimen; (2) no clear trends in the two datasets for G. bulloides comparing the Mediterranean with the Atlantic, though, overall, for this reduced dataset, SNW in sediment trap data is lighter than or equal to seafloor (core-top and sediment core) data; and (3) heavier G. truncatulinoides weight with core-top data. It is important to note that we have limited data from regions that have a very shallow CCD, such as the Pacific, thereby limiting insight.
It is unlikely that dissolution in the water column (i.e. impact of intermediate and deep water) is the cause of lighter weights in sediment trap data (Figs. S10 and S11) because it would have impacted core-top and/or sediment core samples even more due to longer exposure. It is unlikely that diagenetic alteration (e.g. recrystallisation in the pore water) has made the SNW of core-top and sediment core data comparatively heavier, as, relative to the weight of the entire test, it would have little impact on overall weight. We speculate that sediment trap data are lighter, as they reflect current environmental conditions, whereas sediment core and most core-top data are preindustrial; hence the lighter weights may be due to impacts of lower carbonate ion concentration due to ocean acidification (Moy et al., 2009; Pallacks et al., 2023).
4.1 Should SNW be used as proxy for CO2?
Disentangling the controls on SNW is important for understanding the use of SNW as a proxy for interpreting past ocean conditions. This paper cautions the use of planktic foraminiferal SNW as a reliable proxy for the surface ocean carbonate system and palaeo-pCO2.
Although there is a small but likely (i.e. > 95 % probability) effect of carbonate on a group level (i.e. across species; 0.04 [0.01, 0.06]), phosphate is also likely associated with SNW (−0.08 [−0.11, −0.06]; Fig. 3; Table S4). Hence, unless the impact of phosphate on SNW can be quantified and disentangled from the carbonate effect, SNW across species is not a reliable predictor for pCO2. As SNW is variable on a species level, there is a need to consider which species to use for palaeo-proxies or a need to consider multiple species in parallel to reduce uncertainty from species-specific differences.
Although the use of SNW to inform past CO2 has been shown to work regionally with certain species, e.g. G. bulloides in the North Atlantic (Barker and Elderfield, 2002), the relationship between SNW and carbonate ion concentration seems to break down when taken out of its calibration region. When expanding the G. bulloides dataset to include Pacific, Mediterranean, and higher-latitude North Atlantic samples (Fig. S2), we find no correlation between SNW and carbonate ion concentration (Fig. 4). Hence, we advocate for the regional calibration of pCO2–SNW relationships and caution against the extrapolation and global application of SNW as proxy for pCO2.
4.2 Current challenges and future outlook
One of the challenges in assessing a unifying calcification response is unequal methodologies and data reporting. In this paper, 57 publications were screened for their SNW data, but only 7 publications (and our data) could be used for the species-level modelling. Around half were omitted, as they were older than preindustrial and environmental data were not available to determine drivers. Otherwise, SNW data were often not freely available (or at all available) and, if deposited, only provided processed data with different methods of normalising weight to size. We strongly encourage the community to deposit raw data to make the legacy of data longer. A total of 28 publications were omitted because shell weights were reported using the sieve-based weight (SBW) methodology and not normalised to size or area (MBW). Although there is some debate as to whether this additional step of normalising weight to measurement-based size is necessary, some publications (Aldridge et al., 2012; Beer et al., 2010a; Béjard et al., 2023) indicate that MBW SNW is more robust than SBW. It would be a step forward for the community to derive protocols for SNW akin to trace element analysis, e.g. Hathorne et al. (2013) and Rosenthal et al. (2004). Additionally, it is important to acknowledge the different developmental stages in plankton tow samples compared to sediment trap and core-top samples. Post-depositional dissolution will reduce weights, while infilling and diagenesis increase weight, and both need to be carefully monitored (Bassinot et al., 1994; Broecker and Clark, 2001). It would also be useful for authors to report their foraminifera cleaning protocol, or, even better, that the community agrees on a standardised cleaning method, as different methods can result in variable sedimentary contamination, which impacts the weight of specimens (Béjard et al., 2023; Zarkogiannis et al., 2020). Additionally, we still have important gaps in our understanding of foraminiferal ecology, for example, the dynamics of the habitat throughout the year (including the depth of calcification; see Sect. S3), the peak times of biomass production in different regions, and the drivers of thickness of gametogenic calcite. All of these factors limit the use of the proxy.
Importantly, our analyses lack data from the Indian Ocean, southern high latitudes, and large parts of the Pacific, highlighting challenges of preservation in deep-sea sediments, logistics of reaching remote areas, and bias due to the traditional areas of sampling of seagoing nations. As analyses expand to ocean regions below the lysocline, authors should provide a measure of dissolution and/or high-resolution images of specimens which can help assess the impact of post-diagenetic alteration. Although such images can also support morphological assessment of cryptic species, these images are still not systematically implemented in palaeoceanographic studies.
Although higher carbonate ion concentration and lower phosphate concentration are associated with heavier SNWs at the group level (i.e. across species), the environment alone explains relatively little of the variability in SNW at the group level. Instead, we identify species-specific SNW responses that better explain variability in weight. Although physiology is likely to modulate the foraminiferal response to the environment, we find limited evidence of an ecogroup-level response.
The species-specific SNW response to the environment is complex, with each species responding to a different combination of environmental drivers. We hypothesise that this is in part influenced by cryptic species and our limited understanding of what drives the thickness of gametogenic calcite. The SNW response, being species-specific and responding to drivers other than carbonate, implies there is a need to consider which species to use as a pCO2 proxy or a need to consider multiple species in parallel to reduce uncertainty from species-specific differences. Furthermore, due to differences in the published response of G. bulloides in the North Atlantic and our more global dataset of G. bulloides SNW, we advocate for the regional calibration of pCO2–SNW relationships.
Our understanding of SNW as a proxy would be greatly improved with some community efforts to solve some of the above questions, including (1) making raw SNW data freely available; (2) community-agreed protocols, i.e. whether SBW or MBW should be used in such analyses; (3) improving our understanding of the calcification process itself and how the environment drives the thickness of gametogenic calcite; and (4) resolving the impact that cryptic species have on SNW measurements.
An R markdown file has been uploaded as part of the Supplement and is available in the University of Bristol data repository, data.bris, at https://doi.org/10.5523/bris.1963qldd6phh829rnosunh0864 (Barrett, 2025a).
Planktic foraminifera size-normalised weight data and associated environmental data are available at PANGAEA https://doi.org/10.1594/PANGAEA.973256 (Barrett, 2025b).
The supplement related to this article is available online at https://doi.org/10.5194/bg-22-791-2025-supplement.
RB and DNS conceptualised the study. RB collated existing SNW data, processed CMIP6 model data, and conducted analysis of these data. JdV contributed to the methodological design and statistical analysis. RB prepared the article with contributions from both co-authors.
The contact author has declared that none of the authors has any competing interests.
Publisher’s note: Copernicus Publications remains neutral with regard to jurisdictional claims made in the text, published maps, institutional affiliations, or any other geographical representation in this paper. While Copernicus Publications makes every effort to include appropriate place names, the final responsibility lies with the authors.
This work would not have been possible without the efforts of the ODP and IODP programmes. We acknowledge Barbara Donner and Karl Heinz Baumann from the University of Bremen for sharing samples. We would like to thank Dale Thompson and Maricel Williams for processing samples to produce these new SNW data. We thank Li-Qing Jiang for providing support early on in the study design and for sharing their processed CMIP6 data.
This research has been supported by the Natural Environment Research Council (grant nos. NE/S007504/1, NE/P019439/1, and NE/X001261/1).
This paper was edited by Chiara Borrelli and reviewed by Brian Huber, Pincelli Hull, and two anonymous referees.
Aldridge, D., Beer, C. J., and Purdie, D. A.: Calcification in the planktonic foraminifera Globigerina bulloides linked to phosphate concentrations in surface waters of the North Atlantic Ocean, Biogeosciences, 9, 1725–1739, https://doi.org/10.5194/bg-9-1725-2012, 2012.
Aze, T., Ezard, T. H. G., Purvis, A., Coxall, H. K., Stewart, D. R. M., Wade, B. S., and Pearson, P. N.: A phylogeny of Cenozoic macroperforate planktonic foraminifera from fossil data, Biol. Rev. Camb. Philos. Soc., 86, 900–927, https://doi.org/10.1111/J.1469-185X.2011.00178.X, 2011.
Bach, L. T.: Reconsidering the role of carbonate ion concentration in calcification by marine organisms, Biogeosciences, 12, 4939–4951, https://doi.org/10.5194/BG-12-4939-2015, 2015.
Barker, S. and Elderfield, H.: Foraminiferal calcification response to glacial-interglacial changes in atmospheric CO2, Science, 297, 833–836, https://doi.org/10.1126/science.1072815, 2002.
Barrett, R.: R markdown file for Bayesian Regression Modelling in “What controls planktic foraminiferal calcification?”, University of Bristol [code], https://doi.org/10.5523/bris.1963qldd6phh829rnosunh0864, 2025a.
Barrett, R.: Planktic foraminifera size-normalised weight data and associated environmental data, PANGAEA [data set], https://doi.org/10.1594/PANGAEA.973256, 2025b.
Barrett, R., Adebowale, M., Birch, H., Wilson, J. D., and Schmidt, D. N.: Planktic Foraminiferal Resilience to Environmental Change Associated With the PETM, Paleoceanogr. Paleocl., 38, e2022PA004534, https://doi.org/10.1029/2022PA004534, 2023.
Bassinot, F. C., Beaufort, L., Vincent, E., Labeyrie, L. D., Rostek, F., Müller, P. J., Quidelleur, X., and Lancelot, Y.: Coarse fraction fluctuations in pelagic carbonate sediments from the tropical Indian Ocean: A 1500-kyr record of carbonate dissolution, Paleoceanography, 9, 579–600, https://doi.org/10.1029/94PA00860, 1994.
Bé, A. W. H. and Tolderlund, D. S.: Distribution and ecology of living planktonic foraminifera in surface waters of the Atlantic and Indian Oceans, in: The Micropalaeontology of Oceans, edited by: Funnell, B. M. and Riedel, W. R., Cambridge University Press, 105–149, 1971.
Beer, C. J., Schiebel, R., and Wilson, P. A.: On methodologies for determining the size-normalised weight of planktic foraminifera, Biogeosciences, 7, 2193–2198, https://doi.org/10.5194/bg-7-2193-2010, 2010a.
Beer, C. J., Schiebel, R., and Wilson, P. A.: Testing planktic foraminiferal shell weight as a surface water [CO] proxy using plankton net samples, Geology, 38, 103–106, https://doi.org/10.1130/G30150.1, 2010b.
Béjard, T. M., Rigual-Hernández, A. S., Flores, J. A., Tarruella, J. P., Durrieu De Madron, X., Cacho, I., Haghipour, N., Hunter, A., and Sierro, F. J.: Calcification response of planktic foraminifera to environmental change in the western Mediterranean Sea during the industrial era, Biogeosciences, 20, 1505–1528, https://doi.org/10.5194/bg-20-1505-2023, 2023.
Bentov, S. and Erez, J.: Impact of biomineralization processes on the Mg content of foraminiferal shells: A biological perspective, Geochem. Geophy. Geosy., 7, Q01P08, https://doi.org/10.1029/2005GC001015, 2006.
Bentov, S., Brownlee, C., and Erez, J.: The role of seawater endocytosis in the biomineralization process in calcareous foraminifera, P. Natl. Acad. Sci. USA, 106, 21500–21504, https://doi.org/10.1073/PNAS.0906636106, 2009.
Bijma, J., Faber, W. W., and Hemleben, C.: Temperature and salinity limits for growth and survival of some planktonic foraminifers in laboratory cultures, J. Foramin. Res., 20, 95–116, 1990.
Bijma, J., Hemleben, C., Oberhänsli, H., and Spindler, M.: The effects of increased water fertility on tropical spinose planktonic foraminifers in laboratory cultures, J. Foramin. Res., 22, 242–256, 1992.
Bijma, J., Spero, H. J., and Lea, D. W.: Reassessing Foraminiferal Stable Isotope Geochemistry: Impact of the Oceanic Carbonate System (Experimental Results), edited by: Fischer, G. and Wefer, G., in: Use of Proxies in Paleoceanography, Springer, Berlin, Heidelberg, 489–512, https://doi.org/10.1007/978-3-642-58646-0_20, 1999.
Bijma, J., Hönisch, B., and Zeebe, R. E.: Impact of the ocean carbonate chemistry on living foraminiferal shell weight: Comment on “Carbonate ion concentration in glacial-age deep waters of the Caribbean Sea” by W. S. Broecker and E. Clark, Geochem. Geophy. Geosy., 3, 1–7, https://doi.org/10.1029/2002GC000388, 2002.
Broecker, W. and Clark, E.: An evaluation of Lohmann's foraminifera weight dissolution index, Paleoceanography, 16, 531–534, https://doi.org/10.1029/2000PA000600, 2001a.
Broecker, W. and Clark, E.: Reevaluation of the CaCO3 size index paleocarbonate ion proxy, Paleoceanography, 16, 669–671, https://doi.org/10.1029/2001PA000660, 2001b.
Broecker, W. and Clark, E.: Ratio of coccolith CaCO3 to foraminifera CaCO3 in late Holocene deep sea sediments, Paleoceanography, 24, PA3205, https://doi.org/10.1029/2009PA001731, 2009.
Brownlee, C. and Taylor, A.: Calcification in coccolithophores: A cellular perspective, in: Coccolithophores, Springer, Berlin, 31–49, https://doi.org/10.1007/978-3-662-06278-4_2, 2004.
Buitenhuis, E. T., Le Quéré, C., Bednaršek, N., and Schiebel, R.: Large Contribution of Pteropods to Shallow CaCO3 Export, Global Biogeochem. Cy., 33, 458–468, https://doi.org/10.1029/2018GB006110, 2019.
Bürkner, P. C.: brms: An R Package for Bayesian Multilevel Models Using Stan, J. Stat. Softw., 80, 1–28, https://doi.org/10.18637/JSS.V080.I01, 2017.
Bürkner, P. C.: Advanced Bayesian multilevel modeling with the R package brms, R J., 10, 395–411, https://doi.org/10.32614/RJ-2018-017, 2018.
Carpenter, B., Gelman, A., Hoffman, M. D., Lee, D., Goodrich, B., Betancourt, M., Brubaker, M. A., Guo, J., Li, P., and Riddell, A.: Stan: A Probabilistic Programming Language, J. Stat. Softw., 76, 1–32, https://doi.org/10.18637/JSS.V076.I01, 2017.
Danabasoglu, G., Lamarque, J. F., Bacmeister, J., Bailey, D. A., DuVivier, A. K., Edwards, J., Emmons, L. K., Fasullo, J., Garcia, R., Gettelman, A., Hannay, C., Holland, M. M., Large, W. G., Lauritzen, P. H., Lawrence, D. M., Lenaerts, J. T. M., Lindsay, K., Lipscomb, W. H., Mills, M. J., Neale, R., Oleson, K. W., Otto-Bliesner, B., Phillips, A. S., Sacks, W., Tilmes, S., van Kampenhout, L., Vertenstein, M., Bertini, A., Dennis, J., Deser, C., Fischer, C., Fox-Kemper, B., Kay, J. E., Kinnison, D., Kushner, P. J., Larson, V. E., Long, M. C., Mickelson, S., Moore, J. K., Nienhouse, E., Polvani, L., Rasch, P. J., and Strand, W. G.: The Community Earth System Model Version 2 (CESM2), J. Adv. Model. Earth Syst., 12, e2019MS001916, https://doi.org/10.1029/2019MS001916, 2020.
Darling, K. F., Wade, C. M., Stewart, I. A., Kroon, D., Dingle, R., and Leigh Brown, A. J.: Molecular evidence for genetic mixing of Arctic and Antarctic subpolar populations of planktonic foraminifers, Nature, 405, 43–47, https://doi.org/10.1038/35011002, 2000.
Davis, C. V., Badger, M. P. S., Bown, P. R., and Schmidt, D. N.: The response of calcifying plankton to climate change in the Pliocene, Biogeosciences, 10, 6131–6139, https://doi.org/10.5194/bg-10-6131-2013, 2013.
Davis, C. V., Rivest, E. B., Hill, T. M., Gaylord, B., Russell, A. D., and Sanford, E.: Ocean acidification compromises a planktic calcifier with implications for global carbon cycling, Sci. Rep., 7, 1–8, https://doi.org/10.1038/s41598-017-01530-9, 2017.
Demes, K. W., Bell, S. S., and Dawes, C. J.: The effects of phosphate on the biomineralization of the green alga, Halimeda incrassata (Ellis) Lam., J. Exp. Mar. Biol. Ecol., 374, 123–127, https://doi.org/10.1016/J.JEMBE.2009.04.013, 2009.
Dong, S., Lei, Y., Bi, H., Xu, K., Li, T., and Jian, Z.: Biological Response of Planktic Foraminifera to Decline in Seawater pH, Biology, 11, 98, https://doi.org/10.3390/biology11010098, 2022.
Dormann, C. F., Elith, J., Bacher, S., Buchmann, C., Carl, G., Carré, G., Marquéz, J. R. G., Gruber, B., Lafourcade, B., Leitão, P. J., Münkemüller, T., Mcclean, C., Osborne, P. E., Reineking, B., Schröder, B., Skidmore, A. K., Zurell, D., and Lautenbach, S.: Collinearity: a review of methods to deal with it and a simulation study evaluating their performance, Ecography, 36, 27–46, https://doi.org/10.1111/J.1600-0587.2012.07348.X, 2013.
Erez, J.: The Source of Ions for Biomineralization in Foraminifera and Their Implications for Paleoceanographic Proxies, Rev. Mineral. Geochem., 54, 115–149, https://doi.org/10.2113/0540115, 2003.
Etheridge, D. M., Steele, L. P., Langenfelds, R. L., Francey, R. J., Barnola, J. M., and Morgan, V. I.: Natural and anthropogenic changes in atmospheric CO2 over the last 1000 years from air in Antarctic ice and firn, J. Geophys. Res.-Atmos., 101, 4115–4128, https://doi.org/10.1029/95JD03410, 1996.
Gaskell, D. E., Ohman, M. D., and Hull, P. M.: Zooglider-Based Measurements of Planktonic Foraminifera in the California Current System, J. Foramin. Res., 49, 390–404, https://doi.org/10.2113/GSJFR.49.4.390, 2019.
Gelman, A., Goodrich, B., Gabry, J., and Vehtari, A.: R-squared for Bayesian Regression Models, Am. Stat., 73, 307–309, https://doi.org/10.1080/00031305.2018.1549100, 2019.
Gerecht, A. C., Šupraha, L., Langer, G., and Henderiks, J.: Phosphorus limitation and heat stress decrease calcification in Emiliania huxleyi, Biogeosciences, 15, 833–845, https://doi.org/10.5194/bg-15-833-2018, 2018.
Gonzalez-Mora, B., Sierro, F. J., and Flores, J. A.: Controls of shell calcification in planktonic foraminifers, Quaternary Sci. Rev., 27, 956–961, https://doi.org/10.1016/j.quascirev.2008.01.008, 2008.
Harrison, X. A., Donaldson, L., Correa-Cano, M. E., Evans, J., Fisher, D. N., Goodwin, C. E. D., Robinson, B. S., Hodgson, D. J., and Inger, R.: A brief introduction to mixed effects modelling and multi-model inference in ecology, PeerJ, 6, e4794, https://doi.org/10.7717/PEERJ.4794/FIG-3, 2018.
Hathorne, E. C., Gagnon, A., Felis, T., Adkins, J., Asami, R., Boer, W., Caillon, N., Case, D., Cobb, K. M., Douville, E., Demenocal, P., Eisenhauer, A., Garbe-Schönberg, D., Geibert, W., Goldstein, S., Hughen, K., Inoue, M., Kawahata, H., Kölling, M., Cornec, F. L., Linsley, B. K., McGregor, H. V., Montagna, P., Nurhati, I. S., Quinn, T. M., Raddatz, J., Rebaubier, H., Robinson, L., Sadekov, A., Sherrell, R., Sinclair, D., Tudhope, A. W., Wei, G., Wong, H., Wu, H. C., and You, C. F.: Interlaboratory study for coral Sr/Ca and other element/Ca ratio measurements, Geochem. Geophy. Geosy., 14, 3730–3750, https://doi.org/10.1002/GGGE.20230, 2013.
Henehan, M. J., Evans, D., Shankle, M., Burke, J. E., Foster, G. L., Anagnostou, E., Chalk, T. B., Stewart, J. A., Alt, C. H. S., Durrant, J., and Hull, P. M.: Size-dependent response of foraminiferal calcification to seawater carbonate chemistry, Biogeosciences, 14, 3287–3308, https://doi.org/10.5194/bg-14-3287-2017, 2017.
van Heuven, S., Pierrot, D., Rae, J. W. B., Lewis, E., and Wallace, D. W. R.: MATLAB Program Developed for CO2 System Calculations, ORNL/CDIAC-105b, Carbon Dioxide Information Analysis Center, 2011.
Hoffman, M. D. and Gelman, A.: The No-U-Turn Sampler: Adaptively Setting Path Lengths in Hamiltonian Monte Carlo, J. Mach. Learn. Res., 15, 1593–1623, 2014.
IOC, SCOR, and IAPSO: The International Thermodynamic Equation of Seawater – 2010: Calculation and use of thermodynamic properties, Intergovernmental Oceanographic Commission, Manuals and Guides No. 56, UNESCO (English), 196 pp., https://www.teos-10.org/pubs/TEOS-10_Manual.pdf (last access: 7 February 2025), 2010.
IPCC: Summary for Policymakers, in: Climate Change 2021: The Physical Science Basis. Contribution of Working Group I to the Sixth Assessment Report of the Intergovernmental Panel on Climate Change, edited by: Masson-Delmotte, V., Zhai, P., Pirani, A., Connors, S. L., Péan, C., Berger, S., Caud, N., Chen, Y., Goldfarb, L., Gomis, M. I., Huang, M., Leitzell, K., Lonnoy, E., Matthews, J. B. R., Maycock, T. K., Waterfield, T., Yelekçi, O., Yu, R., and Zhou, B., Cambridge University Press, Cambridge, United Kingdom and New York, NY, USA, https://doi.org/10.1017/9781009157896, 2021.
IPCC: Climate Change 2022: Impacts, Adaptation, and Vulnerability. Contribution of Working Group II to the Sixth Assessment Report of the Intergovernmental Panel on Climate Change, edited by: Pörtner, H. O., Roberts, D. C., Tignor, M., Poloczanska, E. S., Mintenbeck, K., Alegría, A., Craig, M., Langsdorf, S., Löschke, S., Möller, V., Okem, A., and Rama, B., Cambridge, UK and New York, NY, USA, https://doi.org/10.1017/9781009325844, 2022.
Jiang, L. Q., Dunne, J., Carter, B. R., Tjiputra, J. F., Terhaar, J., Sharp, J. D., Olsen, A., Alin, S., Bakker, D. C. E., Feely, R. A., Gattuso, J. P., Hogan, P., Ilyina, T., Lange, N., Lauvset, S. K., Lewis, E. R., Lovato, T., Palmieri, J., Santana-Falcón, Y., Schwinger, J., Séférian, R., Strand, G., Swart, N., Tanhua, T., Tsujino, H., Wanninkhof, R., Watanabe, M., Yamamoto, A., and Ziehn, T.: Global Surface Ocean Acidification Indicators From 1750 to 2100, J. Adv. Model. Earth Syst., 15, e2022MS003563, https://doi.org/10.1029/2022MS003563, 2023.
Jørgensen, B. B., Erez, J., Revsbech, P., and Cohen, Y.: Symbiotic photosynthesis in a planktonic foraminiferan, Globigerinoides sacculifer (Brady), studied with microelectrodes1, Limnol. Oceanogr., 30, 1253–1267, https://doi.org/10.4319/LO.1985.30.6.1253, 1985.
Kinsey, D. W. and Davies, P. J.: Effects of elevated nitrogen and phosphorus on coral reef growth, Limnol. Oceanogr., 24, 935–940, https://doi.org/10.4319/LO.1979.24.5.0935, 1979.
Kohfeld, K. E., Fairbanks, R. G., Smith, S. L., and Walsh, I. D.: Neogloboquadrina pachyderma (sinistral coiling) as paleoceanographic tracers in polar oceans: Evidence from northeast water polynya plankton tows, sediment traps, and surface sediments, Paleoceanography, 11, 679–699, https://doi.org/10.1029/96PA02617, 1996.
Köhler-Rink, S. and Kühl, M.: The chemical microenvironment of the symbiotic planktonic foraminifer Orbulina universa, Mar. Biol. Res., 1, 68–78, https://doi.org/10.1080/17451000510019015, 2005.
Kolzenburg, R., Moreira, H., Storey, C., and Ragazzola, F.: Structural integrity and skeletal trace elements in intertidal coralline algae across the Northeast Atlantic reveal a distinct separation of the leading and the trailing edge populations, Mar. Environ. Res., 190, 106086, https://doi.org/10.1016/J.MARENVRES.2023.106086, 2023.
Langer, M. R.: Assessing the contribution of foraminiferan protists to global ocean carbonate production, J. Eukaryot. Microbiol., 55, 163–169, https://doi.org/10.1111/J.1550-7408.2008.00321.X, 2008.
Lastam, J., Griesshaber, E., Yin, X., Rupp, U., Sánchez-Almazo, I., Heß, M., Walther, P., Checa, A., and Schmahl, W. W.: The unique fibrilar to platy nano- and microstructure of twinned rotaliid foraminiferal shell calcite, Sci. Rep., 13, 2189, https://doi.org/10.1038/s41598-022-25082-9, 2023.
Lauvset, S. K., Lange, N., Tanhua, T., Bittig, H. C., Olsen, A., Kozyr, A., Alin, S., Álvarez, M., Azetsu-Scott, K., Barbero, L., Becker, S., Brown, P. J., Carter, B. R., Da Cunha, L. C., Feely, R. A., Hoppema, M., Humphreys, M. P., Ishii, M., Jeansson, E., Jiang, L. Q., Jones, S. D., Lo Monaco, C., Murata, A., Müller, J. D., Pérez, F. F., Pfeil, B., Schirnick, C., Steinfeldt, R., Suzuki, T., Tilbrook, B., Ulfsbo, A., Velo, A., Woosley, R. J., and Key, R. M.: GLODAPv2.2022: the latest version of the global interior ocean biogeochemical data product, Earth Syst. Sci. Data, 14, 5543–5572, https://doi.org/10.5194/essd-14-5543-2022, 2022.
LeKieffre, C., Spero, H. J., Russell, A. D., Fehrenbacher, J. S., Geslin, E., and Meibom, A.: Assimilation, translocation, and utilization of carbon between photosynthetic symbiotic dinoflagellates and their planktic foraminifera host, Mar. Biol., 165, 104, https://doi.org/10.1007/s00227-018-3362-7, 2018.
Leung, J. Y. S., Zhang, S., Connell, S. D., Leung, J. Y. S., Zhang, S., and Connell, S. D.: Is Ocean Acidification Really a Threat to Marine Calcifiers? A Systematic Review and Meta-Analysis of 980+ Studies Spanning Two Decades, Small, 18, 2107407, https://doi.org/10.1002/SMLL.202107407, 2022.
Lewis, E., Wallace, D., and Allison, L. J.: Program developed for CO2 system calculations (No. ORNL/CDIAC-105), Brookhaven National Lab., Dept. of Applied Science, Upton, NY (United States), Oak Ridge National Lab., Carbon Dioxide Information Analysis Center, TN (United States), https://www.ncei.noaa.gov/access/ocean-carbon-acidification-data-system/oceans/CO2SYS/co2rprt.html (last access: 7 February 2025), 1998.
Lin, Y. P. and Singer, P. C.: Inhibition of calcite precipitation by orthophosphate: Speciation and thermodynamic considerations, Geochim. Cosmochim. Ac., 70, 2530–2539, https://doi.org/10.1016/J.GCA.2006.03.002, 2006.
Lohmann, G. P.: A model for variation in the chemistry of planktonic foraminifera due to secondary calcification and selective dissolution, Paleoceanography, 10, 445–457, https://doi.org/10.1029/95PA00059, 1995.
Lombard, F., Labeyrie, L., Michel, E., Spero, H. J., and Lea, D. W.: Modelling the temperature dependent growth rates of planktic foraminifera, Mar. Micropaleontol., 70, 1–7, https://doi.org/10.1016/j.marmicro.2008.09.004, 2009.
Lombard, F., da Rocha, R. E., Bijma, J., and Gattuso, J. P.: Effect of carbonate ion concentration and irradiance on calcification in planktonic foraminifera, Biogeosciences, 7, 247–255, https://doi.org/10.5194/bg-7-247-2010, 2010.
MacFarling Meure, C., Etheridge, D., Trudinger, C., Steele, P., Langenfelds, R., Van Ommen, T., Smith, A., and Elkins, J.: Law Dome CO2, CH4 and N2O ice core records extended to 2000 years BP, Geophys. Res. Lett., 33, L14810, https://doi.org/10.1029/2006GL026152, 2006.
Mallo, M., Ziveri, P., Graham Mortyn, P., Schiebel, R., and Grelaud, M.: Low planktic foraminiferal diversity and abundance observed in a spring 2013 west-east Mediterranean Sea plankton tow transect, Biogeosciences, 14, 2245–2266, https://doi.org/10.5194/bg-14-2245-2017, 2017.
Manno, C., Morata, N., and Bellerby, R.: Effect of ocean acidification and temperature increase on the planktonic foraminifer Neogloboquadrina pachyderma (sinistral), Polar Biol., 35, 1311–1319, https://doi.org/10.1007/s00300-012-1174-7, 2012.
Marcoulides, K. M. and Raykov, T.: Evaluation of Variance Inflation Factors in Regression Models Using Latent Variable Modeling Methods, Educ. Psychol. Meas., 79, 874–882, https://doi.org/10.1177/0013164418817803, 2019.
Marr, J. P., Baker, J. A., Carter, L., Allan, A. S. R., Dunbar, G. B., and Bostock, H. C.: Ecological and temperature controls on ratios of Globigerina bulloides from the southwest Pacific Ocean, Paleoceanography, 26, PA2209, https://doi.org/10.1029/2010PA002059, 2011.
Marshall, B. J., Thunell, R. C., Henehan, M. J., Astor, Y., and Wejnert, K. E.: Planktonic foraminiferal area density as a proxy for carbonate ion concentration: A calibration study using the Cariaco Basin ocean time series, Paleoceanography, 28, 363–376, https://doi.org/10.1002/palo.20034, 2013.
McDougall, T. J. and Barker, P. M.: Getting started with TEOS-10 and the Gibbs seawater (GSW) oceanographic toolbox, 28 pp., SCOR/IAPSO WG127, ISBN 978-0-646-55621-5, https://www.teos-10.org/pubs/Getting_Started.pdf (last access: 13 November 2023), 2011.
Mikis, A., Hendry, K. R., Pike, J., Schmidt, D. N., Edgar, K. M., Peck, V., Peeters, F. J. C., Leng, M. J., Meredith, M. P., Jones, C. L. C., Stammerjohn, S., and Ducklow, H.: Temporal variability in foraminiferal morphology and geochemistry at the West Antarctic Peninsula: A sediment trap study, Biogeosciences, 16, 3267–3282, https://doi.org/10.5194/bg-16-3267-2019, 2019.
de Moel, H., Ganssen, G. M., Peeters, F. J. C., Jung, S. J. A., Kroon, D., Brummer, G. J. A., and Zeebe, R. E.: Planktic foraminiferal shell thinning in the arabian sea due to anthropogenic ocean acidification?, Biogeosciences, 6, 1917–1925, https://doi.org/10.5194/bg-6-1917-2009, 2009.
Morard, R., Darling, K. F., Weiner, A. K. M., Hassenrück, C., Vanni, C., Cordier, T., Henry, N., Greco, M., Vollmar, N. M., Milivojevic, T., Rahman, S. N., Siccha, M., Meilland, J., Jonkers, L., Quillévéré, F., Escarguel, G., Douady, C. J., Garidel-Thoron, T. de, Vargas, C. de, and Kucera, M.: The global genetic diversity of planktonic foraminifera reveals the structure of cryptic speciation in plankton, Biol. Rev., 99, 1218–1241, https://doi.org/10.1111/BRV.13065, 2024.
Moy, A. D., Howard, W. R., Bray, S. G., and Trull, T. W.: Reduced calcification in modern Southern Ocean planktonic foraminifera, Nat. Geosci., 2, 276–280, https://doi.org/10.1038/ngeo460, 2009.
Mulitza, S., Dürkoop, A., Hale, W., Wefer, G., and Niebler, H. S.: Planktonic foraminifera as recorders of past surface-water stratification, Geology, 25, 335–338, 1997.
Naik, S. S., Naidu, P. D., Govil, P., and Godad, S.: Relationship between weights of planktonic foraminifer shell and surface water CO3 = concentration during the Holocene and Last Glacial Period, Mar. Geol., 275, 278–282, https://doi.org/10.1016/j.margeo.2010.05.004, 2010.
Naik, S. S., Godad, S. P., and Naidu, D. P.: Does carbonate ion control planktonic foraminifera shell calcification in upwelling regions?, Curr. Sci., 101, 1370–1375, 2011.
Nehrke, G., Keul, N., Langer, G., de Nooijer, L. J., Bijma, J., and Meibom, A.: A new model for biomineralization and trace-element signatures of Foraminifera tests, Biogeosciences, 10, 6759–6767, https://doi.org/10.5194/bg-10-6759-2013, 2013.
Neukermans, G., Bach, L. T., Butterley, A., Sun, Q., Claustre, H., and Fournier, G. R.: Quantitative and mechanistic understanding of the open ocean carbonate pump – perspectives for remote sensing and autonomous in situ observation, Earth-Sci. Rev., 239, 104359, https://doi.org/10.1016/J.EARSCIREV.2023.104359, 2023.
de Nooijer, L. J., Toyofuku, T., Kitazato, H., and Stanley, S. M.: Foraminifera promote calcification by elevating their intracellular pH, P. Natl. Acad. Sci. USA, 106, 15374–15378, 2009.
de Nooijer, L. J., Spero, H. J., Erez, J., Bijma, J., and Reichart, G. J.: Biomineralization in perforate foraminifera, Earth-Sci. Rev., 135, 48–58, https://doi.org/10.1016/j.earscirev.2014.03.013, 2014.
Ortiz, J. D., Mix, A. C., and Collier, R. W.: Environmental control of living symbiotic and asymbiotic foraminifera of the California Current, Paleoceanography, 10, 987–1009, https://doi.org/10.1029/95PA02088, 1995.
Osborne, E. B., Thunell, R. C., Marshall, B. J., Holm, J. A., Tappa, E. J., Benitez-Nelson, C., Cai, W. J., and Chen, B.: Calcification of the planktonic foraminifera Globigerina bulloides and carbonate ion concentration: Results from the Santa Barbara Basin, Paleoceanography, 31, 1083–1102, https://doi.org/10.1002/2016PA002933, 2016.
Paasche, E. and Brubak, S.: Enhanced calcification in the coccolithophorid Emiliania huxleyi (Haptophyceae) under phosphorus limitation, Phycologia, 33, 324–330, https://doi.org/10.2216/I0031-8884-33-5-324.1, 1994.
Pak, D. K., Hendy, I. L., Weaver, J. C., Schimmelmann, A., and Clayman, L.: Foraminiferal proxy response to ocean temperature variability and acidification over the last 150 years in the Santa Barbara Basin (California), Quaternary Int., 469, 141–150, https://doi.org/10.1016/J.QUAINT.2016.07.049, 2018.
Pallacks, S., Ziveri, P., Schiebel, R., Vonhof, H., Rae, J. W. B., Littley, E., Garcia-Orellana, J., Langer, G., Grelaud, M., and Martrat, B.: Anthropogenic acidification of surface waters drives decreased biogenic calcification in the Mediterranean Sea, Commun. Earth Environ., 4, 1–10, https://doi.org/10.1038/s43247-023-00947-7, 2023.
Qin, B., Li, T., Xiong, Z., Algeo, T. J., and Jia, Q.: Calcification of planktonic foraminifer Pulleniatina obliquiloculata controlled by seawater temperature rather than ocean acidification, Glob. Planet. Change, 193, 103256, https://doi.org/10.1016/J.GLOPLACHA.2020.103256, 2020.
R Core Team: R: A language and environment for statistical computing, R Foundation for Statistical Computing, https://www.r-project.org/ (last access: 10 November 2023), 2018.
Rillo, M. C., Miller, C. G., Kuèera, M., and Ezard, T. H. G.: Intraspecific size variation in planktonic foraminifera cannot be consistently predicted by the environment, Ecol. Evol., 10, 11579–11590, https://doi.org/10.1002/ECE3.6792, 2020.
Rink, S., Kühl, M., Bijma, J., and Spero, H. J.: Microsensor studies of photosynthesis and respiration in the symbiotic foraminifer Orbulina universa, Mar. Biol., 131, 583–595, https://doi.org/10.1007/s002270050350, 1998.
Rosenthal, Y., Perron-Cashman, S., Lear, C. H., Bard, E., Barker, S., Billups, K., Bryan, M., Delaney, M. L., DeMenocal, P. B., Dwyer, G. S., Elderfield, H., German, C. R., Greaves, M., Lea, D. W., Marchitto, T. M., Pak, D. K., Paradis, G. L., Russell, A. D., Schneider, R. R., Scheiderich, K., Stott, L., Tachikawa, K., Tappa, E., Thunell, R., Wara, M., Weldeab, S., and Wilson, P. A.: Interlaboratory comparison study of and measurements in planktonic foraminifera for paleoceanographic research, Geochem. Geophy. Geosy., 5, Q04D09, https://doi.org/10.1029/2003GC000650, 2004.
Russell, A. D., Hönisch, B., Spero, H. J., and Lea, D. W.: Effects of seawater carbonate ion concentration and temperature on shell U, Mg, and Sr in cultured planktonic foraminifera, Geochim. Cosmochim. Ac., 68, 4347–4361, https://doi.org/10.1016/j.gca.2004.03.013, 2004.
Schiebel, R.: Planktic foraminiferal sedimentation and the marine calcite budget, Global Biogeochem. Cy., 16, 3-1–3-21, https://doi.org/10.1029/2001gb001459, 2002.
Schiebel, R. and Hemleben, C.: Planktic Foraminifers in the Modern Ocean, Springer, Berlin, 154 pp., https://doi.org/10.1007/978-3-662-50297-6_1, 2017.
Schindelin, J., Arganda-Carreras, I., Frise, E., Kaynig, V., Longair, M., Pietzsch, T., Preibisch, S., Rueden, C., Saalfeld, S., Schmid, B., Tinevez, J. Y., White, D. J., Hartenstein, V., Eliceiri, K., Tomancak, P., and Cardona, A.: Fiji: an open-source platform for biological-image analysis, Nat. Method., 9, 676–682, https://doi.org/10.1038/nmeth.2019, 2012.
Schmidt, D. N., Renaud, S., Bollmann, J., Schiebel, R., and Thierstein, H. R.: Size distribution of Holocene planktic foraminifer assemblages: Biogeography, ecology and adaptation, Mar. Micropaleontol., 50, 319–338, https://doi.org/10.1016/S0377-8398(03)00098-7, 2004.
Schmidt, D. N., Elliott, T., and Kasemann, S. A.: The influences of growth rates on planktic foraminifers as proxies for palaeostudies – A review, Geol. Soc. Spec. Publ., 303, 73–85, https://doi.org/10.1144/SP303.6, 2008.
Song, Q., Qin, B., Tang, Z., Liu, Y., Chen, Z., Guo, J., Xiong, Z., and Li, T.: Calcification of planktonic foraminifer Neogloboquadrina pachyderma (sinistral) controlled by seawater temperature rather than ocean acidification in the Antarctic Zone of modern Sothern Ocean, Sci. China Earth Sci., 65, 1824–1836, https://doi.org/10.1007/S11430-021-9924-7, 2022.
Spero, H. J., Lerche, I., and Williams, D. F.: Opening the carbon isotope “vital effect” black box, 2, Quantitative model for interpreting foraminiferal carbon isotope data, Paleoceanography, 6, 639–655, https://doi.org/10.1029/91PA02022, 1991.
Spindler, M., Hemleben, C., Salomons, J. B., and Smit, L. P.: Feeding behavior of some planktonic foraminifers in laboratory cultures, J. Foraminifer. Res., 14, 237–249, https://doi.org/10.2113/GSJFR.14.4.237, 1984.
Takahashi, T., Sutherland, S. C., Chipman, D. W., Goddard, J. G., and Ho, C.: Climatological distributions of pH, pCO2, total CO2, alkalinity, and CaCO3 saturation in the global surface ocean, and temporal changes at selected locations, Mar. Chem., 164, 95–125, https://doi.org/10.1016/J.MARCHEM.2014.06.004, 2014.
Toyofuku, T., Matsuo, M. Y., De Nooijer, L. J., Nagai, Y., Kawada, S., Fujita, K., Reichart, G. J., Nomaki, H., Tsuchiya, M., Sakaguchi, H., and Kitazato, H.: Proton pumping accompanies calcification in foraminifera, Nat. Commun., 8, 1–6, https://doi.org/10.1038/ncomms14145, 2017.
Troupin, C., Barth, A., Sirjacobs, D., Ouberdous, M., Brankart, J. M., Brasseur, P., Rixen, M., Alvera-Azcárate, A., Belounis, M., Capet, A., Lenartz, F., Toussaint, M. E., and Beckers, J. M.: Generation of analysis and consistent error fields using the Data Interpolating Variational Analysis (DIVA), Ocean Model., 52/53, 90–101, https://doi.org/10.1016/J.OCEMOD.2012.05.002, 2012.
Vehtari, A., Gelman, A., and Gabry, J.: loo: Efficient Leave-One-Out Cross-Validation and WAIC for Bayesian Models, R Package Version 1.1.0, https://github.com/stan-dev/loo (last access: 17 January 2024), 2017.
de Villiers, S.: Optimum growth conditions as opposed to calcite saturation as a control on the calcification rate and shell-weight of marine foraminifera, Mar. Biol., 144, 45–49, https://doi.org/10.1007/s00227-003-1183-8, 2004.
Waterson, A. M., Edgar, K. M., Schmidt, D. N., and Valdes, P. J.: Quantifying the stability of planktic foraminiferal physical niches between the Holocene and Last Glacial Maximum, Paleoceanography, 32, 74–89, https://doi.org/10.1002/2016PA002964, 2017.
Weinkauf, M. F. G., Moller, T., Koch, M. C., and Kuèera, M.: Calcification intensity in planktonic Foraminifera reflects ambient conditions irrespective of environmental stress, Biogeosciences, 10, 6639–6655, https://doi.org/10.5194/bg-10-6639-2013, 2013.
Weinkauf, M. F. G., Kunze, J. G., Waniek, J. J., and Kuèera, M.: Seasonal Variation in Shell Calcification of Planktonic Foraminifera in the NE Atlantic Reveals Species-Specific Response to Temperature, Productivity, and Optimum Growth Conditions, PLoS One, 11, e0148363, https://doi.org/10.1371/journal.pone.0148363, 2016.
Zarkogiannis, S. D., Antonarakou, A., Tripati, A., Kontakiotis, G., Mortyn, P. G., Drinia, H., and Greaves, M.: Influence of surface ocean density on planktonic foraminifera calcification, Sci. Rep., 9, 1–10, https://doi.org/10.1038/s41598-018-36935-7, 2019.
Zarkogiannis, S. D., Kontakiotis, G., Gkaniatsa, G., Kuppili, V. S. C., Marathe, S., Wanelik, K., Lianou, V., Besiou, E., Makri, P., and Antonarakou, A.: An Improved Cleaning Protocol for Foraminiferal Calcite from Unconsolidated Core Sediments: HyPerCal – A New Practice for Micropaleontological and Paleoclimatic Proxies, J. Mar. Sci. Eng., 8, 998, https://doi.org/10.3390/JMSE8120998, 2020.