the Creative Commons Attribution 4.0 License.
the Creative Commons Attribution 4.0 License.
 | 23 Feb 2018
Sources, fluxes, and behaviors of fluorescent dissolved organic matter (FDOM) in the Nakdong River Estuary, Korea
Shin-Ah Lee
We monitored seasonal variations in dissolved organic carbon (DOC), the stable carbon isotope of DOC (δ13C-DOC), and fluorescent dissolved organic matter (FDOM) in water samples from a fixed station in the Nakdong River Estuary, Korea. Sampling was performed every hour during spring tide once a month from October 2014 to August 2015. The concentrations of DOC and humic-like FDOM showed significant negative correlations against salinity (r2= 0.42–0.98, p < 0.0001), indicating that the river-originated DOM components were the major source and behave conservatively in the estuarine mixing zone. The extrapolated δ13C-DOC values (−27.5 to −24.5 ‰) in fresh water confirm that both components are mainly of terrestrial origin. The slopes of humic-like FDOM against salinity were 60–80 % higher in the summer and fall due to higher terrestrial production of humic-like FDOM. The slopes of protein-like FDOM against salinity, however, were 70–80 % higher in spring due to higher biological production in river water. Our results suggest that there are large seasonal changes in riverine fluxes of humic- and protein-like FDOM to the ocean.
- Article
(3175 KB) - Full-text XML
-
Supplement
(237 KB) - BibTeX
- EndNote


The global annual flux of dissolved organic carbon (DOC) via rivers is approximately 0.17–0.36 × 10¹⁵ g (Meybeck, 1982; Ludwig et al., 1996; Dai et al., 2012). The DOC delivered from riverine discharges and in situ production through biological activities significantly affects carbon and biogeochemical cycles in coastal waters (Hedges, 1992; Bianchi et al., 2004; Bauer et al., 2013; Moyer et al., 2015).
Generally, DOC includes fluorescent dissolved organic matter (FDOM), which emits fluorescent light due to its chemical characteristics. As FDOM accounts for 20–70 % of the DOC in coastal waters (Coble, 2007) and controls the penetration of harmful UV radiation in the euphotic zone, it plays a critical role in carbon cycles and biological production. In addition, FDOM is known as a powerful indicator of humic- and protein-like substances (Coble, 2007) in coastal waters. River discharge is generally the main source of humic-like FDOM in coastal waters, although it is also produced through in situ microbial activity (Romera-Castillo et al., 2011). In contrast, protein-like FDOM is known to be from biological production and anthropogenic sources (Baker and Spencer, 2004). Terrestrial humic substances behave conservatively in coastal areas due to their refractory characteristics (Del Castillo et al., 2000), whereas protein substances behave non-conservatively in many estuaries due to their relatively rapid production and degradation (Vignudelli et al., 2004).
The magnitudes of DOC and FDOM fluxes from rivers are generally dependent on rainfall, discharge, and temperature (Maie et al., 2006; Jaffé et al., 2004; Huang and Chen, 2009). In the estuarine mixing zone, intensive biogeochemical processes occur through photooxidation, microbial degradation, or physicochemical transformations (i.e., flocculation, sedimentation; Bauer and Bianchi, 2011; Moran et al., 1991; Benner and Opsahl, 2001; Raymond and Bauer, 2001). Recent studies have demonstrated large seasonal variations as high as 40 % in DOC export from rivers to the ocean (Burns et al., 2008; Bianchi et al., 2004; Dai et al., 2012). However, the seasonal variations in sources, fluxes, and behaviors of DOC and FDOM in the estuarine mixing zone are still poorly understood.
In this study, we analyzed DOC, δ13C-DOC, and FDOM in estuarine water samples collected monthly from the Nakdong River Estuary. Sampling was conducted at a fixed platform, which has been utilized for monitoring various environmental parameters. This sampling station is advantageous because we can collect water samples for a wide range of salinities throughout tidal fluctuations. Using the data obtained from this unique station, we were able to determine (1) the behaviors of DOM in the estuarine mixing zone, (2) the fluxes of DOM from rivers based on the slopes between salinities and DOM components, and (3) the changes in DOM sources using δ13C-DOC in the estuarine samples. The slope measurement in the mixing zone may represent the end-member of DOM components in rivers better than site-specific measurements in the river by integrating larger spaces and times.
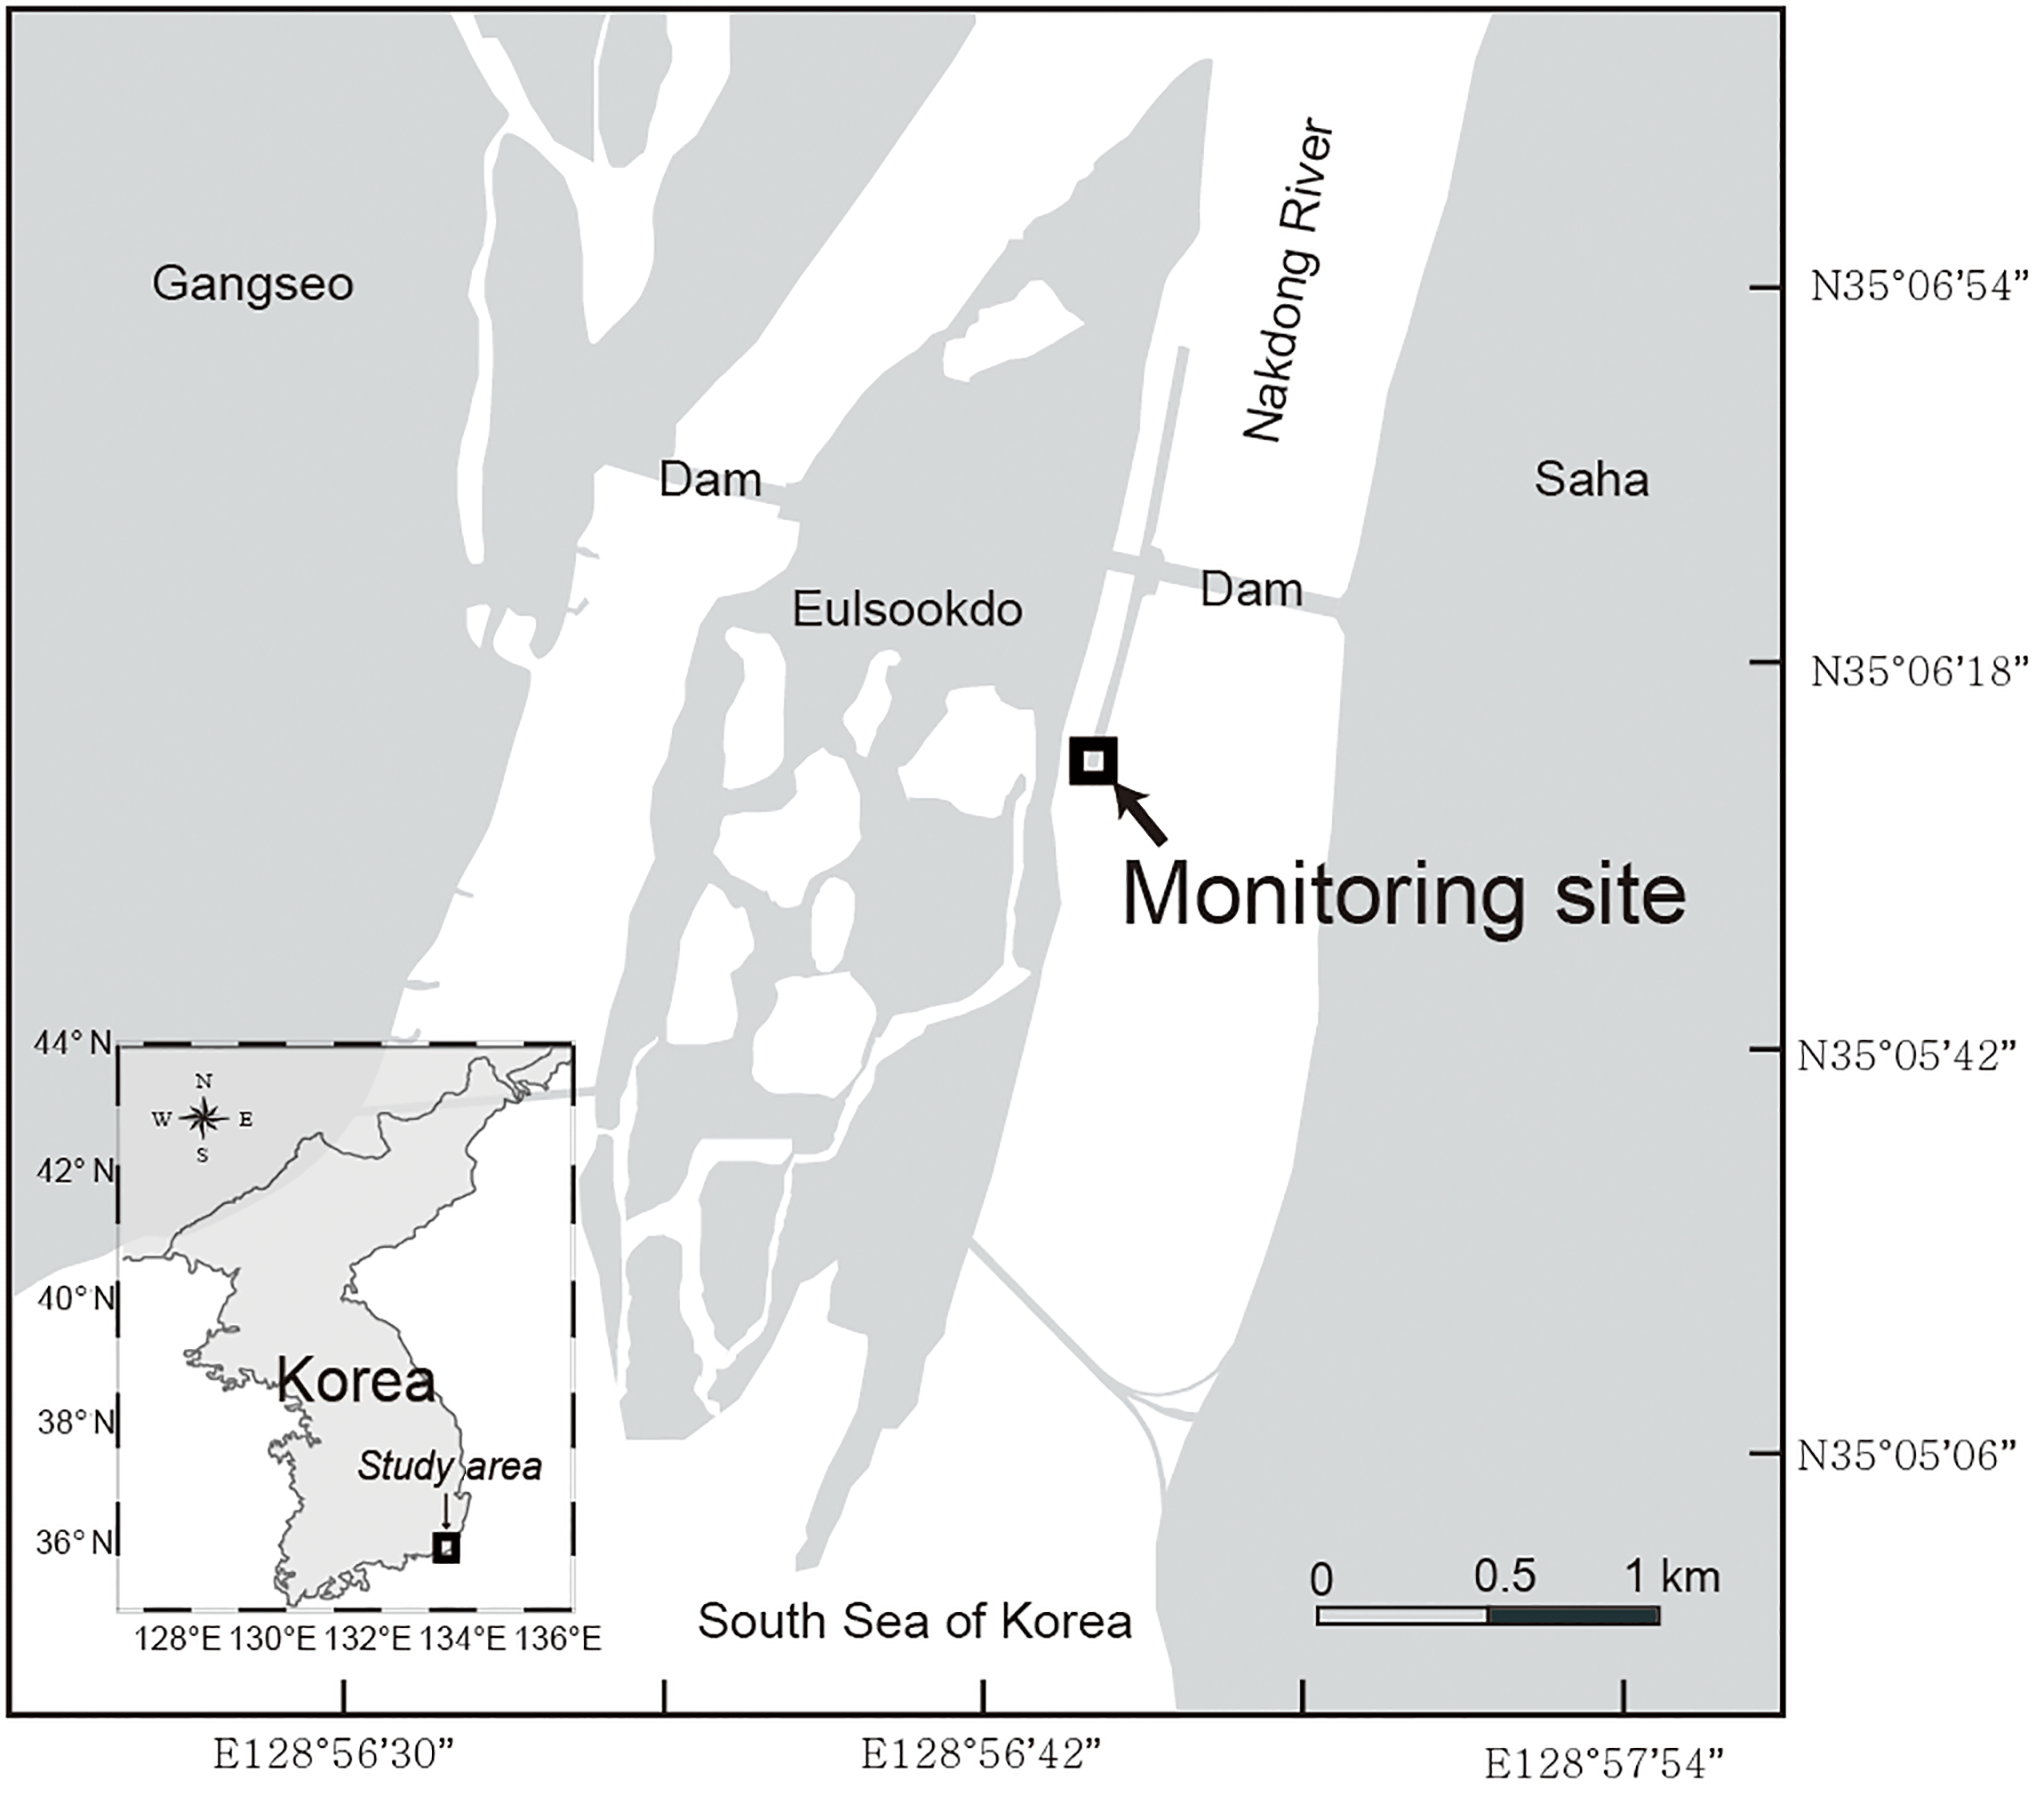
Figure 1Map of the Nakdong River Estuary. The square indicates a fixed monitoring site located 560 m downstream from the dam.
2.1 Study site
The Nakdong River Estuary, which is the estuary of the longest river in Korea, is a major source of water supplying the demand for drinking, agriculture, and industry. The main channel of Nakdong River is approximately 510 km in length with a watershed area of approximately 23 380 km2. It faces the southeastern coastal area of the Korean peninsula, passing through Busan, which is the second largest city in Korea. The mean annual precipitation is 1150 mm, and most precipitation (60–70 %) occurs during the summer monsoon and typhoon seasons (Jeong et al., 2007). To manage water supply and saltwater intrusion, estuary dams were constructed in the mouth of the river in 1987.
2.2 Sampling
Water samples were collected at the sampling site which is located 560 m downstream from the dam (Fig. 1). The sampling period was from October 2014 to August 2015. The 2 L water sampling was conducted every hour for 24 h during spring tide using an autosampler (RoboChem™ Autosampler, model S3-1224N; Centennial Technology, Korea), with a depth of the water intake 1 m below the surface. After samples were collected in acid-cleaned polyethylene bottles, they were moved to the laboratory within 24 h. All water samples were filtered using pre-combusted GF/F filters. The FDOM samples were stored in pre-combusted amber glass vials and kept below 4 ∘C in a refrigerator before analysis. The DOC and δ13C-DOC samples were acidified to pH ∼ 2 using 6 M HCl to avoid bacterial activities and stored in pre-combusted glass ampoules. Ampoules were fire-sealed to prevent the samples from any contamination. The samples were analyzed for DOC and CDOM within 1 week. Salinity was measured using a YSI Pro Series conductivity probe sensor in the laboratory. The real-time and compulsory discharge volume data from the dam are available at http://www.water.or.kr, as provided by K-Water. The monitoring program at this station is maintained by the Korea Environment Management Corporation (KOEM). The water temperature data are recorded automatically at the site. The data are available at https://www.koem.or.kr.
2.3 Analytical methods
The concentrations of DOC were determined by a high-temperature catalytic oxidation (HTCO) method using a TOC-VCPH analyzer (Shimadzu, Japan). Standardization was performed based on the calibration curve of acetanilide in ultra-pure water. The acidified samples were purged with CO2-free carrier gas for 2 min to remove inorganic carbon. The samples were then injected into a combustion column packed with Pt-coated alumina beads and heated to 720 ∘C. The CO2 evolving from combusted organic carbon was detected by a non-dispersive infrared detector (NDIR). Our DOC method was verified with deep seawater reference (DSR) samples for DOC (44–46 µmol L−1) produced by the University of Miami, USA.
The values of δ13C-DOC were measured using a TOC-IRMS instrument consisting of an IRMS instrument coupled with a Vario TOC cube (Isoprime; Elementar, Germany). The TOC instrument uses a common high-temperature catalytic combustion method (Kirkels et al., 2014). The analytical method is fully described in Kim et al. (2015). Briefly, 10 mL of filtered sample was purged with O2 gas for 20–30 min to completely remove DIC after the samples were acidified to pH ∼ 2. Then, 1 mL of the sample was injected into Pt-impregnated catalyst in a quartz tube. In this tube, the DOC was converted completely to CO2 at 750 ∘C, which was then fed through a water trap followed by a halogen trap. After DOC was detected by a NDIR detector, the CO2 gas entered the TOC-IRMS interface via the O2 carrier gas. In the interface, the CO2 was transferred to the IRMS instrument following the removal of any interfering gases. The δ13C-DOC value of blanks was measured using low-carbon water (LCW) from Hansell Lab (University of Miami), which contains less than 2 µM DOC. Certified IAEA-CH6 sucrose (International Atomic Energy Agency; −10.45 ± 0.03 ‰) prepared with the low-carbon water was used as a standard solution. A standard sample was analyzed for every sample queue (once before or after 10 samples) to check for a drifting effect during the measurements. The blank correction was performed using a method previously described in De Troyer et al. (2010) and Panetta et al. (2008). Our measurement result of δ13C-DOC for the DSR (University of Miami) was −21.5 ± 0.1 ‰ , which is consistent with the results reported by Panetta et al. (2008) and Lang et al. (2007). The reproducibility of TOC-IRMS was ∼ 0.3 ‰.
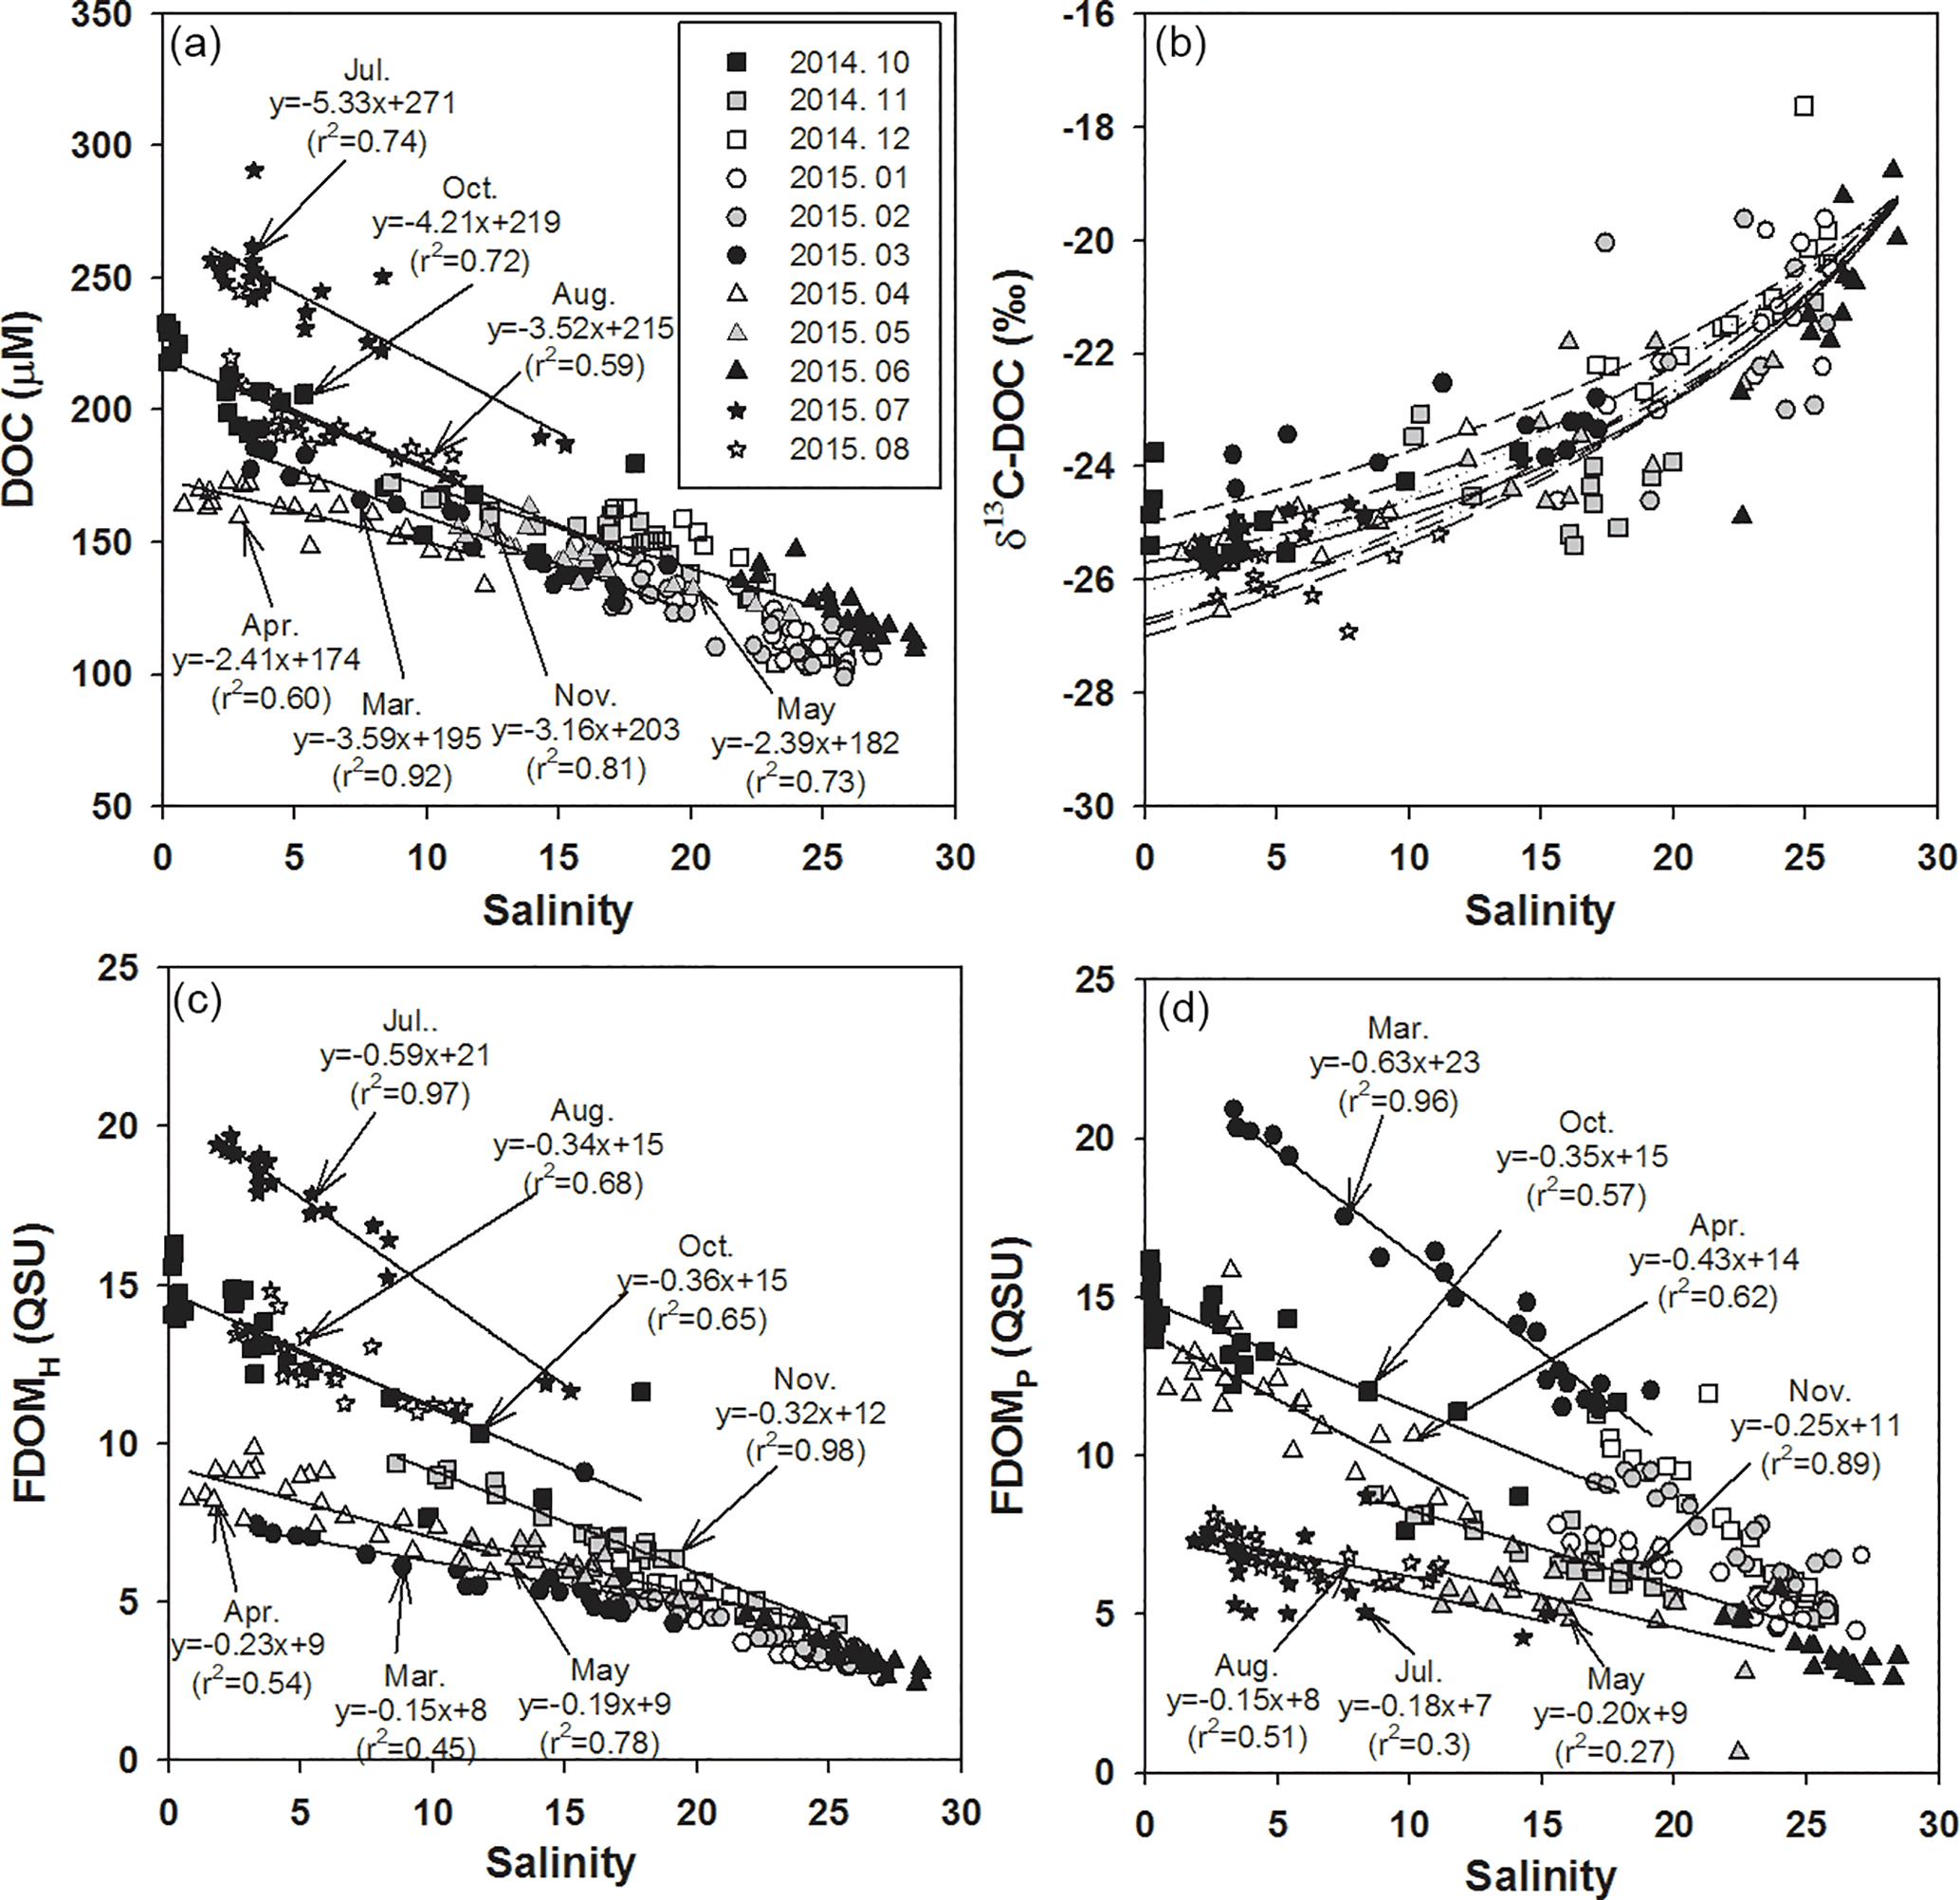
Figure 2Salinities versus the concentrations of (a) DOC, (b) δ13C-DOC, (c) FDOMH, and (d) FDOMP. The values for the regression lines are excluded for high-salinity periods (> 20), including December, January, February, and June, which have large uncertainties in extrapolation. The solid curve (b) is the average conservative mixing line for the two end-member mixing equations. The dotted lines represent the monthly changes in mixing lines for the different monthly end-member values.
FDOM fluorescence was determined in a scan mode using a spectrofluorometer (SCINCO FluoroMate FS-2) within 2 days after sampling. Emission (Em) spectra were collected from 250 to 600 nm at 2 nm intervals at excitation (Ex) wavelengths from 250 to 500 nm at 5 nm intervals. Backgrounds were subtracted for fresh distilled water prepared daily from the sample data to eliminate Raman scatter peaks (Zepp et al., 2004). All data were obtained in counts per second (cps) and converted to a ppb quinine sulfate standard solution in 0.1 N sulfuric acid at Ex ∕ Em of 350 ∕ 450 nm. The inner filter effect was negligible for these estuarine water samples since the correlation between the uncorrected and corrected values for the inner filter effect was very significant for the three identified peaks (r2 = 1, n = 5). EEMs–PARAFAC analysis was performed using a MATLAB R2013a program with a DOMFluor toolbox.
Salinities ranged from 0.1 to 28.5 over the sampling period of 1 year. Salinities in the sampling location were dependent primarily on the volume of river water discharge from the dam. The volumes of river discharge were relatively larger in October, April, July, and May. The mean annual surface water temperature was 16 ∘C, with the lowest temperature (average 8 ∘C) in December and the highest temperature in August (average 26 ∘C).
3.1 Behaviors and sources of DOC in the estuarine mixing zone
The concentrations of DOC ranged from 100 to 300 µM, with the highest concentrations in July (average 243 µM) and the lowest concentrations in February (average 115 µM), which is consistent with the typical DOC concentration ranges in coastal waters (Wang et al., 2004; Raymond and Bauer, 2001). The concentrations of DOC correlated significantly with salinities (r2= 0.59–0.92, p < 0.0001), indicating that DOC behaves conservatively in the mixing zone of this estuary (Fig. 2a), which is commonly observed in estuarine mixing zones (Laane, 1980; Mantoura and Woodward, 1983; Del Castillo et al., 2000; Clark et al., 2002; Jaffé et al., 2004).
If the high-salinity periods are excluded, both the slope and y intercept of DOC concentrations versus salinities were highest in July (Fig. 2), which could be due to a higher terrestrial DOC loading in the summer period, as observed in Horsens Fjord, Denmark (Markager et al., 2011). For this comparison, we excluded the high-salinity periods (> 20) December, January, February, and June, since they showed a narrow and low DOC concentration range (103–163 µM) resulting in large uncertainties, by extrapolating them to the fresh water.
The carbon isotope values in the Nakdong River Estuary ranged from −28.2 to −17.6 ‰ . In order to determine the source of DOC in fresh water, we plotted δ13C-DOC values against salinities (Fig. 2b). The conservative mixing curve of δ13C values can be obtained using the two end-member mixing equation (Spiker, 1980; Raymond and Bauer, 2001):
where δ13Cs, δ13Cr, and δ13Cm are the δ13C-DOC values at a given sample salinity, river end-member salinity, and marine end-member salinity, respectively; Fr is the riverine freshwater fraction calculated from the measured salinities; [DOC]s and [DOC]m are the DOC concentrations at a given salinity and marine end-member salinity, respectively; [DOC]r is the end-member DOC value for the river water (Fig. 2).
The riverine DOC end-member values (S = 0) ranged from 174 to 284 µM. The marine end-member value (S = 29) of DOC is 100 µM with the δ13C-DOC value of −19 ‰. If these values from each month are applied, the δ13C-DOC end-member values for the river water are extrapolated to be from −27.5 to −24.5 ‰ (average −26.2 ‰). Overall, the carbon isotope values of our samples fit well into the conservative mixing curve of the overall trend, with a slight change using different end-member values for different months (Fig. 2b). In general, δ13C-DOC values range from −22 to −18 ‰ for marine phytoplankton, from −34 to −23 ‰ for terrestrial C3 plants, and from −16 to −10 ‰ for terrestrial C4 plants (Gearing 1988; Clark and Fritz, 1997). Carbon isotope values in our study confirm that the main source of DOC in the estuarine mixing zone is dominantly from terrestrial C3 plants over all seasons. However, the value was heavier at lower salinity ranges (S < 10) in March and April samples, perhaps in association with the higher biological production in the river.
3.2 Behaviors and sources of FDOM in the estuarine mixing zone
Three components were identified in the water samples from the EEMs dataset. Based on the excitation–emission peak location, Component 1 (FDOMH, Ex ∕ Em = 320 ∕ 418 nm) is found to be a terrestrial humic-like component (C peak) shown by Coble (2007). Component 2 (FDOMP, Ex ∕ Em = 280 ∕ 328 nm) is found to be a tryptophan-like component (T peak), which is produced by microbial processes. Component 3 (Ex ∕ Em = 300, 325 ∕ 364 nm) is found to be a marine humic-like component (M peak). Since Component 3 values were significantly correlated with Component 1 (r2= 0.95) values, we simply focused on Component 1 (FDOMH) and Component 2 (FDOMP) for data interpretations.
The concentrations of FDOMH ranged from 2.4 to 19.7 quinine sulfate units (QSUs), with the highest concentration in July (average 17.6 QSU) and the lowest concentration in June (average 3.4 QSU; Fig. 2c). The concentrations of FDOMP ranged from 0.6 to 22.4 QSU, with the highest concentration in March (average 15.1 QSU) followed by October (average 13.6 QSU; Fig. 2d).
The concentrations of both FDOM components were significantly correlated with salinities (r2= 0.42–0.98, p< 0.0001 for FDOMH and r2= 0.27–0.96, p< 0.0001 for FDOMP), indicating that they are conservative in the mixing zone (Fig. 2). The slopes of FDOMH and FDOMP for each month ranged from −0.15 to −0.59 and −0.15 to −0.71, respectively. The higher FDOMH slopes in July and October were similar to the trend of DOC (Fig. 2c), which could be due to higher terrestrial FDOM production. However, the seasons (March and April) in which higher FDOMP slopes occurred differ from those of DOC and FDOMH, indicating that both FDOM components have different source inputs (Fig. 2d).

Figure 3Plots of the concentrations of DOC versus the concentrations of (a) FDOMH and (b) FDOMP.
Although there are large differences in the scattering of FDOM components against salinities, it is very difficult to compare scatterings for different seasons in order to discuss the different behaviors of DOM since the scattering is generally larger for the narrow salinity ranges. If the winter data are excluded, in March, during the highest biological production period in the river, the correlation coefficient against salinities was the highest for FDOMP and lowest for FDOMH. In contrast, in June, during the highest fluvial DOM discharge period, the correlation coefficient against salinities was the highest for FDOMH and lowest for FDOMP. This suggests that the biological production and removal, together with other generally known factors such as photodegradation and sedimentary inputs, may affect the scattering of these FDOM components in the estuarine mixing zone.
As such, there was a significant positive correlation between FDOMH and DOC concentrations throughout all sampling periods (r2= 0.93, p< 0.0001; Fig. 3a), suggesting that the main source of FDOMH and DOC is terrestrial based on δ13C-DOC values. Since FDOM does not usually contribute to a major portion of DOC, a positive correlation between FDOM and DOC has only been observed in specific areas, such as river estuarine systems (Del Vecchio and Blough, 2004; Coble, 2007). Stedmon et al. (2006) demonstrated that stronger correlations were observed between DOC and FDOM as humic substances derived from terrestrial DOM are more colored than DOM produced in situ. In general, terrestrial DOM occurring in rivers originates mainly from plant decomposition and leaf litter in the form of humic substances (Huang and Chen, 2009). As such, Gueguen et al. (2006) showed that humic materials are more effectively leached from soils during August and September under high temperatures. Thus, higher FDOMH slopes in August, October, and November relative to the other periods could be associated with higher terrestrial inputs of degradation products of soil organic matter (Dowell, 1985; Qualls et al., 1991).
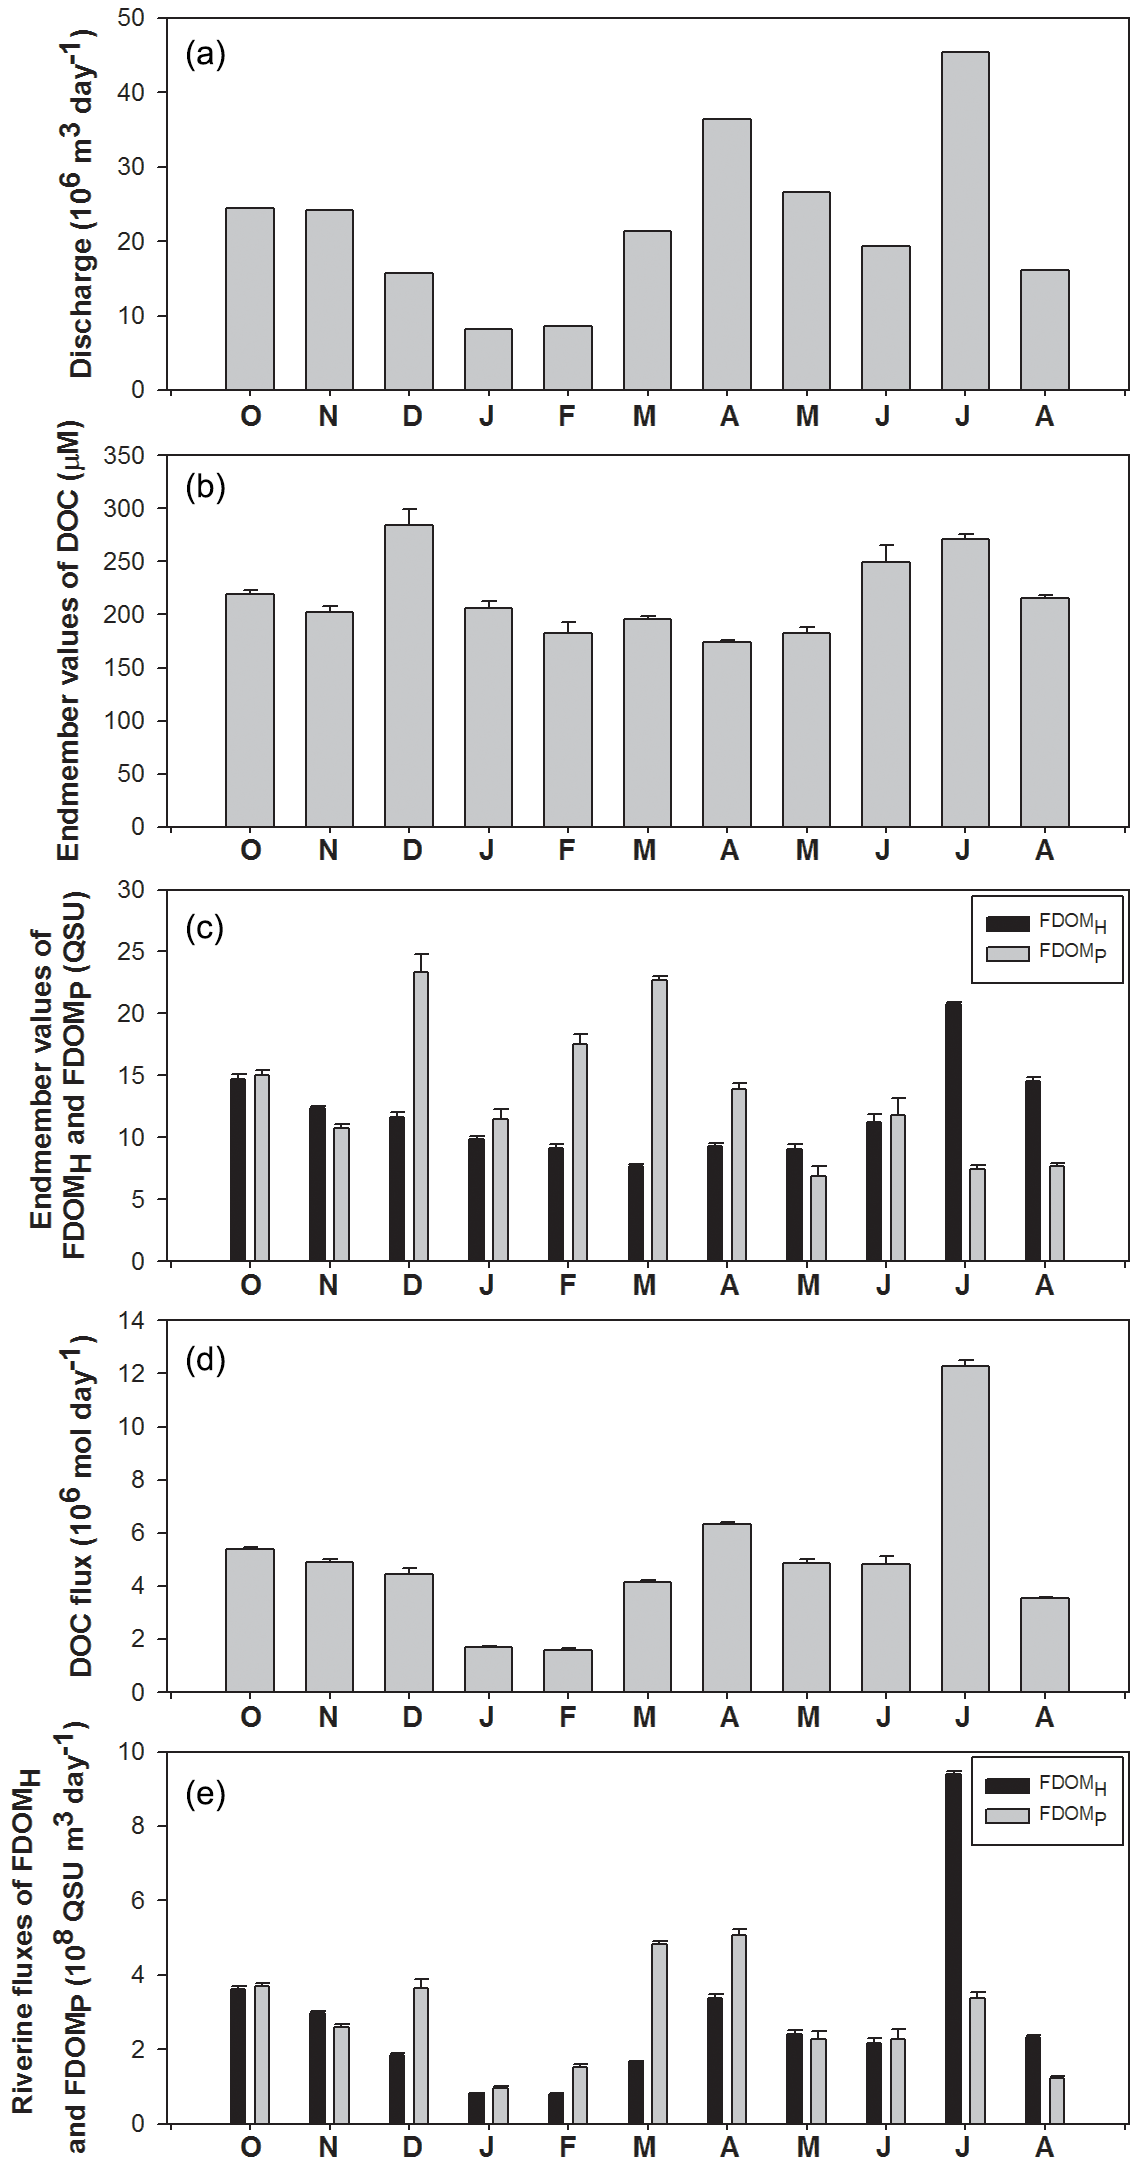
Figure 4Temporal variations in discharge volumes, the end-member values of DOC, FDOMH, and FDOMP, and riverine fluxes of DOC, FDOMH, and FDOMP in the Nakdong River Estuary from October 2014 to August 2015.
In the study region, FDOMP concentrations were poorly correlated with DOC concentrations (r2= 0.11; Fig. 3b). The slopes of FDOMP concentrations against DOC concentrations varied significantly over different seasons, with steeper gradients in the spring (March and April) and fall (October). In general, FDOMP is known to be produced efficiently by biological production in water (Coble, 1996; Belzile et al., 2002; Steinberg et al., 2004; Zhao et al., 2017). Thus, higher FDOMP concentrations relative to DOC concentrations in the spring and fall seem to be associated with the spring and fall phytoplankton blooms in river waters (Mayer et al., 1999; Zhang et al., 2009).
3.3 Fluxes of DOC and FDOM in the estuarine mixing zone
The fluxes of DOC and FDOM from rivers to the ocean are calculated using the end-member values (C) of these components in rivers multiplied by the river discharge volumes (Q) for each month (Fig. 4). For this estimation, we assumed that (1) the end-member values are the same as the intercepts of the DOC, FDOMH, and FDOMP versus salinity plots, and (2) the end-member values measured in the spring tides represent the concentrations of these components for each month.
River discharge was highest in April and July following heavy precipitation, and the largest discharge volume was about 5-fold higher than that of winter discharges (Fig. 4a). However, the monthly variations in DOC end-member (y intercept) values were quite constant, ranging from 174 to 284 µM. This indicates that the concentrations of DOC in the river are independent of river discharge volumes (Fig. 4b). The DOC end-member values were highest in December, followed by July and June (Fig. 4b). The monthly variation trend of FDOMH end-member values was similar to that of DOC, except for the December value. Excluding the December values, the FDOMP end-member values were highest in March, February, and October. These end-member trends are consistent with the slope variations explained in the previous section. Although there are large uncertainties in freshwater end-member values of DOC and FDOM in winter owing to narrow, high salinity ranges, we used the end-member values for the flux comparisons since the contribution of the uncertainties may be relatively small due to smaller river discharge volumes in winter.
The riverine DOC flux ranged from 1.6 × 10⁶ mol day−1 (February) to 12.3 × 10⁶ mol day−1 (July), indicating that there are large variations in DOC fluxes to the ocean. The riverine flux of FDOMH and FDOMP ranged from 1.4 × 10⁹ (December) to 23.1 × 10⁹ QSU m3 day−1 (July) and from 1.6 × 10⁹ (June) to 16.4 × 10⁹ QSU m3 day−1 (March), respectively. The seasonal variation trend of FDOMH was similar to that of DOC. The fluxes of FDOMP in December and March were 2-fold higher than those of FDOMH, whereas the flux of FDOMH in July was 2–3-fold higher than that of FDOMP. This shows that the fluxes of both components of FDOM differ significantly by season owing to the different source inputs even though their magnitudes are controlled mainly by river discharges.
It is well known that a single sampling event is not enough to capture the full range of natural variability in DOM abundance over all seasons (Stedmon et al., 2006; Huang and Chen, 2009; Markager et al., 2011; Dai et al., 2012; Moyer et al., 2015). Overall, our results show that monthly variations are significant. This implies that our understanding of DOC fluxes from large rivers is largely biased, depending on the sampling resolution, methods, and hydrogeological settings of a specific river. For example, if summer data are extrapolated to annual river water discharge, the DOC and FDOMH fluxes can be overestimated by up to 3 times for the Nakdong River.
The concentrations of FDOMH and DOC showed significant negative correlations against salinities throughout all sampling periods, indicating that they behave conservatively in this estuarine mixing zone. The slopes of both DOC and FDOMH concentrations versus salinities were highest in July due to the largest terrestrial DOC loadings. The carbon isotope values showed that the main source of DOC in the estuarine mixing zone is terrestrial C3 plants over all seasons. The slopes of FDOMP versus salinity were relatively higher in March and April in association with the spring phytoplankton blooms in river and estuarine waters. The monthly fluxes of DOC, FDOMH, and FDOMP showed large seasonal variations (5–10-fold), suggesting that the estimation of annual riverine fluxes of DOC, FDOMH, and FDOMP requires careful consideration of seasonal changes in rivers.
All data are available upon request to the author and in the Table S1 in the supplement.
The supplement related to this article is available online at: https://doi.org/10.5194/bg-15-1115-2018-supplement.
The authors declare that they have no conflict of interest.
We thank the Korea Marine Environment Management
Corporation (KOEM) members for their assistance with sampling and laboratory
analyses. This work was supported by a National Research Foundation of
Korea (NRF) grant funded by the Korean government (MEST; NRF-2015R1A2A1A10054309).
Edited by: Koji Suzuki
Reviewed by: two anonymous referees
Baker, A. and Spencer, R. G.: Characterization of dissolved organic matter from source to sea using fluorescence and absorbance spectroscopy, Sci. Total Environ., 333, 217–232, 2004.
Bauer, J. and Bianchi, T.: 5.02 – dissolved organic carbon cycling and transformation, Treatise on estuarine and coastal science, Academic Press, Waltham, 7–67, 2011.
Bauer, J. E., Cai, W.-J., Raymond, P. A., Bianchi, T. S., Hopkinson, C. S., and Regnier, P. A.: The changing carbon cycle of the coastal ocean, Nature, 504, 61–70, 2013.
Belzile, C., Gibson, J. A., and Vincent, W. F.: Colored dissolved organic matter and dissolved organic carbon exclusion from lake ice: Implications for irradiance transmission and carbon cycling, Limnol. Oceanogr., 47, 1283–1293, 2002.
Benner, R. and Opsahl, S.: Molecular indicators of the sources and transformations of dissolved organic matter in the Mississippi river plume, Org. Geochem., 32, 597–611, 2001.
Bianchi, T. S., Filley, T., Dria, K., and Hatcher, P. G.: Temporal variability in sources of dissolved organic carbon in the lower Mississippi River, Geochim. Cosmochim. Ac., 68, 959–967, 2004.
Burns, K. A., Brunskill, G., Brinkman, D., and Zagorskis, I.: Organic carbon and nutrient fluxes to the coastal zone from the Sepik River outflow, Cont. Shelf Res., 28, 283–301, 2008.
Clark, C. D., Jimenez-Morais, J., Jones, G., Zanardi-Lamardo, E., Moore, C. A., and Zika, R. G.: A time-resolved fluorescence study of dissolved organic matter in a riverine to marine transition zone, Mar. Chem., 78, 121–135, 2002.
Clark, I. J. and Fritz, P.: Environmental Isotopes in Hydrogeology, CRC Press/Lewis Publishers, Boca Raton, 1997.
Coble, P. G.: Characterization of marine and terrestrial DOM in seawater using excitation-emission matrix spectroscopy, Mar. Chem., 51, 325–346, 1996.
Coble, P. G.: Marine optical biogeochemistry: the chemistry of ocean color, Chem. Rev., 107, 402–418, 2007.
Dai, M., Yin, Z., Meng, F., Liu, Q., and Cai, W.-J.: Spatial distribution of riverine DOC inputs to the ocean: an updated global synthesis, Curr. Opin. Env. Sust., 4, 170–178, https://doi.org/10.1016/j.cosust.2012.03.003, 2012.
Del Castillo, C. E., Gilbes, F., Coble, P. G., and Müller-Karger, F. E.: On the dispersal of riverine colored dissolved organic matter over the West Florida Shelf, Limnol. Oceanogr., 45, 1425–1432, 2000.
Del Vecchio, R. and Blough, N. V.: Spatial and seasonal distribution of chromophoric dissolved organic matter and dissolved organic carbon in the Middle Atlantic Bight, Mar. Chem., 89, 169–187, 2004.
De Troyer, I., Bouillon, S., Barker, S., Perry, C., Coorevits, K., and Merckx, R.: Stable isotope analysis of dissolved organic carbon in soil solutions using a catalytic combustion total organic carbon analyzer-isotope ratio mass spectrometer with a cryofocusing interface, Rapid Commun. Mass Sp., 24, 365–374, 2010.
Dowell, W. H.: Kinetics and mechanisms of dissolved organic carbon retention in a headwater stream, Biogeochemistry, 1, 329–352, 1985.
Gearing, J. N.: The use of stable isotope ratios for tracing the nearshore–offshore exchange of organic matter, in: Coastal-Offshore Ecosystem Interactions, edited by: Jansson, B.-O., Springer-Verlag, Berlin, 69–101, 1988.
Gueguen, C., Guo, L., Wang, D., Tanaka, N., and Hung, C.-C.: Chemical characteristics and origin of dissolved organic matter in the Yukon River, Biogeochemistry, 77, 139–155, 2006.
Hedges, J. I.: Global biogeochemical cycles: progress and problems, Mar. Chem., 39, 67–93, 1992.
Huang, W. and Chen, R. F.: Sources and transformations of chromophoric dissolved organic matter in the Neponset River Watershed, J. Geophys. Res.-Biogeo., 114, G00F05, https://doi.org/10.1029/2009JG0009762009, 2009.
Jaffé, R., Boyer, J., Lu, X., Maie, N., Yang, C., Scully, N., and Mock, S.: Source characterization of dissolved organic matter in a subtropical mangrove-dominated estuary by fluorescence analysis, Mar. Chem., 84, 195–210, 2004.
Jeong, K.-S., Kim, D.-K., and Joo, G.-J.: Delayed influence of dam storage and discharge on the determination of seasonal proliferations of Microcystis aeruginosa and Stephanodiscus hantzschii in a regulated river system of the lower Nakdong River (South Korea), Water Res., 41, 1269–1279, 2007.
Kim, T.-H., Kim, G., Lee, S.-A., and Dittmar, T.: Extraordinary slow degradation of dissolved organic carbon (DOC) in a cold marginal sea, Sci. Rep., 5, 13808, https://doi.org/10.1038/srep13808, 2015.
Kirkels, F. M. S. A., Cerli, C., Federherr, E., Gao, J., and Kalbitz, K.: A novel high-temperature combustion based system for stable isotope analysis of dissolved organic carbon in aqueous samples, II: optimization and assessment of analytical performance, Rapid Commun. Mass Spectr., 28, 2574–2586, 2014.
Laane, R.: Conservative behaviour of dissolved organic carbon in the Ems-Dollart estuary and the western Wadden Sea, Neth. J. Sea Res., 14, 192–199, 1980.
Lang, S. Q., Lilley, M. D., and Hedges, J. I.: A method to measure the isotopic (13C) composition of dissolved organic carbon using a high temperature combustion instrument, Mar. Chem., 103, 318–326, 2007.
Ludwig, W., Probst, J. L., and Kempe, S.: Predicting the oceanic input of organic carbon by continental erosion, Global Biogeochem. Cy., 10, 23–41, 1996.
Maie, N., Boyer, J. N., Yang, C., and Jaffé, R.: Spatial, geomorphological, and seasonal variability of CDOM in estuaries of the Florida Coastal Everglades, Hydrobiologia, 569, 135–150, 2006.
Mantoura, R. and Woodward, E.: Conservative behaviour of riverine dissolved organic carbon in the Severn Estuary: chemical and geochemical implications, Geochim. Cosmochim. Ac., 47, 1293–1309, 1983.
Markager, S., Stedmon, C. A., and Søndergaard, M.: Seasonal dynamics and conservative mixing of dissolved organic matter in the temperate eutrophic estuary Horsens Fjord, Estuar. Coast. Shelf Sci., 92, 376–388, 2011.
Mayer, L. M., Schick, L. L., and Loder, T. C.: Dissolved protein fluorescence in two Maine estuaries, Mar. Chem., 64, 171–179, 1999.
Meybeck, M.: Carbon, nitrogen, and phosphorus transport by world rivers, Am. J. Sci., 282, 401–450, 1982.
Moran, M. A., Pomeroy, L. R., Sheppard, E. S., Atkinson, L. P., and Hodson, R. E.: Distribution of terrestrially derived dissolved organic matter on the southeastern US continental shelf, Limnol. Oceanogr., 36, 1134–1149, 1991.
Moyer, R. P., Powell, C. E., Gordon, D. J., Long, J. S., and Bliss, C. M.: Abundance, distribution, and fluxes of dissolved organic carbon (DOC) in four small sub-tropical rivers of the Tampa Bay Estuary (Florida, USA), Appl. Geochem., 63, 550–562, 2015.
Panetta, R. J., Ibrahim, M., and Gélinas, Y.: Coupling a high-temperature catalytic oxidation total organic carbon analyzer to an isotope ratio mass spectrometer to measure natural-abundance δ13C-dissolved organic carbon in marine and freshwater samples, Anal. Chem., 80, 5232–5239, 2008.
Qualls, R. G., Haines, B. L., and Swank, W. T.: Fluxes of dissolved organic nutrients and humic substances in a deciduous forest, Ecology, 72, 254–266, 1991.
Raymond, P. A. and Bauer, J. E.: DOC cycling in a temperate estuary: a mass balance approach using natural 14C and 13C isotopes, Limnol. Oceanogr., 46, 655–667, 2001.
Romera-Castillo, C., Sarmento, H., Álvarez-Salgado, X. A., Gasol, J. M., and Marrasé, C.: Net production and consumption of fluorescent colored dissolved organic matter by natural bacterial assemblages growing on marine phytoplankton exudates, Appl. Environ. Microbiol., 77, 7490–7498, 2011.
Spiker, E.: The behavior of 14C and 13C in estuarine water: effects of in situ CO2 production and atmospheric exchange, Radiocarbon, 22, 647–654, 1980.
Stedmon, C. A., Markager, S., Søndergaard, M., Vang, T., Laubel, A., Borch, N. H., and Windelin, A.: Dissolved organic matter (DOM) export to a temperate estuary: seasonal variations and implications of land use, Estuaries Coasts, 29, 388–400, 2006.
Steinberg, D. K., Nelson, N. B., Carlson, C. A., and Prusak, A. C.: Production of chromophoric dissolved organic matter (CDOM) in the open ocean by zooplankton and the colonial cyanobacterium Trichodesmium spp, Mar. Ecol. Prog. Ser., 267, 45–56, 2004.
Vignudelli, S., Santinelli, C., Murru, E., Nannicini, L., and Seritti, A.: Distributions of dissolved organic carbon (DOC) and chromophoric dissolved organic matter (CDOM) in coastal waters of the northern Tyrrhenian Sea (Italy), Estuar. Coast. Shelf Sci., 60, 133–149, 2004.
Wang, X.-C., Chen, R. F., and Gardner, G. B.: Sources and transport of dissolved and particulate organic carbon in the Mississippi River estuary and adjacent coastal waters of the northern Gulf of Mexico, Mar. Chem., 89, 241–256, 2004.
Zepp, R. G., Sheldon, W. M., and Moran, M. A.: Dissolved organic fluorophores in southeastern US coastal waters: correction method for eliminating Rayleigh and Raman scattering peaks in excitation–emission matrices, Mar. Chem., 89, 15–36, 2004.
Zhang, Y., van Dijk, M. A., Liu, M., Zhu, G., and Qin, B.: The contribution of phytoplankton degradation to chromophoric dissolved organic matter (CDOM) in eutrophic shallow lakes: field and experimental evidence, Water Res., 43, 4685–4697, 2009.
Zhao, Z., Gonsior, M., Luek, J., Timko, S., Ianiri, H., Hertkorn, N., Schmitt-Kopplin, P., Fang, X., Zeng, Q., and Jiao, N.: Picocyanobacteria and deep-ocean fluorescent dissolved organic matter share similar optical properties, Nat. Commun., 8, 15284, https://doi.org/10.1038/ncomms15284, 2017.