the Creative Commons Attribution 3.0 License.
the Creative Commons Attribution 3.0 License.
Climate effects on vegetation vitality at the treeline of boreal forests of Mongolia
Choimaa Dulamsuren
Stefan Erasmi
Dirk Nikolaus Karger
Markus Hauck
In northern Mongolia, at the southern boundary of the Siberian boreal forest belt, the distribution of steppe and forest is generally linked to climate and topography, making this region highly sensitive to climate change and human impact. Detailed investigations on the limiting parameters of forest and steppe in different biomes provide necessary information for paleoenvironmental reconstruction and prognosis of potential landscape change. In this study, remote sensing data and gridded climate data were analyzed in order to identify main distribution patterns of forest and steppe in Mongolia and to detect environmental factors driving forest development. Forest distribution and vegetation vitality derived from the normalized differentiated vegetation index (NDVI) were investigated for the three types of boreal forest present in Mongolia (taiga, subtaiga and forest–steppe), which cover a total area of 73 818 km2. In addition to the forest type areas, the analysis focused on subunits of forest and nonforested areas at the upper and lower treeline, which represent ecological borders between vegetation types. Climate and NDVI data were analyzed for a reference period of 15 years from 1999 to 2013.
The presented approach for treeline delineation by identifying representative sites mostly bridges local forest disturbances like fire or tree cutting. Moreover, this procedure provides a valuable tool to distinguish the potential forested area. The upper treeline generally rises from 1800 m above sea level (a.s.l.) in the northeast to 2700 m a.s.l. in the south. The lower treeline locally emerges at 1000 m a.s.l. in the northern taiga and rises southward to 2500 m a.s.l. The latitudinal gradient of both treelines turns into a longitudinal one on the eastern flank of mountain ranges due to higher aridity caused by rain-shadow effects. Less productive trees in terms of NDVI were identified at both the upper and lower treeline in relation to the respective total boreal forest type area. The mean growing season temperature (MGST) of 7.9–8.9 ∘C and a minimum MGST of 6 ∘C are limiting parameters at the upper treeline but are negligible for the lower treeline. The minimum of the mean annual precipitation (MAP) of 230–290 mm yr−1 is a limiting parameter at the lower treeline but also at the upper treeline in the forest–steppe ecotone. In general, NDVI and MAP are lower in grassland, and MGST is higher compared to the corresponding boreal forest. One exception occurs at the upper treeline of the subtaiga and taiga, where the alpine vegetation consists of mountain meadow mixed with shrubs. The relation between NDVI and climate data corroborates that more precipitation and higher temperatures generally lead to higher greenness in all ecological subunits. MGST is positively correlated with MAP of the total area of forest–steppe, but this correlation turns negative in the taiga. The limiting factor in the forest–steppe is the relative humidity and in the taiga it is the snow cover distribution. The subtaiga represents an ecological transition zone of approximately 300 mm yr−1 precipitation, which occurs independently from the MGST.
Since the treelines are mainly determined by climatic parameters, the rapid climate change in inner Asia will lead to a spatial relocation of tree communities, treelines and boreal forest types. However, a direct deduction of future tree vitality, forest composition and biomass trends from the recent relationships between NDVI and climate parameters is challenging. Besides human impact, it must consider bio- and geoecological issues like, for example, tree rejuvenation, temporal lag of climate adaptation and disappearing permafrost.
- Article
(4108 KB) - Full-text XML
-
Supplement
(41365 KB) - BibTeX
- EndNote


Due to the highly continental environment in northern central Asia, Mongolia is subjected to dry and winter-cold climate conditions. The landscape and vegetation development is highly sensitive to changes in temperature and/or precipitation (Dulamsuren et al., 2010a; Gunin et al., 1999). The intensity and impact of climate parameters on vegetation strongly varies in space caused by different factors like topography, latitude and air circulation. Corresponding to the change in climatic conditions from cold semihumid in the north to warm and arid in the south, a latitudinal zonation of the vegetation occurs, which is modified by an altitudinal zonation in the mountains (Hilbig, 1995). From north to south, these vegetation zones include taiga, forest–steppe, steppe and the Gobi desert. Taiga, subtaiga and fragmented forests in the forest–steppe ecotone represent the southern edge of the Eurosiberian boreal forest. The grassland belongs to the region of the Mongolian–Chinese steppe. The distribution of the different vegetation zones, boreal forest types and treelines is mainly controlled by air temperature, evapotranspiration and precipitation (Walter and Breckle, 1994). However, site-specific edaphic parameters, including soil temperature, soil moisture and nutrient availability, also play a role. Moisture conditions are a key limiting factor controlling the distribution of deserts and steppes as well as for the lower boundary of mountain forests at the transition to drylands. In contrast, thermal conditions control position of the upper treeline and the alpine vegetation belt (Klinge et al., 2003, 2015; Körner, 2012; Paulsen and Körner, 2014). Both the upper and the lower treelines of Mongolia's boreal forests represent an obvious visual boundary between vegetation zones of highly different ecological requirements, though their current state can be strongly influenced by human impact (Klinge et al., 2015).
The mean temperature of the growing season (MGST) is more relevant for describing the thermal environment at the upper forest line than mean annual air temperature (MAAT), because winter temperatures are of minor significance for tree growth (Jobbágy and Jackson, 2000; Körner, 2012). To define temperature conditions at the upper treeline the warmest month isotherm of 10 ∘C is commonly used (Walter and Breckle, 1994). For the northern Tian Shan, Klinge et al. (2015) indicated a minimum monthly mean temperature of 5 ∘C during the growing season. Paulsen and Körner (2014) defined the minimum MGST as 5.5 to 7.5 ∘C and the mean temperature as 6.4 ∘C during a period of daily temperatures > 0.9 ∘C in a minimum growing season of 94 days for the upper treeline in a global context. A lower treeline occurs in the semiarid region of central Asia between relatively humid mountain regions and arid basins. The forest distribution is generally limited by annual precipitation, which has its minimum between 300 and 200 mm yr−1 (Dulamsuren et al., 2010a; Holdridge, 1947; Miehe et al., 2003; Walter and Breckle, 1994).
In the forest–steppe, the spatial distribution of vegetation is highly correlated with terrain parameters (Hais et al., 2016; Klinge et al., 2015). Less solar radiation input causes lower temperatures and reduces the evapotranspiration pressure on north-facing slopes, leading to higher humidity, higher soil moisture and more widespread permafrost. The higher water availability supports tree growth (Dashtseren et al., 2014). The dominant tree species in Mongolia's boreal forests is Siberian larch (Larix sibirica). On south-facing slopes higher solar irradiation produces hydrological conditions which are too dry for the establishment of forests and thus favor grassland (Bayartaa et al., 2007).
With respect to global climate change, the question of potential shifts in growth conditions arises. Vegetation indices like the most commonly applied NDVI (normalized differentiated vegetation index), which are derived from multispectral satellite images (Landsat, MODIS, SPOT VGT), provide information about the “greenness” and vitality of the vegetation cover. The various investigations into recent trends in climate and NDVI which exist for the region of Mongolia state partially diverging results (Dashkhuu et al., 2015; Eckert et al., 2015; Miao et al., 2015; Poulter et al., 2013; Vandandorj et al., 2015). Instrumental climate data from weather stations in Mongolia are often discontinuous and time series of climate measurements are not available from mountain areas since climate stations are located near settlements in the basins. Thus, representative climate parameters must be modeled by different regionalization processes (Böhner, 2006). Various gridded datasets of reanalyzed climate parameters with different spatial and temporal resolution exist, which are mainly used for climate trend analysis; examples include CRU-TS (Harris et al., 2014), ERA-interim (Dee et al., 2011) and CHELSA (Karger et al., 2017) (Figs. S1 and S2 in the Supplement). While the quality, origin and resolution of climate records are potential sources of uncertainty, the results and interpretations of the correlations between climate and NDVI trends occasionally suffer from disregarding the specific bio-ecological restrictions of the different vegetation zones.
Batima et al. (2005) analyzed climate station data and observed an increasing MAAT of 1.7 ∘C for Mongolia between 1940 and 2001. Eckert et al. (2015) stated that temperatures have not varied much since the year 2000. Dulamsuren et al. (2014) found a trend toward warmer temperature extremes starting around 2000. Measurements of permafrost distribution and active layer development in Mongolia show a general trend of permafrost degradation, which has been accelerating since the 1990s (Sharkhuu et al., 2007; Sharkhuu, 2003). This is due to climate warming but reinforced by a loss of vegetation caused by livestock grazing in some steppe areas and tree cutting in the forests. Permafrost degradation is more intense in the Khuvsgul area than in the Khentei and Khangai Mountains (Sharkhuu et al., 2007).
The trends in precipitation in Mongolia are not spatially uniform and can strongly depend on the period of observation used for climate analysis (Erasmi et al., 2014; Giese et al., 2007). Batima et al. (2005) found a negative trend of annual precipitation in the period between 1970 and 2001. In the driest regions of western and southern Mongolia, no specific trends occurred at all. Based on tree-ring data, Dulamsuren et al. (2010b) documented increasing drought stress for larch trees in the Khentei Mountains, which they attributed to increasing aridity caused by rising summer temperatures and decreasing summer precipitation during the last 50 years. Although trees at the outer boundary of the forest stands might be better adapted to drought stress, obvious margins of dead trees surrounding the forest islands were recently found in many places in the forest–steppe. For the period from 1980 until 2005, Bayartaa et al. (2007) reported a strong increase in burnt forest area in Mongolia, starting in 1996, which was caused by very dry winter and spring seasons but may also be combined with weakened governmental management during the period of political transition. A general tendency of decreasing lake levels during recent decades in two great lakes of interior drainage in the Gobi with an catchment area south of the Khangai Mountains was observed by Szumińska (2016). This lake-level decline was associated with trends in reduced precipitation and increased evapotranspiration resulting from rising temperatures.
Eckert et al. (2015) analyzed the general trend for NDVI in Mongolia during the period between 2001 and 2011 using the MODIS NDVI dataset and found mostly positive trends in northern and eastern Mongolia, stable conditions in southern Mongolia and large areas of negative trends in the northern Mongolian Altai and in the east of the Khangai Mountains. Based on the same dataset and a similar period from 2000 to 2012, Vandandorj et al. (2015) analyzed the seasonal variation of NDVI for individual vegetation zones. High variations of NDVI occur particularly in the steppe regions where the vitality and density of grassland is closely related to the amount of annual precipitation due to low stomatal control of transpiration by the grassland vegetation. Low variations in NDVI occur in forested regions, since trees exert a much stricter stomatal control of transpiration than herbs and grasses, and in the sparsely vegetated desert regions. Poulter et al. (2013) investigated the influence of recent climate trends on the forests in inner Asia by the temporal distribution of a greening value using specific vegetation indices from remote sensing data and environmental datasets. They found a trend toward earlier greening induced by increasing spring temperatures and earlier browning associated with decreasing summer precipitation. Based on these relationships they projected better future forest conditions for Mongolia until 2100. In opposition to these findings, Bayartaa et al. (2007) reported that climate scenarios would indicate a significant decrease in forest area and its total biomass for Mongolia until the middle of the 21st Century, which is in accordance with the recent trends from dendrochronological data from Mongolia (Dulamsuren et al., 2010a, b, 2014; Khansaritoreh et al., 2017). Lu et al. (2014) investigated the applicability of different remote sensing-based biomass estimation approaches. They found that the biomass estimation method via NDVI was sufficient in low-density forests. Dulamsuren et al. (2016) showed the NDVI to be well suited to estimating the tree biomass of Mongolian forests. The best fit of linear regression was found between biomass and the mean NDVI of April for the period 1999–2013. This shows that in addition to the vegetation vitality the NDVI is a valuable indicator for tree biomass in open forest stands.
With regard to the diverse and in parts contradictory observations on climate and vegetation status, interdependencies, and recent trends in Mongolia that are reported here, this study investigates the present distribution of forest areas and its relation to the actual climate and topography based on high-resolution satellite and gridded climate data. In addition to existing studies, here, the specific impact of climate parameters related to different boreal forest types and ecological subunits is analyzed in order to delineate potential turning points for environmental changes. The following hypotheses were tested:
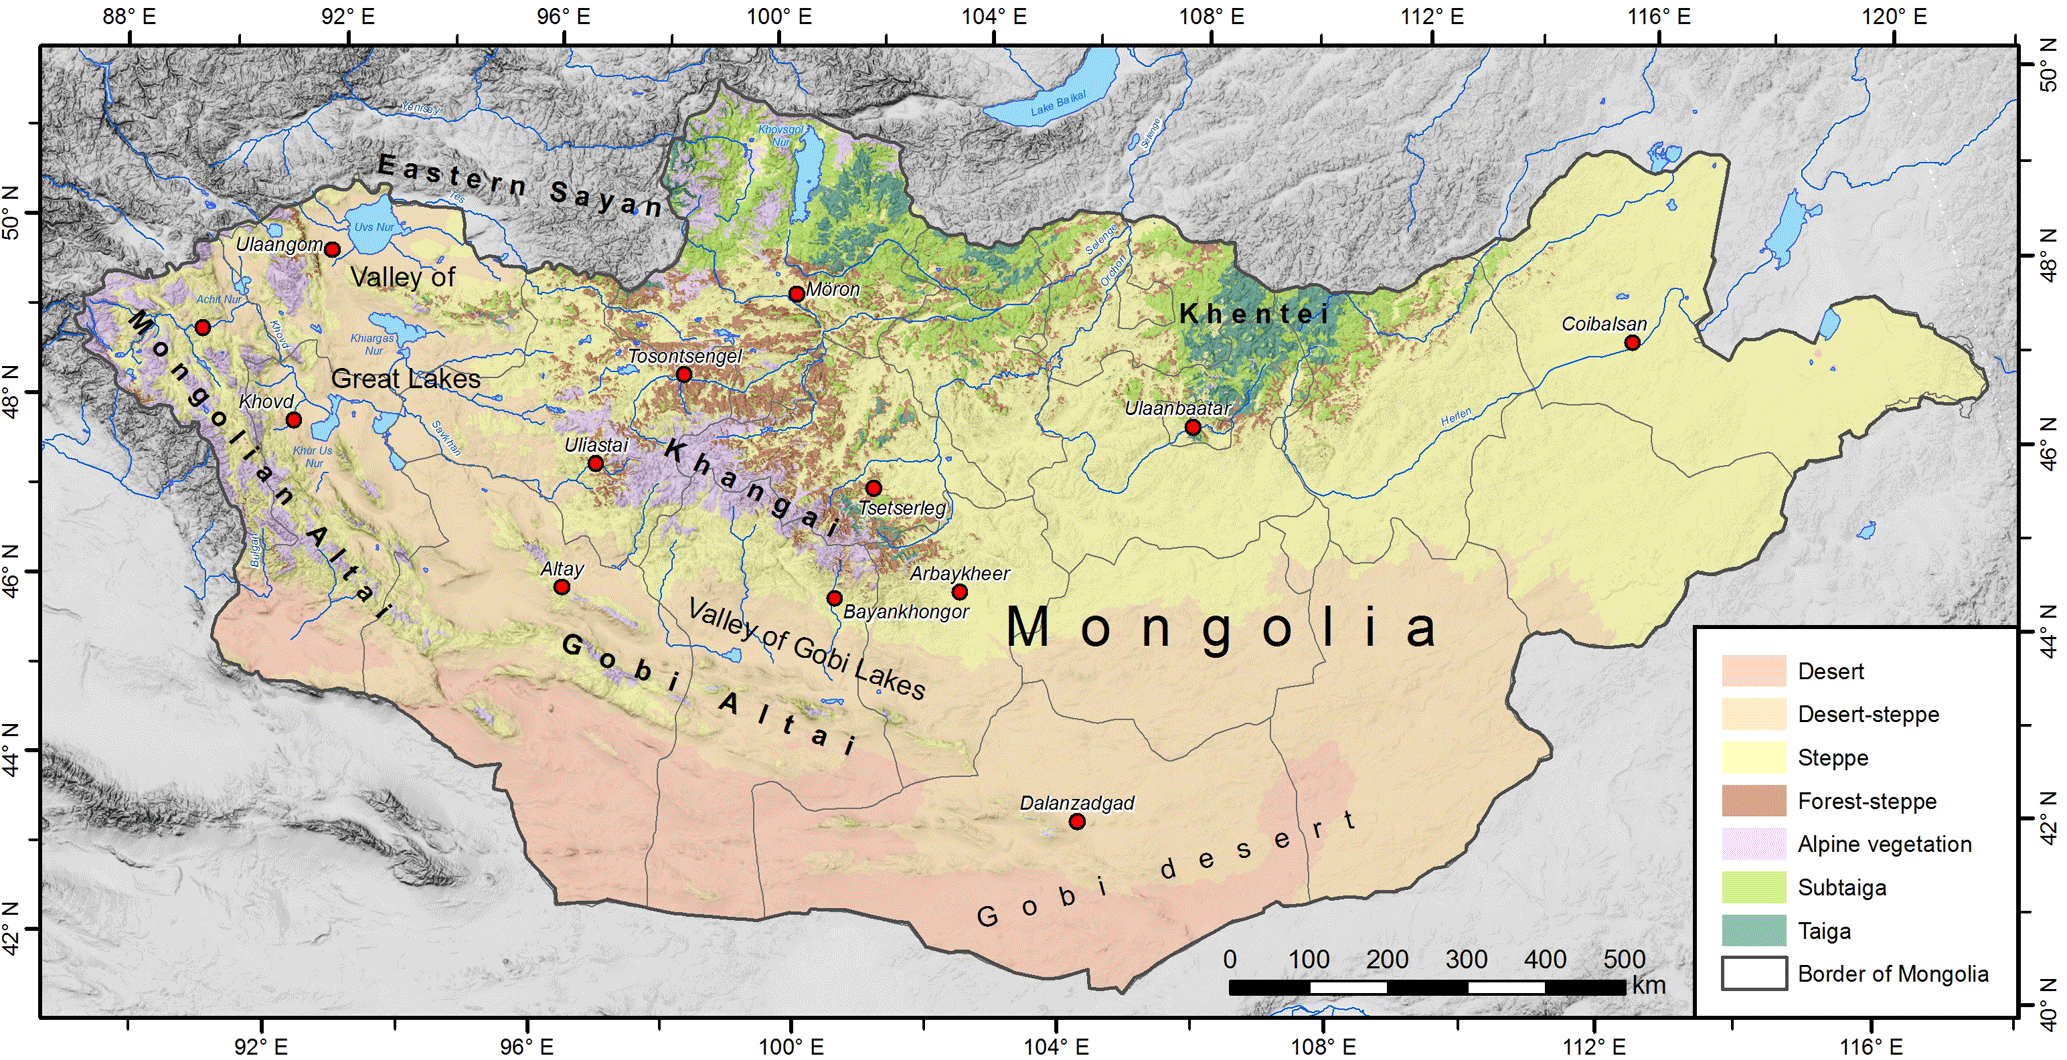
Figure 1The vegetation zones of Mongolia (modified from Gunin and Vostokova, 2005, and Landsat 8 supervised classification).
-
Every type of boreal forest is delimited by a specific climatic envelope. The statistical correlations between NDVI and climate parameters in different forest types and at the corresponding treelines reflect climate-ecological relationships and limitations.
-
Different spatial gradients of climate-induced vitality change exist for different types of boreal forest. This applies in particular to the treelines as an indicator of extreme ecological site conditions.
-
Forest and grassland of the same zone of boreal forest type show different spatial gradients and relations to climate.
Mongolia is situated in northern central Asia in the transition zone between the Siberian taiga in the north and the Gobi desert in the south (Fig. 1). Mongolia extends from 87∘45′ to 119∘56′ E and from 41∘34′ to 52∘09′ N and covers a total area of 1 562 950 km2. Wide basins of interior drainage occur at elevations between 900 and 1500 m a.s.l. with the lowest areas below 720 m a.s.l. There are five principal mountain systems in Mongolia: the Mongolian Altai (MA) in the west (highest peak is Tavan Bogd, 4374 m a.s.l.), the Gobi Altai in the south (Ikh Bogd, 3957 m a.s.l.), the Khangai Mountains (KaM) in the center (Otgon Tenger, 3964 m a.s.l.), the Khentei Mountains (KeM) in the northeast (Asralt Kharj khan, 2799 m a.s.l.), and the Khuvsgul region in the eastern Sayan Mountains (Munkh Saridag, 3460 m a.s.l.). The mountaintops are shaped by pronounced flat surfaces at elevations between 2500 and 3500 m a.s.l. (Academy of Sciences of Mongolia and Academy of Sciences of USSR, 1990; Murzaev, 1954).
The climate of Mongolia is highly continental with semihumid, semiarid and arid conditions. In wintertime, the Siberian high-pressure cell produces cold and dry weather with little snowfall and mean temperatures between −15 and −30 ∘C (Barthel, 1983; Klinge, 2001). The main rainfall occurs from June to August during the short summer and is induced by westerlies and cyclone precipitation, with the dry season starting again in autumn. The mean summer temperatures range between 10 and 27 ∘C. Mean annual precipitation is lower than 50 mm in the interior basins, around 125 mm in the southern desert and up to 350 mm in the northern steppes, whereas it rises to more than 500 mm in the high mountains.
According to the climatic conditions, the vegetation zones are arranged in characteristic sequences along latitudinal and altitudinal gradients (Hilbig, 1995). Dark mountain taiga with coniferous trees (Pinus sibirica, Picea obovata, Abies sibirica, Larix sibirica) occurs as closed forests in northern Mongolia and locally as mountain taiga in the upper KaM in central Mongolia (Dulamsuren, 2004). The subtaiga forest type with needle and deciduous broadleaf forests (Larix sibirica, Pinus sylvestris, Betula platyphylla) represents a type of light taiga beneath and surrounding the mountain taiga. In northern Mongolia, the forest often extends into the valley bottoms and open grassland is restricted to intramontane basins. The vegetation in central Mongolia consists of steppe grassland in the basins and forest–steppe in the mountains. In this forest boundary ecotone of semiarid climate conditions, deciduous conifer forests consisting of Larix sibirica are primarily limited to north-facing slopes (Treter, 1996). In the high mountains, dense alpine meadow vegetation occurs between forest–steppe and the periglacial zone of frost debris. The main perennial rivers are accompanied by floodplain meadows and alluvial forests of Populus spp. and Ulmus pumila (Hilbig, 1995).
Missing forest management and extensive forest use by tree cutting and wood pasture led to forest degradation and local deforestation in many regions of Mongolia during recent decades (Tsogtbaatar, 2004). In addition, hazardous forest fires destroyed large forest areas (Bayartaa et al., 2007; Goldammer, 2002, 2007; Hansen et al., 2013). Although it is supposed that most of the recent forest fires in Mongolia were primarily set by humans, there is an additional ecological exposure to fire susceptibility (Dorjsuren, 2009), which is caused by climate warming, permafrost retreat and insect calamities.
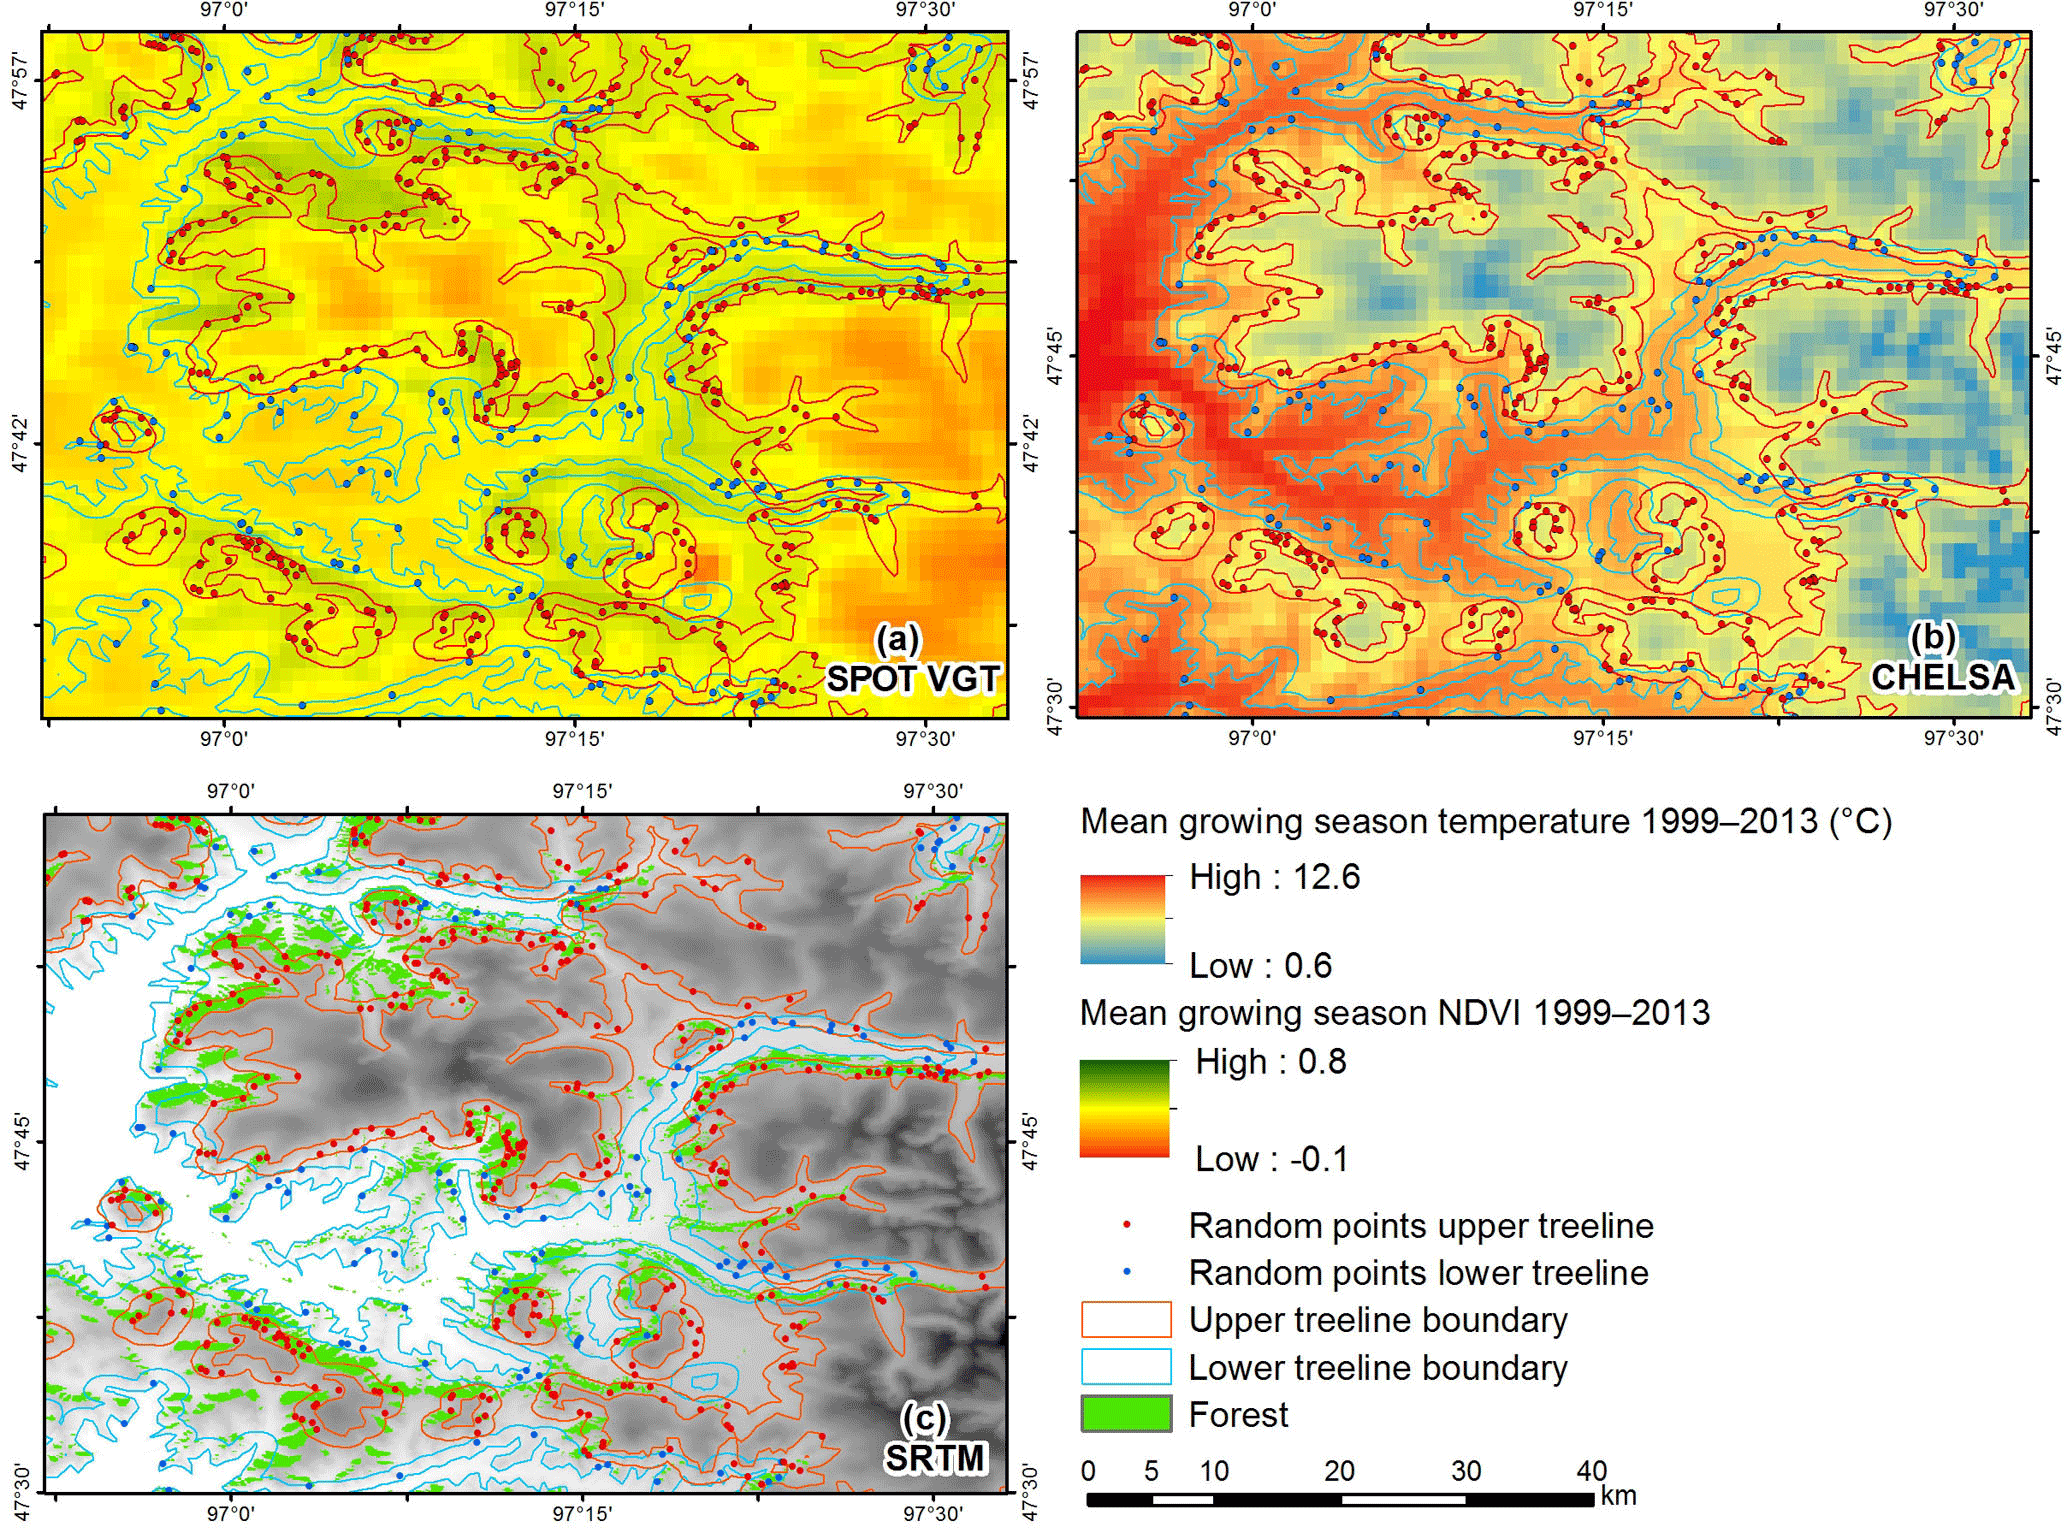
Figure 3Examples for the spatial resolution of the different data: (a) mean growing season NDVI 1999–2013, (b) mean growing season temperature 1999–2013, (c) upper and lower treeline boundary from Landsat and SRTM data.
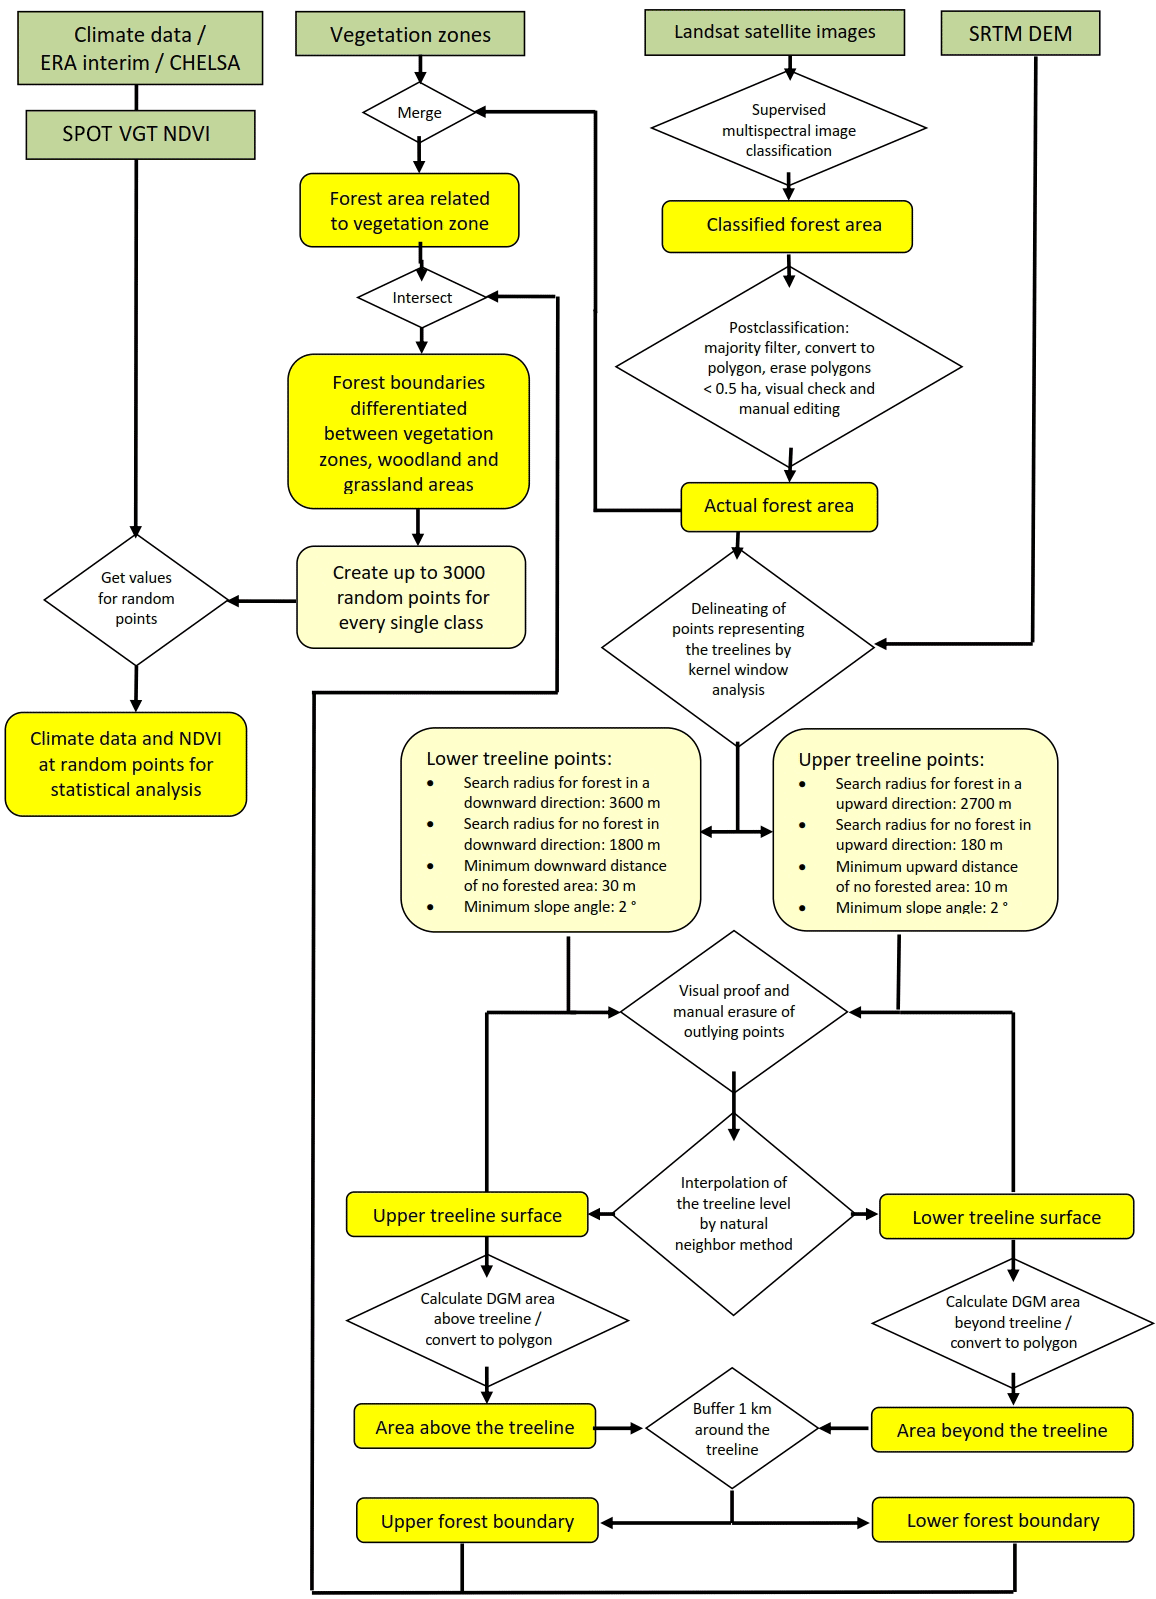
Figure 2 shows a scheme of the complete analysis process, and the individual steps are described in detail below. Figure 3 provides visualizations of the different spatial resolution of the basic datasets used for the analysis. The forested area of Mongolia and its surroundings was mapped from 50 Landsat 8 satellite images (spatial resolution 30 m). Images of the years 2013 and 2014 were used as a baseline, and, in areas of low quality or high cloud coverage, were supplemented by Landsat 5 images from 2009 to 2011 (spatial resolution 30 m). The mapping process consists of two steps. Initially a maximum likelihood supervised classification was carried out and subsequently the resulting forest polygons were visually proofed and manually corrected.
The elevation of the actual treeline was calculated from selected points of a digital elevation model (DEM) taken from SRTM data (spatial resolution 90 m; Fig. 3c). Points representing the treeline were established using a kernel model, which evaluates, for every pixel covered by forest, whether (1) it has a slope of more than 2∘, (2) there is any forested area in the surroundings in a higher or lower position and (3) there is any woodless area representing the existence of the next vegetation zone beyond the potential forest boundary, to exclude relief-related distribution limits. The specific search parameters for the upper and lower treeline are given in Fig. 2. Körner (2012) proposes a minimum vertical range of 100 m from the upper treeline (UT) to the summit to prevent the summit effect on tree development and to receive a true climatic treeline value. Due to extensive planation surfaces in the area of KaM, the widespread alpine belt occurs with less than 100 m vertical distance between the upper treeline and the flat mountaintops. Thus, it was necessary to reduce the minimum distance for defining the summit effect in the modeling to only 10 m to prevent UT values beyond large alpine areas from being excluded. After visual proof and deletion of strong outlying points, a final number of 7081 points for the UT and 5220 for the lower treeline (LT) were used for the spatial interpolation of the treeline surfaces applying the natural neighbor method (Watson, 1992). Subsequently, the vertical distance of the treeline surfaces and the area above and below the treeline were calculated. A buffer of 1000 m around these areas was chosen to represent the treeline boundary area. This distance meets the spatial resolution of the SPOT VGT and climate data (Fig. 3b).
The distribution of the different zones of boreal forest type was adapted from the Ecosystems Atlas of Mongolia (Gunin and Vostokova, 2005). At places where the map does not match the position of the landscape elements represented in the remote sensing data, the spatial deviations were corrected to the position of the satellite images. The different ecosystem units were generalized to the main vegetation zones (desert, desert steppe, steppe, forest–steppe, subtaiga, taiga, alpine vegetation). Forests of floodplain areas, which are hydrologically favored by groundwater, were excluded from this analysis. Where forest areas were found in steppe regions, those parts were changed into forest–steppe. In the upper elevation belts where the strong disparity between north-facing slopes with forest and south-facing slopes with steppe dissipates, the areas with slopes covered by forests in every direction were reclassified as mountain subtaiga. Subsequently, the mapped forest areas were combined with the vegetation zones to achieve a spatial differentiation between forested area and open grassland within the total ecological (TE) units of the forest–steppe, subtaiga and taiga. These three types of boreal forest comprise the area under investigation in the present study.
Here, the statistical approach to use one mean value in a period of 15 years (1999–2013) for every parameter was chosen in order to eliminate annual changes and interannual variations, which derive from phenology and climate variability. Thus, normalized variables representing the mean site conditions were computed and spatially analyzed, although this is a simplification since the plant species respond to interannual variations and extreme values. NDVI, temperature and solar radiation are integrated to the MGS (mean growing season). Precipitation during the winter season is retained in the soil and additionally available during the MGS. The vegetation index from SPOT VGT satellite data was used for the time span from 1 January 1999 to 31 December 2013, which originally consists of SPOT-Vegetation 10-daily NDVI composites (spatial resolution 1 km, Fig. 3a). These data were aggregated to monthly values using the maximum value of the three 10 day composites. Monthly NDVI data were further aggregated to the mean of the growing season from May to September (MGS-NDVI) for the period 1999 to 2013. We used reanalyzed climate data from the CHELSA dataset with 30 arcsec resolution (approx. 1 km, Fig. 3b), because it incorporates terrain parameters and wind effect for better representing climate parameters in the relief (Karger et al., 2017) (Figs. S1 and S2 in the Supplement). Monthly data from 1999 to 2013 were averaged to cover the same period as the MGS-NDVI dataset. While MGSTs were calculated from the monthly means from May to September, the mean annual precipitation (MAP) represents the average of the total annual sum of the period from 1999 to 2013. The sum of solar radiation input (MGSR; Wh m−2) for the MGS (day 121–273) was simply calculated with a GIS-tool based on STRM-DEM data for 2007 and was assumed to be relatively constant for the observation period 1999 to 2013.
Up to 3000 random points for both forest and grassland area in the three types of boreal forest and at the upper and lower forest boundary were chosen for statistical analysis (Tables 1, 2). The total number of random points was reduced for treeline subunits, which have only a small spatial distribution to prevent a point density that is too large. Areas of larger valleys where extensive forest occurs below the LT are excluded from the treeline analysis.
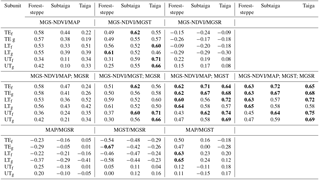
Table 1Arithmetic mean ± standard deviation of different climate parameters (MAP: mean annual precipitation, MGST: mean growing season temperature, MGS-NDVI: mean growing season normalized differentiated vegetation index) and vegetation units (subunits are TE: total ecological unit, LT: lower treeline, UT: upper treeline, s: portion of grassland, f: portion of forest). Within one row, mean values sharing a common uppercase letter, do not differ significantly (p≤0.05, Duncan's multiple range test, dfmodel = 2). Within one subunit (forest–steppe, subtaiga, taiga), mean values sharing a common lowercase letter do not differ significantly (p≤0.05, Duncan's multiple range test, dfmodel=5.13295).
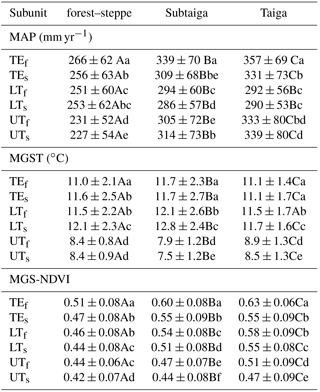
Table 2Correlation matrix showing Pearson and multiple correlation coefficients (r) between NDVI, climate, and terrain parameters for different types of boreal forest and ecological subunits. (MAP: mean annual precipitation, MGST: mean growing season temperature, MGS-NDVI: mean growing season normalized differentiated vegetation index, MGSR: mean growing season solar radiation input; subunits are TE: total ecological unit, LT: lower treeline, UT: upper treeline, s: portion of grassland, f: portion of forest). Bold letters highlight strong correlations between the different parameters.
For each of the three boreal forest types (forest–steppe, subtaiga, taiga), first, the total area (total ecological unit, TE) is considered, and then the TE is divided into forest (f) and grassland (s) and further separated into the 1 km boundary area of both treelines (LT, UT). This categorization leads to 18 ecological subunits. Multiple comparisons between means were calculated with Duncan's multiple range test after testing for normal distribution using SAS 9.4 software (SAS Institute Inc., Cary, North Carolina, USA). In addition to the mean values, the standard deviation specifies the variation range of the climate parameters for every subunit. Pearson and multiple correlation coefficients between NDVI, MAP, MGST and MGSR were computed as a statistical base for the interpretation of regression gradients. Due to the high amount of random points, the performance of a t test was opposed because the significance level (p value) is always < 0.05. The correlations at the level of the TE are used to analyze the controlling climatic conditions and the environmental range with respect to the ecological distribution of the entire type of boreal forest.
Table 3Proportion of forest area (f) and total area of different boreal forest types and corresponding treelines. (TE: total ecological unit, LT: lower treeline, UT: upper treeline).
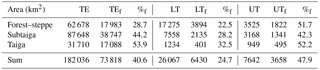
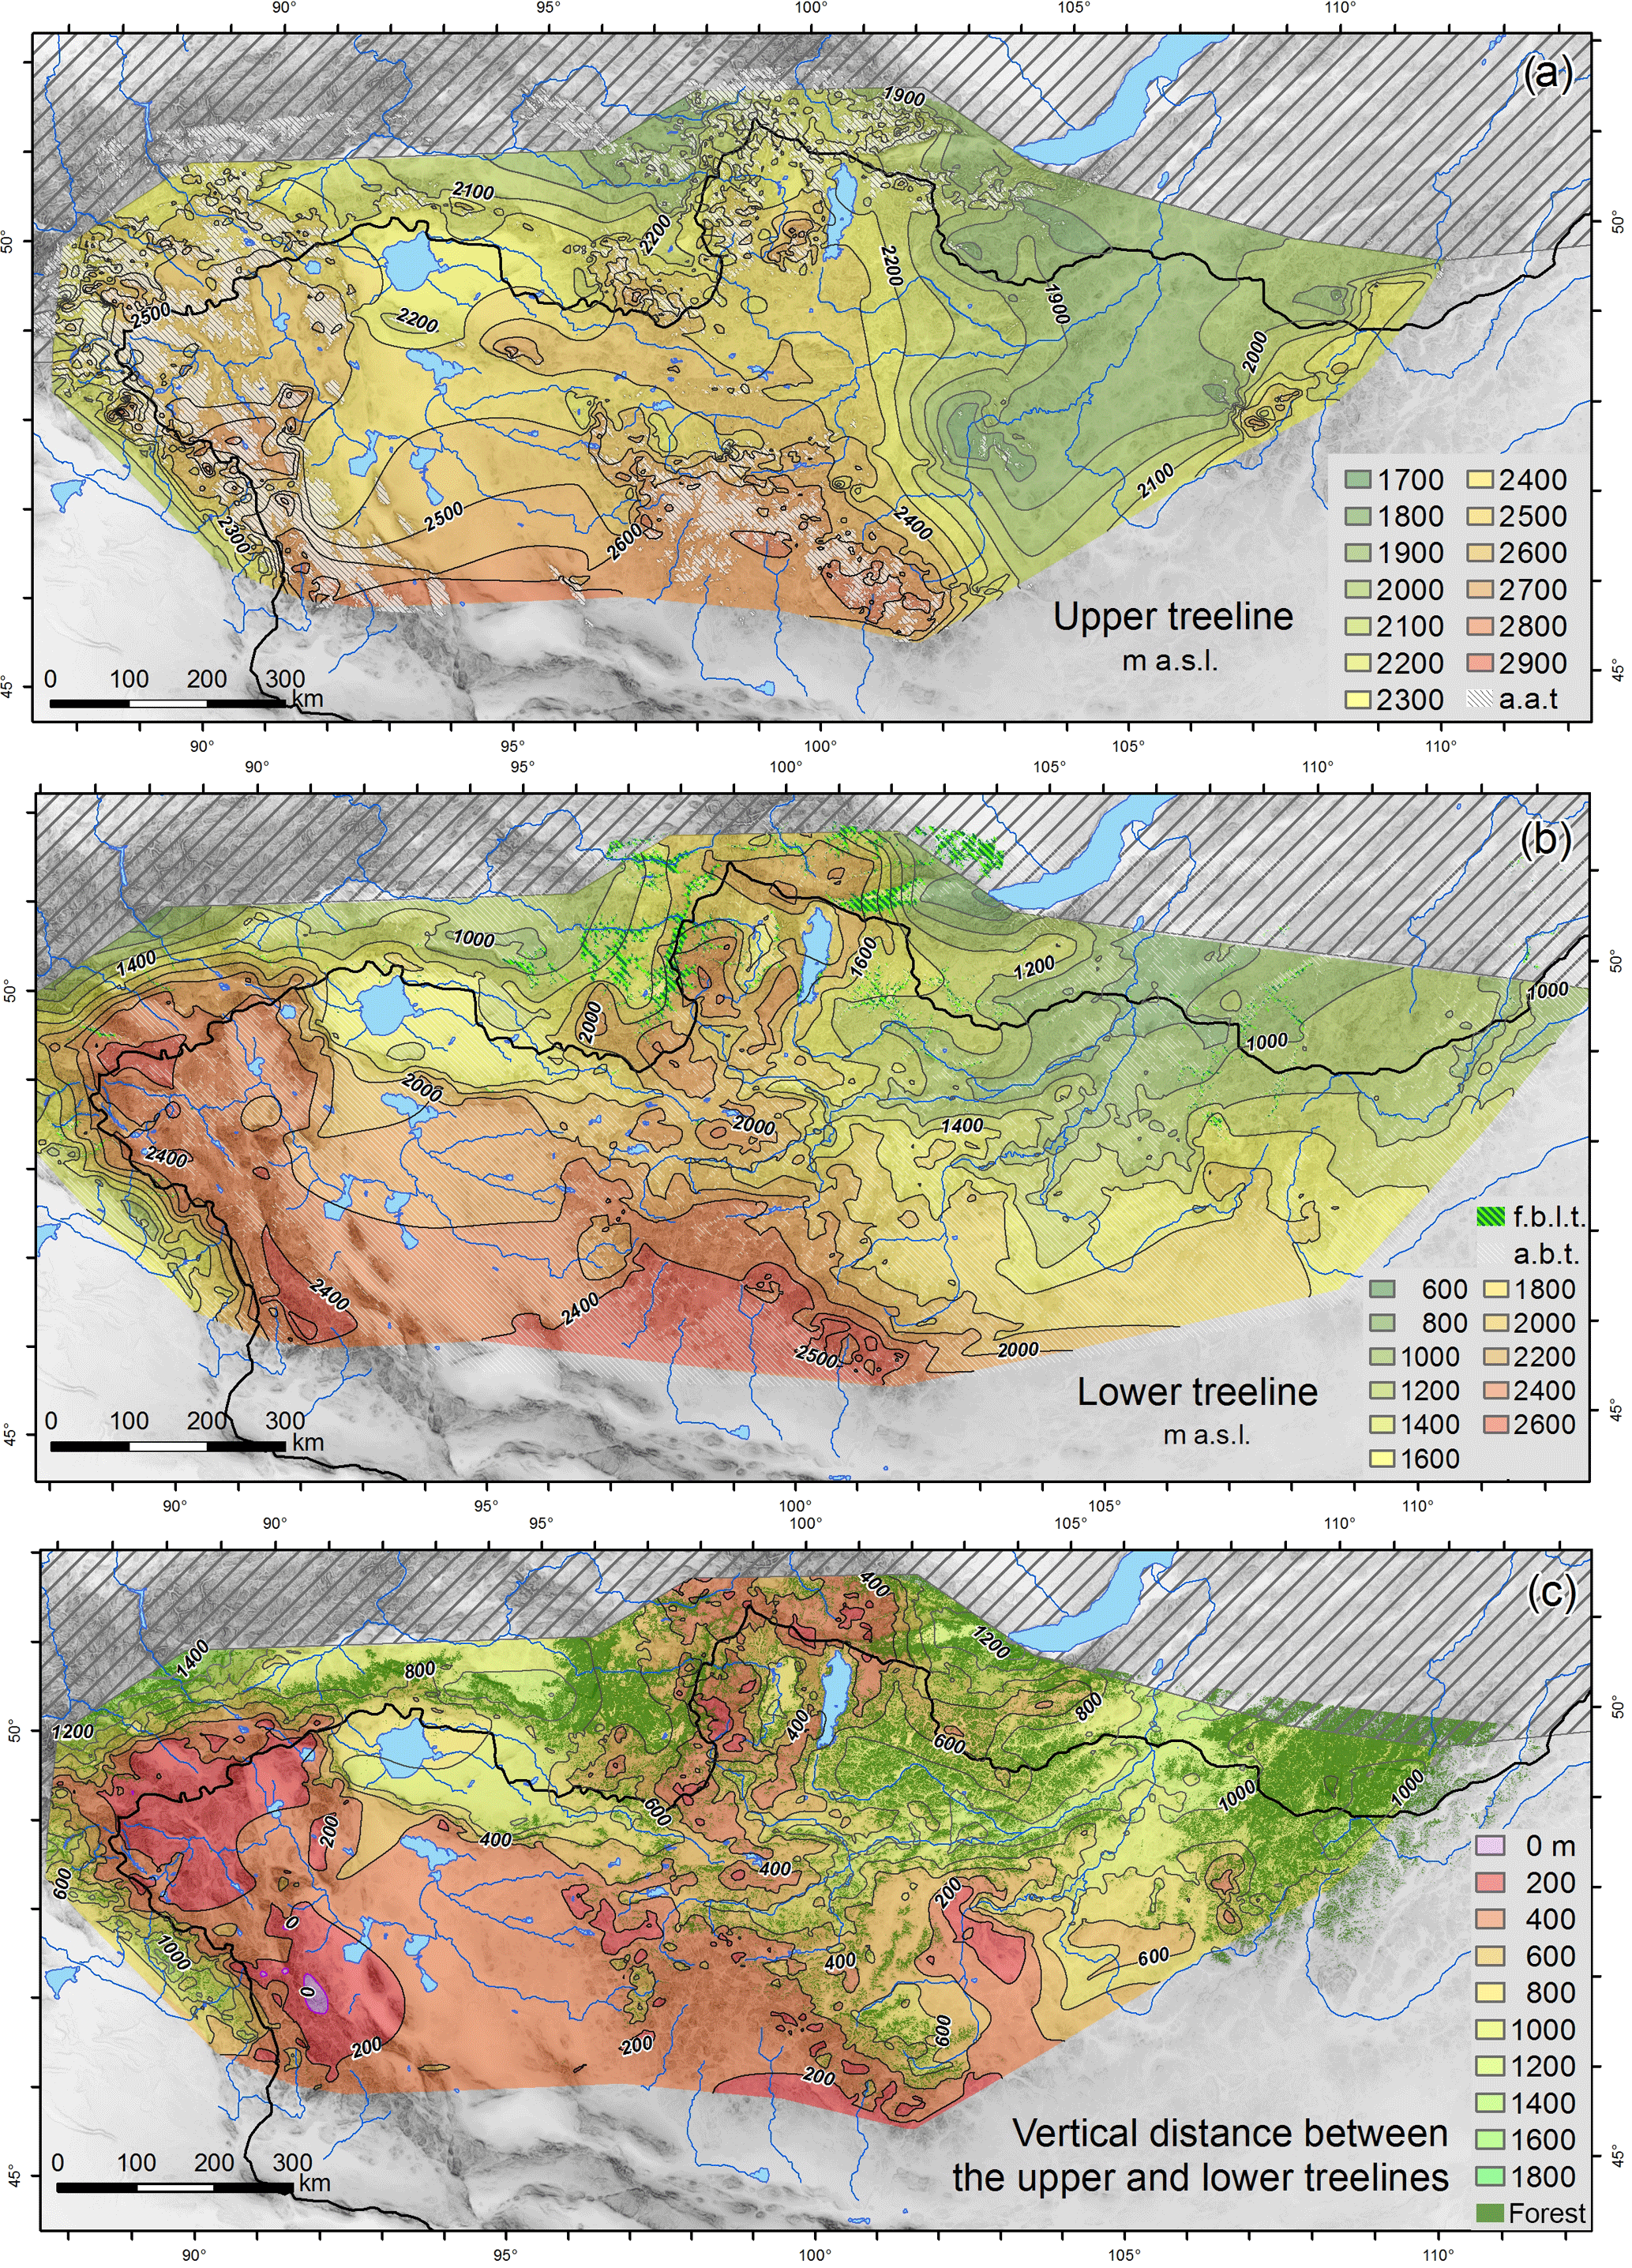
Figure 4Treeline distribution maps of Mongolia: (a) upper treeline, (b) lower treeline, (c) vertical distance between upper and lower treeline (a.a.t. = area above the upper treeline, a.b.t. = area beneath the lower treeline, f.b.l.t. = forest below the lower treeline, a.s.l. = above sea level).
4.1 Treeline distribution
The actual total area of Mongolian southern boreal forest was estimated at 73 818 km2 (Dulamsuren et al., 2016). The proportion of forested areas related to the total areas of the ecological units and subunits at the treelines are given in Table 3. The approximate forest proportion for all three ecological units is 40 % and the highest proportions occur in the taiga and at all UTs. As expected for an ecotone, low forest densities occur in the forest–steppe, but this is also true for LTs of all forest types. Figure 4 shows the forest distribution, the treelines, the vertical distance of the forest belt and the area beyond the treelines in northern Mongolia. No treeline continuance is indicated in the southern part of Mongolia due to missing boreal forests in the desert. The treeline distribution in western Mongolia generally corresponds to the results from Klinge et al. (2003), who investigated forest distribution in the Altai Mountains based on topographic maps.
Large areas above the UT occur in the MA, in the southern part of KaM and east of Lake Khuvsgul. In the KeM, areas above the treeline in > 2500 m a.s.l. are small. The UTs show a general rise from 2200 m a.s.l. at the mountains in the north of Uvs Nur and from 1800 m a.s.l. south of Lake Baikal to 2700 m a.s.l. in the southern parts of the MA and the KaM (Fig. 4a). At the southwestern side of the MA the UT rises steeply from 2100 to 2600 m a.s.l. in a northeastern direction. In the large mountain systems of the MA and KaM the UT stays in a relative constant altitude between 2400 and 2600 m a.s.l. Northeast of KaM, the UT has an explicit longitudinal direction and a UT depression of up to 800 m occurs in the basin of the Selenga River. It was verified using the forest cover change data of Hansen et al. (2013) that the extraordinarily low UT at 1800 m a.s.l. is not related to burnt forest. In large burnt areas, as they occur for example in the northern KaM, it could be expected that the actual treeline is shifted and may not represent the natural limit. However, small forest patches that remain vital represent the potential forested area. Relic forest stands provide valuable treeline values in the modeling process and help to identify areas of human or natural forest disturbance (Klinge et al., 2015; Miehe et al., 2003).
Large areas below the LT exist in the great basins and along the main river valleys, but they are also present in the intermontane basins (Fig. 4b). While the subtaiga is bordering the meadow–steppe, the lower treeline seldom occurs in the taiga and forests extend continuously into the valley bottom. Nevertheless, at smaller intermontane basins and valleys a lower forest boundary is still detectable in the Mongolian taiga. Concordant with the intensifying aridity, the LT is generally rising southward from 1000 to 2500 m a.s.l. in eastern Mongolia. The strong rise of the LT at the north- and southwestern slopes of the Altai Mountains is due to the convective rainfall in the western ranges and the eastward intensification of aridity in the MA.
The forested area of central Mongolia, which remains between the large areas beyond the treelines, is small from the top-down view. However, the spatial expansion of forests has a particular vertical component (Fig. 4c). The maximum altitudinal expansion of the forest belt of up to 1000 m vertical distance occurs in the northwestern subtaiga and taiga. In the mountain forest–steppe of the central MA, the western KaM and in the mountains at Lake Khuvsgul, the altitudinal extent of forests reduces below 400 m. In the southeastern part of the MA, the UT and LT converge, the forest belt disappears, and the mountain steppe directly passes over into the alpine belt. Due to the extraordinarily low UT, thin forest belts also occur in the area northeast of the KaM and in the southwestern part of KeM. This can be related to human impact by forest clearing in a more populated region.
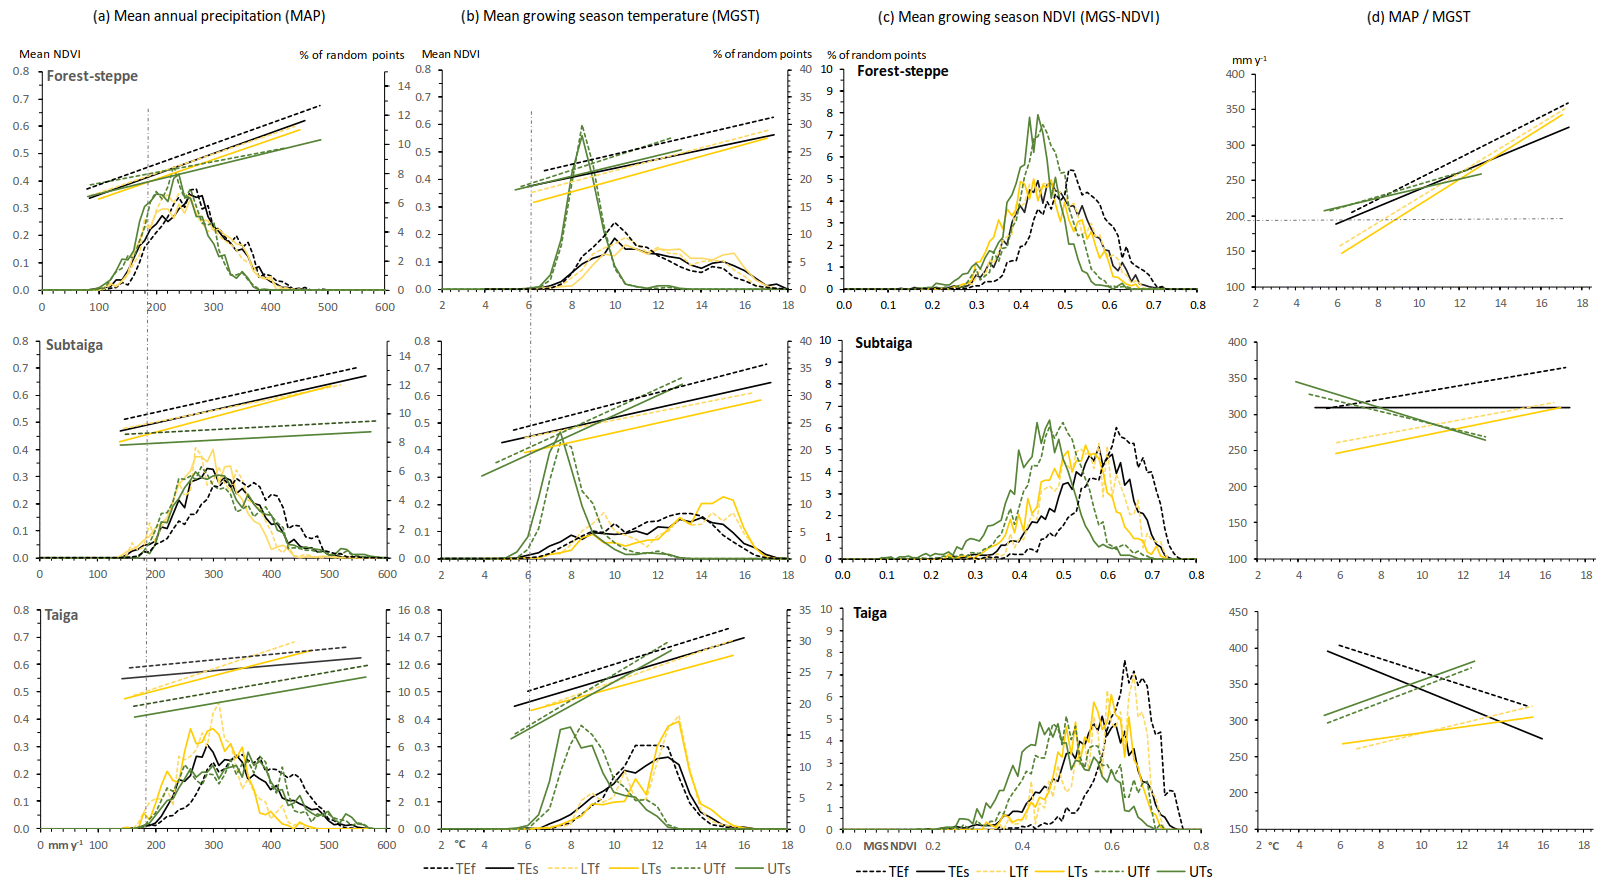
Figure 5Mean annual precipitation (MAP) and mean air temperature during the growing season (MGST) related to the mean growing season NDVI of random points of different ecosystem units (values averaged for the investigation period 1999–2013). The straight lines represent the linear regressions between climate parameters and NDVI. The distribution curves represent the frequency of random points (%). Dashed lines represent forest values (f), continuous lines represent grassland values (s), yellow colors represent lower treeline values (LT), green color represents upper treeline values (UT) and black colors represent the total ecological unit values (TE). Vertical grey dashed lines indicate the deduced minimum values for tree growth.
Most precipitation is combined with westerlies, which produce humid condition at the western side of the Altai Mountains. In the rain shadow at the eastern side in the central MA and in the Valley of the Great Lakes dry conditions occur. This causes an extraordinarily high LT and the small vertical extent of the forest belt in this region (Klinge et al., 2003). The southern side of the KaM is still arid, but its northern part and particularly the KeM receive more precipitation coming from the northeast along the Selenga river depression. The tree species composition of the different boreal forest types and subunits is given in Fig. S3 in the Supplement.
4.2 Specific climate parameters of boreal forest types
The zonal statistics for the climate parameters and MGS-NDVI in different boreal forest types are given in Table 1 and the correlation matrix among MGS-NDVI, MAP, MGST and MGSR is presented in Table 2. Figure 5 illustrates the frequency distributions and linear regressions between these parameters. The average MAP of the TE forests generally rises from 266 mm yr−1 in the forest–steppe to 339 mm yr−1 in the subtaiga and 357 mm yr−1 in the taiga (Table 1). Due to the expected hydrological limitation, the MAP at the LT is lower than the respective average of the TE. This is also true for all forest subunits at the UTs, where the MAP is about 30 mm yr−1 lower than the mean of the TE forests. This phenomenon is due to the lower temperatures in higher mountains, which reduce the evapotranspiration pressure. Moreover, the average MAP at the UT of the forest–steppe is even lower than at the LT. However, sites with extremely low MAP, below 190 mm yr−1 (Fig. 5a), receive additional soil water supply. The grassland has predominantly lower average values of MAP than the forest of the corresponding ecological unit. This general relation inverts at the UTs of the subtaiga and taiga, while there are nearly equal values at the LTs of the forest–steppe and taiga.
The average MGST of any TEs are very similar between 11.0 and 11.7 ∘C. However, the maximum of 16 ∘C in the taiga is lower than in the forest–steppe and subtaiga where it is up to 18 ∘C (Fig. 5b). While all average values of MGST at the LTs equate to the TE values, the UTs show frequency maxima of the MGST between 7.5 and 8.9 ∘C (Table 1). With the exception of the UT in the subtaiga and taiga, in all subunits, the grassland has similar or slightly higher temperatures as the forest of the same unit. The phenomenon of an inversion of the general relation at the UT of the subtaiga and taiga, which occurs simultaneously to the MAP, is due to a change in grassland vegetation. Alpine shrub and meadow vegetation are supported by the cold and more humid climate and replace the mountain meadow steppe. The MGST of all TEs and LTs shows similar frequency distributions with wide value ranges and slightly higher values at the LTs (Fig. 5b). However, the narrow and uniform frequency distributions of all UTs indicate that the MGST is the main controlling parameter for forest distribution at the UT with an absolute minimum value of 6 ∘C. A considerable portion of MGSTs at the UTs occur between 10 and 13 ∘C, which is marginal in the forest–steppe and subtaiga but becomes more important in the taiga.
4.3 Relationship between climate and NDVI in different types of boreal forest
The average values of MGS-NDVI of Table 1 show only small variation between the TE and the treeline subunits. The values rise from forest–steppe to taiga and are higher in the forested area compared to the grassland of the same subunit. The inverse relation between forest and grassland of the same subunit, which occur for MAP and MGST at the UT of subtaiga and taiga, does not exist for the NDVI. The frequency distributions of MSG-NDVI for the subunits in the forest–steppe are nearly similar but clearly separated in the other types of boreal forest (Fig. 5c). The UTs have the lowest and the TEs have the highest NDVI values, which is generally due to less favorable ecological site conditions at the forest boundaries. In Table 2 most of the TEs show good correlations between NDVI and the climate parameters (r=0.44–0.71), with an obvious exception of the MAP and the taiga. Linear regressions of the terrain parameter MGSR are omitted in Fig. 5, because MGSR is only weakly correlated to the NDVI in all subunits.
In accordance with the correlation coefficients given in Table 2, the linear regressions between MGS-NDVI, MAP and MGST (Fig. 5) illustrate the relationship between the environmental conditions and the types of boreal forest and their respective treelines. The regression trends indicate a potential susceptibility of the ecological unit to climate changes. There are mostly low correlations between MGS-NDVI and MAP at most subunits. The only exceptions are the TE and the LT of the forest–steppe and particular the LT in the forest subunit of the taiga. However, the gradients of linear regression indicate potential relations between NDVI and MAP for all LTs and particularly for all subunits in the forest–steppe (Fig. 5a). Both the correlation values and the linear regressions between MGS-NDVI and MGST (Fig. 5b) indicate strong dependencies for all subunits; the UT of the forest–steppe is an exception from this rule, since only weak correlation was found. However, the steep gradient of the linear regressions at all UTs accentuates the temperature as the main limiting parameter with increasing influence towards the taiga. Presupposing that at least precipitation, temperature and solar radiation input control the vitality of the vegetation and the treeline distribution, but with different intensities for every subunit, the multi-regression correlations between NDVI and MAP, MGST and MGSR are generally higher. However, the combination of the two climate parameters MAP and MGST shows the best correlations with the NDVI, while the combination of all three parameters only leads to a marginal improvement (Table 2).
The high positive correlations between MAP and MGST and the high negative correlation between MGST and MGSR in the TE and at the LT of the forest–steppe indicate a specific environmental interrelation and potential autocorrelation effects between these two climate parameters in the semiarid climate zone. This is due to the fact that in the forest–steppe the increasing atmospheric vapor pressure deficit, which results from higher temperatures, must be compensated for by more precipitation, on the one hand, and by less solar radiation input, on the other hand. However, the weak correlation between MAP and MGST in all subunits of the subtaiga and taiga indicates a climate-independent factor. This is notably attributable to permafrost distribution as a supplemental ecological parameter, which is not included in our regression models but modifies the soil hydrological regime. Regression gradients between MAP and MGST of the TEs change from the strong positive gradient in the forest–steppe into a less precipitation-dependent gradient in the subtaiga and then into a negative gradient in the taiga (Fig. 5d). The rising MAP produces a more humid climate in the taiga and reduces the dependency of vegetation vitality in the TE on precipitation limits. Low temperatures as a zonal climatic parameter become a dominating limit for tree development towards higher latitudes. Concordant with the transformation of ecological conditions, the physiological constitution of individual trees and the tree species composition change from drought-adapted individuals to low-temperature-adapted but more drought-sensitive individuals.
Trees grow and exist for several decades or centuries and establish an autochthonous microclimate below the canopy; thus, forests represent mean climatic conditions of a longer period. In contrast, the vitality of annual or perennial grasses and herbs of the steppes and meadows respond to interannual variation in climate conditions, and the vegetation density represents small-scale periods (Bat-Oyun et al., 2016). The treelines represent boundaries of forest distribution at the ecological limits and it is hypothesized that changes in climate or environmental conditions at these boundaries lead to an alteration of the treelines. On the one hand, forest expansion needs a longer period of favorable conditions for seed formation, as well as seedling and sapling establishments. The requirements can be different from those of mature trees. On the other hand, declines in the forest area can be induced by short hazardous events like drought, freeze, calamities or fire. Human impact on the forest area since prehistoric times is another important influence on the actual treeline (Klinge et al., 2015; Miehe et al., 2003). The treeline might be shifted as the result of climate changes with a certain time lag. Although the treeline may not directly correspond to the current climatic envelope for forest, it represents at least the minimum potential forest area. In view of the ecological relations, the spatial accuracy of the actual database, and the regional scale of the investigation, it is reasonable to calculate average values for a longer period to receive representative parameters.
The lower boundaries of the distribution curves (Fig. 5a) and the standard deviation of MAP (Table 1) indicate that an approximate MAP of 190 mm yr−1 can be regarded as the minimum amount of direct rainfall for tree development in Mongolia. Dulamsuren et al. (2010a) reported an annual precipitation between 230 and 400 mm for larch trees (Larix sibirica) at the lower forest boundary in northern and central Mongolia. For the northern Tian Shan, Klinge et al. (2015) state a minimum MAP of 250 mm for the distribution limit of spruce trees (Picea schrenkiana). Sites with lower MAP values, occurring in parts of the forest–steppe, are favored by additional soil water supply from upslope areas or melting permafrost ice, which can support tree growth under these dry conditions where rainfall is insufficient (Dulamsuren et al., 2014). This explains why Dulamsuren et al. (2014) found coniferous forests in regions with an annual precipitation of around 120 mm in the MA. The annual amount of precipitation is highly varying in the steppes region and the permafrost layer can bridge drought years by accumulating soil water in the soil ice reservoir during moist years (Sugimoto et al., 2002). The vegetation vitality as expressed by the NDVI is generally lower in the forest–steppe than in the subtaiga and the taiga. This fact reflects the extreme ecological limitations of forests in the forest–steppe ecotone. Recently emerging margins of dead trees around the forest islands are apparently induced by the trend in increasing temperature, insufficient precipitation and missing soil water storage from disappearing discontinuous permafrost.
The proportion of open grassland area to forest islands in the southern forest–steppe changes towards northern latitudes with the expansion of forest area. In the large valleys of the taiga and subtaiga in northern Mongolia, where trees are apparently less limited by water shortage, a LT does not exist. However, inside the dense woodland of the taiga, the grassland occurs in intramontane basins (Dulamsuren et al., 2005; Gunin et al., 1999; Hilbig, 1995). The rain shadow of the surrounding mountains keeps precipitation extraordinarily low and thus a LT is present. The high correlation of the detected LTs to MAP in the taiga suggests a primarily drought-induced and not anthropogenic position of the LT. This finding points to a high vulnerability of the trees at the taiga's LT to climate warming. This conclusion is supported by ecophysiological, dendrochronological and palynological studies from the LT of the mountain taiga of western Khentei (Dulamsuren et al., 2009a, 2010b; Schlütz et al., 2008).
There is a close correlation between NDVI and MGST at the UT in the taiga and the subtaiga (Table 2). At the UT of the forest–steppe, precipitation is an additional limiting factor at higher elevations. While a MGST of 6 ∘C tends to be the general minimum temperature for tree growth in the study area, at some places at the UT of the subtaiga, trees occur at MGST as low as 4 ∘C (Fig. 5b). Here, the low MGST is associated with high MAP of roughly 350 mm yr−1 (Fig. 5d). In the low temperature range between 6 and 8 ∘C, the linear regressions between MAP and MGST at the UT show that different MAP conditions exist simultaneously for the different types of boreal forest (Fig. 5d). In the forest–steppe at 6 ∘C MGST, MAP is approximately 200 mm yr−1, whereas it amounts to 320 mm yr−1 in the subtaiga and 400 mm yr−1 in the taiga. This combination between both low precipitation and temperature is extreme at the LT of the forest–steppe. In the range of 6–8 ∘C MGST, MAP tends to be below the tree growth minimum of 190 mm yr−1, which emphasizes again the impact of permafrost, as the permafrost is also associated with low temperatures.
Differing frequency distributions show that the NDVI at the UT and LT is generally lower than in the TEs of the taiga and the subtaiga, except for the forest–steppe (Fig. 5c). The low NDVI values indicate low vegetation vitality. This suggests that forests composing the treelines in the taiga and the subtaiga and the complete forest–steppe ecotone are exposed to physiological stress. Forests in the taiga receive generally more precipitation and thus have developed higher stand densities and are also home to more water-demanding dark taiga tree species like Abies sibirica and Pinus sibirica (Dulamsuren, 2004; Dulamsuren et al., 2010a). Reports of increased drought stress, reduced stemwood formation, reduced forest regeneration and increased tree mortality, especially in the Larix sibirica-dominated forest–steppe ecotones of inner Asia, support this conclusion (Dulamsuren et al., 2010a, b, 2013; Liu et al., 2013).
Recent climate change scenarios predict a temperature increase in Mongolia of up to 5 ∘C until the end of the century (Ministry of the Environment Japan, 2015), while projections for precipitation trends show spatial differences between decreasing precipitation amounts in the north and an increase in the southern parts (Sato et al., 2007). In general, climate modeling also suggests a future increase of summer droughts and a decrease in soil moisture (Sato et al., 2007). Higher temperatures yield higher evapotranspiration and hence to less relative humidity, even if a slight increase of precipitation simultaneously occurs. The consequences of increasing aridity and an increasing atmospheric vapor deficit are a reduction in tree vitality, which finally might lead to widely increased tree mortality and forest area loss in the forest–steppe, subtaiga and taiga. In addition, this trend could promote of Pinus sylvestris in parts of the Larix sibirica-dominated forest–steppe (Dulamsuren et al., 2009b).
Using high-resolution remote sensing and climatic data allows the characterization of the climatic envelope of the three types of boreal forest in Mongolia as well as identification of hotspots of additional natural or anthropogenic factors. It was shown that the NDVI distribution between forest and grassland of the same ecological subunits differs, which is mainly controlled by different photosynthetic activity, vegetation density and seasonal growth. However, with respect to the small-scale variation of the vegetation and the resolution of the NDVI data, a spatial overlap producing mixed data values cannot be totally avoided. The ecological relationship between climatic parameters and forest or treeline distribution was verified by the NDVI as an indicator for vegetation vitality. It can be assumed that local site conditions like permafrost distribution, soil parameters and hydrology may also play an important role in vegetation vitality. The statistical results on geoecological relations presented in this work are suited to be used for modeling of potential past, current and future forest areas.
The observed recent increase of forest greening indices from remote sensing data and stemwood increment found in several places by Poulter et al. (2013) is combined with increasing summer temperature but also promoted by additional soil water supply from melting permafrost. However, disappearing permafrost and increasing drought stress, as projected by climate modeling, may cause dramatic loss of forest cover in future. The widespread occurrence of dead tree margins around forest islands shows that this trend is already ongoing as the result of climate warming. Trees suffering from drought stress are more vulnerable to insect calamities. The impact of forest fires also increases under dryer conditions. For all LTs and for the TE of the forest–steppe, increasing temperatures are likely to result in increased tree mortality, the reduction of forested area and shifting of the LTs.
Research on NDVI trends and climate development in Mongolia is often lacking detailed spatial separation of the different ecological units. Every vegetation unit has its own temporally defined ecological environment, which produces different spatial and temporal gradients in remote sensing-derived vegetation indices. Changes in climate conditions will lead to more or less vitality in the limited physiological range of the individual trees, which are adapted to recent local climate and soil conditions. Forest dynamics and forest development from the biological point of view mean change in the vegetation structure and biodiversity, which cannot be exclusively modeled by greening indices (Busing and Mailly, 2004; Miao et al., 2015; Poulter et al., 2013). It was shown that the creation of detailed landscape stratification and of small-scale ecological classifications could assist in incorporating spatial and temporal transitions of vegetation units in environmental modeling.
The GIS data for the upper and lower treeline as well as the areas above and below the treeline are provided in the Supplement of this article.
The supplement related to this article is available online at: https://doi.org/10.5194/bg-15-1319-2018-supplement.
The authors declare that they have no conflict of interest.
The authors would like to thank the US Geological Survey and VITO, Belgium, for making the satellite data freely available for scientific research. We acknowledge support by the Open Access Publication Funds of Göttingen University. We very specially thank Jan Degener for his scientific support in data processing and intensive discussion. We also thank Udo Schickhoff and an anonymous referee for the valuable comments which improved the paper.
Funded by the Deutsche Forschungsgemeinschaft (DFG) – Projektnummern FR
877/32 and DU 1145/4-1.
This open-access
publication was funded
by the University of Göttingen.
Edited by: Jochen Schöngart
Reviewed by:
Udo Schickhoff and one anonymous referee
Academy of Sciences of Mongolia and Academy of Sciences of USSR: National Atlas of the Peoples Republic of Mongolia, Ulan Baatar, Moscow, 144 pp., 1990.
Barthel, H.: Die regionale und jahreszeitliche Differenzierung des Klimas in der Mongolischen Volksrepublik, Studia geographica, 34, 3–91, 1983.
Batima, P., Natsagdorj, L., Gombluudev, P., and Erdenetsetseg, B.: Observed climate change in Mongolia, AIACC Working Papers, 12, 1–25, 2005.
Bat-Oyun, T., Shinoda, M., Cheng, Y., and Purevdorj, Y.: Effects of grazing and precipitation variability on vegetation dynamics in a Mongolian dry steppe, JPECOL, 9, 508–519, https://doi.org/10.1093/jpe/rtv083, 2016.
Bayartaa, N., Goldammer, G., and Uibrig, H.: Fire situation in Mongolia, in: International Forest Fire News, edited by: Goldammer, G., 36, 46–66, 2007.
Böhner, J.: General climatic controls and topoclimatic variations in Central and High Asia, Boreas, 35, 279–295, https://doi.org/10.1080/03009480500456073, 2006.
Busing, R. T. and Mailly, D.: Advances in spatial, individual-based modelling of forest dynamics, J. Veg. Sci., 15, 831–842, https://doi.org/10.1111/j.1654-1103.2004.tb02326.x, 2004.
Dashkhuu, D., Kim, J. P., Chun, J. A., and Lee, W.-S.: Long-term trends in daily temperature extremes over Mongolia, Weather and Climate Extremes, 8, 26–33, https://doi.org/10.1016/j.wace.2014.11.003, 2015.
Dashtseren, A., Ishikawa, M., Iijima, Y., and Jambaljav, Y.: Temperature Regimes of the Active Layer and Seasonally Frozen Ground under a Forest-Steppe Mosaic, Mongolia, Permafrost Periglac., 25, 295–306, https://doi.org/10.1002/ppp.1824, 2014.
Dee, D. P., Uppala, S. M., Simmons, A. J., Berrisford, P., Poli, P., Kobayashi, S., Andrae, U., Balmaseda, M. A., Balsamo, G., Bauer, P., Bechtold, P., Beljaars, A. C. M., van de Berg, L., Bidlot, J., Bormann, N., Delsol, C., Dragani, R., Fuentes, M., Geer, A. J., Haimberger, L., Healy, S. B., Hersbach, H., Hólm, E. V., Isaksen, L., Kållberg, P., Köhler, M., Matricardi, M., McNally, A. P., Monge-Sanz, B. M., Morcrette, J.-J., Park, B.-K., Peubey, C., Rosnay, P. de, Tavolato, C., Thépaut, J.-N., and Vitart, F.: The ERA-Interim reanalysis: Configuration and performance of the data assimilation system, Q. J. Roy. Meteor. Soc., 137, 553–597, https://doi.org/10.1002/qj.828, 2011.
Dorjsuren, C.: Anthropogenic succession in larch forests of Mongolia, Biological Resources and Natural Conditions of Mongolia, Vol. 50, 1–260, Nauka, Moscow, 2009 (in Russian).
Dulamsuren, C.: Floristische Diversität, Vegetation und Standortbedingungen in der Gebirgstaiga des Westkhentej, Nordmongolei, Berichte des Forschungszentrums Waldökosysteme, Reihe A, 191, 1–290, 2004.
Dulamsuren, C., Hauck, M., and Mühlenberg, M.: Ground vegetation in the Mongolian taiga forest-steppe ecotone does not offer evidence for the human origin of grasslands, Appl. Veg. Sci., 8, 149–154, https://doi.org/10.1658/1402-2001(2005)008[0149:GVITMT]2.0.CO;2, 2005.
Dulamsuren, C., Hauck, M., Bader, M., Osokhjargal, D., Oyungerel, S., Nyambayar, S., Runge, M., and Leuschner, C.: Water relations and photosynthetic performance in Larix sibirica growing in the forest-steppe ecotone of northern Mongolia, Tree Physiol., 29, 99–110, https://doi.org/10.1093/treephys/tpn008, 2009a.
Dulamsuren, C., Hauck, M., Bader, M., Oyungerel, S., Osokhjargal, D., Nyambayar, S., and Leuschner, C.: The different strategies of Pinus sylvestris and Larix sibirica to deal with summer drought in a northern Mongolian forest–steppe ecotone suggest a future superiority of pine in a warming climate, Can. J. Forest Res., 39, 2520–2528, https://doi.org/10.1139/X09-156, 2009b.
Dulamsuren, C., Hauck, M., Khishigjargal, M., Leuschner, H. H., and Leuschner, C.: Diverging climate trends in Mongolian taiga forests influence growth and regeneration of Larix sibirica, Oecologia, 163, 1091–1102, https://doi.org/10.1007/s00442-010-1689-y, 2010a.
Dulamsuren, C., Hauck, M., and Leuschner, C.: Recent drought stress leads to growth reductions in Larix sibirica in the western Khentey, Mongolia, Glob. Change Biol., 16, 3024–3035, https://doi.org/10.1111/j.1365-2486.2009.02147.x, 2010b.
Dulamsuren, C., Wommelsdorf, T., Zhao, F., Xue, Y., Zhumadilov, B. Z., Leuschner, C., and Hauck, M.: Increased Summer Temperatures Reduce the Growth and Regeneration of Larix sibirica in Southern Boreal Forests of Eastern Kazakhstan, Ecosystems, 16, 1536–1549, https://doi.org/10.1007/s10021-013-9700-1, 2013.
Dulamsuren, C., Khishigjargal, M., Leuschner, C., and Hauck, M.: Response of tree-ring width to climate warming and selective logging in larch forests of the Mongolian Altai, J. Plant Ecol., 7, 24–38, https://doi.org/10.1093/jpe/rtt019, 2014.
Dulamsuren, C., Klinge, M., Degener, J., Khishigjargal, M., Chenlemuge, T., Bat-Enerel, B., Yeruult, Y., Saindovdon, D., Ganbaatar, K., Tsogtbaatar, J., Leuschner, C., and Hauck, M.: Carbon pool densities and a first estimate of the total carbon pool in the Mongolian forest-steppe, Glob. Change Biol., 22, 830–844, https://doi.org/10.1111/gcb.13127, 2016.
Eckert, S., Hüsler, F., Liniger, H., and Hodel, E.: Trend analysis of MODIS NDVI time series for detecting land degradation and regeneration in Mongolia, J. Arid Environ., 113, 16–28, https://doi.org/10.1016/j.jaridenv.2014.09.001, 2015.
Erasmi, S., Schucknecht, A., Barbosa, M., and Matschullat, J.: Vegetation Greenness in Northeastern Brazil and Its Relation to ENSO Warm Events, Remote Sensing, 6, 3041–3058, https://doi.org/10.3390/rs6043041, 2014.
Giese, E., Mossig, I., Rybski, D., and Bunde, A.: Long-term analysis of air temperature trends in Central Asia, Erdkunde, 61, 186–202, 2007.
Goldammer, G.: Fire Situation in Mongolia, in: International Forest Fire News, United Nations, New York and Geneva, 26, 75–83, 2002.
Goldammer, G. (Ed.): International Forest Fire News, 36, 97 pp., 2007.
Gunin, P. and Vostokova, E.: Ecosystems of Mongolia: Atlas, Moscow, 48 pp., 2005.
Gunin, P. D., Vastokova, E. A., Dorofeyuj, N. I., Tarasov, P. E., and Black, C. C.: Vegetation dynamics of Mongolia, Geobotany, 26, Kluwer Academic Publishers, Dordrecht, Boston, London, 238 pp., 1999.
Hais, M., Chytrý, M., and Horsák, M.: Exposure-related forest-steppe: A diverse landscape type determined by topography and climate, J. Arid Environ., 135, 75–84, https://doi.org/10.1016/j.jaridenv.2016.08.011, 2016.
Hansen, M. C., Potapov, P. V., Moore, R., Hancher, M., Turubanova, S. A., Tyukavina, A., Thau, D., Stehman, S. V., Goetz, S. J., Loveland, T. R., Kommareddy, A., Egorov, A., Chini, L., Justice, C. O., and Townshend, J. R. G.: High-resolution global maps of 21st-century forest cover change, Science, 342, 850–853, https://doi.org/10.1126/science.1244693, 2013.
Harris, I., Jones, P. D., Osborn, T. J., and Lister, D. H.: Updated high-resolution grids of monthly climatic observations – the CRU TS3.10 Dataset, Int. J. Climatol., 34, 623–642, https://doi.org/10.1002/joc.3711, 2014.
Hilbig, W.: The vegetation of Mongolia, SPB Acad. Publ., Amsterdam, 258 pp., 1995.
Holdridge, L.: Determination of world plant formations from simple climatic data, Science, 105, 367–368, 1947.
Jobbágy, E. G. and Jackson, R. B.: Global controls of forest line elevation in the northern and southern hemispheres, Global Ecol. Biogeogr., 9, 253–268, 2000.
Karger, D. N., Conrad, O., Böhner, J., Kawohl, T., Kreft, H., Soria-Auza, R. W., Zimmermann, N. E., Linder, H. P., and Kessler, M.: Climatologies at high resolution for the earth's land surface areas, Scientific data, 4, 170122, https://doi.org/10.1038/sdata.2017.122, 2017.
Khansaritoreh, E., Dulamsuren, C., Klinge, M., Ariunbaatar, T., Bat-Enerel, B., Batsaikhan, G., Ganbaatar, K., Saindovdon, D., Yeruult, Y., Tsogtbaatar, J., Tuya, D., Leuschner, C., and Hauck, M.: Higher climate warming sensitivity of Siberian larch in small than large forest islands in the fragmented Mongolian forest steppe, Glob. Change Biol., https://doi.org/10.1111/gcb.13750, 2017.
Klinge, M.: Glazialgeomorphologische Untersuchungen im Mongolischen Altai als Beitrag zur jungquartären Landschafts- und Klimageschichte der Westmongolei, Aachener Geographische Arbeiten, 35, Aachen, 125 pp., 2001.
Klinge, M., Böhner, J., and Lehmkuhl, F.: Climate patterns, snow- and timberlines in the Altai Mountains, Central Asia, Erdkunde, 57, 296–308, 2003.
Klinge, M., Böhner, J., and Erasmi, S.: Modeling forest lines and forest distribution patterns with remote-sensing data in a mountainous region of semiarid central Asia, Biogeosciences, 12, 2893–2905, https://doi.org/10.5194/bg-12-2893-2015, 2015.
Körner, C.: Alpine treelines: Functional ecology of the global high elevation tree limits, Springer, Basel, 220 pp., 2012.
Liu, H., Park Williams, A., Allen, C. D., Guo, D., Wu, X., Anenkhonov, O. A., Liang, E., Sandanov, D. V., Yin, Y., Qi, Z., and Badmaeva, N. K.: Rapid warming accelerates tree growth decline in semi-arid forests of Inner Asia, Glob. change Biol., 19, 2500–2510, https://doi.org/10.1111/gcb.12217, 2013.
Lu, D., Chen, Q., Wang, G., Liu, L., Li, G., and Moran, E.: A survey of remote sensing-based aboveground biomass estimation methods in forest ecosystems, Int. J. Digit. Earth, 9, 63–105, https://doi.org/10.1080/17538947.2014.990526, 2014.
Miao, L., Liu, Q., Fraser, R., He, B., and Cui, X.: Shifts in vegetation growth in response to multiple factors on the Mongolian Plateau from 1982 to 2011, Phys. Chem. Earth, 87–88, 50–59, https://doi.org/10.1016/j.pce.2015.07.010, 2015.
Miehe, G., Miehe, S., Koch, K., and Will, M.: Sacred Forests in Tibet, Mt. Res. Dev., 23, 324–328, https://doi.org/10.1659/0276-4741(2003)023[0324:SFIT]2.0.CO;2, 2003.
Ministry of the Environment Japan: Climate change in Mongolia: Output from GCM, 12 pp., available at: https://www.env.go.jp/en/focus/docs/files/20150331-85.pdf (last access: 2 March 2018), 2015.
Murzaev, E. M.: Die Mongolische Volksrepublik – Physisch-geographische Beschreibung, Gotha, VEB Geograph.-Kartograph. Anst., 521 pp., 1954.
Paulsen, J. and Körner, C.: A climate-based model to predict potential treeline position around the globe, Alp Botany, 124, 1–12, https://doi.org/10.1007/s00035-014-0124-0, 2014.
Poulter, B., Pederson, N., Liu, H., Zhu, Z., D'Arrigo, R., Ciais, P., Davi, N., Frank, D., Leland, C., Myneni, R., Piao, S., and Wang, T.: Recent trends in Inner Asian forest dynamics to temperature and precipitation indicate high sensitivity to climate change, Agr. Forest Meteorol., 178–179, 31–45, https://doi.org/10.1016/j.agrformet.2012.12.006, 2013.
Sato, T., Kimura, F., and Kitoh, A.: Projection of global warming onto regional precipitation over Mongolia using a regional climate model, J. Hydrol., 333, 144–154, https://doi.org/10.1016/j.jhydrol.2006.07.023, 2007.
Schlütz, F., Dulamsuren, C., Wieckowska, M., Mühlenberg, M., and Hauck, M.: Late Holocene vegetation history suggests natural origin of steppes in the northern Mongolian mountain taiga, Palaeogeogr. Palaeocl., 261, 203–217, https://doi.org/10.1016/j.palaeo.2007.12.012, 2008.
Sharkhuu, A., Sharkhuu, N., Etzelmüller, B., Heggem, E. S. F., Nelson, F. E., Shiklomanov, N. I., Goulden, C. E., and Brown, J.: Permafrost monitoring in the Hovsgol mountain region, Mongolia, J. Geophys. Res., 112, https://doi.org/10.1029/2006JF000543, 2007.
Sharkhuu, N.: Recent changes in the permafrost of Mongolia, in: Proc. 8th Int. Conf. Permafrost, 21–25 July 2003, Zurich, Switzerland, edited by: Phillips, M., Springman, S. M., and Arenson, L. U., Zurich, Switzerland, 21–25 July 2003, Swets & Zeitlinger, Lisse, the Netherlands, 2003.
Sugimoto, A., Yanagisawa, N., Naito, D., Fujita, N., and Maximov, T. C.: Importance of permafrost as a source of water for plants in east Siberian taiga, Ecol. Res., 17, 493–503, https://doi.org/10.1046/j.1440-1703.2002.00506.x, 2002.
Szumińska, D.: Changes in surface area of the Böön Tsagaan and Orog lakes (Mongolia, Valley of the Lakes, 1974–2013) compared to climate and permafrost changes, Sediment. Geol., 340, 62–73, https://doi.org/10.1016/j.sedgeo.2016.03.002, 2016.
Treter, U.: Gebirgs-Waldsteppe in der Mongolei, Geographische Rundschau, 48, 655–661, 1996.
Tsogtbaatar, J.: Deforestation and reforestation needs in Mongolia, Forest Ecol. Manag., 201, 57–63, https://doi.org/10.1016/j.foreco.2004.06.011, 2004.
Vandandorj, S., Gantsetseg, B., and Boldgiv, B.: Spatial and temporal variability in vegetation cover of Mongolia and its implications, J. Arid Land, 7, 450–461, https://doi.org/10.1007/s40333-015-0001-8, 2015.
Walter, H. and Breckle, S.-W.: Spezielle Ökologie der gemäßigten und arktischen Zonen Euro-Nordasiens: Zonobiom VI–IX; 232 Tabellen, 2nd Edn., UTB für Wissenschaft Große Reihe, Geo-Biosphäre/Heinrich Walter; Siegmar-W. Breckle; Bd. 3, Fischer, Stuttgart, 726 pp., 1994.
Watson, D.: Contouring: A Guide to the Analysis and Display of Spatial Data, Computer methods in the Geosciences, 10, Pergamon Press, London, 204 pp., 1992.