the Creative Commons Attribution 4.0 License.
the Creative Commons Attribution 4.0 License.
 | 04 Apr 2018
Plant functional diversity affects climate–vegetation interaction
Vivienne P. Groner
Thomas Raddatz
Christian H. Reick
Martin Claussen
We present how variations in plant functional diversity affect climate–vegetation interaction towards the end of the African Humid Period (AHP) in coupled land–atmosphere simulations using the Max Planck Institute Earth system model (MPI-ESM). In experiments with AHP boundary conditions, the extent of the “green” Sahara varies considerably with changes in plant functional diversity. Differences in vegetation cover extent and plant functional type (PFT) composition translate into significantly different land surface parameters, water cycling, and surface energy budgets. These changes have not only regional consequences but considerably alter large-scale atmospheric circulation patterns and the position of the tropical rain belt. Towards the end of the AHP, simulations with the standard PFT set in MPI-ESM depict a gradual decrease of precipitation and vegetation cover over time, while simulations with modified PFT composition show either a sharp decline of both variables or an even slower retreat. Thus, not the quantitative but the qualitative PFT composition determines climate–vegetation interaction and the climate–vegetation system response to external forcing. The sensitivity of simulated system states to changes in PFT composition raises the question how realistically Earth system models can actually represent climate–vegetation interaction, considering the poor representation of plant diversity in the current generation of land surface models.
- Article
(4607 KB) - Full-text XML
- BibTeX
- EndNote


The African Humid Period (AHP) is an exceptionally interesting period to study drastic climate and vegetation changes in the past. During this period, around 11 700 to 4200 years ago, rainfall was substantially higher than today across much of west and north Africa (Bartlein et al., 2011; Shanahan et al., 2015), and rivers and lakes were widespread (Hoelzmann et al., 1998; Kröpelin et al., 2008; Lézine et al., 2011a; Drake et al., 2011). Pollen records indicate that the Sahel boundary was shifted northward by 5 to 7∘ to at least 23∘ N (Jolly et al., 1998), and tropical plant taxa might have used river banks as migration paths to enter drier environments, forming gallery forests (Watrin et al., 2009). Consequently, vegetation cover marked a diverse savanna-like mosaic of xeric and tropical species whose ranges do not overlap today (Hély et al., 2014).
The establishment of this so-called “green” Sahara (Ritchie and Haynes, 1987; Jolly et al., 1998) was presumably triggered by changes in the Earth's orbit resulting in a stronger insolation and higher temperatures in the boreal summer than today, accompanied by an intensification and northward-shifted west African monsoon (Kutzbach, 1981; Kutzbach and Guetter, 1986). It has been shown that these externally triggered changes were amplified by internal feedback mechanisms involving ocean (Kutzbach and Liu, 1997; Braconnot et al., 1999; Liu et al., 2004), surface water coverage by lakes and wetlands (Coe and Bonan, 1997; Krinner et al., 2012), dust (Pausata et al., 2016; Egerer et al., 2016), soil albedo (Knorr and Schnitzler, 2006; Vamborg et al., 2011), and vegetation (Claussen and Gayler, 1997; Texier et al., 1997; Doherty et al., 2000; Rachmayani et al., 2015). However, despite increasing understanding of these involved feedbacks, the extent of the green Sahara substantially differed between previous modelling studies, and all models underestimated the northward extent reconstructed from palaeo proxy data (see Claussen et al., 2017).
Similar to the establishment of the green Sahara, there is scientific consensus that the desertification of the southern Sahara and Sahel regions towards the end of the AHP was triggered by a gradual decline in incoming solar radiation due to changes in the Earth's orbit which caused a weakening and southward shift of the west African monsoon. However, the timing and abruptness of the transition from the green Sahara to the “desert” state are as yet uncertain, among other things, because the role of climate–vegetation feedbacks in this context is still under debate. Under the assumption of a strong positive climate–vegetation feedback, at least two stable equilibria could exist for the Sahara region – a green state with high vegetation cover and a desert state without vegetation (Claussen, 1994; Claussen and Gayler, 1997; Brovkin et al., 1998; Bathiany et al., 2012). The non-linearity of this feedback can potentially cause an abrupt transition between these states when the system reaches a “tipping point” (Williams et al., 2011). While some studies indicated such an abrupt collapse of vegetation towards the end of the AHP implying a strong climate–vegetation feedback (Claussen et al., 1999; deMenocal et al., 2000), others suggested a more gradual decline of vegetation (Kröpelin et al., 2008; Lézine, 2009; Lézine et al., 2011b) and precipitation (Francus et al., 2013) or attributed the collapse to other triggers (Liu et al., 2007; Rachmayani et al., 2015), thereby questioning the strength of climate–vegetation feedbacks.
Based on a conceptual modelling study, Claussen et al. (2013) proposed that these different viewpoints are not contradicting if one accounts for plant diversity. High plant diversity in terms of moisture requirements could stabilize a climate–vegetation system by buffering strong feedbacks between individual plant types and precipitation, whereas a reduction in plant diversity might allow for an abrupt regime shift under gradually changing environmental conditions. Hence, climate–vegetation feedback strength would not be a unique property of a certain region but also depend on its vegetation composition. An ecological assessment of the conceptual approach by Claussen et al. (2013) and an adjustment of their model to AHP plant types corroborated their results (Groner et al., 2015). These findings raise the question how the representation of plant functional diversity influences climate–vegetation interaction in models of higher complexity and thereby affects the extent of the green Sahara as well as the timing and rate of the transition to the desert state. To our knowledge, no previous comprehensive modelling study on the AHP has explicitly considered the effect of plant functional diversity on climate–vegetation interaction. To close this gap, we present here a series of coupled land–atmosphere simulations from mid-Holocene to the pre-industrial period with different combinations of plant functional types (PFTs) using the Max Planck Institute Earth system model (MPI-ESM). With our idealized set-up, we do not expect our simulations to match reconstructions; rather, we focus on qualitative differences between simulations to find mechanisms relevant for the role of PFT diversity in climate–vegetation interactions.
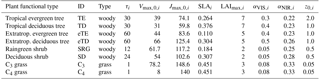
Table 1Natural plant functional types in JSBACH, their woodiness type, associated time constants for establishment/mortality (τi, in years), maximum carboxylation capacities () and electron transport capacities () at 25 ∘C (in ), specific leaf area (SLAi, in m2 (leaf) mol−1 (carbon)), maximum leaf area index (LAImax,i, in m2 m−2), canopy albedo αi in VIS/NIR, and vegetation roughness length z0,i (in m) (Reick et al., 2013).
2.1 MPI-ESM
We use for our study the MPI-ESM, a comprehensive Earth system model that couples model components for the atmosphere (ECHAM6; Stevens et al., 2013), ocean (MPIOM; Jungclaus et al., 2013), and land surface (JSBACH; Raddatz et al., 2007; Reick et al., 2013) through the exchange of energy, momentum, water, and carbon dioxide. This study focuses on the coupling between the atmospheric component and the land surface component.
ECHAM6 is an atmospheric general circulation model (GCM) which was developed at the Max Planck Institute for Meteorology in Hamburg, Germany. The model focuses on the coupling between diabatic processes and large-scale circulations which are both driven by solar insolation. For each time step, the model determines the large-scale horizontal circulation with a spectral hydrostatic dynamical core. Additionally, other physical processes (turbulent diffusion, convection, clouds, precipitation, gravity wave drag, diabatic heating by radiation) are calculated for each vertical column of the Gaussian grid associated with the truncation used in the spectral dynamical core. These processes are coupled with the horizontal circulation each time step by transforming the variables that represent the atmospheric state from the spectral representation to the Gaussian grid and back. However, radiative transfer is computed extensively only once per hour for solar radiation (14 bands) as well as for terrestrial radiation (16 bands).
As an integral component of ECHAM6, JSBACH provides the lower atmospheric boundary conditions over land and simulates both biogeochemical and biogeophysical terrestrial processes. JSBACH simulates land surface properties interactively in terms of soil moisture, snow cover, leaf area index, and vegetation distribution. Plant diversity is represented in JSBACH in discrete functional plant classes, so-called PFTs. The submodel for biogeographic vegetation shifts accounts for eight PFTs, shown in Table 1. Natural land cover change and vegetation dynamics are simulated in JSBACH by the DYNVEG component based on a number of principles commonly used in dynamic global vegetation models (DGVMs), briefly summarized here, followed by a description of the implementation in JSBACH. For more details, see Brovkin et al. (2009) and Reick et al. (2013).
The “universal presence principle” implies that each PFT can potentially grow everywhere (“seeds are everywhere”). Physiological constraints define the climatic range within which a certain PFT can exist. Such bioclimatic limits only prohibit establishment if conditions are not suitable for a PFT to grow but do not prevent further existence when values fall out of this range. The increase or reduction in fractional vegetation cover is determined by two processes. The first possibility for land cover to increase or decrease is that inhospitable regions can expand or shrink. This change in area available for growth affects the cover of all PFTs. Second, PFT cover can be reduced by natural death or disturbance (e.g. wildfires) and increased by migration into space opened in this way, so-called “uncolonized land”. The different PFTs compete for this uncolonized land, while vegetation establishment is generally only possible when net primary productivity (NPP) is positive at least for some years. Competition is considered in DYNVEG by a hierarchy in vegetation superiority based on growth form and NPP. Woody PFTs (trees and shrubs) are assumed to be dominant over grass PFTs by reason of light competition; within the woody PFTs, competition is regulated by productivity: higher NPP means a competitive advantage because PFTs with higher NPP migrate faster into uncolonized land. If uncolonized land is available, grass PFTs have a competitive advantage because they quickly migrate in the new space while woody PFTs regrow slowly. However, grasses can establish only on uncolonized land, whereas trees and shrubs establish also on already vegetated land. So, in the absence of disturbances, grasses are gradually superseded by woody vegetation and the tree–grass ratio eventually depends on the rate of disturbances.
The dynamic modelling of natural vegetation is based on fractions of unit area in a grid cell as the state variables in DYNVEG. A composition of woody (wi), grass (gi), and uncolonized (u) cover fractions composes the whole area within a grid cell where vegetation can grow (vegmax):
where Nw and Ng are the number of woody and grass PFTs, respectively.
The dynamics of woody and grass PFT cover fractions are governed by a coupled set of differential equations that account for establishment, natural mortality, and disturbance-driven mortality (fire, wind throw):
The establishment of a woody PFT i, represented by the first term on the right-hand side in Eq. (2), depends on its cover fraction wi, its characteristic establishment timescale , and its competitive strength in terms of long-term average NPP (, in ) compared to other woody PFTs. The exponent α is set to 1.5 to control the competition between woody PFTs by suppressing the establishment with small NPP. The step function θ accounts for the area available for establishment which is 1 for u>0 and otherwise 0. The establishment of grass PFTs (first term on the right-hand side in Eq. 3) is similar to woody establishment except for the assumption that grass can establish only within the area left available after tree establishment. This ensures the competitive advantage of woody PFTs over grasses in the absence of disturbances such as fires.
Natural mortality, represented by the second term on the right-hand side in Eqs. (2 and 3), is assumed to be proportional to the abundance of the particular vegetation type and acts on a characteristic timescales / for woody and grass PFTs, respectively. Due to the lack of knowledge, it is assumed that τi=γi; see Table 1.
Disturbance-driven mortality, represented by the third term on the right-hand side in Eqs. (2 and 3), accounts for mortality due to fire and wind throw. For wildfires to happen in JSBACH, sufficient aboveground plant litter has to be available for combustion, and the litter needs to be sufficiently dry, meaning below a threshold, to catch fire. Fire disturbance rate is assumed to increase linearly with decreasing humidity and depends on the extent of woody and grass PFTs via the value of the aboveground litter. Wind disturbance accounts for the reduction in forest cover by storms, which is of minor importance in our study. For a description of the disturbance equations, see Reick et al. (2013).
The result is the potential natural vegetation cover in a world without humans. DYNVEG also includes a sophisticated approach to account for a human aspect, but we do not consider anthropogenic land cover change here.
The dynamics of the fraction of inhospitable land () in a grid cell are calculated in DYNVEG with a separate submodel in order to determine the extent of cool deserts like the Arctic region or hot deserts like the Sahara. The extent of d determines the fraction of a grid cell where vegetation cannot grow. The model is based on the idea that deserts develop when the long-term NPP average drops below a threshold so that vegetation cannot build a canopy at least once a year. The fraction vegmax of a model grid cell with substantial vegetation cover at least once in year (y) is
where is the total grass fraction of vegetation, and is the maximum leaf area that appeared during the year y. is determined from the maximum biomass in leaves by
where is the maximum living biomass found in PFT i in the considered year. One-third of the biomass is assumed to be in the leaves, and the specific leaf area (SLAi) relates the carbon content of leaves to their area. The parameter a=1.95 is chosen such that the simulated distribution of hot and cold deserts matches observations. The parameter b=2 describes steepness of the transition between vegetation and desert, and has been chosen to give a realistic distribution of deserts. Since 1 year of low growth does not make a desert, we assume a delayed response to changes in growth conditions where the timescale for desert development is chosen as 50 years.

Figure 1Mean orography (in metres) of the simulated study domain in north Africa, 11.19 to 33.57∘ N, 15.94∘ W to 40.31∘ E.
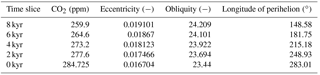
Table 2CO2 concentrations (in ppm) and orbital parameters for simulated time slices at 8, 6, 4, 2, and 0 kyr. For palaeo simulations, CO2 concentrations are taken from Fortunate Joos (personal communication, 2016) and orbital parameters are adjusted according to Berger (1978). The values for 0 kyr conform to the standard pre-industrial set-up of MPI-ESM.
2.2 Set-up of simulations
We perform global coupled land–atmosphere simulations with a horizontal resolution of approximately 1.88∘ (T63) and 47 vertical levels. The model runs with dynamic vegetation for the periods 8 kyr (kyr = 1000 years before present), 6, 4, 2, and 0 kyr for 300 years with the first 200 years corresponding to a spin-up period to reach a state close to equilibrium; the first 100 years of the spin-up period were run with 3 times the accelerated vegetation dynamics. In the standard JSBACH configuration, the seasonal canopy albedo is calculated as a function of leaf area index, whereas the bare soil albedo is a grid box constant derived from satellite measurements (see Otto et al., 2011). To account for darker soils below vegetation, we implement for the study domain (11.19 to 33.57∘ N, 15.94∘ W to 40.31∘ E; see Fig. 1) a simple albedo scheme that reduces the soil albedo according to the mean net primary productivity of the preceding 5 years (based on Vamborg et al., 2011). Soil types originate from the FAO digital soil map of the world (FAO/UNESCO, 1974); soil characteristics such as soil depth, soil porosity, and soil field capacity are prescribed after Hagemann and Stacke (2015). In the absence of palaeo soil data, we are obliged to assume that the soil characteristics during the AHP were the same as they are today. To attain equilibrium states, we set orbital parameters (Berger, 1978) and CO2 concentrations (Fortunate Joos, personal communication, 2016) to fixed values for each time slice experiment; see Table 2. Other atmospheric boundary conditions (trace gas concentrations, stratospheric ozone, aerosol distribution, spectral solar irradiance, orography) remain unchanged at representative present-day values (Stevens et al., 2013). Moreover, we prescribe sea ice concentration (SIC) and sea surface temperatures (SSTs) identically for all simulations using data from Hurrell et al. (2008) in cyclical repetition (1945 to 1974). The use of present-day SSTs probably reduces the overall strength of the west African monsoon in mid-Holocene simulations as it has been shown that the west African monsoon and the seasonal cooling of the equatorial Atlantic amplify each other; see, e.g. Okumura and Xie (2004). Thereby, the simulated precipitation and vegetation cover fractions are probably lower than with AHP SST. The consideration of an interactive ocean would probably further amplify the monsoon signals caused by changes in PFT composition. However, as mentioned above, we do not expect our simulations to match reconstructions, and our study focuses on the effect of plant functional diversity rather than synergies that might occur with an interactive ocean. As we prescribed SST identically for all simulations, we do not expect qualitative differences in the results.
2.3 Modifications of plant functional diversity
To investigate the effects of changes in plant functional diversity on climate–vegetation interaction towards the end of the AHP, we perform four different types of simulations: the simulation EXPALL serves as a baseline with all natural PFTs commonly used in JSBACH (Table 1). The second type of simulation is a single-PFT experiment which features only C4 grass (C4) and thereby excludes all woody PFTs and their competition in the study domain. Third, we combine the woody PFTs tropical evergreen tree (TE) and raingreen shrub (SRG) with C4 grass in the study domain for the experiments and . The fourth type of simulation addresses the representation of bioclimatic limits in JSBACH. During the present study, we found that the minimum temperatures of the coldest month fall in some regions in north Africa below the bioclimatic limit of tropical evergreen and deciduous trees (15.5 ∘C) and thereby prevent their establishment in areas where reconstructions indicate the presence of tropical trees during the AHP (Hély et al., 2014). Although the definition of this limit is based on an empirical relationship between mean temperatures of the coldest month and absolute minimum temperature (frost occurrence) (Müller, 1982; Prentice et al., 1992), favourable microclimatic conditions could have allowed tropical taxa to establish, especially in gallery forests. Another argument is that there might have been taxa that were partially frost tolerant and could survive short periods of freezing temperatures. A literature-based compilation of experimental cold-tolerance thresholds for leaves (evergreens), buds and twigs, or stems illustrates that “tropical evergreens show damage at −1 or −2 ∘C. Many of the broad-leaved evergreens can tolerate −10 to −15 ∘C, with a few able to survive −20 ∘C” (Harrison et al., 2010). In order to test the model sensitivity to this limit, we add a newly designed tropical frost-tolerant woody PFT (TD10) with relaxed bioclimatic limits to the standard PFT set in . The minimum temperature of the coldest month is for TD10 reduced from 15.5 to 10 ∘C, while all other parameters remain the same as for the tropical deciduous tree PFT (TD); see Table 1. In all simulations, the initial cover fractions are equally distributed over all included PFTs in the study domain.
In the following, we refer to the “potential” PFT diversity as the number of PFTs allowed in a simulation and to the “realized” PFT diversity as the number of PFTs that actually establish in a grid cell. We present the effects of changes in plant functional diversity on (1) climate–vegetation interaction during the AHP and the extent of the green Sahara (8 kyr), and on (2) the timing and rate of the transition from the green Sahara to the desert state.
Table 3Effects of different PFT compositions on land surface parameters, surface energy budget, and hydrological cycle in coupled land–atmosphere simulations in Region 1 (18.65 to 22.38∘ N, 4.69 to 30.94∘ E) and Region 2 (11.19 to 18.65∘ N, 15.94∘ W to 19.69∘ E). The first two columns contains 100-year averages of the experiment with the standard PFT set EXPALL; the following show differences between EXPALL and simulations with modified PFT composition (tropical evergreen tree – TE, raingreen shrub – SRG, C4 grass – C4, frost-tolerant tropical deciduous tree – TD10). Bold values are significant (σ=0.05) with regard to the time series of 100 years (yearly averages); values in brackets correspond to spatial standard deviations of difference fields.
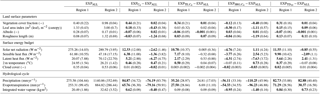
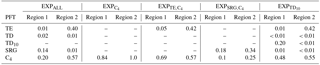
Table 4Mean cover fractions fi (per vegetated area of a grid cell) of all PFTs with substantial shares of the total vegetation cover in Region 1 (18.65 to 22.38∘ N, 4.69 to 30.94∘ E) and Region 2 (11.19 to 18.65∘ N, 15.94∘ W to 19.69∘ E). Values represent 100-year averages of the experiment with the standard PFT set EXPALL and simulations with modified PFT composition (tropical evergreen tree – TE, raingreen shrub – SRG, C4 grass – C4, frost-tolerant tropical deciduous tree – TD10).
3.1 Effects on climate–vegetation interaction during the AHP
Changes in plant functional diversity significantly affect climate–vegetation interaction and the extent of the green Sahara under AHP boundary conditions (8 kyr). Figure 2 illustrates precipitation (P) and vegetation cover fraction (vegmax) for the experiment with the standard PFT set (EXPALL) as well as differences between EXPALL and simulations with modified PFT composition. Already at the first glance, it becomes apparent that P and vegmax considerably differ between experiments: , , and depict in most of the study domain a “greening” associated with higher P compared to EXPALL (Fig. 2c–f, i–j), while shows a “browning” and less P (Fig. 2g, h).
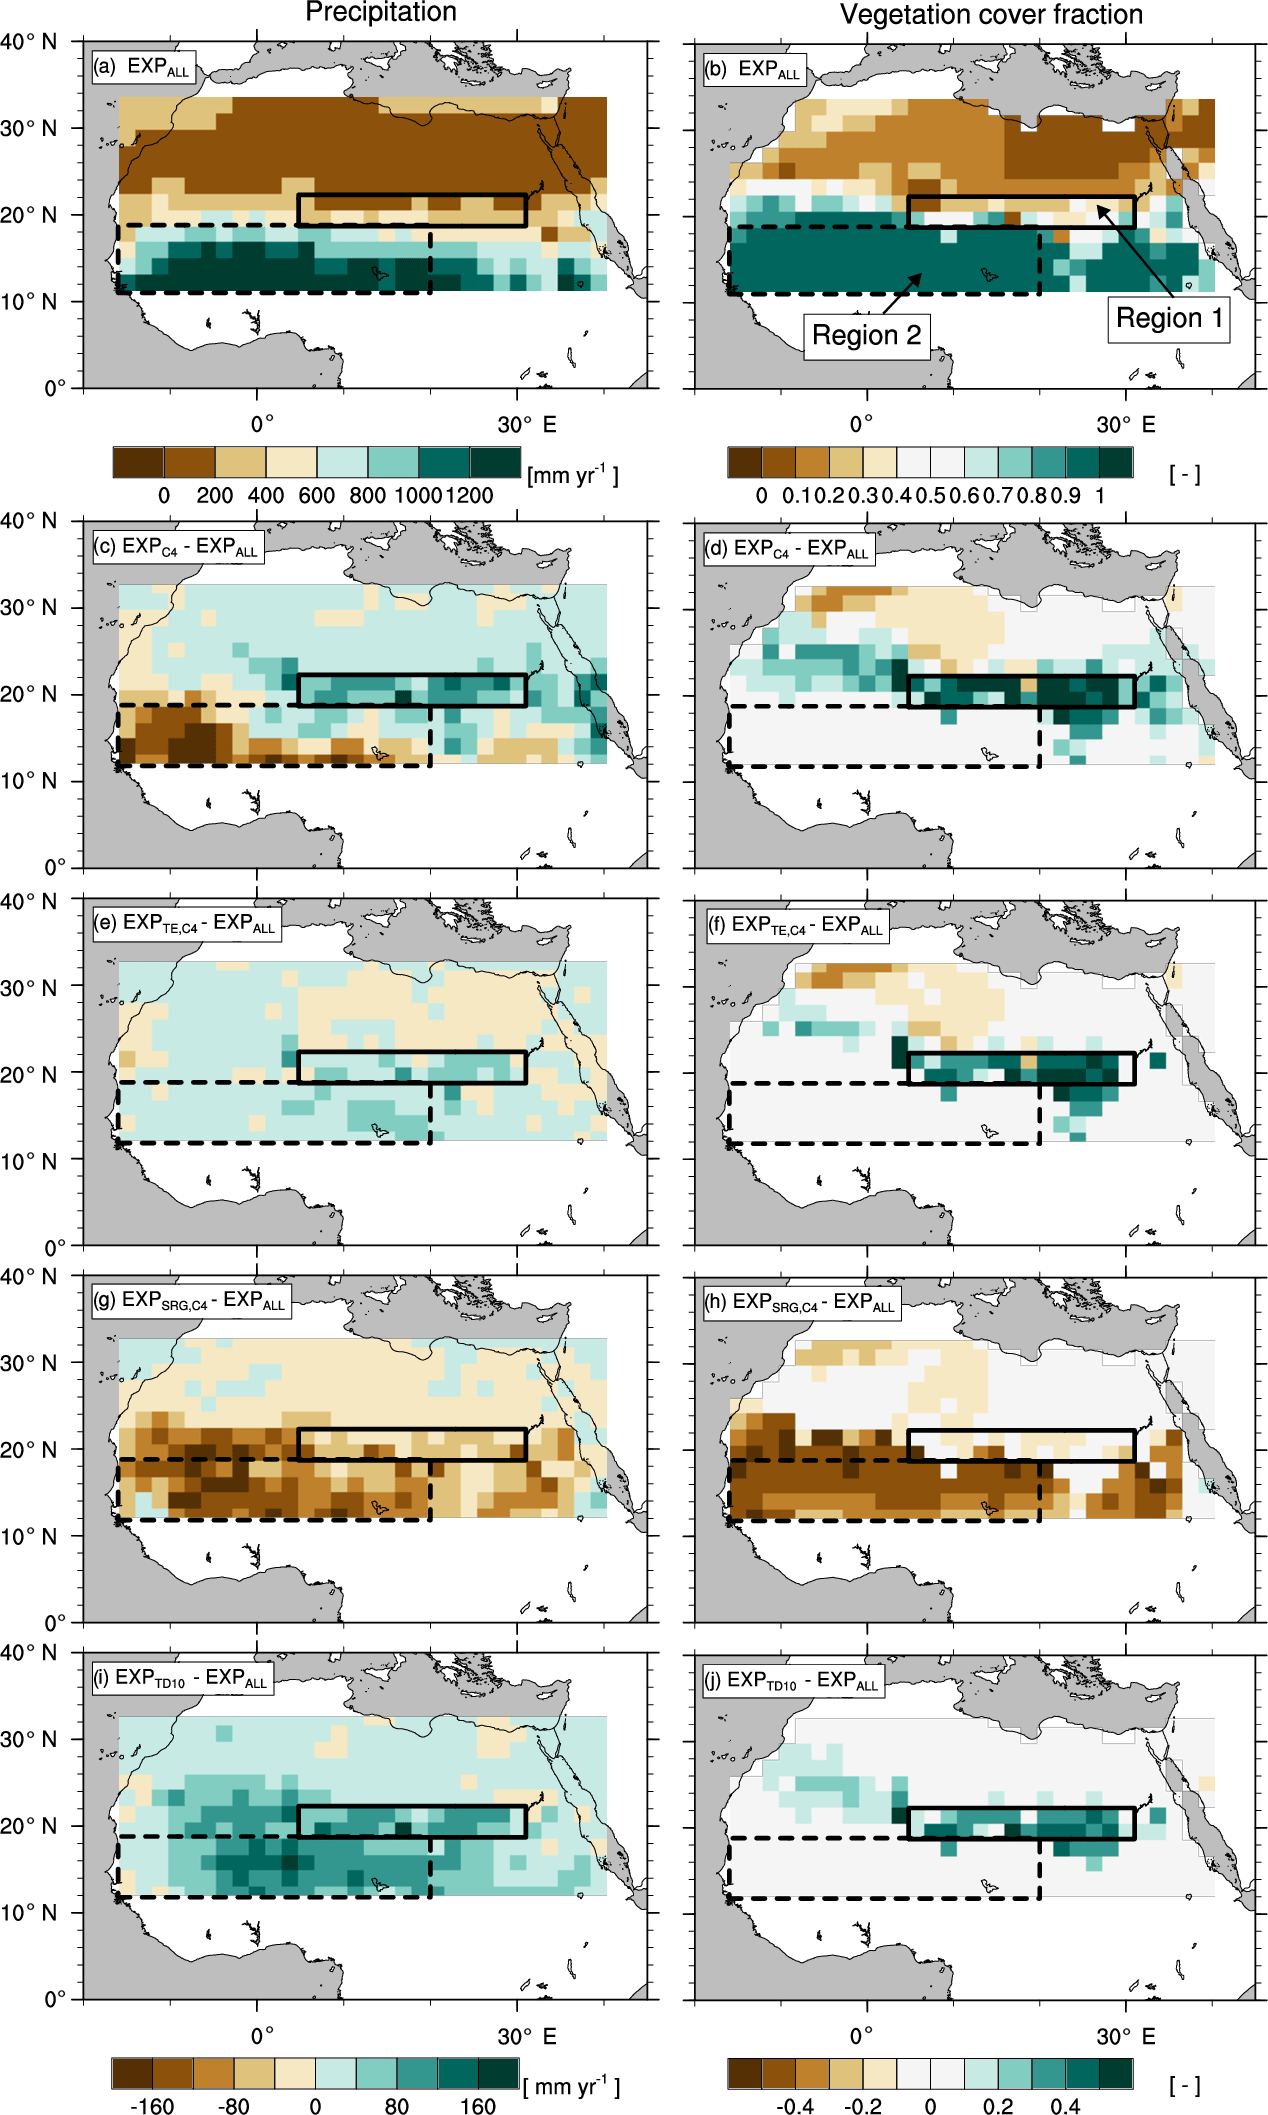
Figure 2Effects of changes in plant functional diversity on precipitation P (left column) and vegetation cover fraction vegmax (right column) during the AHP (8 kyr) in Region 1 (18.65 to 22.38∘ N, 4.69 to 30.94∘ E; solid box) and Region 2 (11.19 to 18.65∘ N, 15.94∘ W to 19.69∘ E; dashed box). Panels (a, b) show 100-year averages for the experiment with the standard PFT set (EXPALL). The following panels illustrate differences in 100-year averages between EXPALL and (c, d), (e, f), (g, h), and (i, j).
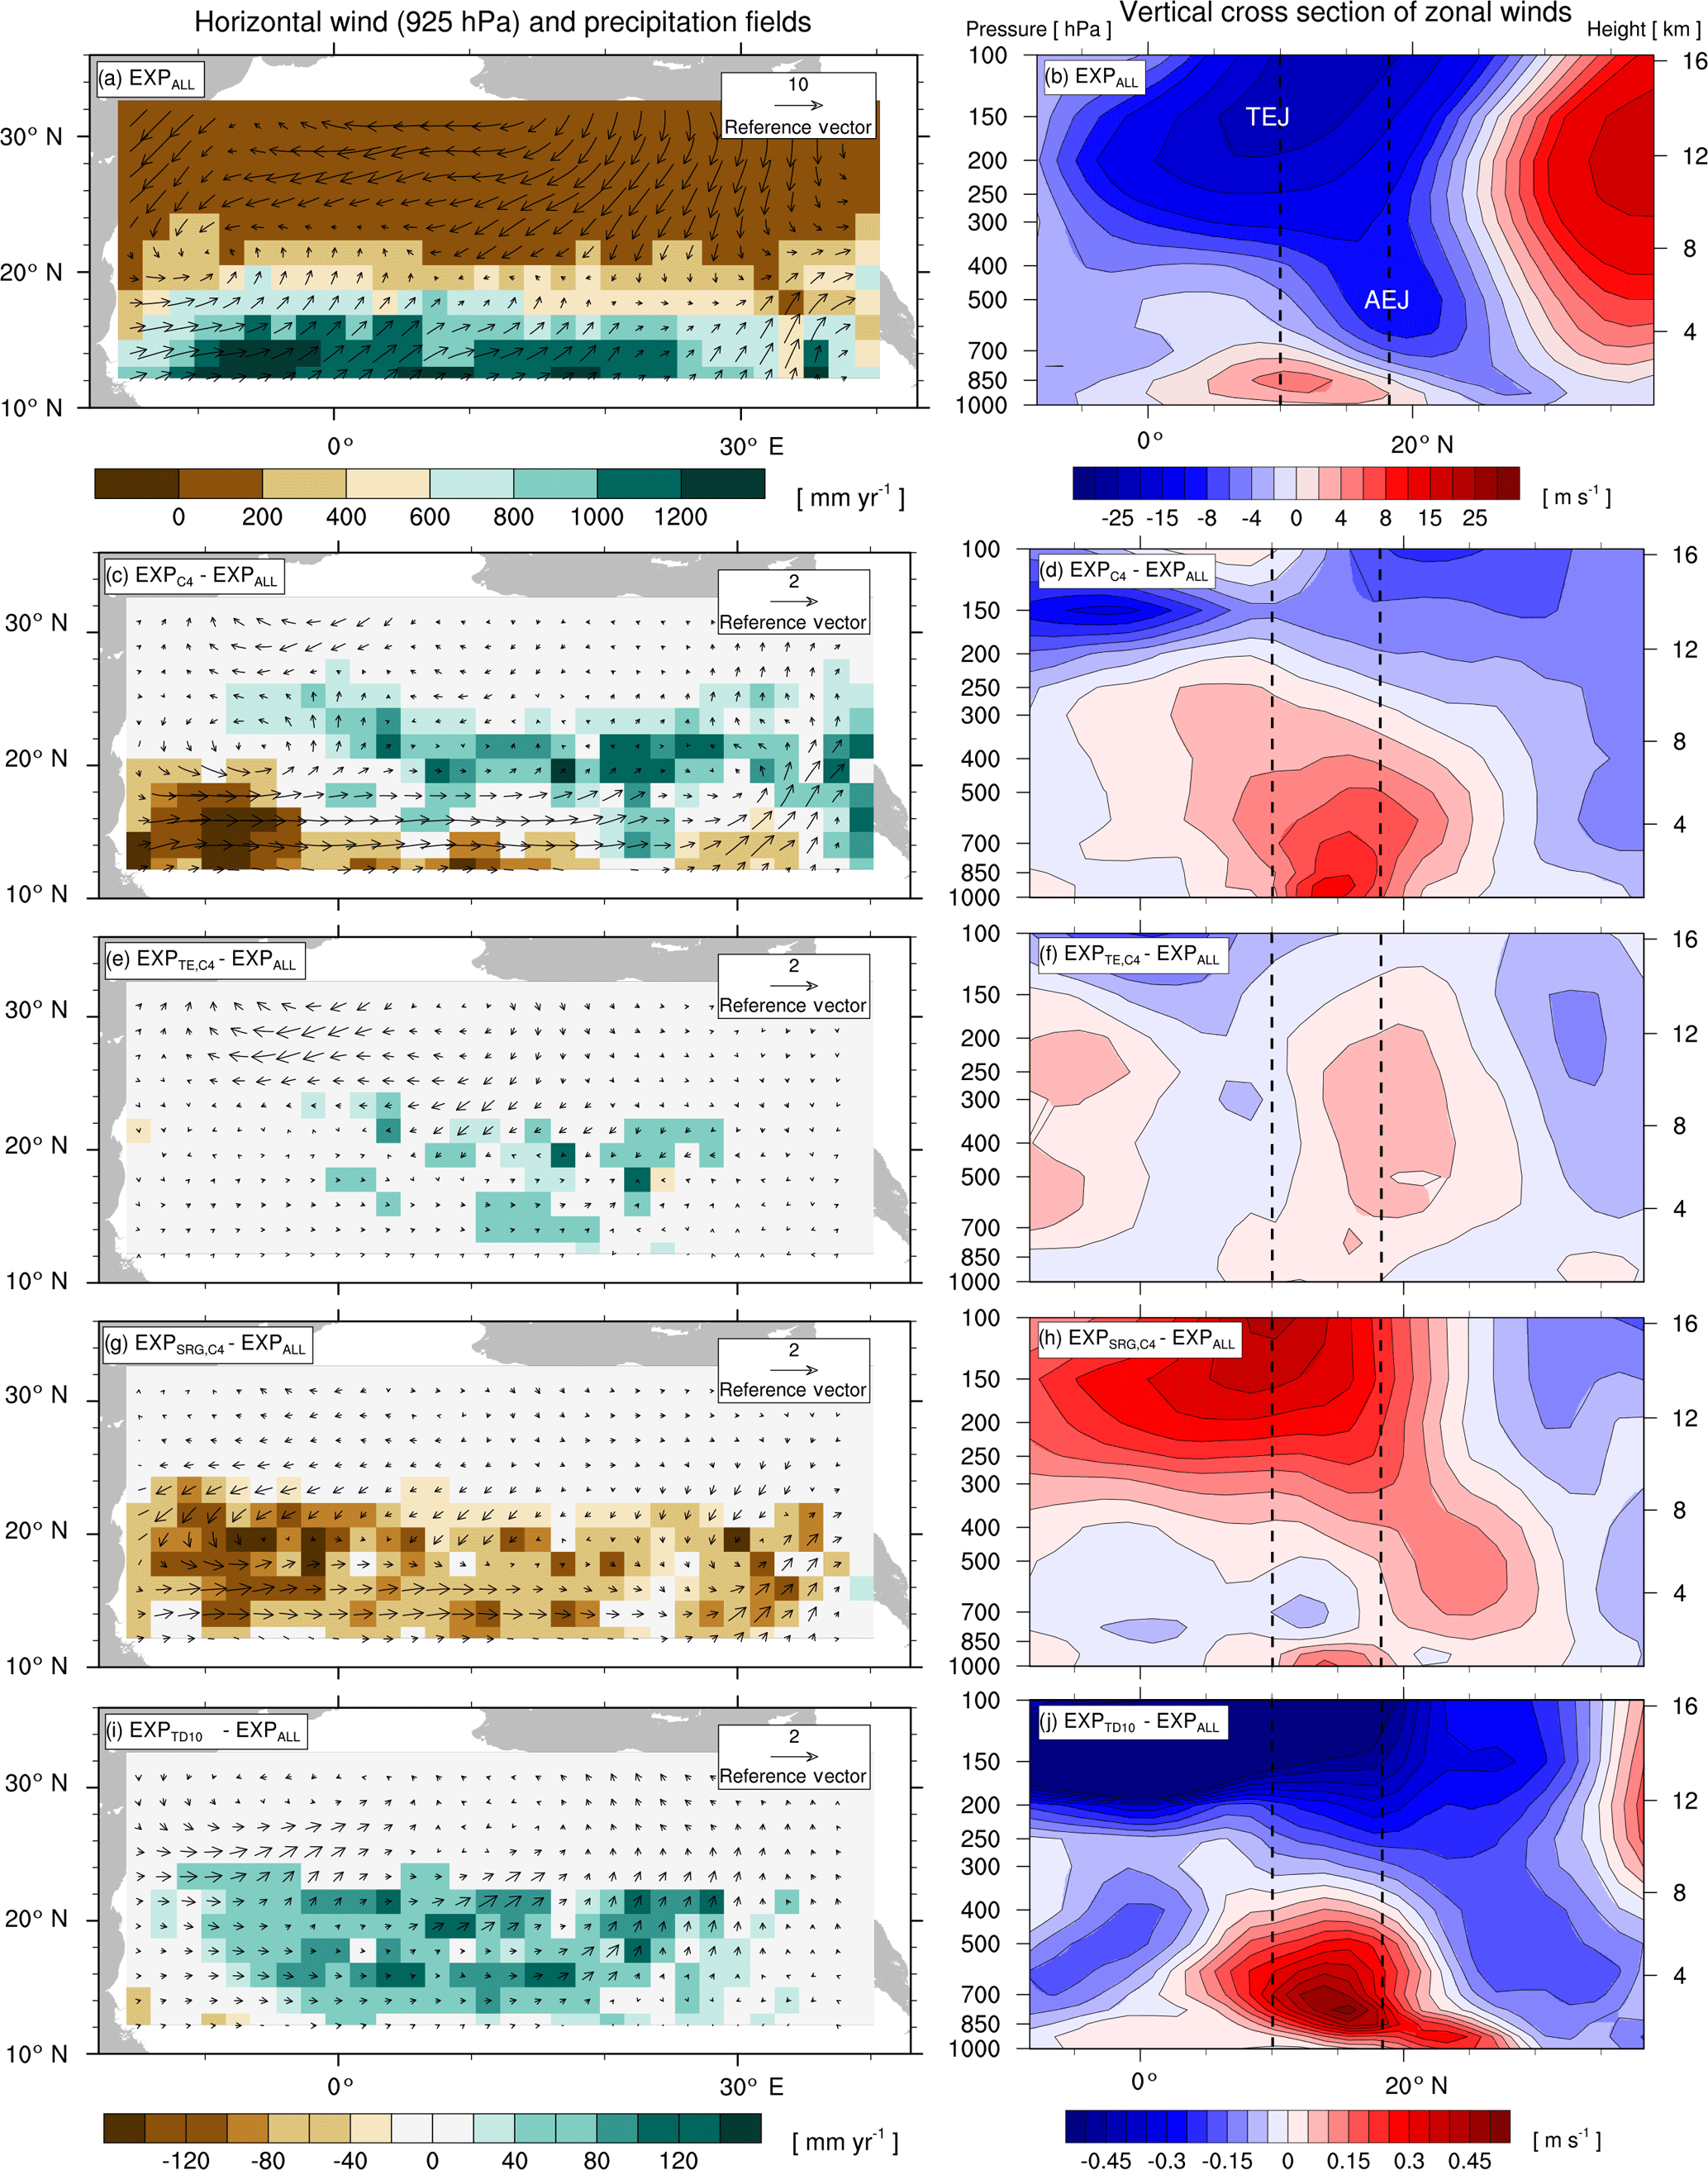
Figure 3Effects of changes in plant functional diversity on precipitation P and large-scale atmospheric circulation patterns during the monsoon season (JJAS) under AHP conditions (8 kyr). Left: horizontal low-level wind fields in the monsoon layer (925 hPa) and P fields. Right: vertical cross sections of zonal winds (9.33 to 39.17∘ N, 10.31∘ W to 40.31∘ E). Dotted lines mark the core regions of mid-level African easterly jet (AEJ, 600 hPa) and upper-level tropical easterly jet (TEJ, 150 hPa) in EXPALL. Panels (a, b) show the 100-year average for the experiment with the standard PFT set (EXPALL); the following panels illustrate differences in 100-year averages between EXPALL and (c, d), (e, f), (g, h), and (i, j).
A closer look reveals substantial regional differences within each simulation. To identify the underlying causes, we compare land surface parameters, energy surface budget, and hydrological cycle in the two most affected regions (see Fig. 2): the transition zone between the desert and savanna (Region 1: 18.65 to 22.38∘ N, 4.69 to 30.94∘ E) and the region southwest of the transition zone (Region 2: 11.19 to 18.65∘ N, 15.94∘ W to 19.69∘ E). Table 3 summarizes selected variables averaged over the last 100 simulated years in the two regions for EXPALL as well as differences with the other simulations. The fractions (fi) of PFTs with a substantial contribution to the total vegetation cover fraction vegmax are shown in Table 4. Further, we consider how changes in land surface parameters, surface energy balance, and hydrological cycle translate into alterations of large-scale circulation features associated with the west African monsoon focusing on the lower-level Intertropical Convergence Zone (ITCZ, 925 hPa), the mid-level African easterly jet (AEJ, 600 hPa), and the upper-level tropical easterly jet (TEJ, 150 hPa) during the monsoon season (June to September) (Fig. 3). The term ITCZ is ambiguous since the literature provides very different definitions based on wind convergence, surface air pressure and rainfall, or outgoing longwave radiation. Hereinafter, we refer to the ITCZ as the surface feature over the African continent that marks the convergence of northeasterly Harmattan winds that originate in the Sahara and the southwest monsoon flow that emanates from the Atlantic, also named the Intertropical Front.
In Region 1 in , , and , the lower albedo due to higher vegmax compared to EXPALL enhances the absorption of solar energy available for evapotranspiration which heats the lower atmosphere, accelerates energy and water cycling, and boosts moisture available in the atmosphere. This does not only increase the likelihood for regional convective precipitation but also enhances the meridional temperature and moisture gradient between the Equator and the northern tropics. This gradient is a good indicator of how far north the monsoon flow penetrates into Africa (Bonfils et al., 2001). The increase of this gradient results in a northward shift of the ITCZ, a weakening and northward shift of the AEJ, a strengthening of the TEJ, and consequently, a northward shift of the tropical rain belt (Fig. 3c–f, i–j). These changes are in accordance with the literature: wetter-than-average conditions in the Sahel are linked to a weaker and northward-shifted AEJ (Nicholson and Grist, 2003; Nicholson, 2013) and a stronger TEJ (Grist and Nicholson, 2001; Jenkins et al., 2005; Nicholson, 2008; Hulme and Tosdevin, 1989).
Conversely, the higher albedo in compared to EXPALL lowers the absorption of solar energy available for evapotranspiration which decreases water and surface energy fluxes, dries and cools the atmosphere, and suppresses precipitation in Region 1. The resulting reduction in the meridional atmospheric moisture and temperature gradient causes a southward shift of the ITCZ, the AEJ, and the core of the rain belt (Fig. 3g, h). In agreement with the literature, a more equatorward position of the AEJ is associated with drier-than-average conditions over the Sahel (Nicholson and Grist, 2003; Nicholson, 2013). However, the weakening of these two tropical jets is usually linked to wet conditions, which is not the case in . This could be attributed to the low water recycling efficiency of vegetation compared to EXPALL, especially due to SRG, which implies less release of latent heat in the atmosphere, which in turn decreases convection (Texier et al., 2000).

Figure 4Vegetation–precipitation diagrams (vegmax, P) for simulations with different PFT combinations including all grid cells in the study domain (11.19 to 33.57∘ N, 15.94∘ W to 40.31∘ E). Values are derived from 100-year averages under 8 kyr (blue) and 0 kyr (red) boundary conditions for EXPALL (a), (b), (c), (d), and (e).
In Region 2 in , , and , vegmax varies only little with changes in PFT composition compared to EXPALL, but P is largely affected by the physical properties of prevailing PFTs. In , the high grass albedo, compared to tropical tree PFTs that cover a substantial fraction of Region 2 in EXPALL (Table 4), reduces the absorption of incoming solar radiation and surface energy fluxes. Additionally, the limited evapotranspiration capacity of the C4 PFT due to a comparatively small maximum leaf area (LAImax,i) limits the transfer of interception and soil water to the atmosphere (Table 1). Together with the small surface roughness of C4, which reduces turbulent fluxes, this decreases the likelihood of precipitation south of the tropical rain belt (Fig. 3c). Based on the assumption that less precipitation supports less plant growth, one would expect both vegmax and P to be lower in than in EXPALL. However, the efficient growth of C4 compensates the lower P relative to EXPALL. C4 requires less water to cover the same area with leaves than other PFTs (Fig. 4b) because C4 has a high SLAi and a high NPP (Table 1), and the photosynthetic C4 pathway enables a high water use efficiency. For example, to cover 1 m2 area with 1 m2 leaves, C4 needs around 210 % less carbon than TE and around 260 % less than SRG (derived from Eqs. 4, 5). Additionally, grasses re-establish within 1 year after fire disturbance.
The moderate effects on precipitation in reflect the relatively small changes in land surface properties because the PFT composition is almost identical to EXPALL (Table 4). In , the increase in P in Region 2 results mainly from a lower albedo, a higher surface roughness, and a higher evapotranspiration in Region 1, as well as in the northwestern part of the study domain due to a higher contribution of tree PFTs which limits SRG growth. This strongly enhances the west African monsoon (Fig. 3i, j) and thereby significantly increases rainfall over large areas of the study domain. Such an albedo-induced enhancement of precipitation in the Sahel region has been shown in previous MPI-ESM experiments (Bathiany et al., 2010; Vamborg et al., 2011).
In , vegmax is in Region 2 lower than in the other simulations with the same precipitation (see Figs. 2e, f and 4d). The explanation lies in the parameterization of SRG and in the implementation of competition in JSBACH. Due to a low SLAi (Table 1), SRG requires a higher NPP to cover the same area with leaves as another PFT. SRG's comparatively low photosynthetic capacity and low LAImax,i, however, impede reaching a NPP on the order of magnitude as other PFTs (Fig. 4d). When competition is calculated in JSBACH, SRG outcompetes C4 due to the implicit assumption of light competition (see Sect. 2.1). Since growth conditions are not optimal for SRG in the study domain facing water competition with C4 – all PFTs use water from the same soil water reservoir – SRG cannot fill the pools of living biomass over the growing season, which leads to an expansion of the desert area (see Eqs. 4, 5). SRG thereby acts as a desert promoter in JSBACH. Complementary to this, the lack of SRG in and reduces the competitive pressure on TE and C4 and their higher growth efficiency facilitates their expansion and the repression of desert. The desert-promoting effect of shrubs has been observed in previous experimental studies (“fertile island” effect, e.g. Schlesinger et al., 1990, 1996; Whitford, 2002), but for other reasons – the complex processes involved are not explicitly implemented in JSBACH.
Another important aspect to be considered is that various factors can affect vegmax in coupled simulations apart from precipitation, which is the main determinant of plant growth in semi-arid regions on the considered scale of the order of a GCM grid cell (Coughenour and Ellis, 1993). Two important additional factors appear upon closer inspection of the outliers in Fig. 4. First, shallow soils in mountainous regions (in JSBACH, compare Fig. 1) are not capable of holding water and therewith impede plant growth despite high precipitation. Second, in regions where temperatures of the coldest month fall below the bioclimatic threshold of TE/TD (15.5 ∘C), these tropical PFTs cannot establish, thereby favouring the dominance of other PFTs with different water requirements. This effect is substantially reduced in with the implementation of a frost-tolerant tropical tree PFT.
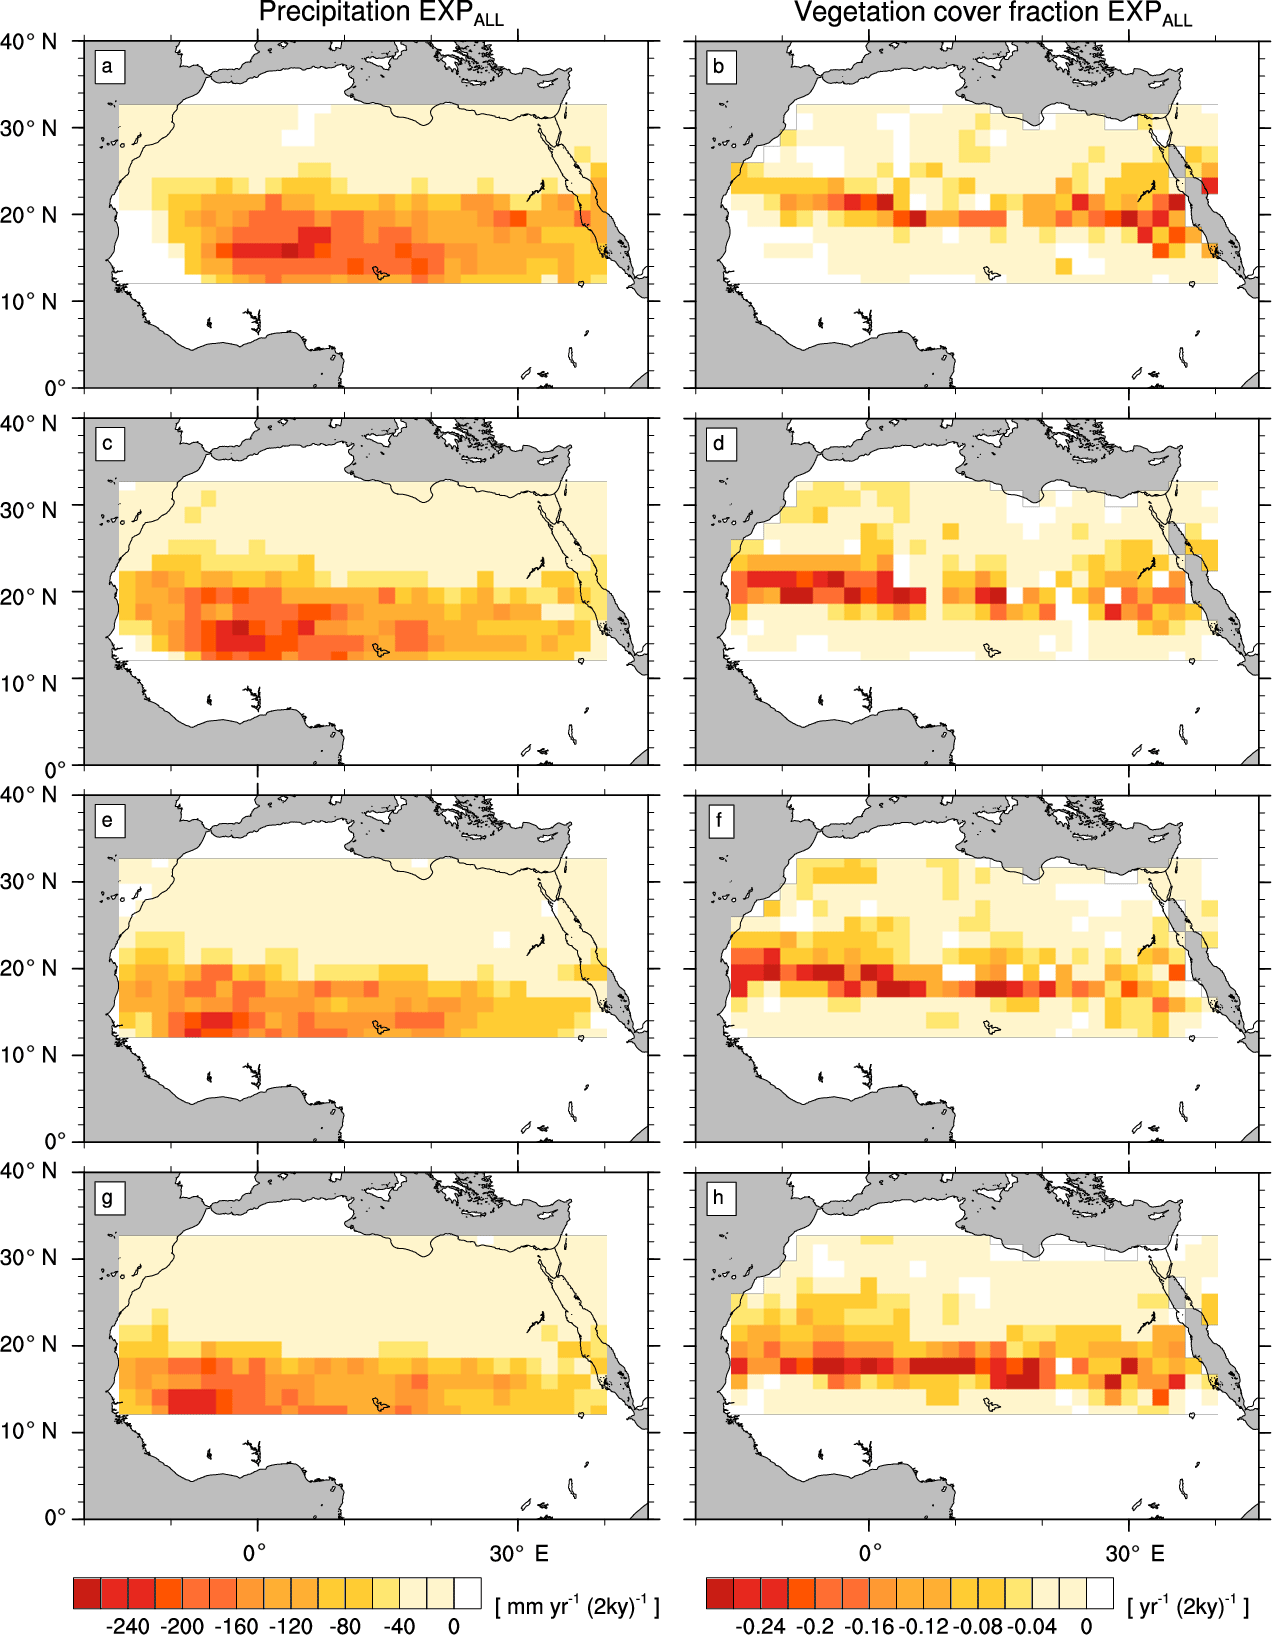
Figure 5Transition rates from the green Sahara to the desert state for precipitation P (left column) and vegetation cover fraction vegmax (right column) of a simulation with the standard PFT set (EXPALL). Plots depict differences between consecutive time slices (100-year averages): 6–8 kyr (a, b), 4–6 kyr (c, d), 2–4 kyr (e, f), and 0–2 kyr (g, h).
3.2 Effects on the transition from the green Sahara to the desert state
For a first estimate of regional transition patterns from the green Sahara (8 kyr) to the desert state (0 kyr), we calculate differences between consecutive time slices (8–6, 6–4, 4–2, and 2–0 kyr) of the 100-year averages of P and vegmax for all simulations, and compare the resulting transition maps of P and vegmax in the whole study domain (11.19 to 33.57∘ N, 15.94∘ W to 40.31∘ E). Note that this analysis does not represent the transient changes of vegetation extent and precipitation over the last 8000 years but provides an estimate of possible different states for a series of external forcings. This set-up implies vegetation being permanently in equilibrium with climate. In reality, the delayed response of vegetation allows several potential transient conditions to exist before diversity slowly attains equilibrium (Vellend et al., 2006; Diamond, 1972; Brooks et al., 1999). However, as the timescales of the simulated vegetation dynamics and atmospheric processes are much shorter than the 2 kyr period between simulated time slices, this approach is legitimate for this study.
In EXPALL, the western part of the study domain experiences a stronger precipitation reduction than the eastern part in all periods (Fig. 5, left column). The latitudes of strongest precipitation decline shift gradually southward, indicating a southward shift of the tropical rain belt over time. A slight precipitation increase at the southwestern coast in the first period before precipitation starts decreasing in concert with the rest of the domain and supports this indication. The magnitude of P decline ranges from less than 50 in the northern part of the domain to more than 200 at the latitudes of maximum change between around 12 and 20∘ N, with single grid cells in the western part reaching up to 250 . vegmax follows the pattern of P decline with a latitudinal offset of around one grid cell to the north, reaching maximum rates of decrease from 0.1 to 0.2 in the transition zone between desert and savanna (Fig. 5, right column). This transition zone shifts southward from about 18 to 22∘ N at 8 kyr to around 14 to 20∘ N at 0 kyr. The latitudinal offset indicates that vegetation does not respond directly to changes in P but declines when a threshold is reached at low precipitation rates. The almost-constant rates of P and vegmax decline in the latitudes of maximum change in all periods represent a gradual transition from the green Sahara to the desert state.
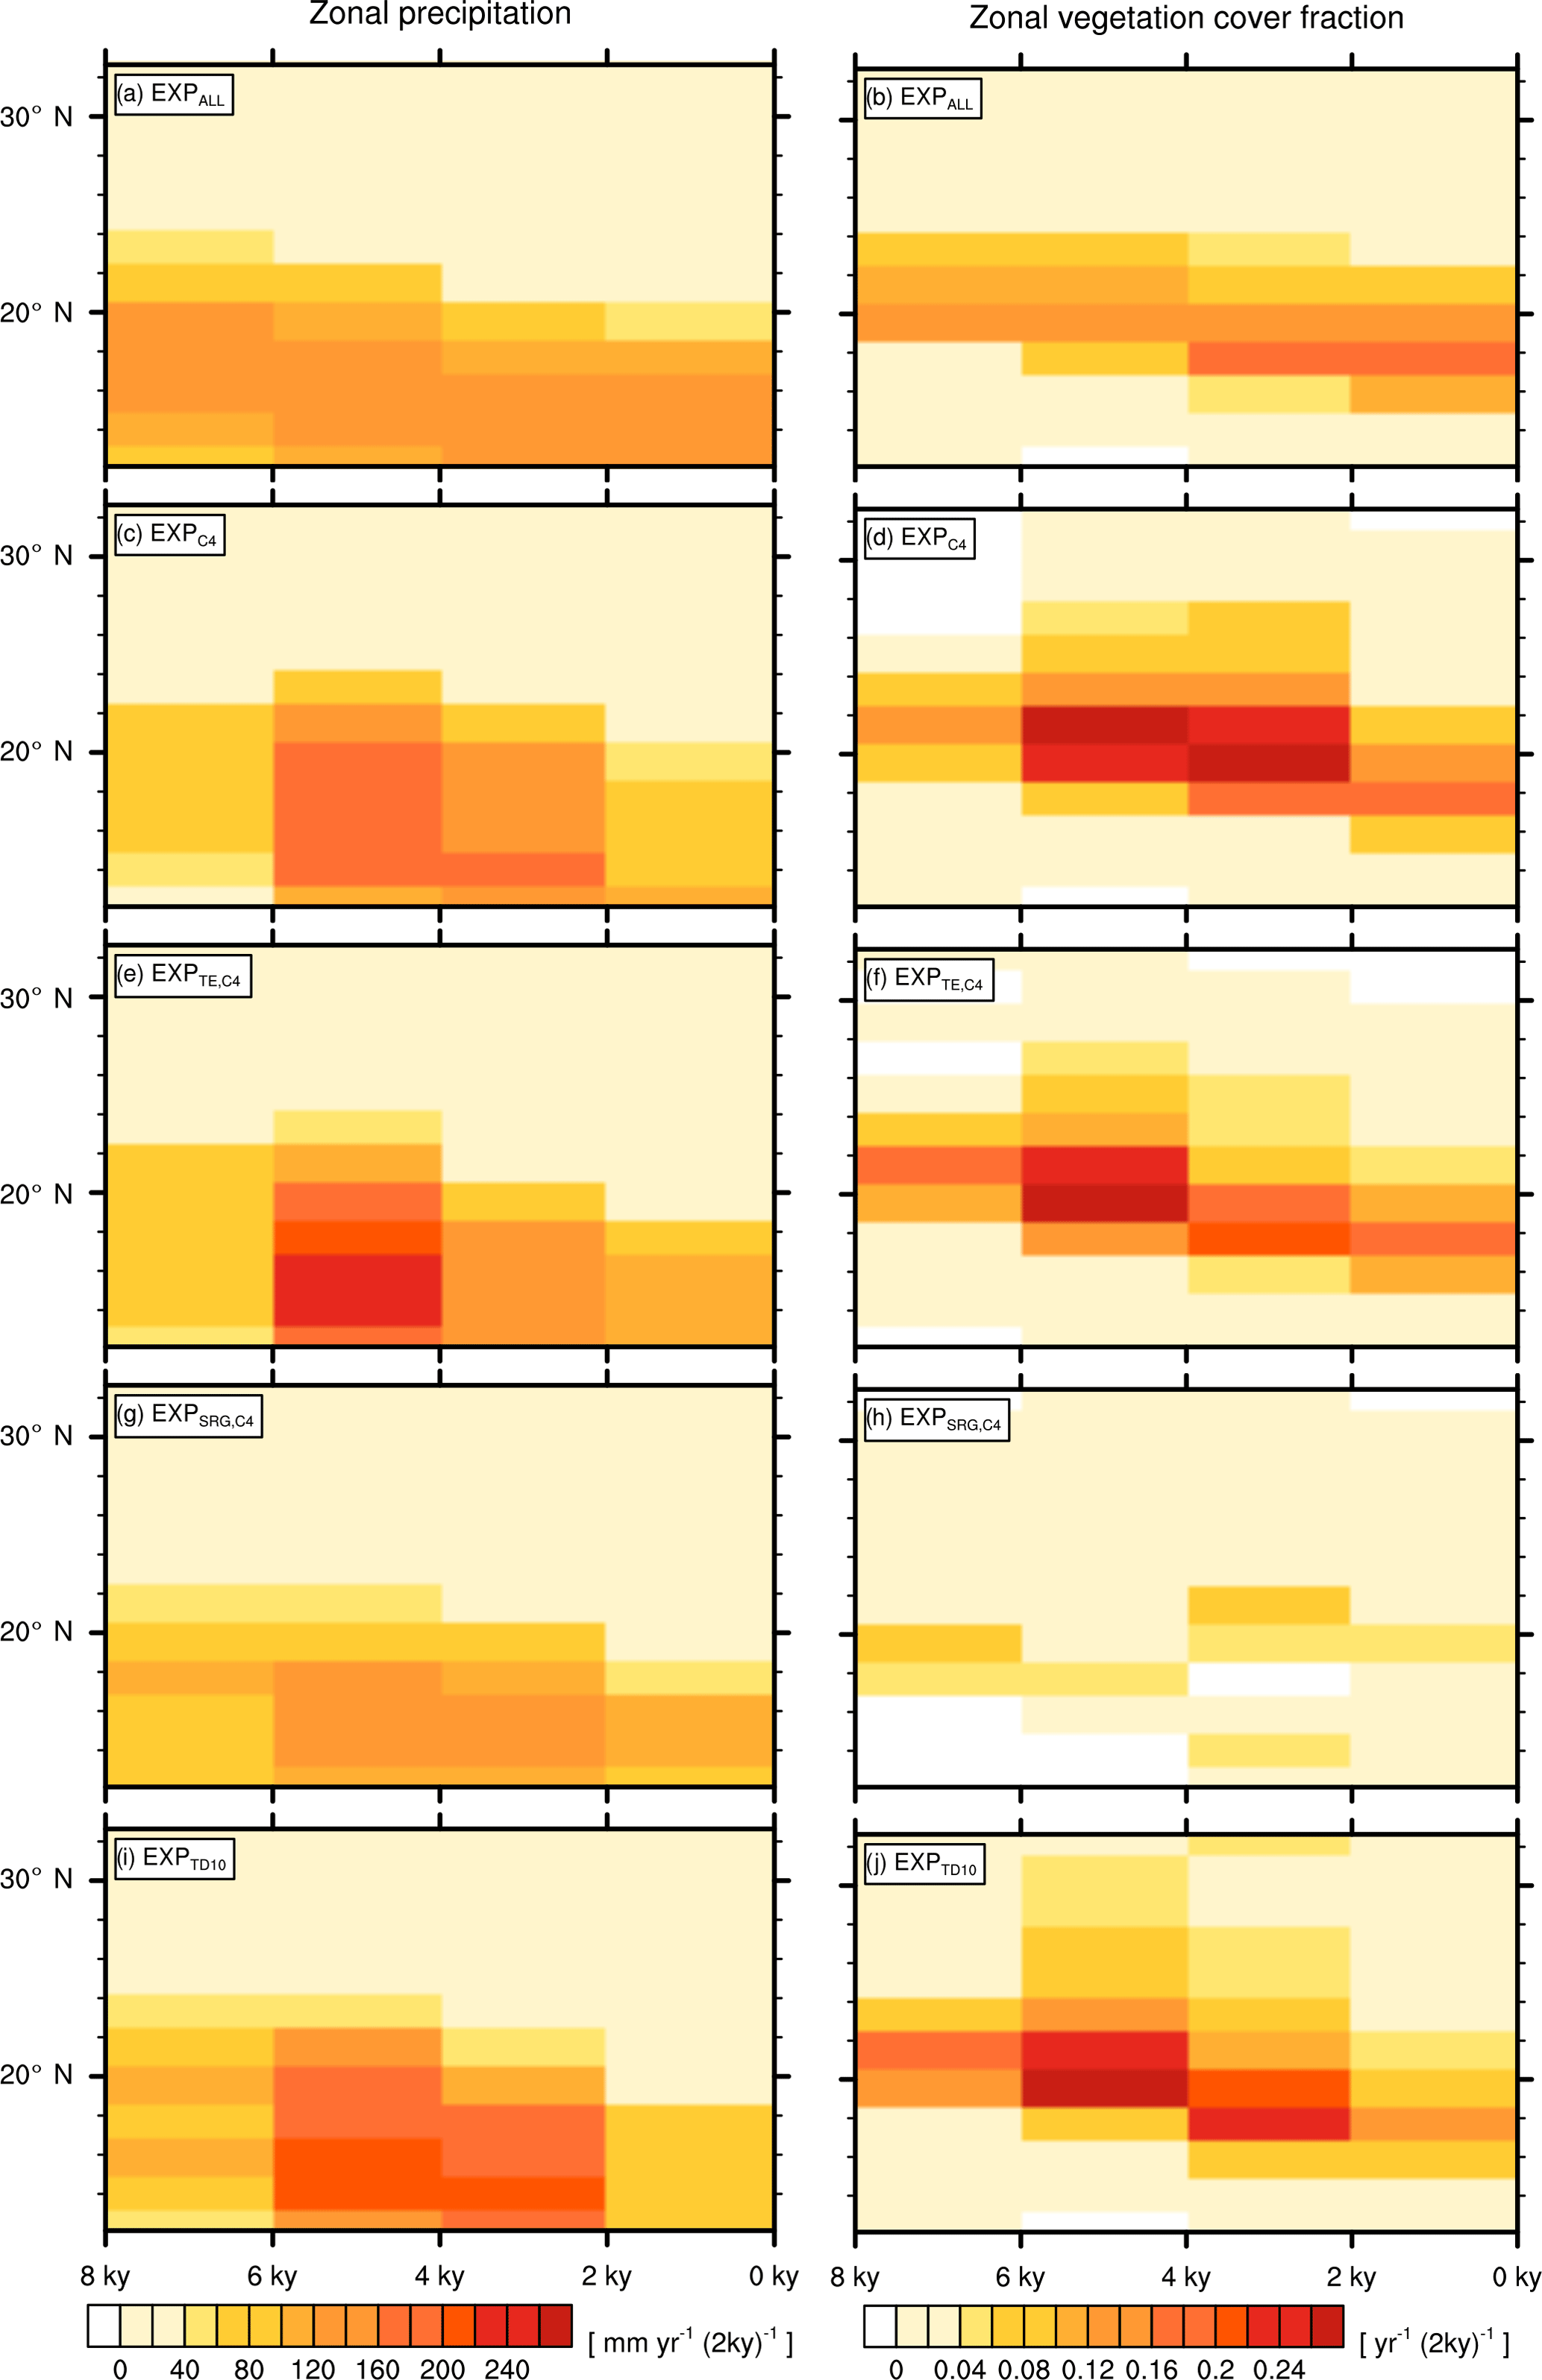
Figure 6Zonally averaged transition rates from the green Sahara to the desert state for precipitation ΔPi (left column) and vegetation cover fraction Δvegmax,i (right column). Plots depict differences between consecutive time slices (100-year averages) for EXPALL (a, b), (c, d), (e, f), (g, h), and (i, j).
The simulations with modified PFT diversity show qualitatively similar patterns of P and vegmax decline (see the Appendix). However, the timing and rate of transition substantially differ between simulations with different PFT compositions.
For the quantitative comparison of all simulations, we condense the information of the transition maps by calculating zonal means (15.94∘ W to 40.31∘ E) of P and vegmax, and subtracting consecutive time slices. These zonally averaged differences between consecutive time slices are in the following referred to as ΔP and Δvegmax. Figure 6 illustrates that the maximum as well as the temporal evolution of ΔP and Δvegmax considerably differ between simulations.
Just as described above for the transition maps, the latitudes of maximum change shift in EXPALL gradually southward by one grid cell per period (Fig. 6a). Δvegmax follows the symmetric pattern of ΔP with a meridional offset of around one grid cell to the north, reaching maximum rates of decrease in the transition zone between desert and savanna (Fig. 6b). In , , and , the temporal evolutions of ΔP and Δvegmax exhibit a delayed and sharpened transition compared to EXPALL (Fig. 6c–f, i–j), whereas depicts a delayed but smoothed transition (Fig. 6g, h). Δvegmax shows in an exceptional behaviour with a slow but non-monotonous southward shift of the most changing latitudes.
The explanation for differences in timing and magnitude of vegetation and precipitation decline between simulations with different PFT compositions is two-fold. The first part of the explanation lies in dissimilar initial precipitation and vegetation cover fraction values. High initial values of P and vegmax in , , and in the transition zone between desert and savanna imply a large gradient between green and desert state, and therewith inherit a larger potential for high ΔP and Δvegmax than EXPALL and (Fig. 2, Table 3). In other words, if the initial values are low, there is no potential to show a decrease as large as starting from a higher value.
The second part of the explanation lies in the disparate relationships between precipitation and vegetation cover fraction and in the associated different sensitivities to precipitation decline that are specific to the particular PFT composition, depicted in the vegetation–precipitation diagrams (V–P diagrams) in Fig. 4 for all simulations at 8 kyr (blue) and 0 kyr (red) including all grid cells in the study domain to cover the full precipitation spectrum.
If we consider a grid cell j at the upper end of the precipitation range in any simulation, the qualitatively constant relationship between P and vegmax over time indicates that vegmax,j “moves” left along the branch in the V–P diagram when Pj declines. Within a certain precipitation range, vegmax,j is not affected by a precipitation reduction until the threshold of maximum cover is reached. The position of this threshold is determined by the ratio of involved PFTs resulting from competition, their productivities, and their capabilities to suppress desert expansion as described earlier in Sect. 3.2. When Pj drops below the threshold of maximum cover, vegmax,j starts to decrease according to the slope of the branch. If the threshold value is low, the slope of the branch is steep, and vegmax,j drops abruptly with a small precipitation decline. If the threshold value is higher, the slope is shallower, and vegmax,j retreats more gradually. Thus, the regional response is sharp in , , and , gradual in EXPALL, and very shallow in . With further precipitation decline below the threshold, not only vegmax,j decreases, but the PFT composition changes as well. PFTs with high moisture requirements cannot sustain growth and are consequently replaced by more drought-resistant PFTs. The alteration in PFT composition implies that the relationship between Pj and vegmax,j changes in the respective grid cell; thus, the grid cell value “jumps” to another branch and follows its trajectory with further precipitation decrease. This jump happens most obviously in . When SRG disappears after 4 kyr and thereby allows C4 to establish, affected grid cells shift to the upper branch in the diagram, which resembles the main branch of , and reach a higher cover fractions with the same precipitation amount. This shift also explains the non-monotonous vegetation retreat in Fig. 6h.
The present study is a first attempt to account for effects of plant functional diversity on climate–vegetation interaction in a comprehensive Earth system model. Our results confirm previous conceptual studies on the effect of plant diversity on climate–vegetation interaction (Claussen et al., 2013; Groner et al., 2015) in accordance with the “diversity–stability” hypothesis (McCann, 2000; Scherer-Lorenzen, 2005): high diversity can smooth the vegetation response to an externally forced precipitation decline, as we demonstrate in the comparison between EXPALL and /. Our findings thereby reconcile a gradual transition from a green state to a desert state with a strong feedback between vegetation and climate. On the other hand, the removal or introduction of keystone species – here, SRG or TD10, respectively – can substantially alter the vegetation response to an externally forced precipitation decline. Despite the potential PFT diversity being highest in , the properties of realized PFTs change the vegetation dynamics and the interaction with the atmosphere such that the transition happens with a similar fast rate as the one in the simulation with only one PFT (). In contrast, the dominance of the desert-promoting SRG in leads to a transition that is even more gradual than in the experiments with higher potential PFT diversity. Thus, not the absolute number of potential PFTs but the realized PFT composition determines climate–vegetation interaction and the system response to changing external forcing.
Previous studies have shown that the differences in the strength of climate vegetation coupling contribute to the differences in the extent of the green Sahara in different models. The sensitivity of the simulated system to changes in PFT composition and PFT properties could be an additional explanation for why previous studies showed different extents of the green Sahara (see Claussen et al., 2017). Some land surface models such as ORCHIDEE (Krinner et al., 2005) do not have a raingreen shrub PFT, which plays a crucial role in competition in JSBACH, especially in the transition zone between desert and savanna. Further, the definition of bioclimatic limits in terms of minimum temperature of the coldest month, which is set to 15.5 ∘C in many land surface models, prevents tropical tree PFTs from establishment in regions where they were reconstructed for the AHP. With the significant increase of vegetation cover fraction north of 20∘ N, the simulation with a frost-tolerant tropical tree reaches a closer match to reconstructions than previous studies. The final choice of this bioclimatic limit requires further investigation.
Eventually, our findings raise the question how plant functional diversity should generally be represented in land surface models to obtain a functionally realistic description of vegetation. The PFT concept is the most commonly used approach to represent vegetation in the current generation of DGVMs, but its validity has been extensively discussed over the last years. The representation of plant diversity with a static set of discrete PFT parameters does not cover the range of species categorized as one PFT and disregards phenotypic plasticity and trait variability (Van Bodegom et al., 2012; Wullschleger et al., 2014) which are often larger within PFTs than between PFTs (de Bello et al., 2011; Kattge et al., 2011).
Alternative approaches to represent plant diversity consider the simulation of individual plants (e.g. LPJ-GUESS – Smith et al., 2001; aDGVM – Scheiter et al., 2013), “trait variability” which allows selected traits to vary within the range of observations to optimize growth under varying environmental conditions (e.g. JSBACH – Verheijen et al., 2013, 2015), “trait flexibility” which represents plant diversity in terms of plant ecophysiological trade-offs instead of PFTs by selecting for the most suitable growth strategy out of randomly generated sets of parameter values (e.g. JeDi-DGVM – Pavlick, 2012; aDGVM – Scheiter et al., 2013), or operate based on the “evolutionary optimality hypothesis”, an approach based on the microeconomic standard framework to determine the optimal input mix for a two-input production process – here water loss and carbon gain during photosynthesis (Wang et al., 2017).
Nevertheless, the PFT concept remains the current standard method to represent vegetation in land surface models, and we suggest that the uncertainties arising from the incomplete representation of plant diversity need to be taken into account in the interpretation of modelling studies.
In the present study, we have illustrated how variations in plant functional diversity affect climate–vegetation interaction towards the end of the AHP in coupled land–atmosphere simulations.
In experiments with AHP boundary conditions, the extent of the green Sahara varies considerably with changes in plant functional diversity. Differences in vegetation extent and PFT composition in turn alter land surface parameters, water cycling, and the surface energy budget. These changes have not only local consequences but significantly affect large-scale atmospheric circulation patterns, indicating a strong feedback between the terrestrial biosphere and the atmosphere. In contrast with the general hypothesis of a positive climate–vegetation feedback, we find that higher vegetation cover is not necessarily associated with higher precipitation but determined by the properties of the predominant PFTs which are highly model dependent. We demonstrate that the simulated climate–vegetation system state is highly sensitive to the implementation of these properties by the example of bioclimatic limits in terms of minimum temperature of the coldest month for the tropical deciduous tree PFT.
Towards the end of the AHP, modifications of PFT diversity significantly impact the timing and rate of transition to the desert state. While the simulations with the standard PFT set in MPI-ESM show a gradual decrease of precipitation and vegetation cover over time, variations in potential PFT diversity cause either a sharp decline of both variables or an even slower response to the external forcing depending on the realized PFT composition. The explanation lies in different initial precipitation and vegetation cover values as well as in different relationships between precipitation and vegetation cover fraction that are specific to the particular PFT composition.
In summary, we identify the realized PFT diversity rather than the potential PFT diversity as the decisive factor for climate–vegetation feedback strength, vegetation extent, and the timing and rate of transition from the green Sahara to the desert state in MPI-ESM. Since climate–vegetation interaction is highly sensitive to the PFT composition and the model-specific PFT representation, we expect that the observed effects are not limited to the subtropics during the mid-Holocene but could occur in different regions, especially in transition zones between different biomes, under different external forcings, including recent and future climate change. This raises the question how realistically Earth system models can actually represent climate–vegetation interaction, considering the poor representation of plant diversity in the current generation of land surface models. However, as long as the processes shaping ecosystems are still not fully understood, it remains a challenge to set the criteria for an appropriate representation of plant functional diversity in land surface models.
The MPI-ESM source code is available for scientific and educational purposes. Signing of the MPI-ESM licence agreement is required, which can be easily done through http://www.mpimet.mpg.de/en/science/models/license/ (last access: 3 April 2018). The model data used in this study are long-term archived at the DKRZ Hamburg tape archive for at least 5 years following publication and will be made available upon request. Please contact v.groner@ucl.ac.uk.
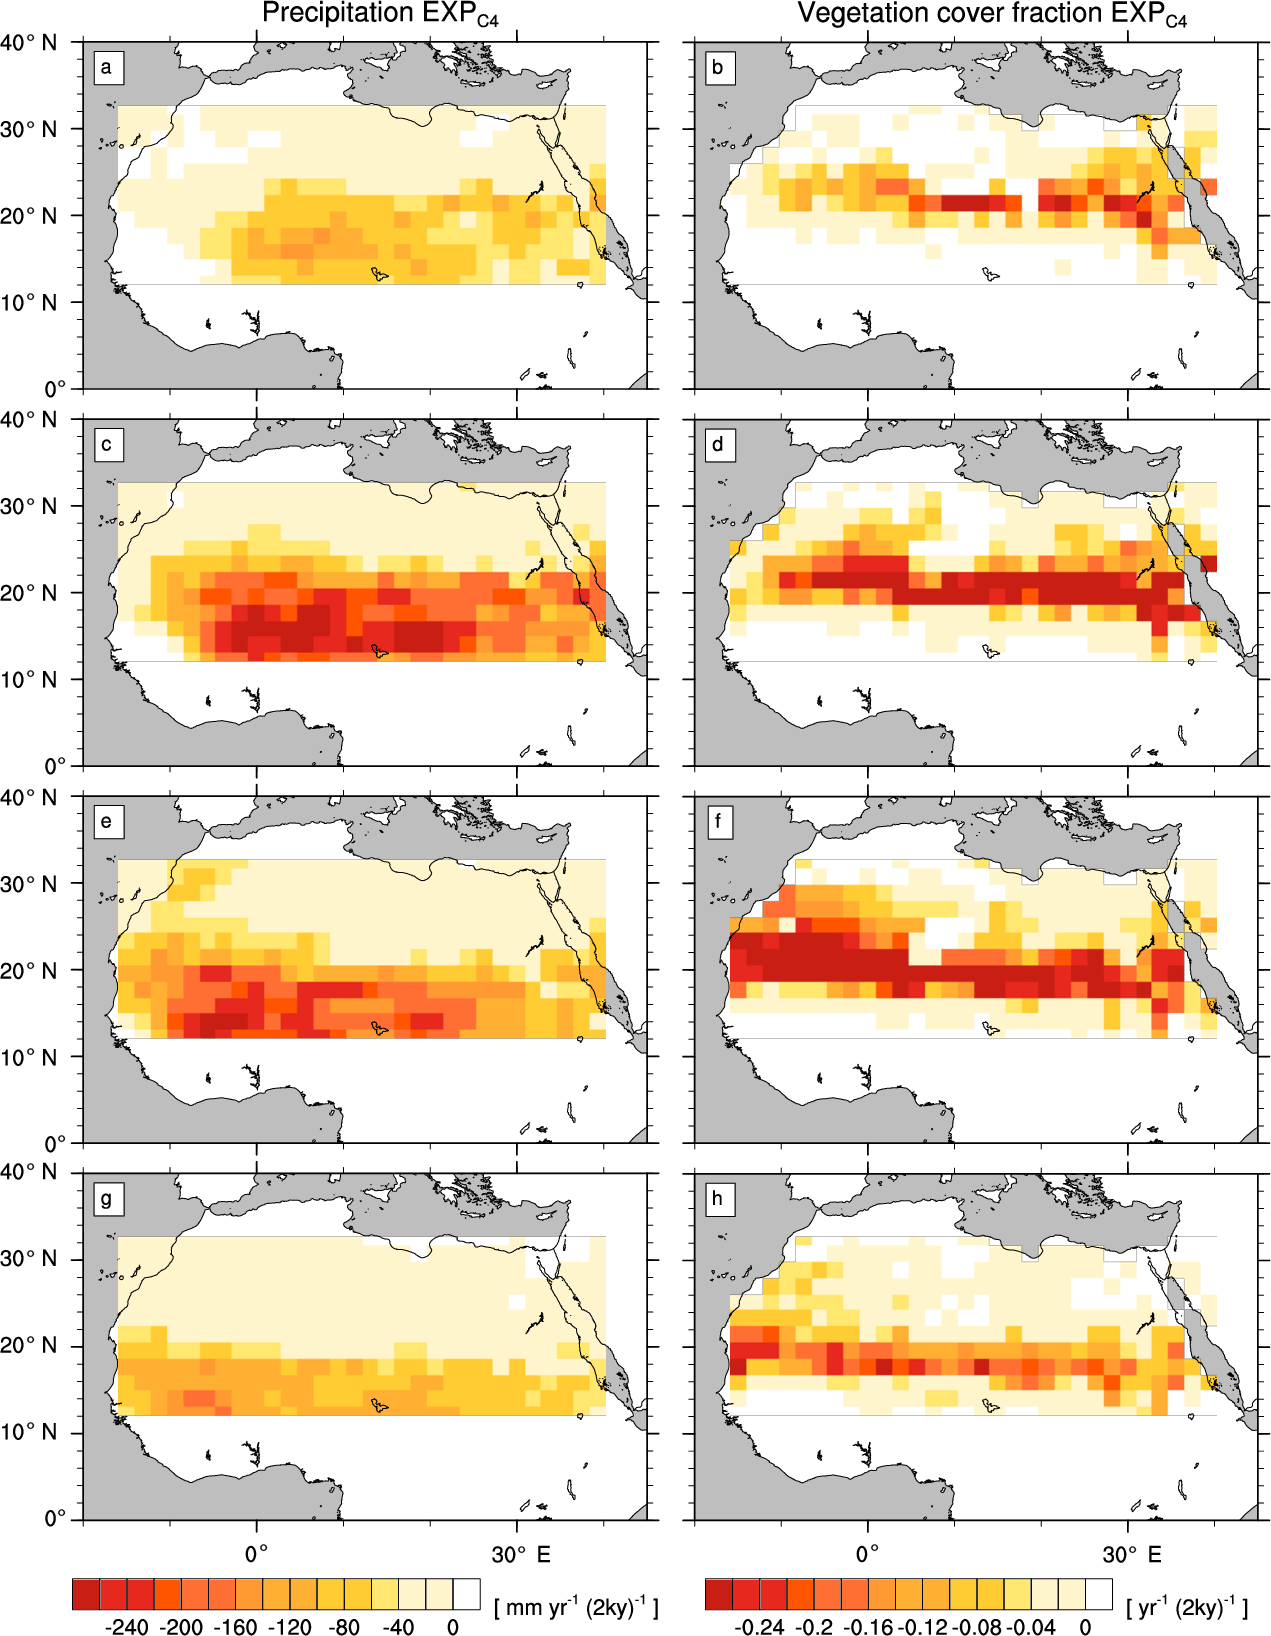
Figure A1Transition rates from the green Sahara to the desert state for precipitation P (left column) and vegetation cover fraction vegmax (right column) of a simulation with C4 grass only (). Plots depict differences between consecutive time slices (100-year averages): 6–8 kyr (a, b), 4–6 kyr (c, d), 2–4 kyr (e, f), and 0–2 kyr (g, h).
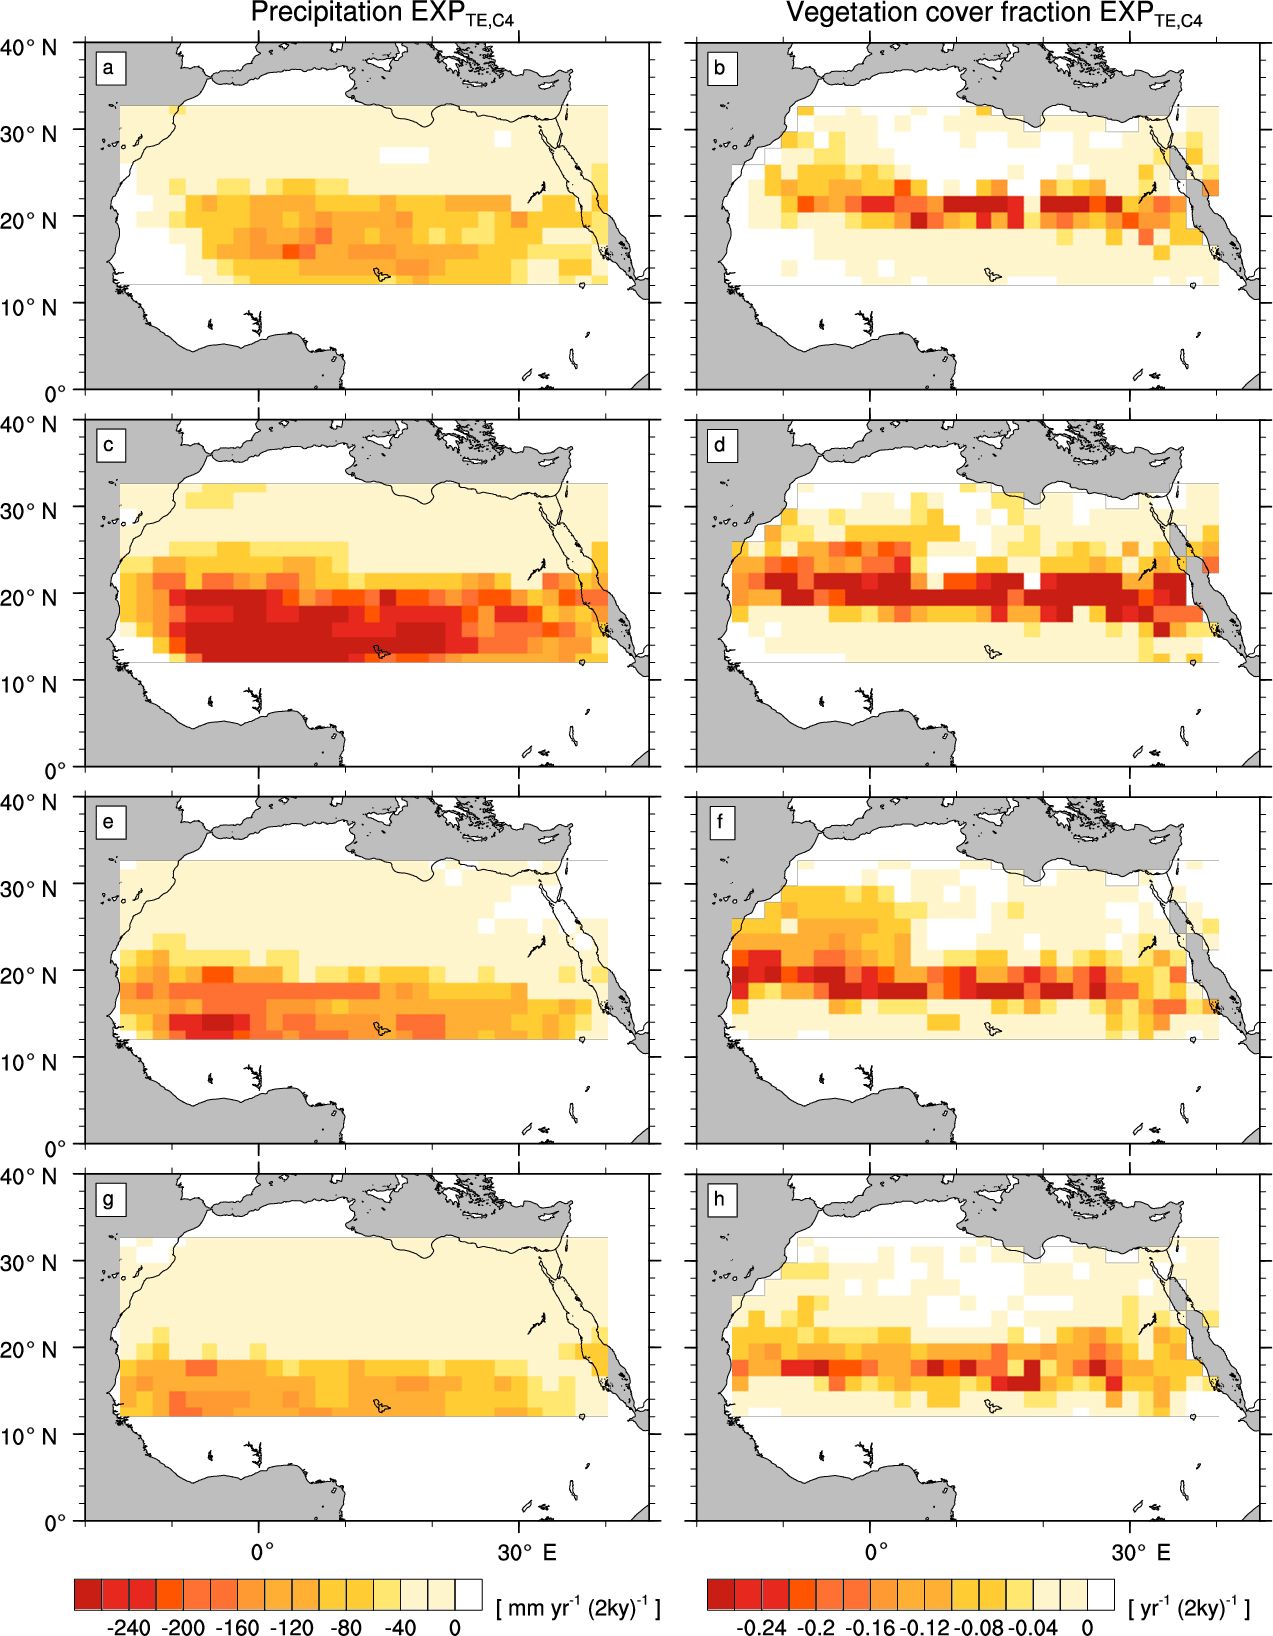
Figure A2Transition rates from the green Sahara to the desert state for precipitation P (left column) and vegetation cover fraction vegmax (right column) of a simulation with C4 grass and tropical evergreen tree (). Plots depict differences between consecutive time slices (100-year averages): 6–8 kyr (a, b), 4–6 kyr (c, d), 2–4 kyr (e, f), and 0–2 kyr (g, h).

Figure A3Transition rates from the green Sahara to the desert state for precipitation P (left column) and vegetation cover fraction vegmax (right column) of a simulation with C4 grass and raingreen shrub (). Plots depict differences between consecutive time slices (100-year averages): 6–8 kyr (a, b), 4–6 kyr (c, d), 2–4 kyr (e, f), and 0–2 kyr (g, h).
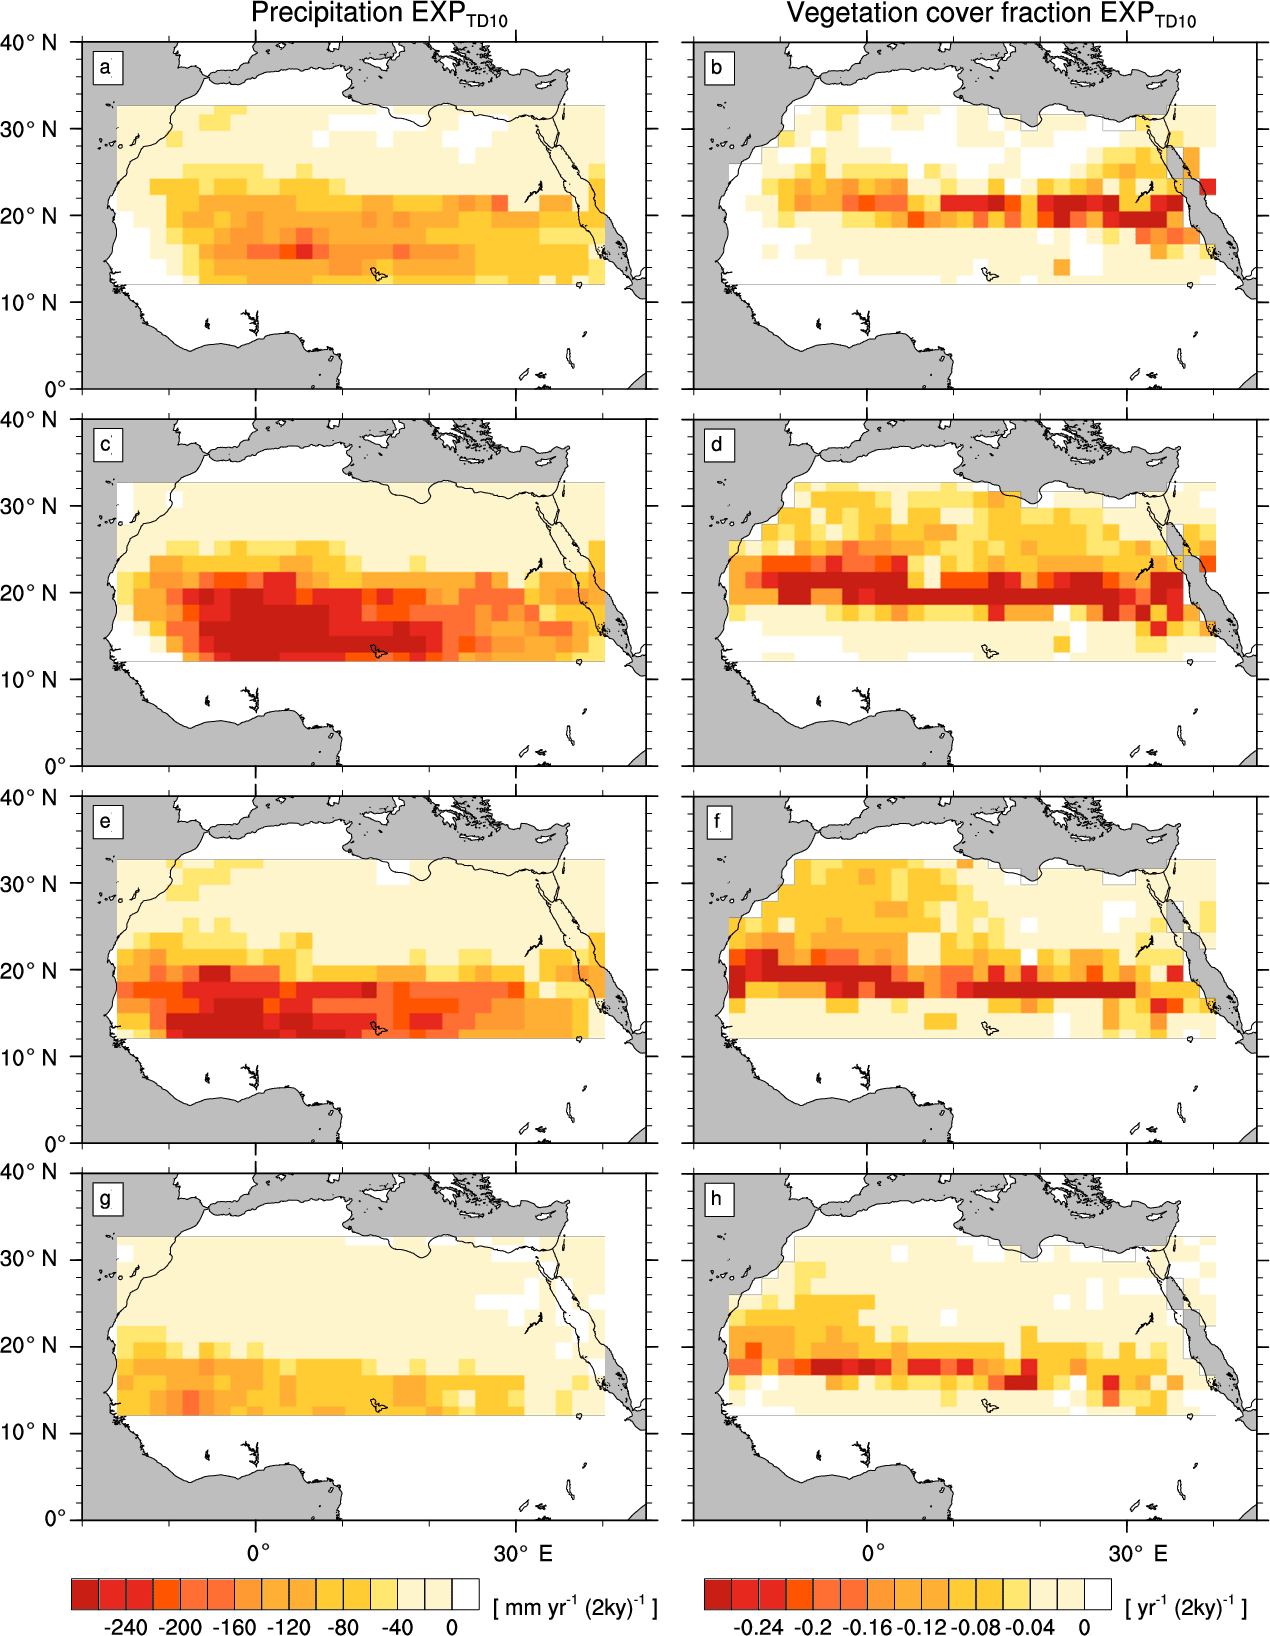
Figure A4Transition rates from the green Sahara to the desert state for precipitation P (left column) and vegetation cover fraction vegmax (right column) of a simulation with the standard PFT set and a newly designed frost-tolerant tropical deciduous tree PFT (). Plots depict differences between consecutive time slices (100-year averages): 6–8 kyr (a, b), 4–6 kyr (c, d), 2–4 kyr (e, f), and 0–2 kyr (g, h).
The authors declare that they have no conflict of interest.
We thank Victor Brovkin for internal review and fruitful discussions, and the anonymous referees for insightful
comments.
The article processing charges for this open-access
publication were covered by the Max Planck Society.
Edited by: Alexey V. Eliseev
Reviewed by: two anonymous referees
Bartlein, P. J., Harrison, S. P., Brewer, S., Connor, S., Davis, B. A. S., Gajewski, K., Guiot, J., Harrison-Prentice, T. I., Henderson, A., Peyron, O., Prentice, I. C., Scholze, M., Seppä, H., Shuman, B., Sugita, S., Thompson, R. S., Viau, A. E., Williams, J., and Wu, H.: Pollen-based continental climate reconstructions at 6 and 21 ka: a global synthesis, Clim. Dynam., 37, 775–802, https://doi.org/10.1007/s00382-010-0904-1, 2011. a
Bathiany, S., Claussen, M., Brovkin, V., Raddatz, T., and Gayler, V.: Combined biogeophysical and biogeochemical effects of large-scale forest cover changes in the MPI earth system model, Biogeosciences, 7, 1383–1399, https://doi.org/10.5194/bg-7-1383-2010, 2010. a
Bathiany, S., Claussen, M., and Fraedrich, K.: Implications of climate variability for the detection of multiple equilibria and for rapid transitions in the atmosphere–vegetation system, Clim. Dynam., 38, 1775–1790, https://doi.org/10.1007/s00382-011-1037-x, 2012. a
Berger, A. L.: Long-term variations of caloric insolation resulting from the earth's orbital elements, Quat. Res., 9, 139–167, https://doi.org/10.1016/0033-5894(78)90064-9, 1978. a, b
Bonfils, C., de Noblet-Ducoudré, N., Braconnot, P., and Joussaume, S.: Hot Desert Albedo and Climate Change: Mid-Holocene Monsoon in North Africa, J. Climate, 14, 3724–3737, https://doi.org/10.1175/1520-0442(2001)014<3724:HDAACC>2.0.CO;2, 2001. a
Braconnot, P., Joussaume, S., Marti, O., and de Noblet, N.: Synergistic feedbacks from ocean and vegetation on the African Monsoon response to Mid-Holocene insolation, Geophys. Res. Lett., 26, 2481–2484, https://doi.org/10.1029/1999GL006047, 1999. a
Brooks, T. M., Pimm, S. L., and Oyugi, J. O.: Time lag between deforestation and bird extinction in tropical forest fragments, Conserv. Biol., 13, 1140–1150, https://doi.org/10.1046/j.1523-1739.1999.98341.x, 1999. a
Brovkin, V., Claussen, M., Petoukhov, V., and Ganopolski, A.: On the stability of the atmosphere–vegetation system in the Sahara/Sahel region, J. Geophys. Res.-Atmos., 103, 31613–31624, https://doi.org/10.1029/1998JD200006, 1998. a
Brovkin, V., Raddatz, T., Reick, C. H., Claussen, M., and Gayler, V.: Global biogeophysical interactions between forest and climate, Geophys. Res. Lett., 36, L07405, https://doi.org/10.1029/2009GL037543, 2009. a
Claussen, M.: On coupling global biome models with climate models, Clim. Res., 4, 203–221, 1994. a
Claussen, M. and Gayler, V.: The greening of the Sahara during the Mid-Holocene: results of an interactive atmosphere–biome model, Global Ecol. Biogeogr., 6, 369–377, https://doi.org/10.2307/2997337, 1997. a, b
Claussen, M., Kubatzki, C., Brovkin, V., Ganopolski, A., Hoelzmann, P., and Pachur, H.-J.: Simulation of an abrupt change in Saharan vegetation in the Mid-Holocene, Geophys. Res. Lett., 26, 2037–2040, https://doi.org/10.1029/1999GL900494, 1999. a
Claussen, M., Bathiany, S., Brovkin, V., and Kleinen, T.: Simulated climate–vegetation interaction in semi-arid regions affected by plant diversity, Nat. Geosci., 6, 954–958, https://doi.org/10.1038/ngeo1962, 2013. a, b, c
Claussen, M., Dallmeyer, A., and Bader, J.: Theory and modeling of the African humid period and the green Sahara, in: Oxford Research Encyclopedia of Climate Science, https://doi.org/10.1093/acrefore/9780190228620.013.532, 2017. a, b
Coe, M. and Bonan, G.: Feedbacks between climate and surface water in northern Africa during the middle Holocene, J. Geophys. Res., 102, 11087–11101, https://doi.org/10.1029/97JD00343, 1997. a
Coughenour, M. B. and Ellis, J. E.: Landscape and climatic control of woody vegetation in a dry tropical ecosystem: Turkana District, Kenya, J. Biogeogr., 20, 383–398, https://doi.org/10.2307/2845587, 1993. a
de Bello, F., Lavorel, S., Albert, C. H., Thuiller, W., Grigulis, K., Dolezal, J., Janecek, S., and Leps, J.: Quantifying the relevance of intraspecific trait variability for functional diversity, Methods Ecol. Evol., 2, 163–174, https://doi.org/10.1111/j.2041-210X.2010.00071.x, 2011. a
deMenocal, P., Ortiz, J., Guilderson, T., Adkins, J., Sarnthein, M., Baker, L., and Yarusinsky, M.: Abrupt onset and termination of the African Humid Period: rapid climate responses to gradual insolation forcing, Quaternary Sci. Rev., 19, 347–361, https://doi.org/10.1016/S0277-3791(99)00081-5, 2000. a
Diamond, J. M.: Biogeographic kinetics: estimation of relaxation times for avifauna of southwest Pacific Islands, P. Natl. Acad. Sci. USA, 69, 3199–3203, 1972. a
Doherty, R., Kutzbach, J., Foley, J., and Pollard, D.: Fully coupled climate/dynamical vegetation model simulations over Northern Africa during the mid-Holocene, Clim. Dynam., 16, 561–573, https://doi.org/10.1007/s003820000065, 2000. a
Drake, N. A., Blench, R. M., Armitage, S. J., Bristow, C. S., and White, K. H.: Ancient watercourses and biogeography of the Sahara explain the peopling of the desert, P. Natl. Acad. Sci. USA, 108, 458–462, https://doi.org/10.1073/pnas.1012231108, 2011. a
Egerer, S., Claussen, M., Reick, C., and Stanelle, T.: The link between marine sediment records and changes in Holocene Saharan landscape: simulating the dust cycle, Clim. Past, 12, 1009–1027, https://doi.org/10.5194/cp-12-1009-2016, 2016. a
FAO/UNESCO: Soil map of the world 1 : 5 000 000, vols. 1–10, 1974. a
Francus, P., von Suchodoletz, H., Dietze, M., Donner, R. V., Bouchard, F., Roy, A.-J., Fagot, M., Verschuren, D., and Kröpelin, S.: Varved sediments of Lake Yoa (Ounianga Kebir, Chad) reveal progressive drying of the Sahara during the last 6100 years, Sedimentology, 60, 911–934, https://doi.org/10.1111/j.1365-3091.2012.01370.x, 2013. a
Grist, J. P. and Nicholson, S. E.: A Study of the Dynamic Factors Influencing the Rainfall Variability in the West African Sahel, J. Climate, 14, 1337–1359, https://doi.org/10.1175/1520-0442(2001)014<1337:ASOTDF>2.0.CO;2, 2001. a
Groner, V. P., Claussen, M., and Reick, C.: Palaeo plant diversity in subtropical Africa – ecological assessment of a conceptual model of climate–vegetation interaction, Clim. Past, 11, 1361–1374, https://doi.org/10.5194/cp-11-1361-2015, 2015. a, b
Hagemann, S. and Stacke, T.: Impact of the soil hydrology scheme on simulated soil moisture memory, Clim. Dynam., 44, 1731–1750, https://doi.org/10.1007/s00382-014-2221-6, 2015. a
Harrison, S. P., Prentice, I. C., Barboni, D., Kohfeld, K. E., Ni, J., and Sutra, J.: Ecophysiological and bioclimatic foundations for a global plant functional classification, J. Veg. Sci., 21, 300–317, https://doi.org/10.1111/j.1654-1103.2009.01144.x, 2010. a
Hély, C., Lézine, A.-M., and APD contributors: Holocene changes in African vegetation: tradeoff between climate and water availability, Clim. Past, 10, 681–686, https://doi.org/10.5194/cp-10-681-2014, 2014. a, b
Hoelzmann, P., Jolly, D., Harrison, S. P., Laarif, F., Bonnefille, R., and Pachur, H.-J.: Mid-Holocene land-surface conditions in northern Africa and the Arabian Peninsula: a data set for the analysis of biogeophysical feedbacks in the climate system, Global Biogeochem. Cy., 12, 35–51, https://doi.org/10.1029/97GB02733, 1998. a
Hulme, M. and Tosdevin, N.: The Tropical easterly Jet and Sudan rainfall: A review, Theor. Appl. Climatol., 39, 179–187, https://doi.org/10.1007/BF00867945, 1989. a
Hurrell, J. W., Hack, J. J., Shea, D., Caron, J. M., and Rosinski, J.: A New Sea Surface Temperature and Sea Ice Boundary Dataset for the Community Atmosphere Model, J. Climate, 21, 5145–5153, https://doi.org/10.1175/2008JCLI2292.1, 2008. a
Jenkins, G. S., Gaye, A. T., and Sylla, B.: Late 20th century attribution of drying trends in the Sahel from the Regional Climate Model (RegCM3), Geophys. Res. Lett., 32, l22705, https://doi.org/10.1029/2005GL024225, 2005. a
Jolly, D., Prentice, I. C., Bonnefille, R., Ballouche, A., Bengo, M., Brenac, P., Buchet, G., Burney, D., Cazet, J.-P., Cheddadi, R., Edorh, T., Elenga, H., Elmoutaki, S., Guiot, J., Laarif, F., Lamb, H., Lezine, A.-M., Maley, J., Mbenza, M., Peyron, O., Reille, M., Reynaud-Farrera, I., Riollet, G., Ritchie, J. C., Roche, E., Scott, L., Ssemmanda, I., Straka, H., Umer, M., Van Campo, E., Vilimumbalo, S., Vincens, A., and Waller, M.: Biome reconstruction from pollen and plant macrofossil data for Africa and the Arabian peninsula at 0 and 6000 years, J. Biogeogr., 25, 1007–1027, https://doi.org/10.1046/j.1365-2699.1998.00238.x, 1998. a, b
Jungclaus, J. H., Fischer, N., Haak, H., Lohmann, K., Marotzke, J., Matei, D., Mikolajewicz, U., Notz, D., and von Storch, J. S.: Characteristics of the ocean simulations in the Max Planck Institute Ocean Model (MPIOM) the ocean component of the MPI-Earth system model, Adv. Mod. Earth Sy., 5, 422–446, https://doi.org/10.1002/jame.20023, 2013. a
Kattge, J., Diaz, S., Lavorel, S., Prentice, I. C., Leadley, P., Bonisch, G., Garnier, E., Westoby, M., Reich, P. B., Wright, I. J., Cornelissen, J. H. C., Violle, C., Harrison, S. P., van Bodegom, P. M., Reichstein, M., Soudzilovskaia, N. A., Ackerly, D. D., Anand, M., Atkin, O., Bahn, M., Baker, T. R., Baldocchi, D., Bekker, R., Blanco, C., Blonder, B., Bond, W., Bradstock, R., Bunker, D. E., Casanoves, F., Cavender-Bares, J., Chambers, J., Chapin, F. S., Chave, J., Coomes, D., Cornwell, W. K., Craine, J. M., Dobrin, B. H., Durka, W., Elser, J., Enquist, B. J., Esser, G., Estiarte, M., Fagan, W. F., Fang, J., Fernandez, F., Fidelis, A., Finegan, B., Flores, O., Ford, H., Frank, D., Freschet, G. T., Fyllas, N. M., Gallagher, R., Green, W., Gutierrez, A. G., Hickler, T., Higgins, S., Hodgson, J. G., Jalili, A., Jansen, S., Kerkhoff, A. J., Kirkup, D., Kitajima, K., Kleyer, M., Klotz, S., Knops, J. M. H., Kramer, K., Kuhn, I., Kurokawa, H., Laughlin, D., Lee, T. D., Leishman, M., Lens, F., Lenz, T., Lewis, S. L., Lloyd, J., Llusia, J., Louault, F., Ma, S., Mahecha, M. D., Manning, P., Massad, T., Medlyn, B., Messier, J., Moles, A., Muller, S., Nadrowski, K., Naeem, S., Niinemets, U., Nollert, S., Nuske, A., Ogaya, R., Joleksyn, J., Onipchenko, V. G., Onoda, Y., Ordonez, J., Overbeck, G., Ozinga, W., Patino, S., Paula, S., Pausas, J. G., Penuelas, J., Phillips, O. L., Pillar, V., Poorter, H., Poorter, L., Poschlod, P., Proulx, R., Rammig, A., Reinsch, S., Reu, B., Sack, L., Salgado, B., Sardans, J., Shiodera, S., Shipley, B., Sosinski, E., Soussana, J.-F., Swaine, E., Swenson, N., Thompson, K., Thornton, P., Waldram, M., Weiher, E., White, M., Wright, S. J., Zaehle, S., Zanne, A. E., and Wirth, C.: TRY – a global database of plant traits, Glob. Change Biol., 17, 2905–2935, https://doi.org/10.1111/j.1365-2486.2011.02451.x, 2011. a
Knorr, W. and Schnitzler, K.-G.: Enhanced albedo feedback in North Africa from possible combined vegetation and soil-formation processes, Clim. Dynam., 26, 55–63, https://doi.org/10.1007/s00382-005-0073-9, 2006. a
Krinner, G., Viovy, N., de Noblet-Ducoudré, N., Ogée, J., Polcher, J., Friedlingstein, P., Ciais, P., Sitch, S., and Prentice, I. C.: A dynamic global vegetation model for studies of the coupled atmosphere-biosphere system, Global Biogeochem. Cy., 19, gB1015, https://doi.org/10.1029/2003GB002199, 2005. a
Krinner, G., Lézine, A.-M., Braconnot, P., Sepulchre, P., Ramstein, G., Grenier, C., and Gouttevin, I.: A reassessment of lake and wetland feedbacks on the North African Holocene climate, Geophys. Res. Lett., 39, L07701, https://doi.org/10.1029/2012GL050992, 2012. a
Kröpelin, S., Verschuren, D., Lézine, A.-M., Eggermont, H., Cocquyt, C., Francus, P., Cazet, J.-P., Fagot, M., Rumes, B., Russell, J. M., Darius, F., Conley, D. J., Schuster, M., von Suchodoletz, H., and Engstrom, D. R.: Climate-driven ecosystem succession in the Sahara: the past 6000 years, Science, 320, 765–768, https://doi.org/10.1126/science.1154913, 2008. a, b
Kutzbach, J. E.: Monsoon climate of the Early Holocene: climate experiment with the Earth's orbital parameters for 9000 years ago, Science, 214, 59–61, https://doi.org/10.1126/science.214.4516.59, 1981. a
Kutzbach, J. E. and Guetter, P. J.: The influence of changing orbital parameters and surface boundary conditions on climate simulations for the past 18,000 years, J. Atmos. Sci., 43, 1726–1759, 1986. a
Kutzbach, J. E. and Liu, Z.: Response of the African monsoon to orbital forcing and ocean feedbacks in the Middle Holocene, Science, 278, 440–443, https://doi.org/10.1126/science.278.5337.440, 1997. a
Lézine, A.-M.: Timing of vegetation changes at the end of the Holocene humid period in desert areas at the northern edge of the Atlantic and Indian monsoon systems, Comptes Rendus Geoscience, 341, 750–759, https://doi.org/10.1016/j.crte.2009.01.001, 2009. a
Lézine, A.-M., Hély, C., Grenier, C., Braconnot, P., and Krinner, G.: Sahara and Sahel vulnerability to climate changes, lessons from Holocene hydrological data, Quaternary Sci. Rev., 30, 3001–3012, https://doi.org/10.1016/j.quascirev.2011.07.006, 2011a. a
Lézine, A.-M., Zheng, W., Braconnot, P., and Krinner, G.: Late Holocene plant and climate evolution at Lake Yoa, northern Chad: pollen data and climate simulations, Clim. Past, 7, 1351–1362, https://doi.org/10.5194/cp-7-1351-2011, 2011b. a
Liu, Z., Harrison, S. P., Kutzbach, J., and Otto-Bliesner, B.: Global monsoons in the mid-Holocene and oceanic feedback, Clim. Dynam., 22, 157–182, https://doi.org/10.1007/s00382-003-0372-y, 2004. a
Liu, Z., Wang, Y., Gallimore, R., Gasse, F., Johnson, T., deMenocal, P., Adkins, J., Notaro, M., Prentice, I., Kutzbach, J., Jacob, R., Behling, P., Wang, L., and Ong, E.: Simulating the transient evolution and abrupt change of Northern Africa atmosphere-ocean-terrestrial ecosystem in the Holocene, Quaternary Sci. Rev., 26, 1818–1837, https://doi.org/10.1016/j.quascirev.2007.03.002, 2007. a
McCann, K. S.: The diversity–stability debate, Nature, 405, 228–233, https://doi.org/10.1038/35012234, 2000. a
Müller, J. M.: Selected climatic data for a global set of standard stations for vegetation science, Junk, The Hague, 1982. a
Nicholson, S. E.: The intensity, location and structure of the tropical rainbelt over west Africa as factors in interannual variability, Int. J. Climatol., 28, 1775–1785, https://doi.org/10.1002/joc.1507, 2008. a
Nicholson, S. E.: The West African Sahel: A Review of Recent Studies on the Rainfall Regime and Its Interannual Variability, ISRN Meteorology, 2013, 1–32, https://doi.org/10.1155/2013/453521, 2013. a, b
Nicholson, S. E. and Grist, J. P.: The Seasonal Evolution of the Atmospheric Circulation over West Africa and Equatorial Africa, J. Climate, 16, 1013–1030, https://doi.org/10.1175/1520-0442(2003)016<1013:TSEOTA>2.0.CO;2, 2003. a, b
Okumura, Y. and Xie, S.-P.: Interaction of the Atlantic Equatorial Cold Tongue and the African Monsoon, J. Climate, 17, 3589–3602, https://doi.org/10.1175/1520-0442(2004)017<3589:IOTAEC>2.0.CO;2, 2004. a
Otto, J., Raddatz, T., and Claussen, M.: Strength of forest-albedo feedback in mid-Holocene climate simulations, Clim. Past, 7, 1027–1039, https://doi.org/10.5194/cp-7-1027-2011, 2011. a
Pausata, F., Messori, G., and Zhang, Q.: Impacts of dust reduction on the northward expansion of the African monsoon during the Green Sahara period, EPSL, 434, 298–307, https://doi.org/10.1016/j.epsl.2015.11.049, 2016. a
Pavlick, R.: Development and evaluation of a diverse dynamic global vegetation model based on plant functional tradeoffs, PhD thesis, Universität Hamburg, 2012. a
Prentice, I., Cramer, W., Harrison, S., Leemans, R., Monserud, R., and Solomon, A.: Special Paper: A Global Biome Model Based on Plant Physiology and Dominance, Soil Properties and Climate, J. Biogeogr., 19, 117–134, https://doi.org/10.2307/2845499, 1992. a
Rachmayani, R., Prange, M., and Schulz, M.: North African vegetation–precipitation feedback in early and mid-Holocene climate simulations with CCSM3-DGVM, Clim. Past, 11, 175–185, https://doi.org/10.5194/cp-11-175-2015, 2015. a, b
Raddatz, T. J., Reick, C. H., Knorr, W., Kattge, J., Roeckner, E., Schnur, R., Schnitzler, K.-G., Wetzel, P., and Jungclaus, J.: Will the tropical land biosphere dominate the climate – carbon cycle feedback during the twenty-first century?, Clim. Dynam., 29, 565–574, https://doi.org/10.1007/s00382-007-0247-8, 2007. a
Reick, C. H., Raddatz, T., Brovkin, V., and Gayler, V.: Representation of natural and anthropogenic land cover change in MPI-ESM, Adv. Model. Earth Sy., 5, 459–482, https://doi.org/10.1002/jame.20022, 2013. a, b, c, d
Ritchie, J. and Haynes, C.: Holocene vegetation zonation in the eastern Sahara, Nature, 330, 645–647, https://doi.org/10.1038/330645a0, 1987. a
Scheiter, S., Langan, L., and Higgins, S. I.: Next-generation dynamic global vegetation models: learning from community ecology, New Phytol., 198, 957–969, https://doi.org/10.1111/nph.12210, 2013. a, b
Scherer-Lorenzen, M.: Biodiversity and ecosystem functioning: basic principles, in: Biodiversity: Structure and Function, in: Encyclopedia of Life Support Systems (EOLSS), Developed under the Auspices of the UNESCO, edited by: Barthlott, W., Linsenmair, K. E., and Porembski, S., EOLSS Publisher, Oxford, 2005. a
Schlesinger, W. H., Reynolds, J. F., Cunningham, G. L., Huenneke, L. F., Jarrell, W. M., Virginia, R. A., and Whitford, W. G.: Biological feedbacks in global desertification, Science, 247, 1043–1048, https://doi.org/10.1126/science.247.4946.1043, 1990. a
Schlesinger, W. H., Raikes, J. A., Hartley, A. E., and Cross, A. F.: On the Spatial Pattern of Soil Nutrients in Desert Ecosystems, Ecology, 77, 364–374, https://doi.org/10.2307/2265615, 1996. a
Shanahan, T. M., Mckay, N. P., Hughen, K. A., Overpeck, J. T., Otto-Bliesner, B., Heil, C. W., King, J., Scholz, C. A., and Peck, J.: The time-transgressive termination of the African humid period, Nat. Geosci., 8, 140–144, https://doi.org/10.1038/ngeo2329, 2015. a
Smith, B., Prentice, I. C., and Sykes, M. T.: Representation of vegetation dynamics in the modelling of terrestrial ecosystems: comparing two contrasting approaches within European climate space, Glob. Ecol. Biogeogr., 10, 621–637, 2001. a
Stevens, B., Giorgetta, M., Esch, M., Mauritsen, T., Crueger, T., Rast, S., Salzmann, M., Schmidt, H., Bader, J., Block, K., Brokopf, R., Fast, I., Kinne, S., Kornblueh, L., Lohmann, U., Pincus, R., Reichler, T., and Roeckner, E.: Atmospheric component of the MPI-M Earth System Model: ECHAM6, Adv. Mod. Earth Sys., 5, 146–172, https://doi.org/10.1002/jame.20015, 2013. a, b
Texier, D., de Noblet, N., Harrison, S. P., Haxeltine, A., Jolly, D., Joussaume, S., Laarif, F., Prentice, I. C., and Tarasov, P.: Quantifying the role of biosphere-atmosphere feedbacks in climate change: coupled model simulations for 6000 years BP and comparison with palaeodata for northern Eurasia and northern Africa, Clim. Dynam., 13, 865–882, https://doi.org/10.1007/s003820050202, 1997. a
Texier, D., de Noblet, N., and Braconnot, P.: Sensitivity of the African and Asian Monsoons to Mid-Holocene Insolation and Data-Inferred Surface Changes, J. Climate, 13, 164–181, https://doi.org/10.1175/1520-0442(2000)013<0164:SOTAAA>2.0.CO;2, 2000. a
Vamborg, F. S. E., Brovkin, V., and Claussen, M.: The effect of a dynamic background albedo scheme on Sahel/Sahara precipitation during the mid-Holocene, Clim. Past, 7, 117–131, https://doi.org/10.5194/cp-7-117-2011, 2011. a, b, c
Van Bodegom, P. M., Douma, J. C., Witte, J. P. M., Ordonez, J. C., Bartholomeus, R. P., and Aerts, R.: Going beyond limitations of plant functional types when predicting global ecosystem–atmosphere fluxes: exploring the merits of traits-based approaches, Glob. Ecol. Biogeogr., 21, 625–636, https://doi.org/10.1111/j.1466-8238.2011.00717.x, 2012. a
Vellend, M., Verheyen, K., Jacquemyn, H., Kolb, A., Van Calster, H., Peterken, G., and Hermy, M.: Extinction debt of forest plants persists for more than a century following habitat fragmentation, Ecology, 87, 542–548, https://doi.org/10.1890/05-1182, 2006. a
Verheijen, L., Aerts, R., Brovkin, V., Cavender-Bares, J., Cornelissen, J., Kattge, J., and van Bodegom, M.: Inclusion of ecologically based trait variation in plant functional types reduces the projected land carbon sink in an earth system model, Glob. Change Biol., 21, 3074–3086, https://doi.org/10.1111/gcb.12871, 2015. a
Verheijen, L. M., Brovkin, V., Aerts, R., Bönisch, G., Cornelissen, J. H. C., Kattge, J., Reich, P. B., Wright, I. J., and van Bodegom, P. M.: Impacts of trait variation through observed trait–climate relationships on performance of an Earth system model: a conceptual analysis, Biogeosciences, 10, 5497–5515, https://doi.org/10.5194/bg-10-5497-2013, 2013. a
Wang, H., Prentice, I. C., Keenan, T. F., Davis, T. W., Wright, I. J., Cornwell, W. K., Evans, B. J., and Peng, C.: Towards a universal model for carbon dioxide uptake by plants, Nature Plants, 3, 734–741, https://doi.org/10.1038/s41477-017-0006-8, 2017. a
Watrin, J., Lézine, A.-M., Hély, C., Cour, P., Ballouche, D., and Contributors: Plant migration and plant communities at the time of the “Green Sahara”, histoire climatique des déserts d'Afrique et d'Arabie Climatic history of the African and Arabian deserts, CR Geosci., 341, 656–670, https://doi.org/10.1016/j.crte.2009.06.007, 2009. a
Whitford, W.: Ecology of Desert Systems, Elsevier Science, available at: https://books.google.de/books?id=OZ4hZbXS8IcC (last access: 22 March 2018), 2002. a
Williams, J. W., Blois, J. L., and Shuman, B. N.: Extrinsic and intrinsic forcing of abrupt ecological change: case studies from the late Quaternary, J. Ecol., 99, 664–677, https://doi.org/10.1111/j.1365-2745.2011.01810.x, 2011. a
Wullschleger, S. D., Epstein, H. E., Box, E. O., Euskirchen, E. S., Goswami, S., Iversen, C. M., Kattge, J., Norby, R. J., van Bodegom, P. M., and Xu, X.: Plant functional types in Earth system models: past experiences and future directions for application of dynamic vegetation models in high-latitude ecosystems, Ann. Bot.-London, 114, 1–16, https://doi.org/10.1093/aob/mcu077, 2014. a