the Creative Commons Attribution 4.0 License.
the Creative Commons Attribution 4.0 License.
 | 09 May 2018
A model based on Rock-Eval thermal analysis to quantify the size of the centennially persistent organic carbon pool in temperate soils
Lauric Cécillon
François Baudin
Claire Chenu
Sabine Houot
Romain Jolivet
Thomas Kätterer
Suzanne Lutfalla
Andy Macdonald
Folkert van Oort
Alain F. Plante
Florence Savignac
Laure N. Soucémarianadin
Pierre Barré
Changes in global soil carbon stocks have considerable potential to influence the course of future climate change. However, a portion of soil organic carbon (SOC) has a very long residence time (> 100 years) and may not contribute significantly to terrestrial greenhouse gas emissions during the next century. The size of this persistent SOC reservoir is presumed to be large. Consequently, it is a key parameter required for the initialization of SOC dynamics in ecosystem and Earth system models, but there is considerable uncertainty in the methods used to quantify it. Thermal analysis methods provide cost-effective information on SOC thermal stability that has been shown to be qualitatively related to SOC biogeochemical stability. The objective of this work was to build the first quantitative model of the size of the centennially persistent SOC pool based on thermal analysis. We used a unique set of 118 archived soil samples from four agronomic experiments in northwestern Europe with long-term bare fallow and non-bare fallow treatments (e.g., manure amendment, cropland and grassland) as a sample set for which estimating the size of the centennially persistent SOC pool is relatively straightforward. At each experimental site, we estimated the average concentration of centennially persistent SOC and its uncertainty by applying a Bayesian curve-fitting method to the observed declining SOC concentration over the duration of the long-term bare fallow treatment. Overall, the estimated concentrations of centennially persistent SOC ranged from 5 to 11 g C kg−1 of soil (lowest and highest boundaries of four 95 % confidence intervals). Then, by dividing the site-specific concentrations of persistent SOC by the total SOC concentration, we could estimate the proportion of centennially persistent SOC in the 118 archived soil samples and the associated uncertainty. The proportion of centennially persistent SOC ranged from 0.14 (standard deviation of 0.01) to 1 (standard deviation of 0.15). Samples were subjected to thermal analysis by Rock-Eval 6 that generated a series of 30 parameters reflecting their SOC thermal stability and bulk chemistry. We trained a nonparametric machine-learning algorithm (random forests multivariate regression model) to predict the proportion of centennially persistent SOC in new soils using Rock-Eval 6 thermal parameters as predictors. We evaluated the model predictive performance with two different strategies. We first used a calibration set (n = 88) and a validation set (n = 30) with soils from all sites. Second, to test the sensitivity of the model to pedoclimate, we built a calibration set with soil samples from three out of the four sites (n = 84). The multivariate regression model accurately predicted the proportion of centennially persistent SOC in the validation set composed of soils from all sites (R2 = 0.92, RMSEP = 0.07, n = 30). The uncertainty of the model predictions was quantified by a Monte Carlo approach that produced conservative 95 % prediction intervals across the validation set. The predictive performance of the model decreased when predicting the proportion of centennially persistent SOC in soils from one fully independent site with a different pedoclimate, yet the mean error of prediction only slightly increased (R2 = 0.53, RMSEP = 0.10, n = 34). This model based on Rock-Eval 6 thermal analysis can thus be used to predict the proportion of centennially persistent SOC with known uncertainty in new soil samples from different pedoclimates, at least for sites that have similar Rock-Eval 6 thermal characteristics to those included in the calibration set. Our study reinforces the evidence that there is a link between the thermal and biogeochemical stability of soil organic matter and demonstrates that Rock-Eval 6 thermal analysis can be used to quantify the size of the centennially persistent organic carbon pool in temperate soils.
- Article
(1601 KB) - Full-text XML
-
Supplement
(494 KB) - BibTeX
- EndNote


Soils exert a key regulation on atmospheric greenhouse gas concentrations on a decadal timescale through the net carbon source and sink status of their organic carbon reservoir (Amundson, 2001; Eglin et al., 2010). However, a portion of the soil organic carbon (SOC) reservoir may not contribute significantly to the net exchange of CO2 and CH4 between atmosphere and land during the next century because its residence time exceeds 100 years and its rate of carbon input is low (Trumbore, 1997; He et al., 2016). The size of the centennially persistent SOC pool is presumed to be large (i.e., between one- and two-thirds of total SOC) and dependent on geochemical parameters such as soil texture and mineralogy (Buyanovsky and Wagner, 1998a; Trumbore, 2009; Mills et al., 2014; Mathieu et al., 2015). However, the amount of centennially persistent organic carbon in soils is highly uncertain as it cannot be estimated accurately by current analytical methods (Post and Kwon, 2000; von Lützow et al., 2007; Bruun et al., 2008). Physicochemical procedures attempting to isolate SOC with a high residence time from bulk SOC have proven unsatisfactory because of indications that such fractions are a mixture of ancient and recent SOC (von Lützow et al., 2007; Trumbore, 2009; Lutfalla et al., 2014). Even the well-established radiocarbon (14C) analytical technique cannot precisely determine the size of the centennially persistent SOC pool (Schrumpf and Kaiser, 2015; Menichetti et al., 2016). The importance of better information on the size of the centennially persistent SOC pool has been emphasized recently (Soil Carbon Initiative, 2011; Bispo et al., 2017; Bailey et al., 2018; Harden et al., 2018), stressing the need for operational and standardized metrics or proxies to accurately quantify SOC persistent at the centennial timescale. The general lack of information on the size and turnover rate of measurable SOC pools hampers the initialization of SOC pools in dynamic models, questioning their predictions of the evolution of the global SOC reservoir (Falloon and Smith, 2000; Luo et al., 2014; Feng et al., 2016; He et al., 2016; Sanderman et al., 2016). Luo et al. (2016) and He et al. (2016) recently claimed that optimizing parameter estimations with global datasets on SOC pools and fluxes was the highest priority to reduce biases among Earth system models.
In the past decade, the thermal stability of organic carbon has been proposed as a good surrogate for its biogeochemical stability in litter and soils (e.g., Rovira et al., 2008; Plante et al., 2009; Gregorich et al., 2015). Several studies using thermal analysis techniques, such as thermogravimetry and differential scanning calorimetry with ramped combustion, have shown that the fast-cycling SOC pool determined as the amount CO2 respired in laboratory incubation experiments was thermally labile (Plante et al., 2011; Leifeld and von Lützow, 2014; Campo and Merino, 2016). Recently, studies using thermal analysis under an oxidative or inert (pyrolysis) reaction atmosphere coupled with evolved gas analysis have shown a high and positive correlation between the thermally stable SOC and persistent SOC determined using 14C measurements (Plante et al., 2013) and between thermally stable SOC and mineral-associated SOC isolated by a classical SOC physical fractionation scheme (Saenger et al., 2015). Using long-term bare fallow (LTBF) soils kept free of vegetation for several decades (i.e., with negligible carbon inputs), Barré et al. (2016) recently showed that persistent SOC was low in energy and thermally stable. While there appear to be strong qualitative links between the thermal and biogeochemical stability of SOC, there is to date no established quantitative link between the size of the persistent SOC pool and SOC thermal characteristics.
The objective of this work was to design a reliable, routine method based on a thermal analysis technique (Rock-Eval 6; RE6) to quantify centennially persistent SOC in a range of temperate soil types. First, we compiled a set of reference soil samples from four long-term agronomic experiments in northwestern Europe with long-term bare fallow treatments. The SOC concentration of LTBF treatments can be used to estimate the size of the persistent SOC pool of a particular site, as proposed by Rühlmann (1999) and Barré et al. (2010). Here, we refined estimates of the persistent SOC concentration previously published by Barré et al. (2010) for the four sites used in this study. We then used these values to estimate the proportion of centennially persistent SOC in 118 archived soil samples (time series) from LTBF and non-LTBF treatments of these four sites. The last step consisted of analyzing these reference samples using RE6 thermal analysis and building a multivariate regression model to relate RE6 information on SOC thermal stability and bulk chemistry to the estimated proportion of centennially persistent SOC. In this work, we aimed to deliver a model based on thermal analysis with reliable prediction intervals around the predicted values of the size of the centennially persistent SOC pool. We thus focused on the uncertainty in the estimated proportion of centennially persistent SOC and its propagation in the multivariate regression model.
2.1 Reference soil sample set with estimated size of the centennially persistent SOC pool
The reference soil sample set was built using samples from four long-term agronomic experimental sites in northwestern Europe (Versailles and Grignon in France, Rothamsted in the United Kingdom and Ultuna in Sweden; Supplement, Table S1). Each of the four sites includes an LTBF treatment, with bare fallow duration ranging from 48 years at Grignon to 79 years at Versailles. For all experimental sites, we also included non-LTBF treatments that have increased or maintained their total SOC concentrations over time or sustained smaller losses than the LTBF treatment. The selected non-LTBF treatments included manure amendments (Versailles), straw or composted straw amendments (Grignon), continuous grassland (Rothamsted) and continuous cropland (Ultuna). Soil samples from each site and treatment have been regularly collected and archived since the initiation of the experiments. A total of 118 topsoil samples (0–20 to 0–25 cm of depth; Table S1) were selected from the archives of LTBF and non-LTBF treatments to build the reference sample set. Samples were selected from two or three field replicate plots with a decadal frequency from the initiation of the experiments up to 2007 (Grignon), 2008 (Versailles, Rothamsted) or 2009 (Ultuna) to obtain a sample set with the widest possible range of proportions of centennially persistent SOC. The non-LTBF treatments and multiple sites also added to the diversity of land-use, climate and parent material. For each sample, total SOC concentration was measured by dry combustion with an elemental analyzer (SOCEA, g C kg−1 of soil) after the removal of soil carbonates when necessary according to NF ISO 10694 (1995).
Based on the decline in total SOC concentration over the duration of the LTBF treatment, Barré et al. (2010) estimated the concentration of centennially persistent SOC at each site using a Bayesian curve-fitting method applied to each LTBF field replicate plot. Here, we refined those site-specific estimates by (i) applying a similar Bayesian curve-fitting method to combined SOC concentration data from all LTBF field replicate plots of each site (four field replicate plots for Ultuna and Rothamsted, six field replicate plots for Versailles and Grignon) and (ii) using new SOC concentration data up to 2014 for Rothamsted and 2015 for Ultuna, increasing their LTBF duration to 55 years for Rothamsted and 59 years for Ultuna.
For each site, we assumed that the temporal evolution of LTBF SOC concentration, γ(t), followed an exponential decay function:
where γ(t) (unit = g C kg−1 of soil) is the LTBF SOC concentration at time t, t (unit = year) is the time under bare fallow, and a, b and c are fitting parameters. Parameter a (unit = g C kg−1 of soil) corresponds to the amplitude of the decay and b (unit = yr−1) is the characteristic decay rate. The parameter c (unit = g C kg−1 of soil) represents a theoretically inert portion of SOC. We considered this parameter as a site-specific metric of the centennially persistent SOC concentration. In our view, the centennially persistent SOC pool is not biogeochemically inert; it has a mean age and a mean residence time that are both assumed to be high (e.g., centuries) though not precisely defined in this study. As a result, its decline is minimal at the timescale of this study and we thus considered the centennially persistent SOC concentration at each experimental site to be constant. We used a Bayesian inference method to compute site-specific estimates of centennially persistent SOC concentration and associated uncertainties (detailed in the Sect. 2.3.1).
The proportion of centennially persistent SOC (CPSOC) in each soil sample was then calculated as the ratio of the site-specific CPSOC concentration to the total SOC concentration of the sample:
where the unit of CPSOC concentration [site] and SOC concentration [sample] is g C kg−1 of soil. The CPSOC proportions of five samples that were slightly above 1 were set to 1. In these calculations, we assumed that at each site, the concentration of CPSOC was the same in the LTBF and non-LTBF treatments and was constant with time. The details related to the estimation of the uncertainty in the CPSOC proportion of each sample are reported in Sect. 2.3.2.
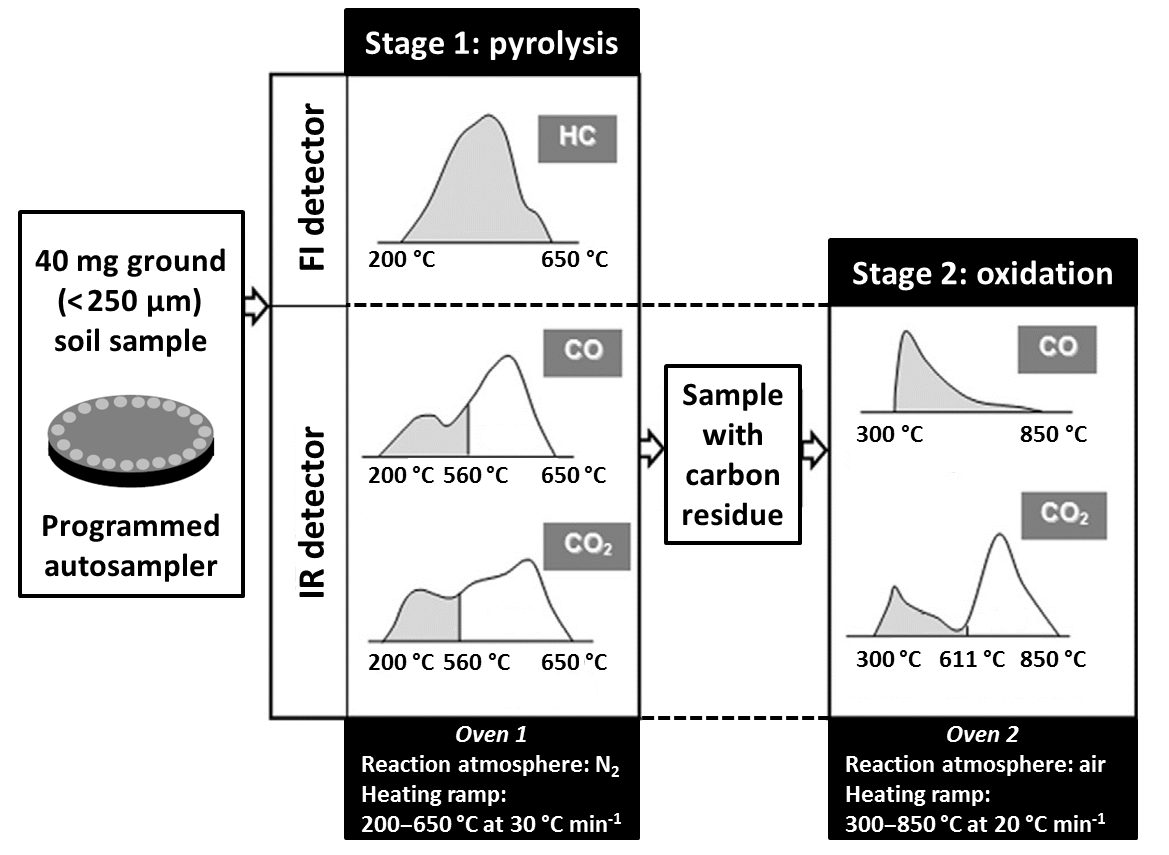
Figure 1Detail of the sequential pyrolysis and oxidation stages of Rock-Eval 6 (RE6) thermal analysis and of the five thermograms used to derive the 30 RE6 parameters reflecting SOC thermal stability and bulk chemistry. The grey area under each RE6 thermogram represents the portion of the signal unaffected by soil carbonates that was used to calculate RE6 temperature parameters (modified after Behar et al., 2001; Saenger et al., 2013).
2.2 Thermal analysis of soil samples by Rock-Eval 6
The 118 soil samples from the reference set were analyzed with an RE6 Turbo device (Vinci Technologies) using the basic setup for the analysis of soil organic matter (Behar et al., 2001; Disnar et al., 2003). The RE6 technique provided measurements from the sequential pyrolysis and oxidation of ca. 40 mg of finely ground (< 250 µm) soil per sample (Fig. 1). Volatile hydrocarbon effluents from pyrolysis were detected and quantified with flame ionization detection (FID), while the evolution of CO and CO2 gases was quantified by infrared detection during both the pyrolysis and oxidation stages. Pyrolysis was carried out from 200 to 650 ∘C in an N2 atmosphere with a heating rate of 30 ∘C min−1, while the oxidation was carried out from 300 to 850 ∘C in a laboratory air atmosphere (with O2) with a heating rate of 20 ∘C min−1. The RE6 technique generated five thermograms per sample (Fig. 1, i.e., volatile hydrocarbon (HC) effluents during pyrolysis, CO2 during pyrolysis, CO2 during oxidation, CO during pyrolysis and CO during oxidation). On average, the organic carbon yield of the RE6 analysis was greater than 96.5 % of SOCEA for the soils of the reference sample set (SOCRE6 = 0.966 × SOCEA + 0.403, R2 = 0.97, n = 118).
For each RE6 thermogram, we determined the temperatures corresponding to each incremental proportion of the amount of gases evolved during the pyrolysis and oxidation stages. Upper temperatures of 850 ∘C (CO oxidation thermogram), 650 ∘C (HC pyrolysis thermogram), 611 ∘C (CO2 oxidation thermogram) and 560 ∘C (CO and CO2 pyrolysis thermograms) were chosen for signal integration (Fig. 1), thereby excluding any interference of soil carbonates (Behar et al., 2001). The thermal decomposition of carbonates was indeed observed beyond 560 ∘C (CO and CO2 pyrolysis thermograms) and 611 ∘C (CO2 oxidation thermogram) for the site of Grignon (data not shown). For each RE6 thermogram, signal integration was performed on the offset-corrected thermogram using sample-specific offset values estimated by the RE6 Turbo device. For the three pyrolysis thermograms, signal integration started after an isotherm step of 200 s at 200 ∘C. Finally, we retained five of these temperature parameters per thermogram: T10, T30, T50, T70 and T90, which respectively represent the temperatures corresponding to the evolution of 10, 30, 50, 70 and 90 % of the amount of evolved gases for each sample and for each of the five different thermograms (HC, CO2 pyrolysis, CO2 oxidation, CO pyrolysis, CO oxidation).
For the HC pyrolysis thermogram we also determined three parameters reflecting a proportion of thermally resistant or labile hydrocarbons: a parameter representing the proportion of hydrocarbons evolved between 200 and 450 ∘C (thermo-labile hydrocarbons, TLHC index; modified from Saenger et al., 2015), with the I index representing the preservation of thermally labile immature hydrocarbons (after Sebag et al., 2016) and the R index representing the proportion of hydrocarbons thermally stable at 400 ∘C (after Sebag et al., 2016). Those three RE6 parameters were calculated as follows:
Using the HC pyrolysis thermogram, we determined a parameter reflecting SOC bulk chemistry, the hydrogen index (HI, mg HC g−1C) that corresponds to the quantity of pyrolyzed hydrocarbons relative to SOCRE6. Using the CO and CO2 pyrolysis thermograms, we determined another parameter reflecting SOC bulk chemistry, the oxygen index (OIRE6, mgO2 g−1C) corresponding to the oxygen yield as CO and CO2 during the thermal pyrolysis of soil organic matter divided by the total SOC (SOCRE6) of the sample. The HI correlates with the elemental H : C atomic ratio of SOC and the OIRE6 correlates with the elemental O : C atomic ratio of SOC (Espitalié et al., 1977).
Overall, we thus calculated for each soil sample a series of 30 RE6 parameters reflecting SOC thermal stability and bulk chemistry to be used in subsequent statistical and modeling analyses.
The signal integration of the RE6 thermograms and the calculation of the RE6 temperature parameters were performed with R v.3.4.3 (R Core Team, 2017) and the hyperSpec (Beleites and Sergo, 2014), pracma (Borchers, 2015) and stringr (Wickham, 2015) packages.
2.3 Statistical analysis
2.3.1 Bayesian inference of site-specific CPSOC concentrations and uncertainties
At each site, the CPSOC concentration was estimated as the model parameter c of the exponential decay function described in Eq. (1). To estimate the value of this parameter and assess its uncertainty, we sampled the posterior probability density function (PDF) of the model parameters in Eq. (1), which is given by Bayes' theorem as a function of the prior PDF (i.e., what we know before collecting data) and the likelihood (i.e., how likely is it to predict the data given a set of parameters). The posterior PDF is the combination of our prior knowledge and the information carried by the data, including measurement uncertainties. For a model vector m (containing the parameters a, b and c) and a data vector d of all the measurements of SOC concentrations, the posterior PDF, P(d|m), is , with P(m) the prior PDF on the model parameters and P(m|d) the likelihood.
We chose uniform PDFs for the model parameters a, b and c to be as uninformative as possible. We use the Gaussian form of the likelihood function, such as , where t is the vector of all observation times and Cd is the data covariance matrix describing the uncertainties in the SOC measurements. We consider a conservative standard deviation for SOC concentration data (0.75 g C kg−1 of soil) estimated by Barré et al. (2010) for the same soils. We use a Metropolis algorithm to draw 3 × 10⁴ samples from the posterior PDF with a burning phase of 3.7 × 10⁵ steps. We can then derive the mean and standard deviation for the parameter c from the posterior PDF.
2.3.2 Estimating the uncertainty of CPSOC proportion in each sample
Based on our assessment of the uncertainties in SOC concentration data and site-specific CPSOC concentrations (see above), we propagated these errors to estimate the uncertainty in the CPSOC proportion in each soil sample. This was estimated by calculating the standard deviation (SD) of the CPSOC proportion for each sample as follows:
2.3.3 Statistical relationships between RE6 parameters and CPSOC proportion
The reference sample set was randomly split into a calibration set (n = 88 samples) and a validation set (n = 30 samples), each one containing soils from all sites. The correlations between the 30 RE6 parameters and the CPSOC proportion were assessed with a nonparametric Spearman's rank correlation test on the calibration set (n = 88). A principal component analysis (PCA) of the 30 centered and scaled RE6 parameters was performed for the calibration set to (i) summarize the variance of SOC thermal stability and bulk chemistry on a single factorial map and (ii) illustrate the correlations among RE6 parameters. Correlations between the CPSOC proportion in calibration soils and their principal component scores were determined using Spearman's rank correlation tests, and its relationships with the 30 RE6 parameters were further illustrated by projecting the CPSOC proportion variable in the PCA correlation plot. The RE6 data of the soils from the validation set were projected on the same PCA factorial map to check that the validation set was representative of the calibration set.
2.3.4 Random forests regression model to predict CPSOC proportion from RE6 parameters
A multivariate regression model was built to relate the CPSOC proportion in the reference samples from the calibration set with soils from all sites (response vector or dependent variable y, n = 88) to their SOC thermal stability and bulk chemistry, summarized by a matrix of predictor variables (X) made up of the 30 centered and scaled RE6 parameters. The nonparametric and nonlinear machine-learning technique of random forests (RF, Breiman, 2001; Strobl et al., 2009) was used to build this model. The random forests regression model was based on a forest of 1000 diverse regression trees made of splits and nodes. A random forests learning algorithm combines bootstrap resampling and random variable selection. Each of the 1000 regression trees was thus grown on a bootstrapped subset of the calibration set (i.e., containing about two-thirds of “in-bag” calibration samples) by randomly sampling 10 out of the 30 RE6 parameters as candidates at each split of the tree and using a minimum size of terminal tree nodes of five soil samples. The random forests regression model was then used to predict the proportion of CPSOC in the validation set (n = 30), a prediction corresponding to the mean of the predicted values across the 1000 regression trees.
The performance of the random forests regression model for predicting CPSOC proportion was assessed by statistics comparing the RF-predicted vs. reference (estimated) values of the sample set. The performance statistics were calculated on (i) the “out-of-bag” soil samples of the calibration set and (ii) the soil samples of the validation set. Out-of-bag samples are observations from the calibration set not included in the learning sample set for a specific tree that can be used as a “built-in” test set for calculating its prediction accuracy (Strobl et al., 2009). The performance statistics included the coefficient of determination (pseudo-R2 for the calibration set or R2 for the validation set) and the root mean square error of calibration or prediction (RMSEC for the calibration set or RMSEP for the validation set). The ratio of performance to deviation (RPD) and the bias of the random forests regression model were additionally calculated for the validation set. The relative importance (i.e., ranking) of each of the 30 RE6 parameters for the prediction of the proportion of CPSOC in the RF regression model was computed as the unscaled permutation accuracy (Strobl et al., 2009).
Additionally, the sensitivity of the RF regression model to pedoclimate was assessed by examining its predictive performance for a calibration set based on soils from three sites (Versailles, Grignon, Rothamsted, n = 84) and a fully independent validation set based on soils from a different pedoclimate (Ultuna, n = 34) but with similar RE6 thermal characteristics to those of the calibration set (see Sect. 3.2). Soils from Ultuna indeed have a higher clay content (from 11 to 20 % more clays) and experience a lower mean annual temperature (from 4 to 5.2 ∘C lower temperature) and a lower mean annual precipitation (from 116 to 179 mm lower precipitation) than the soils of the three other sites (Table S1).
2.3.5 Error propagation in the random forests regression model
Since our objective was to deliver a model based on thermal analysis with reliable prediction intervals around the predicted values of the CPSOC proportion, we estimated the prediction uncertainty of the random forests model for new soil samples. We used a methodology recently published by Coulston et al. (2016) to approximate prediction uncertainty for random forests regression models and adapted it to explicitly take into account the uncertainty in the reference values of the CPSOC proportion (Eq. 6) that were used to build the model (Supplement, Fig. S1).
Briefly, we sampled with replacement (i.e., bootstrapped) the calibration set (y,X) 2000 times to obtain 2000 bootstrap samples (y∗b, X∗b) that were used to parameterize 2000 random forest models (RF∗b). To incorporate the uncertainty in the reference values of the CPSOC proportion, each of the 2000 bootstrapped vectors (y∗b) contained values of CPSOC proportion that were randomly sampled from normal distributions with means and standard deviations of the CPSOC proportion of the corresponding soil samples from the calibration set (Eq. 6). For each bootstrap sample of the calibration set, resampling discarded approximatively 37 % of the data (, ) that were used for prediction. We obtained an error assessment dataset made up of 2000 vectors of observed (reference) values , predicted values (mean of the predictions across 1000 regression trees for each observation) and (variance of the predictions across 1000 regression trees for each observation). For each observation of the 2000 bootstrap samples, we calculated a metric τ allowing us to scale between , which can be calculated for any soil sample by the random forests regression model, and the squared prediction error (, which is only available for the reference sample set. The metric τ was calculated as follows (Coulston et al., 2016):
A Monte Carlo approach was used to estimate , the 95th percentile of all calculated τ values for all out-of-bag observations of the 2000 bootstraps (Fig. S1). This value was such that 95 % of the predictions of the CPSOC proportion lie within × of the true value of the CPSOC proportion (i.e., 95 % prediction intervals). As , the standard deviation of the predictions of the CPSOC proportion across 1000 regression trees can be calculated by the random forests regression model for any soil sample; this approach allows for the calculation of 95 % prediction intervals on new soil samples for which only X data (30 RE6 parameters) are available. We calculated the 95 % prediction intervals ( ± × ) for the validation set (n = 30) to examine whether those intervals included the true (estimated) values of the CPSOC proportion. More details on the procedure to approximate prediction uncertainty for random forests regression models are provided in Coulston et al. (2016). We finally checked how the error in the CPSOC proportion propagated into the random forests regression model by (i) comparing the value of with or without incorporating the uncertainty in the reference values of the CPSOC proportion in the algorithm and (ii) by comparing the sizes of the 95 % prediction intervals calculated for the validation soil samples with their respective 95 % confidence intervals (determined by multiplying their standard deviation calculated in Eq. 6 by 1.96).
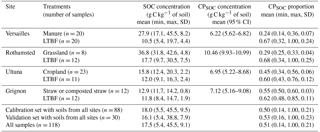
Table 1Measured total SOC concentrations, estimated site-specific CPSOC concentrations and resulting CPSOC proportions in four long-term agronomic experimental sites used to generate calibration and validation soil sample sets. Abbreviations: LTBF, long-term bare fallow; min, minimum; max, maximum; SD, standard deviation; CI, confidence interval.
The Bayesian inference method was performed with Python 2.7 and the PyMC library (Patil et al., 2010). All other statistical analyses were performed with R v.3.4.3 (R Core Team, 2017) and the factoextra package for running PCA (Kassambara, 2015), the randomForest package for running the random forests regression models (Liaw and Wiener, 2002) and the boot package for bootstrapping (Davison and Hinkley, 1997; Canty and Ripley, 2015).
3.1 CPSOC concentration at each site and CPSOC proportion in reference soil samples
The Bayesian inference of the parameter c of the exponential decay function (Eq. 1) yielded site-specific estimates of the CPSOC concentration with 95 % confidence intervals (Eq. 1, Table 1, Fig. 2). Estimated CPSOC concentrations ranged from 6.22 g C kg−1 of soil at Versailles to 10.46 g C kg−1 of soil at Rothamsted. The uncertainty in CPSOC concentration was lower at Rothamsted (standard deviation of 0.27 g C kg−1 of soil) and Versailles (standard deviation of 0.31 g C kg−1 of soil) than at Ultuna (standard deviation of 0.88 g C kg−1 of soil) and Grignon (standard deviation of 1.00 g C kg−1 of soil).
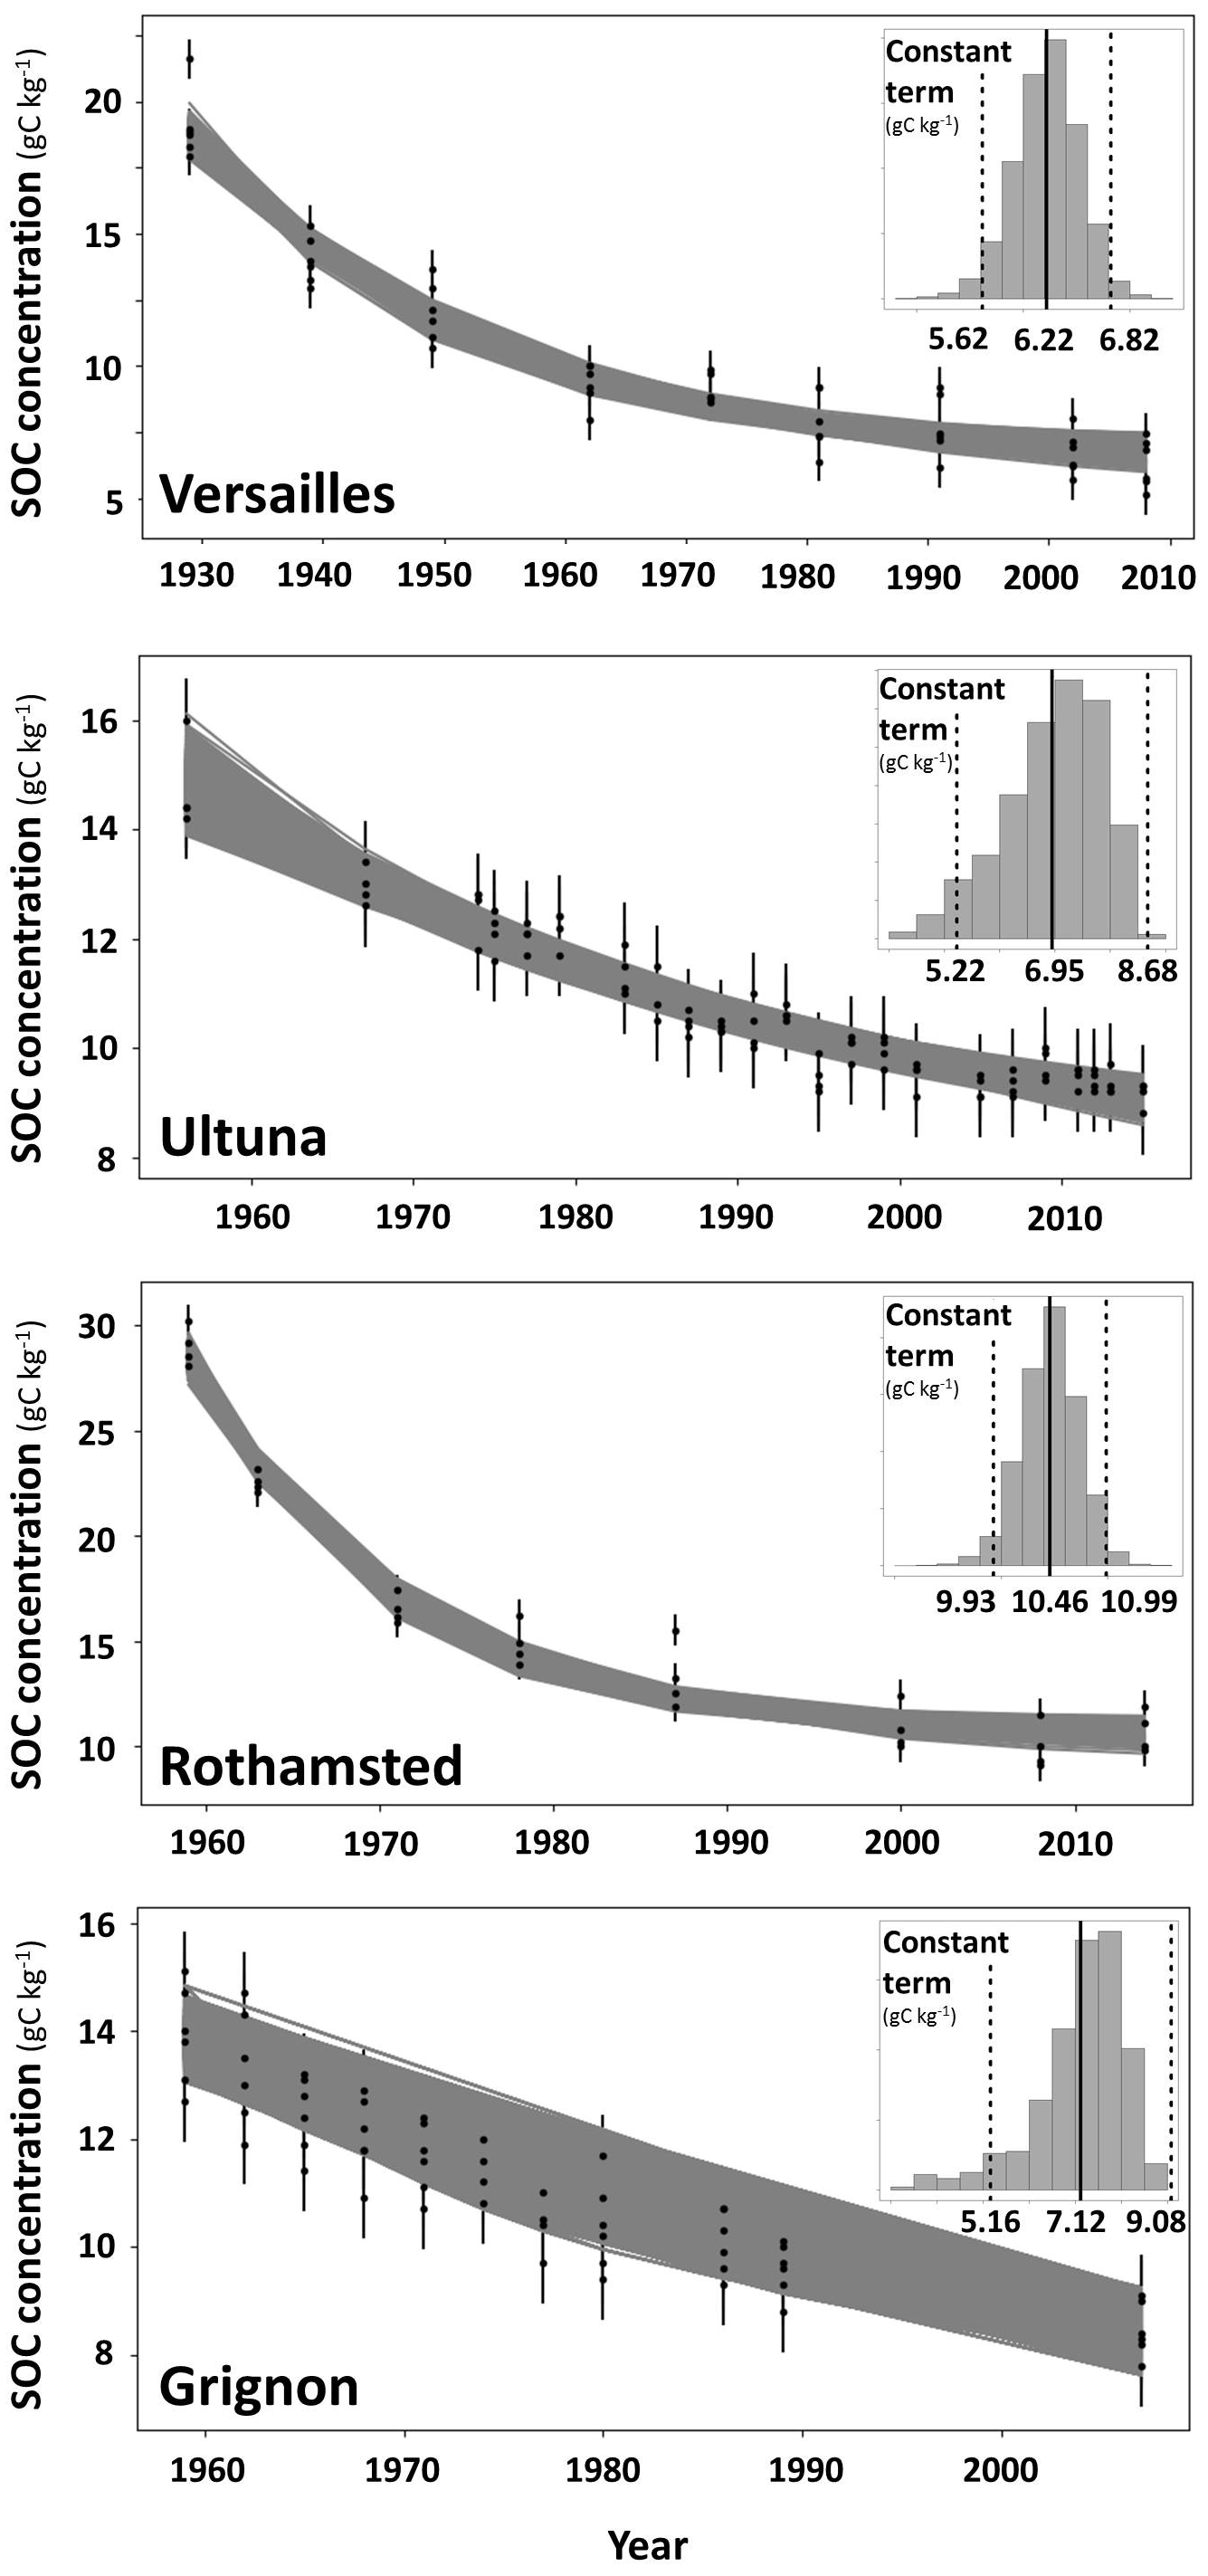
Figure 2Evolution of SOC concentration (g C kg−1 of soil) with time for the bare fallow plots of each experimental site and representation of the 3 × 10⁴ fitted exponential decay functions (Bayesian curve-fitting method) from which a site-specific CPSOC concentration (model parameter c) and its 95 % confidence interval were determined (histogram in the upper right corner of each scatter plot). At each site, the 95 % confidence interval around the CPSOC concentration was determined as c ± 1.96 SD(c), where c is the model parameter c in Eq. (1) and SD(c) is its standard deviation.
Overall, the wide range in total SOC concentrations within and across sites (from 5 to 46 g C kg−1 of soil; Table 1), combined with an assumed constant CPSOC concentration within each site, resulted in a reference sample set with a wide spectrum of CPSOC proportions ranging from 0.14 to 1 (Eq. 2, Table 1). The uncertainty (standard deviation) in the values of CPSOC proportion ranged from 0.01 to 0.15 for the reference sample set (Eq. 6, Fig. S2). High uncertainties were found for high values of CPSOC proportion (i.e., samples with longer time periods under bare fallow treatment), with a modulation by the site-specific CPSOC concentration uncertainty (Grignon > Ultuna > Versailles > Rothamsted; Table 1), as expected from Eq. (6) (Fig. S2).
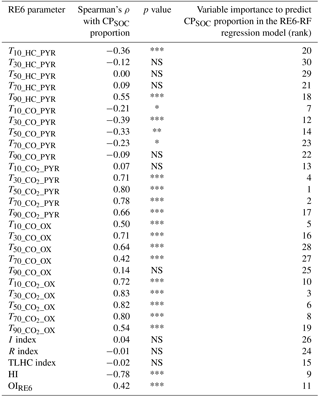
Table 2Spearman's rank correlation coefficient test between the 30 RE6 parameters and the CPSOC proportion and variable importance (ranking) of the 30 RE6 parameters to predict CPSOC proportion in the random forests model based on Rock-Eval 6 thermal analysis (RE6-RF, calibration sample set with soils from all sites, n = 88). Symbols for p values: p < 0.001; p < 0.01; * p < 0.05; NS p > 0.05 = not significant.
The random splitting of the reference sample set generated calibration and validation sample sets with similar mean values, range of values and standard deviations for both total SOC concentration and CPSOC proportion (Table 1).
3.2 Relationships between RE6 parameters and CPSOC proportion
The 30 RE6 parameters showed very different and even contrasting correlations with the CPSOC proportion in the calibration set with soils from all sites (Table 2). Most RE6 temperature parameters showed positive correlations with the CPSOC proportion, with Spearman's ρ above 0.8 for four of them (the RE6 temperature parameter corresponding to 50 % of CO2 gas evolution during the pyrolysis stage, , and the RE6 temperature parameters corresponding to 30, 50 and 70 % of CO2 gas evolution during the oxidation stages , , ; Table 2).
Conversely, five RE6 temperature parameters showed significant negative correlations with the CPSOC proportion (T10_HC_PYR, T10_CO_PYR, T30_CO_PYR, T50_CO_PYR, T70_CO_PYR; Table 2). The three RE6 parameters reflecting a proportion of thermally resistant or labile hydrocarbons (TLHC index, I index and the R index) showed no correlations with the CPSOC proportion (Table 2). The two RE6 parameters reflecting SOC bulk chemistry showed highly significant correlations with the CPSOC proportion (Table 2), the HI being negatively correlated and the OIRE6 being positively correlated.

Figure 3Principal component analysis (PCA) of the 30 RE6 parameters of the calibration sample set with soils from all sites (n = 88). (a) The scores of the calibration samples on the first two principal components are represented in the factorial map, as are the projected principal component scores of the validation samples (n = 30; with soils from all sites). A color scale is used to represent the CPSOC proportion (determined using Eq. 2) in all samples. (b) PCA loadings of the 30 RE6 parameters and projection of the CPSOC proportion variable in the PCA correlation circle. Note that despite some of the 30 RE6 parameters being significantly correlated, all parameters are included in the analysis.
The PCA of the centered and scaled RE6 parameters illustrates the correlations among those 30 variables in the calibration set with soils from all sites (Fig. 3). A continuum of CPSOC proportion values was observed in the reference samples along the first two principal components (Fig. 3a), and projecting the CPSOC proportion in the PCA correlation circle further highlighted the relationships between this variable and the 30 RE6 parameters (Fig. 3b). The CPSOC proportion variable had a strongly negative projected loading score on PC1 (Fig. 3b), as well as negative projected loadings on PC2 (Fig. 3b) and PC3 (data not shown). The scores of the calibration soils on the first three principal components were indeed significantly and negatively correlated with the CPSOC proportion (ρ = −0.61, p value < 0.001 for PC1, ρ = −0.49, p value < 0.001 for PC2, ρ = −0.25, p value < 0.05 for PC3) such that a large part (82 %) of the variance in the 30 RE6 parameters was linked to the CPSOC proportion in the calibration set.
The random splitting of the reference sample set generated calibration and validation sample sets with similar RE6 thermal characteristics as illustrated by their similar distribution on the factorial map of the first two principal components of the PCA (Fig. 3a). Soils from the site of Grignon (with carbonates) showed RE6 thermal characteristics different from the other sites (Fig. 3a). Some soils from the sites of Rothamsted and Versailles with high CPSOC proportions also showed specific RE6 thermal signatures (Fig. 3a). Conversely, all soils from the site of Ultuna showed similarities regarding their RE6 thermal characteristics with certain soil samples from other sites (Versailles and Rothamsted; Fig. 3a).
3.3 Performance of the regression model using RE6 parameters to predict CPSOC proportion
The random forests regression model performed very well in predicting the CPSOC proportion in the reference sample set using the 30 RE6 parameters as predictors (Fig. 4). Both performance statistics on the calibration set with soils from all sites (pseudo-R2 = 0.89, RMSEC = 0.07, n = 88) and on the validation set with soils from all sites (R2 = 0.92, RMSEP = 0.07, n = 30) demonstrated the good predictive power of the regression model based on RE6 thermal analysis. The predictive performance of the random forests model based on RE6 thermal analysis (RE6-RF) was altered when soil samples from a pedoclimate different (site of Ultuna, n = 34) from the calibration set (Versailles, Rothamsted, Grignon), but with similar RE6 thermal characteristics (see Sect. 3.2), were used for validation (Fig. 5). The coefficient of determination of the model decreased (R2 = 0.53), yet its mean error of prediction did not increase strongly (RMSEP = 0.10; Fig. 5).
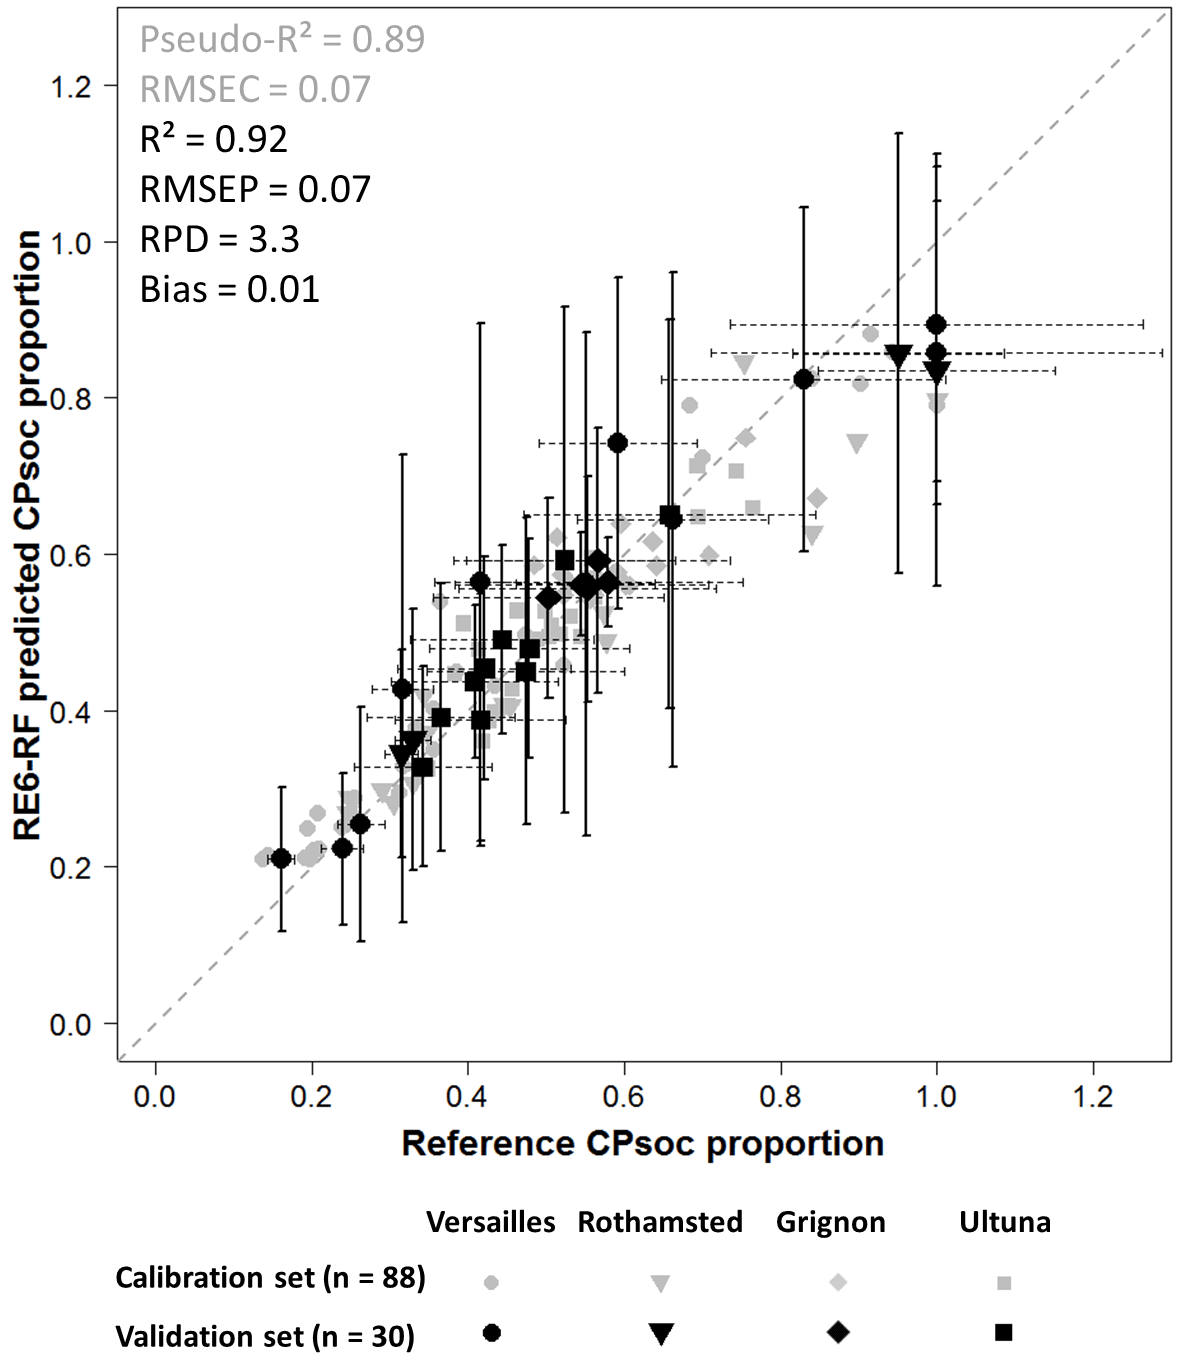
Figure 4Performance of the random forests regression model based on Rock-Eval 6 thermal analysis (RE6-RF) for predicting the CPSOC proportion. The performance statistics on the calibration set with soils from all sites (n = 88) and on the validation set with soils from all sites (n = 30) of the RE6-RF multivariate regression model are shown. Horizontal bars represent the estimated uncertainty (95 % confidence intervals) in the reference CPSOC proportion values of the validation set calculated as CPSOC proportion [sample] ± 1.96 × SD(CPSOC proportion [sample]). Vertical bars represent the propagated errors (95 % prediction intervals) in the RE6-RF-predicted CPSOC proportion values of the validation sample set calculated as ± × SD() (see Sect. 2.3.5), with a value of 2.12 (Fig. S1). Abbreviations: RMSEC, root mean square error of calibration; RMSEP, root mean square error of prediction; RPD, ratio of performance to deviation; SD, standard deviation.
Propagating the estimated uncertainties in the values of CPSOC proportion increased the size of the prediction intervals of the RE6-RF regression model. Indeed, the value of increased from 1.83 to 2.12 when the uncertainty in CPSOC proportion was integrated into the algorithm described in Sect. 2.3.5. The horizontal and vertical error bars in Fig. 4 illustrate the global error propagation of the CPSOC proportion estimates in the RE6-RF regression model for the validation soil sample set. The values of the total width of the 95 % confidence interval (reference estimations of CPSOC proportion; horizontal error bars in Fig. 4) were 0.03 (minimum total width), 0.58 (maximum total width) and 0.24 (mean total width) for the soil samples of the validation set (n = 30). For the 95 % prediction intervals (RE6-RF predictions of CPSOC proportion; vertical error bars in Fig. 4), the uncertainties increased to 0.11 (minimum total width), 0.66 (maximum total width) and 0.37 (mean total width). The 30 total 95 % prediction intervals for RE6-RF predictions of the CPSOC proportion in the validation set all included their respective reference estimation of the CPSOC proportion (Fig. 4).
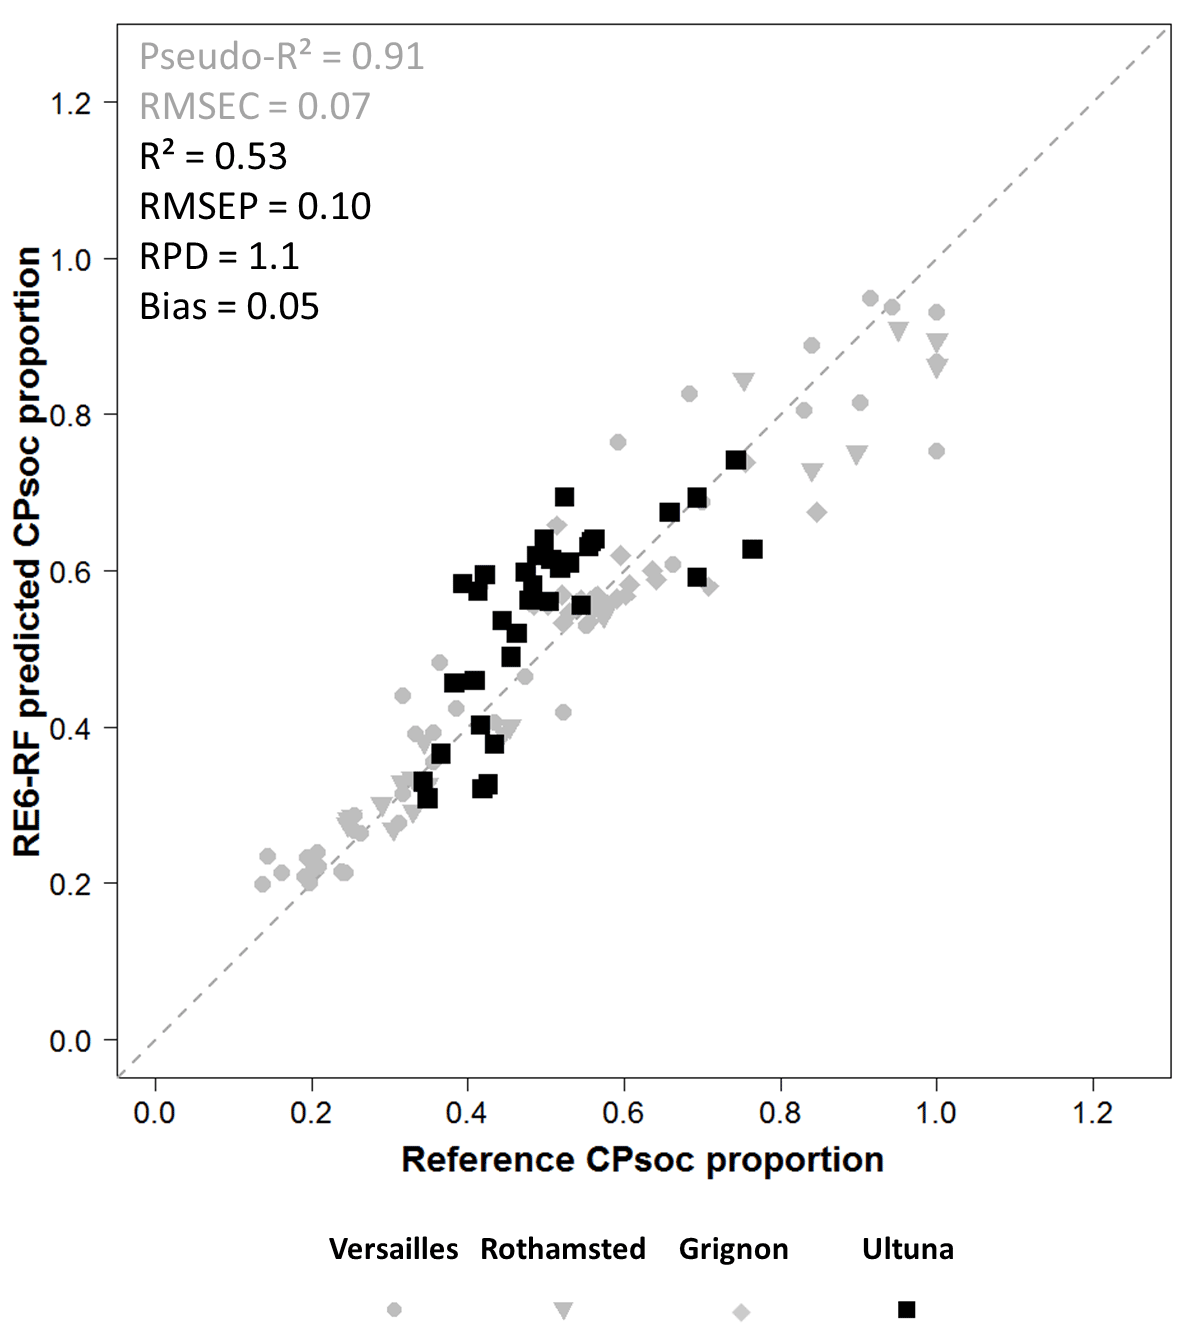
Figure 5Performance of the random forests regression model based on Rock-Eval 6 thermal analysis (RE6-RF) for predicting the CPSOC proportion for a calibration set based on soils from three sites (Versailles, Rothamsted, Grignon; n = 84) and a validation set based on soils from a different pedoclimate but with similar RE6 thermal characteristics than those of the calibration set (Ultuna; n = 34).
Out of the 30 RE6 parameters tested by the random forests model as possible predictor variables of the CPSOC proportion in the calibration set with soils from all sites, the RE6 temperature parameters corresponding to 50 and 70 % of CO2 gas evolution during the pyrolysis stage (, ) and to 30 % of CO2 gas evolution during the oxidation stage () showed the highest importance scores (based on permutation accuracy importance calculations; Table 2). The eight most important RE6 parameters for predicting the CPSOC proportion were temperature parameters calculated on the five different RE6 thermograms (Table 2). The two RE6 parameters reflecting SOC bulk chemistry (OIRE6 and HI) were of medium importance to predict the CPSOC proportion, while the RE6 parameters reflecting a proportion of thermally resistant or labile hydrocarbons (I index, R index and TLHC index) were of weak importance (Table 2).
4.1 A unique soil sample set with accurate and contrasting values of CPSOC
Adding new SOC concentration data for Rothamsted (up to 2014) and Ultuna (up to 2015) and combining SOC concentration data from all LTBF field replicate plots of each site decreased the uncertainty in the site-specific estimates of the CPSOC concentration (Fig. 2) compared with the previous estimations published by Barré et al. (2010). Indeed, the total width of the 95 % confidence interval around the estimation of the site-specific CPSOC concentration slightly decreased from 1.4 to 1.2 g C kg−1 of soil at Versailles and from 4.96 to 3.92 g C kg−1 of soil at Grignon; it also strongly decreased from 7.24 to 3.46 g C kg−1 of soil at Ultuna and from 5.98 to 1.06 g C kg−1 of soil at Rothamsted (Table 1, Fig. 2; Barré et al., 2010). The mean estimated values of the CPSOC concentration were marginally changed at Versailles (6.22 vs. 6.12 g C kg−1 of soil in Barré et al., 2010) and Grignon (7.12 vs. 6.80 g C kg−1 of soil in Barré et al., 2010), but strongly modified (increased) at Ultuna (6.95 vs. 3.90 g C kg−1 of soil in Barré et al., 2010) and Rothamsted (10.46 vs. 2.72 g C kg−1 of soil in Barré et al., 2010; Table 1).
Our results obtained under four contrasting pedoclimates of northwestern Europe indicate a minimum value of 5 g C kg−1 of soil (the lowest boundary of the four 95 % confidence intervals; Table 1) and a maximum value of 11 g C kg−1 of soil (the highest boundary of the four 95 % confidence intervals; Table 1) for CPSOC concentration in topsoils (0–20 to 0–25 cm of depth). These estimates are close, yet below the CPSOC concentration value of 12 g C kg−1 of soil estimated by Buyanovsky and Wagner (1998b) for the topsoil (0–20 cm of depth) of the Sanborn long-term (100 years) agronomic experiment (Columbia, Missouri, USA). Our estimates of topsoil CPSOC concentration are also well below the value of 16 g C kg−1 of soil estimated by Franko and Merbach (2017) in the topsoil (0–30 cm of depth) of the long-term (28 years) bare fallow experiment of Bad Lauchstädt (central Germany). The soil type in Bad Lauchstädt (Haplic Chernozem) and its high concentration of slow-cycling black carbon (estimated at 2.5 g C kg−1 of soil; Brodowski et al., 2007) may explain this difference, as well as the relatively short time period under bare fallow (higher uncertainty in the inferred CPSOC concentration).
Among the wide range of CPSOC proportions (0.14 to 1) of our reference sample set, high values of CPSOC proportions (> 0.6) were obtained only for soils that had been under bare fallow for a long period of time: after several years or decades with negligible C inputs and sustained SOC decomposition (Table 1). Similarly, the low values of CPSOC proportions (< 0.25) of our reference sample set were obtained for soils without vegetation but receiving high amounts of manure amendments at Versailles (Table 1). It could be argued that the CPSOC proportion values obtained for bare soils with or without organic matter amendments may not be representative of the CPSOC proportions of soils under conventional management practices. However, it is interesting to note that the soils of the reference sample set with vegetation and experiencing classical management practices (grassland at Rothamsted, cropland at Ultuna) also showed a wide range of CPSOC proportions, from 0.25 to 0.56 (Table 1). Moreover, other studies have shown the high variability of CPSOC proportions in soils. For instance, Falloon et al. (1998) listed a series of published values of CPSOC proportions ranging from 0.13 to 0.59. More recently, Mills et al. (2014) published a large dataset of CPSOC proportions in uncultivated topsoils (ca. 15 cm of depth). They estimated CPSOC proportions using a global dataset of topsoil radiocarbon (14C) data and a steady-state SOC turnover model with a fixed mean residence time of 1000 years for persistent SOC. Their estimates of CPSOC proportions varied greatly from 0.03 to 0.98 (mean = 0.48, standard deviation = 0.22, n = 232; soils with inconsistent negative modeled SOC pools values were removed), with significantly higher CPSOC proportions in non-forest than in forest uncultivated ecosystems (Mills et al., 2014).
Overall, those combined results illustrate the wide range of CPSOC concentrations and proportions in topsoils that may depend upon pedoclimate, land-use and management practices.
4.2 A quantitative link between the long-term biogeochemical stability of SOC and its thermal stability and bulk chemistry
This work reinforces the evidence that there is a link between SOC persistence in ecosystems and its thermal stability, providing evidence of the first quantitative link between thermal and in situ long-term (> 100 years) biogeochemical SOC stability (Fig. 4). The regression model yields accurate RE6-RF predictions of CPSOC proportions with 95 % prediction intervals that fully propagate the uncertainties originating from the calibration set that was used to build the model. Predictions on the validation set illustrate that the error propagation scheme provides highly conservative 95 % prediction intervals of the CPSOC proportion in new samples at all intervals including their respective reference estimate of CPSOC proportion (Fig. 4). Despite rather large prediction intervals, the RE6-RF regression model clearly discriminates soils with small CPSOC proportions from samples with large CPSOC proportions (Fig. 4). This model based on RE6 thermal analysis can thus be used to predict the size of the CPSOC pool with known uncertainty in new soil samples from similar pedoclimates and with thermal characteristics (i.e., RE6 predictor variables) similar to those of the reference sample set.
Our results also highlight the sensitivity of the RE6-RF regression model to pedoclimate. Decreased predictive performance of the model (as assessed by the coefficient of determination) was indeed observed when predicting the CPSOC proportion in new soils with similar RE6 thermal characteristics but from a different pedoclimate (Fig. 5). However, the mean error of prediction of the model only slightly increased when predicting the CPSOC proportion in soils from the fully independent site of Ultuna (Fig. 5). Overall, those results illustrate the potential of the model based on RE6 thermal analysis to predict the proportion of CPSOC in new soil samples from different pedoclimates, at least for sites that have similar RE6 thermal characteristics to those of the calibration set.
Our results also illustrate the complex relationships between thermal-analysis-based parameters of SOC stability and the CPSOC proportion. The hypothesis behind the use of SOC thermal stability as a proxy for its biogeochemical stability implies positive correlations between the size of the CPSOC pool and temperature parameters derived from thermal analysis such as the 25 RE6 temperature parameters calculated in this study. Significant positive correlations with the CPSOC proportions were indeed found for the majority (14 out of 25) of RE6 temperature parameters, with very high and positive Spearman's ρ values for some of them (Table 2). This was notably the case of the RE6 temperature parameter corresponding to 50 % of CO2 gas evolution during the oxidation stage, , which had been previously shown to systematically increase with bare fallow duration in the same soils by Barré et al. (2016). This study extends the results of Barré et al. (2016) towards a quantitative link between RE6 temperature parameters and SOC persistence (direct correlations and predictions of the size of the CPSOC pool rather than time under bare fallow treatment). It also extends those results to non-bare fallow soils: bare soils receiving organic amendments (at Grignon and Versailles), cropland soils (Ultuna) and grassland soils (Rothamsted). Conversely, 11 RE6 temperature parameters showed no significant correlation or significant negative correlations with the CPSOC proportion. Weak or negative correlations occurred principally for temperature parameters calculated on thermograms of the pyrolysis stage of the RE6 analysis: for parameters of the HC and CO thermograms (except T90_HC_PYR) and the lowest temperature parameter of the CO2 thermogram (Table 2). Negative correlations contradict the abovementioned hypothesis, with the evolution of a similar proportion of the total amount of gases (HC pyrolysis effluents or CO) occurring at lower temperatures for samples with high CPSOC proportions than for soils with low CPSOC proportions. A possible explanation for this unexpected observation could be that the pyrolysis of SOC in samples with a high proportion of CPSOC may undergo an enhanced pyrolysis catalyst effect by soil minerals (Auber, 2009), which are relatively more abundant in those samples generally characterized by low total SOC concentrations.
Despite the fact that the TLHC index, the I index and the R index had originally been proposed as useful qualitative metrics of soil carbon dynamics, reflecting a proportion of thermally resistant or labile hydrocarbons (Disnar et al., 2003; Sebag et al., 2006, 2016; Saenger et al., 2013, 2015), those parameters were not correlated with the CPSOC proportion. Furthermore, they also had a weak importance in the random forests model predictions of the CPSOC proportion (Table 2). The poor link between those three RE6 parameters and the CPSOC proportion may be explained by the high residence time of CPSOC (> 100 years). Indeed, so far those parameters have been related to the proportion of SOC present in the particulate organic matter fraction (size > 50 µm, density < 1–1.6), an SOC pool characterized by a residence time in soils generally below 20 years (Saenger et al., 2015; Soucémarianadin et al., 2018).
The two RE6 parameters reflecting SOC bulk chemistry showed highly significant correlations with the CPSOC proportion. This confirms, and extends to vegetated soils, the observed decreasing trend for HI and increasing trend for OIRE6 (except at Versailles where soils have a high pyrogenic C content) with bare fallow duration observed by Barré et al. (2016) in the bare fallow treatments of the same experimental sites. Soils with high proportions of CPSOC are thus characterized by an oxidized and H-depleted organic matter.
4.3 Perspectives to improve and foster RE6 thermal-analysis-based predictions of the size of the CPSOC pool
Future developments of this work must extend the Rock-Eval 6 thermal analysis regression model to a wider range of pedoclimates and to other biomes. As sites with LTBF treatments are not widespread, complementing the reference sample set may be achieved by using soils that have different soil forming factors (e.g., climate, parent material) and (i) which are sampled from long-term (> 50 to 100 years) experiments with contrasting SOC inputs, enabling the estimation of their CPSOC concentration (Buyanovsky and Wagner, 1998a, b), or (ii) for which the mean SOC age is known from radiocarbon data, enabling the estimation of the size of their persistent SOC pool (Trumbore, 2009; Mills et al., 2014).
Another development of this work will involve elucidating the fundamental mechanisms linking the biogeochemical stability of SOC with its thermal stability (e.g., Leifeld and von Lützow, 2014). This was beyond the scope of this work, yet it constitutes an exciting field of research that should be addressed in the future, as highlighted by the unexpected observations discussed in Sect. 4.2 and by other recent works that found no relationships between the thermal oxidation of SOC between 200 and 400 ∘C and the size of SOC pools with shorter residence times in soils (below or above ca. 18 years; Schiedung et al., 2017).
Overall, this work demonstrates the value of Rock-Eval 6 as a routine method for quantifying the size of the centennially persistent SOC pool with known uncertainty in temperate soils. The relatively low cost of the Rock-Eval 6 technique and the robustness of the thermal analysis regression model make it possible to apply it to soil monitoring networks across a continuum of scales as a reliable proxy for SOC persistence. This may be part of the framework proposed by O'Rourke et al. (2015) to better understand SOC processes at the biosphere to biome scale and should be added to the soil carbon cycling proxies recently listed by Bailey et al. (2018). Mapping persistent SOC at large scales may allow for the identification of regional hotspots of centennially persistent SOC that may contribute little to climate change by 2100. It may also provide information on the sustainability of additional SOC storage from soil carbon sequestration strategies such as those promoted by the international 4 per 1000 initiative in agriculture and forestry (https://www.4p1000.org/, last access: 6 May 2018; Dignac et al., 2017; Minasny et al., 2017; Soussana et al., 2018). A global map of centennially persistent SOC based on this empirical RE6 thermal analysis model could also be useful for improving the parameterization of SOC dynamics in Earth system models (Falloon and Smith, 2000; Luo et al., 2014; He et al., 2016). Indeed, this model based on RE6 thermal analysis appears as a robust and operational alternative to existing techniques used to initialize the size of the CPSOC pool in models of SOC dynamics (such as the methods of Falloon et al. (1998) or Zimmermann et al. (2007) that estimate the size of the inert SOC pool in the RothC model). The integration of large-scale information on the size of SOC kinetic pools may provide an adequate complement to the global datasets on SOC fluxes that are currently under development and restructuring (Hashimoto et al., 2015; Luo et al., 2016; Harden et al., 2018).
Data can be accessed upon request to Lauric Cécillon and Pierre Barré.
The supplement related to this article is available online at: https://doi.org/10.5194/bg-15-2835-2018-supplement.
LC and PB designed the study. PB and CC collected the archived soils. TK, SH, FvO and AM provided the archived soils and associated metadata. FB and FS performed the RE6 thermal analyses. RJ wrote the Python code. LC wrote the R codes and performed all statistical analysis. All authors contributed to the interpretation of the results. LC prepared the paper with contributions from all coauthors.
The authors declare that they have no conflict of interest.
This work was funded by ADEME and EC2CO (CARACAS project). Pierre Barré,
Lauric Cécillon, Laure Soucémarianadin and Suzanne Lutfalla thank
the Mairie de Paris (Emergences Programme) for financial support. We thank
Thomas Eglin (ADEME), Nicolas Bouton and Jean Espitalié (Vinci
Technologies), David Sebag (Normandie Univ., University of Lausanne), the
associate editor and two anonymous reviewers for their valuable suggestions
on this work. We thank INRA and AgroParisTech for access to and maintenance
of the Versailles 42 plots and the Grignon 36 plots with their long-term experiments and
sample archives. We thank Rothamsted Research and the Lawes
Agricultural Trust for access to archived samples and the BBSRC for support
under the Institute National Capabilities program grant (BBS/E/C/000J0300).
We gratefully acknowledge the Faculty of Natural Resources and Agricultural
Sciences of the Swedish University of Agricultural Sciences (SLU) for
providing funds for the maintenance of the Ultuna long-term field experiment and
for its sample archive.
Edited by: Marcel van
der Meer
Reviewed by: two anonymous referees
Amundson, R.: The carbon budget of soils, Annu. Rev. Earth Pl. Sc., 29, 535–562, 2001.
Auber, M.: Effet catalytique de certains inorganiques sur la sélectivité des réactions de pyrolyse rapide de biomasses et de leurs constituants, PhD Thesis, Institut National Polytechnique de Lorraine, 296 pp., 2009.
Bailey, V. L., Bond-Lamberty, B., DeAngelis, K., Grandy, A. S., Hawkes, C. V., Heckman, K., Lajtha, K., Phillips, R. P., Sulman, B. N., Todd-Brown, K. E. O., and Wallenstein, M. D.: Soil carbon cycling proxies: Understanding their critical role in predicting climate change feedbacks, Glob. Change Biol., 24, 895–905, 2018.
Barré, P., Eglin, T., Christensen, B. T., Ciais, P., Houot, S., Kätterer, T., van Oort, F., Peylin, P., Poulton, P. R., Romanenkov, V., and Chenu, C.: Quantifying and isolating stable soil organic carbon using long-term bare fallow experiments, Biogeosciences, 7, 3839–3850, https://doi.org/10.5194/bg-7-3839-2010, 2010.
Barré, P., Plante, A. F., Cécillon, L., Lutfalla, S., Baudin, F., Bernard, S., Christensen, B. T., Eglin, T., Fernandez, J. M., Houot, S., Kätterer, T., Le Guillou, C., Macdonald, A., van Oort, F., and Chenu, C.: The energetic and chemical signatures of persistent soil organic matter, Biogeochemistry, 130, 1–12, 2016.
Behar, F., Beaumont, V., and De B. Penteado, H. L.: Rock-Eval 6 technology: performances and developments, Oil Gas Sci. Technol., 56, 111–134, 2001.
Beleites, C. and Sergo, V.: hyperSpec: a package to handle hyperspectral data sets in R, R package version 0.98-20140523, 2014.
Bispo, A., Andersen, L., Angers, D., Bernoux, M., Brossard, M., Cécillon, L., Comans, R., Harmsen, J., Jonassen, K., Lamé, F., Lhuillery, C., Maly, S., Martin, E., Mcelnea, A., Sakai, H., Watabe, Y., and Eglin, T.: Accounting for carbon stocks in soils and measuring GHGs emission fluxes from soils: do we have the necessary standards?, Front. Environ. Sci., 5, 41, https://doi.org/10.3389/fenvs.2017.00041, 2017.
Borchers, H. W.: pracma: Practical Numerical Math Functions, R package version 1.8.8, 2015.
Breiman, L.: Random forests, Mach. Learn., 45, 5–32, 2001.
Brodowski, S., Amelung, W., Haumaier, L., and Zech, W.: Black carbon contribution to stable humus in German arable soils, Geoderma, 139, 220–228, 2007.
Bruun, S., Thomsen, I. K., Christensen, B. T., and Jensen, L. S.: In search of stable soil organic carbon fractions: a comparison of methods applied to soils labelled with 14C for 40 days or 40 years, Eur. J. Soil Sci., 59, 247–256, 2008.
Buyanovsky, G. A. and Wagner, G. H.: Carbon cycling in cultivated land and its global significance, Glob. Change Biol., 4, 131–141, 1998a.
Buyanovsky, G. A. and Wagner, G. H.: Changing role of cultivated land in the global carbon cycle, Biol. Fert. Soils, 27, 242–245, 1998b.
Campo, J. and Merino, A.: Variations in soil carbon sequestration and their determinants along a precipitation gradient in seasonally dry tropical forest ecosystems, Glob. Change Biol., 22, 1942–1956, 2016.
Canty, A. and Ripley, B.: boot: Bootstrap R (S-Plus) Functions, R package version 1.3-17, 2015.
Coulston, J. W., Blinn, C. E., Thomas, V. A., and Wynne, R. H.: Approximating prediction uncertainty for random forest regression models, Photogramm. Eng. Rem. S., 82, 189–197, 2016.
Davison, A. C. and Hinkley, D. V.: Bootstrap Methods and Their Applications, Cambridge University Press, Cambridge, 1997.
Dignac, M. F., Derrien, D., Barré, P., Barot, S., Cécillon, L., Chenu, C., Chevallier, T., Freschet, G. T., Garnier, P., Guenet, B., Hedde, M., Klumpp, K., Lashermes, G., Maron, P. A., Nunan, N., Roumet, C., and Basile-Doelsch, I.: Increasing soil carbon storage: mechanisms, effects of agricultural practices and proxies. A review, Agron. Sustain. Dev., 37, 14, https://doi.org/10.1007/s13593-017-0421-2, 2017.
Disnar, J. R., Guillet, B., Keravis, D., Di-Giovanni, C., and Sebag, D.: Soil organic matter (SOM) characterization by Rock-Eval pyrolysis: scope and limitations, Org. Geochem., 34, 327–343, 2003.
Eglin, T., Ciais, P., Piao, S. L., Barré, P., Bellassen, V., Cadule, P., Chenu, C., Gasser, T., Koven, C., Reichstein, M., and Smith, P.: Historical and future perspectives of global soil carbon response to climate and land-use changes, Tellus B, 62, 700–718, 2010.
Espitalié, J., Madec, M., Tissot, B., Mennig, J. J., and Leplat, P.: Source rock characterization method for petroleum exploration, 9th annual offshore technology conference, 2–5 May 1977, Houston, USA, OTC 2935, https://doi.org/10.4043/2935-MS, 1977.
Falloon, P. and Smith, P.: Modelling refractory soil organic matter, Biol. Fert. Soils, 30, 388–398, 2000.
Falloon, P., Smith, P., Coleman, K., and Marshall, S.: Estimating the size of the inert organic matter pool from total soil organic carbon content for use in the Rothamsted carbon model, Soil Biol. Biochem., 30, 1207–1211, 1998.
Feng, W., Shi, Z., Jiang, J., Xia, J., Liang, J., Zhou, J., and Luo, Y.: Methodological uncertainty in estimating carbon turnover times of soil fractions, Soil Biol. Biochem., 100, 118–124, 2016.
Franko, U. and Merbach, I.: Modelling soil organic matter dynamics on a bare fallow Chernozem soil in Central Germany, Geoderma, 303, 93–98, 2017.
Gregorich, E. G., Gillespie, A. W., Beare, M. H., Curtin, D., Sanei, H., and Yanni, S. F.: Evaluating biodegradability of soil organic matter by its thermal stability and chemical composition, Soil Biol. Biochem., 91, 182–191, 2015.
Harden, J. W., Hugelius, G., Ahlström, A., Blankinship, J. C., Bond-Lamberty, B., Lawrence, C. R., Loisel, J., Malhotra, A., Jackson, R. B., Ogle, S., Phillips, C., Ryals, R., Todd-Brown, K., Vargas, R., Vergara, S. E., Cotrufo, M. F., Keiluweit, M., Heckman, K. A., Crow, S. E., Silver, W. L., DeLonge, M., and Nave, L. E.: Networking our science to characterize the state, vulnerabilities, and management opportunities of soil organic matter, Glob. Change Biol., 24, e705–e718, 2018.
Hashimoto, S., Carvalhais, N., Ito, A., Migliavacca, M., Nishina, K., and Reichstein, M.: Global spatiotemporal distribution of soil respiration modeled using a global database, Biogeosciences, 12, 4121–4132, https://doi.org/10.5194/bg-12-4121-2015, 2015.
He, Y., Trumbore, S. E., Torn, M. S., Harden, J. W., Vaughn, L. J. S., Allison, S. D., and Randerson, J. T.: Radiocarbon constraints imply reduced carbon uptake by soils during the 21st century, Science, 353, 1419–1424, 2016.
Kassambara, A.: factoextra: extract and visualize the results of multivariate data analyses, R package version 1.0.3, 2015.
Leifeld, J. and von Lützow, M.: Chemical and microbial activation energies of soil organic matter decomposition, Biol. Fert. Soils, 50, 147–153, 2014.
Liaw, A. and Wiener, M.: Classification and Regression by randomForest, R News, 2, 18–22, 2002.
Luo, Y., Ahlström, A., Allison, S. D., Batjes, N. H., Brovkin, V., Carvalhais, N., Chappell, A., Ciais, P., Davidson, E. A., Finzi, A., Georgiou, K., Guenet, B., Hararuk, O., Harden, J. W., He, Y., Hopkins, F., Jiang, L., Koven, C., Jackson, R. B., Jones, C. D., Lara, M. J., Liang, J., McGuire, A. D., Parton, W., Peng, C., Randerson, J. T., Salazar, A., Sierra, C. A., Smith, M. J., Tian, H., Todd-Brown, K. E. O., Torn, M., van Groenigen, K. J., Wang, Y. P., West, T. O., Wei, Y., Wieder, W. R., Xia, J., Xu, X., Xu, X., and Zhou, T.: Toward more realistic projections of soil carbon dynamics by Earth system models, Global Biogeochem. Cy., 30, 40–56, https://doi.org/10.1002/2015GB005239, 2016.
Luo, Z. K., Wang, E. L., Fillery, I. R. P., Macdonald, L. M., Huth, N., and Baldock, J.: Modelling soil carbon and nitrogen dynamics using measurable and conceptual soil organic matter pools in APSIM, Agr. Ecosyst. Environ., 186, 94–104, 2014.
Lutfalla, S., Chenu, C., and Barré, P.: Are chemical oxidation methods relevant to isolate a soil pool of centennial carbon?, Biogeochemistry, 118, 135–139, 2014.
Mathieu, J. A., Hatté, C., Balesdent, J., and Parent, E.: Deep soil carbon dynamics are driven more by soil type than by climate: a worldwide meta-analysis of radiocarbon profiles, Glob. Change Biol., 21, 4278–4292, 2015.
Menichetti, L., Kätterer, T., and Leifeld, J.: Parametrization consequences of constraining soil organic matter models by total carbon and radiocarbon using long-term field data, Biogeosciences, 13, 3003–3019, https://doi.org/10.5194/bg-13-3003-2016, 2016.
Mills, R. T. E., Tipping, E., Bryant, C. L., and Emmett, B. A.: Long-term organic carbon turnover rates in natural and semi-natural topsoils, Biogeochemistry, 118, 257–272, 2014.
Minasny, B., Malone, B. P., McBratney, A. B., Angers, D. A., Arrouays, D., Chambers, A., Chaplot, V., Chen, Z. S., Cheng, K., Das, B. S., Field, D. J., Gimona, A., Hedley, C. B., Hong, S. Y., Mandal, B., Marchant, B. P., Martin, M., McConkey, B. G., Mulder, V. L., O'Rourke, S., Richer-de-Forges, A. C., Odeh, I., Padarian, J., Paustian, K., Pan, G., Poggio, L., Savin, I., Stolbovoy, V., Stockmann, U., Sulaeman, Y., Tsui, C. C., Vågen, T. G., van Wesemael, B., and Winowiecki, L.: Soil carbon 4 per mille, Geoderma, 292, 59–86, 2017.
NF ISO 10694: Determination of organic and total carbon after dry combustion (elementary analysis), AFNOR, 1995.
O'Rourke, S. M., Angers, D. A., Holden, N. M., and McBratney, A. B.: Soil organic carbon across scales, Glob. Change Biol., 21, 3561–3574, 2015.
Patil, A., Huard, D., and Fonnesbeck, C. J.: PyMC: Bayesian stochastic modelling in Python, J. Stat. Softw., 35, 1–81, 2010.
Plante, A. F., Fernández, J. M., and Leifeld, J.: Application of thermal analysis techniques in soil science, Geoderma, 153, 1–10, 2009.
Plante, A. F., Fernández, J. M., Haddix, M. L., Steinweg, J. M., and Conant, R. T.: Biological, chemical and thermal indices of soil organic matter stability in four grassland soils, Soil Biol. Biochem., 43, 1051–1058, 2011.
Plante, A. F., Beaupré, S. R., Roberts, M. L., and Baisden, T.: Distribution of radiocarbon ages in soil organic matter by thermal fractionation, Radiocarbon, 55, 1077–1083, 2013.
Post, W. M. and Kwon, K. C.: Soil carbon sequestration and land-use change: processes and potential, Glob. Change Biol., 6, 317–327, 2000.
R Core Team: R: a language and environment for statistical computing, Vienna, Austria: R Foundation for Statistical Computing, 2017.
Rovira, P., Kurz-Besson, C., Coûteaux, M. M., and Ramón Vallejo, V.: Changes in litter properties during decomposition: A study by differential thermogravimetry and scanning calorimetry, Soil Biol. Biochem., 40, 172–185, 2008.
Rühlmann, J.: A new approach to estimating the pool of stable organic matter in soil using data from long-term field experiments, Plant Soil, 213, 149–160, 1999.
Saenger, A., Cécillon, L., Sebag, D., and Brun, J. J.: Soil organic carbon quantity, chemistry and thermal stability in a mountainous landscape: A Rock-Eval pyrolysis survey, Org. Geochem., 54, 101–114, 2013.
Saenger, A., Cécillon, L., Poulenard, J., Bureau, F., De Danieli, S., Gonzalez, J. M., and Brun, J. J.: Surveying the carbon pools of mountain soils: A comparison of physical fractionation and Rock-Eval pyrolysis, Geoderma, 241–242, 279–288, 2015.
Sanderman, J., Baisden, W. T., and Fallon, S.: Redefining the inert organic carbon pool, Soil Biol. Biochem., 92, 149–152, 2016.
Schiedung, M., Don, A., Wordell-Dietrich, P., Alcántara, V., Kuner, P., and Guggenberger, G.: Thermal oxidation does not fractionate soil organic carbon with differing biological stabilities, J. Plant Nutr. Soil Sci., 180, 18–26, 2017.
Schrumpf, M. and Kaiser, K.: Large differences in estimates of soil organic carbon turnover in density fractions by using single and repeated radiocarbon inventories, Geoderma, 239–240, 168–178, 2015.
Sebag, D., Disnar, J. R., Guillet, B., Di Giovanni, C., Verrecchia, E. P., and Durand, A.: Monitoring organic matter dynamics in soil profiles by “Rock-Eval pyrolysis”: bulk characterization and quantification of degradation, Eur. J. Soil Sci., 57, 344–355, 2006.
Sebag, D., Verrecchia, E. P., Cécillon, L., Adatte, T., Albrecht, R., Aubert, M., Bureau, F., Cailleau, G., Copard, Y., Decaens, T., Disnar, J. R., Hetényi, M., Nyilas, T., and Trombino, L.: Dynamics of soil organic matter based on new Rock-Eval indices, Geoderma, 284, 185–203, 2016.
Soil Carbon Initiative: Outcomes Document Soil Carbon Summit, Dow-Sustainability-Fund and ALCOA, 11 pp., The United States Study Center, The University of Sydney, Sydney, Australia, 2011.
Soucémarianadin, L., Cécillon, L., Chenu, C., Baudin, F., Nicolas, M., Girardin, C., and Barré, P.: Is Rock-Eval 6 thermal analysis a good indicator of soil organic carbon lability? – A method comparison study in forest soils, Soil Biol. Biochem., 117, 108–116, 2018.
Soussana, J. F., Lutfalla, S., Ehrhardt, F., Rosenstock, T., Lamanna, C., Havlík, P., Richards, M., Wollenberg, E. L., Chotte, J. L., Torquebiau, E., Ciais, P., Smith, P., and Lal, R.: Matching policy and science: Rationale for the “4 per 1000 – soils for food security and climate” initiative, Soil Till. Res., https://doi.org/10.1016/j.still.2017.12.002, online first, 2017.
Strobl, C., Malley, J., and Tutz, G.: An introduction to recursive partitioning: rationale, application and characteristics of classification and regression trees, bagging and random forests, Psychol. Methods, 14, 323–348, 2009.
Trumbore, S. E.: Potential responses of soil organic carbon to global environmental change, P. Natl. Acad. Sci. USA, 94, 8284–8291, 1997.
Trumbore, S. E.: Radiocarbon and soil carbon dynamics, Annu. Rev. Earth Pl. Sc., 37, 47–66, 2009.
von Lützow, M., Kögel-Knabner, I., Ekschmitt, K., Flessa, H., Guggenberger, G., Matzner, E., and Marschner, B.: SOM fractionation methods: relevance to functional pools and to stabilization mechanisms, Soil Biol. Biochem., 39, 2183–2207, 2007.
Wickham, H.: stringr: Simple, Consistent Wrappers for Common String Operations, R package version 1.0.0, available at: http://CRAN.R-project.org/package=stringr (last access: 6 May 2018), 2015.
Zimmermann, M., Leifeld, J., Schmidt, M. W. I., Smith, P., and Fuhrer, J.: Measured soil organic matter fractions can be related to pools in the RothC model, Eur. J. Soil Sc., 58, 658–667, 2007.