the Creative Commons Attribution 4.0 License.
the Creative Commons Attribution 4.0 License.
 | 25 May 2018
In situ evidence of mineral physical protection and carbon stabilization revealed by nanoscale 3-D tomography
Yi-Tse Weng
Chun-Chieh Wang
Cheng-Cheng Chiang
Heng Tsai
Yen-Fang Song
Shiuh-Tsuen Huang
Biqing Liang
An approach for nanoscale 3-D tomography of organic carbon (OC) and associated mineral nanoparticles was developed to illustrate their spatial distribution and boundary interplay, using synchrotron-based transmission X-ray microscopy (TXM). The proposed 3-D tomography technique was first applied to in situ observation of a laboratory-made consortium of black carbon (BC) and nanomineral (TiO2, 15 nm), and its performance was evaluated using dual-scan (absorption contrast and phase contrast) modes. This novel tool was then successfully applied to a natural OC–mineral consortium from mountain soil at a spatial resolution of 60 nm, showing the fine structure and boundary of OC, the distribution of abundant nano-sized minerals, and the 3-D organo-mineral association in situ. The stabilization of 3500-year-old natural OC was mainly attributed to the physical protection of nano-sized iron (Fe)-containing minerals (Fe oxyhydroxides including ferrihydrite, goethite, and lepidocrocite), and the strong organo-mineral complexation. In situ evidence revealed an abundance of mineral nanoparticles, in dense thin layers or nano-aggregates/clusters, instead of crystalline clay-sized minerals on or near OC surfaces. The key working minerals for C stabilization were reactive short-range-order (SRO) mineral nanoparticles and poorly crystalline submicron-sized clay minerals. Spectroscopic analyses demonstrated that the studied OC was not merely in crisscross co-localization with reactive SRO minerals; there could be a significant degree of binding between OC and the minerals. The ubiquity and abundance of mineral nanoparticles on the OC surface, and their heterogeneity in the natural environment may have been severely underestimated by traditional research approaches. Our in situ description of organo-mineral interplay at the nanoscale provides direct evidence to substantiate the importance of mineral physical protection for the long-term stabilization of OC. This high-resolution 3-D tomography approach is a promising tool for generating new insight into the interior 3-D structure of micro-aggregates, the in situ interplay between OC and minerals, and the fate of mineral nanoparticles (including heavy metals) in natural environments.
- Article
(3703 KB) - Full-text XML
-
Supplement
(2833 KB) - BibTeX
- EndNote


Three main mechanisms for soil organic carbon (SOC) stabilization have been proposed: (1) chemical stabilization as a result of chemical or physiochemical binding between SOC and soil minerals (especially clay and silt in current opinions), namely organo-mineral complexation; (2) physical protection, which occurs predominantly at the microaggregate level and is built on top of the chemical organo-mineral complexation; and (3) biochemical stabilization in the form of recalcitrant SOC compounds (Six et al., 2002). The accumulation and subsequent loss of OC have been found to be largely driven by changes in the millennial-scale cycling of mineral-stabilized C, and a positive correlation between non-crystalline minerals and OC has been found in soils across a climate gradient (Torn et al., 1997). Metastable SRO minerals, which may only exist in small portions in the fine and dense soil fraction, are crucial for C stabilization (Cusack et al., 2012; Eusterhues et al., 2005; Kaiser et al., 2002a; Mikutta et al., 2005, 2006, 2007; Rasmussen et al., 2005). Even though SRO minerals are known for high reactivity (Eusterhues et al., 2008, 2011), their development of strong organo-mineral complexation with OC relies on immediate contact with the reactive surface of OC. In contrast, although SRO normally accounts for only a small portion of weight in the soil fraction, their distribution could be prevalent due to small size. In real soil environments, the actual key mineral players (crystalline micron-sized clay vs. nanoscale SRO minerals) for in situ interaction with OC have not been identified, and their spatial and temporal variations are not known (Vogel et al., 2014). To date, little information is available on the in situ distribution of reactive minerals below clay size, and on the subsequent organo-mineral micro-assemblage in soils (Baldock and Skjemstad, 2000; Cusack et al., 2012; Mikutta et al., 2006; Torn et al., 1997; Vogel et al., 2014). Traditional fractionation methods based on size and external force for dissecting the association strength between OC and minerals in soils are limited to bulk samples and clay-sized mineral particles (Kaiser et al., 2002b; Kleber et al., 2007; Sollins et al., 2009). Multi-dimensional perspectives call for in situ observation of organo-mineral interplay and micro-assemblage at nanoscale (Kinyangi et al., 2006; Lehmann et al., 2007, 2008; Solomon et al., 2012). Advance of in situ interfacial details may lead to a breakthrough in mineral physical protection mechanism for the long-term stabilization of OC. To overcome the limitations of routinely used electron microscopic methods (e.g., applicability limited to the surface layer or undesirable artifacts due to pretreatments), a non-destructive high-resolution X-ray 3-D tomographic technique is used in this study to explore the fine structure of OC and boundary interplay with nano-sized mineral particles. It is worth noting that while some 3-D tomography studies have been conducted on soil microstructure and porosity using X-ray micro-computed tomography (CT), the best resolution achieved only amounts to tens of microns (for example, Quin et al. (2014), down to 70 µm, with biochar amendment; Kravchenko et al. (2015), down to 13 µm), which far exceed the size of clay minerals (< 2 µm). The micro-CT is therefore not fit for capturing the microstructure of clay and submicron minerals. High-resolution synchrotron-based TXM has been demonstrated as a powerful tool for understanding the internal 3-D structure of particles down to nanometer scale, due to its large penetration depth and superior spatial resolution (Kuo et al., 2011; Wang et al., 2015). This technique has been successfully applied to reveal the discrete three-dimensional micro-aggregation structure of clay (kaolinite) in natural aqueous environment and generated remarkable tomography that revealed precise inter-particle structure (Zbik et al., 2008). Clay particles with a diameter below 500 nm were clearly visible and their pseudohexagonal symmetry was recognized in three-dimensional details.
The synchrotron-based TXM at the beamline BL01B1 of Taiwan Light Source (TLS), which has been used in this study, provides two-dimensional imaging and three-dimensional tomography at a spatial resolution of 30∕60 nm with tunable energy (8–11 keV). It provides an unprecedented opportunity for studying OC boundary interplays with mineral particles at nanometer scale. Two image acquisition modes, absorption contrast and phase contrast, can be used for recognizing OC and nanominerals. X-ray images are often taken in the absorption contrast mode, and the resulting image contrast depends solely on the difference of X-ray attenuation coefficient between materials. This mode is especially suitable for imaging materials consisting of high atomic number compositions. However, for organic materials, the difference of X-ray attenuation coefficients between specimen and air is too small to distinguish them from each other. For this reason, the structure of organic materials is often difficult to recognize due to a low contrast in absorption contrast images. Alternatively, phase contrast technique which converts optical path length differences (optical phase) inside specimens into intensity contrast, can be used for imaging low atomic number materials with poor X-ray absorption. It provides a unique opportunity to observe fine structures of organic specimens such as OC. Few studies have been conducted on OC and mineral nanoparticles using high-resolution 3-D X-ray tomography, although non-synchrotron-based 3-D X-ray microscopy has been used to observe occluded carbon in phytolith structure and kerogen at micrometer scale (Alexandre et al., 2015; Bousige et al., 2016). We developed a new dual-scan method using phase contrast and absorption contrast modes of the TXM for observing OC and mineral consortiums inside laboratory-made and natural samples at nanometer scale. For the first time, synchrotron-based TXM was used to examine laboratory-made OC in the form of BC in the artificial consortium with added mineral nanoparticles (TiO2). Black carbon (biochar) has received increasing research interest globally due to its importance in global carbon cycling, soil fertility improvement, and environmental pollutant remediation (Bond et al., 2013; Jeffery et al., 2015; Kuhlbusch, 1998; Lehmann et al., 2007; Liang et al., 2006, 2008; Schmidt, 2004). In addition to method development for 3-D tomography at the nanometer scale, this study provides in situ evidence on the minerals physical protection on natural OC, and allows for the exploration of the C stabilization mechanism in natural soil.
High-resolution X-ray scanning and 3-D tomography is highly demanding in terms of technology, and multidisciplinarity and “big data” analysis (Lafond et al., 2015). Except for the adoption of high-resolution X-ray objective lenses, the fidelity of 3-D tomography relies on the accurate alignment of the 2-D projections in correct three-dimensional positions. However, non-negligible mechanical imperfection of the rotational stages at nanometer level, or the thermal effects may significantly degrade the spatial resolution of reconstructed tomography. We have developed a markless image auto-alignment algorithm for fast projection matching (Faproma, Wang et al., 2017) to overcome these challenges, and accomplished accurate reconstruction of 3-D tomography at the nanometer level.
2.1 Sample preparation and background
Sample of BC was made in the laboratory using a leguminous plant (Sesbania roxburghii) harvested 80 days after planting, which was first oven-dried (65 ∘C), and charred inside a muffle furnace at 300 ∘C in loosely sealed stainless containers (Chen et al., 2014b). This consortium of low temperature BC and mineral nanoparticles was constructed by dry deposition of commercial TiO2 (15 nm) on laboratory-made BC (3 mm chunk), and then was embedded in Gatan G-1 epoxy. The blocks were cross-sectioned to a thickness of 100 to 200 µm using a microtome (Leica Reichert Ultracut E ultra-microtome) and subsequently hand-polished to a thickness of 30 to 50 µm. Each section was transferred onto Kapton tape and mounted on a stainless steel sample holder for TXM observation. Before TXM analysis, gold nanoparticles (50–150 nm or 400–500 nm in diameter) were deployed on the section surface for image registration.
Thin section of natural OC and mineral consortium (NH) was prepared using micron- to millimeter-sized particulate sample from mountain soil. Millimeter-sized particulate organic matter with minerals embedded inside was taken from the lower dark layer at a depth of 72 to 93 cm in a “Typic Humicryept” soil profile, located in Mt. Nanhua, Nantou County, Taiwan (24∘03′00, 121∘17′02). On top of this dark layer, iron stain was observed at depths from 63 to 72 cm in the profile. The soil in question had developed on top of sandstone and slate, with some features of Inceptisol and Spodosol. The elevation of the sampled area was 3092 m, the annual average temperature was 7.57 ∘C, and the yearly rainfall was 2203.1 mm. The primary vegetation in the region was arrow bamboo (Yushania nittakayamensis), with sporadic hemlock (Tsuga chinensis), fir (Abies kawakamii), and spruce (Picea morrisonicola). The sequestration environment represents weak leaching and chemical weathering conditions. The age of soil organic C was estimated to be 3500 yr BP.
2.2 Working conditions of TXM
A superconducting wavelength shifter source provides a photon flux of 4 × 10¹¹ photons s−1 (0.1 % bw)−1 in the energy range of 5–20 keV at the BL01B1 beamline. A double crystal monochromator exploiting a pair of Ge (111) crystals selects X-rays within the energy range of 8–11 keV. The specimen is imaged using a Fresnel zone plate, which functions as an objective lens for an image magnification of 44× by the first order diffraction mode. Conjugated with a 20× downstream optical magnification, the TXM provides a total magnification of 880× with a field of view of 15 × 15 µm2. By acquiring a series of 2-D images with the sample rotated 1∘ stepwise, 3-D tomography datasets are later reconstructed based on 151 sequential image frames that are captured with azimuth angle rotating from −75 to +75∘.
2.3 Image acquisition for 3-D tomography
Under the most frequently used absorption contrast mode, 2-D images are recorded based on the projection of the different X-ray absorption coefficient integration along the optical pathway through the samples on a detector. The absorption mode is useful for materials of high absorption coefficient, such as minerals or high atomic number materials, but it performs poorly for the observation of low atomic number materials, such as organic or polymer materials. To recognize the OC structure more accurately, 2-D/3-D images for the same sample region are recorded using absorption contrast and phase contrast modes, respectively.
In the phase contrast mode, the gold-made phase ring positioned at the back focal plane of the zone plate is used to retard or advance the phase of the non-diffracted light by π∕2, generating (Zernike's) phase contrast image recordings at the detector. The light diffracted by the specimen interferes with the retarded non-diffracted light, generating a phase contrast image. The intensity difference in a phase contrast image shows the combination of optical phase difference and absorption difference through the specimens. This ability is especially important for the observation of OC which has a low X-ray absorption coefficient.
2.4 Three-dimensional reconstruction and analysis
Three-dimensional tomography reconstruction was performed using homemade software, which was coded based on iterative image registration (Faproma) (Wang et al., 2017) and filtered back projection (FBP) reconstruction algorithms. Firstly, a series of single TXM images captured from −75 to +75∘ at rotational increments of 1∘ were loaded for automatic image registration using the Faproma algorithm. Then, the reconstruction was processed using the FBP algorithm. The reconstructed datasets were exported in cross-sections for 3-D visualization using Amira software. The intensity contrast of reconstructed datasets was inversed for better visualization. Compositions with higher absorption coefficients were shown in higher intensity and those with low absorption coefficients were shown in lower intensity. The exported cross-section of 3-D tomography (reconstructed datasets) showed the real distribution details and boundary interplay of OC and mineral particles. The final 3-D tomographic structures for visualization and illustration were generated using Amira 3-D software for image post-process and computation (Fig. S1 in the Supplement).
2.5 Elemental mapping by SEM-EDS
For correlated spatial distribution of selected elements (C, O, Fe, Al, etc.) in natural OC particles from mountain soil, a low-vacuum scanning electron microscope (SEM, JEOL W-LVSEM, JSM-6360LV) equipped with an energy dispersive X-ray spectrometer (Oxford EDS) and a cathodoluminescence (CL) image detector (Gatan mini-CL) was used for elemental mapping, at an accelerating voltage of 15 keV.
2.6 X-ray diffraction for mineralogy
To analyze the forms of minerals associated with natural OC, particulate OC (with minerals on the surface and embedded inside) was ground and injected into capillary tubes (Special Glass 10, Hampton Research, CA) for synchrotron high-resolution X-ray diffraction analysis. Analysis took place at the 09A beamline at Taiwan Photon Source (TPS), which was equipped with a set of high-resolution monochromators (HRM). The wavelength was 0.8266 Å at an energy of 15 keV. The X-ray diffraction (XRD) spectra were recorded under room temperature for 240 s accumulation time. Specific X-ray diffraction peaks and patterns were assigned using the ICDD PDF-2/4 databases.
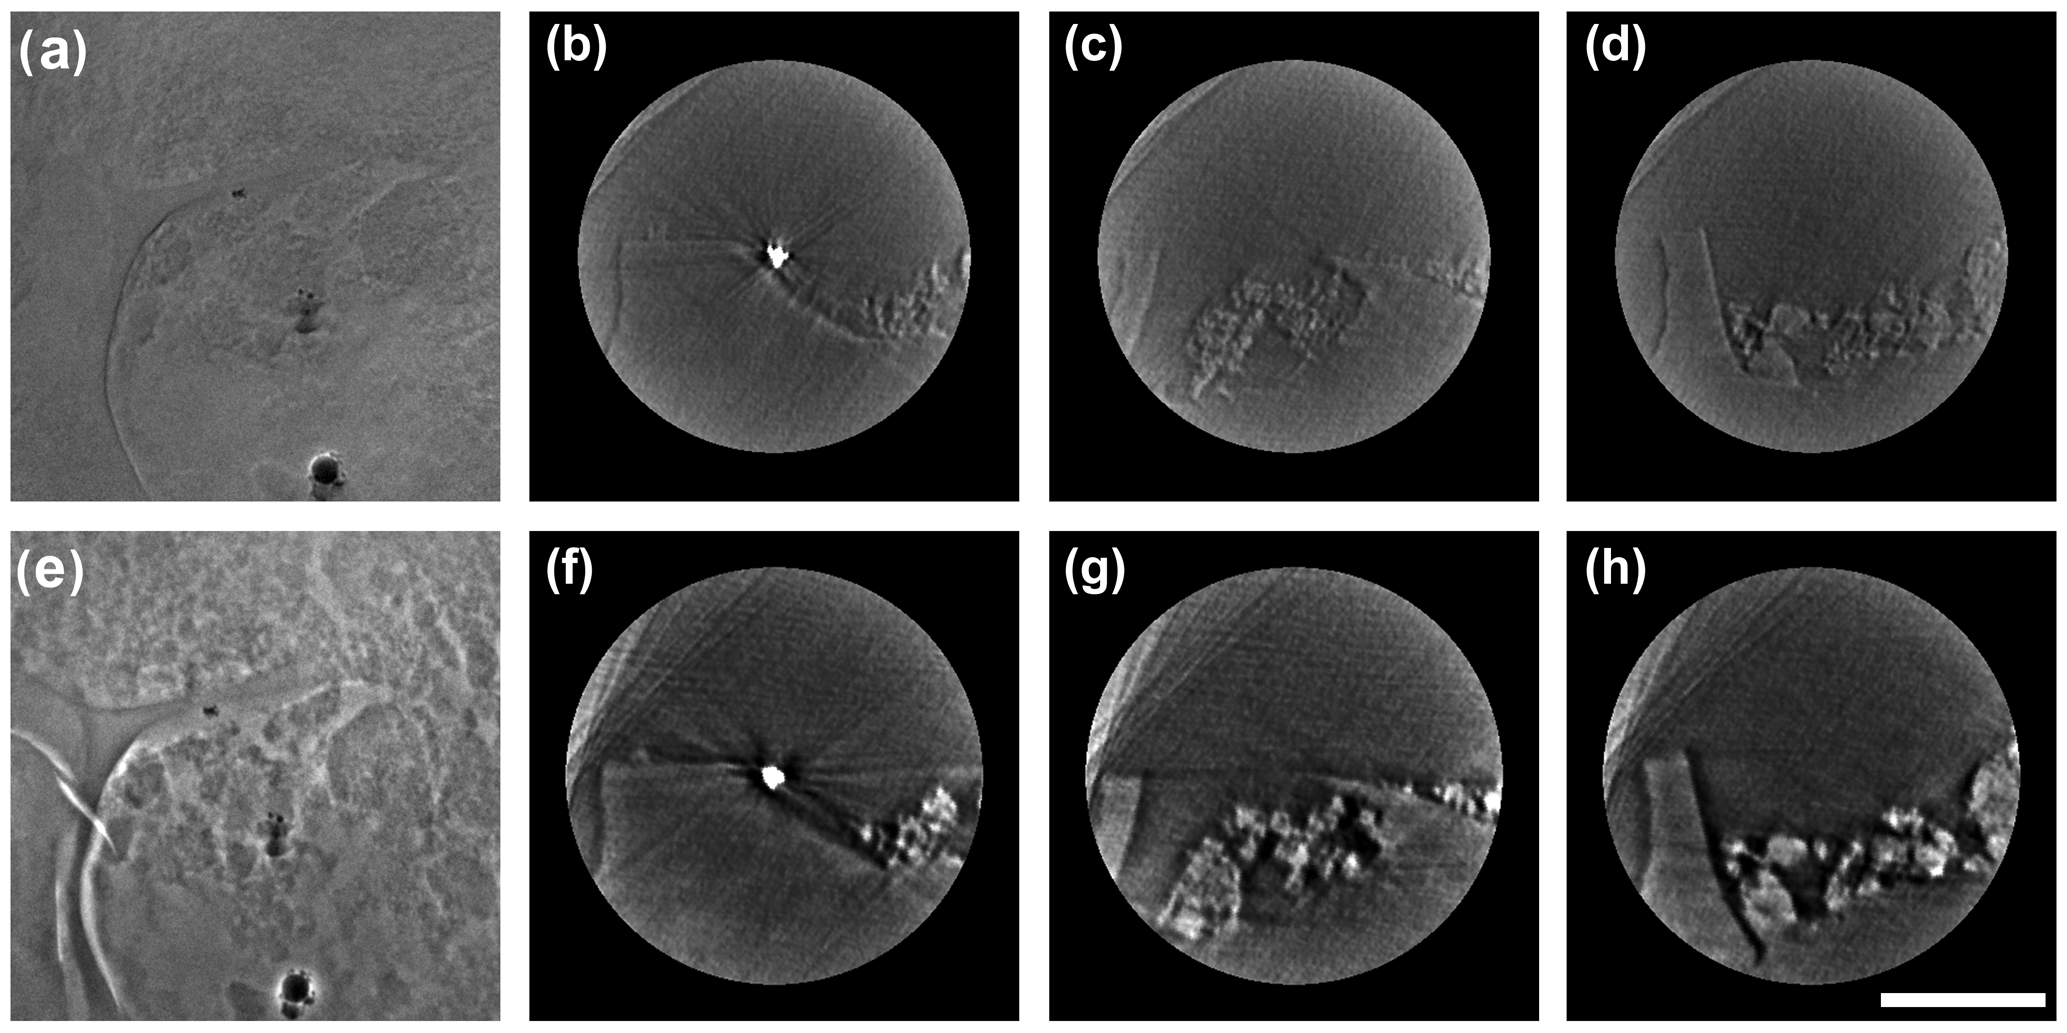
Figure 1The 2-D X-ray images for BC and the mineral nanoparticle consortium. Two images are taken of the same region using absorption contrast mode (a) and phase contrast mode (e), respectively. Cross-section views of the reconstructed 3-D tomography under each mode at different depths relative to the position of gold nanoparticle along the z axis as a reference. (b) and (f) are sections extracted at the position of the gold particle. (c) and (g) are sections extracted at 800 nm above the gold particle. (d) and (h) are sections extracted at 800 nm below the gold particle. The scale bar is 5 µm.
2.7 Carbon functionality and interfacial mineral forms using FTIR
For the FTIR analysis, mineral-bearing OC (NH) particles were ground, dried (60 ∘C overnight), mixed with potassium bromide (KBr) at a ratio of 1:100, and molded into disks using a hydraulic press. During the pressing process, a vacuum pump was used for evacuating air and water. The samples were measured using infrared microspectroscopy at the BL14A1 beamline at the National Synchrotron Radiation Research Center (NSRRC), Taiwan. The FTIR spectra were collected with up to 1024 scans in the mid-infrared range of 4000–400 cm−1 at a spectral resolution of 4 cm−1, using a FTIR spectrometer (Nicolet 6700, Thermo Fisher Scientific, Madison, WI, USA) with a self-equipped light source. The automatic atmospheric suppression function of OMNIC software (OMNIC 9.2, 2012; Thermo Fisher Scientific Inc., Waltham, MA, USA) for bulk sample analysis was activated for data analysis, to eliminate the rovibrational absorptions of CO2 and water vapor in ambient air.
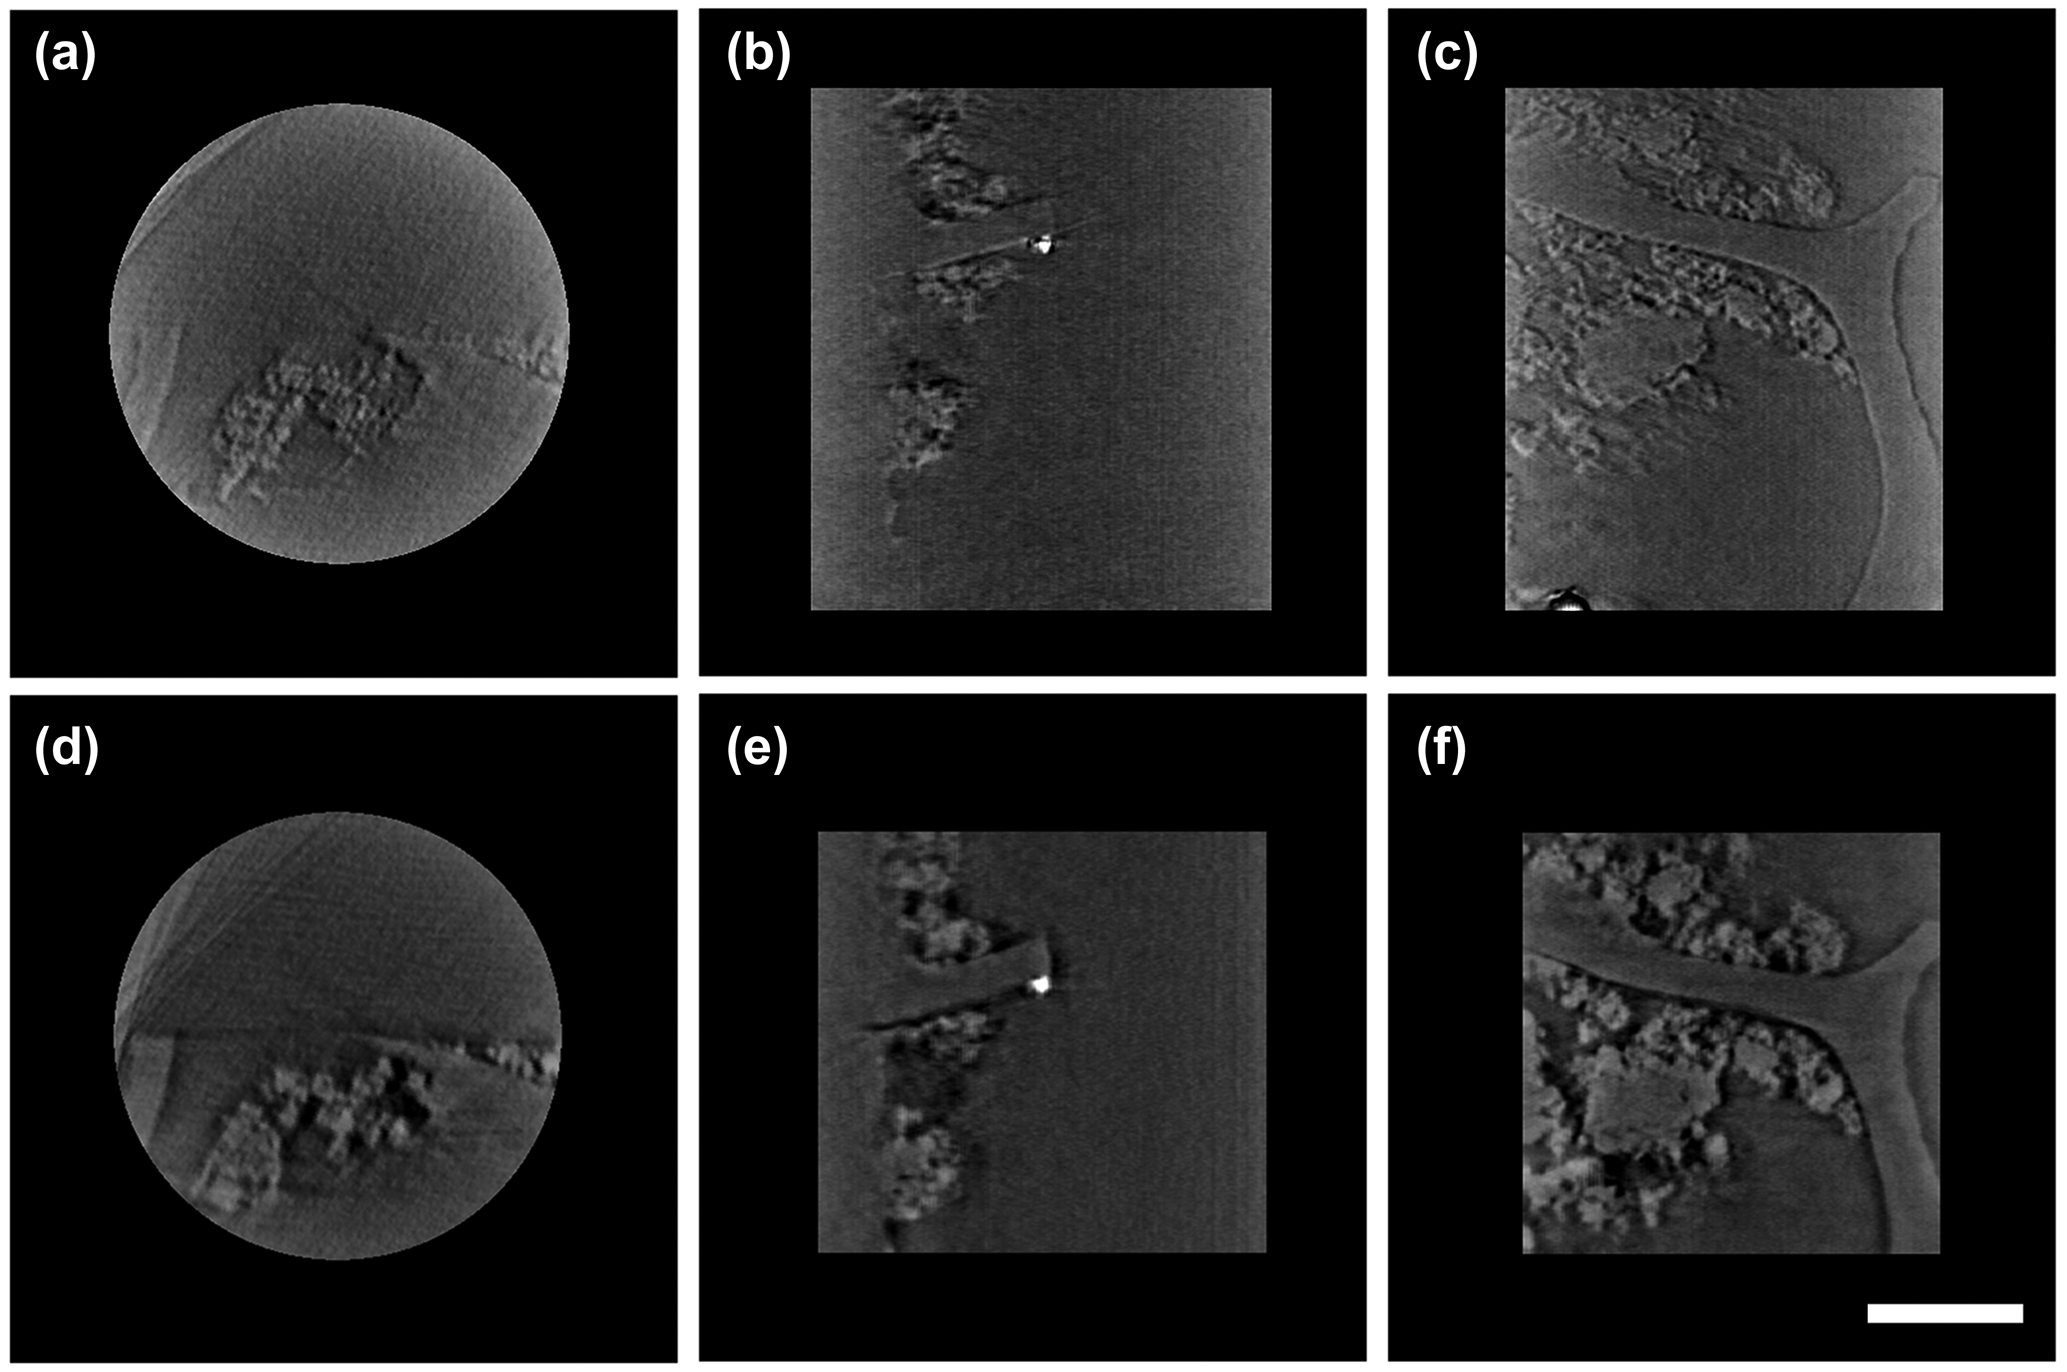
Figure 2Three-directional orthogonal sections of laboratory-made BC and mineral nanoparticle consortium. The upper row sections were extracted from absorption contrast tomography (a, b, c), and the lower row sections are extracted from phase contrast tomography (d, e, f), specifically (a) and (d) are for xy plane, (b) and (e) are for yz plane, and (c) and (f) are for xz plane. The scale bar is 5 µm.
3.1 Distinguish the fine structure of BC and boundary interplay with mineral nanoparticles
High-resolution 2-D X-ray photographs were captured for the identical regions in laboratory-made BC and nanomineral consortium using dual-scan absorption contrast and phase contrast modes (Fig. 1a and e). The cross-section views exported from the reconstructed 3-D datasets reveal subtle details of BC and mineral nanoparticles, and clearly outline the fine boundary of BC and the distribution of TiO2 nanoparticles (Fig. 1). The shape, size, and distribution of mineral nanoparticles were identified accurately using the absorption contrast mode due to their high X-ray absorptivity (Fig. 1b, c, and d). In comparison, the BC structure and contour of its boundary were revealed much more clearly using the phase contrast mode (Fig. 1f, g and h). However, the bright halo artifacts in phase contrast images enhance the intensity of margin texture for nanominerals, and may lead to an overestimation of their volume (Fig. 1e, f, g and h). The use of dual-scan mode allows cross-checking and validation of details.
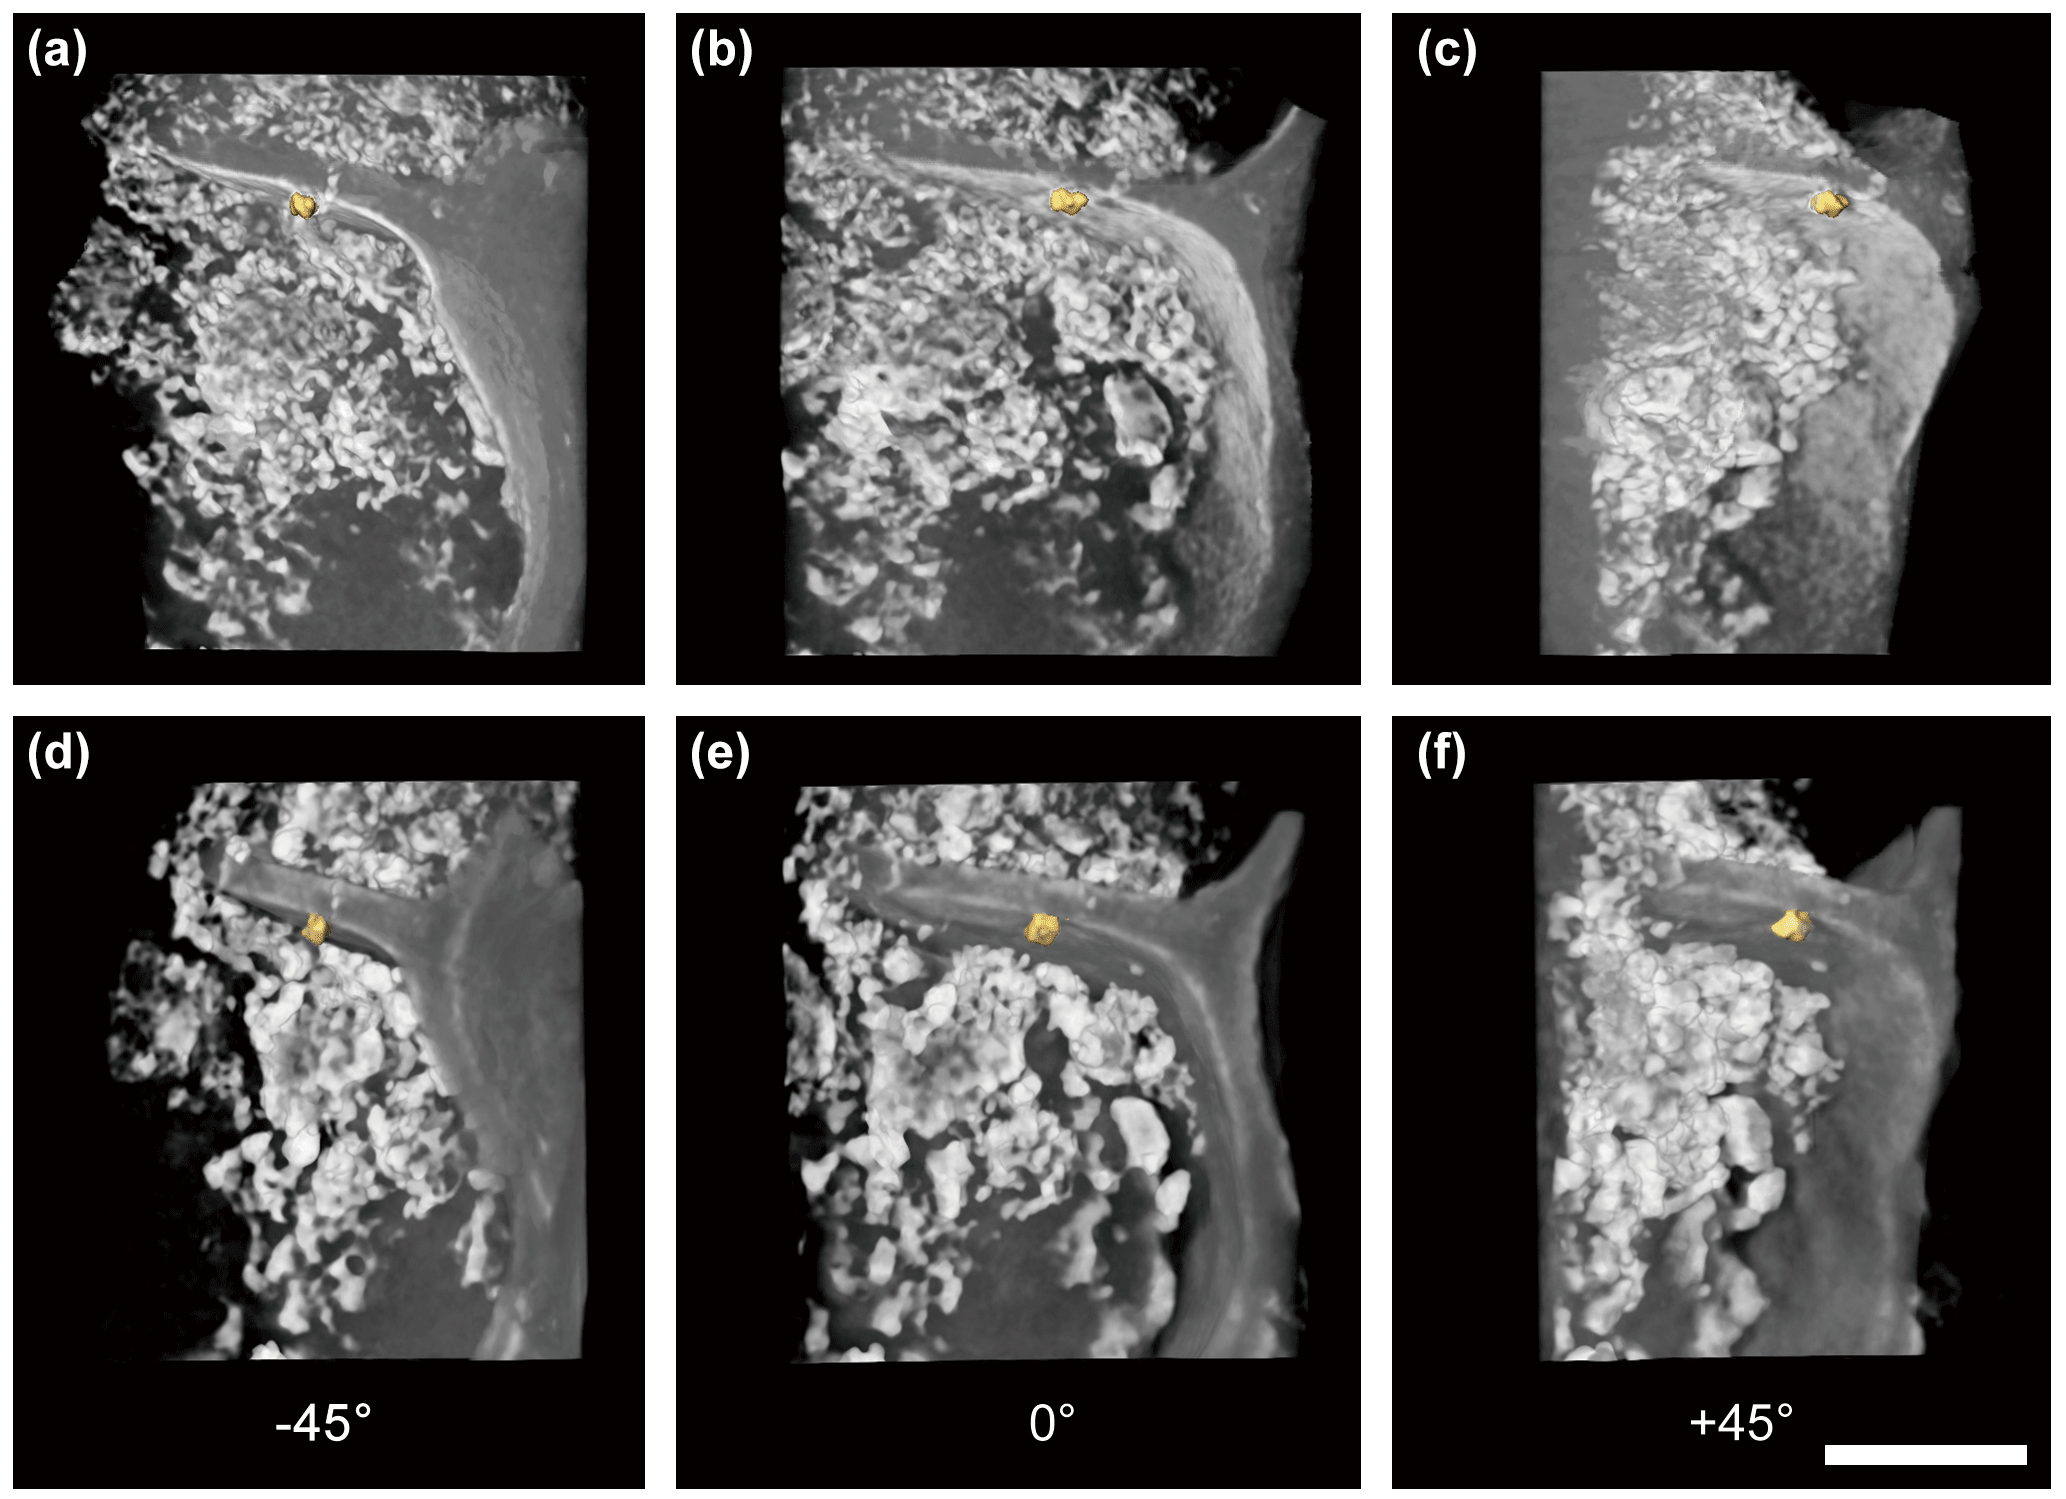
Figure 33-D tomography illustration of laboratory-made BC and the mineral nanoparticle consortium observed at −45∘ (a, d), 0∘ (b, e), and +45∘ (c, f) azimuthal viewing angles under absorption contrast (a, b, c) and phase contrast mode (d, e, f). The scale bar is 5 µm.
Cross-sectional views of the reconstructed 3-D tomography shared consistent and comparable features of BC and nanominerals in multi-angles (Fig. 2). According to the display of different slicing planes (xy, xz, yz), TiO2 nanoparticles deposit inside BC only had sporadic contact with the BC boundary (Fig. 2b, e, c, and f) due to the treatment of dry deposition. The nanoscale gap between BC and nanominerals was clearly observed in absorption and phase contrast images (Fig. 2b, e, c, and f). It was feasible to calculate the interplay surface and mineral volume quantitatively by examining each cross-sectional view in a selected region. Our approach was successful in thoroughly exploring OC and minerals' 3-D distribution and verifying their real in situ spatial correlation at nanoscale resolution.
3.2 Three-dimensional tomography for illustrating in situ distribution of BC and mineral nanoparticles
Three-dimensional tomography for visualization was computed and generated based on the post-processing of the reconstructed 3-D datasets to illustrate the spatial correlation between BC and minerals. Unprecedented details of 3-D in situ distribution of BC and mineral nanoparticles were revealed in the computed 3-D tomography (Fig. 3; Fig. SMOV1 https://doi.org/10.5446/36090, last access: 21 May 2018; Fig. SMOV2 https://doi.org/10.5446/36091, last access: 21 May 2018). Results from absorption-mode and phase contrast mode were consistent and comparable. The fine boundary feature of BC was contoured for completion in the phase contrast mode. The OC was rendered by transparent mode, and high absorptivity materials (such as minerals and gold particles) were rendered by solid mode with various colors. All renderings were combined to visualize their interactions. The computed 3-D tomography illustrations allow randomly tilted and set angles for image and animated video exports, thus any region of interest inside a specimen may be explored thoroughly.
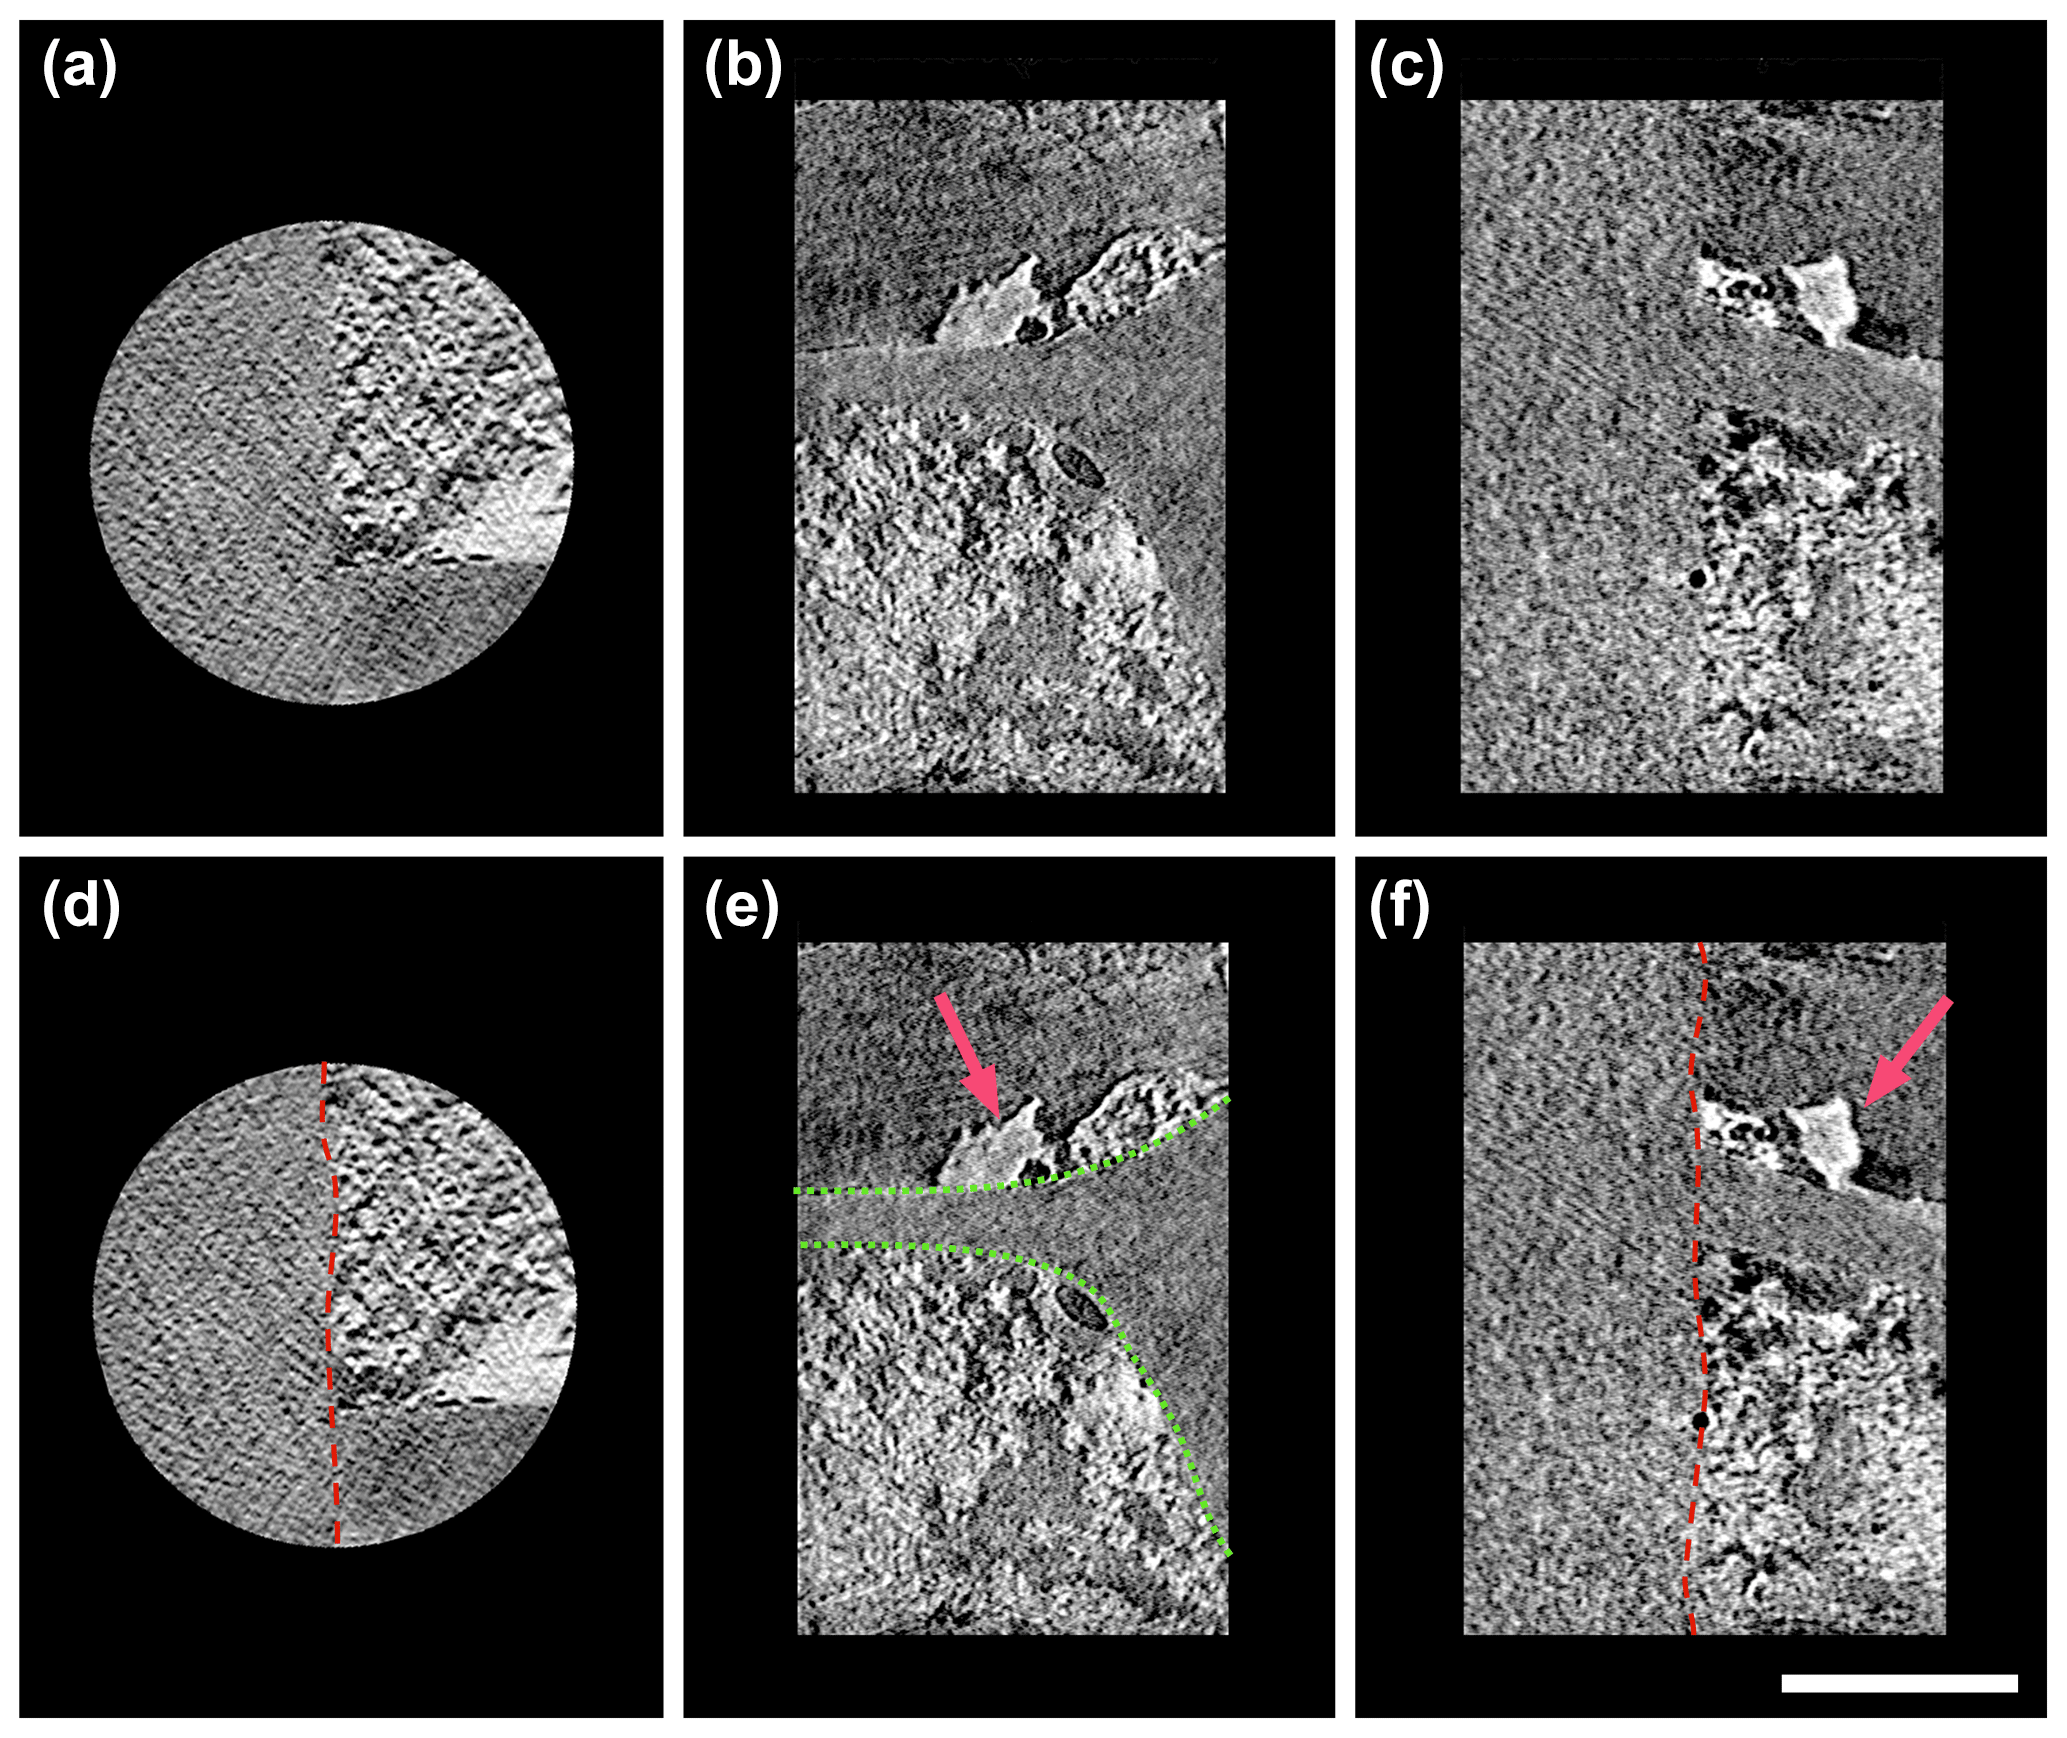
Figure 4Three-directional orthogonal sections of natural mineral-bearing OC from absorption contrast tomography (a for xy plane, b for xz plane, and c for yz plane). The scale bar is 5 µm. Minerals mainly exhibit two types of textures, subhedral particles and anhedral nano-aggregates/clusters. The images in the lower row highlight the free surface of specimen (red line in d), the boundary of OC (green dotted line in e), and the subhedral mineral particles (pink arrow in e and f).
The laboratory-made consortium was successfully tested by the dual-scan methodology using both absorption contrast and phase contrast acquisition modes (Figs. 1, 2, and 3). Compared with BC made at high temperatures, low-temperature BC is more similar to pyrogenic OC exposed to the natural environment. Thus, low-temperature BC was specially made to test its applicability under absorption contrast mode. Results showed that the fine structure and boundary of low-temperature BC can be clearly observed under absorption contrast mode. Thus, for environmental OC samples, the use of absorption contrast mode is very likely sufficient for capturing organo-mineral features.
Unlike field samples, the minerals observed within the laboratory-made consortium are often distributed in clusters and are only sparsely in contact with BC surfaces. The preservation of plant-like structures in BC could play a role in carbon stabilization in the natural environment, as their porosity and reactive surface provide large areas and sites for mineral coating, which may contribute to their long residence and physical endurance (Eusterhues et al., 2008; Rasmussen et al., 2005; Rawal et al., 2016).
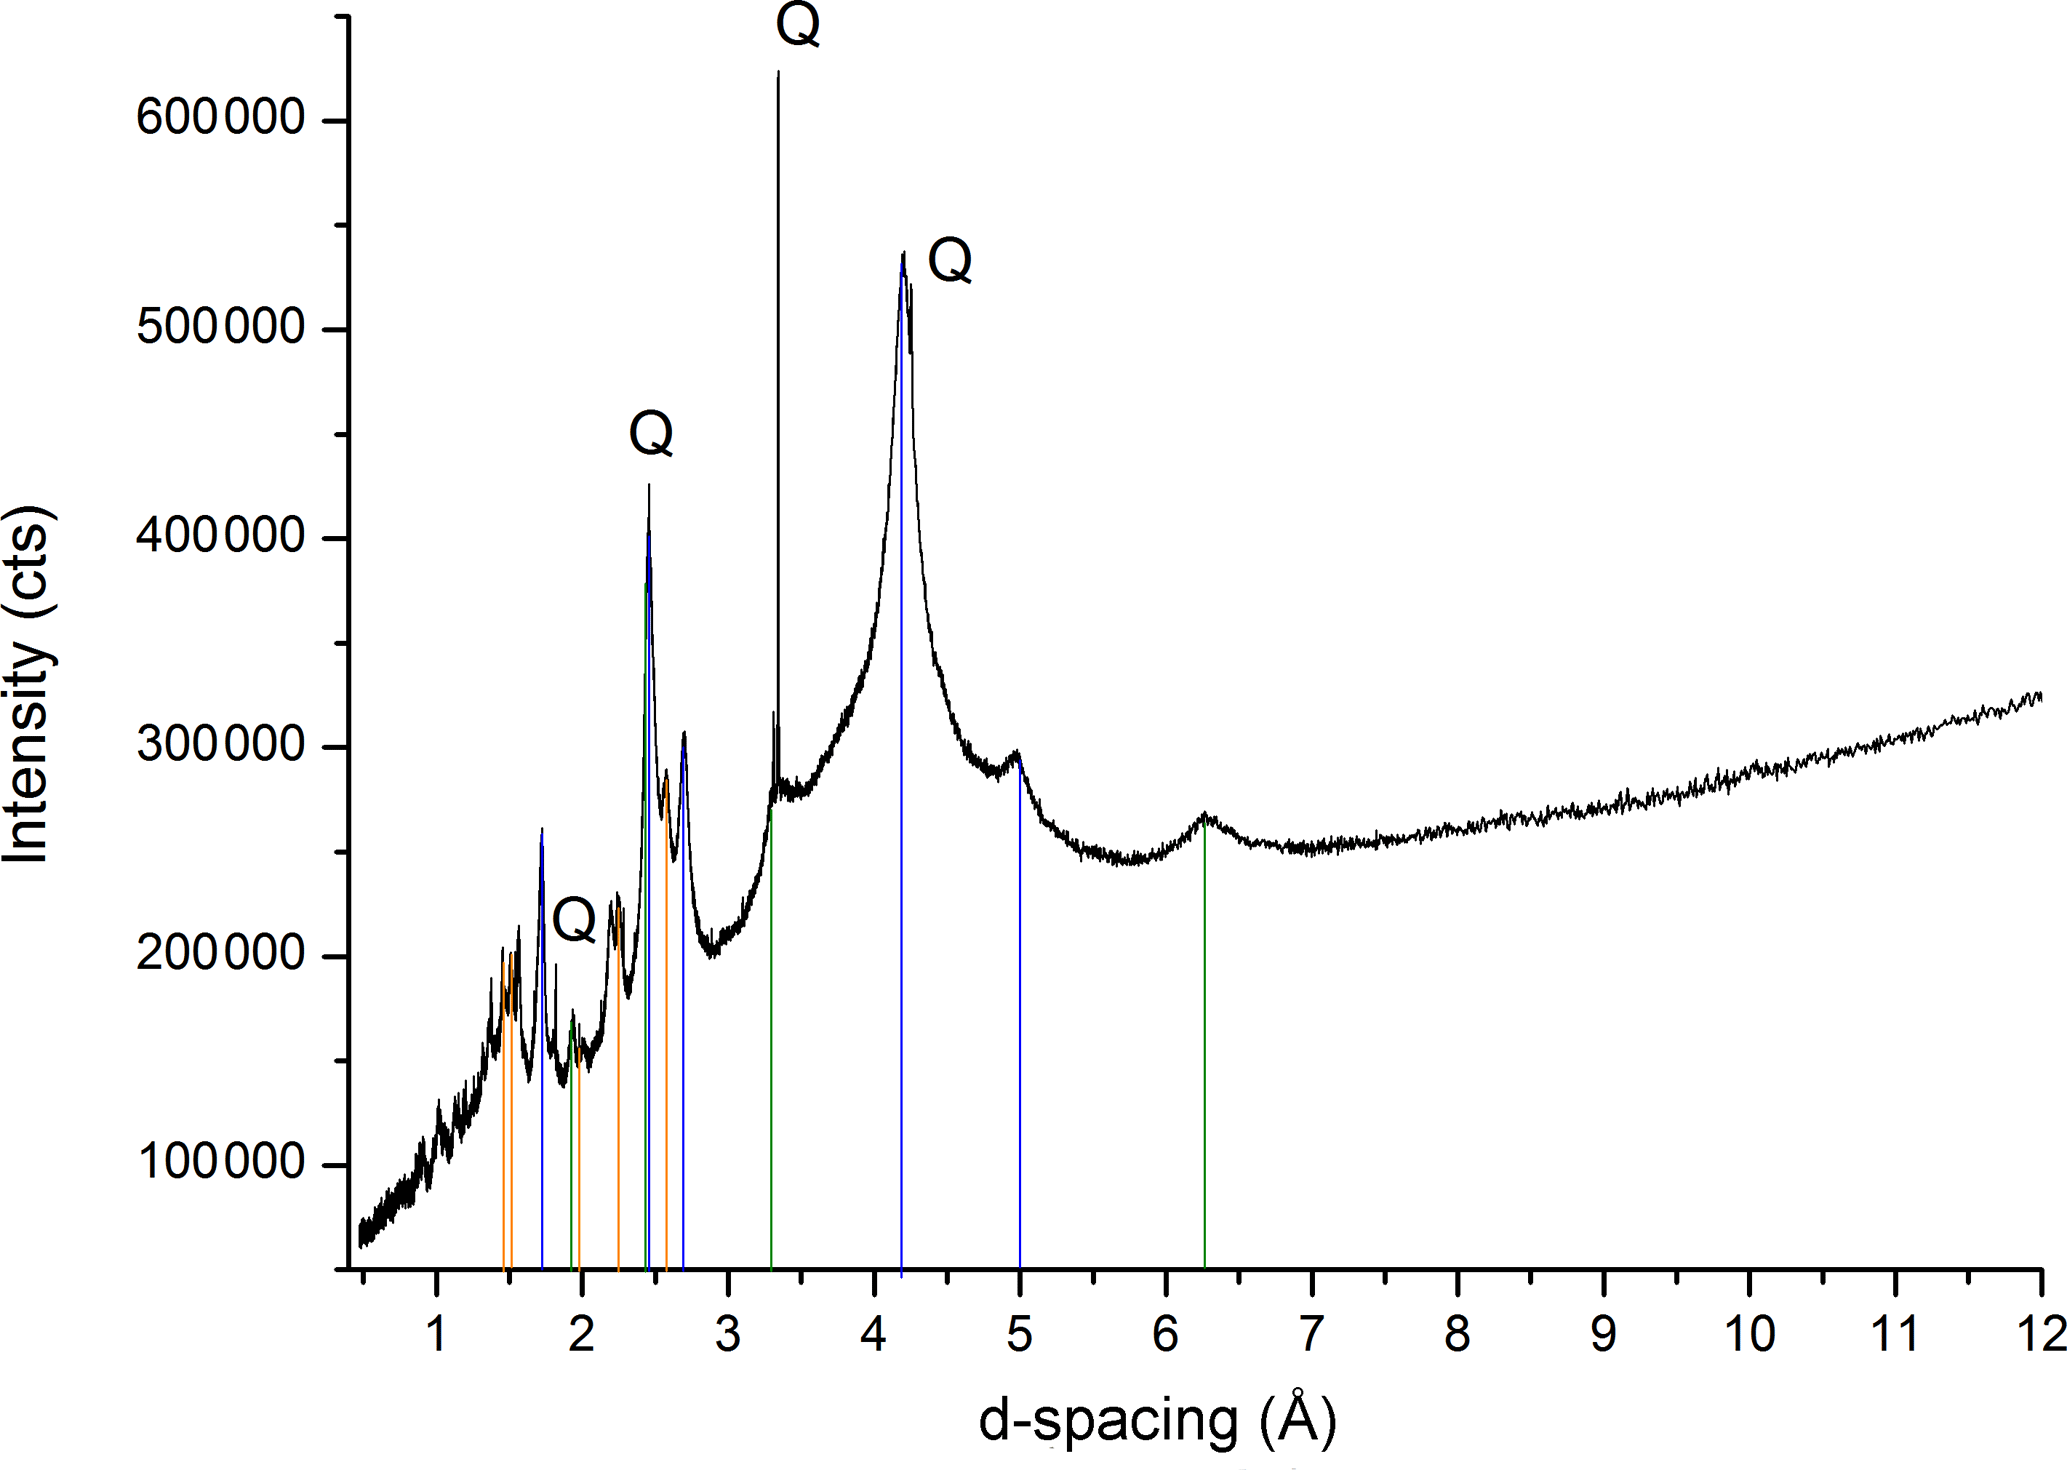
Figure 5The X-ray diffraction pattern of minerals within OC particles from mountain soil. Highly reactive Fe oxyhydroxides are identified and denoted with lines of different colors: ferrihydrite (ICDD 01-073-8408, orange), goethite (ICDD 01-073-6522, blue), and lepidocrocite (ICDD 00-044-1415, green). Q stands for Quartz (ICDD 00-033-1161). Details are included in Table S1.
3.3 Interplay of OC and minerals and C stabilization in the mountain soil
The nanoscale 3-D tomography in this study revealed a high heterogeneity within the natural OC–mineral consortium, and most of the particulate OC surface was coated by minerals. Natural OC exhibited strong organo-mineral association on its surface at the nanoscale (Fig. 4; Fig. SMOV3 https://doi.org/10.5446/36092; last access: 21 May 2018). Very few micron-sized or clay-sized, euhedral or crystalline minerals were observed. An abundance of SRO minerals in the form of subhedral particles or anhedral nano-aggregates/clusters had direct association with the boundary of OC, and developed a coating on the tracheid surface (Fig. 4b and c) (Mikutta et al., 2006). A sheet-like mineral coating was observed on the OC surface, in the form of dense and thin layers, which indicated possible origination from adsorption (Figs. 4b, S2). The densely packed mineral texture suggested significant physical protection on the OC surface (Kaiser and Guggenberger, 2007). The sorbed minerals not only provide physical protection, but can also shield OC from chemical weathering (Mikutta et al., 2006). The key working minerals for OC–mineral interplay are SRO mineral nanoparticles and poorly crystalline submicron-sized clay minerals, instead of crystalline clay-sized minerals. The other distinct texture is recognized as OC–mineral nano-aggregates/clusters, with either minerals in the core and OC around (Fig. S2), or vice versa (Fig. S3). This type of texture indicates possible OC–mineral co-precipitation at microsites (Fig. 4b). Many clusters of various shapes are observed (Fig. S3). Mineral aggregation by poorly crystalline nanoparticles renders natural sub-micron porosity, which may contribute to an elevation of sorption capacity in soil (Rawal et al., 2016).
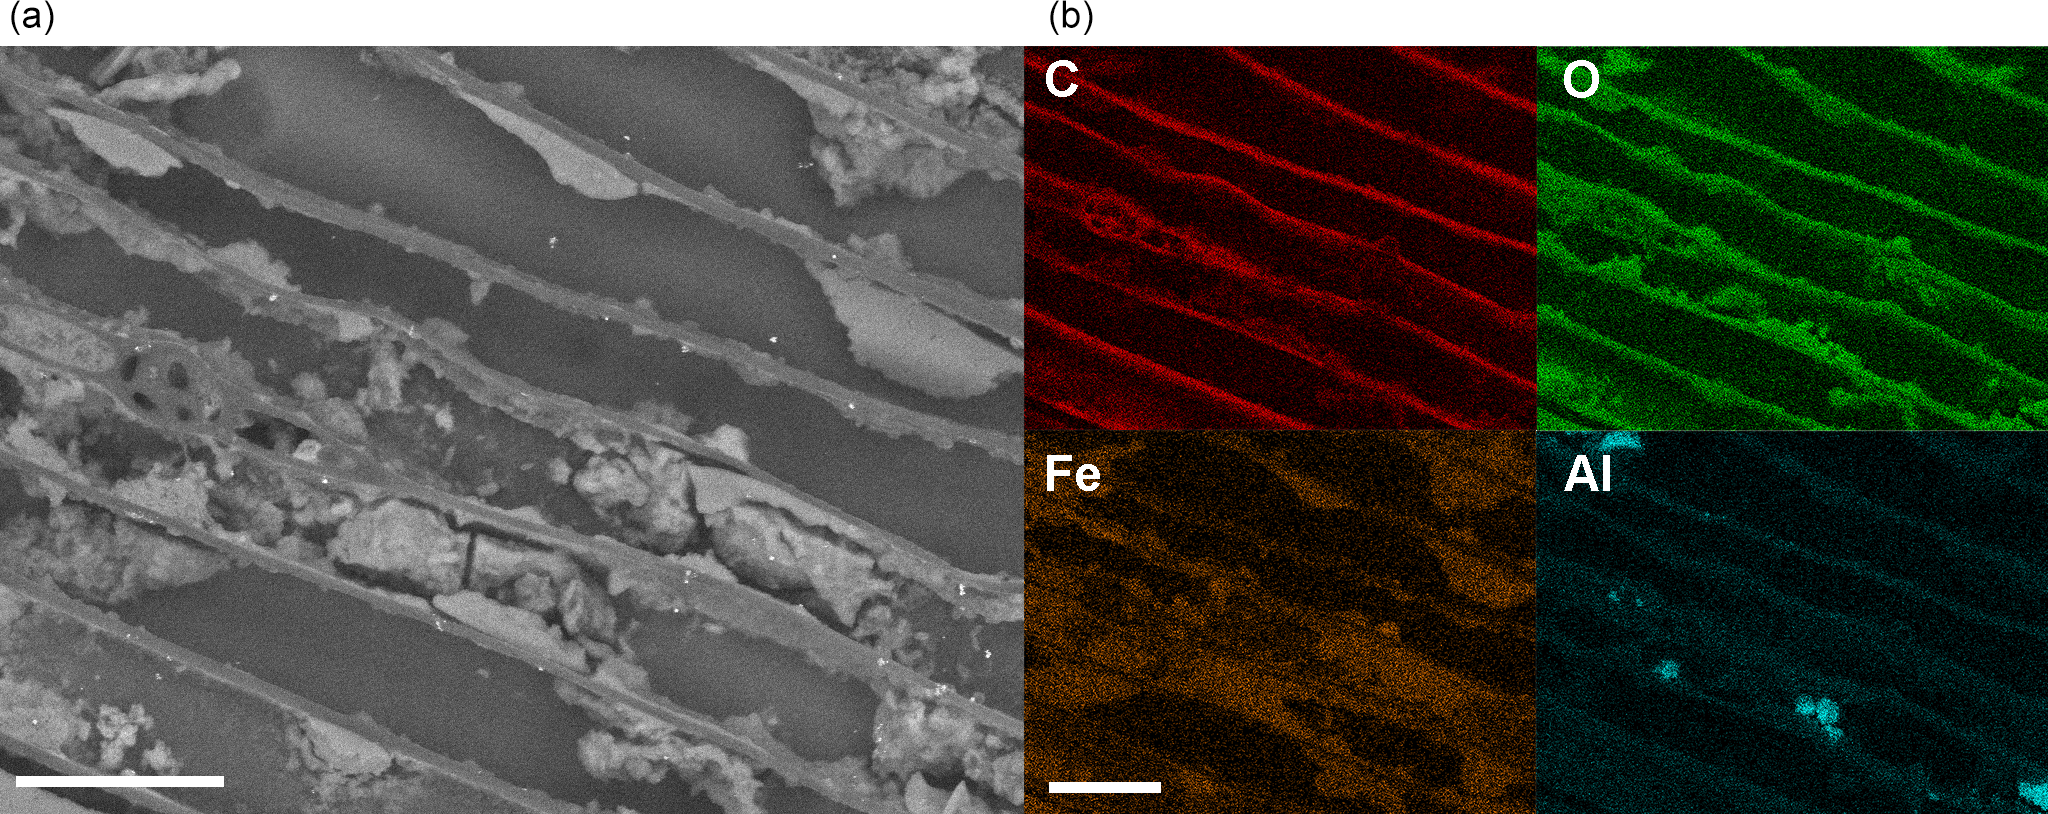
Figure 6Elemental mapping by SEM-EDS for the mineral-bearing OC from the mountain soil. (a) SEM backscattering image (The bright spots inside are gold nanoparticles for coating). (b) Elemental mapping of C, O, Fe, and Al. Scale bars are 20 µm.
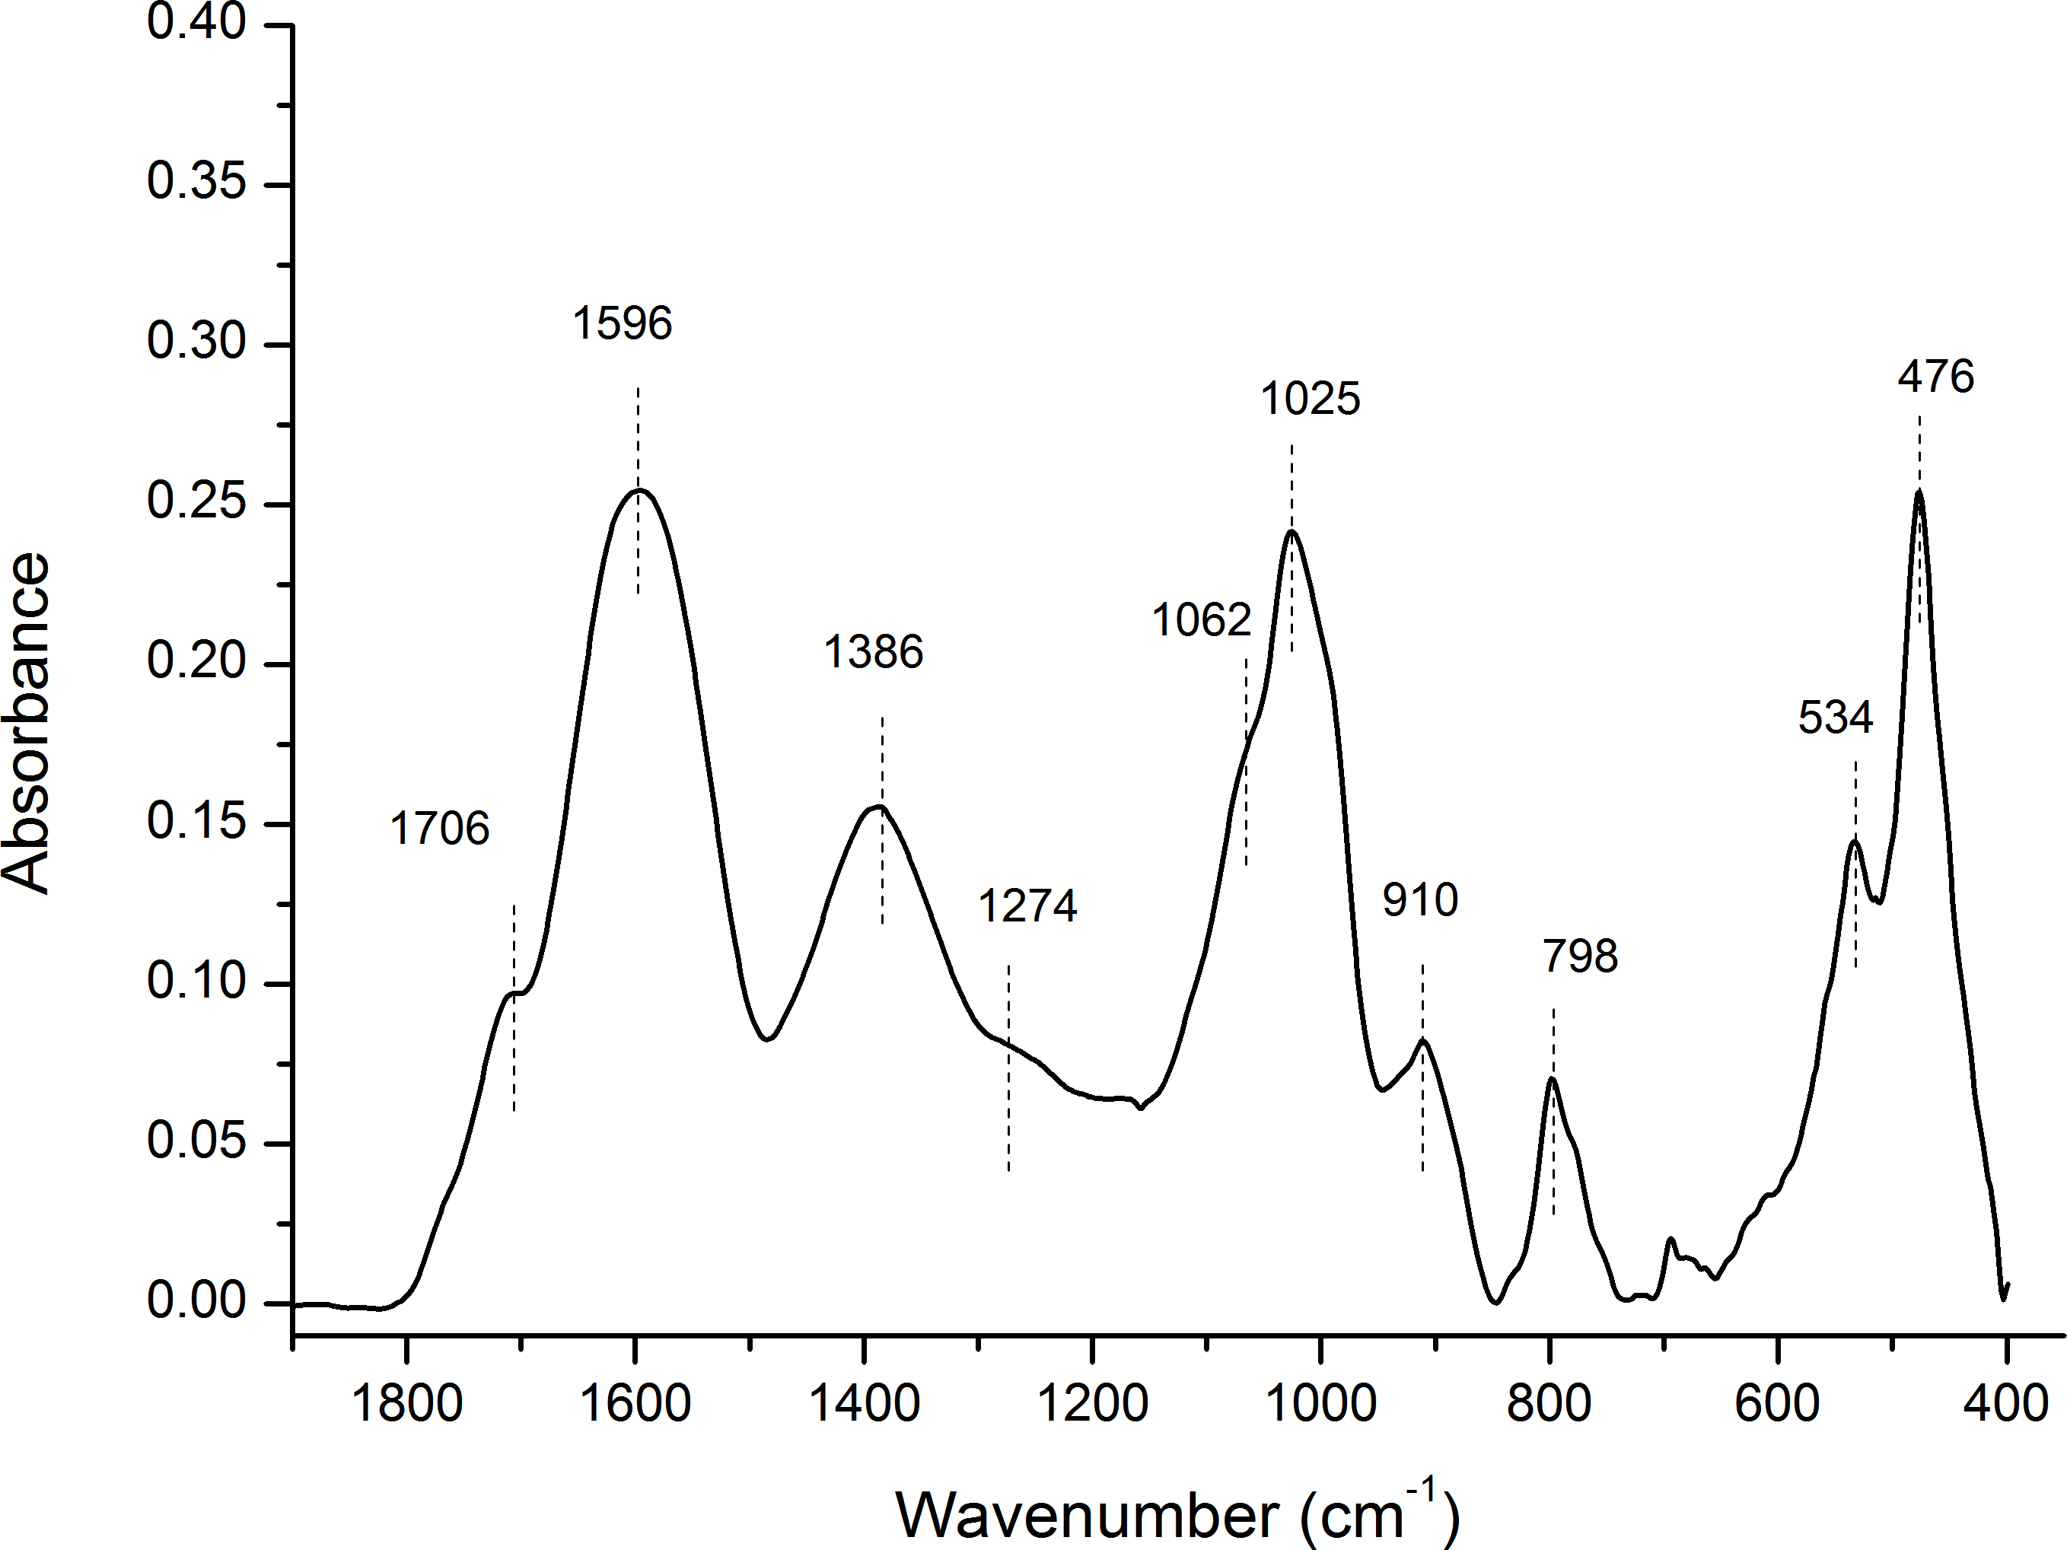
Figure 7The FTIR spectra for the chemistry of organo-mineral association. The aged OC is highly aromatic (1596 and 1386 cm−1), and highly reactive with obvious carboxyl functional group (1706 cm−1). The broad bands likely point to a significant degree of association between OC and minerals. Some minor bands near 1274, 1062, 1024, and 989 cm−1 indicate the lignin-derived nature of OC. The bands near 1025, 910, 798, 534, and 476 cm−1 have similar characteristics of soil inorganic/mineral matrix. More details are included in Table S2.
The high-resolution synchrotron-based X-ray diffraction confirmed the nature of associated minerals to be mainly SRO Fe oxyhydroxides, specifically ferrihydrite (ICDD 01-073-8408), goethite (ICDD 01-073-6522), lepidocrocite (ICDD 00-044-1415), and quartz (ICDD 00-033-1161) (Fig. 5; Table S1 in the Supplement). Quartz may be at most a minor component on the OC surface, considering their chemistry and particle size; however siliceous mineral surfaces may be coated with a veneer of hydrous Al- and Fe-oxides, which could confer a net positive charge and promote their reactivity in tropical environments (Chen et al., 2014a; Sposito, 1989).
Considering their large surface area and high reactivity, the abundant nano-sized Fe oxyhydroxides could play a significant role in the long-term stabilization of OC through chemical bonding and physical shielding (Eusterhues et al., 2005; Kaiser et al., 2002b; Kiem and Kogel-Knabner, 2002; Mikutta et al., 2006), and contribute to the longevity of OC in mountain environments. According to elemental mapping, aluminosilicates may also be present, however, their portion and crystallization levels should be low judging from their minimal signal in the XRD spectra (Figs. 5, 6). The primary minerals in mountain soil were quartz, amesite (kaolin–serpentine), and muscovite (Fig. S4); minimal Fe oxyhydroxides signal was observed. The mountain soil was not rich in Fe oxyhydroxides; however, the studied particulate organic C was rich in Fe oxyhydroxides. The key working minerals for physical protection and chemical stabilization of OC could be nano-sized SRO minerals in a soil that is not rich in Fe oxyhydroxides. The FTIR analyses demonstrated the chemistry of organo-mineral association (Fig. 7; Table S2). The aged OC is highly aromatic when it is highly reactive, similar to pyrogenic C that has been exposed to the natural environment (Liang et al., 2006). Broad bands are observed at 1596 cm−1 for aromatic C = C stretching and 1706 cm−1 for carboxylic νC = O stretching (Özçimen and Ersoy-Meriçboyu, 2010; Sharma et al., 2004). Both aromatic and carboxyl C functional groups normally have a high affinity with Fe (III) (Hall et al., 2016; Mikutta et al., 2007; Zhao et al., 2016). Broad bands likely indicate a significant degree of association between OC and minerals (Chen et al., 2016; Gu et al., 1994; Kaiser and Guggenberger, 2007). The sorption of OC to Fe oxyhydroxides through organo-mineral multiple complex bonds could occupy their reactive surface sites, and enhance their respective stabilization (Chorover and Amistadi, 2001; Cornell and Schwertmann, 2006; Hall et al., 2016; Kaiser and Guggenberger, 2007; Mikutta et al., 2007). For example, the discovery of SRO mineral ferrihydrite in air-dried and ground OC particles indirectly validates its stabilization due to organo-mineral interplay. It is difficult to accurately estimate ferrihydrite in dry soil samples due to its transient nature and the limitation of traditional extraction and spectroscopic methods (Cornell and Schwertmann, 2006). The phase of mineral in point-to-point direct contact with OC surface warrants future research at the nanoscale (Fig. SMOV3). In situ mineral mapping of different SRO minerals including Fe oxyhydroxide on OC surface may provide more insight into OC stabilization. Mineral physical protection on OC may represent the end stage of carbon stabilization, especially in weak leaching and weathering environments.
Our in situ description of organo-mineral interplay at nanoscale provides direct evidence on the importance of mineral physical protection for the long term stabilization of OC. Large amounts of ferrihydrite and other Fe oxyhydroxides were also found associated with lignin-like OC in soil under an aquic moisture regime (Eusterhues et al., 2011). The abundance of mineral nanoparticles, and the nature of their high heterogeneity and short-range-order, could be common in a humid environment; however, they may have been severely underestimated by traditional analysis methods such as electron microscopy, X-ray diffraction and fractionation approaches, which mainly focus on clay-sized minerals (Mikutta et al., 2005). We recommend future research explores the following: (1) whether it is a general phenomenon that the minerals interacting with OC surface are essentially mineral nanoparticle and submicron-sized clay minerals; and (2) whether the minerals for C stabilization are primarily nano-sized SRO minerals instead of clay-sized minerals in soils. Perspectives on C stabilization and saturation may be revolutionized once the role of SRO minerals is considered in modeling soil C dynamics, in addition to parameters such as clay type and content. We suggest that the modeling of SOC turnover should also include BC and pyrogenic OC into the biochemically protected pool, as such organic C can persist over millennia under natural exposure (Liang et al., 2008).
In summary we have developed a high-resolution 3-D tomography approach using dual-scan modes and successfully applied it to study the in situ interplay of OC and minerals in a laboratory-made and natural OC–mineral consortium at the nanoscale. We discovered that the stabilization of the 3500-year-old natural OC was mainly attributed to the physical protection of nano-sized Fe-containing mineral (Fe oxyhydroxides) and to the strong organo-mineral complexation. We provided in situ evidence and revealed an abundance of mineral nanoparticles, in dense thin layers or nano-aggregates/clusters, instead of crystalline clay-sized minerals on or near OC surfaces. The key working minerals for C stabilization were reactive SRO mineral nanoparticles and poorly crystalline submicron-sized clay minerals. Nanoscale 3-D tomography provides new insight into the mineral physical protection of OC in soil. This high-resolution 3-D tomography approach is a promising technique for probing the multi-interfacial features between OC and minerals in lab and field samples. It is also potentially a powerful tool for tracking the fate of nanoparticles including heavy metals in the natural environments.
Videos of the 3-D tomography for the Supplement Figs. SMOV1 (https://doi.org/10.5446/36090, Weng, 2018), SMOV2 (https://doi.org/10.5446/36091, Weng, 2018), and SMOV3 (https://doi.org/10.5446/36092, Weng, 2018) have been deposited in the TIB AV Portal, and DOIs have been assigned. .
The supplement related to this article is available online at: https://doi.org/10.5194/bg-15-3133-2018-supplement.
The authors declare that they have no conflict of interest.
We thank Dr. Chung-Ho Wang for his kind support; Ms. Hsueh-Chi Wang (TXM, TLS-BL01B01), Dr. Yao-Chang Lee and Ms. Pei-Yu Huang (FTIR, TLS-BL14A1), and Dr. Hwo-Shuenn Sheu and Dr. Yu-Chun Chuang (XRD, TPS-09A1) at the end-stations of NSRRC (Taiwan) for their technical support; Yoshiyuki Iizuka (Academia Sinica) for helping with the SEM-EDS analysis; Dr. Chih-Hsin Cheng (National Taiwan University) for the SC specimen; Dr. Yen-Hua Chen (NCKU, the department of Earth Sciences) for the TiO2 nanoparticles; and Dr. Chia-Chuan Liu, and the former and current members of the NCKU Global Change Geobiology Carbon Laboratory for help and support.
Biqing Liang and Chun-Chieh Wang acknowledge the funding support from Taiwan Ministry of
Science and Technology (MOST 102-2116-M-006-018-MY2, MOST
105-2116-M-006-010, and MOST 105-2112-M-213-001).
Edited by: Sébastien Fontaine
Reviewed by: two anonymous referees
Alexandre, A., Basile-Doelsch, I., Delhaye, T., Borshneck, D., Mazur, J. C., Reyerson, P., and Santos, G. M.: New highlights of phytolith structure and occluded carbon location: 3-D X-ray microscopy and NanoSIMS results, Biogeosciences, 12, 863–873, https://doi.org/10.5194/bg-12-863-2015, 2015.
Baldock, J. A. and Skjemstad, J. O.: Role of the soil matrix and minerals in protecting natural organic materials against biological attack, Org. Geochem., 31, 697–710, 2000.
Bond, T. C., Doherty, S. J., Fahey, D. W., Forster, P. M., Berntsen, T., DeAngelo, B. J., Flanner, M. G., Ghan, S., Karcher, B., Koch, D., Kinne, S., Kondo, Y., Quinn, P. K., Sarofim, M. C., Schultz, M. G., Schulz, M., Venkataraman, C., Zhang, H., Zhang, S., Bellouin, N., Guttikunda, S. K., Hopke, P. K., Jacobson, M. Z., Kaiser, J. W., Klimont, Z., Lohmann, U., Schwarz, J. P., Shindell, D., Storelvmo, T., Warren, S. G., and Zender, C. S.: Bounding the role of black carbon in the climate system: A scientific assessment, J. Geophys. Res.-Atmos., 118, 5380–5552, 2013.
Bousige, C., Ghimbeu, C. M., Vix-Guterl, C., Pomerantz, A. E., Suleimenova, A., Vaughan, G., Garbarino, G., Feygenson, M., Wildgruber, C., Ulm, F.-J., Pellenq, R. J. M., and Coasne, B.: Realistic molecular model of kerogen's nanostructure, Nat. Mater., 15, 572–582, 2016.
Chen, C., Dynes, J. J., Wang, J., Karunakaran, C., and Sparks, D. L.: Soft X-ray Spectromicroscopy Study of Mineral-Organic Matter Associations in Pasture Soil Clay Fractions, Environ. Sci. Technol., 48, 6678–6686, 2014a.
Chen, C. P., Cheng, C. H., Huang, Y. H., Chen, C. T., Lai, C. M., Menyailo, O. V., Fan, L. J., and Yang, Y. W.: Converting leguminous green manure into biochar: changes in chemical composition and C and N mineralization, Geoderma, 232, 581–588, 2014b.
Chen, K.-Y., Chen, T.-Y., Chan, Y.-T., Cheng, C.-Y., Tzou, Y.-M., Liu, Y.-T., and Teah, H.-Y.: Stabilization of Natural Organic Matter by Short-Range-Order Iron Hydroxides, Environ. Sci. Technol., 50, 12612–12620, 2016.
Chorover, J. and Amistadi, M. K.: Reaction of forest floor organic matter at goethite, birnessite and smectite surfaces, Geochim. Cosmochim. Ac., 65, 95–109, 2001.
Cornell, R. M. and Schwertmann, U.: The Iron Oxides: Structure, Properties, Reactions, Occurrences and Uses, Wiley, 2006.
Cusack, D. F., Chadwick, O. A., Hockaday, W. C., and Vitousek, P. M.: Mineralogical controls on soil black carbon preservation, Global Biogeochem. Cy., 26, GB2019, https://doi.org/10.1029/2011GB004109, 2012.
Eusterhues, K., Rumpel, C., and Kogel-Knabner, I.: Organo-mineral associations in sandy acid forest soils: Importance of specific surface area, iron oxides and micropores, Eur. J. Soil Sci., 56, 753–763, 2005.
Eusterhues, K., Wagner, F. E., Hausler, W., Hanzlik, M., Knicker, H., Totsche, K. U., Kogel-Knabner, I., and Schwertmann, U.: Characterization of ferrihydrite-soil organic matter coprecipitates by X-ray diffraction and Mossbauer spectroscopy, Environ. Sci. Technol., 42, 7891–7897, 2008.
Eusterhues, K., Rennert, T., Knicker, H., Kogel-Knabner, I., Totsche, K. U., and Schwertmann, U.: Fractionation of organic matter due to reaction with ferrihydrite: Coprecipitation versus adsorption, Environ. Sci. Technol., 45, 527–533, 2011.
Gu, B. H., Schmitt, J., Chen, Z. H., Liang, L. Y., and Mccarthy, J. F.: Adsorption and Desorption of Natural Organic-Matter on Iron-Oxide – Mechanisms and Models, Environ. Sci. Technol., 28, 38–46, 1994.
Hall, S. J., Silver, W. L., Timokhin, V. I., and Hammel, K. E.: Iron addition to soil specifically stabilized lignin, Soil Biol. Biochem., 98, 95–98, 2016.
Jeffery, S., Bezemer, T. M., Cornelissen, G., Kuyper, T. W., Lehmann, J., Mommer, L., Sohi, S. P., van de Voorde, T. F. J., Wardle, D. A., and van Groenigen, J. W.: The way forward in biochar research: Targeting trade-offs between the potential wins, GCB, Bioenergy, 7, 1–13, 2015.
Kaiser, K. and Guggenberger, G.: Sorptive stabilization of organic matter by microporous goethite: sorption into small pores vs. surface complexation, Eur. J. Soil Sci., 58, 45–59, 2007.
Kaiser, K., Eusterhues, K., Rumpel, C., Guggenberger, G., and Kogel-Knabner, I.: Stabilization of organic matter by soil minerals – Investigations of density and particle-size fractions from two acid forest soils, J. Plant Nutr. Soil Sci., 165, 451–459, 2002a.
Kaiser, K., Eusterhues, K., Rumpel, C., Guggenberger, G., and Kogel-Knabner, I.: Stabilization of organic matter by soil minerals – investigations of density and particle-size fractions from two acid forest soils, J. Plant Nutr. Soil Sci., 165, 451–459, 2002b.
Kiem, R. and Kogel-Knabner, I.: Refractory organic carbon in particle-size fractions of arable soils II: organic carbon in relation to mineral surface area and iron oxides in fractions < 6 µm, Org. Geochem., 33, 1699–1713, 2002.
Kinyangi, J., Solomon, D., Liang, B., Lerotic, M., Wirick, S., and Lehmann, J.: Nanoscale Biogeocomplexity of the Organomineral Assemblage in Soil, Soil Sci. Soc. Am. J., 70, 1708–1718, 2006.
Kleber, M., Sollins, P., and Sutton, R.: A conceptual model of organo-mineral interactions in soils: self-assembly of organic molecular fragments into zonal structures on mineral surfaces, Biogeochemistry, 85, 9–24, 2007.
Kravchenko, A. N., Negassa, W. C., Guber, A. K., and Rivers, M. L.: Protection of soil carbon within macro-aggregates depends on intra-aggregate pore characteristics, Sci. Rep., 5, 16261, https://doi.org/10.1038/srep16261, 2015.
Kuhlbusch, T. A. J.: Black carbon and the carbon cycle, Science, 280, 1903–1904, 1998.
Kuo, C.-H., Chu, Y.-T., Song, Y.-F., and Huang, M. H.: Cu2O Nanocrystal-Templated Growth of Cu2S Nanocages with Encapsulated Au Nanoparticles and In-Situ Transmission X-ray Microscopy Study, Adv. Funct. Mater., 21, 792–797, 2011.
Lafond, J. A., Han, L. W., and Dutilleul, P.: Concepts and analyses in the CT scanning of root systems and leaf canopies: A timely summary, Front. Plant Sci., 6, 1111, https://doi.org/10.3389/fpls.2015.01111, 2015.
Lehmann, J., Kinyangi, J., and Solomon, D.: Organic matter stabilization in soil microaggregates: implications from spatial heterogeneity of organic carbon contents and carbon forms, Biogeochemistry, 85, 45–57, 2007.
Lehmann, J., Solomon, D., Kinyangi, J., Dathe, L., Wirick, S., and Jacobsen, C.: Spatial complexity of soil organic matter forms at nanometre scales, Nat. Geosci., 1, 238–242, 2008.
Liang, B., Lehmann, J., Solomon, D., Kinyangi, J., Grossman, J., O'Neill, B., Skjemstad, J. O., Thies, J., Luizao, F. J., Petersen, J., and Neves, E. G.: Black carbon increases cation exchange capacity in soils, Soil Sci. Soc. Am. J., 70, 1719–1730, 2006.
Liang, B., Lehmann, J., Solomon, D., Sohi, S., Thies, J. E., Skjemstad, J. O., Luizão, F. J., Engelhard, M. H., Neves, E. G., and Wirick, S.: Stability of biomass-derived black carbon in soils, Geochim. Cosmochim. Ac., 72, 6069–6078, 2008.
Mikutta, R., Kleber, M., and Jahn, R.: Poorly crystalline minerals protect organic carbon in clay subfractions from acid subsoil horizons, Geoderma, 128, 106–115, 2005.
Mikutta, R., Kleber, M., Torn, M. S., and Jahn, R.: Stabilization of soil organic matter: Association with minerals or chemical recalcitrance?, Biogeochemistry, 77, 25–56, 2006.
Mikutta, R., Mikutta, C., Kalbitz, K., Scheel, T., Kaiser, K., and Jahn, R.: Biodegradation of forest floor organic matter bound to minerals via different binding mechanisms, Geochim. Cosmochim. Ac., 71, 2569–2590, 2007.
Özçimen, D. and Ersoy-Meriçboyu, A.: Characterization of biochar and bio-oil samples obtained from carbonization of various biomass materials, Renew. Energ., 35, 1319–1324, 2010.
Quin, P. R., Cowie, A. L., Flavel, R. J., Keen, B. P., Macdonald, L. M., Morris, S. G., Singh, B. P., Young, I. M., and Van Zwieten, L.: Oil mallee biochar improves soil structural properties-A study with x-ray micro-CT, Agr. Ecosyst. Environ., 191, 142–149, 2014.
Rasmussen, C., Torn, M. S., and Southard, R. J.: Mineral assemblage and aggregates control carbon dynamics in a California conifer forest, Soil Sci. Soc. Am. J., 69, 1711–1721, 2005.
Rawal, A., Joseph, S. D., Hook, J. M., Chia, C. H., Munroe, P. R., Donne, S., Lin, Y., Phelan, D., Mitchell, D. R. G., Pace, B., Horvat, J., and Webber, J. B. W.: Mineral–Biochar Composites: Molecular Structure and Porosity, Environ. Sci. Technol., 50, 7706–7714, 2016.
Schmidt, M. W. I.: Biogeochemistry: Carbon budget in the black, Nature, 427, 305–307, 2004.
Sharma, R. K., Wooten, J. B., Baliga, V. L., Lin, X., Geoffrey Chan, W., and Hajaligol, M. R.: Characterization of chars from pyrolysis of lignin, Fuel, 83, 1469–1482, 2004.
Six, J., Conant, R. T., Paul, E. A., and Paustian, K.: Stabilization mechanisms of soil organic matter: Implications for C-saturation of soils, Plant Soil, 241, 155–176, 2002.
Sollins, P., Kramer, M. G., Swanston, C., Lajtha, K., Filley, T., Aufdenkampe, A. K., Wagai, R., and Bowden, R. D.: Sequential density fractionation across soils of contrasting mineralogy: evidence for both microbial- and mineral-controlled soil organic matter stabilization, Biogeochemistry, 96, 209–231, 2009.
Solomon, D., Lehmann, J., Harden, J., Wang, J., Kinyangi, J., Heymann, K., Karunakaran, C., Lu, Y., Wirick, S., and Jacobsen, C.: Micro- and nano-environments of carbon sequestration: Multi-element STXM–NEXAFS spectromicroscopy assessment of microbial carbon and mineral associations, Chem. Geol., 329, 53–73, 2012.
Sposito, G.: The Chemistry of Soils, Oxford University Press, 1989.
Torn, M. S., Trumbore, S. E., Chadwick, O. A., Vitousek, P. M., and Hendricks, D. M.: Mineral control of soil organic carbon storage and turnover, Nature, 389, 170–173, 1997.
Vogel, C., Mueller, C. W., Hoschen, C., Buegger, F., Heister, K., Schulz, S., Schloter, M., and Kogel-Knabner, I.: Submicron structures provide preferential spots for carbon and nitrogen sequestration in soils, Nat. Commun., 5, 2947, https://doi.org/10.1038/ncomms3947, 2014.
Wang, C.-C., Song, Y.-F., Song, S.-R., Ji, Q., Chiang, C.-C., Meng, Q., Li, H., Hsiao, K., Lu, Y.-C., Shew, B.-Y., Huang, T., and Reisz, R. R.: Evolution and Function of Dinosaur Teeth at Ultramicrostructural Level Revealed Using Synchrotron Transmission X-ray Microscopy, Sci. Rep., 5, 15202, https://doi.org/10.1038/srep15202, 2015.
Wang, C. C., Chiang, C. C., Liang, B. Q., Yin, G. C., Weng, Y. T., and Wang, L. C.: Fast projection matching for X-ray tomography, Sci. Rep., 7, 3691, https://doi.org/10.1038/s41598-017-04020-0, 2017.
Weng, Y.-T: SMOV1 Video illustration extracted from 3-D absorption contrast tomography of lab-made BC and mineral nanoparticle consortium, https://doi.org/10.5446/36090, last access: 23 May 2018.
Weng, Y.-T: SMOV2 Video illustration extracted from 3-D phase contrast tomography of lab-made BC and mineral nanoparticle consortium, https://doi.org/10.5446/36091, last access: 23 May 2018.
Weng, Y.-T: SMOV3 Video illustration extracted from 3-D absorption contrast tomography of lab-made BC and mineral nanoparticle consortium, https://doi.org/10.5446/36092, last access: 23 May 2018.
Zbik, M. S., Frost, R. L., Song, Y. F., Chen, Y. M., and Chen, J. H.: Transmission X-ray microscopy reveals the clay aggregate discrete structure in aqueous environment, J. Colloid Interf. Sci., 319, 457–461, 2008.
Zhao, Q., Poulson, S. R., Obrist, D., Sumaila, S., Dynes, J. J., McBeth, J. M., and Yang, Y.: Iron-bound organic carbon in forest soils: quantification and characterization, Biogeosciences, 13, 4777–4788, https://doi.org/10.5194/bg-13-4777-2016, 2016.