the Creative Commons Attribution 4.0 License.
the Creative Commons Attribution 4.0 License.
 | 11 Jun 2018
Thermal acclimation of leaf photosynthetic traits in an evergreen woodland, consistent with the coordination hypothesis
Henrique Fürstenau Togashi
Iain Colin Prentice
Owen K. Atkin
Craig Macfarlane
Suzanne M. Prober
Keith J. Bloomfield
Bradley John Evans
Ecosystem models commonly assume that key photosynthetic traits, such as carboxylation capacity measured at a standard temperature, are constant in time. The temperature responses of modelled photosynthetic or respiratory rates then depend entirely on enzyme kinetics. Optimality considerations, however, suggest this assumption may be incorrect. The “coordination hypothesis” (that Rubisco- and electron-transport-limited rates of photosynthesis are co-limiting under typical daytime conditions) predicts, instead, that carboxylation (Vcmax) capacity should acclimate so that it increases somewhat with growth temperature but less steeply than its instantaneous response, implying that Vcmax when normalized to a standard temperature (e.g. 25 ∘C) should decline with growth temperature. With additional assumptions, similar predictions can be made for electron-transport capacity (Jmax) and mitochondrial respiration in the dark (Rdark). To explore these hypotheses, photosynthetic measurements were carried out on woody species during the warm and the cool seasons in the semi-arid Great Western Woodlands, Australia, under broadly similar light environments. A consistent proportionality between Vcmax and Jmax was found across species. Vcmax, Jmax and Rdark increased with temperature in most species, but their values standardized to 25 ∘C declined. The ci:ca ratio increased slightly with temperature. The leaf N : P ratio was lower in the warm season. The slopes of the relationships between log-transformed Vcmax and Jmax and temperature were close to values predicted by the coordination hypothesis but shallower than those predicted by enzyme kinetics.
- Article
(1211 KB) - Full-text XML
- BibTeX
- EndNote


Net photosynthetic CO2 uptake (Anet) depends on temperature in all vegetation models, but models commonly disregard possible acclimation of the parameters determining Anet to temporal variations in the growth environment. There are plenty of data on the instantaneous (minutes to hours) temperature responses of photosynthetic uptake (Hikosaka et al., 2006; Sage and Kubien, 2007; Way and Sage, 2008), but data on the responses of photosynthetic traits on ecologically relevant timescales (days to years) are scarce (Wilson et al., 2000; Lin et al., 2013). Nonetheless there is evidence that temperature responses of biochemical processes are a function of plant growth temperature, and not just instantaneous temperature, from studies comparing species (Miyazawa and Kikuzawa, 2006; Kattge and Knorr, 2007), to experiments or serial measurements on single species (Medlyn et al., 2002b; Onoda et al., 2005). Neglecting acclimation to the growth temperature could lead to incorrect model estimates of the responses of primary production and ecosystem carbon budgets to climate change.
Farquhar et al. (1980) provided the standard model to predict photosynthetic responses to the environment in C3 plants. The model describes photosynthesis as instantaneously determined by the slower of two biochemical rates: the carboxylation of RuBP (ribulose-1,5-bisphosphate), which is dependent on Rubisco (ribulose-1,5-bisphosphate carboxylase/oxygenase) activity (Vcmax), and electron transport for RuBP regeneration in the Calvin cycle, which is dependent on light intensity and (at high light intensity) limited by the capacity of the electron transport chain (Jmax). Both rates are influenced by intercellular CO2 concentration (ci), which in turn is partially regulated by stomatal conductance (gs). Unlimited mesophyll conductance (Miyazawa and Kikuzawa, 2006; Lin et al., 2013) remains the most common implementation of the Farquhar model: apparent Vcmax and Jmax values can be calculated from A-ci curves under this assumption provided KC and KO (the Michaelis–Menten coefficients for carboxylation and oxygenation, respectively) are appropriately specified. Vcmax and Jmax are highly variable both within and between species (Wullschleger, 1993), ranging through 2 to 3 orders of magnitude. Despite the accepted importance of these parameters for predicting rates of net CO2 exchange in natural ecosystems, a full understanding of how changes in the environment affect these quantities is lacking.
The “coordination hypothesis” (Chen et al., 1993; Field and Mooney, 1986; Maire et al., 2012) predicts that values of Vcmax and Jmax should acclimate, in time as well as in space, in such a way that carboxylation and RuBP regeneration are co-limiting under average daytime conditions. This has been suggested often in the literature, both as a prediction based on optimality considerations (e.g. Von Caemmerer and Farquhar, 1981; Dewar, 1996; Haxeltine and Prentice, 1996) and as an empirical observation, consistent with the finding that carboxylation is a limiting factor at saturating light intensity as has been shown to apply in the great majority of cases (De Kauwe et al., 2015). The coordination hypothesis makes a number of testable predictions regarding photosynthetic properties of woody plants experiencing large seasonal variations in growth temperature, including an increase in Vcmax with rising growth temperature because at higher daily temperatures, somewhat greater Rubisco activity is required to match any given rate of photosynthesis. On the other hand, it predicts that the value of Vcmax normalized to 25 ∘C – and with it, the leaf N per unit area (Maire et al., 2012; Dong et al., 2017) – should decline with increasing daily average temperature, because the quantities of proteins needed to maintain a given level of photosynthetic activity decline more steeply with temperature than does the predicted increase in Vcmax. These predictions were strongly supported by experiments on tree species grown at different temperatures (Scafaro et al., 2017). Scafaro et al. (2017) also demonstrated that the acclimation of Vcmax involves changes in the Rubisco amount and the relative allocation of leaf N to Rubisco. If it is further assumed that Jmax covaries closely with Vcmax, as is commonly observed, then similar predictions apply to the acclimation of Jmax. Wang et al. (2017) have provided a fuller treatment of Jmax acclimation, based on a cost-minimizing principle that also correctly predicts the dependence of the ratio Jmax∕Vcmax on growth temperature (Kattge and Knorr, 2007; Wang et al., 2017). Note that the coordination hypotheses as presented here is the strong form of the hypothesis, which allows the metabolic component of leaf N to be optimized – thus differing from an alternative interpretation, in which leaf N remains constant and only the Jmax∕Vcmax ratio is allowed to vary (Medlyn, 1996; Ali et al., 2016; Quebbeman and Ramirez, 2016).
Rdark (leaf respiratory CO2 release in darkness) is known to acclimate to temperature, although little is known about how this might be linked to the coordination hypothesis. Acclimation results in Rdark being of similar magnitude in plants grown at different temperatures when measured at their respective growth temperatures (Larigauderie and Körner, 1995; Atkin and Tjoelker, 2003) and also results in Rdark at 25 ∘C, increasing upon cold acclimation and declining upon acclimation to warmer temperature (Reich et al., 2016). Growth temperature-dependent changes in Rdark at a standard temperature can occur over periods of 1–3 days (Atkin et al., 2000; Bolstad et al., 2003; Lee et al., 2005; Zaragoza-Castells et al., 2007; Armstrong et al., 2008). A data synthesis of global patterns in Rdark (Atkin et al., 2015) showed that geographic variation in Rdark at growth temperature from the tropics to the tundra is much smaller than would be expected on the basis of enzyme kinetics. In that study, leaf Rdark at standard temperature was shown to increase with decreasing growth temperature at a global scale (Atkin et al., 2015). Observed global patterns in Rdark are consistent with the acclimation of Rdark to global patterns in growth temperature (Slot and Kitajima, 2015; Vanderwel et al., 2015).
Many ecosystem models assume optimality criteria for stomatal behaviour, in which carbon assimilation is traded off against water loss. Prentice et al. (2014) provided field evidence supporting the least-cost hypothesis, stating that plants adopt an optimal ci:ca ratio that minimizes the combined costs per unit carbon assimilation of maintaining the capacities for carboxylation (Vcmax) and water transport. This hypothesis predicts that the ci:ca ratio should increase with temperature due to lower water viscosity (reducing water costs) and higher photorespiration (increasing carboxylation costs) (Prentice et al., 2014) while declining with vapour pressure deficit (VPD) due to increasing water costs (Prentice et al., 2011).
In the current study, we present leaf-level measurements carried out during the warm and the cool seasons in the semi-arid environment of the Great Western Woodlands of south-western Australia. By sampling during both seasons, we were able to compare observations under broadly overlapping light conditions but at contrasting temperatures. We are not aware of any previous study that has tested whether seasonal temperature acclimation is consistent with the coordination hypothesis. We explore the idea by comparing the field-observed relationships of each trait to temperature with the theoretical acclimation of photosynthetic traits (as predicted by the coordination hypothesis) and with the alternative, i.e. the relationship of each trait to temperature to be expected if it were controlled only by enzyme kinetics (no acclimation).
2.1 Site
Eight representative woody species were studied at the Great Western Woodlands SuperSite (17∘07′ S, 145∘37′ E) approximately 70 km north-west of Kalgoorlie, Western Australia. The area has a semi-arid climate and the vegetation is a well-preserved mosaic of temperate woodland, shrubland and mallee. The mean annual precipitation (MAP) during 1970–2013 was 380 mm (Hutchinson, 2014c). The average precipitation is slightly higher during summer months, but this rain often falls during short periods as intense storms. Mean annual temperature (MAT) is 20 ∘C (Hutchinson, 2014a, b). Mean monthly daily temperature minima range between 6 and 18 ∘C and maxima between 17 and 35 ∘C. The area is not prone to large shifts in temperature or VPD within days (e.g. cold fronts). Data for daily temperature and short-wave radiation were obtained from the flux tower (TERN Ozflux, http://www.ozflux.org.au, last access: 21 May 2018). All trees were sampled within a 5 km radius from the tower. The species studied were the angiosperm trees Eucalyptus clelandii, E. salmonophloia, E. salubris and E. transcontinentalis and the shrub Eremophila scoparia; the nitrogen-fixing leguminous tree Acacia aneura and shrub A. hemiteles; and one gymnosperm tree, Callitris columellaris. All are evergreen.
2.2 Gas exchange measurements
We measured 109 A-ci curves altogether during the warm season (late March–early April) and the cool season (late August–early September). The same individual plants were sampled in both seasons. A portable infrared gas analyser system (LI-6400; Li-Cor, Inc., Lincoln, NB, USA) was used. Sunlit terminal branches from the top one-third of the canopy were collected and immediately re-cut under water (Domingues et al., 2010). One of the youngest fully expanded leaves, attached to the cut branch, was placed in the leaf chamber. Measurements in the field were taken with the chamber block temperature close to the air ambient temperature. The CO2 partial pressure in the chamber for the A-ci curves proceeded stepwise down from 400 to 35, back to 400 and then up to 2000 µmol mol−1. Prior to the measurements, we tested plants to determine appropriate light-saturation levels. The photosynthetic photon flux density (PPFD) adopted for measurement ranged between 1500 and 1800 µmol m−2 s−1. After measuring the A-ci curves over about 35 min, light was set to zero for 5 min before measuring Rdark. This was a time-saving compromise to allow four or five replicate curves per machine per day, based on our experience that stable results are commonly obtained after 5 min. Moreover, this quick estimate should still be superior to the common practice of deriving Rdark as one of the parameters in a curve-fitting routine. Following Domingues et al. (2010), we discarded 23 A-ci curves in which stomatal conductance declined to very low levels, resulting in 86 curves being used in further analyses. TPU (triose phosphate utilization) limitation (Sharkey et al., 2007) was not considered, as it would be unlikely to occur at our field temperatures of above 17 ∘C.
In theory optimal growth temperature (Topt) could affect the calculation of Vcmax and Jmax. However, Medlyn et al. (2002b) and Kattge and Knorr (2007) have found very good correlations between Topt and mean daily temperature; and we measured A-ci curves between morning and early afternoon, avoiding the hottest part of the day. Therefore, it is unlikely that any measurements were carried out above the optimum temperature.
The primary data are available via the TERN SuperSites Data Portal (Prober et al., 2015). Reported ratios of ci:ca relate to chamber conditions, with ambient CO2 ≈ 400 µmol mol−1.
2.3 Photosynthetic parameters and their temperature responses
Apparent values of Vcmax and Jmax were fitted using the Farquhar et al. (1980) model. Values were standardized to 25 ∘C (Vcmax 25 and Jmax25) using the in vivo temperature dependencies given in Bernacchi et al. (2001, 2003). Following Bernacchi et al. (2009), we used the Arrhenius equation to describe the kinetic temperature responses of Vcmax and Jmax:
where ΔHa is the activation energy (J mol−1), R is the universal gas constant (8.314 J mol−1 K−1), Tref is a reference temperature and T is the leaf temperature (K). To derive Rdark25 we applied a temperature-dependent Q10 (fractional change in respiration with a 10 ∘C increase in temperature) equation in which Q10 declines with increasing leaf temperature (Atkin and Tjoelker, 2003):
where 3.09 and 0.04 are empirical constants, TCref= 25 ∘C and TC is leaf temperature (∘C).
2.4 Nutrient analyses
After completion of each A-ci curve, leaves were retained to determine leaf area, dry mass, and mass-based nitrogen (N) and phosphorus (P) concentrations (mg g−1). Leaves were sealed in plastic bags containing moist tissue paper to prevent wilting. Leaf area was determined using a 600 dots/inch flatbed top-illuminated optical scanner and Image J software (http://imagej.nih.gov/ij/, last access: 1 April 2016). Leaves were dried in a portable desiccator for 48 h, to be preserved until the end of the campaign. Subsequently, in the laboratory, leaves were oven-dried for 24 h at 70 ∘C and the dry weight was determined (Mettler-Toledo Ltd, Port Melbourne, Victoria, Australia). Leaf mass per unit area (LMA; g m−2) was calculated from leaf area and dry mass. Nmass and Pmass were obtained by Kjeldahl acid digestion of the same leaves (Allen et al., 1974). The leaf material was digested using 98 % sulfuric acid and 30 % hydrogen peroxide. Digested material was analysed for N and P using a flow injection analyser system (LaChat QuikChem 8500 Series 2, Lachat Instruments, Milwaukee, WI, USA). Area-based N and P values (Narea, Parea, mg m−2) were calculated as the products of LMA and Nmass or Pmass.
2.5 Statistical analyses
All statistics were performed in R (R Core Team, 2012). For graphing we used the ggplot2 package (Wickham, 2010). Vcmax, Vcmax 25, Jmax, Jmax25, Rdark, Rdark25, Narea and Parea data were naturally log-transformed to approximate a normal distribution of values. Log-transformation of the photosynthetic parameters has the added advantage that the slopes of log-transformed values with respect to temperature are expected to be approximately linear due to the exponential nature of biochemical temperature dependencies generally. The ratio ci:ca, however, was not transformed because of its small variance and approximately normal distribution in this study. Linear regression was used to test dependencies among the parameters. Slopes and elevations of regressions were compared using standardized major axis regression with the smatr package (Warton et al., 2006). The Welch two-sample t test was used to test pairwise differences in traits (e.g. differences between the warm season and the cool season measurements). Generalized linear models (GLMs) were used to test acclimation to temperature across species, with temperature as the single quantitative predictor and species as a factor.
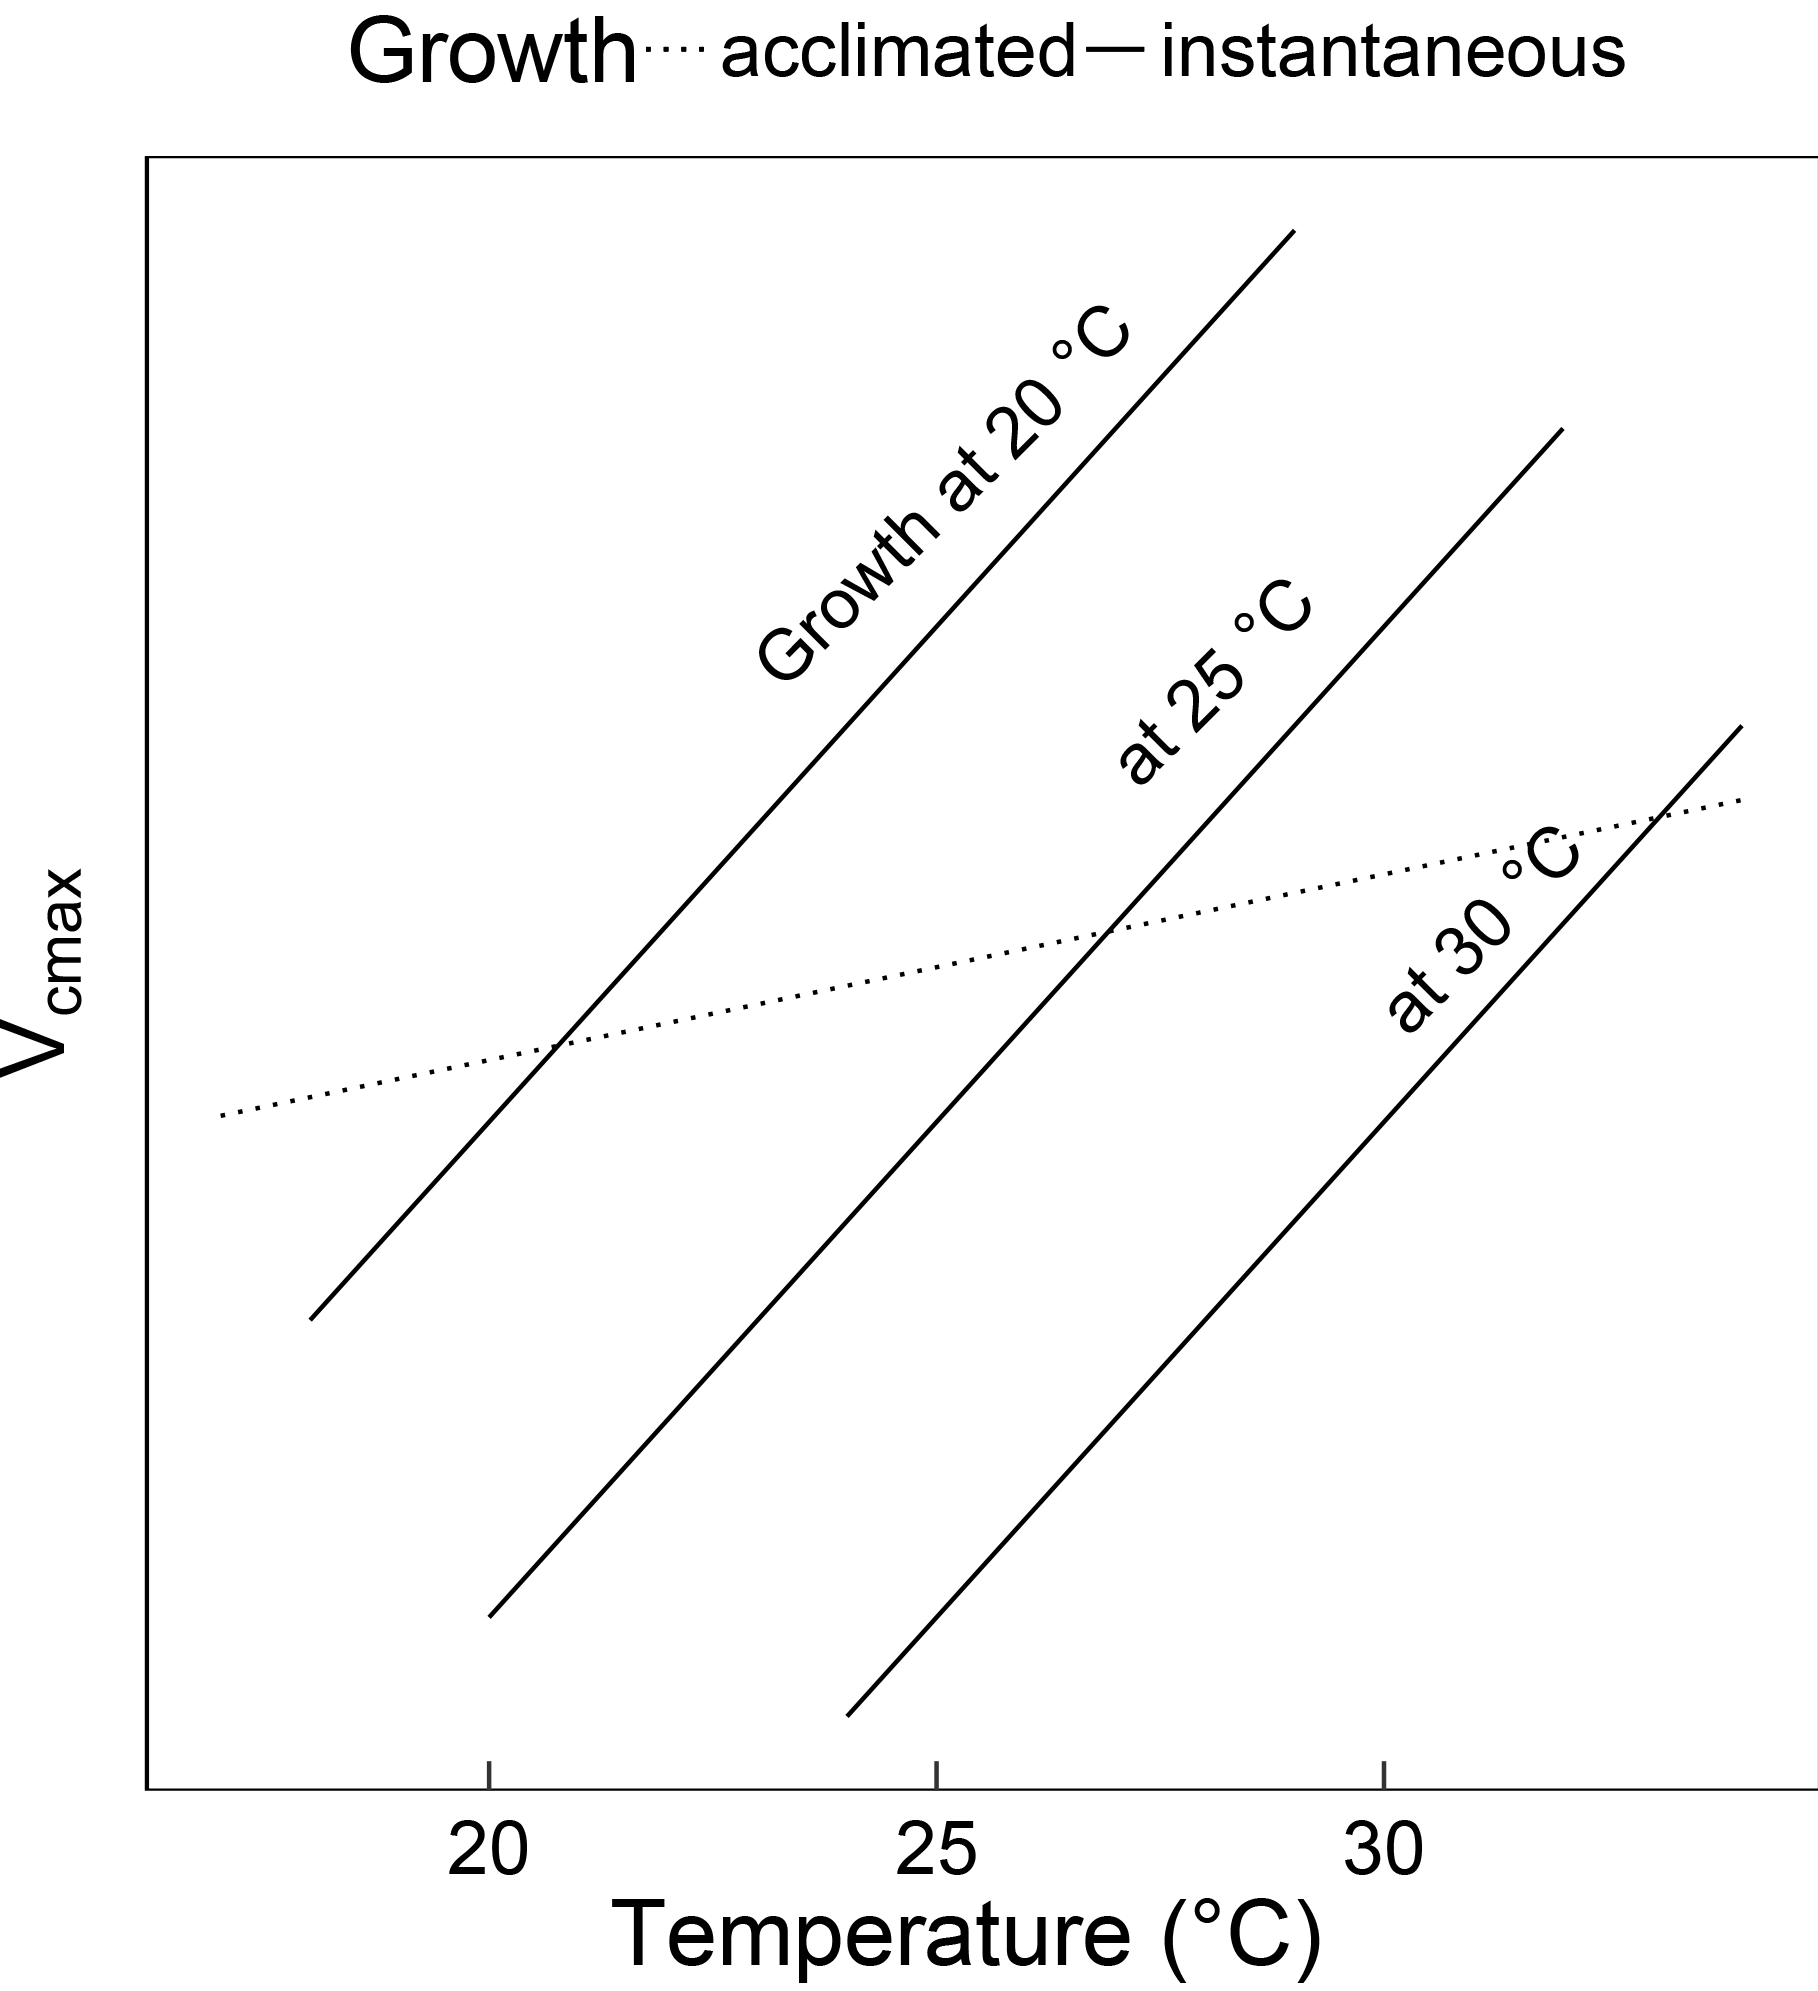
Figure 1Schematic showing the difference between instantaneous and acclimated Vcmax as predicted by the coordination hypothesis. The three solid lines indicate the instantaneous response of Vcmax to temperature for plants grown at 20, 25 and 30 ∘C under identical light conditions. The dashed line indicates the predicted response of field-measured (acclimated) Vcmax to the growth temperature. The instantaneous responses are due to enzyme kinetics, whereas the acclimated response is due to the slightly higher Vcmax required to compensate for increased photorespiration at higher temperatures. Because the acclimated response is shallower than the instantaneous response, Vcmax at a common temperature (e.g. 25 ∘C) declines with growth temperature.
2.6 Comparison of observed and predicted responses to temperature
Regression slopes of each naturally log-transformed variable to temperature (obtained using species as a factor, to control for differences in the magnitudes of values for different species) were compared with theoretically derived values based on alternative hypotheses: (a) based on enzyme kinetics (without acclimation), and (b) based on the coordination hypothesis for Vcmax (Fig. 1), Jmax and Rdark and the least-cost hypothesis for ci:ca. “Kinetic” temperature responses were predicted from Eq. (1), which can also be written as follows:
which in turn is well approximated by linearizing around Tref:
where . Thus, the kinetic slopes of ln param (T) vs. T can be predicted from Eq. (4) and compared directly with the fitted slopes obtained with a GLM. We set Tref= 298 K (which is both conventional and close to the median measurement temperature in our data set). We applied ΔHa values based on in vivo measurement at 25 ∘C by Bernacchi et al. (2001) for Vcmax (65 330 J mol−1 K−1). For Jmax, we used the ΔHa value based on in vivo measurements by Bernacchi et al. (2003) on plants that had been grown at 25 ∘C (43 900 J mol−1 K−1). For Rdark, we used a value of ΔHa (50 230 J mol−1 K−1) calculated from Eq. (2). Although ΔHa values can vary among species and with temperature (Von Caemmerer, 2000), for simplicity we adopted the same ΔHa for all species and temperatures. This approximation could affect interspecies comparisons of ΔHa-dependent parameters but should not interfere with the comparison of theoretical and fitted slopes.
The “acclimated” response of Vcmax according to the coordination hypothesis was predicted by setting the Rubisco- and electron-transport-limited rates of photosynthesis to be equal. To simplify matters, we disregarded the curvature of the response of electron transport to PPFD at values below the point of Rubisco limitation, giving
where φ0 is the intrinsic quantum efficiency of photosynthesis, Iabs is the absorbed PPFD, K is the effective Michaelis–Menten coefficient for carbon fixation and Γ∗ is the photorespiratory compensation point. The theoretical (acclimated) sensitivity of Vcmax to temperature was then calculated from the derivative of Eq. (5):
We evaluated Eq. (6) at T= 298 K and ci= 200 µmol mol−1 (approximately the median of our observed values of ci), using the temperature dependencies of K and Γ∗ from Bernacchi et al. (2001). The temperature dependency of K was determined from those of the constituent terms KC and KO (the Michaelis–Menten coefficients for carboxylation and oxygenation, respectively) (Wang et al., 2017). We estimated the theoretical acclimated slope for Jmax as being the acclimated slope of Vcmax, minus the difference between the kinetic slopes of Vcmax and Jmax; this is equivalent to assuming that the ratio of Jmax to Vcmax at 25 ∘C is constant. We further assumed that Rdark (on acclimation) should be an invariant fraction of Vcmax, implying the same acclimated temperature response for Rdark as for Vcmax.
The least-cost hypothesis (Prentice et al., 2014) provides an optimal value for ci:ca, denoted by χo, such that
where b is the (assumed constant) ratio of Rdark to Vcmax and a is the cost of maintaining the water-transport pathway. Both K and a are temperature-dependent (a because it is proportional to the viscosity of water, η). Holding vapour pressure deficit (D) constant, we obtained an expression for ,
and from Eqs. (7) and (8),
We evaluated Eq. (9) at T= 298 K, χo= 0.5 and ca= 400 ppm using the known temperature dependencies of K and η.
3.1 Relationships among photosynthetic parameters
When measured at near-ambient air temperature, species-average Vcmax values ranged across seasons from 44.4 to 105 µmol m−2 s−1, Jmax from 77.4 to 160 µmol m−2 s−1, Rdark from 1.16 to 3.14 µmol m−2 s−1 and ci:ca from 0.39 to 0.60 (at ambient CO2 ≈ 400 µmol mol−1). At the prevailing air temperatures, Vcmax, Jmax and Rdark were systematically higher in the warm season, while their values standardized to 25 ∘C were higher in the cool season (Fig. 2). The ci:ca ratio also exhibited significantly higher average values in the warm season for six out of eight species (not shown).
Vcmax and Jmax were closely correlated across species within and across seasons (Fig. 3). The warm and the cool season regression equations relating Vcmax and Jmax were significant and statistically indistinguishable. The warm and the cool season slopes of regressions forced through the origin are shown in Fig. 3. (We show regressions through the origin here because the intercept (a) is extrapolated well beyond the range of the data, and (b) has no clear biological meaning.) Regressions between Vcmax and Jmax for the warm and the cool seasons together yielded Jmax= 0.84 Vcmax+ 55.2 (p < 0.05, slope standard error = ±0.2). There were positive correlations between Rdark25 and both Vcmax and Jmax across seasons, as well as strong negative correlations between species-average ci:ca ratios and both Vcmax and Jmax across seasons (Fig. 4). Log-transformed Rdark was only correlated to Vcmax and Jmax (p < 0.05) for the individual species E. salmonophloia and C. columellaris.
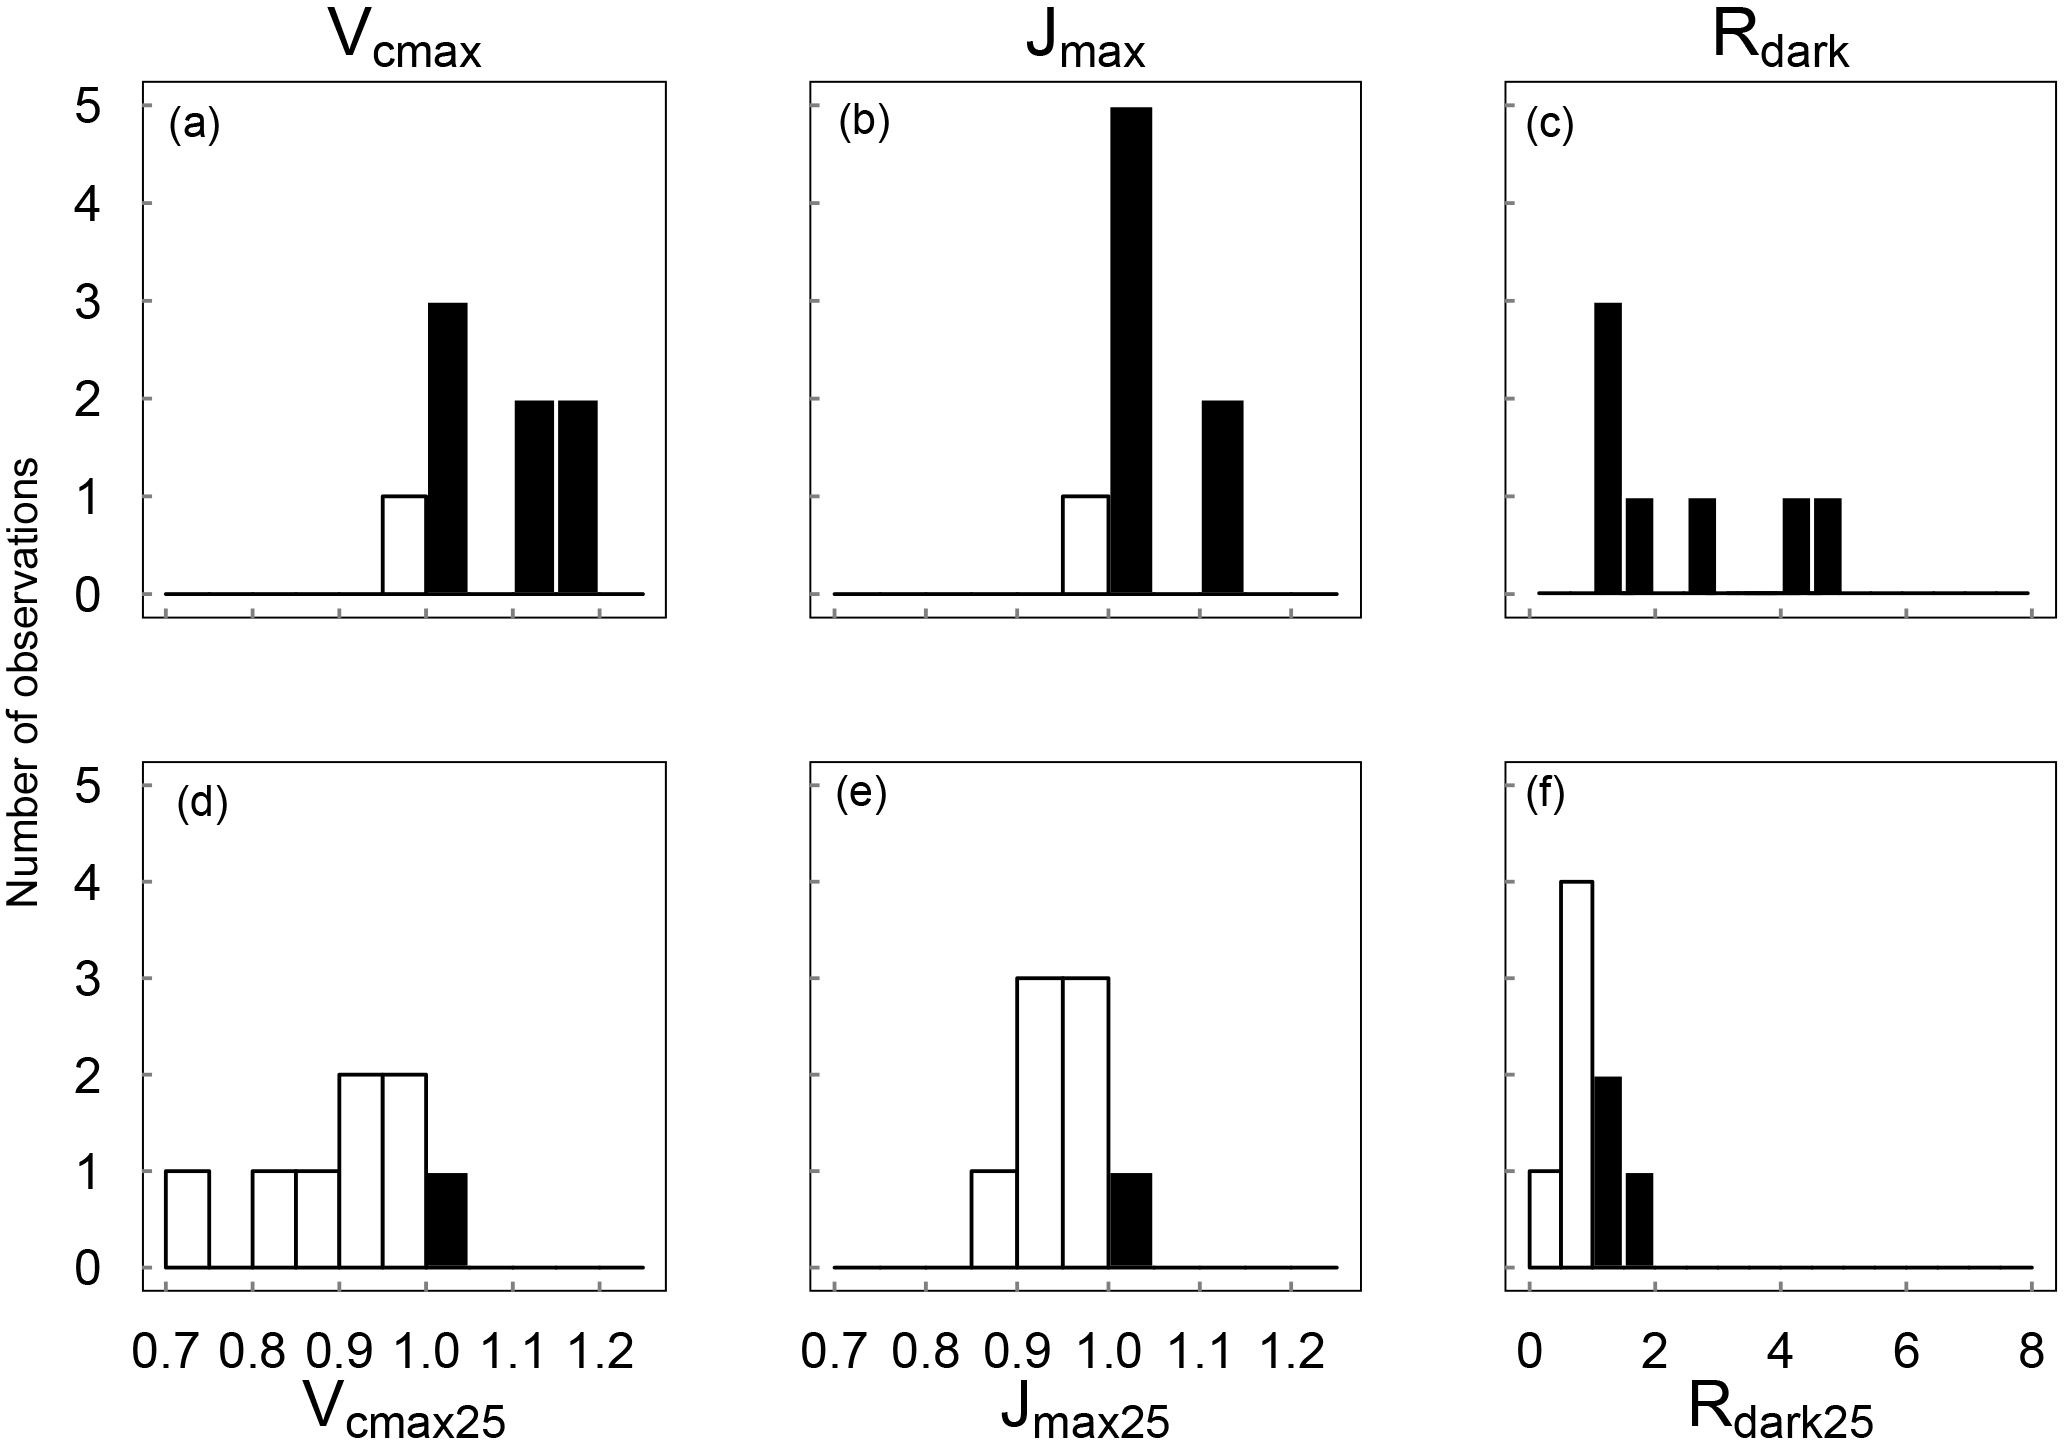
Figure 2Distributions across species of the warm : cool season ratios of Vcmax, Jmax and Rdark measured at ambient temperature (a–c) and standardized to 25 ∘C (d–e). Ratios > 1 are shown as black bars and ratios < 1 as white bars (n= 8).
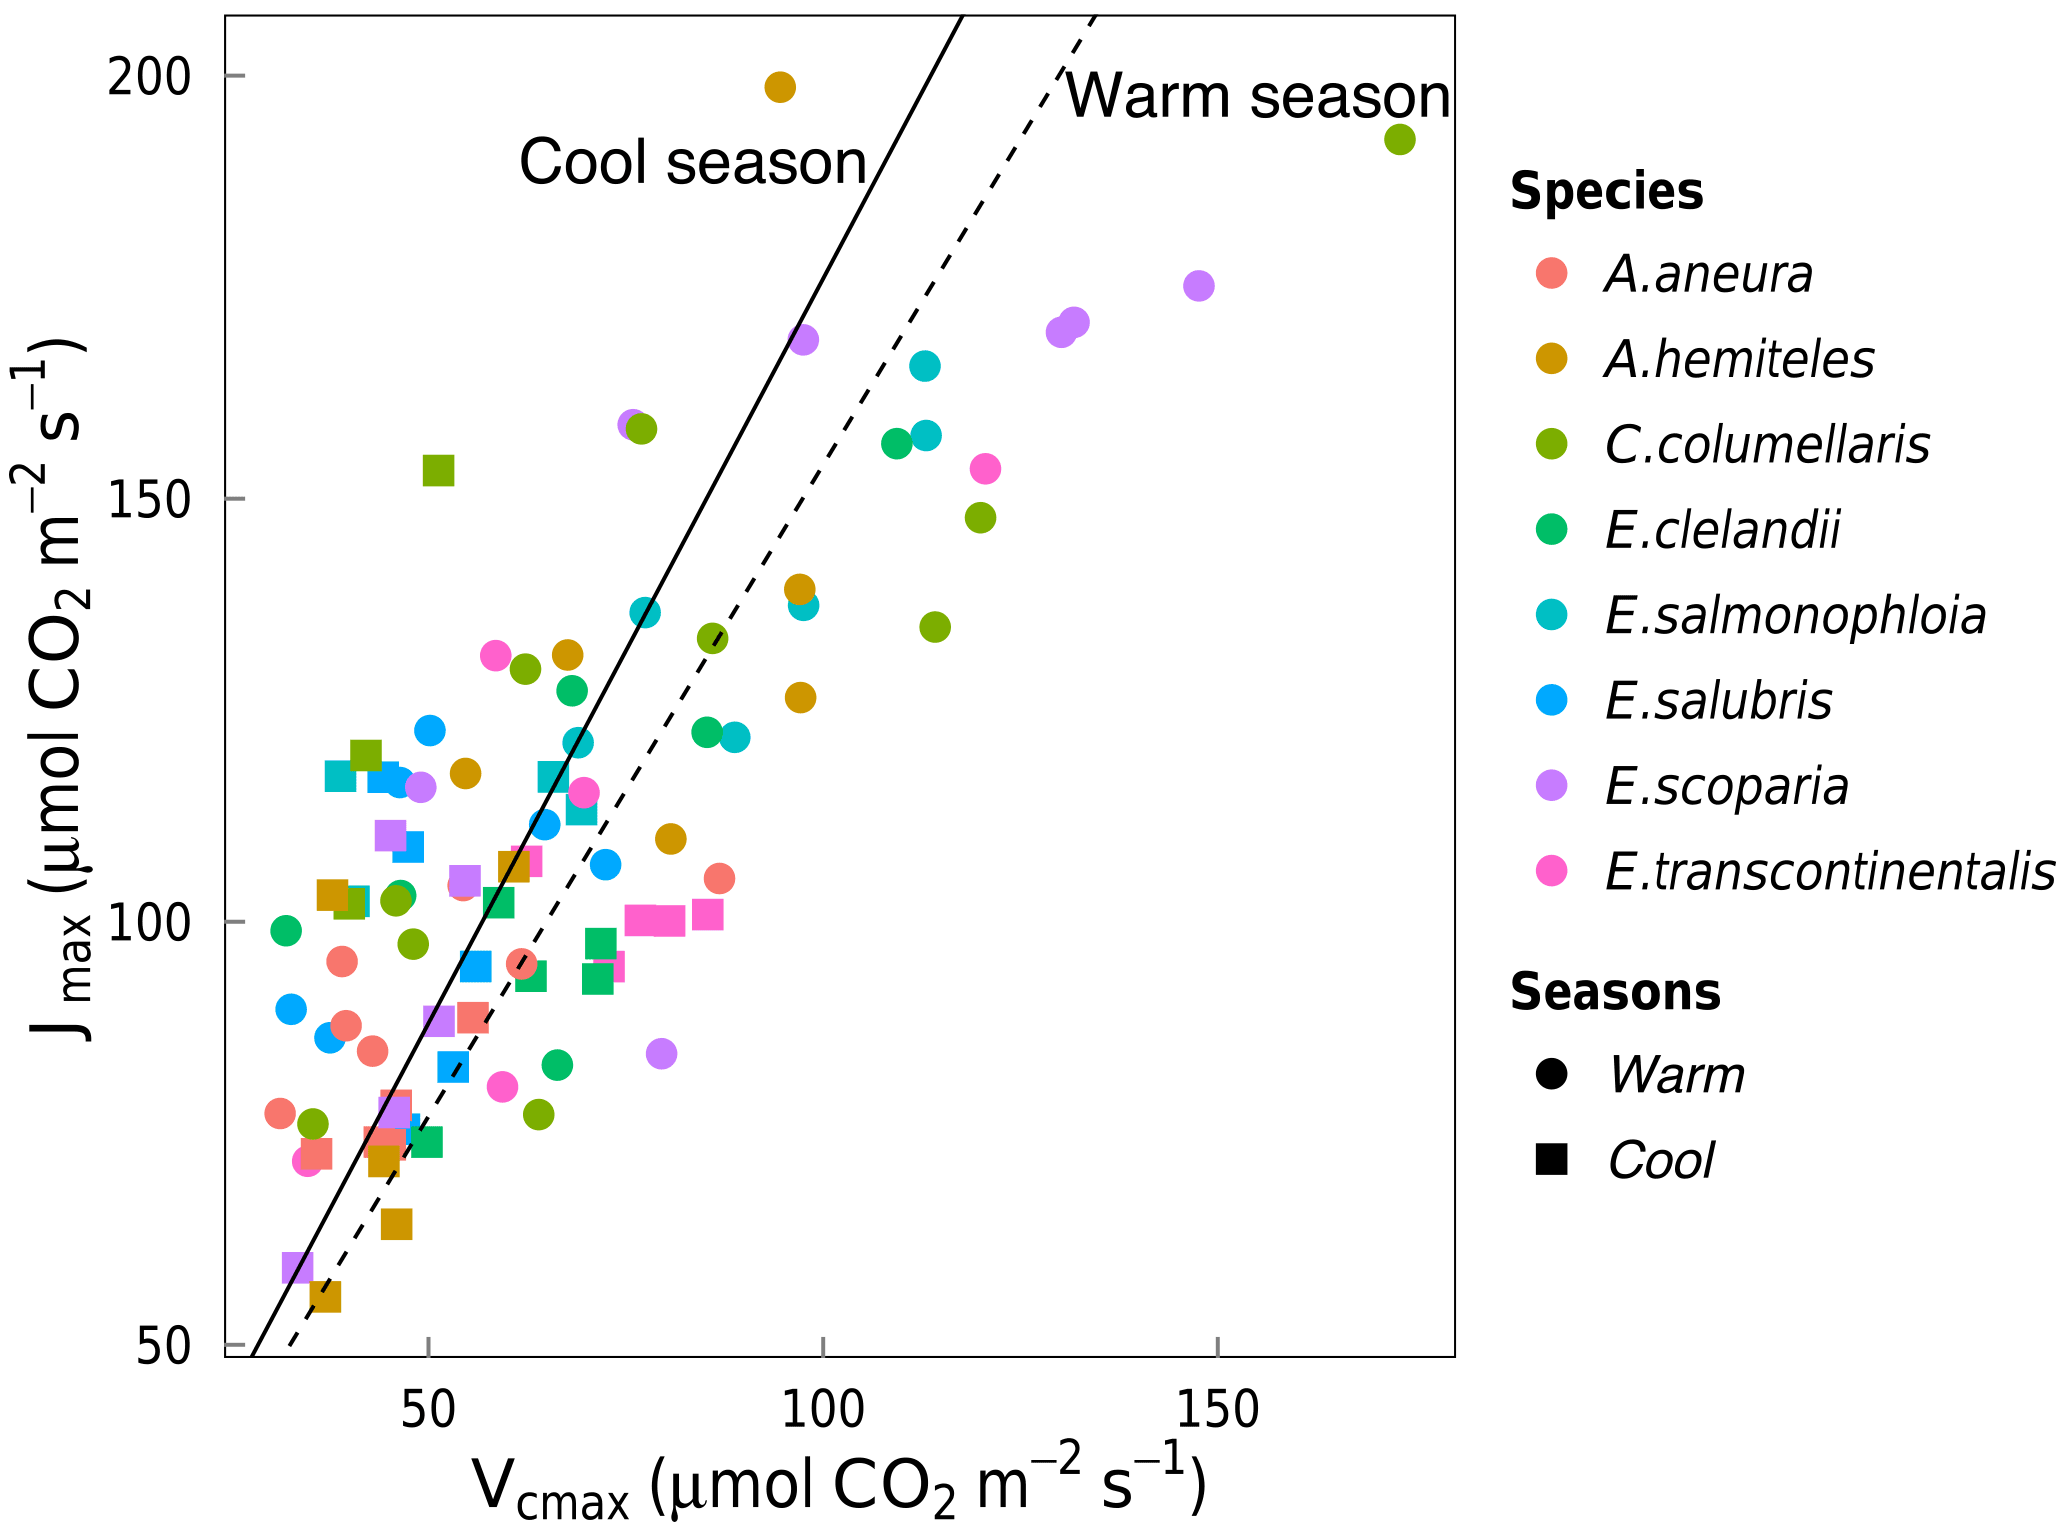
Figure 3Linear regressions forced through the origin between Jmax (µmol m−2 s−1) and Vcmax (µmol m−2 s−1) for individual trees of eight species in the warm season (circles, dashed line, slope = 1.58) and the cool season (squares, solid line, slope = 1.79). Both regressions are significant (p < 0.05). Each point represents one A-ci curve (n= 86).
3.2 Leaf gas exchange trait responses to temperature
Based on data from all species together, Vcmax,Jmax and Rdark increased with leaf temperature, while the corresponding normalized (to 25 ∘C) values declined with leaf temperature (p < 0.05, Fig. 5). The ci:ca ratio also increased slightly but significantly with leaf temperature, (p < 0.05; Fig. 6a). The ratio Jmax:Vcmax did not correlate with temperature based on the data from all species together, but it was negatively correlated with temperature for E. salmonophloia, E. scoparia and C. columellaris (not shown). Excluding the two N-fixing species, and/or the one gymnosperm, from the data set had no effect on these results.

Figure 4Linear regressions of individual trees by season (n= 16) and species (n= 8) for photosynthetic capacity, Vcmax and Jmax with Rdark (µmol m−2 s−1) and the ci:ca ratio at ambient CO2 ≈ 400 µmol mol−1 (p < 0.05). Vcmax, Jmax and Rdark were logln transformed; ci:ca was not. Each point represents one A-ci curve (n= 86).
The relationship between ambient air temperature (Tair, ∘C) and leaf temperature (Tleaf, ∘C) as measured in the gas-exchange system was Tleaf= 1.01 Tair+ 0.35 (p < 0.05, R2= 0.96). Regression slopes between photosynthetic parameters and Tair showed no significant differences from those calculated using Tleaf, but the goodness of fit was weaker with Tair than with Tleaf. We also fitted regressions using Tday (the daily mean temperature). Again, the slopes did not change, but the goodness of fit was further reduced. The factor of season (included as a predictor in a generalized linear model, in addition to Tleaf) did not improve model fit.
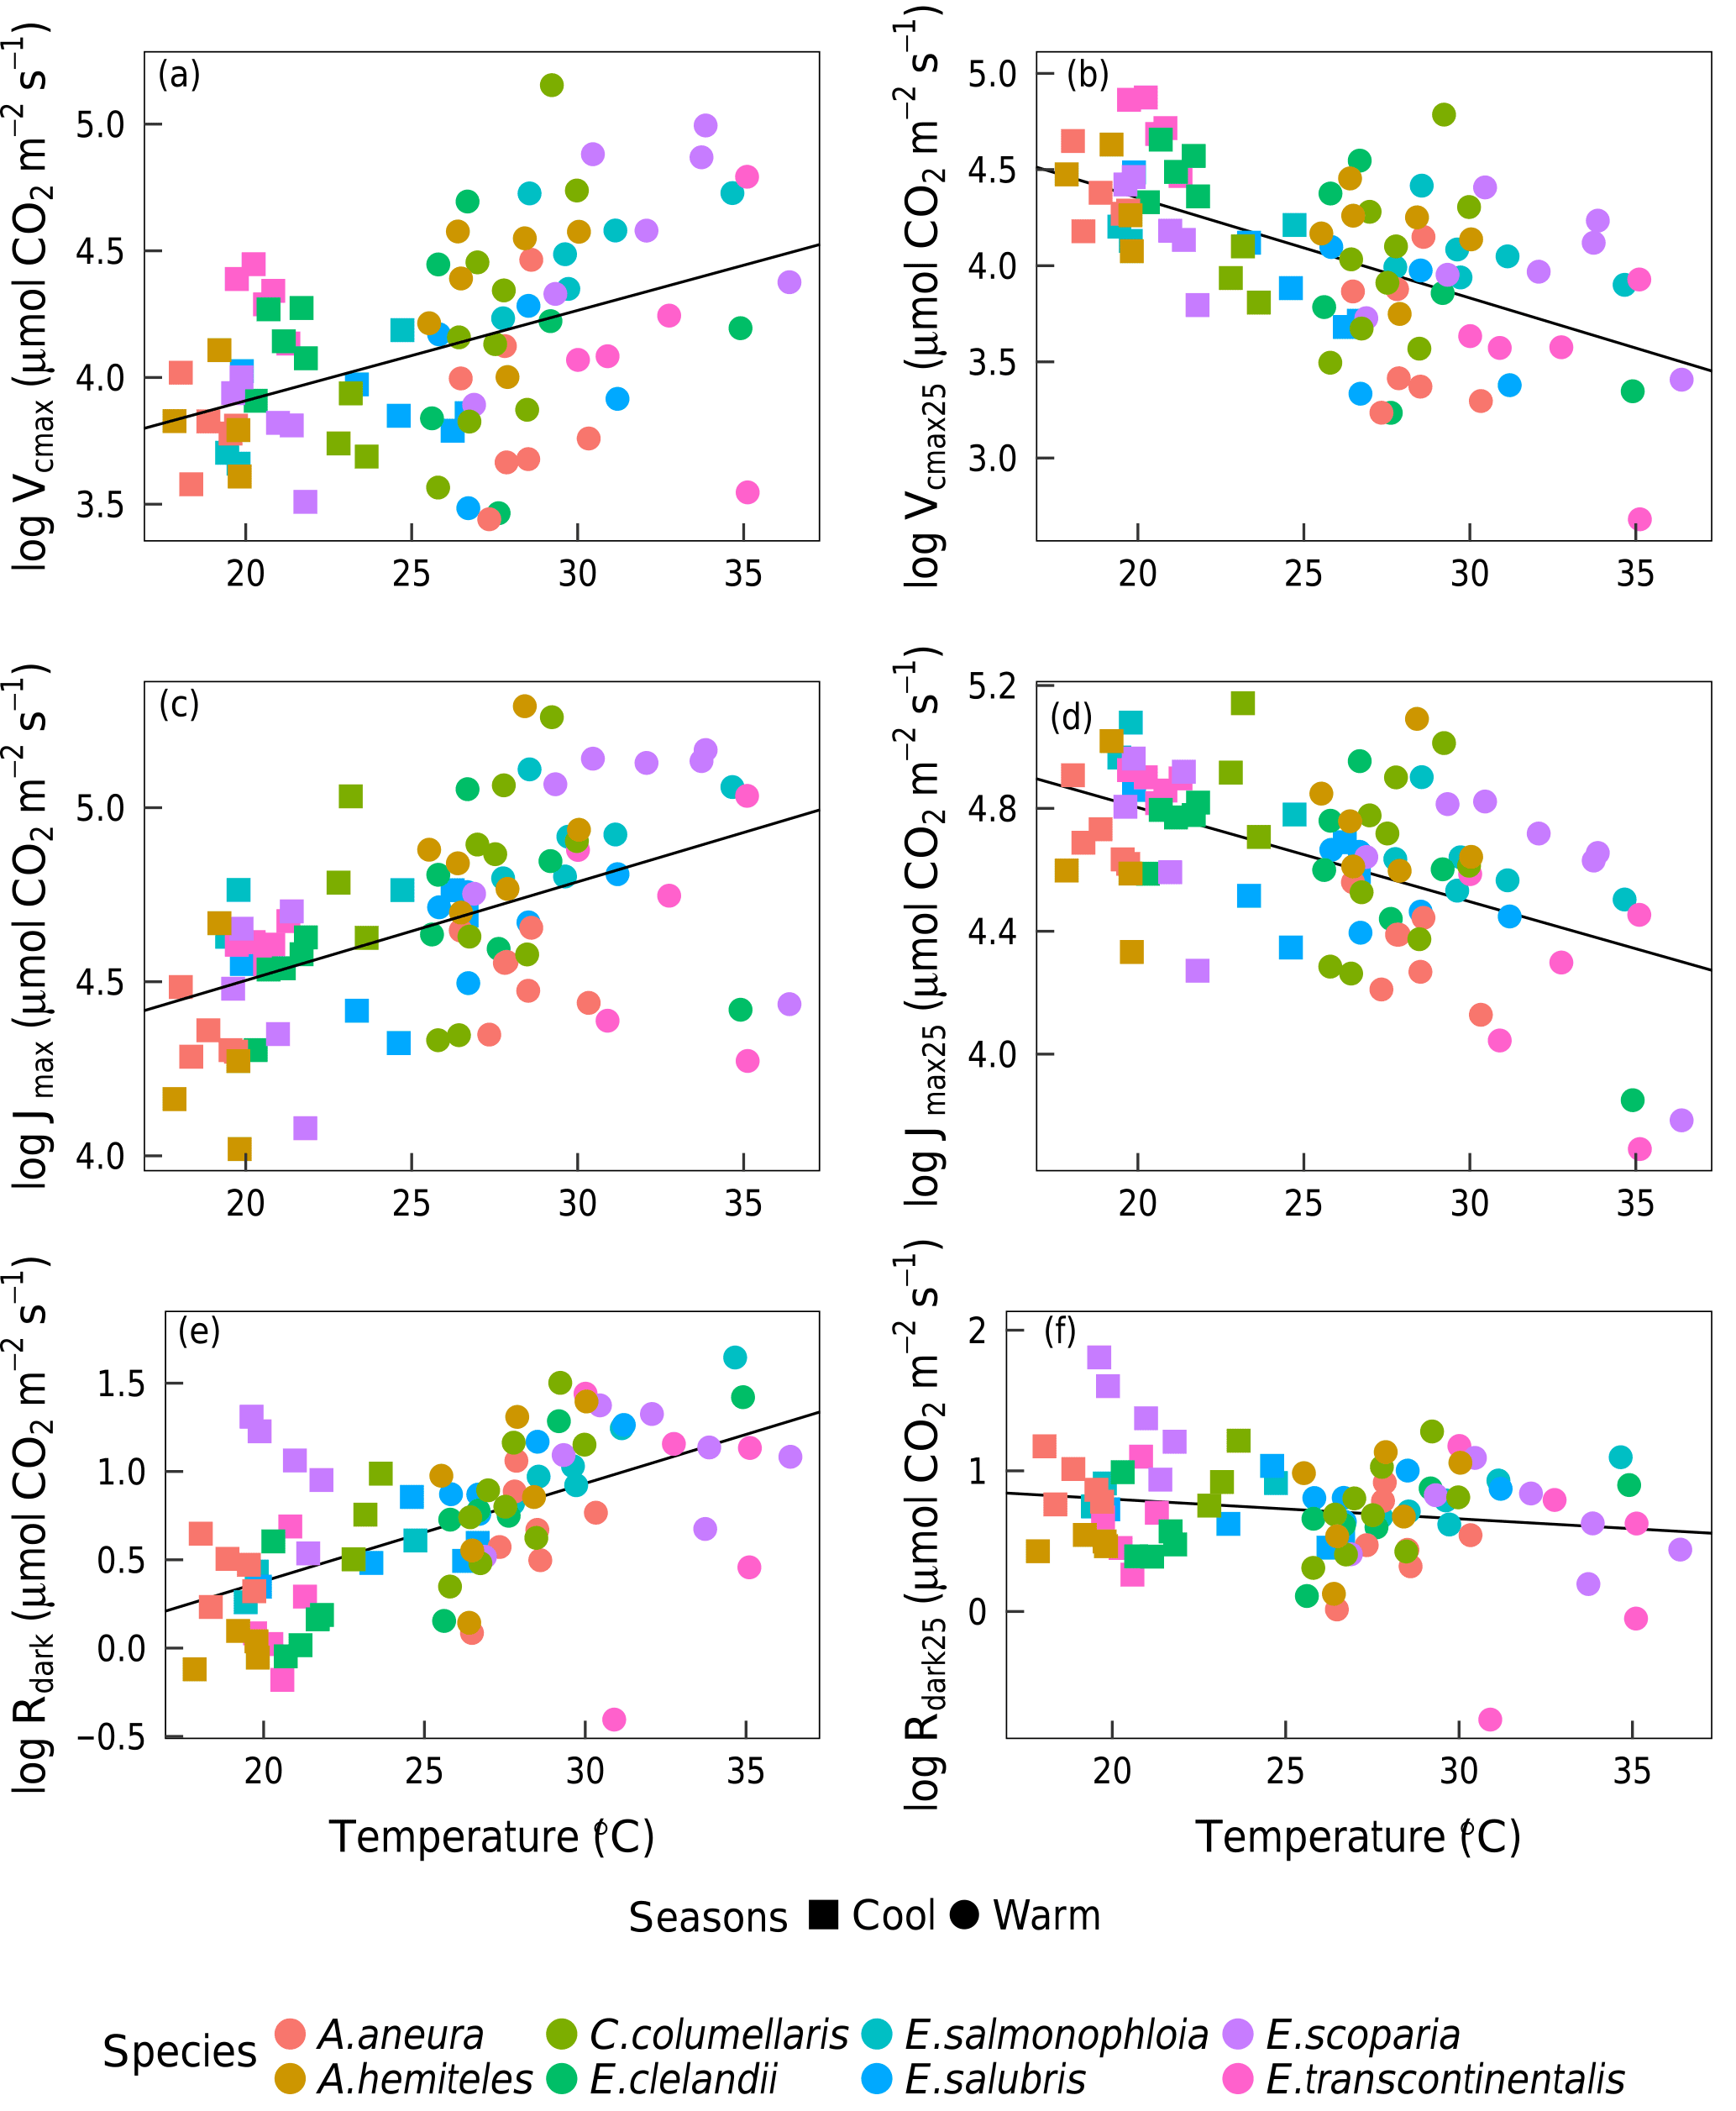
Figure 5Bivariate linear regressions (p < 0.05) of naturally log-transformed Vcmax, Vcmax25, Jmax, Jmax25, Rdark and Rdark25 (µmol m−2 s−1) vs. leaf temperature (Tleaf, ∘C). Each point represents one A-ci curve (n= 86).
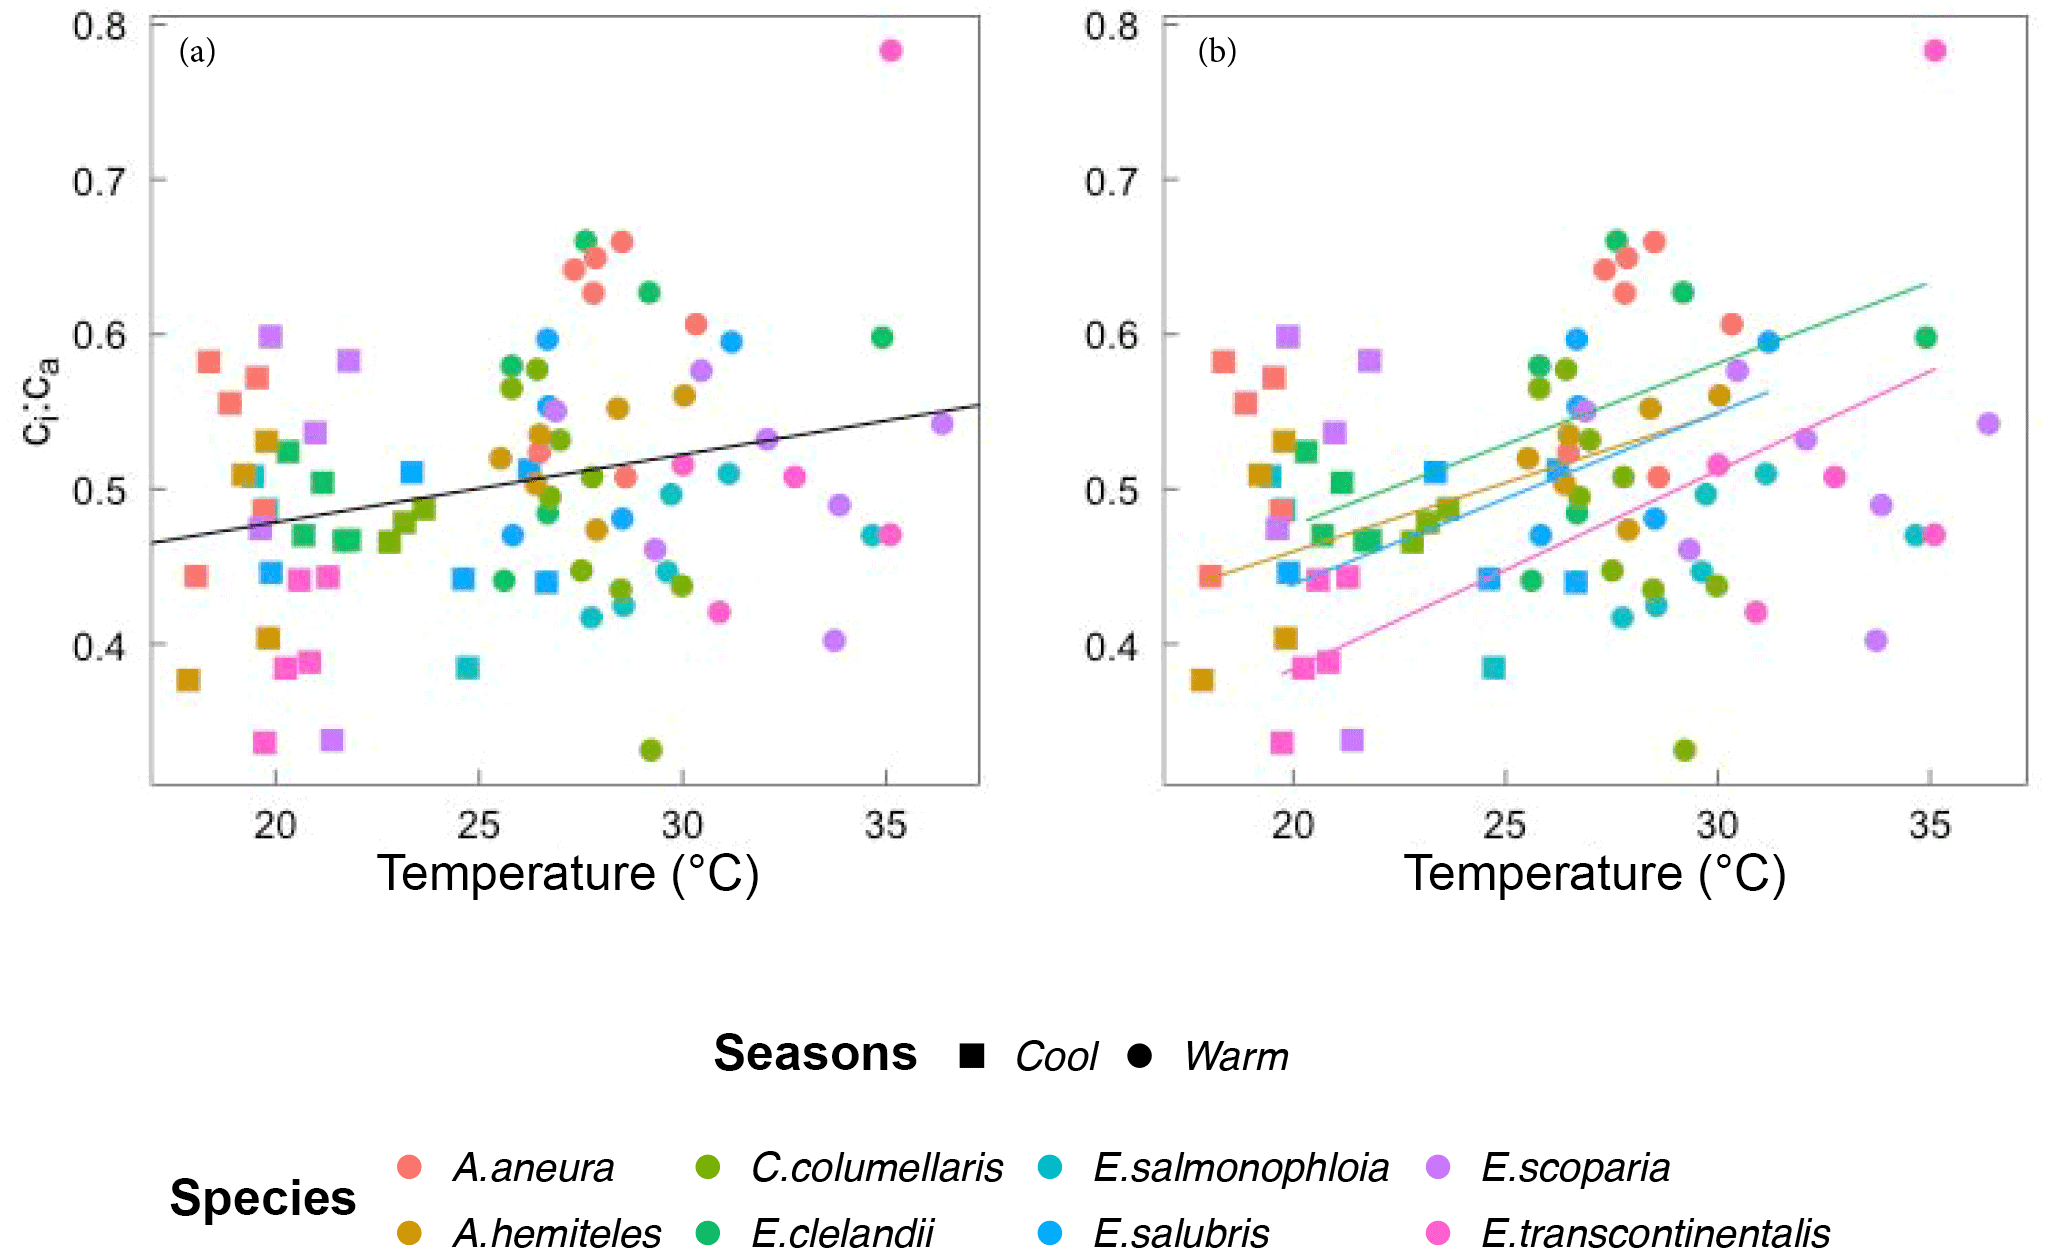
Figure 6Bivariate linear regressions of the ci:ca ratio (at ambient CO2 ≈ 400 µmol mol−1) vs. temperature (Tleaf, ∘C) for individual trees considering all data (a) and within species (b). Only significant regressions (p < 0.05) are shown. Each point represents one A-ci curve (n= 86).
Within individual species, we also found positive responses of Vcmax and Jmax to temperature, and negative responses when the parameters were standardized to 25 ∘C (Fig. 7). The response of the ci:ca ratio to leaf temperature was similar in most species (Fig. 6b). Within-species responses of Rdark to leaf temperature were weaker and less consistent (Fig. 7), suggesting that respiration had acclimated to a greater extent than was the case for Vcmax and Jmax.
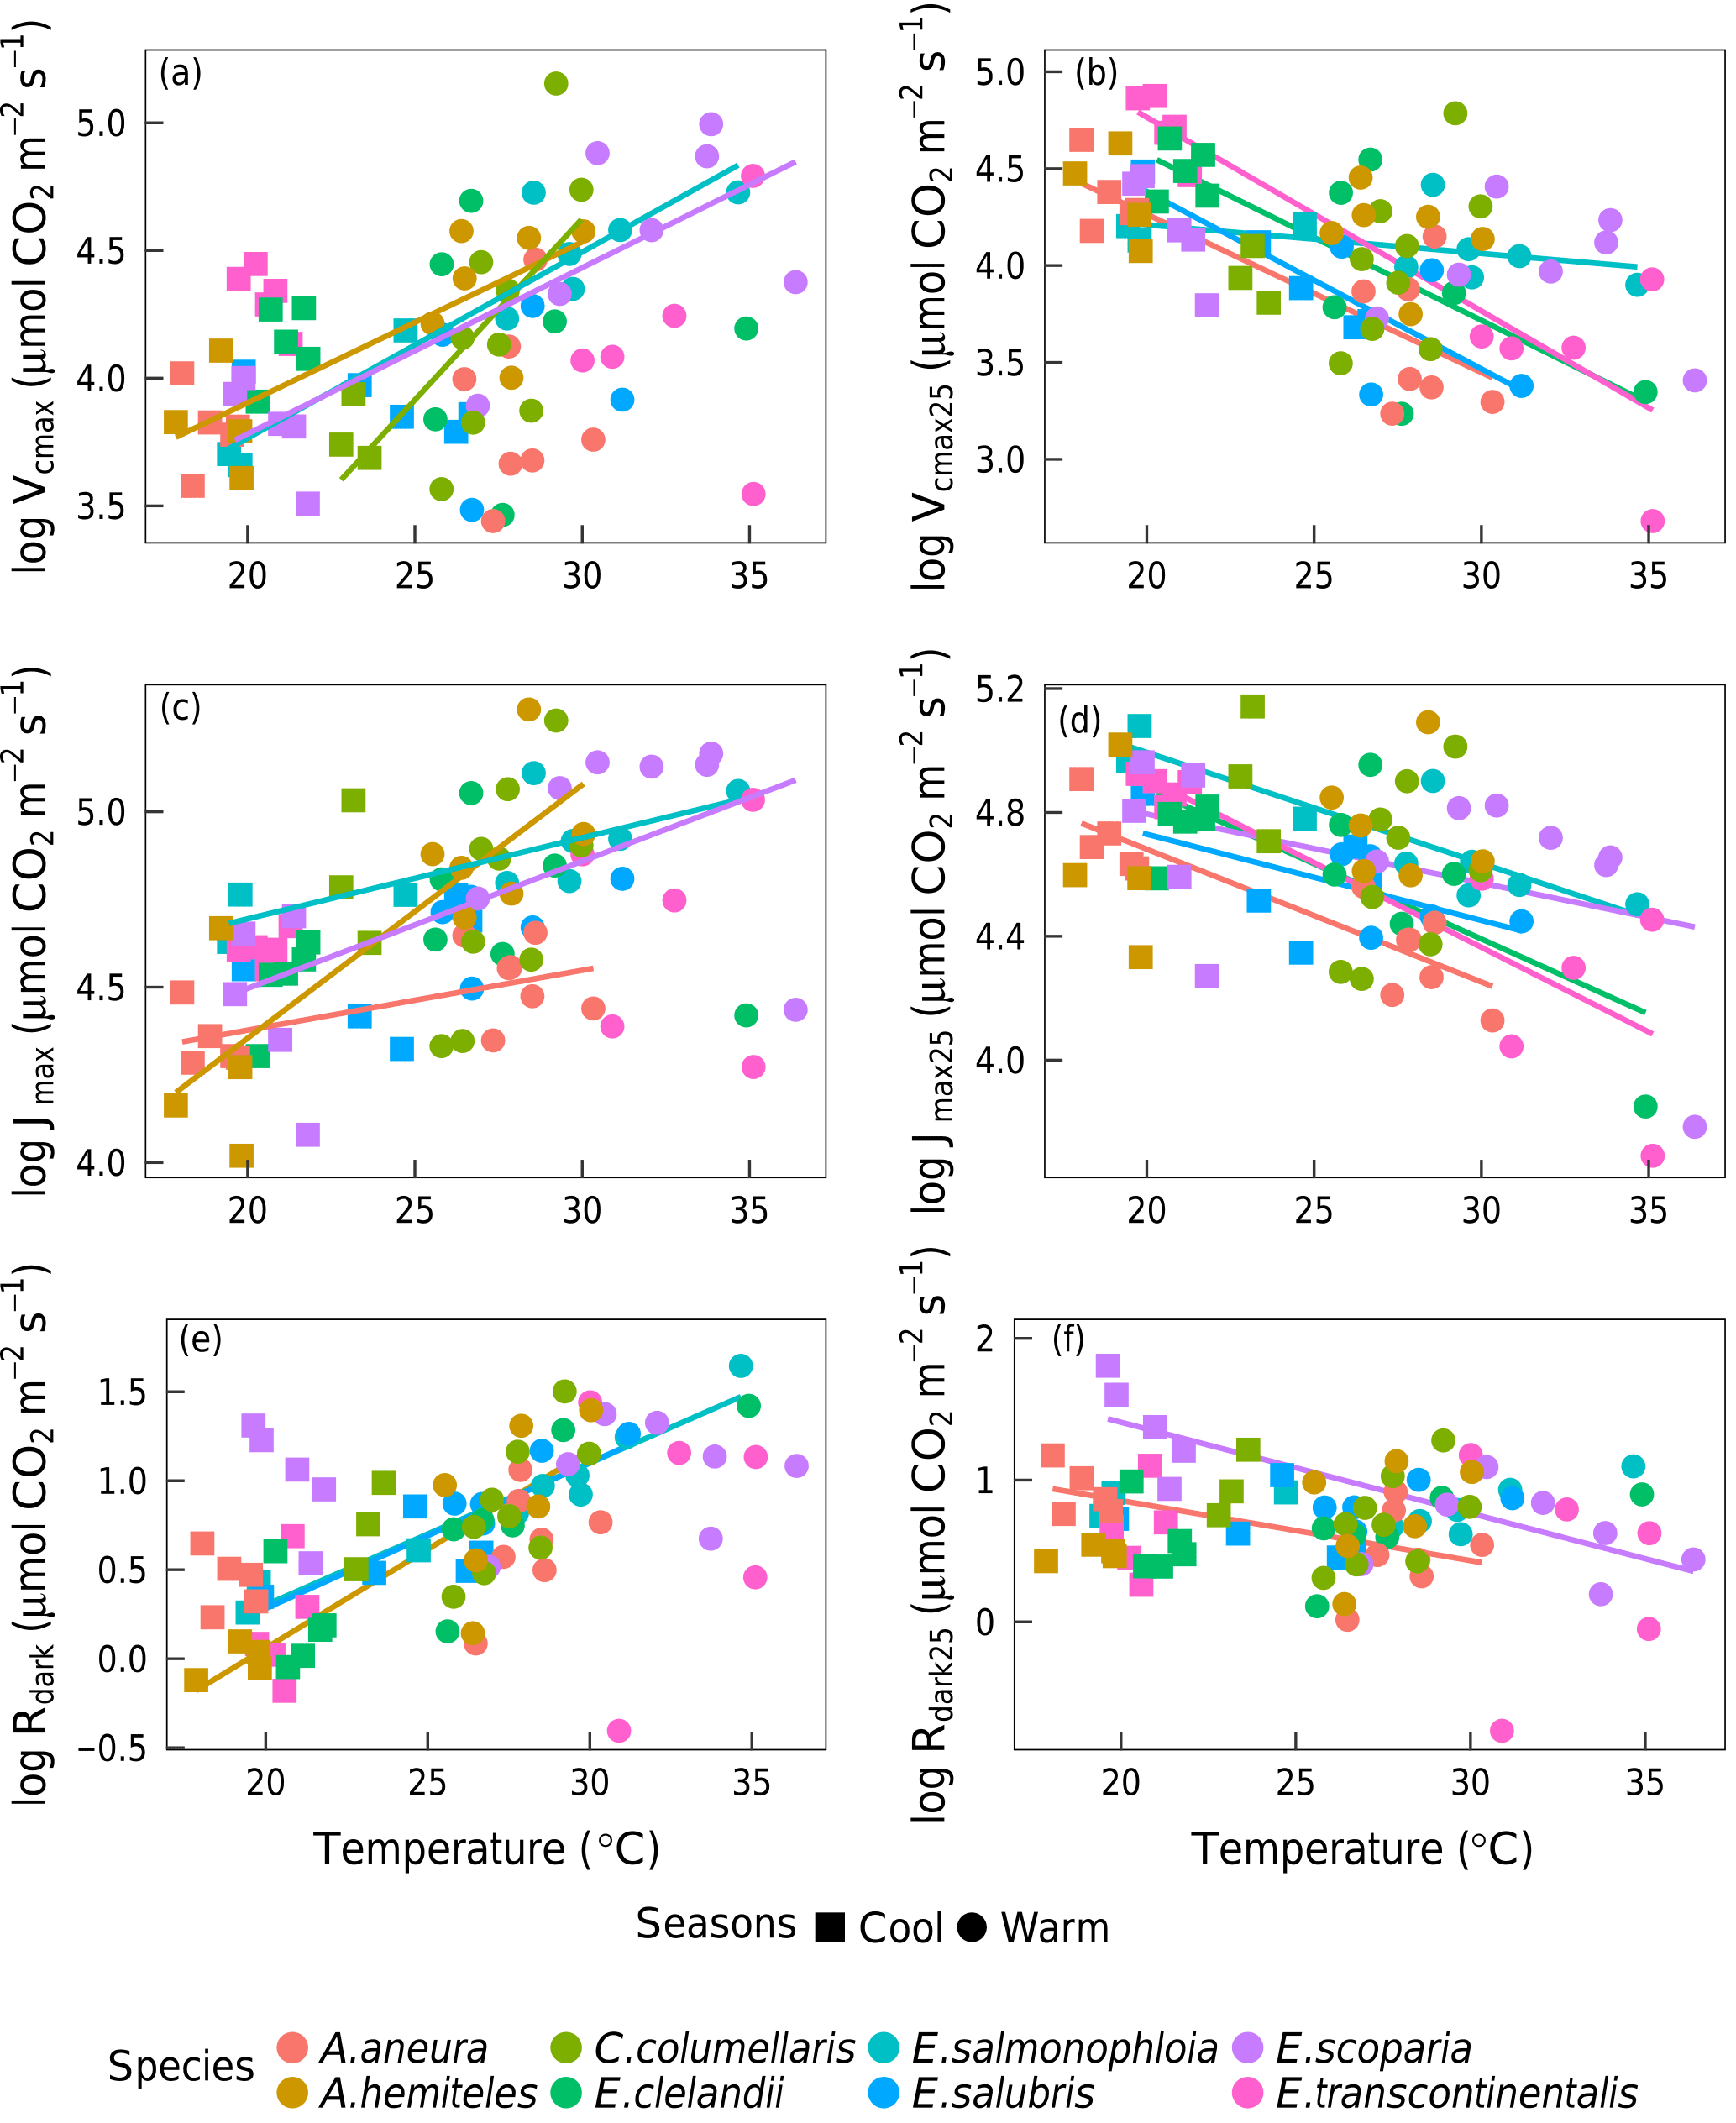
Figure 7Bivariate linear regressions of naturally log-transformed Vcmax, Vcmax25, Jmax, Jmax25, Rdark and Rdark25 (µmol m−2 s−1) vs. leaf temperature (Tleaf, ∘C) within species (p < 0.05). Only significant regressions (p < 0.05) are shown. Each point represents one A-ci curve (n= 86).
The average VPD value during the warm season was 1.13 kPa, and during the cool season it was 0.45 kPa. The average leaf-to-air VPD (i.e. corrected to leaf temperature) during the warm season was 2.5 kPa, and during the cool season it was 1.44 kPa. However, there was very little difference in stomatal conductance at light saturation: 0.064, 0.082 and 0.101 (lower quartile, median and upper quartile) mol m−2 s−1 for the warm season, and 0.057, 0.078 and 0.085 mol m−2 s−1 for the cool season.
Incoming short-wave radiation at the surface was used as a proxy for PPFD. Daily values ranged from 90 to 256 W m−2 and averaged 193 W m−2. Averages for the warm and the cool-season sampling periods were not significantly different. None of the photosynthetic parameters showed any relationship with short-wave radiation.
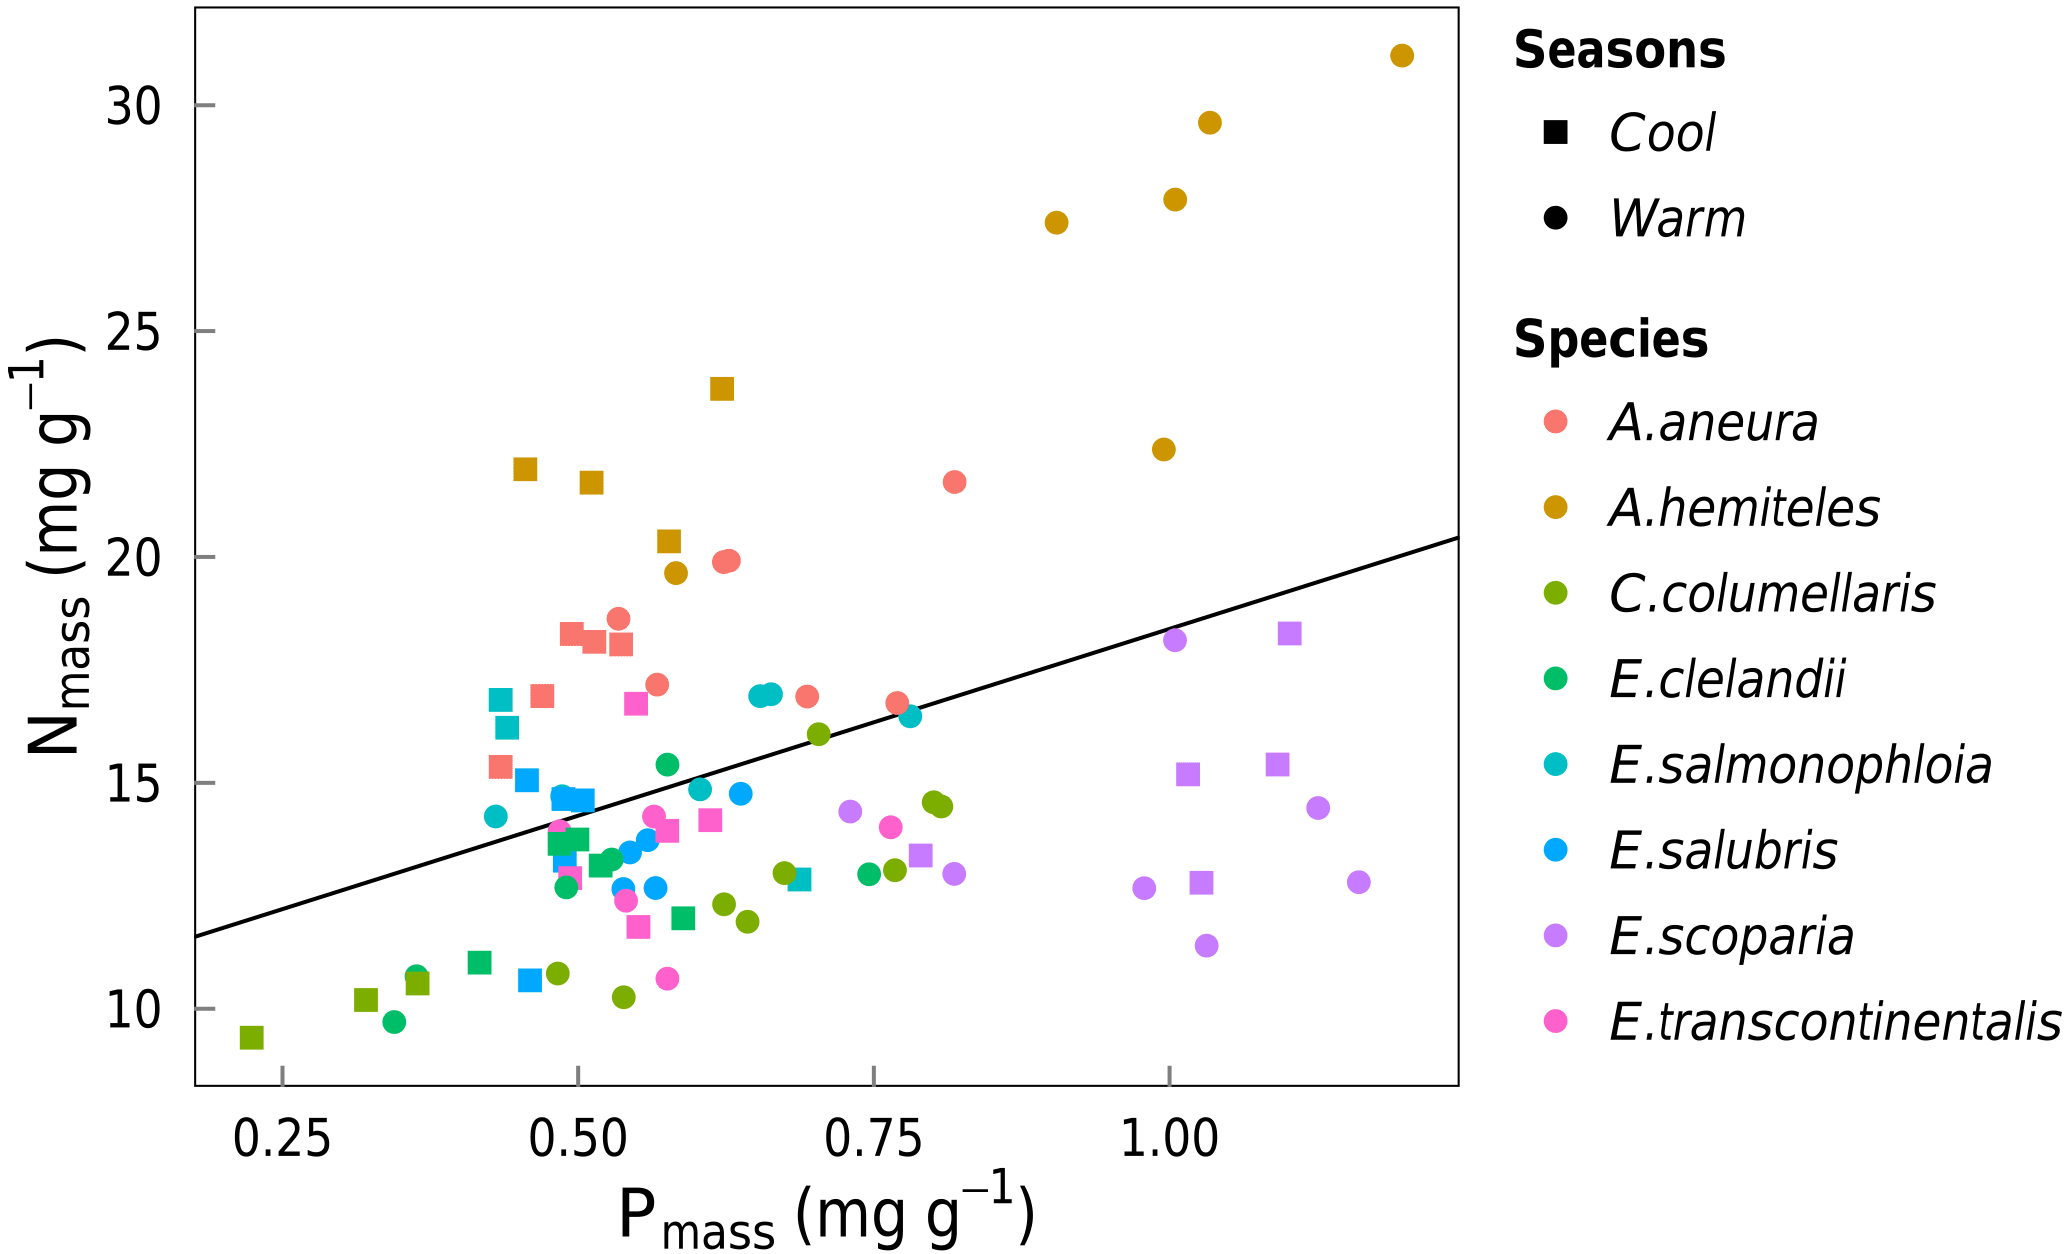
Figure 8Bivariate linear regression of Nmass (mg g−1) vs. Pmass (mg g−1) for all data (black line, slope = 0.33, R2= 0.17). Each point represents one leaf (n= 86).
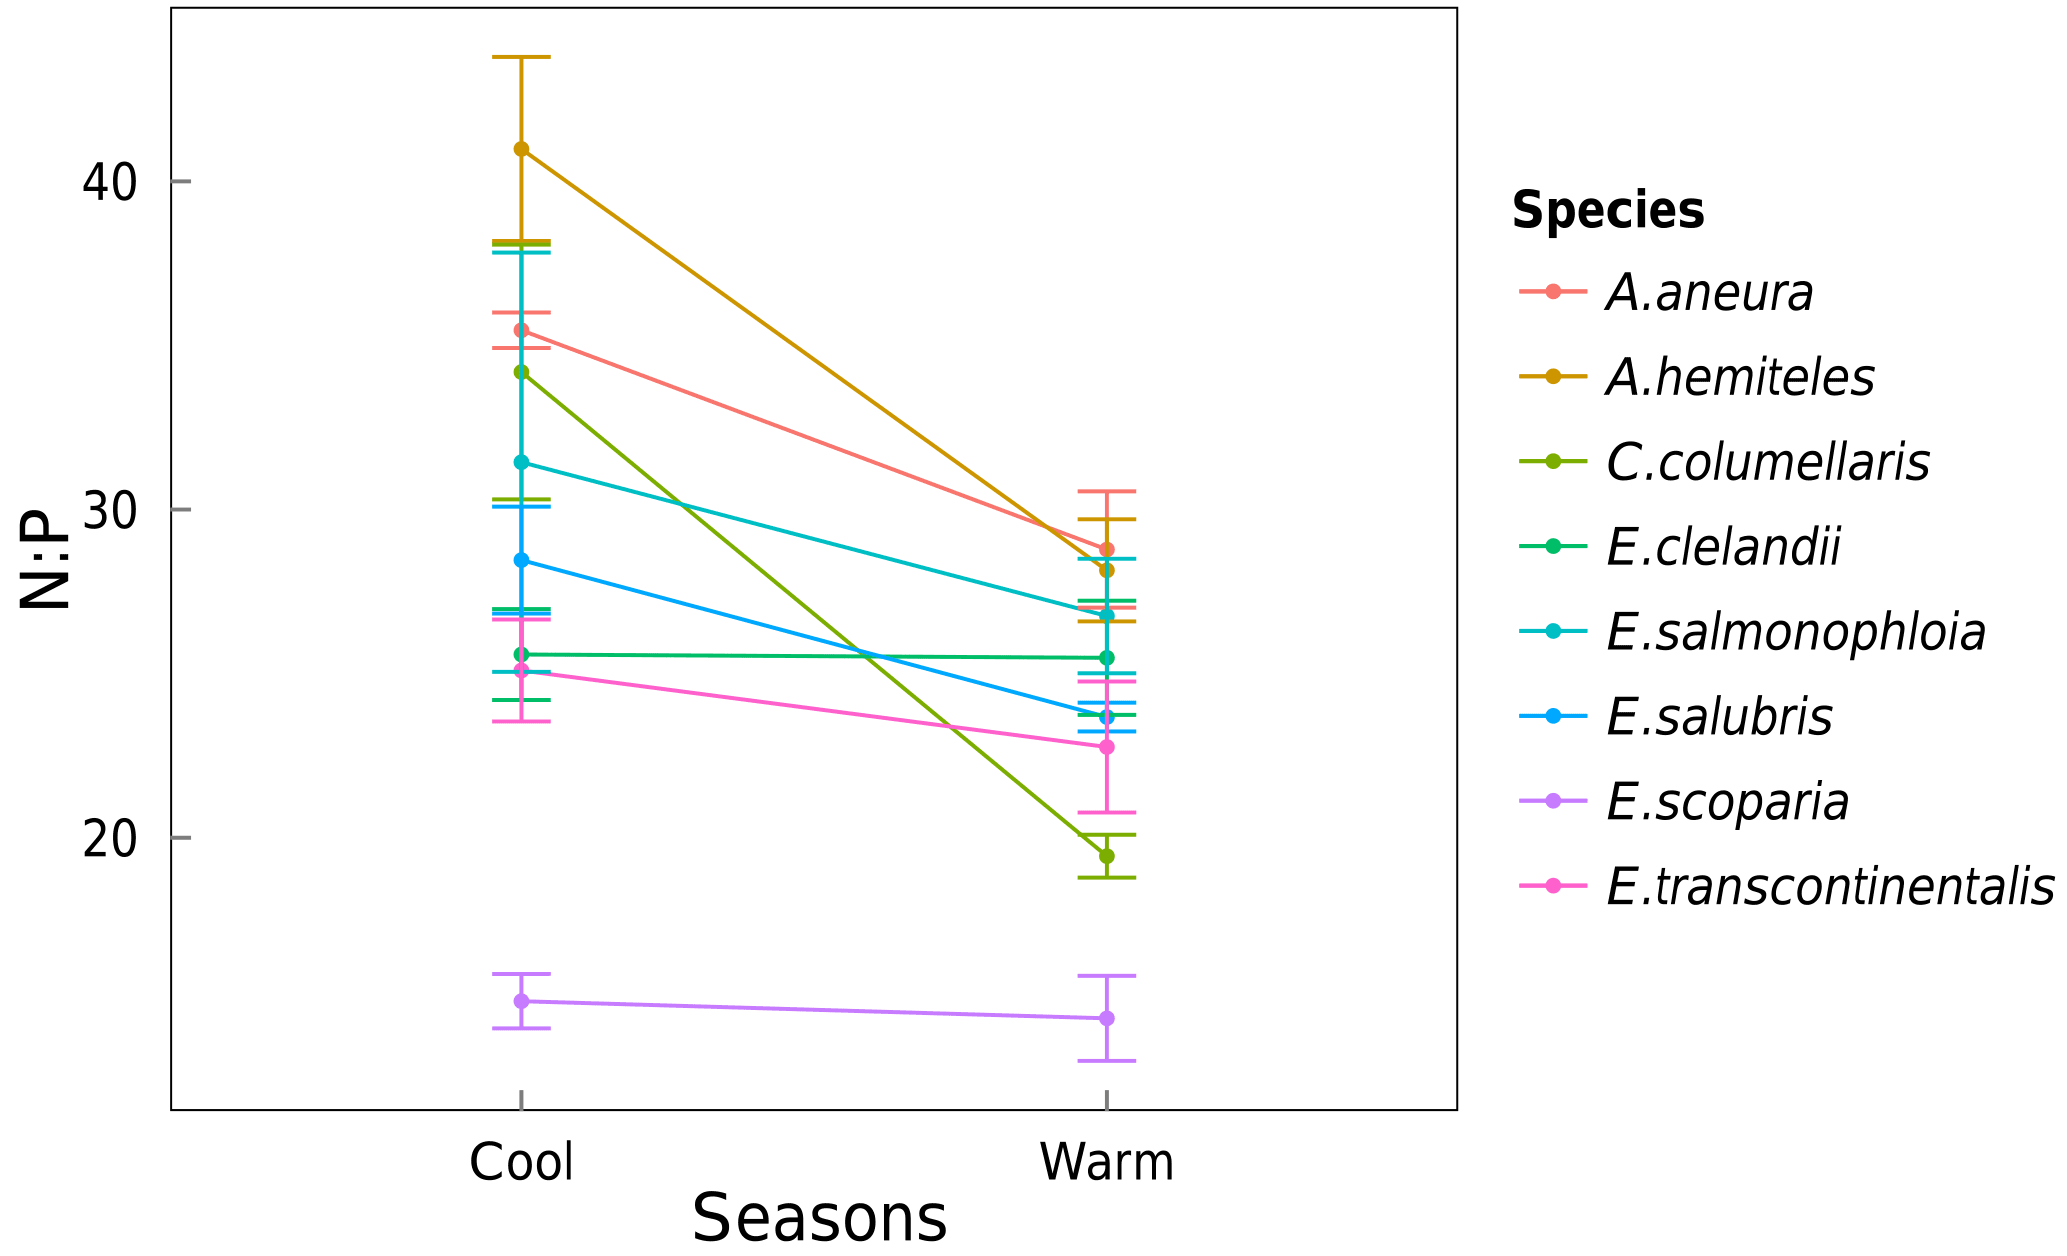
Figure 9Changes in the average foliar N : P ratio for each species between the cool and the warm seasons. Standard errors are shown.
3.3 Leaf N and P relationships to photosynthetic traits and temperature
Area-based rates of leaf gas exchange traits were not systematically related to total leaf Narea or Parea (not shown). There was a positive relationship between N and P (by mass) when taking all species together and within three of the species (p < 0.05; Fig. 8). High values of foliar N : P ratios (> 16) in seven out of eight species (Fig. 9) may suggest that P in this ecosystem is more limiting to growth than N (Westoby and Wright, 2006). N : P ratios declined with increasing temperature (p < 0.05). A. aneura and A. hemiteles presented the highest N : P, as expected for N-fixing species.
We investigated how the ratio of Vcmax (and Vcmax25) to Narea varied with ambient temperature. The results were generally very similar to the analysis of Vcmax (and Vcmax25) to temperature (Figs. 5 and 7), but they were significant (p < 0.05) for seven out of eight species (all except the gymnosperm Callitris columelaris) for both Vcmax and Vcmax25 (not shown).
3.4 Quantitative temperature responses
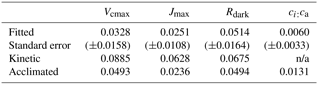
For Vcmax and Jmax, the fitted slopes with leaf temperature were shallower than the predicted kinetic slopes by a margin that greatly exceeded their 95 % confidence limits (Table 1). The kinetic values are what would be expected if the activities of the relevant enzyme complexes remained constant with changing growth temperature. The coordination hypothesis predicts much shallower acclimated rate temperature slopes (Fig. 1). The acclimated slope for Vcmax can be predicted from the temperature dependencies of K and the photorespiratory compensation point (Γ∗). The acclimated slope for Vcmax falls just marginally above the 95 % confidence interval for the fitted slope. The acclimated slope of Jmax falls well within the 95 % confidence interval for the fitted slope. For Rdark the acclimated and kinetic slopes are closer together, and both fall within the 95 % confidence interval of the fitted slope.
There is no kinetic response of ci:ca, but the least-cost hypothesis predicts a positive response to temperature. This was observed, although the fitted slope of the response to temperature was shallower than predicted.
4.1 Quantitative ranges of photosynthesis traits
Values of Vcmax, Jmax, Rdark and ci:ca for the eight species measured here were within commonly reported ranges. Vcmax and Jmax were generally lower than expected for desert species (153 ± 54 µmol m−2 s−1) but higher than typical values for mesic perennial species (53 ± 15 µmol m−2 s−1) (Wullschleger, 1993). The values were also high compared with trees from savannas with twice the annual precipitation (range 20–90 µmol m−2 s−1) (Domingues et al., 2010). The ci:ca ratios fall within the range typical for dry environments (Prentice et al., 2014).
4.2 Comparison between seasons
Our results were consistent with acclimation of photosynthetic traits to temperature as predicted by the coordination hypothesis. When measured at the prevailing ambient temperature, Vcmax, Jmax and Rdark were all generally higher in the warm season than in the cool season, whereas values standardized to 25 ∘C were generally lower in the warm season than in the cool season (Fig. 2). This is prima facie evidence for active seasonal acclimation, in agreement with the coordination hypothesis that predicts lower allocation of N to Rubisco and other photosynthetic enzymes at higher temperatures, offsetting the increase in enzyme activity with elevated temperature. Moreover, the absence of acclimation (as found in Way and Yamori, 2014) should result in no relationship between Vcmax25 and leaf temperature, while the negative relationship found here is evidence of acclimation (Figs. 5 and 7).
The comparison of fitted and theoretically predicted slopes (Table 1) reveals not only that the responses of Vcmax, Jmax and Rdark to ambient temperature were smaller than would be predicted from enzyme kinetics alone but also that the observed responses were close to, or (in the case of Jmax) statistically indistinguishable from, the responses predicted by the coordination hypothesis. The response of ci:ca is in the same direction (positive) as the response predicted by the least-cost hypothesis but only about half as large, probably due to the opposing effect (reduction in ci:ca) of larger VPD in the warm season than in the cool season (Prentice et al., 2014).
Vcmax and Jmax were strongly and positively correlated across species (Fig. 3), and the relationship did not shift significantly between seasons. Some studies have reported a lower Jmax:Vcmax ratio in warmer seasons compared to cooler seasons (Medlyn et al., 2002a; Lin et al., 2013). Our data show a tendency in this direction but not enough to be significant (Fig. 3). Vcmax and Jmax have previously been reported to increase seasonally with leaf temperature. In one study on six Eucalyptus species, measurements were taken at six temperature levels in winter, spring and summer; there was an increase in Vcmax and Jmax with air temperature in seasons with overlapping temperatures, and Vcmax25 was significantly higher in the winter than in the summer (Lin et al., 2013). Miyazawa and Kikuzawa (2006) obtained similar results in five evergreen broadleaved species. Our measurements also yielded similar results (Figs. 5 and 7).
4.3 Seasonal variability in leaf nutrients
Levels of leaf N and P have been reported to change seasonally (Medlyn et al., 2002a, and Fig. 9). We found a reduction in the N : P ratio in the warm season, consistent with a reduced allocation of N to photosynthetic functions (Way and Sage, 2008). A reduction in total leaf N does not necessarily indicate changes in N allocation; however, a strong coupling between N and photosynthesis has been widely observed, even though Rubisco accounts for only 10–30 % of the total leaf N (Evans, 1989). This coupling can be verified in our data, represented by the relationship between Vcmax∕ Narea and temperature across the two seasons, which was significant for a greater number of species in comparison to the relationship between Vcmax and temperature.
A reduction in leaf N in the warm season is unlikely to be caused by general growth dilution during an actively growing part of the year because (a) this is an environment with a year-round growing season, (b) PPFD during the periods of the field campaigns was similar, and (c) the measured Vcmaxvalues were shown to be consistent with the coordination hypothesis, implying similar assimilation rates in the two seasons. We did not find significant relationships of photosynthetic traits to foliar N or P despite the study area being extremely limited in supplies of both nutrients (Prober et al., 2012).
4.4 Links between photosynthetic activity, Rdark and ci:ca
Vcmax, Jmax and Rdark were positively correlated with leaf temperature across a wide range (cool season 17 to 27 ∘C; warm season 26 to 37 ∘C), both for the data set as a whole and within individual species (Figs. 5 and 7). Photosynthetic capacity and respiratory flux are linked via the ATP (adenosine triphosphate) demand of sucrose synthesis and transport, leading to the interdependence of chloroplast and mitochondrial metabolism (Krömer, 1995; Ghashghaie et al., 2003). The parallel temperature acclimation of Rdark and Vcmax illustrates this close relationship.
Across all species, there was a strong negative relationship between ci:ca and photosynthetic capacity. A simple interpretation of this (common) finding is that a higher photosynthetic capacity allows a stronger drawdown of CO2 between ca and ci. However, this interpretation assumes that a higher Vcmax means a higher assimilation rate, which cannot be true if Vcmax is already optimized to the current light environment. Instead, the coordination hypothesis implies that the lower the ci:ca ratio, the greater the photosynthetic capacity that is required in order to achieve a given assimilation rate. Measured ci:ca ratios in this study increased with temperature as predicted, but the slope of 0.006 (Fig. 6) based on all data was shallower than the predicted slope of 0.013. This difference may reflect higher VPD in the warm season, which would be expected to close stomata and therefore act in the opposite way to the effect of temperature alone (Prentice et al., 2014).
4.5 Implications for modelling
Data that test predictions of the coordination hypothesis regarding the seasonal acclimation of Vcmax, Jmax and Rdark are scarce. This study has presented evidence suggesting that such acclimation (at least in evergreen woody plants) is a real phenomenon, and is quantitatively consistent with the coordination hypothesis. Terrestrial models that do not allow seasonal acclimation therefore may incorrectly represent the seasonal time course of carbon exchange at the plant and ecosystem levels.
One dynamic global vegetation model, the Lund–Potsdam–Jena (LPJ) model (Sitch et al., 2003), together with several later models based on LPJ, formally assumes the coordination hypothesis (as well as the coupling between Rdark and Vcmax) and thus implicitly allows photosynthetic parameters and leaf respiration to acclimate to the seasonal variation of climate. The coordination hypothesis is also invoked by the new “first-principles” global primary production model developed by Wang et al. (2014) and further elaborated and tested by Wang et al. (2017). However, there are several steps between these models and the potentially wider application of the coordination hypothesis in physical land surface and Earth System modelling. Timescales are a key issue. The timescale of acclimation of Vcmax and Jmax is unclear, and could not be resolved empirically without frequently repeated measurements. It is generally accepted, however, that acclimation occurs over multiple days. The LPJ model requires daily or monthly inputs and assumes complete acclimation on monthly timescales. Wang et al. (2014, 2017) implemented their model on monthly time steps. Modelling diurnal cycles would require a separation of timescales, such that photosynthetic capacities would be near-constant over a diurnal cycle but would vary gradually in response to the seasonal cycle. Thus, whereas Wang et al. (2014, 2017) could make Vcmax and Jmax “disappear” from equations describing monthly primary production (because on this timescale they were considered to depend only on the environment), multitemporal applications will have to explicitly predict time-varying values of Vcmax and Jmax depending on antecedent environmental conditions. Field measurements of photosynthetic parameters in different seasons are required to test these predictions (Bloomfield et al., 2018).
Table 1Linear regression slopes (K−1) and their 95 % confidence intervals for naturally log-transformed photosynthetic traits, with species included as a factor. The values are compared to kinetic slopes (as expected in the absence of acclimation) and acclimated slopes, as predicted by the coordination hypothesis for Vcmax, Jmax and Rdark and the least-cost hypothesis for ci:ca; n/a means not applicable.
Data can be requested at the Terrestrial Ecosystem Research Network (TERN) data discovery portal http://portal.tern.org.au (last access: 21 May 2018) (Prober et al., 2015).
HFT, ICP, OKA, CM and SMP planned and designed the research. HFT performed all research and data analysis. HFT measured all the field data used in the experiment. ICP developed the theoretical predictions. HFT wrote the first draft; all authors commented on subsequent versions and assisted with data interpretation.
The authors declare that they have no conflict of interest.
This research was funded by the Terrestrial Ecosystem Research Network (TERN), Macquarie University
and the Australian National University. Henrique Fürstenau
Togashi was supported by an international Macquarie University International
Research Scholarship (iMQRES). Iain Colin Prentice, Bradley John Evans, and Henrique Fürstenau Togashi were funded by
the Ecosystem Modelling and Scaling Infrastructure (eMAST, part of TERN).
TERN and eMAST have been supported
by the Australian Government through the National Collaborative Research
Infrastructure Strategy (NCRIS). Owen Atkin acknowledges the support of the
Australian Research Council (DP130101252 and CE140100008). The Australian
SuperSites Network and OzFlux (part of TERN), the CSIRO Land and Water
Flagship, and the Western Australia Department of Environment and
Conservation support the Great Western Woodlands SuperSite. N and P were
analysed in the Department of Forestry, ANU. We are grateful to Jack Egerton (ANU), Li Guangqi (Macquarie),
Lingling Zhu (ANU), Danielle Creek (University of Western Sydney), Lasantha Weerasinghe (ANU), Lucy Hayes (ANU)
and Stephanie McCaffery (ANU) for help with fieldwork and/or N and P
digestions. We thank Ian Wright (Macquarie University), Santi Sabaté (University of Barcelona)
and Maurizio Mencuccini (CREAF, Barcelona) for
comments that helped to improve the paper. This paper is a contribution to
the AXA Chair Programme in Biosphere and Climate Impacts and the Imperial
College initiative on Grand Challenges in Ecosystems and the Environment.
Edited by: Sönke Zaehle
Reviewed by: three anonymous referees
Ali, A. A., Xu, C., Rogers, A., Fisher, R. A., Wullschleger, S. D., Massoud, E. C., Vrugt, J. A., Muss, J. D., McDowell, N. G., Fisher, J. B., Reich, P. B., and Wilson, C. J.: A global scale mechanistic model of photosynthetic capacity (LUNA V1.0), Geosci. Model Dev., 9, 587–606, https://doi.org/10.5194/gmd-9-587-2016, 2016.
Allen, S. E., Grimshaw, H., Parkinson, J. A., and Quarmby, C.: Chemical Analysis of Ecological Materials, Blackwell Scientific Publications, Oxford, UK, 1974.
Armstrong, A. F., Badger, M. R., Day, D. A., Barthet, M. M., Smith, P. M. C., Millar, A. H., Whelan, J. I. M., and Atkin, O. K.: Dynamic changes in the mitochondrial electron transport chain underpinning cold acclimation of leaf respiration, Plant Cell Environ., 31, 1156–1169, 2008.
Atkin, O. K. and Tjoelker, M. G.: Thermal acclimation and the dynamic response of plant respiration to temperature, Trends Plant Sci., 8, 343–351, 2003.
Atkin, O. K., Evans, J. R., Ball, M. C., Lambers, H., and Pons, T. L.: Leaf respiration of snow gum in the light and dark. Interactions between temperature and irradiance, Plant Physiol., 122, 915–924, 2000.
Atkin, O. K., Bloomfield, K. J., Reich, P. B., Tjoelker, M. G., Asner, G. P., Bonal, D., Bönisch, G., Bradford, M. G., Cernusak, L. A., Cosio, E. G., Creek, D., Crous, K. Y., Domingues, T. F., Dukes, J. S., Egerton, J. J. G., Evans, J. R., Farquhar, G. D., Fyllas, N. M., Gauthier, P. P. G., Gloor, E., Gimeno, T. E., Griffin, K. L., Guerrieri, R., Heskel, M. A., Huntingford, C., Ishida, F. Y., Kattge, J., Lambers, H., Liddell, M. J., Lloyd, J., Lusk, C. H., Martin, R. E., Maksimov, A. P., Maximov, T. C., Malhi, Y., Medlyn, B. E., Meir, P., Mercado, L. M., Mirotchnick, N., Ng, D., Niinemets, Ü., O'Sullivan, O. S., Phillips, O. L., Poorter, L., Poot, P., Prentice, I. C., Salinas, N., Rowland, L. M., Ryan, M. G., Sitch, S., Slot, M., Smith, N. G., Turnbull, M. H., VanderWel, M. C., Valladares, F., Veneklaas, E. J., Weerasinghe, L. K., Wirth, C., Wright, I. J., Wythers, K. R., Xiang, J., Xiang, S., and Zaragoza-Castells, J.: Global variability in leaf respiration in relation to climate, plant functional types and leaf traits, New Phytol., 206, 614–636, 2015.
Bernacchi, C., Rosenthal, D., Pimentel, C., Long, S., and Farquhar, G.: Modeling the temperature dependence of C3 photosynthesis, in: Photosynthesis in silico, edited by: Laisk, A., Nedbal, L., and Govindjee, Y. C., Advances in Photosynthesis and Respiration, Springer, the Netherlands, 231–246, 2009.
Bernacchi, C. J., Singsaas, E. L., Pimentel, C., Portis Jr., A. R., and Long, S. P.: Improved temperature response functions for models of Rubisco-limited photosynthesis, Plant Cell Environ., 24, 253–259, 2001.
Bernacchi, C. J., Pimentel, C., and Long, S. P.: In vivo temperature response functions of parameters required to model RuBP-limited photosynthesis, Plant Cell Environ., 26, 1419–1430, 2003.
Bloomfield, K. J., Cernusak, L. A., Eamus, D., Ellsworth, D. S., Prentice, I. C., Wright, I. J., Boer, M. M., Bradford, M. G., Cale, P., Cleverly, J., Egerton, J. J. G., Evans, B. J., Hayes, L. S., Hutchinson, M. F., Liddell, M. J., Macfarlane, C., Meyer, W. S., Prober, S. M., Togashi, H. F., Wardlaw, T., Zhu, L., and Atkin, O. K. : A continental-scale assessment of variability in leaf traits: within species, across sites and between seasons, Funct. Ecol., 2018, 1–15, https://doi.org/10.1111/1365-2435.13097, 2018.
Bolstad, P. V., Reich, P., and Lee, T.: Rapid temperature acclimation of leaf respiration rates in Quercus alba and Quercus rubra, Tree Physiol., 23, 969–976, 2003.
Chen, J.-L., Reynolds, J., Harley, P., and Tenhunen, J.: Coordination theory of leaf nitrogen distribution in a canopy, Oecologia, 93, 63–69, 1993.
De Kauwe, M. G., Lin, Y.-S., Wright, I. J., Medlyn, B. E., Crous, K. Y., Ellsworth, D. S., Maire, V., Prentice, I. C., Atkin, O. K., Rogers, A., Niinemets, Ü., Serbin, S. P., Meir, P., Uddling, J., Togashi, H. F., Tarvainen, L., Weerasinghe, L. K., Evans, B. J., Ishida, F. Y., and Domingues, T. F.: A test of the “one-point method” for estimating maximum carboxylation capacity from field-measured, light-saturated photosynthesis, New Phytol., 210, 1130–1144, 2015.
Dewar, R. C.: The correlation between plant growth and intercepted radiation: an interpretation in terms of optimal plant nitrogen content, Ann. Bot.-London, 78, 125–136, 1996.
Domingues, T. F., Meir, P., Feldpausch, T. R., Saiz, G., Veenendaal, E. M., Schrodt, F., Bird, M., Djagbletey, G., Hien, F., Compaore, H., Diallo, A., Grace, J., and Lloyd, J.: Co-limitation of photosynthetic capacity by nitrogen and phosphorus in West Africa woodlands, Plant Cell Environ., 33, 959–980, 2010.
Dong, N., Prentice, I. C., Evans, B. J., Caddy-Retalic, S., Lowe, A. J., and Wright, I. J.: Leaf nitrogen from first principles: field evidence for adaptive variation with climate, Biogeosciences, 14, 481–495, https://doi.org/10.5194/bg-14-481-2017, 2017.
Evans, J.: Photosynthesis and nitrogen relationships in leaves of C3 plants, Oecologia, 78, 9–19, 1989.
Farquhar, G. D., von Caemmerer, S., and Berry, J. A.: A biochemical model of photosynthetic CO2 assimilation in leaves of C3 species, Planta, 149, 78–90, 1980.
Field, C. and Mooney, H.: Photosynthesis–nitrogen relationship in wild plants, in: On the Economy of Plant Form and Function: Proceedings of the Sixth Maria Moors Cabot Symposium, “Evolutionary Constraints on Primary Productivity, Adaptive Patterns of Energy Capture in Plants”, Harvard Forest, Cambridge University, Cambridge, UK, August 1983, 1986.
Ghashghaie, J., Badeck, F.-W., Lanigan, G., Nogués, S., Tcherkez, G., Deléens, E., Cornic, G., and Griffiths, H.: Carbon isotope fractionation during dark respiration and photorespiration in C3 plants, Phytochem. Rev., 2, 145–161, 2003.
Haxeltine, A. and Prentice, I. C.: A general model for the light-use efficiency of primary production, Funct. Ecol., 10, 551–561, 1996.
Hikosaka, K., Ishikawa, K., Borjigidai, A., Muller, O., and Onoda, Y.: Temperature acclimation of photosynthesis: mechanisms involved in the changes in temperature dependence of photosynthetic rate, J. Exp. Bot., 57, 291–302, 2006.
Hutchinson, M.: Daily minimum temperature: ANUClimate 1.0, 0.01 degree, Australian Coverage, 1970–2012, Terrestrial Ecosystem Research Network's (TERN) Ecosystem Modelling and Scaling Infrastructure (eMAST), available at: http://geonetworkrr9.nci.org.au/geonetwork/srv/eng/catalog.search#/metadata/6572bca1-dc0d-422e-ac7e-89fbf6236d34 (last access: 1 April 2016), 2014a.
Hutchinson, M.: Daily maximum temperature: ANUClimate 1.0, 0.01 degree, Australian Coverage, 1970–2012, Terrestrial Ecosystem Research Network's (TERN) Ecosystem Modelling and Scaling Infrastructure (eMAST), available at: http://geonetworkrr9.nci.org.au/geonetwork/srv/eng/catalog.search#/metadata/6572bca1-dc0d-422e-ac7e-89fbf6236d34 (last access: 1 April 2016), 2014b.
Hutchinson, M.: Daily precipitation: ANUClimate 1.0, 0.01 degree, Australian Coverage, 1970–2012, Terrestrial Ecosystem Research Network's (TERN) Ecosystem Modelling and Scaling Infrastructure (eMAST), available at: http://geonetworkrr9.nci.org.au/geonetwork/srv/eng/catalog.search#/metadata/c49888fe-eb97-4c2a-abfc-273a9d8e95d4 (last access: 1 April 2016), 2014c.
Kattge, J. and Knorr, W.: Temperature acclimation in a biochemical model of photosynthesis: a reanalysis of data from 36 species, Plant Cell Environ., 30, 1176–1190, 2007.
Krömer, S.: Respiration during photosynthesis, Annu. Rev. Plant Biol., 46, 45–70, 1995.
Larigauderie, A. and Körner, C.: Acclimation of leaf dark respiration to temperature in alpine and lowland plant species, Ann. Bot.-London, 76, 245–252, 1995.
Lee, T., Reich, P., and Bolstad, P.: Acclimation of leaf respiration to temperature is rapid and related to specific leaf area, soluble sugars and leaf nitrogen across three temperate deciduous tree species, Funct. Ecology, 19, 640–647, 2005.
Lin, Y.-S., Medlyn, B. E., De Kauwe, M. G., and Ellsworth, D. S.: Biochemical photosynthetic responses to temperature: how do interspecific differences compare with seasonal shifts?, Tree Physiol., 33, 793–806, 2013.
Maire, V., Martre, P., Kattge, J., Gastal, F., Esser, G., Fontaine, S., and Soussana, J.-F.: The coordination of leaf photosynthesis links C and N fluxes in C3 plant species, PLoS ONE, 7, e38345 https://doi.org/10.1371/journal.pone.0038345, 2012.
Medlyn, B. E.: The optimal allocation of nitrogen within the C3 photosynthetic system at elevated CO2, Aust. J. Plant Physiol., 23, 593–603, 1996.
Medlyn, B. E., Dreyer, E., Ellsworth, D., Forstreuter, M., Harley, P. C., Kirschbaum, M. U. F., Le Roux, X., Montpied, P., Strassemeyer, J., Walcroft, A., Wang, K., and Loustau, D.: Temperature response of parameters of a biochemically based model of photosynthesis. II. A review of experimental data, Plant Cell Environ., 25, 1167–1179, 2002a.
Medlyn, B. E., Loustau, D., and Delzon, S.: Temperature response of parameters of a biochemically based model of photosynthesis. I. Seasonal changes in mature maritime pine (Pinus pinaster Ait.), Plant Cell Environ., 25, 1155–1165, 2002b.
Miyazawa, Y. and Kikuzawa, K.: Physiological basis of seasonal trend in leaf photosynthesis of five evergreen broad-leaved species in a temperate deciduous forest, Tree Physiol., 26, 249–256, 2006.
Onoda, Y., Hikosaka, K., and Hirose, T.: Seasonal change in the balance between capacities of RuBP carboxylation and RuBP regeneration affects CO2 response of photosynthesis in Polygonum cuspidatum, J. Exp. Bot., 56, 755–763, 2005.
Prentice, I. C., Meng, T., Wang, H., Harrison, S. P., Ni, J., and Wang, G.: Evidence of a universal scaling relationship for leaf CO2 drawdown along an aridity gradient, New Phytol., 190, 169–180, 2011.
Prentice, I. C., Dong, N., Gleason, S. M., Maire, V., and Wright, I. J.: Balancing the costs of carbon gain and water transport: testing a new theoretical framework for plant functional ecology, Ecol. Lett., 17, 82–91, 2014.
Prober, S., Thiele, K., Rundel, P., Yates, C., Berry, S., Byrne, M., Christidis, L., Gosper, C., Grierson, P., Lemson, K., Lyons, T., Macfarlane, C., O'Connor, M., Scott, J., Standish, R., Stock, W., van Etten, E. B., Wardell-Johnson, G., and Watson, A.: Facilitating adaptation of biodiversity to climate change: a conceptual framework applied to the world's largest Mediterranean-climate woodland, Climatic Change, 110, 227–248, 2012.
Prober, S., Macfarlane, C., Atkin, O. P., Evans, B. J., Bloomfield, K., Prentice, I. C., and Togashi, H. F.: Leaf level physiology, chemistry and structural traits, Great Western Woodlands SuperSite, 2014, TERN, Brisbane, Australia, available at: http://portal.tern.org.au/leaf-level-physiology-supersite-2014/19952 (last access: 21 May 2018), 2015.
R Core Team: R: A language and environment for statistical computing. R Foundation for Statistical Computing, Vienna, Austria, http://www.R-project.org/ (last access: 21 May 2018), 2012.
Quebbeman, J. A. and Ramirez, J. A.: Optimal allocation of leaf-level nitrogen: Implications for covariation of Vcmax and Jcmax and photosynthetic downregulation, J. Geophys. Res.-Biogeo., 121, 2464–2475, 2016.
Reich, P. B., Sendall, K. M., Stefanski, A., Wei, X., Rich, R. L., and Montgomery, R. A.: Boreal and temperate trees show strong acclimation of respiration to warming, Nature, 531, 633–636, 2016.
Sage, R. F. and Kubien, D. S.: The temperature response of C3 and C4 photosynthesis, Plant Cell Environ., 30, 1086–1106, 2007.
Scafaro, A. P., Negrini, A. C. A., O'Leary, B., Rashid, F. A. A., Hayes, L., Fan, Y., Zhang, Y., Chochois, V., Badger, M. R., and Millar, A. H.: The combination of gas-phase fluorophore technology and automation to enable high-throughput analysis of plant respiration, Plant Methods, 2017, 13, https://doi.org/10.1186/s13007-017-0169-3, 2017.
Sharkey, T. D., Bernacchi, C. J., Farquhar, G. D., and Singsaas, E. L.: Fitting photosynthetic carbon dioxide response curves for C3 leaves, Plant Cell Environ., 30, 1035–1040, 2007.
Sitch, S., Smith, B., Prentice, I. C., Arneth, A., Bondeau, A., Cramer, W., Kaplan, J. O., Levis, S., Lucht, W., Sykes, M. T., Thonicke, K., and Venevsky, S.: Evaluation of ecosystem dynamics, plant geography and terrestrial carbon cycling in the LPJ dynamic global vegetation model, Global Change Biol., 9, 161–185, 2003.
Slot, M. and Kitajima, K.: General patterns of acclimation of leaf respiration to elevated temperatures across biomes and plant types, Oecologia, 177, 885–900, 2015.
Vanderwel, M. C., Slot, M., Lichstein, J. W., Reich, P. B., Kattge, J., Atkin, O. K., Bloomfield, K. J., Tjoelker, M. G., and Kitajima, K.: Global convergence in leaf respiration from estimates of thermal acclimation across time and space, New Phytol., 207, 1026–1037, 2015.
Von Caemmerer, S.: Biochemical Models of Leaf Photosynthesis, CSIRO Publishing, Victoria, Australia, 2000.
Von Caemmerer, S. and Farquhar, G. D.: Some relationships between the biochemistry of photosynthesis and the gas exchange of leaves, Planta, 153, 376–387, 1981.
Wang, H., Prentice, I. C., and Davis, T. W.: Biophsyical constraints on gross primary production by the terrestrial biosphere, Biogeosciences, 11, 5987–6001, https://doi.org/10.5194/bg-11-5987-2014, 2014.
Wang, H., Prentice, I. C., Cornwell, W. M., Keenan, T. F., Davis, T. W., Wright, I. J., Evans, B. J., and Peng, C.: Towards a universal model for carbon dioxide uptake by plants, Nat. Plants, 3, 734–741, 2017.
Warton, D. I., Wright, I. J., Falster, D. S., and Westoby, M.: Bivariate line-fitting methods for allometry, Biol. Rev., 81, 259–291, 2006.
Way, D. A. and Sage, R. F.: Thermal acclimation of photosynthesis in black spruce [Picea mariana (Mill.) B.S.P.], Plant Cell Environ., 31, 1250–1262, 2008.
Way, D. A. and Yamori, W.: Thermal acclimation of photosynthesis: on the importance of adjusting our definitions and accounting for thermal acclimation of respiration, Photosynth. Res., 119, 89–100, 2014.
Westoby, M. and Wright, I. J.: Land-plant ecology on the basis of functional traits, Trends Ecol. Evol., 21, 261–268, 2006.
Wickham, H.: ggplot2: Elegant Graphics for Data Analysis, Springer, Berlin, Germany, 2010.
Wilson, K. B., Baldocchi, D. D., and Hanson, P. J.: Spatial and seasonal variability of photosynthetic parameters and their relationship to leaf nitrogen in a deciduous forest, Tree Physiol., 20, 565–578, 2000.
Wullschleger, S. D.: Biochemical limitations to carbon assimilation in C3 plants – A Retrospective Analysis of the A ∕ Ci Curves from 109 Species, J. Exp. Bot., 44, 907–920, 1993.
Zaragoza-Castells, J., Sánchez-Gómez, D., Valladares, F., Hurry, V., and Atkin, O. K.: Does growth irradiance affect temperature dependence and thermal acclimation of leaf respiration? Insights from a Mediterranean tree with long-lived leaves, Plant Cell Environ., 30, 820–833, 2007.