the Creative Commons Attribution 4.0 License.
the Creative Commons Attribution 4.0 License.
 | 15 Jun 2018
A three-dimensional niche comparison of Emiliania huxleyi and Gephyrocapsa oceanica: reconciling observations with projections
Natasha A. Gafar
Kai G. Schulz
Coccolithophore responses to changes in carbonate chemistry speciation such as CO2 and H+ are highly modulated by light intensity and temperature. Here, we fit an analytical equation, accounting for simultaneous changes in carbonate chemistry speciation, light and temperature, to published and original data for Emiliania huxleyi, and compare the projections with those for Gephyrocapsa oceanica. Based on our analysis, the two most common bloom-forming species in present-day coccolithophore communities appear to be adapted for a similar fundamental light niche but slightly different ones for temperature and CO2, with E. huxleyi having a tolerance to lower temperatures and higher CO2 levels than G. oceanica. Based on growth rates, a dominance of E. huxleyi over G. oceanica is projected below temperatures of 22 ∘C at current atmospheric CO2 levels. This is similar to a global surface sediment compilation of E. huxleyi and G. oceanica coccolith abundances suggesting temperature-dependent dominance shifts. For a future Representative Concentration Pathway (RCP) 8.5 climate change scenario (1000 µatm fCO2), we project a CO2 driven niche contraction for G. oceanica to regions of even higher temperatures. However, the greater sensitivity of G. oceanica to increasing CO2 is partially mitigated by increasing temperatures. Finally, we compare satellite-derived particulate inorganic carbon estimates in the surface ocean with a recently proposed metric for potential coccolithophore success on the community level, i.e. the temperature-, light- and carbonate-chemistry-dependent CaCO3 production potential (CCPP). Based on E. huxleyi alone, as there was interestingly a better correlation than when in combination with G. oceanica, and excluding the Antarctic province from the analysis, we found a good correlation between CCPP and satellite-derived particulate inorganic carbon (PIC) with an R2 of 0.73, p < 0.01 and a slope of 1.03 for austral winter/boreal summer and an R2 of 0.85, p < 0.01 and a slope of 0.32 for austral summer/boreal winter.
- Article
(6044 KB) - Full-text XML
-
Supplement
(226 KB) - BibTeX
- EndNote


Since the Industrial Revolution in the late 18th century, burning of fossil fuels as well as wide-scale deforestation have contributed to significant increases in atmospheric carbon dioxide, CO2 (IPCC, 2013a). Depending upon the decisions in the next few decades, atmospheric CO2 levels are projected to reach between 420 µatm, which is the Representative Concentration Pathway (RCP) 2.6 scenario, and 985 µatm (RCP8.5 scenario) by 2100 (Caldeira and Wickett, 2005; Orr et al., 2005; IPCC, 2013a). To date, approximately one-third of the anthropogenic carbon emissions have been absorbed by the world's oceans (Sabine et al., 2004). As atmospheric partial pressures of CO2 (pCO2) increase, CO2 concentrations in the surface ocean also increase, resulting in increased bicarbonate and hydrogen ions but also in decreased carbonate ion concentrations and pH (Doney et al., 2009; Schulz et al., 2009). These changes, often termed ocean carbonation and acidification, can have both positive and negative effects for different phytoplankton species and groups (e.g. Engel et al., 2005; Feng et al., 2010; Moheimani and Borowitzka, 2011; Endo et al., 2013; Schulz et al., 2017).
Associated with rising pCO2 is the phenomenon of global warming. Under current scenarios, ocean temperatures are projected to increase from 2.6 to 4.8 ∘C by 2100 (IPCC, 2013b). In addition, warming of the ocean is expected to enhance vertical stratification of the water column, resulting in a shoaling of the surface mixed layer and increasing overall light and decreasing nutrient availability in the euphotic zone (Bopp et al., 2001; Rost and Riebesell, 2004; Lefebvre et al., 2012). While increased light intensity and temperatures often accelerate growth in phytoplankton, excessive levels of light and temperature can cause damage to the photosynthetic apparatus and reduce effectiveness of enzymes, thus decreasing growth (Powles, 1984; Rhodes et al., 1995; Crafts-Brandner and Salvucci, 2000; Zondervan et al., 2002; Helm et al., 2007; Pörtner and Farrell, 2008). Meanwhile, reduced nutrient availability could diminish overall productivity.
Coccolithophores play an important role in the marine carbon cycle through the precipitation of calcium carbonate, via calcification and the formation and settling of coccolith aggregates, as well as inorganic carbon fixation by photosynthesis (Rost and Riebesell, 2004; Broecker and Clark, 2009; Poulton et al., 2007, 2010). The coccolithophores Emiliania huxleyi and Gephyrocapsa oceanica are considered the most common species in present-day coccolithophore communities. E. huxleyi is a ubiquitous coccolithophore having been observed from polar to equatorial regions, from nutrient-poor ocean gyres to nutrient-rich upwelling systems and from the bright sea surface down to 200 m depth (McIntyre and Bé, 1967; Winter et al., 1994; Hagino and Okada, 2006; Boeckel and Baumann, 2008; Mohan et al., 2008; Henderiks et al., 2012). The wide tolerance of E. huxleyi to different environmental conditions is believed to be, at least partially, explained by the existence of several environmentally selected ecotypes and morphotypes within the species (Paasche, 2001; Cook et al., 2011). G. oceanica is also found in most oceanographic regions (McIntyre and Bé, 1967; Okada and Honjo, 1975; Roth and Coulbourn, 1982; Knappertsbusch, 1993; Eynaud et al., 1999; Andruleit et al., 2003; Saavedra-Pellitero et al., 2014), however with a tendency towards warmer waters with very few specimens observed below 13 ∘C (McIntyre and Bé, 1967; Eynaud et al., 1999; Hagino et al., 2005). It is well established that rising pCO2 will have significant effects on coccolithophorid growth, calcification and photosynthetic carbon fixation rates (Riebesell et al., 2000; Bach et al., 2011; Raven and Crawfurd, 2012). Furthermore, it has been shown that the response to rising pCO2 of both G. oceanica and E. huxleyi is strongly influenced by light intensity and temperature (Zondervan et al., 2002; Schneider, 2004; De Bodt et al., 2010; Sett et al., 2014; Zhang et al., 2015). However, to which degree species-specific responses may shape individual distribution and abundance in the future ocean is far less clear.
This is because the distribution and abundance of a species is controlled by several factors. Firstly, each species has a specific range of environmental conditions under which they can successfully grow and reproduce called the fundamental niche. The fundamental niche describes the multidimensional combination of environmental conditions, such as temperature, light and pCO2, required for survival of a species assuming no other species are present (Leibold, 1995). However, species do not exist in a vacuum, and where the niche of a species overlaps with another species interactions such as competition for resources and predation can occur (Hutchinson, 1957; Leibold, 1995), resulting in the realised niche (Leibold, 1995; Zurell et al., 2016). Hence, it is not only important to determine how environmental change shapes the fundamental niche of individual species but also consider the impact of niche overlap of different species in shaping the realised niches and hence community composition.
In the present study, we therefore compare species-specific sensitivities and responses to combined light, temperature and carbonate chemistry changes of two of the most abundant coccolithophores (Emiliania huxleyi and Gephyrocapsa oceanica). For that purpose, E. huxleyi was grown at 12 pCO2 levels and five light intensities, and growth, photosynthetic carbon fixation and calcification rates were measured in response. These data were then combined with a previously published dataset on temperature and CO2 interaction (Sett et al., 2014) and fitted to an analytical equation describing the combined effects of changing carbonate chemistry speciation, light and temperature. The resulting projections are then compared to those previously published for G. oceanica (Gafar et al., 2018) in an attempt to assess their individual success and potential realised niche in a changing ocean. Finally, we compare satellite-derived particulate inorganic carbon estimates with a recently proposed metric for coccolithophore success on the community level, i.e. the temperature-, light- and carbonate-chemistry-speciation-dependent calcium carbonate potential (Gafar et al., 2018).
2.1 Experimental setup
To accurately identify optimal conditions, tipping points and sensitivities of rates in response to changing CO2, light and temperature, a broad range of experimental conditions are required. Hence, monospecific cultures of the coccolithophore E. huxleyi (strain PML B92/11 morphotype A isolated from Bergen, Norway) were grown in artificial seawater (ASW) at 20 ∘C and a salinity of 35 across a pCO2 (partial pressure of CO2) gradient from ∼ 25 to 7000 µatm. Light intensities were set to 50, 400 and 600 µmol photons m−2 s−1 of photosynthetically active radiation (PAR) on a 16:8 h light–dark cycle in a Panasonic versatile environmental test chamber (MLR-352-PE). An additional set of cultures was also incubated at 1200 µmol photons m−2 s−1 under a Philips SON-T HPS 600W light in a water bath set to 20 ∘C. Light intensities at each bottle position for all experiments were measured using a LI-193 spherical sensor (LI-COR). Cells were pre-acclimated to experimental conditions for 8–12 generations. To account for differences in growth rate between the extreme high/low CO2 treatments and the intermediate CO2 treatments, initial cell densities were chosen between 20 and 80 cells mL−1. Treatments were run using a dilute-batch culture setup, mixed daily and harvested before dissolved inorganic carbon (DIC) consumption exceeded 10 %.
2.2 Media
ASW with a salinity of 35 was prepared according to Kester et al. (1967). ASW was enriched with f∕8 trace metals (ethylenediaminetetraacetic acid (EDTA)-bound Fe, Cu, Mo, Zn, Co, Mn) and vitamins (thiamine, biotin, cyanocobalamin) according to Guillard (1975), 64 µmol kg−1 nitrate (), 4 µmol kg−1 phosphate (), 10 nmol kg−1 SeO2 and 1 mL kg−1 of coastal seawater (collected at Shelly Beach, Ballina, NSW, Australia) to prevent possible limitation by trace elements during culturing which had not been added to the artificial seawater mix. ASW medium was sterile filtered (0.2 µm pore size, Whatman™ Polycap 75 AS) directly into autoclaved acclimation (0.5 L) or experimental (2 L) polycarbonate bottles (Nalgene®), leaving a small headspace for the adjustment of carbonate chemistry conditions.
2.3 Carbonate chemistry manipulation, measurements and calculation
Carbonate chemistry, i.e. total alkalinity (TA) and DIC, for each treatment was adjusted through calculated additions of hydrochloric acid (certified 3.571 mol L−1 HCl, Merck) and Na2CO3 (Sigma-Aldrich, TraceSELECT® quality, dried for 2 h at 240 ∘C). Samples for TA and DIC measurements were taken at the end of the experiment. TA samples were filtered through GF/F filters, stored in the dark at 4 ∘C and processed within 7 days (Dickson et al., 2007; SOP 1). TA samples were measured by potentiometric titration using a Metrohm Titrino Plus automatic titrator with 0.05 mol kg−1 HCl as the titrant, adjusted to an ionic strength of 0.72 mol kg−1 with NaCl (Dickson et al., 2007; SOP 3b).
DIC samples were sterile filtered by gentle pressure filtration with a peristaltic pump (0.2 µm pore size polycarbonate, Sartorius) into glass stoppered 100 mL bottles (Schott Duran) with overflow of at least 50 % of bottle volume similar to Bockmon and Dickson (2014), sealed without headspace and stored in the dark at 4 ∘C until processing within 7 days. To determine DIC, 2 mL of sample was analysed on a Marianda AIRICA system by acidification with 10 % phosphoric acid to convert all DIC into CO2, followed by extraction with N2 (5.0) and concomitant CO2 analysis with an IR detector (LI-COR LI-7000 CO2 ∕ H2O analyser). Both TA and DIC measurements were calibrated against certified reference materials (batches 139, 141 and 150) following Dickson (2010). Initial DIC and TA concentrations were estimated by adding measured total particulate carbon build-up during incubations to measured final DIC and double the particulate inorganic carbon build-up during incubations to measured final TA concentrations. Carbonate chemistry speciation for each treatment was calculated from mean TA, mean DIC, measured temperature, salinity and [] using the program CO2SYS (Lewis et al., 1998), the dissociation constants for carbonic acid determined by Lueker et al. (2000), KS for sulfuric acid determined by Dickson et al. (1990) and KB for boric acid following Uppström (1974).
2.4 Particulate organic and inorganic carbon
Sampling started approximately 2 h after the onset of the light period and lasted no longer than 3 h. Duplicate samples for total and particulate organic carbon (TPC and POC) were filtered (−200 mbar) onto GF/F filters (Whatmann, precombusted at 500 ∘C for 4 h) and stored in glass petri dishes (precombusted at 500 ∘C for 4 h) at −20 ∘C until analysis. POC filters were placed in a desiccator above fuming (37 %) HCl for 2 h to remove all particulate inorganic carbon (PIC). All filters were dried overnight at 60 ∘C and analysed for carbon content and corresponding isotopic signature according to Sharp (1974) on an elemental analyser (Flash EA, Thermo Fisher) coupled to an isotope ratio mass spectrometer (IRMS, Delta V plus, Thermo Fisher). PIC was calculated by subtracting measured POC from TPC.
2.5 Growth
Cell densities were measured every 3–4 days after the commencement of the experiment using a flow cytometer (Becton Dickinson FACSCalibur) on high flow settings (58 µL min−1) for 2 min per measurement. Living cells were detected by their red autofluorescence in relation to their orange fluorescence in scatter plots (FL3 vs. FL2). At both the extreme low and high CO2 treatments, carbonate chemistry at the end of the pre-incubation phase can significantly deviate from initial and hence experimental treatment conditions due to enhanced air/water CO2 gas exchange during regular cell abundance monitoring. As a result, at some extreme CO2 levels, there was an initial lag phase, and therefore growth rates were calculated from densities only during the exponential part of the growth phase. After disregarding lag-phase measurements, the majority of treatments had only two to three data points in the exponential phase. As a result, specific growth rates were calculated as
where Cf represents cell densities at time of sampling, C0 represents cell densities at the beginning of the exponential growth phase, and d is the duration of the exponential phase in days. Calcification and photosynthetic rates were calculated by multiplying cellular PIC and POC quotas with respective growth rates.
2.6 Fitting procedure
Coccolithophore metabolic rate (MR) responses of growth, calcification and photosynthetic carbon fixation to combined changes in temperature, light and carbonate chemistry speciation can be described as follows (Gafar et al., 2018):
where k1 (pg C cell−1 d−1 or d−1), k2 (µmol photons m−2 s−1), k3 (kg mol−1 µmol photons m−2 s−1), k4 (mol kg−1 ∘C), k5 (∘C), k6 (kg mol−1 µmol photons−1 m2s ∘C−1) are fit coefficients, and MR (T, I, S, H) is the metabolic rate of photosynthesis, calcification or growth dependent on temperature (T), light intensity (I), substrate (S= [CO2] + []) and [H+] (H). Inputs to the equation consisted of calculated CO2, and H+ (H in total scale) concentrations, as well as measured metabolic rates, and light (I) and temperature (T) levels of all treatments (please see below for information on temperature and light transforms).
Data from this study (Tables S1, S2) and Sett et al. (2014) were fitted to Eq. (2) using the non-linear regression fit procedure nlinfit in MATLAB (MathWorks). The reason only these studies were chosen, from the multitude of E. huxleyi datasets, is because (1) they use the same strain (PML B92/11), (2) they have the same nutrient conditions, and (3) they use the same carbonate chemistry manipulation methods. Nevertheless, the two chosen studies provided light (six levels) and temperature (three levels) interactions over a broad carbonate chemistry speciation range. It is noted that in both studies the carbonate chemistry system is coupled, meaning that a change in CO2 results in a change in pH. This method reflects the changes in carbonate chemistry speciation due to ongoing ocean acidification (Bach et al., 2011, 2013). However, some studies have examined the effects of decoupled carbonate chemistry where CO2 is changed at a constant pH. This approach is used to tease apart the independent effects of H+ and CO2 on physiological responses (see Bach et al., 2013). While Eq. (2) can also be used to explain responses under decoupled carbonate chemistry conditions (see Gafar et al., 2018 for details), the fit obtained here is only valid for coupled CO2/pH changes as no data from decoupled experiments (i.e. Bach et al., 2011) have been used. The reason for this is that Bach et al. (2011) does not contain data of temperature, light and carbonate chemistry interactions.
Table 1Fit coefficients (k1 to k6), R2, F values, degrees of freedom and p values obtained for calcification (pg C cell−1 d−1), photosynthetic carbon fixation (pg C cell−1 d−1) and growth rates (d−1) from Eq. (2) fitted to data from this study and Sett et al. (2014). For calcification and photosynthetic carbon fixation rates, the unit for v is pg C cell−1 d−1, while for growth rates, the unit for v is d−1.
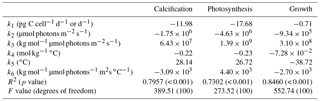
Table 2Optimum CO2 concentrations, CO2 concentrations and maximum rates (Vmax) at 10, 15 and 20 ∘C from Eq. (2) fit to CO2 light data at 20 ∘C in this paper, and E. huxleyi CO2 data from Sett et al. (2014) at 10, 15 and 20 ∘C and 150 µmol photons m−2 s−1 light intensity. Note that the CO2 working range for the equation for this species was 0–250 µmol kg−1. Values exceeding this range were reported as > 250 µmol kg−1.
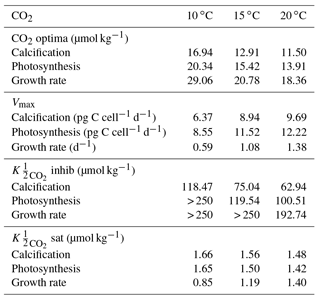
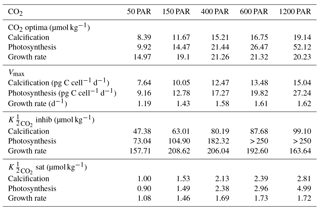
Table 3Optimum CO2 concentrations, CO2 concentrations and maximum rates (Vmax) at 50–1200 µmol photons m−2 s−1 from Eq. (2) fit to CO2 data at 50, 400, 600 and 1200 µmol photons m−2 s−1 and 20 ∘C in this paper and E. huxleyi CO2 data from Sett et al. (2014) at 150 µmol photons m−2 s−1 light intensity and 10, 15 and 20 ∘C. Note that the CO2 working range for the equation for this species was 0–250 µmol kg−1. Values exceeding this range were reported as > 250 µmol kg−1.
2.7 Temperature and light transformations
To reduce skew and to better accommodate certain features (i.e. light and temperature inhibition and limitation), both temperature and light data were transformed. Light data were square root transformed with light , where PFD is the photon flux density (µmol photons m−2 s−1) of an incubation. To accommodate for known temperature inhibition below 2 and above 30 ∘C (Rhodes et al., 1995; van Rijssel and Gieskes, 2002; Helm et al., 2007; Zhang et al., 2014) at a much narrower experimental range (10–20 ∘C), the upper and lower limits for E. huxleyi growth were added into the equation with a general transform of , where Tt is the temperature of an incubation. To accurately express the onset of high temperature inhibition, the transform was further modified with a square root transform to give . This transform produces reasonable results when compared to the Eppley temperature envelope curve and the Norberg model (see Gafar et al., 2018).
2.8 Physiological rate response parameter estimations to changes in carbonate chemistry, temperature and light
Equation (2) was used to assess the combined effects of carbonate chemistry, temperature and light on growth, calcification and photosynthetic carbon fixation rates, with a focus on general physiological features, such as limitation and inhibition, as well as how much variability could be explained. For growth, photosynthetic carbon fixation and calcification rates of optimum CO2 concentrations for maximum production rates (Vmax) and half-saturation values were calculated at each experimental light and temperature level. values consisted of sat which is the CO2 concentration (at certain T and I) at which rates are saturated to half the maximum, and inhib, which is the CO2 concentration (at certain T and I) at which high proton concentrations reduce physiological rates to half the maximum. Fitting results (R2, fit coefficients, p values, F values and degrees of freedom), as well as Vmax, and CO2 optima are presented in Tables 1, 2 and 3. Species-specific differences in response to changing carbonate chemistry, temperature and light were assessed by comparing the above fit to that recently produced for Gephyrocapsa oceanica (Gafar et al., 2018).
2.9 Niche comparison
To examine the potential of ongoing ocean change to influence realised niches, and hence individual success, ranges for light and temperature where both Emiliania huxleyi and Gephyrocapsa oceanica might be expected to coexist were selected (i.e. 50–1000 µmol photons m−2 s−1 and 8–30 ∘C). E. huxleyi and G. oceanica were chosen for comparison as they are currently the only two species with response data over a range of carbonate chemistry, temperature and light conditions. Growth rates were selected as the point of comparison because they can be used as a measure of relative abundance and therefore dominance of a species, and because growth rates largely control carbon fixation rates. To assess competitive ability, and the potential realised niche, the difference in growth rates between the species was visualised using contour plots.
The effect of temperature on growth rates and hence potential dominance was then compared to phytoplankton community data from global surface sediment samples above the lysocline (McIntyre and Bé, 1967; Chen and Shieh, 1982; Roth and Coulbourn, 1982; Knappertsbusch, 1993; Andruleit and Rogalla, 2002; Boeckel et al., 2006; Fernando et al., 2007; Saavedra-Pellitero et al., 2014). As E. huxleyi and G. oceanica have similar average numbers of coccoliths per cells, 28 and 21, respectively (Samtleben and Schroder, 1992; Knappertsbusch, 1993; Baumann et al., 2000; Boeckel and Baumann, 2008; Patil et al., 2014), the abundance ratio of E. huxleyi to G. oceanica coccoliths was here assumed to be a suitable proxy for species dominance. It is noted that E. huxleyi has been found to produce excess coccoliths towards the end of blooms when inorganic nutrients become limiting for cellular growth (Balch et al., 1992; Holligan et al., 1993; Paasche, 1998), which would result in an overestimate of E. huxleyi dominance in our study. Nevertheless, given that the coccoliths' ratio varies orders of magnitude in modern marine sediments, none of our general conclusions should be affected. Temperature for each sampling site was retrieved from the National Oceanic and Atmospheric Administration (NOAA) 1∘ resolution annual temperature climatology (Boyer et al., 2013).
2.10 Global calcium carbonate production potential
While our fit equation has previously explained variability in lab experiments quite well (Gafar et al., 2018), natural systems are much more complex, with the interactions of dozens of variables including temperature, light, nutrients, predation and competition all influencing productivity (Behrenfeld, 2014). As such, we wanted to examine how projections of productivity using our relatively simple equation compared to coccolithophorid productivity patterns observed in natural systems. Productivity can be defined in a few ways; traditionally, changes in cellular calcification rates, in response to ocean change, have been used as indicator for the potential success of coccolithophores in the future ocean. However, the exponential nature of phytoplankton growth amplifies even small differences in cellular growth rates, when applied on the community level. For instance, a phytoplankton bloom occurring over 1 week at a growth rate of 1.0 d−1 and a starting cell density of 50 cells mL−1 would lead to a peak density of about 55 000 cells mL−1. This is in stark contrast to conditions where growth is only 10 % lower as peak cell densities, and hence biomass and PIC standing stock, will only be half.
Recently, a new metric was proposed, the CaCO3 production potential (CCPP), which (1) should be a better representation of potential coccolithophore success on the community level and (2) can be tested against modern observations of surface ocean CaCO3 distribution (Gafar et al., 2018). CCPP is defined as the amount of CaCO3 produced within a week by a coccolithophore community (with a set starting cell count) for a certain environmental condition, calculated from Eq. (2) derived growth rates and inorganic carbon quotas. Inorganic carbon quotas are calculated as the quotient of calcification and growth rates. As CCPP is calculated from calcification and growth rates, it accounts for the individual effects of temperature, light and carbonate chemistry on growth rates and on carbon production. It was for these reasons that CCPP was the metric chosen for comparison.
Provided values for temperature, light, substrate (CO2 + ) and hydrogen ion concentrations (H) for the surface mixed layer, coccolithophore CaCO3 production potential can be projected for the world oceans. CCPP can then be cautiously evaluated against and compared to satellite-derived global particulate inorganic carbon concentration estimates (PICs). As inorganic nutrients are a critical factor influencing phytoplankton abundance, and especially bloom formation, in the ocean (Browning et al., 2017), nitrate concentrations were also included in the analysis (for details, see below). As a result, climatological datasets consisted of World Ocean Atlas (WOA) 2013 v2 nitrate concentrations at 1∘ resolution (Boyer et al., 2013); SeaWiFS mixed layer depth (MLD 2∘ resolution) from de Boyer Montégut et al. (2004); surface photosynthetically available radiation (PAR µmol photons m−2 s−1 9 km resolution) from the Moderate Resolution Imaging Spectroradiometer (MODIS)-Aqua (NASA Goddard Space Flight Center, 2014b); diffuse attenuation coefficients at 490 nm (9 km resolution) from Pascal (2013); and NOAA dissolved inorganic carbon, pCO2, pH (total scale), [], temperature and salinity (4 × 5∘ resolution) from Takahashi et al. (2014). A 9 km resolution climatology for particulate inorganic carbon (PICs) concentration (mol PIC m−3) was also retrieved from MODIS-Aqua (NASA Goddard Space Flight Center, 2014a). Once acquired, all datasets were interpolated to a 1∘ resolution.
Hydrogen ion concentrations were calculated as 10−pH, CO2, after conversion of pCO2 to fCO2 as described in CO2SYS (Lewis et al., 1998), as [fCO2] × K0 (with K0 being the temperature- and salinity-dependent Henry's constant), as [] = DIC − ([CO2] + []) and substrate (S) as the sum of CO2 and concentrations. Mean mixed layer nitrate concentrations were calculated by determining concentrations for each depth and averaging from the surface to the mixed layer depth for each grid cell. Mean mixed layer irradiance was calculated in 1 m depth increments for each grid cell as
where I is the average PAR (µmol photons m−2 s−1), kd is the attenuation coefficient (m−1), MLD denotes the mixed layer depth in metres, and I0 is the incident PAR at the surface (µmol photons m−2 s−1).
Global coverage of oceanic nutrient concentrations is often limited to only a few macronutrients (nitrate, silicate, phosphate). However, concentrations of these nutrients are often strongly correlated (e.g. phosphate and nitrate in Boyer et al., 2013). To ensure there were sufficient nutrients to support the level of production estimated by CCPP, we opted to use a single nutrient, i.e. nitrate, in combination with a simple scaling metric. We first assumed a Redfieldian ratio of 106 : 16 C : N to determine the maximum POC production possible from the amount of available nitrate. We then calculated the amount of PIC which would be co-produced based on a mean PIC : POC. The average PIC : POC of E. huxleyi and G. oceanica was calculated as the average of all treatments between 300 and 1000 µatm from Sett et al. (2014), Zhang et al. (2015) and this study. Based on these averages (PIC : POC of 0.8 and 1.35 for E. huxleyi and G. oceanica, respectively), and assuming Redfieldian production, a corresponding PIC : PON of 5.3 and 8.94 was calculated. Hence, maximum CaCO3 production potential (CCPPmax) in a grid cell would be 5.3 and 8.94 times the nitrate concentration for E. huxleyi and G. oceanica, respectively. If estimated CCPP for a cell exceeded CCPPmax, and therefore the nitrate required to produce that much PIC, then it was replaced with the CCPPmax value. If CCPP was less than Cmax, then no further changes were applied.
To ensure that mean global CCPP and mean global PICs would be of the same magnitude, starting cell counts for CCPP calculations were set at 1 mL−1 for E. huxleyi alone, 0.25 mL−1 for G. oceanica alone and 0.25 mL−1 for each species when combined. To allow comparison, CCPP and PICs were both converted to units of µmol PIC L−1. All data were then averaged for austral summer/boreal winter (December–February) and austral winter/boreal summer (June–August). Austral summer/boreal winter and austral winter/boreal summer were chosen as they provide prominent differences between minimum and maximum PIC, while spring and autumn do not. A direct comparison between PICs and CCPP was achieved by splitting results into major ocean biogeographical provinces following Gregg and Casey (2007) with the single change of adjusting the Antarctic and the north ocean regions to start at 45∘ as in Longhurst (2007) rather than 40∘ (see Sect. 4.5). For each major province, the total amount of PICs and CCPP for all comparable grid cells was calculated for austral summer/boreal winter and austral winter/boreal summer. For comparison, values for each basin and season were then converted into percentages of annual global (global summer plus global winter) PICs or CCPP production. Agreement between the satellite and CCPP estimates was then assessed using a linear correlation. While three CCPP scenarios are presented above, only the results with the highest correlation to satellite PIC are shown and discussed below.

Figure 1(a) Fitted PIC, (b) POC production and (c) growth rates (solid lines) of E. huxleyi in response to changes in carbonate chemistry at 10, 15 and 20 ∘C using Eq. (2) and fit coefficients from Table 1. Symbols represent rate measurements from Sett et al. (2014) at 10, 15 and 20 ∘C and 150 µmol photons m−2 s−1. Shaded areas represent modern ocean CO2 concentrations of 8.5–30 µmol kg−1 based on data from Takahashi et al. (2014).
The fit equation (Eq. 2) was able to explain up to 85 % of growth, 80 % of calcification and 73 % of photosynthetic rate variability in E. huxleyi across a broad range of carbonate chemistry (25–4000 µatm), light (50–1200 µmol photons m−2 s−1) and temperature (10–20 ∘C) conditions (Table 1).
3.1 E. huxleyi responses to changing carbonate chemistry: CO2 and H+
Based on fits of Eq. (2), growth, calcification and photosynthetic carbon fixation rates all had a similar optimum curve response to the broad changes in carbonate chemistry speciation (Fig. 1) regardless of temperature and light intensities. Growth, calcification and photosynthetic carbon fixation rates required similar CO2 concentrations, with differences of less than 3 µmol kg−1 under comparable temperature and light conditions, to stimulate rates to half the maximum, sat (Tables 2, 3). Optimum CO2 concentrations for calcification (8.4–19.1 µmol kg−1) were slightly lower than for photosynthesis (9.9–52.1 µmol kg−1) or growth (15–29.1 µmol kg−1 Tables 2, 3). At CO2 concentrations beyond the optimum, a much higher sensitivity to increasing [H+], i.e. inhib, was observed for calcification (47.4–118.5 µmol kg−1) than for photosynthesis (73.0–250 µmol kg−1) or growth rates (157.7–250 µmol kg−1; Tables 2, 3 and Figs. 1, 2).
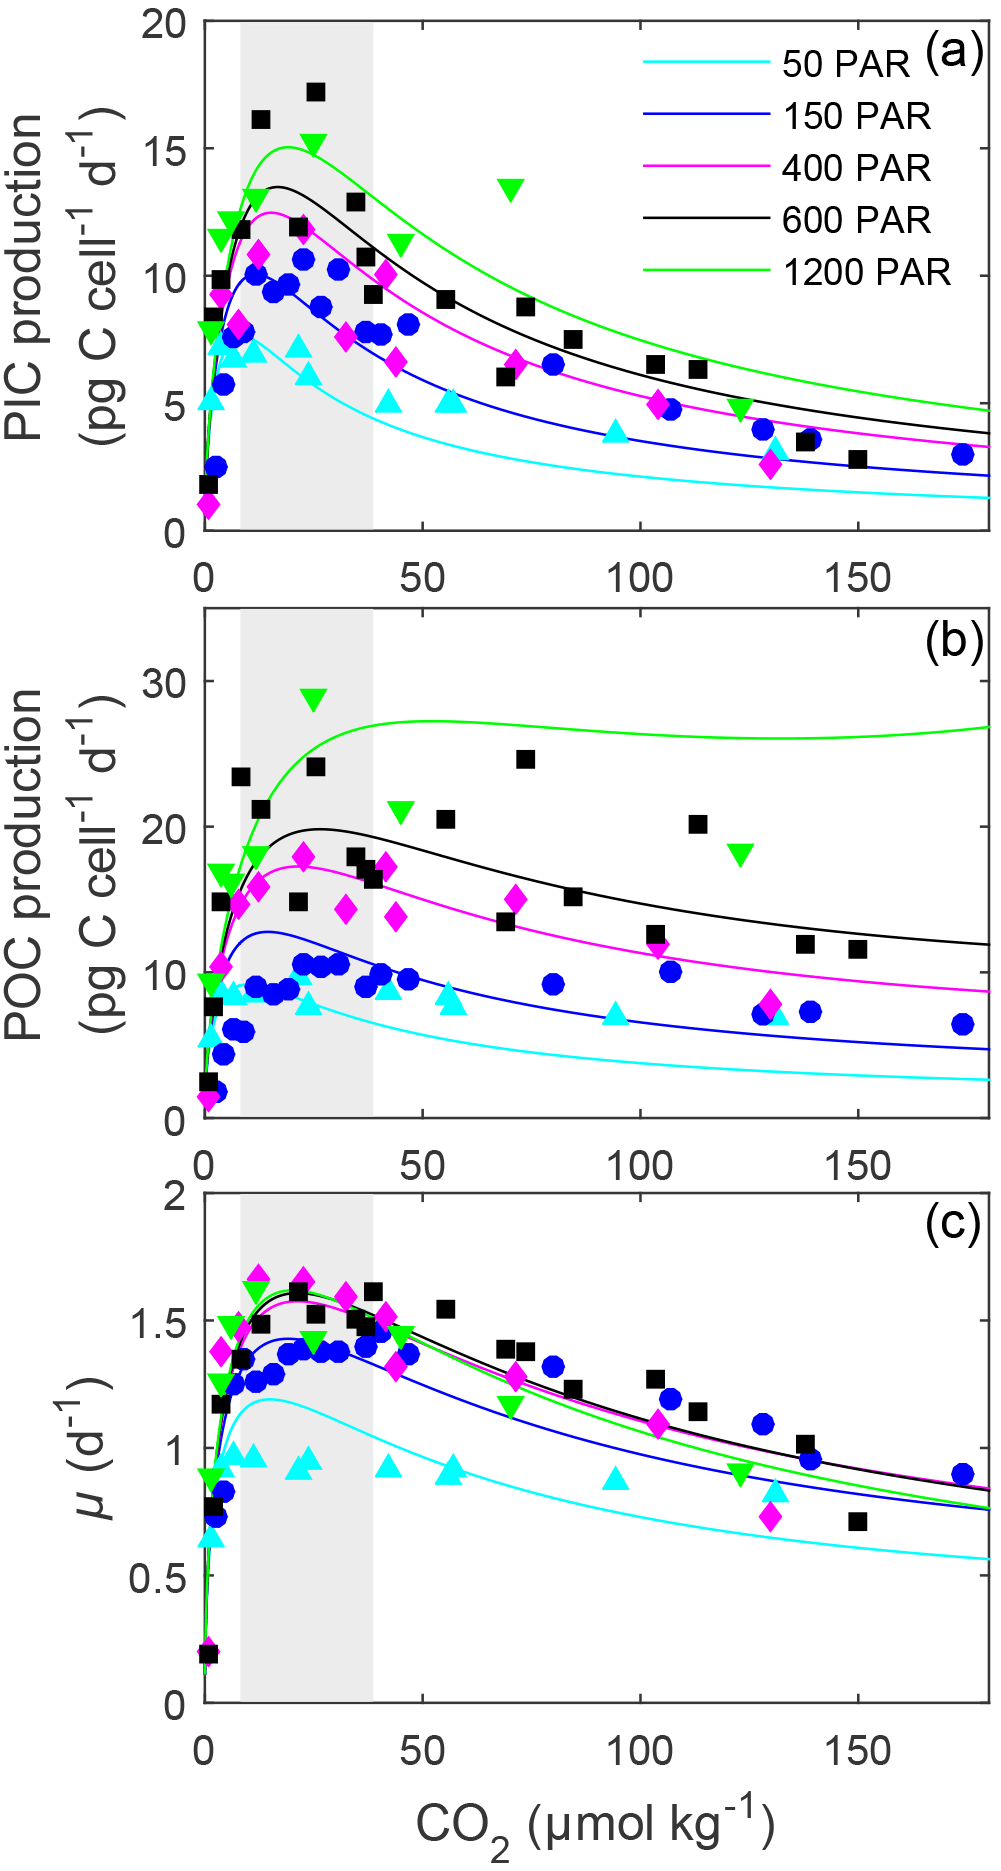
Figure 2Fitted (solid lines) and measured (symbols) (a) PIC and (b) POC production and (c) growth rates of E. huxleyi in response to changes in CO2 concentration at six different light intensities using Eq. (2) and fit coefficients from Table 1. Symbols represent rate measurements from this paper at a constant temperature (20 ∘C) and 50, 150, 400, 600 and 1200 µmol photons m−2 s−1. Shaded areas represent modern ocean CO2 concentrations of 8.5–30 µmol kg−1 based on data from Takahashi et al. (2014).
3.2 E. huxleyi responses to temperature
The effect of temperature on rates was dependent upon CO2, with the greatest effect observed at optimum CO2 concentrations (Fig. 1). Increasing temperature increased maximum growth rates (Vmax) up to 2-fold, photosynthetic rates up to 43 % and calcification rates up to 52 % (Fig. 1, Table 2) under optimal CO2 concentrations. CO2 half-saturation concentrations ( sat) were insensitive to temperature (Table 2). However, under increasing temperatures, CO2 concentrations for both optimal growth and for inhibition of rates to half the maximum ( inhib) decreased (Table 2).
3.3 E. huxleyi responses to light
Light intensities affected all physiological rates, with the greatest effect generally being observed at CO2 concentrations at or above the optimum (Fig. 2). Between 50 and 1200 µmol photons m−2 s−1, calcification rates doubled, photosynthetic rates tripled and growth rates increased around 36 % (Fig. 2, Table 3). Both optimum CO2 and CO2 concentrations at which rates were half saturated ( sat) increased slightly with increasing light intensity (Table 3). CO2 concentrations required to inhibit rates to half of the maximum ( inhib) for calcification and photosynthesis increased with increasing light intensity, while those for growth increased from 50 to 150 µmol photons m−2 s−1 before decreasing with further increases in light (Table 3).
4.1 Responses to changing carbonate chemistry: CO2 and H+
Rates of photosynthesis, calcification and growth in coccolithophores are strongly influenced by CO2 (Bach et al., 2011; Sett et al., 2014; Zhang et al., 2015). Increasing CO2 concentrations resulted in enhanced rates up to an optimum level beyond which they then declined again. This pattern in growth, photosynthetic carbon fixation and calcification rates has been observed previously for several coccolithophore species (Sett et al., 2014; Bach et al., 2015). The availability of substrate (CO2 and ) was suggested as the factor influencing the increase in rates on the left side of the optimum, while the proton concentration ([H+]) was the factor most likely driving declines to the right side of the optimum (Bach et al., 2011, 2015).
Of the two species, E. huxleyi has a higher CO2 optimum than G. oceanica (Tables 2, 3 and S3; Gafar et al., 2018) for all rates and under most conditions. This could suggest that E. huxleyi has a slightly higher substrate requirement than G. oceanica. However, considering that G. oceanica has both a larger cell size and higher carbon quotas per cell, the opposite would be expected (Sett et al., 2014; Bach et al., 2015). An explanation for achieving maximum rates only at higher CO2 concentrations in E. huxleyi, in comparison to G. oceanica despite a lower inorganic carbon demand, might be a less efficient or capable carbon uptake/concentrating mechanism. Alternatively, a decreased sensitivity to high [H+] in E. huxleyi, in comparison to G. oceanica (see below), would lead to a shift in the optimum towards higher CO2 as well and might be a more likely explanation.
Of the three rates, calcification in E. huxleyi had both the lowest CO2 requirement and the highest sensitivity to increasing [H+] (Tables 3 and 2). This is a pattern previously observed for G. oceanica under varying temperature and light conditions (Gafar et al., 2018; see also Table S3 in the Supplement). As evidenced by higher inhib values for all processes, E. huxleyi also appears less sensitive to the inhibiting effects of increasing [H+] than G. oceanica (i.e. inhib is 47–250 µmol kg−1 versus 25–99 µmol kg−1 for G. oceanica depending on light intensities or inhib is 62–250 µmol kg−1 versus 25–130 µmol kg−1 for G. oceanica depending on temperature) (Tables 2, 3, S3; Gafar et al., 2018). This also supports earlier results in a model analysis by Bach et al. (2015) where E. huxleyi reacted less sensitively to higher CO2 (and [H+]) than G. oceanica.
A lower sensitivity of rates to changes in carbonate chemistry speciation, in particular calcification rates, could be explained by the lower degree of calcification in E. huxleyi (PIC : POC ratios 0.24–1.38) when compared to G. oceanica (PIC : POC ratios 0.84–2.44) (Sett et al., 2014). Higher rates of calcification result in greater production of intracellular H+ (Ca2+ + ⇌ CaCO3 + H+), potentially decreasing [] in the coccolith-producing vesicle and hence the CaCO3 saturation state (Bach et al., 2015). Furthermore, increased [H+] has been found to result in declines in [] uptake, the primary carbon source for calcification (Kottmeier et al., 2016).
4.2 Responses to temperature
Temperature was observed to have few modulating effects on CO2 responses in E. huxleyi. Changes in temperature produced little (< 1 µmol kg−1) change in CO2 substrate half-saturation ( sat) levels, at least within the measured range (Fig. 1, Table 2). CO2 requirements for optimum rates tended to slightly decrease with warming temperatures. Similar results were observed for G. oceanica (Gafar et al., 2018). This indicates that while overall rates change, carbon uptake mechanisms appear to scale to maintain internal substrate concentrations and thus cellular requirements regardless of temperature conditions.
In contrast, the inhibition of rates by rising [H+], i.e. inhib, was more sensitive to temperature. The CO2 concentration at which rates were reduced to half the maximum increased with decreasing temperatures (Table 2). These results were also observed for G. oceanica which had a lower sensitivity to increasing [H+] at the lowest tested temperature (Gafar et al., 2018). This also agrees with De Bodt et al. (2010) in which a greater decline in calcification rate was observed with increasing CO2 at 18 ∘C than at 13 ∘C. These results indicate that at least some coccolithophores may be less sensitive to high CO2 levels at lower temperatures. As a result, both G. oceanica and E. huxleyi may become more vulnerable to the negative effects of ocean acidification as ocean temperatures increase due to climate change.
4.3 Responses to light
The sensitivity of all rates in E. huxleyi to changing carbonate chemistry, in particular increasing [H+], was clearly modulated by light intensity (Fig. 2), agreeing with earlier findings (Zondervan et al., 2002; Feng et al., 2008; Gao et al., 2009; Rokitta and Rost, 2012; Zhang et al., 2015). CO2 half saturation ( sat) for all rates was insensitive to increasing light intensities (Table S3). This agrees with results for G. oceanica which also displayed little change in CO2 half-saturation concentrations with increasing light (Table S3). Increasing light intensity induced increases in CO2 optima in all rates; however, these changes were small (< 10 µmol kg−1) for calcification and growth rates. This contrasts with G. oceanica for which a distinct decrease in optimal CO2 concentrations for growth rates with increasing light intensities was observed (Table S3). However, G. oceanica projections are based on a dataset with only three CO2 concentrations (∼ 16, 31, 45 µmol kg−1). As such, it is difficult to determine how robust the estimates of CO2 optima and half-saturation requirements may be for this species (Zhang et al., 2015).
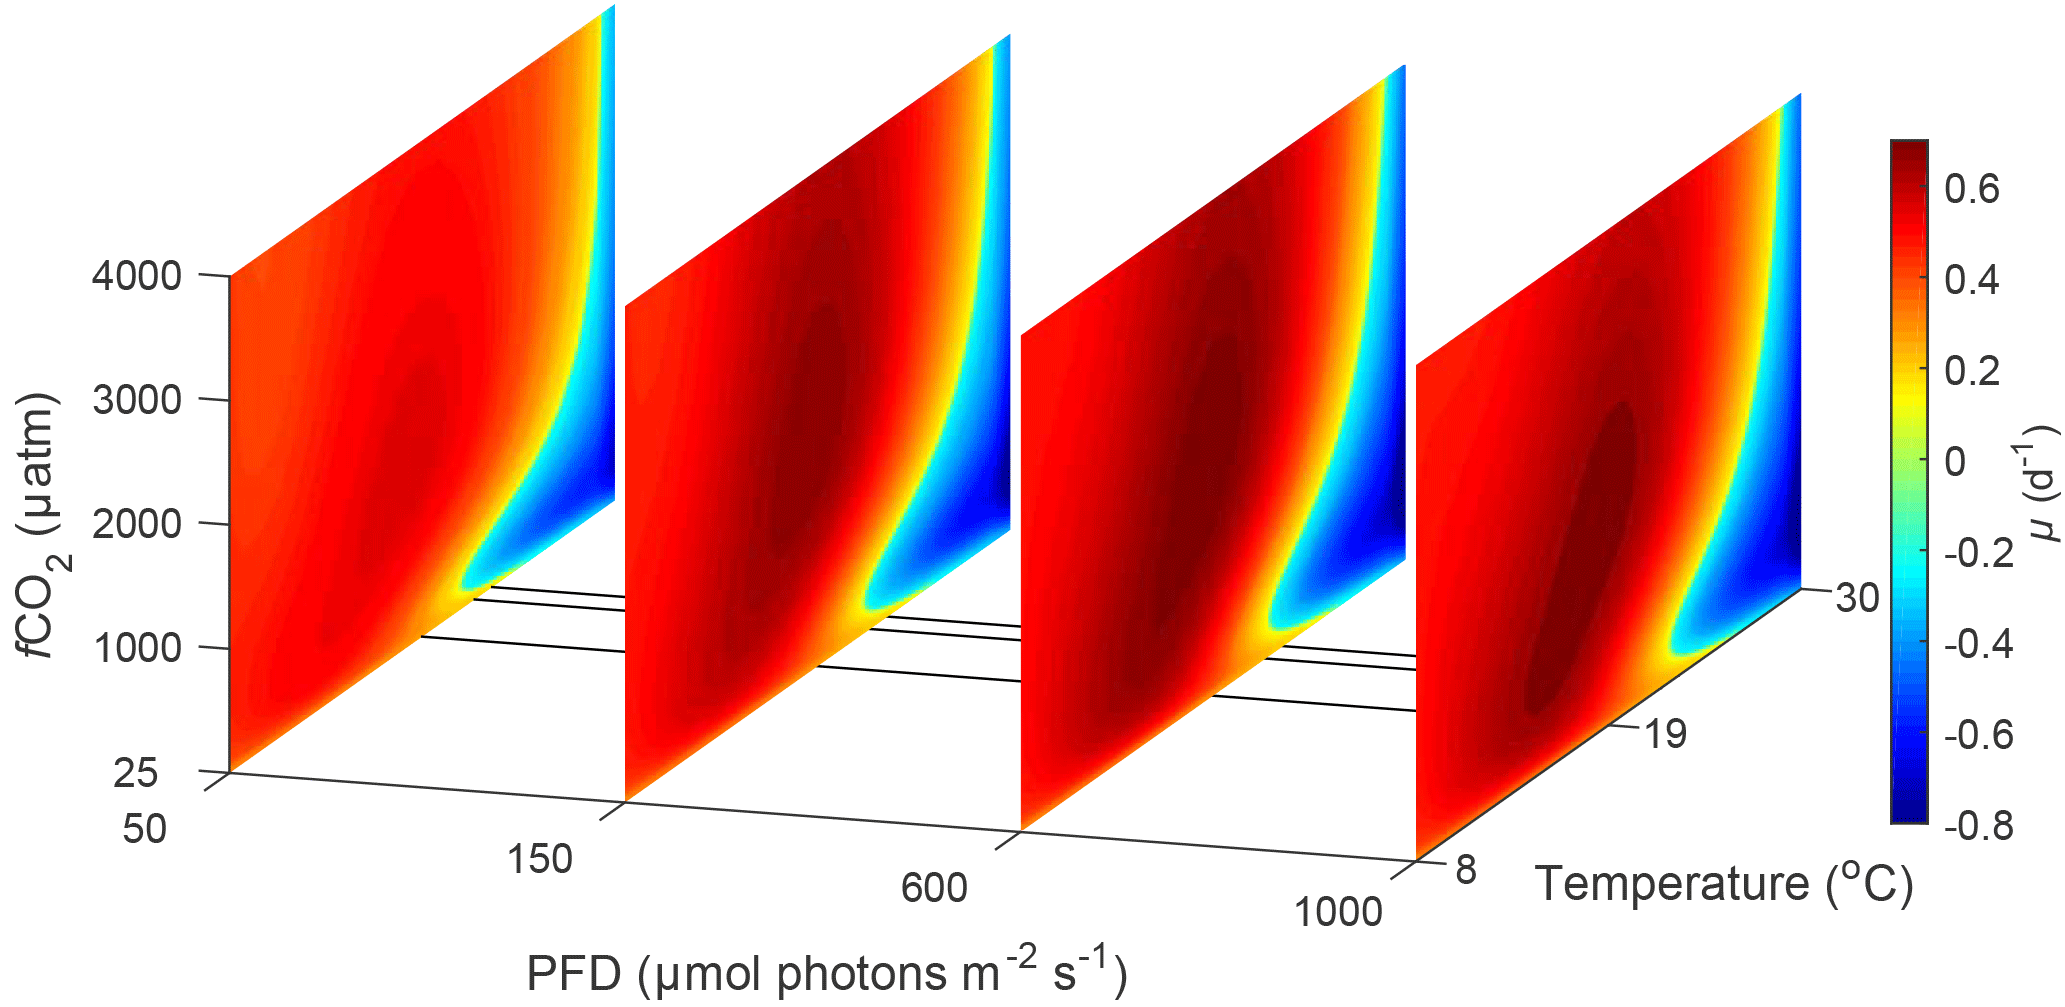
Figure 3Predicted difference in growth rates between E. huxleyi and G. oceanica across a temperature range of 8–30 ∘C and a fCO2 range of 25–4000 µatm at 50, 150, 600 and 1000 µmol photons m−2 s−1 of PAR based on Eq. (2). Note that the response to varying CO2 or temperature is not significantly influenced by light intensity. Note the positive values indicate E. huxleyi dominance while negative values indicate G. oceanica dominance.
In E. huxleyi, the relationship between H+ sensitivity and light intensity was the same for the three rates. Calcification and photosynthetic carbon fixation and growth rates were most sensitive to H+ at the lowest (50 µmol photons m−2 s−1) and growth rates were also slightly more sensitive at the highest (1200 µmol photons m−2 s−1) light intensities (Table 3). This result is in part due to an underestimation of growth rates by the fitting equation under high CO2 conditions at 50 µmol photons m−2 s−1 light (Fig. 2). However, it may be that sub-optimal light intensities add additional stress to the cells resulting in them having less resources with which to handle the stress of increasing high [H+]. Hence, rates are lower but also appear more sensitive to changing carbonate chemistry. These findings agree with findings by Rokitta and Rost (2012) where a diploid E. huxleyi strain became insensitive to the effects of rising CO2 (380 vs. 1000 µatm) when light intensities were increased from 50 to 300 µmol photons m−2 s−1. However, this differs from G. oceanica which, with rising light intensities, had no change in sensitivity for calcification rates, a decrease in sensitivity for photosynthesis and an increase in sensitivity for growth rates (Table S3). Again, although this could be indicative of species-specific differences in sensitivity, it may also be a result of the low number of CO2 treatments used in the light data of G. oceanica (see Zhang et al., 2015).
4.4 E. huxleyi and G. oceanica a niche comparison
In the future ocean CO2, temperature and light availability are all expected to change (Rost and Riebesell, 2004; IPCC, 2013b). Levels of fCO2 are expected to reach as high as 985 µatm by the end of the century with concomitant rise in global ocean temperature of up to 4.8 ∘C (RCP8.5 scenario, IPCC, 2013a, b). Light intensities in the surface ocean are also expected to increase as a result of mixed layer depth shoaling (Rost and Riebesell, 2004). By calculating and comparing growth rates for E. huxleyi and G. oceanica over a range of environmental conditions, it is possible to differentiate between the fundamental (physiological) niche of a species and its potentially realised niche when in competition with others. For this purpose, light, temperature and CO2 ranges were restricted to those where both species would be expected to co-occur, i.e. 20–1000 µmol photons m−2 s−1, 8–30 ∘C and 25–4000 µatm, respectively. The calculated difference in growth rates in response to CO2 and temperature does not significantly change with light intensity (Figs. 3 and 4). It should be noted, however, that light intensity might modify observed growth rate differences for other strains of the same species than used here as they can possess different sensitivities and requirements (i.e. Langer et al., 2009; Müller et al., 2015).
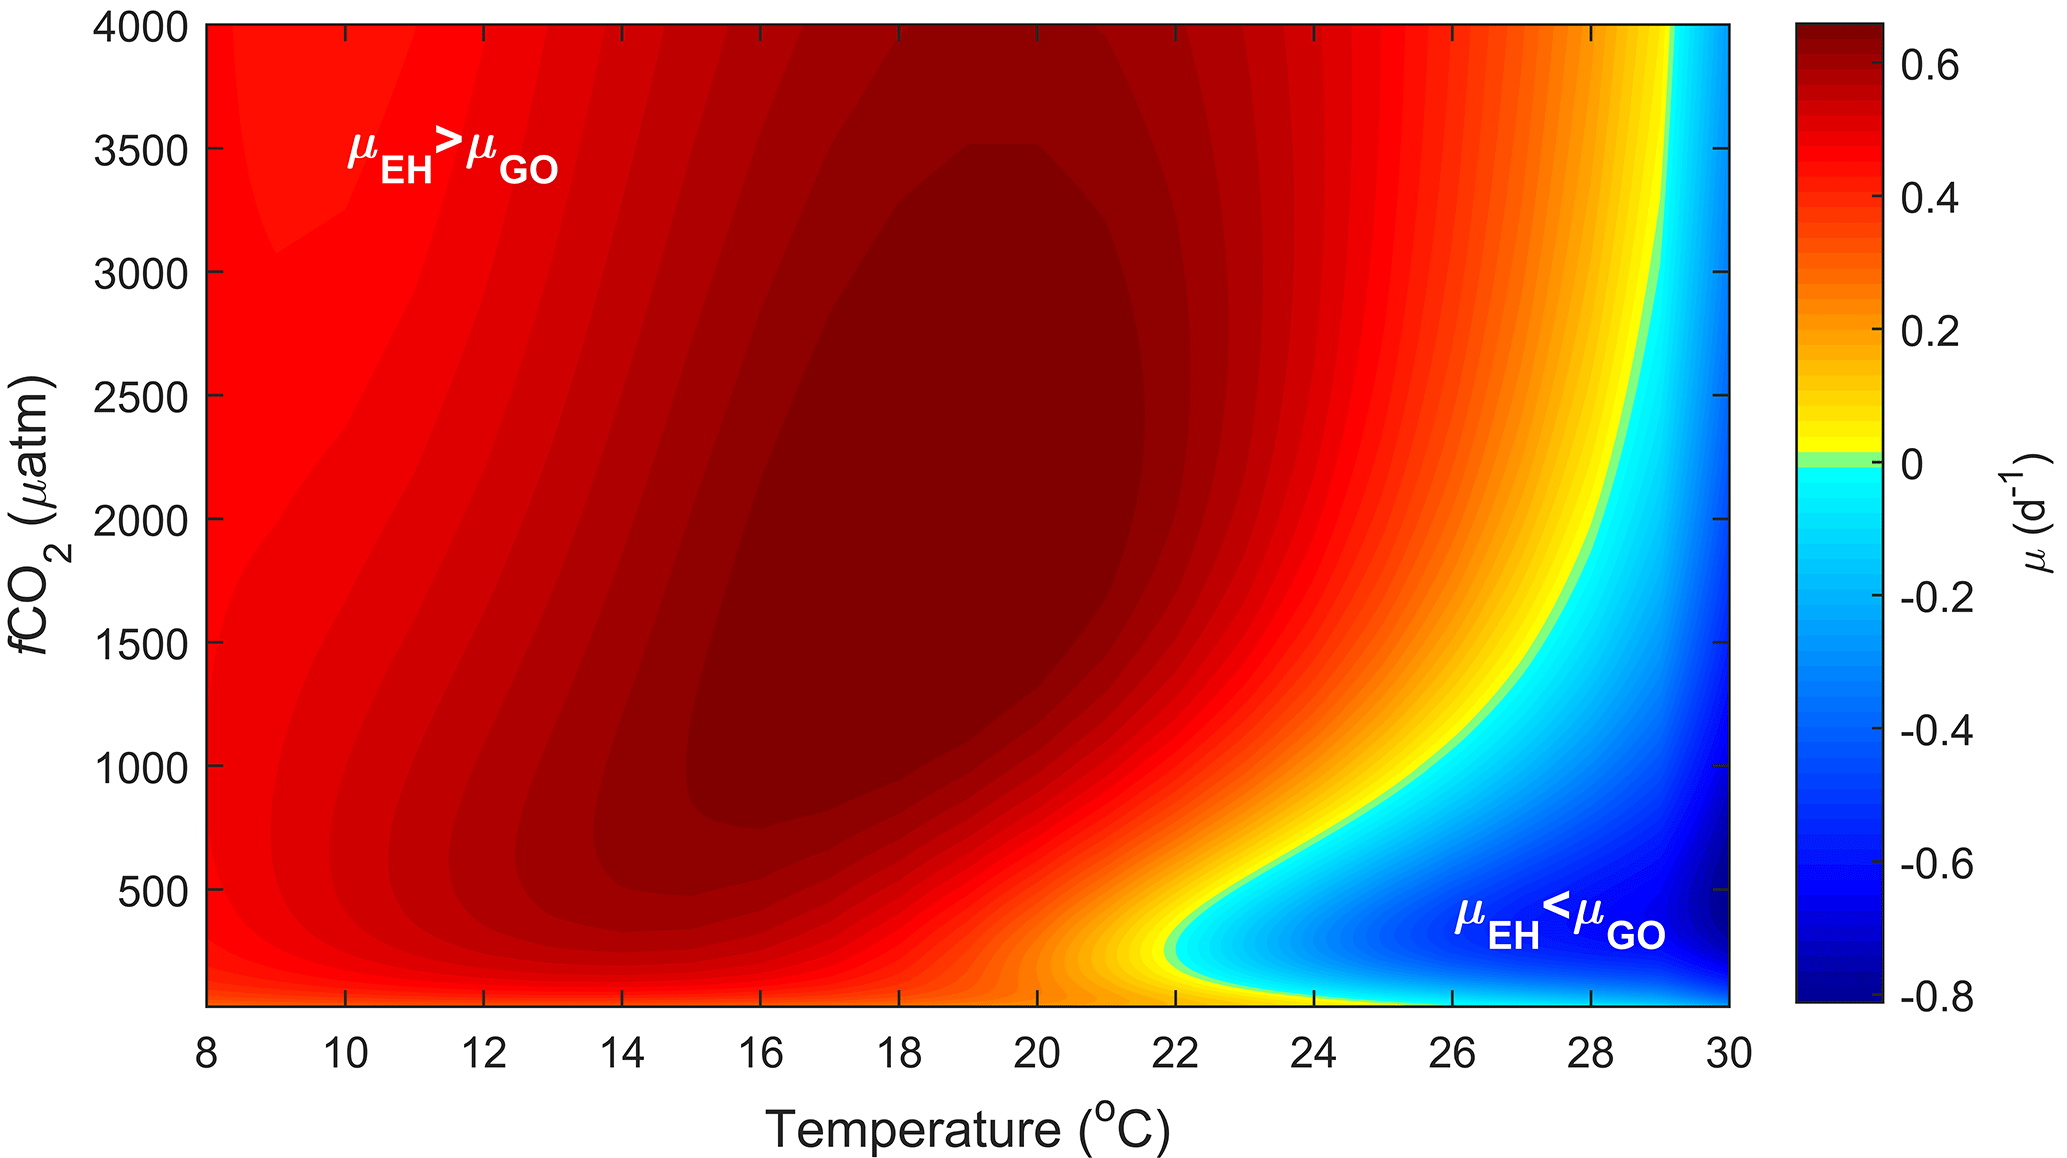
Figure 5Predicted difference in growth rates between E. huxleyi and G. oceanica across a temperature range of 8–30 ∘C and a fCO2 range of 25–4000 µatm at 150 µmol photons m−2 s−1 of light based on Eq. (2).
4.4.1 Fundamental niche
Experimentally, E. huxleyi has been found to grow in a range of ∼ 6 to 2500 µmol photons m−2 s−1 with high light resulting in no inhibition of maximum rates in some strains and up to 20 % reduction in others (Balch et al., 1992; van Bleijswijk et al., 1994; Nielsen, 1995; Nanninga and Tyrrell, 1996; van Rijssel and Gieskes, 2002). In contrast, G. oceanica is more sensitive in a similar experimental range of ∼ 6–2400 µmol photons m−2 s−1 with maximum rates inhibited by up to 38 % at high light intensities (Larsen, 2012). Light intensities below 6 µmol photons m−2 s−1 for E. huxleyi and G. oceanica resulted in no growth for both species (van Bleijswijk et al., 1994; van Rijssel and Gieskes, 2002; Larsen, 2012). So, while G. oceanica is more sensitive to high light, the potential upper light limit for growth in both species is beyond naturally occurring maxima. Within this light range, both species show a similar increase in projected absolute growth rates of 0–1.57 (d−1) for E. huxleyi and 0–1.51 (d−1) for G. oceanica (based on Fig. 4).
E. huxleyi has been successfully cultured at pCO2 levels between ∼ 20 and 5600 µatm, while G. oceanica has been successfully cultured at pCO2 levels of ∼ 20–3400 µatm (Sett et al., 2014). Again, the upper tolerance limit for growth in both is not known and well above what is expected for most ocean systems. Responses in projected growth rates with rising CO2 differ between the two species, with G. oceanica rates dropping to 50 % of maximum at fCO2 levels above ∼ 1760 µatm while E. huxleyi drops to 50 % of maximum at ∼ 5950 µatm. In terms of temperature, E. huxleyi has a broader niche of 3–29 ∘C in comparison to G. oceanica at 10–32 ∘C. Within this temperature niche, both species again show a similar change in absolute growth rates of 0–1.40 (d−1) for G. oceanica and 0–1.43 (d−1) for E. huxleyi (based on Fig. 5).
It should be noted, however, that although niche ranges and maximum rates are similar for both species, different requirements ( sat) and sensitivities inhib) will lead to different actual rates at a specific environmental condition. This becomes evident when examining the temperature, light and CO2 niches to find a combination of conditions at which the growth rate for each species is at its maximum. For E. huxleyi, maximum growth rates of 1.62 (d−1) are projected at ∼ 970 µmol photons m−2 s−1 light, ∼ 640 µatm CO2 and 20.2 ∘C. In contrast, the conditions for optimal growth rates of 1.52 (d−1) for G. oceanica are achieved at ∼ 500 µmol photons m−2 s−1 light, ∼ 430 µatm CO2 and 24.4 ∘C. Differences in sensitivity and therefore performance under certain conditions will influence the potentially realised niche of the species. For example, E. huxleyi is projected to reach higher growth rates than G. oceanica under a broader range of temperature, light and CO2 conditions (Figs. 3, 4 and 5), supporting the notion that E. huxleyi is rather a generalist.

Figure 6Log ratio of E. huxleyi to G. oceanica coccoliths versus temperature in the global oceans. Symbols and colours represent different ocean basins with data taken from McIntyre and Bé (1967), Chen and Shieh (1982), Roth and Coulbourn (1982), Knappertsbusch (1993), Andruleit and Rogalla (2002), Boeckel et al. (2006), Fernando et al. (2007) and Saavedra-Pellitero et al. (2014). Symbols denote samples from different oceanic regions with Atlantic B specifically representing samples from Boeckel et al. (2006) which appear influenced by upwelling of nutrients (see Sect. 4.4.2), while Atlantic A refers to samples from the Atlantic ocean from all other studies. The line at zero indicates a shift in dominance from E. huxleyi (> 0) to G. oceanica (< 0). The grey line represents a linear regression through the entire dataset with p < 0.05 and F of 156.05 with 95 % prediction bounds for new observations. For details, see Sect. 2.9.
4.4.2 Potentially realised niche
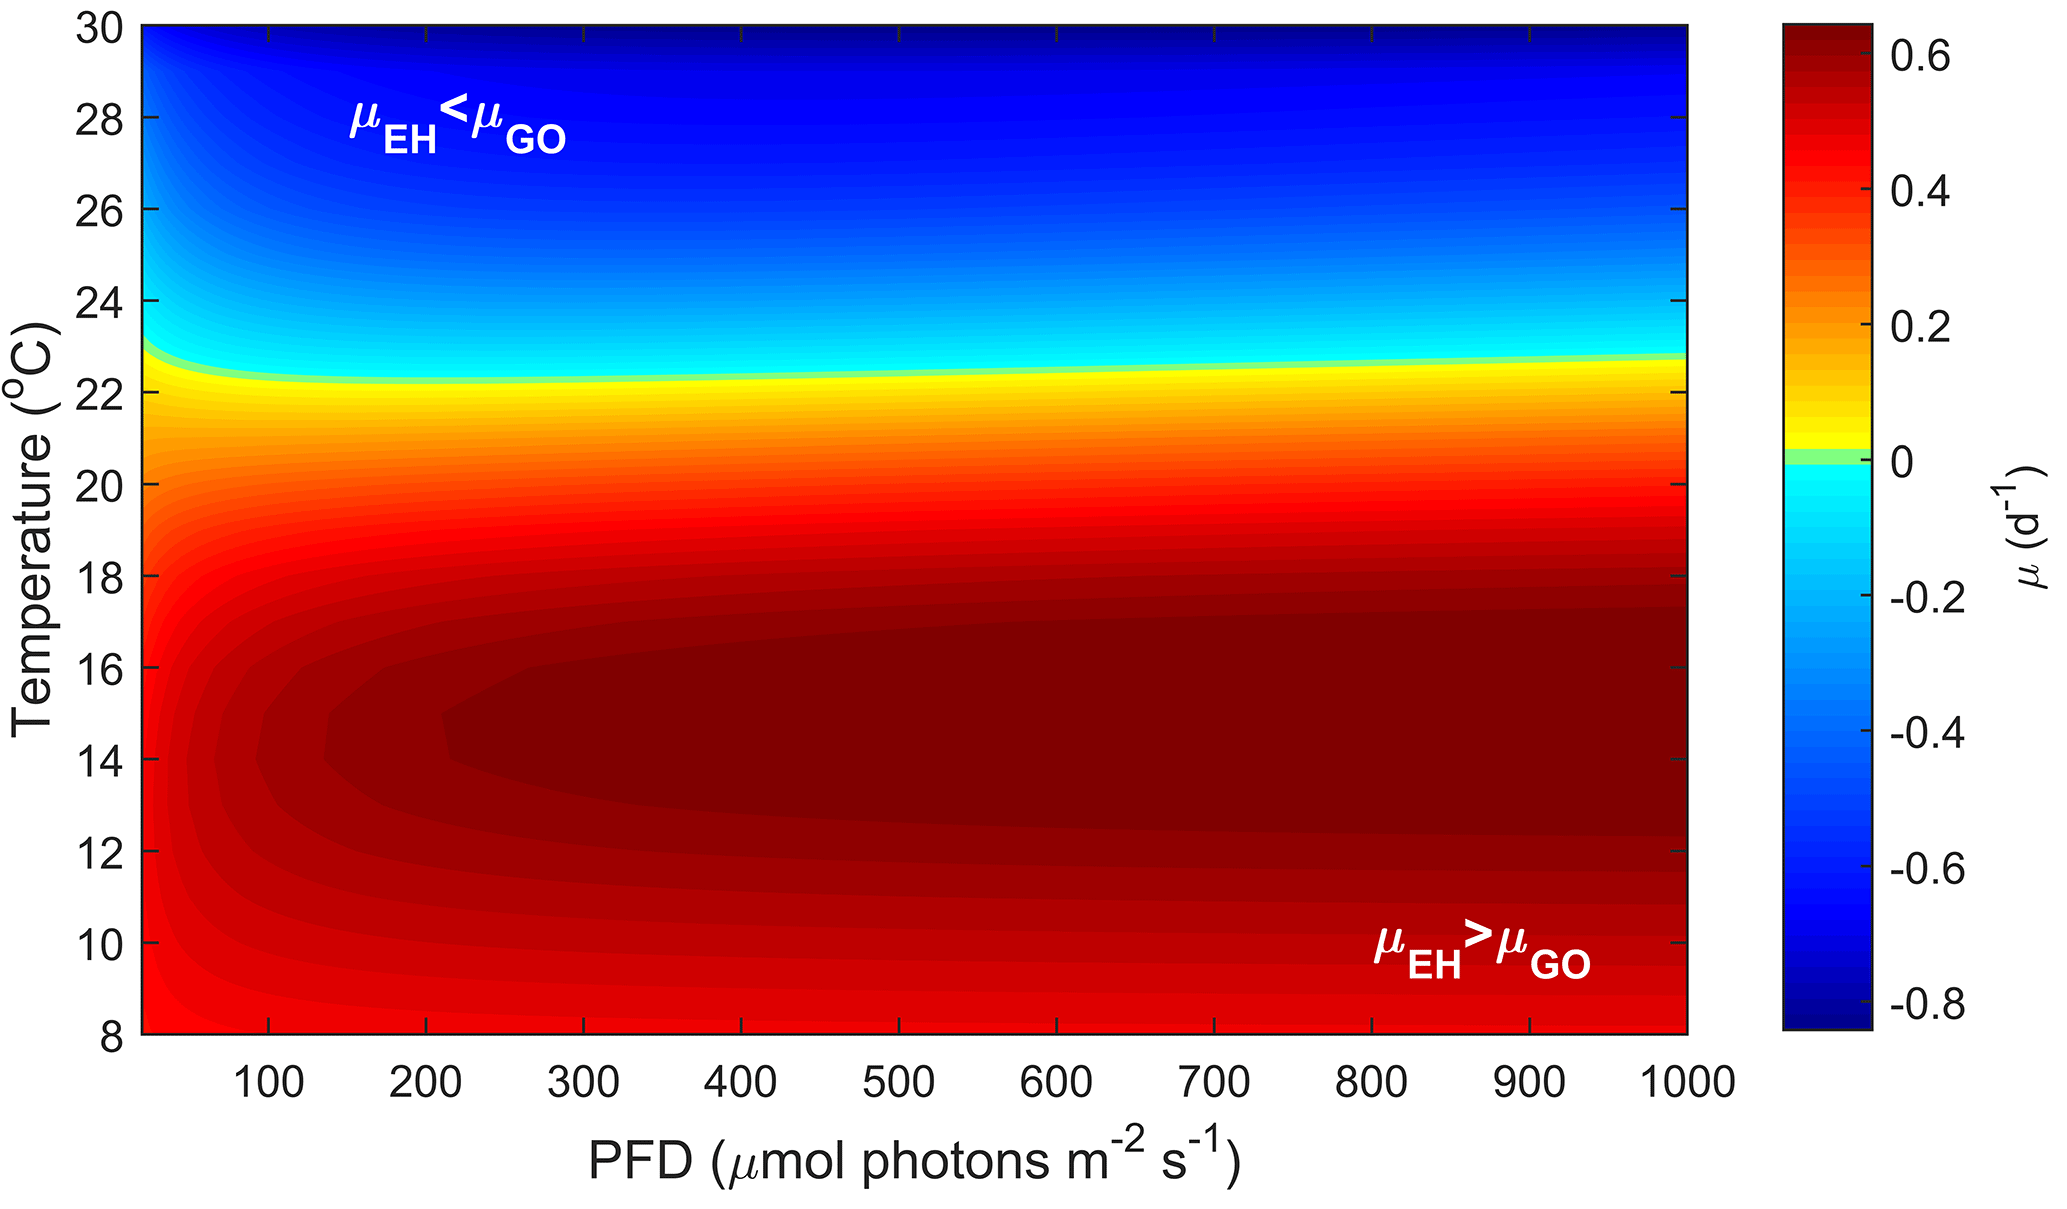
Temperature and CO2 both have substantial effects on the potentially realised niche of E. huxleyi and G. oceanica (Figs. 4 and 5). In contrast, light intensity has very little effect (Fig. 3). E. huxleyi appears able to exceed growth rates of G. oceanica at temperatures below 22 ∘C under most CO2 and light conditions (Figs. 4 and 5). A similar difference in temperature preferences has also been observed in New Zealand isolates of Gephyrocapsa oceanica and Emiliania huxleyi with G. oceanica and E. huxleyi growing in the range of 10–25 and 5–25 ∘C at optimum temperatures of 22 and 20 ∘C, respectively (Rhodes et al., 1995). While these results are based on single-strain laboratory experiments, there is evidence that such differences in temperature sensitivity may also hold true in the modern ocean. For example, data gathered from multiple phytoplankton monitoring cruises indicate that while both species are found at higher temperatures, G. oceanica largely vanishes from the assemblage at temperatures below 13 ∘C (McIntyre and Bé, 1967; Eynaud et al., 1999; Hagino et al., 2005). However, phytoplankton monitoring cruises can be seasonally biased and represent a single point in time.
Another way to relate our niche comparison to today's oceans is through surface sediments. Surface sediment samples represent an integrated signal of the composition of a phytoplankton community over time and can therefore be a more suitable proxy of species dominance in a certain location. Global surface sediment data on G. oceanica and E. huxleyi coccolith abundance indicate that the dominance of these two species is influenced by temperature, particularly in the Pacific Ocean (Fig. 6). It is noted, however, that samples from the south-equatorial to equatorial Atlantic Ocean in Boeckel et al. (2006) do not follow the general temperature trend observed in other ocean basins (Fig. 6). In this location, it appears that G. oceanica abundance is driven more by increasing nutrient concentrations than by temperature. It seems oceanic upwelling in this region is driving a different relationship between E. huxleyi and G. oceanica than observed in other areas. Globally, the data suggest that dominance switches from E. huxleyi to G. oceanica at temperatures above 25 ∘C which is similar to our projections. While both species have a similar upper limit to their fundamental thermal niche (i.e. Rhodes et al., 1995), it would appear that the higher minimum temperature of G. oceanica, combined with its greater tolerance for high temperatures, restricts its realised niche to the upper end of the temperature range (Figs. 4 and 6).
CO2 level also influences the relative growth rates of E. huxleyi and G. oceanica. Under present-day levels of ∼ 400 µatm, E. huxleyi would dominate at temperatures up to 22 ∘C (Fig. 5). However, at higher and lower CO2 levels, E. huxleyi begins to outgrow G. oceanica at progressively higher temperatures. At the same time, combined warming in a future ocean would partially mitigate the higher CO2 sensitivity of G. oceanica (Fig. 5). Nevertheless, over the naturally observed temperature range, G. oceanica′ s niche would be expected to decrease towards higher CO2 levels.
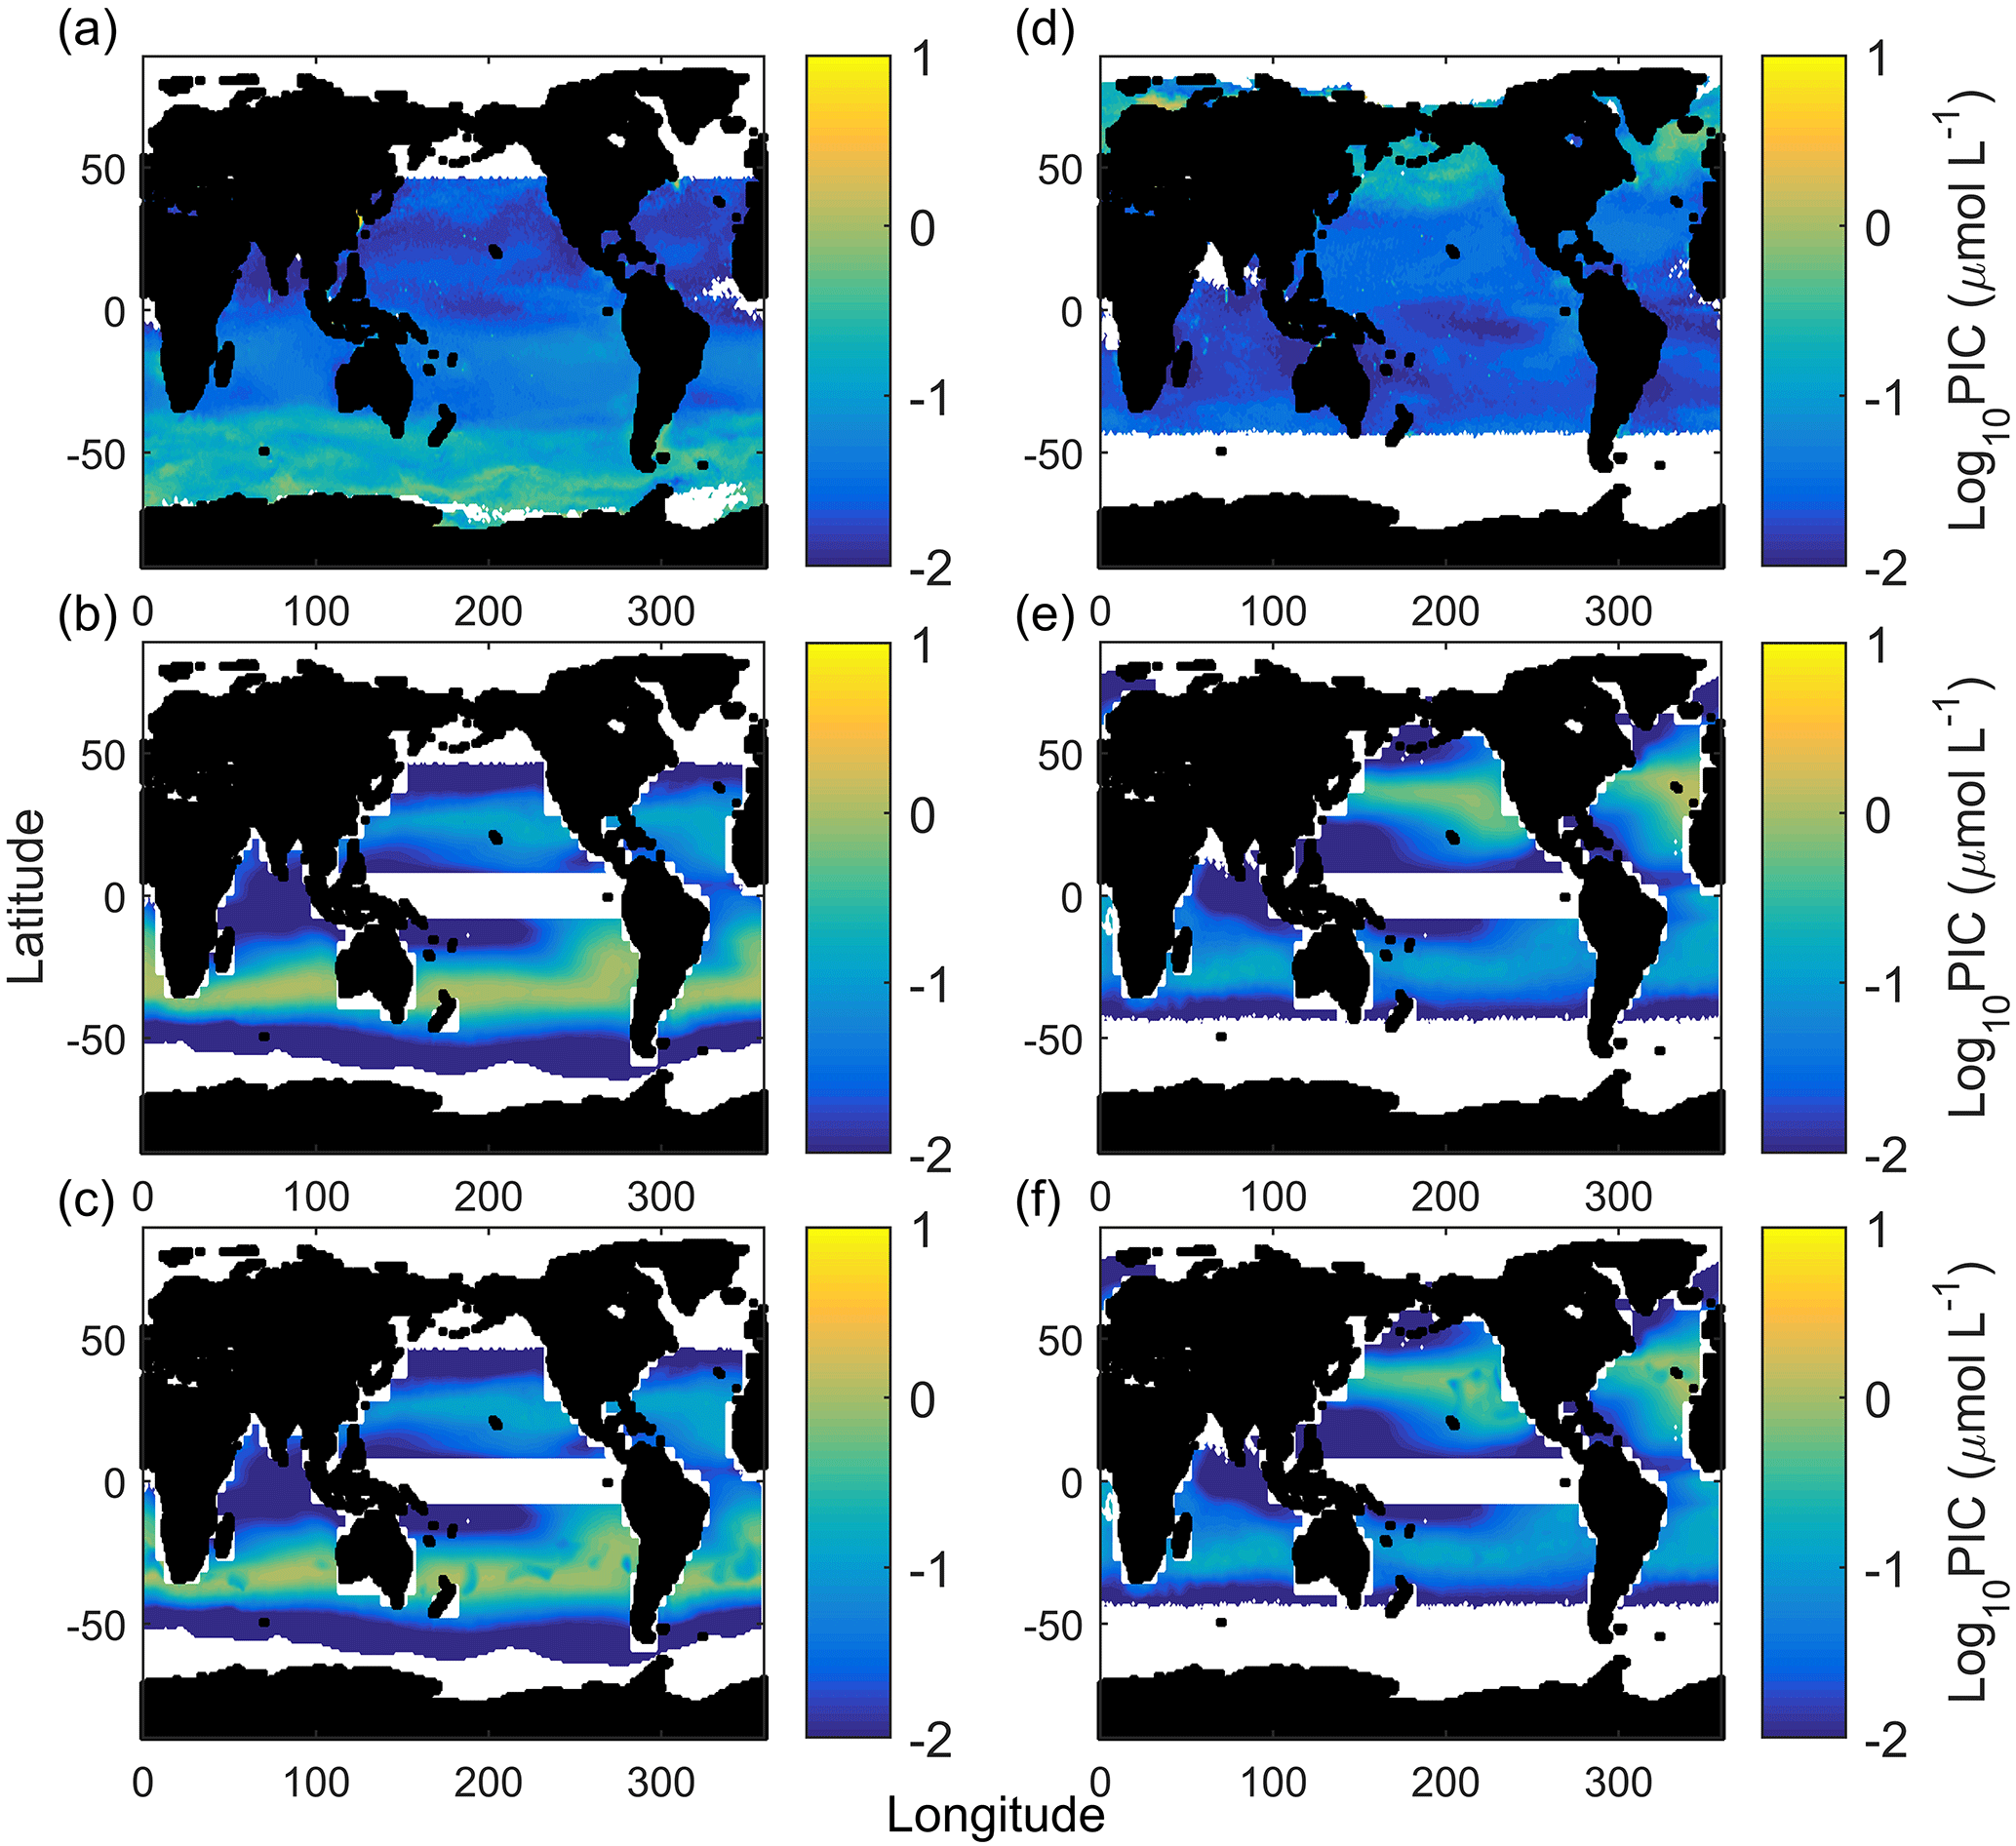
Figure 7Austral summer/boreal winter (a) and austral winter/boreal summer (d) satellite-measured particulate inorganic carbon. Austral summer/boreal winter (b) and austral winter/boreal summer (d) E. huxleyi-based CCPP estimates accounting for carbonate chemistry (substrate and hydrogen ion concentrations), light intensity and temperature. Note the strong bands of CCPP at the midlatitudes. Austral summer/boreal winter (c) and austral winter/boreal summer (f) CCPP estimates accounting for carbonate chemistry (substrate and hydrogen ion concentrations), light intensity and temperature and nitrate concentrations (nutrient proxy).
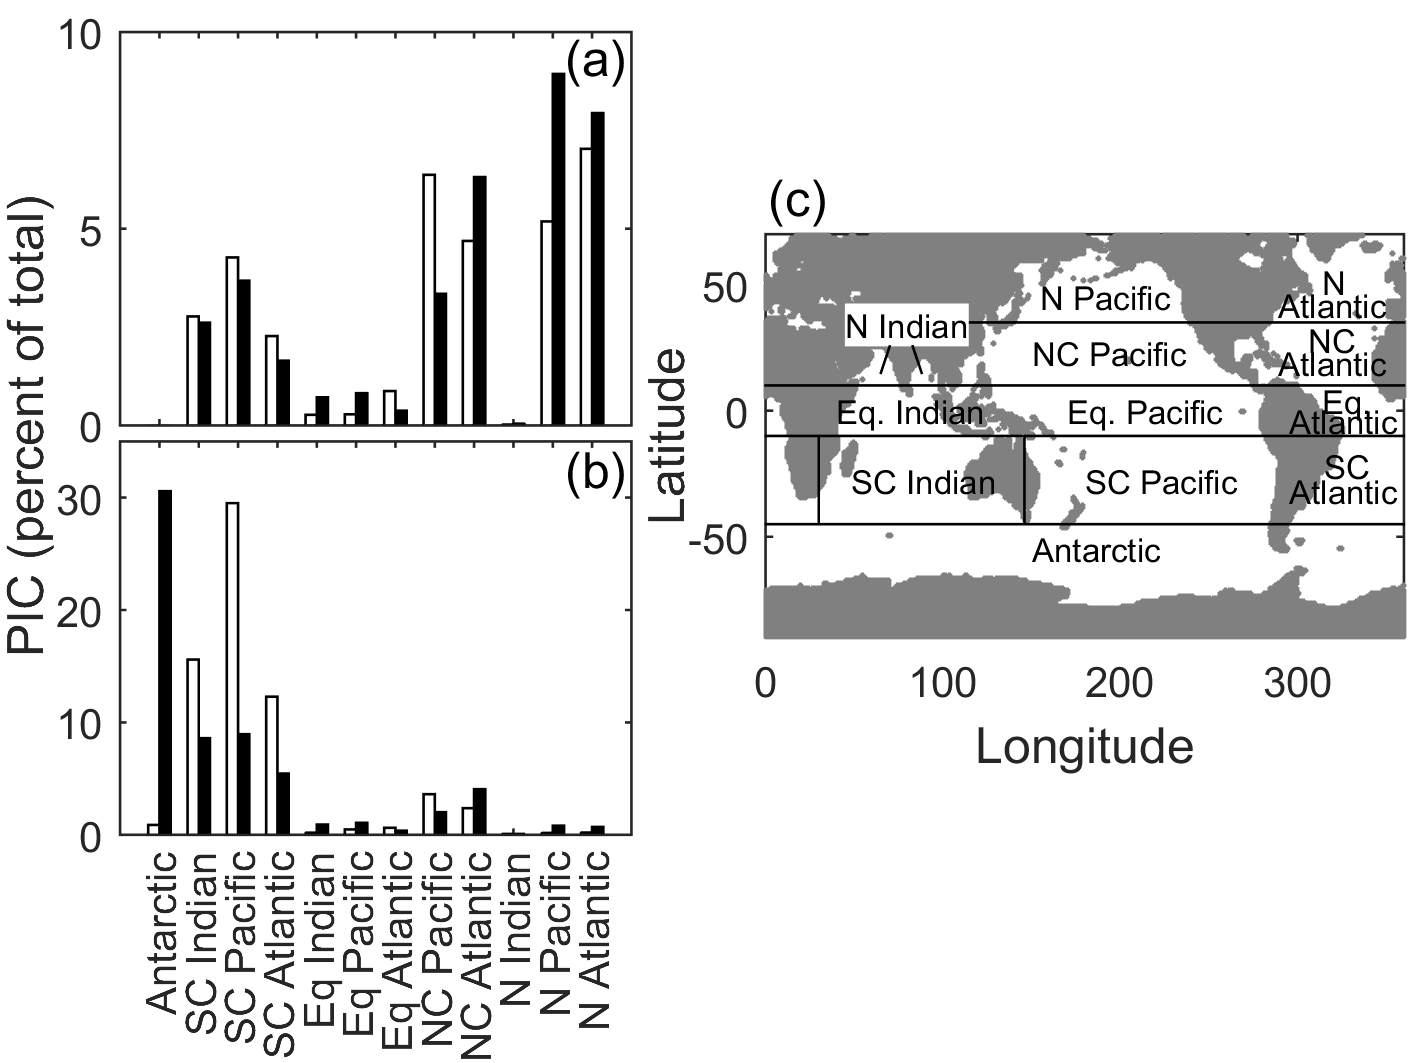
Figure 8Satellite-derived particulate inorganic carbon (black bars) and E. huxleyi-based CCPP (white bars) estimates for major ocean biogeographical provinces as percentages of total production in (a) austral winter/boreal summer and (b) austral summer/boreal winter. (c) Major ocean biogeographical province definitions.
This comparison only considers the responses of single strains of E. huxleyi and G. oceanica. Considering multiple strains, from diverse ocean regions, would aid our study in describing the fundamental and realised niches for a species in more general terms. However, even though our realised niche projections are based on only one strain for each species, they do generally agree with experimental observations of other strains and with planktonic and sediment observations of each species as a whole. This indicates that the differences in requirements and sensitivities of the two species as described here are large enough to be revealed by choosing only one representative for each species. Another consideration to be made is the fact that coccolithophore communities can be made up of dozens of species (McIntyre and Bé, 1967; Winter and Siesser, 1994), all of which are likely to have different preferences for and sensitivities to changes in fCO2, temperature and light. Shifts in plankton community structure, as a result of different species and group preferences, in response to environmental change have already been observed in the past (Beaugrand et al., 2013; Rivero-Calle et al., 2015), while simulations also suggest shifts in plankton community under future climate conditions (Dutkiewicz et al., 2015). Community structure shifts and changes in coccolithophore species composition are likely to alter ocean biogeochemistry with implications for ocean-atmosphere CO2 partitioning.
4.5 Global calcium carbonate production potential
The CCPP is based on cellular CaCO3 quotas and growth rates calculated for a given set of temperature, light and carbonate chemistry conditions (see Sect. 2.10). Here, we test how this measure for productivity compares to estimated surface ocean CaCO3 content observed by satellite imaging (PICs). At this point, it is important to remember that CCPP does not account for top-down controls such as grazing or viral attack (Holligan et al., 1993; Wilson et al., 2002; Behrenfeld, 2014), and bottom-up controls such as competition for macro- or micronutrients (Zondervan, 2007; Monteiro et al., 2016; Browning et al., 2017). Thus, a potential for high CaCO3 production is not necessarily realised when exposed to different top-down and bottom-up pressures.
Calculated CCPP of E. huxleyi alone (Fig. 7) for the global ocean visually reproduces the midlatitude production belts, however at lower latitudes than satellite PIC estimates. This agrees with the NEMO and OCCAM models of coccolithophore dominance (Sinha et al., 2010) and the chlorophyll a NASA Ocean Biogeochemical Model (NOBM) model for the Southern Hemisphere and central North Atlantic provinces (Gregg and Casey, 2007). CCPP also estimates seasonal changes with higher productivity during summer in both hemispheres (see Fig. 7a and d vs. b and e). This pattern is driven mainly by temperature, which influences the latitudinal location of the bands, and light intensity, which influences whether the northern or southern band of productivity is stronger in a season. Nutrients are an essential, and in the ocean often limiting, requirement for biological productivity (Kattner et al., 2004; Browning et al., 2017). As such, it would be expected that nutrients should also be strongly influencing seasonal patterns of PIC production. However, with the starting cell concentrations for the CCPP calculations chosen here, there was sufficient nitrate to support the projected production in most ocean regions (Fig. 7c and f). High temperatures drove relatively low productivity in the equatorial regions in agreement with satellite PIC. Similar low levels of coccolithophores are estimated in Sinha et al. (2010) in the equatorial Pacific and Atlantic with the mixed phytoplankton functional group dominating with or without coccolithophores due to low iron and moderate phosphate concentrations, and in Gregg and Casey (2007) for the equatorial Indian and Atlantic provinces. CCPP underestimates production at cold high latitudes, in particular in the Southern Ocean, when compared to the satellite. Similar low levels of coccolithophores have been projected in the Southern Ocean in Gregg and Casey (2007) (very low coccolithophore chlorophyll a), Krumhardt et al. (2017) (growth rates at or close to zero which equates to low to zero CCPP) and Sinha et al. (2010) (high nutrients resulting in coccolithophores being dominated by diatoms). For the Southern Ocean, it has been suggested that satellite PIC concentrations in subantarctic waters are overestimated by a factor of 2–3 while those in Antarctic waters may be even more so (Holligan et al., 2010; Balch et al., 2011; Trull et al., 2018). The fact that three other global estimates, based on different sets of environmental parameters, all estimate very little PIC productivity in the Southern Ocean seems to support this theory. However, there are also specifically cold-adapted strains of Emiliania huxleyi found at high latitudes which at least partially could explain discrepancies between the mentioned model projections and satellite-derived PIC concentrations (see also below).
In austral winter/boreal summer, CCPP (for E. huxleyi) and satellite PIC estimates closely match (R2 of 0.73, F of 26.78, p < 0.01, slope of 1.03) with low PIC in the south and central south provinces, very low PIC in the equatorial, north Indian and Antarctic provinces and higher PIC in the north central Pacific, North Pacific and North Atlantic provinces (Fig. 8a). In austral summer/boreal winter, CCPP (for E. huxleyi) and satellite PIC estimates in individual ocean provinces are also generally of overall good agreement but with a much lower slope (R2 of 0.85, F of 50.01, p < 0.01, slope of 0.32). Both CCPP and satellite PIC estimates for austral summer/boreal winter are low in all equatorial and north ocean provinces with slightly higher CCPP and satellite PIC production for the north central provinces and higher production in the south and central south provinces (Fig. 8b). The reason for the relatively small slope of 0.32 in austral summer, meaning that CCPP overestimates the total production by a factor of 3, is the high values of satellite-derived PIC in the Antarctic province. To rectify this issue, a simple scaling factor could be introduced.
Despite having similar PIC patterns, overall PIC estimates can differ significantly between CCPP and PICs in some provinces. These provinces can be divided into two groups characterised by either greater or lesser PIC estimates than those observed by satellite (Fig. 8). The midlatitude provinces of central south and central North Pacific and Atlantic and central south Indian Ocean in the summer season belong to the former, with higher CCPP than PICs. Recently, low phytoplankton biomass in these subtropical gyre systems has been hypothesised to be the result of strong grazing pressure despite high cellular growth rates (Behrenfeld, 2014), lending an explanation of why CCPP is higher than satellite PIC standing stocks. The lower PIC standing stocks estimated from the satellite could also be the result of other phytoplankton functional groups, such as diatoms, taking a comparatively bigger nutrient share (Iglesias-Rodríguez et al., 2002), thereby leaving less for PIC production by coccolithophores.
In contrast, in austral summer/boreal winter in the Antarctic and austral winter/boreal summer in the North Pacific, CCPP is smaller than satellite PIC estimates (Fig. 8). E. huxleyi, which our projections are based off, has been found to dominate assemblages in polar areas, particularly in the Southern Hemisphere (Okada and Honjo, 1973; Gravalosa et al., 2008; Mohan et al., 2008; Charalampopoulou et al., 2016). The strains of E. huxleyi found here are special cold-adapted ones which can survive at temperatures as low as −1.7 ∘C in the Antarctic (Cubillos et al., 2007) and −0.9 ∘C in the Arctic (Charalampopoulou et al., 2011). As our CCPP is based on a temperate coccolithophore strain, lacking the cold-adapted ones, our projections underestimate coccolithophore productivity in these areas. Additionally, differences in CCPP and satellite PIC in the Southern Ocean may also be connected to satellite overestimation of PIC at high southern latitudes (see above).
Comparing satellite PIC and CCPP in different oceanic provinces (Fig. 8c) E. huxleyi alone provided the greatest agreement between both. The addition of G. oceanica to CCPP calculations negatively affected correlations with satellite PIC. This is counterintuitive as one would expect increasing correlation of CCPP with satellite PIC as more species are used for the projection of the former. Indeed, estimates based on a combination of E. huxleyi and G. oceanica in austral summer/boreal winter were similar to those for E. huxleyi alone. However, in austral winter/boreal summer, estimates based on a combination of E. huxleyi and G. oceanica resulted in much lower agreement between CCPP and satellite PIC when compared to E. huxleyi alone. This difference is driven by greatly increased CCPP estimates in the central North Pacific and Atlantic, combined with greatly decreased CCPP estimates in the North Pacific and Atlantic, relative to the E. huxleyi fit alone. Being a warm-adapted species including G. oceanica would result in more productivity in the subtropical zones. However, these zones are also regions of potentially significant top-down control (see above for details). Meanwhile, the North Pacific and Atlantic are likely dominated by cold-adapted species (see above for details), so including the warm-adapted G. oceanica in CCPP calculations would further reduce estimates in these regions. As a result, the inclusion of G. oceanica does not assist in making global estimates of coccolithophore PIC production.
Our analysis of the projected combination of increased temperature and CO2 on potential success, in terms of growth rates, suggests that E. huxleyi will gain further competitive advantage over G. oceanica. Due to a greater sensitivity to CO2, G. oceanica's niche will likely contract to regions of higher temperature under future ocean conditions. In general, changes in community composition can influence community level carbon production and sequestration by coccolithophores. Such changes could have significant implications for climate feedback mechanisms, one being the relative strengths of the organic and inorganic carbon pumps in ecosystems where coccolithophores are abundant enough to significantly impact the air–sea CO2 flux (e.g. coccolithophore blooms) and/or dominate the deep-sea flux of particulate material (e.g. subtropical gyres). Temperature and light were found to be important factors driving projections of CCPP on a global scale. Comparison of satellite-derived inorganic carbon versus estimated inorganic carbon suggests that E. huxleyi CCPP is a good proxy for coccolithophore community production in most biogeographical provinces. However, results indicate that data on the responses of polar species and strains, to environmental change, may be required to improve estimates in the high latitudes, while the effects of top-down controls might be needed to improve estimates in the midlatitudes.
All data used for the calculation of model fits and coefficients for Emiliania huxleyi can be found in the Supplement for this paper. Fit coefficients used for calculation of Gephyrocapsa oceanica niches can be found in Gafar et al. (2018) (https://doi.org/10.3389/fmars.2017.00433). Third-party datasets used for calculation of global calcium carbonate production potential are detailed in Sect. 4.5.
The supplement related to this article is available online at: https://doi.org/10.5194/bg-15-3541-2018-supplement.
KS and NG conceived and designed the experiments. NG carried out the experiments and measured dissolved inorganic carbon, total alkalinity and E. huxleyi cell counts. NG calculated carbonate chemistry, particulate carbon values and growth rates. NG and KS analysed the data, undertook model fitting procedures and wrote the MATLAB code to calculate global CCPP values. NG prepared the figures and wrote the manuscript. KS contributed greatly to the results and discussion sections and critically commented on the manuscript draft.
The authors declare that they have no conflict of interest.
This study was funded by the Australian Research Council (ARC) FT120100384
awarded to Kai G. Schulz and DP150102092 awarded to Kai G. Schulz. We also
thank Matheus Carvalho for analysing particulate carbon samples.
Edited by: Emilio
Marañón
Reviewed by: Alex Poulton and one anonymous
referee
Andruleit, H. and Rogalla, U.: Coccolithophores in surface sediments of the Arabian Sea in relation to environmental gradients in surface waters, Mar. Geol., 186, 505–526, https://doi.org/10.1016/S0025-3227(02)00312-2, 2002. a, b
Andruleit, H., Stäger, S., Rogalla, U., and Čepek, P.: Living coccolithophores in the northern Arabian Sea: Ecological tolerances and environmental control, Mar. Micropaleontol., 49, 157–181, https://doi.org/10.1016/S0377-8398(03)00049-5, 2003. a
Bach, L. T., Riebesell, U., and Schulz, K. G.: Distinguishing between the effects of ocean acidification and ocean carbonation in the coccolithophore Emiliania huxleyi, Limnol. Oceanogr., 56, 2040–2050, https://doi.org/10.4319/lo.2011.56.6.2040, 2011. a, b, c, d, e, f
Bach, L. T., MacKinder, L. C. M., Schulz, K. G., Wheeler, G., Schroeder, D. C., Brownlee, C., and Riebesell, U.: Dissecting the impact of CO2 and pH on the mechanisms of photosynthesis and calcification in the coccolithophore Emiliania huxleyi, New Phytol., 199, 121–134, https://doi.org/10.1111/nph.12225, 2013. a, b
Bach, L. T., Riebesell, U., Gutowska, M. A., Federwisch, L., and Schulz, K. G.: A unifying concept of coccolithophore sensitivity to changing carbonate chemistry embedded in an ecological framework, Prog. Oceanogr., 135, 125–138, https://doi.org/10.1016/j.pocean.2015.04.012, 2015. a, b, c, d, e
Balch, W., Drapeau, D., Bowler, B., Lyczskowski, E., Booth, E., and Alley, D.: The contribution of coccolithophores to the optical and inorganic carbon budgets during the Southern Ocean Gas Exchange Experiment: New evidence in support of the “Great Calcite Belt” hypothesis, J. Geophys. Res.-Ocean., 116, C00F06, https://doi.org/10.1029/2011JC006941, 2011. a
Balch, W. M., Holligan, P. M., and Kilpatrick, K. A.: Calcification, photosynthesis and growth of the bloom-forming coccolithophore, Emiliania huxleyi, Cont. Shelf Res., 12, 1353–1374, https://doi.org/10.1016/0278-4343(92)90059-S, 1992. a, b
Baumann, K.-H., Andruleit, H., and Samtleben, C.: Coccolithophores in the Nordic Seas: Comparison of living communities with surface sediment assemblages, Deep-Sea Rese. Pt. II, 47, 1743–1772, https://doi.org/10.1016/S0967-0645(00)00005-9, 2000. a
Beaugrand, G., McQuatters-Gollop, A., Edwards, M., and Goberville, E.: Long-term responses of North Atlantic calcifying plankton to climate change, Nat. Clim. Change, 3, 263–267, https://doi.org/10.1038/nclimate1753, 2013. a
Behrenfeld, M. J.: Climate-mediated dance of the plankton, Nat. Clim. Change, 4, 880–887, https://doi.org/10.1038/NCLIMATE2349, 2014. a, b, c
Bockmon, E. E. and Dickson, A. G.: A seawater filtration method suitable for total dissolved inorganic carbon and pH analyses, Limnol. Oceanogr.-Meth., 12, 191–195, https://doi.org/10.4319/lom.2014.12.191, 2014. a
Boeckel, B. and Baumann, K.-H.: Vertical and lateral variations in coccolithophore community structure across the subtropical frontal zone in the South Atlantic Ocean, Mar. Micropaleontol., 67, 255–273, https://doi.org/10.1016/j.marmicro.2008.01.014, 2008. a, b
Boeckel, B., Baumann, K.-H., Henrich, R., and Kinkel, H.: Coccolith distribution patterns in South Atlantic and Southern Ocean surface sediments in relation to environmental gradients, Deep-Sea Res. Pt. I, 53, 1073–1099, https://doi.org/10.1016/j.dsr.2005.11.006, 2006. a, b, c, d
Bopp, L., Monfray, P., Aumont, O., Dufresne, J.-L., Le Treut, H., Madec, G., Terray, L., and Orr, J. C.: Potential impact of climate change on marine export production, Global Biogeochem. Cy., 15, 81–99, https://doi.org/10.1029/1999GB001256, 2001. a
Boyer, T. P., Antonov, J. I., Baranova, O. K., Coleman, C., Garcia, H. E., Grodsky, A., Johnson, D. R., Locarnini, R. A., Mishonov, A. V., and O'Brien, T. D.: World Ocean Database 2013, NOAA Atlas NESDIS 72, National Oceanographic Data Center, Silver Spring, MD, USA, https://doi.org/10.2481/dsj.WDS-041, 2013. a, b, c
Broecker, W. and Clark, E.: Ratio of coccolith CaCO3 to foraminifera CaCO3 in late Holocene deep sea sediments, Paleoceanography, 24, PA3205, https://doi.org/10.1029/2009PA001731, 2009. a
Browning, T. J., Achterberg, E. P., Rapp, I., Engel, A., Bertrand, E. M., Tagliabue, A., and Moore, C. M.: Nutrient co-limitation at the boundary of an oceanic gyre, Nature, 551, 242–246, https://doi.org/10.1038/nature24063, 2017. a, b, c
Caldeira, K. and Wickett, M. E.: Ocean model predictions of chemistry changes from carbon dioxide emissions to the atmosphere and ocean, J. Geophys. Res., 110, C09S04, https://doi.org/10.1029/2004jc002671, 2005. a
Charalampopoulou, A., Poulton, A. J., Tyrrell, T., and Lucas, M. I.: Irradiance and pH affect coccolithophore community composition on a transect between the North Sea and the Arctic Ocean, Mar. Ecol. Prog. Ser., 431, 25–43, https://doi.org/10.3354/meps09140, 2011. a
Charalampopoulou, A., Poulton, A. J., Bakker, D. C., Lucas, M. I., Stinchcombe, M. C., and Tyrrell, T.: Environmental drivers of coccolithophore abundance and calcification across Drake Passage (Southern Ocean), Biogeosciences, 13, 5917, https://doi.org/10.5194/bg-13-5917-2016, 2016. a
Chen, M. and Shieh, K.: Recent nannofossil assemblages in sediments from Sunda Shelf to abyssal plain, South China Sea, Proceedings of the National Science Council (ROC), Part A, 6, 250–285, 1982. a, b
Cook, S. S., Whittock, L., Wright, S. W., and Hallegraeff, G. M.: Photosynthetic pigment and genetic differences between two Southern Ocean morphotypes of Emiliania huxleyi (Haptophyta), J. Phycol., 47, 615–626, https://doi.org/10.1111/j.1529-8817.2011.00992.x, 2011. a
Crafts-Brandner, S. J. and Salvucci, M. E.: Rubisco activase constrains the photosynthetic potential of leaves at high temperature and CO2, P. Natl. Acad. Sci. USA, 97, 13430–13435, https://doi.org/10.1073/pnas.230451497, 2000. a
Cubillos, J. C., Wright, S. W., Nash, G., De Salas, M. F., Griffiths, B., Tilbrook, B., Poisson, A., and Hallegraeff, G. M.: Calcification morphotypes of the coccolithophorid Emiliania huxleyi in the Southern Ocean: Changes in 2001 to 2006 compared to historical data, Mar. Ecol. Prog. Ser., 348, 47–54, https://doi.org/10.3354/meps07058, 2007. a
De Bodt, C., Van Oostende, N., Harlay, J., Sabbe, K., and Chou, L.: Individual and interacting effects of pCO2 and temperature on Emiliania huxleyi calcification: Study of the calcite production, the coccolith morphology and the coccosphere size, Biogeosciences, 7, 1401–1412, https://doi.org/10.5194/bg-7-1401-2010, 2010. a, b
de Boyer Montégut, C., Madec, G., Fischer, A. S., Lazar, A., and Iudicone, D.: Mixed layer depth over the global ocean: An examination of profile data and a profile-based climatology, J. Geophys. Res.-Ocean., 109, C12003, https://doi.org/10.1029/2004JC002378, 2004. a
Dickson, A. G.: Standards for ocean measurements, Oceanography, 23, 34–47, https://doi.org/10.5670/oceanog.2010.22, 2010. a
Dickson, A. G., Wesolowski, D. J., Palmer, D. A., and Mesmer, R. E.: Dissociation constant of bisulfate ion in aqueous sodium chloride solutions to 250 ∘C, J. Phys. Chem., 94, 7978–7985, https://doi.org/10.1021/j100383a042, 1990. a
Dickson, A. G., Sabine, C. L., and Christian, J. R.: Guide to best practices for ocean CO2 measurements, PICES Special Publication, North Pacific Marine Science Organization, Sidney, British Columbia, 2007. a, b
Doney, S. C., Fabry, V. J., Feely, R. A., and Kleypas, J. A.: Ocean acidification: The other CO2 problem, Annu. Rev. Mar. Sci., 1, 169–192, https://doi.org/10.1146/annurev.marine.010908.163834, 2009. a
Dutkiewicz, S., Morris, J. J., Follows, M. J., Scott, J., Levitan, O., Dyhrman, S. T., and Berman-Frank, I.: Impact of ocean acidification on the structure of future phytoplankton communities, Nat. Clim. Change, 5, 1002–1006, https://doi.org/10.1038/nclimate2722, 2015. a
Endo, H., Yoshimura, T., Kataoka, T., and Suzuki, K.: Effects of CO2 and iron availability on phytoplankton and eubacterial community compositions in the northwest subarctic Pacific, J. Exp. Mar. Biol. Ecol., 439, 160–175, https://doi.org/10.1016/j.jembe.2012.11.003, 2013. a
Engel, A., Zondervan, I., Aerts, K., Beaufort, L., Benthien, A., Chou, L., Delille, B., Gattuso, J.-P., Harlay, J., Heemann, C., Hoffmann, L., Jacquet, S., Nejstgaard, J., Pizay, M.-D., Rochelle-Newall, E., Schneider, U., Terbrueggen, A., and Riebesell, U.: Testing the direct effect of CO2 concentration on a bloom of the coccolithophorid Emiliania huxleyi in mesocosm experiments, Limnol. Oceanogr., 50, 493–507, https://doi.org/10.4319/lo.2005.50.2.0493, 2005. a
Eynaud, F., Giraudeau, J., Pichon, J.-J., and Pudsey, C. J.: Sea-surface distribution of coccolithophores, diatoms, silicoflagellates and dinoflagellates in the South Atlantic Ocean during the late austral summer 1995, Deep-Sea Res. Pt. I, 46, 451–482, https://doi.org/10.1016/S0967-0637(98)00079-X, 1999. a, b, c
Feng, Y., Warner, M. E., Zhang, Y., Sun, J., Fu, F.-X., Rose, J. M., and Hutchins, D. A.: Interactive effects of increased pCO2, temperature and irradiance on the marine coccolithophore Emiliania huxleyi (Prymnesiophyceae), Eur. J. Phycol., 43, 87–98, https://doi.org/10.1080/09670260701664674, 2008. a
Feng, Y., Hare, C. E., Rose, J., Handy, S. M., DiTullio, G. R., Lee, P. A., Smith Jr, W. O., Peloquin, J., Tozzi, S., Sun, J., Zhang, Y., Dunbar, R. B., Long, M. C., Sohst, B., Lohan, M., and Hutchins, D. A.: Interactive effects of iron, irradiance and CO2 on Ross Sea phytoplankton, Deep-Sea Res. Pt. I, 57, 368–383, https://doi.org/10.1016/j.dsr.2009.10.013, 2010. a
Fernando, A. G. S., Peleo-Alampay, A. M., and Wiesner, M. G.: Calcareous nannofossils in surface sediments of the eastern and western South China Sea, Mar. Micropaleontol., 66, 1–26, https://doi.org/10.1016/j.marmicro.2007.07.003, 2007. a, b
Gafar, N. A., Eyre, B. D., and Schulz, K. G.: A conceptual model for projecting coccolithophorid growth, calcification and photosynthetic carbon fixation rates in response to global ocean change, Front. Mar. Sci., 4, 1–18, https://doi.org/10.3389/fmars.2017.00433, 2018. a, b, c, d, e, f, g, h, i, j, k, l, m, n
Gao, K., Ruan, Z., Villafane, V. E., Gattuso, J.-P., and Helbling, E. W.: Ocean acidification exacerbates the effect of UV radiation on the calcifying phytoplankter Emiliania huxleyi, Limnol. Oceanogr., 54, 1855–1862, https://doi.org/10.4319/lo.2009.54.6.1855, 2009. a
Gravalosa, J. M., Flores, J.-A., Sierro, F. J., and Gersonde, R.: Sea surface distribution of coccolithophores in the eastern Pacific sector of the Southern Ocean (Bellingshausen and Amundsen Seas) during the late austral summer of 2001, Mar. Micropaleontol., 69, 16–25, https://doi.org/10.1016/j.marmicro.2007.11.006, 2008. a
Gregg, W. W. and Casey, N. W.: Modeling coccolithophores in the global oceans, Deep-Sea Res. Pt. II, 54, 447–477, https://doi.org/10.1016/j.dsr2.2006.12.007, 2007. a, b, c, d
Guillard, R. R. L.: Culture of phytoplankton for feeding marine invertebrates, in: Culture of Marine Invertebrate Animals, edited by: Smith, W. L. and Chanley, M. H., Plenum Press, New York, USA, 26–60, 1975. a
Hagino, K. and Okada, H.: Intra-and infra-specific morphological variation in selected coccolithophore species in the equatorial and subequatorial Pacific Ocean, Mar. Micropaleontol., 58, 184–206, https://doi.org/10.1016/j.marmicro.2005.11.001, 2006. a
Hagino, K., Okada, H., and Matsuoka, H.: Coccolithophore assemblages and morphotypes of Emiliania huxleyi in the boundary zone between the cold Oyashio and warm Kuroshio currents off the coast of Japan, Mar. Micropaleontol., 55, 19–47, https://doi.org/10.1016/j.marmicro.2005.02.002, 2005. a, b
Helm, D., Cook, S., Cubillos, J., McMinn, A., and Hallegraeff, G. M.: Growth, photosynthesis and temperature tolerance of eight Southern Ocean strains of the coccolithophorid Emiliania huxleyi, Masters thesis, Institute of Antarctic and Southern Ocean Studies, 2007. a, b
Henderiks, J., Winter, A., Elbraechter, M., Feistel, R., van der Plas, A., Nausch, G., and Barlow, R.: Environmental controls on Emiliania huxleyi morphotypes in the Benguela coastal upwelling system (SE Atlantic), Mar. Ecol. Prog. Ser., 448, 51–66, https://doi.org/10.3354/meps09535, 2012. a
Holligan, P. M., Fernández, E., Aiken, J., Balch, W. M., Boyd, P., Burkill, P. H., Finch, M., Groom, S. B., Malin, G., Muller, K., Purdie, D. A., Robinson, C., Trees, C. C., Turner, S. M., and van der Wal, P.: A biogeochemical study of the coccolithophore, Emiliania huxleyi, in the North Atlantic, Global Biogeochem. Cy., 7, 879–900, https://doi.org/10.1029/93GB01731, 1993. a, b
Holligan, P. M., Charalampopoulou, A., and Hutson, R.: Seasonal distributions of the coccolithophore, Emiliania huxleyi, and of particulate inorganic carbon in surface waters of the Scotia Sea, J. Mar. Syst., 82, 195–205, https://doi.org/10.1016/j.jmarsys.2010.05.007, 2010. a
Hutchinson, G.: Concluding remarks, Cold Spring Harbor Symposia on Quantitative Biology, 22, 415–427, 1957. a
Iglesias-Rodríguez, M. D., Brown, C. W., Doney, S. C., Kleypas, J., Kolber, D., Kolber, Z., Hayes, P. K., and Falkowski, P. G.: Representing key phytoplankton functional groups in ocean carbon cycle models: Coccolithophorids, Global Biogeochem. Cy., 16, 47-1–47-20, https://doi.org/10.1029/2001GB001454, 2002. a
IPCC: Climate Change 2013: The Physical Science Basis. Contribution of Working Group I to the Fifth Assessment Report of the Intergovernmental Panel on Climate Change, Cambridge University Press, Cambridge, United Kingdom and New York, NY, USA, 2013a. a, b, c
IPCC: Summary for policy makers, in: Climate Change 2013: The Physical Science Basis, Contribution of Working Group I to the Fifth Assessment Report of the Intergovernmental Panel on Climate Change, edited by: Stocker, T. F., Qin, D., Plattner, G.-K., Tignor, M., Allen, S. K., Boschung, J., Nauels, A., Xia, Y., V., B., and Midgley, P. M., Cambridge University Press, Cambridge, United Kingdom and New York, NY, USA, 1–27, 2013b. a, b, c
Kattner, G., Thomas, D. N., Haas, C., Kennedy, H., and Dieckmann, G. S.: Surface ice and gap layers in Antarctic sea ice: Highly productive habitats, Mar. Ecol. Prog. Ser., 277, 1–12, https://doi.org/10.3354/meps277001, 2004. a
Kester, D. R., Duedall, I. W., Connors, D. N., and Pytkowicz, R. M.: Preparation of artificial seawater, Limnol. Oceanogr., 12, 176–179, https://doi.org/10.4319/lo.1967.12.1.0176, 1967. a
Knappertsbusch, M.: Geographic distribution of living and Holocene coccolithophores in the Mediterranean Sea, Mar. Micropaleontol., 21, 219–247, https://doi.org/10.1016/0377-8398(93)90016-Q, 1993. a, b, c, d
Kottmeier, D. M., Rokitta, S. D., and Rost, B.: Acidification, not carbonation, is the major regulator of carbon fluxes in the coccolithophore Emiliania huxleyi, New Phytol., 211, 126–137, https://doi.org/10.1111/nph.13885, 2016. a
Krumhardt, K. M., Lovenduski, N. S., Iglesias-Rodríguez, M. D., and Kleypas, J. A.: Coccolithophore growth and calcification in a changing ocean, Prog. Oceanogr., 159, 276–295, https://doi.org/10.1016/j.pocean.2017.10.007, 2017. a
Langer, G., Nehrke, G., Probert, I., Ly, J., and Ziveri, P.: Strain-specific responses of Emiliania huxleyi to changing seawater carbonate chemistry, Biogeosciences, 6, 2637–2646, https://doi.org/10.5194/bg-6-2637-2009, 2009. a
Larsen, S. H.: Dimethylsulphoniopropionate (DMSP) production of Gephyrocapsa oceanica in response to environmental forcing, Doctor of philosophy, School of Biological Sciences, Melbourne, 202 pp., https://doi.org/10.4225/03/58a24e0331904, 2012. a, b
Lefebvre, S. C., Benner, I., Stillman, J. H., Parker, A. E., Drake, M. K., Rossignol, P. E., Okimura, K. M., Tomoko, K., and Carpenter, E. J.: Nitrogen source and pCO2 synergistically affect carbon allocation, growth and morphology of the coccolithophore Emiliania huxleyi: Potential implications of ocean acidification for the carbon cycle, Glob. Change Biol., 18, 493–503, https://doi.org/10.1111/j.1365-2486.2011.02575.x, 2012. a
Leibold, M. A.: The niche concept revisited: Mechanistic models and community context, Ecology, 76, 1371–1382, https://doi.org/10.1111/j.1529-8817.2005.00152.x, 1995. a, b, c
Lewis, E., Wallace, D., and Allison, L. J.: Program developed for CO2 system calculations, Carbon Dioxide Information Analysis Center, managed by Lockheed Martin Energy Research Corporation for the US Department of Energy Tennessee, Oak Ridge, ORNL/CDIAC-105, 42 pp., https://doi.org/10.3334/CDIAC/otg.CO2SYS_DOS_CDIAC105, 1998. a, b
Longhurst, A. R.: Ecological geography of the sea, Ecological Geography of the Sea Series, Elsevier Science, London, UK, 2nd Edn., 2007. a
Lueker, T. J., Dickson, A. G., and Keeling, C. D.: Ocean pCO2 calculated from dissolved inorganic carbon, alkalinity, and equations for K1 and K2: Validation based on laboratory measurements of CO2 in gas and seawater at equilibrium, Mar. Chem., 70, 105–119, https://doi.org/10.1016/S0304-4203(00)00022-0, 2000. a
McIntyre, A. and Bé, A. W. H.: Modern Coccolithophoridae of Atlantic Ocean – I. Placoliths and cyrtoliths, Deep-Sea Res. Oceanogr. Abstracts, 14, 561–597, https://doi.org/10.1016/0011-7471(67)90065-4, 1967. a, b, c, d, e, f, g
Mohan, R., Mergulhao, L. P., Guptha, M. V. S., Rajakumar, A., Thamban, M., AnilKumar, N., Sudhakar, M., and Ravindra, R.: Ecology of coccolithophores in the Indian sector of the Southern Ocean, Mar. Micropaleontol., 67, 30–45, https://doi.org/10.1016/j.marmicro.2007.08.005, 2008. a, b
Moheimani, N. R. and Borowitzka, M. A.: Increased CO2 and the effect of pH on growth and calcification of Pleurochrysis carterae and Emiliania huxleyi (Haptophyta) in semicontinuous cultures, Appl. Microbiol. Biot., 90, 1399–1407, https://doi.org/10.1007/s00253-011-3174-x, 2011. a
Monteiro, F. M., Bach, L. T., Brownlee, C., Bown, P., Rickaby, R. E., Poulton, A. J., Tyrrell, T., Beaufort, L., Dutkiewicz, S., and Gibbs, S.: Why marine phytoplankton calcify, Sci. Adv., 2, e1501822, https://doi.org/10.1126/sciadv.1501822, 2016. a
Müller, M. N., Trull, T. W., and Hallegraeff, G. M.: Differing responses of three Southern Ocean Emiliania huxleyi ecotypes to changing seawater carbonate chemistry, Mar. Ecol.-Prog. Ser, 531, 81–90, https://doi.org/10.3354/meps11309, 2015. a
Nanninga, H. and Tyrrell, T.: Importance of light for the formation of algal blooms by Emiliania huxleyi, Mar. Ecol. Prog. Ser., 136, 195–203, https://doi.org/10.3354/meps136195, 1996. a
NASA Goddard Space Flight Center, Ocean Ecology Laboratory, O. B. P. G.: Moderate-resolution Imaging Spectroradiometer (MODIS) Aqua Particulate Inorganic Carbon Data; 2014 Reprocessing, NASA OB, DAAC, Greenbelt, MD, USA, https://doi.org/10.5067/AQUA/MODIS/L3B/PIC/2018 (last access: 2 November 2017), 2014a. a
NASA Goddard Space Flight Center, Ocean Ecology Laboratory, O. B. P. G.: Moderate-resolution Imaging Spectroradiometer (MODIS) Aqua Photosynthetically Available Radiation Data; 2014 Reprocessing, NASA OB.DAAC, Greenbelt, MD, USA, https://doi.org/10.5067/AQUA/MODIS/L3M/PAR/2018 (last access: 30 November 2017), 2014b. a
Nielsen, M. V.: Photosynthetic characteristics of the coccolithophorid Emiliania huxleyi (Prymnesiophyceae) exposed to elevated concentrations of dissolved inorganic carbon, J. Phycol., 31, 715–719, https://doi.org/10.1111/j.0022-3646.1995.00715.x, 1995. a
Okada, H. and Honjo, S.: Distribution of coccolithophorids in the North and Equatorial Pacific Ocean: Quantitative data on samples collected during Leg 30, Oshoro-Maru, 1968 and Leg HK69-4, Hakuho-Maru, 1969, Report WHOI-73-81, Woods Hole Oceanographic Institution, Woods hole, Falmouth, unpublished manuscript, 1973. a
Okada, H. and Honjo, S.: Distribution of Coccolithophores in Marginal Seas along the Western Pacific Ocean and in the Red Sea, Mar. Biol., 31, 271–285, 1975. a
Orr, J. C., Fabry, V. J., Aumont, O., Bopp, L., Doney, S. C., Feely, R. A., Gnanadesikan, A., Gruber, N., Ishida, A., Joos, F., Key, R. M., Lindsay, K., Maier-Reimer, E., Matear, R., Monfray, P., Mouchet, A., Najjar, R. G., Plattner, G.-K., Rodgers, K. B., Sabine, C. L., Sarmiento, J. L., Schlitzer, R., Slater, R. D., Totterdell, I. J., Weirig, M.-F., Yamanaka, Y., and Yool, A.: Anthropogenic ocean acidification over the twenty-first century and its impact on calcifying organisms, Nature, 437, 681–686, https://doi.org/10.1038/nature04095, 2005. a
Paasche, E.: Roles of nitrogen and phosphorus in coccolith formation in Emiliania huxleyi (Prymnesiophyceae), Eur. J. Phycol., 33, 33–42, https://doi.org/10.1080/09670269810001736513, 1998. a
Paasche, E.: A review of the coccolithophorid Emiliania huxleyi (Prymnesiophyceae), with particular reference to growth, coccolith formation, and calcification-photosynthesis interactions, Phycologia, 40, 503–529, https://doi.org/10.2216/i0031-8884-40-6-503.1, 2001. a
Pascal, D.: GMIS – MERIS Monthly climatology sea surface diffuse attenuation coefficient at 490 nm (9 km) in m−1, European Commission, Joint Research Centre (JRC), 2013. a
Patil, S. M., Mohan, R., Shetye, S., Gazi, S., and Jafar, S.: Morphological variability of Emiliania huxleyi in the Indian sector of the Southern Ocean during the austral summer of 2010, Mar. Micropaleontol., 107, 44–58, https://doi.org/10.1016/j.marmicro.2014.01.005, 2014. a
Pörtner, H. O. and Farrell, A. P.: Physiology and Climate Change, Science, 322, 690–692, https://doi.org/10.1126/science.1163156, 2008. a
Poulton, A. J., Adey, T. R., Balch, W. M., and Holligan, P. M.: Relating coccolithophore calcification rates to phytoplankton community dynamics: Regional differences and implications for carbon export, Deep-Sea Res. Pt. II, 54, 538–557, https://doi.org/10.1016/j.dsr2.2006.12.003, 2007. a
Poulton, A. J., Charalampopoulou, A., Young, J. R., Tarran, G. A., Lucas, M. I., and Quartly, G. D.: Coccolithophore dynamics in non-bloom conditions during late summer in the central Iceland Basin (July–August 2007), Limnol. Oceanogr., 55, 1601–1613, https://doi.org/10.4319/lo.2010.55.4.1601, 2010. a
Powles, S. B.: Photoinhibition of photosynthesis induced by visible light, Ann. Rev. Plant Physiol., 35, 15–44, https://doi.org/10.1146/annurev.pp.35.060184.000311, 1984. a
Raven, J. A. and Crawfurd, K.: Environmental controls on coccolithophore calcification, Mar. Ecol. Prog. Ser., 470, 137–166, https://doi.org/10.3354/meps09993, 2012. a
Rhodes, L. L., Peake, B. M., MacKenzie, A. L., and Marwick, S.: Coccolithophores Gephyrocapsa oceanica and Emiliania huxleyi (Prymnesiophyceae = Haptophyceae) in New Zealand's coastal waters: Characteristics of blooms and growth in laboratory culture, New Zeal. J. Mar. Fresh., 29, 345–357, https://doi.org/10.1080/00288330.1995.9516669, 1995. a, b, c, d
Riebesell, U., Zondervan, I., Rost, B., Tortell, P. D., Zeebe, R. E., and Morel, F. M. M.: Reduced calcification of marine plankton in response to increased atmospheric CO2, Nature, 407, 364–367, https://doi.org/10.1038/35030078, 2000. a
Rivero-Calle, S., Gnanadesikan, A., Del Castillo, C. E., Balch, W. M., and Guikema, S. D.: Multidecadal increase in North Atlantic coccolithophores and the potential role of rising CO2, Science, 350, 1533–1537, https://doi.org/10.1126/science.aaa8026, 2015. a
Rokitta, S. D. and Rost, B.: Effects of CO2 and their modulation by light in the life-cycle stages of the coccolithophore Emiliania huxleyi, Limnol. Oceanogr., 57, 607–618, https://doi.org/10.4319/lo.2012.57.2.0607, 2012. a, b
Rost, B. and Riebesell, U.: Coccolithophores and the biological pump: Responses to environmental changes, in: Coccolithophores: From molecular processes to global impacts, edited by: Thierstein, H. R. and Young, J. R., Book section 5, 99–125, Springer, Berlin, Heidelberg, https://doi.org/10.1007/978-3-662-06278-4_5, 2004. a, b, c, d
Roth, P. H. and Coulbourn, W. T.: Floral and solution patterns of coccoliths in surface sediments of the North Pacific, Mar. Micropaleontol., 7, 1–52, https://doi.org/10.1016/0377-8398(82)90014-7, 1982. a, b, c
Saavedra-Pellitero, M., Baumann, K.-H., Flores, J.-A., and Gersonde, R.: Biogeographic distribution of living coccolithophores in the Pacific Sector of the Southern Ocean, Mar. Micropaleontol., 109, 1–20, https://doi.org/10.1016/j.marmicro.2014.03.003, 2014. a, b, c
Sabine, C. L., Feely, R. A., Gruber, N., Key, R. M., Lee, K., Bullister, J. L., Wanninkhof, R., Wong, C. S. l., Wallace, D. W. R., and Tilbrook, B.: The oceanic sink for anthropogenic CO2, science, 305, 367–371, https://doi.org/10.1126/science.1097403, 2004. a
Samtleben, C. and Schroder, A.: Living coccolithophore communities in the Norwegian-Greenland Sea and their record in sediments, Mar. Micropaleontol., 19, 333–354, https://doi.org/10.1016/0377-8398(92)90037-K, 1992. a
Schneider, U.: Influence of carbonate chemistry and light intensity on natural phytoplankton assemblages with emphasis on species composition, Doctor of philosophy, Biology/Chemistry, 2004. a
Schulz, K. G., Barcelos e Ramos, J., Zeebe, R. E., and Riebesell, U.: CO2 perturbation experiments: Similarities and differences between dissolved inorganic carbon and total alkalinity manipulations, Biogeosciences, 6, 2145–2153, https://doi.org/10.5194/bgd-6-4441-2009, 2009. a
Schulz, K. G., Bach, L. T., Bellerby, R. G., Bermudez, R., Büdenbender, J., Boxhammer, T., Czerny, J., Engel, A., Ludwig, A., and Meyerhöfer, M.: Phytoplankton blooms at increasing levels of atmospheric carbon dioxide: Experimental evidence for negative effects on prymnesiophytes and positive on small picoeukaryotes, Front. Mar. Sci., 4, 1–18, https://doi.org/10.3389/fmars.2017.00064., 2017. a
Sett, S., Bach, L. T., Schulz, K. G., Koch-Klavsen, S., Lebrato, M., and Riebesell, U.: Temperature modulates coccolithophorid sensitivity of growth, photosynthesis and calcification to increasing seawater pCO2, PloS One, 9, e88308, https://doi.org/10.1371/journal.pone.0088308, 2014. a, b, c, d, e, f, g, h, i, j, k, l, m
Sharp, J. H.: Improved analysis for “particulate” organic carbon and nitrogen from seawater, Limnol. Oceanogr., 19, 984–989, https://doi.org/10.4319/lo.1974.19.6.0984, 1974. a
Sinha, B., Buitenhuis, E. T., Le Quéré, C., and Anderson, T. R.: Comparison of the emergent behavior of a complex ecosystem model in two ocean general circulation models, Prog. Oceanogr., 84, 204–224, https://doi.org/10.1016/j.pocean.2009.10.003, 2010. a, b, c
Takahashi, T., Sutherland, S. C., Chipman, D. W., Goddard, J. G., Ho, C., Newberger, T., Sweeney, C., and Munro, D.: Climatological distributions of pH, pCO2, total CO2, alkalinity, and CaCO3 saturation in the global surface ocean, and temporal changes at selected locations, Mar. Chem., 164, 95–125, https://doi.org/10.1016/j.marchem.2014.06.004, 2014. a, b, c
Trull, T. W., Passmore, A., Davies, D. M., Smit, T., Berry, K., and Tilbrook, B.: Distribution of planktonic biogenic carbonate organisms in the Southern Ocean south of Australia: a baseline for ocean acidification impact assessment, Biogeosciences, 15, 31–49, https://doi.org/10.5194/bg-15-31-2018, 2018. a
Uppström, L. R.: The boron/chlorinity ratio of deep-sea water from the Pacific Ocean, Deep-Sea Res. Oceanogr. Abstracts, 21, 161–162, https://doi.org/10.1016/0011-7471(74)90074-6, 1974. a
van Bleijswijk, J. D. L., Kempers, R. S., and Velhuis, M. J.: Cell and growth characteristics of types A and B of Emiliania huxleyi (Prymnesiophyceae) as determined by flow cytometry and chemical analysis, J. Phycol., 30, 230–241, https://doi.org/10.1111/j.0022-3646.1994.00230.x, 1994. a, b
van Rijssel, M. and Gieskes, W. W. C.: Temperature, light, and the dimethylsulfoniopropionate (DMSP) content of Emiliania huxleyi (Prymnesiophyceae), J. Sea Res., 48, 17–27, https://doi.org/10.1016/S1385-1101(02)00134-X, 2002. a, b, c
Wilson, W. H., Tarran, G. A., Schroeder, D., Cox, M., Oke, J., and Malin, G.: Isolation of viruses responsible for the demise of an Emiliania huxleyi bloom in the English Channel, J. Mar. Biol. Assoc. UK, 82, 369–377, https://doi.org/10.1017/S002531540200560X, 2002. a
Winter, A. and Siesser, W. G.: Atlas of living coccolithophores, in: Coccolithophores, edited by: Winter, A. and Siesser, W. G., book section 7, Cambridge University Press, Cambridge, UK, vol. 13, 107–159, 1994. a
Winter, A., Jordan, R. W., and Roth, P. H.: Biogeography of living coccolithophores in ocean waters, in: Coccolithophores, edited by: Winter, A. and Siesser, W. G., book section 8, Cambridge University Press, Cambridge, United Kingdom, vol. 13, 161–177, 1994. a
Zhang, Y., Klapper, R., Lohbeck, K. T., Bach, L. T., Schulz, K. G., Reusch, T. B. H., and Riebesell, U.: Between-and within-population variations in thermal reaction norms of the coccolithophore Emiliania huxleyi, Limnol. Oceanogr., 59, 1570–1580, https://doi.org/10.4319/lo.2014.59.5.1570, 2014. a
Zhang, Y., Bach, L. T., Schulz, K. G., and Riebesell, U.: The modulating influence of light intensity on the response of the coccolithophore Gephyrocapsa oceanica to ocean acidification, Limnol. Oceanogr., 60, 2145–2157, https://doi.org/10.1002/lno.10161, 2015. a, b, c, d, e, f
Zondervan, I.: The effects of light, macronutrients, trace metals and CO2 on the production of calcium carbonate and organic carbon in coccolithophores – A review, Deep-Sea Res. Pt. II, 54, 521–537, https://doi.org/10.1016/j.dsr2.2006.12.004, 2007. a
Zondervan, I., Rost, B., and Riebesell, U.: Effect of CO2 concentration on the PIC/POC ratio in the coccolithophore Emiliania huxleyi grown under light-limiting conditions and different daylengths, J. Exp. Mar. Biol. Ecol., 272, 55–70, https://doi.org/10.1016/S0022-0981(02)00037-0, 2002. a, b, c
Zurell, D., Thuiller, W., Pagel, J., Cabral, J. S., Münkemüller, T., Gravel, D., Dullinger, S., Normand, S., Schiffers, K. H., and Moore, K. A.: Benchmarking novel approaches for modelling species range dynamics, Glob. Change Biol., 22, 2651–2664, https://doi.org/10.1111/gcb.13251, 2016. a