the Creative Commons Attribution 4.0 License.
the Creative Commons Attribution 4.0 License.
 | 03 Sep 2018
Patterns of soil respiration and its temperature sensitivity in grassland ecosystems across China
Jiguang Feng
Jingsheng Wang
Yanjun Song
Soil respiration (Rs), a key process in the terrestrial carbon cycle, is very sensitive to climate change. In this study, we synthesized 54 measurements of annual Rs and 171 estimates of Q10 value (the temperature sensitivity of soil respiration) in grasslands across China. We quantitatively analyzed their spatial patterns and controlling factors in five grassland types, including temperate typical steppe, temperate meadow steppe, temperate desert steppe, alpine grassland, and warm, tropical grassland. Results showed that the mean (±SE) annual Rs was 582.0±57.9 g C m−2 yr−1 across Chinese grasslands. Annual Rs significantly differed among grassland types, and was positively correlated with mean annual temperature, mean annual precipitation, soil temperature, soil moisture, soil organic carbon content, and aboveground biomass, but negatively correlated with soil pH (p<0.05). Among these factors, mean annual precipitation was the primary factor controlling the variation of annual Rs among grassland types. Based on the overall data across Chinese grasslands, the Q10 values ranged from 1.03 to 8.13, with a mean (±SE) of 2.60±0.08. Moreover, the Q10 values varied largely within and among grassland types and soil temperature measurement depths. Among grassland types, the highest Q10 derived by soil temperature at a depth of 5 cm occurred in alpine grasslands. In addition, the seasonal variation of soil respiration in Chinese grasslands generally cannot be explained well by soil temperature using the van't Hoff equation. Overall, our findings suggest that the combined factors of soil temperature and moisture would better predict soil respiration in arid and semi-arid regions, highlight the importance of precipitation in controlling soil respiration in grasslands, and imply that alpine grasslands in China might release more carbon dioxide to the atmosphere under climate warming.
- Article
(3416 KB) - Full-text XML
-
Supplement
(872 KB) - BibTeX
- EndNote


Soil respiration (Rs) represents carbon dioxide (CO2) efflux from the soil surface, including autotrophic/root respiration, and heterotrophic/microbial respiration associated with soil organic matter and litter decomposition (Boone et al., 1998; Kuzyakov, 2006; Schindlbacher et al., 2009). As one of the largest fluxes in the global carbon cycle, Rs plays an important role in regulating ecosystem carbon cycling, carbon–climate feedback, and climate change (Raich and Schlesinger, 1992; Davidson et al., 2002; Luo and Zhou, 2006; Bond-Lamberty and Thomson, 2010). The temperature sensitivity of Rs (Q10), the factor by which Rs is multiplied when temperature increases by 10 ∘C, is a key parameter to evaluate the feedback intensity between soil carbon efflux and climate warming (Reichstein et al., 2005; Davidson and Janssens, 2006). Knowledge on patterns and control of Rs and Q10 variation at a large scale is crucial for better understanding and modeling of the soil carbon cycle in a warmer world (Peng et al., 2009; Wang et al., 2010).
Temperature and precipitation are commonly believed to be the most important climatic factors controlling Rs at the large scale, as suggested by a number of studies (Raich and Schlesinger, 1992; Raich and Potter, 1995; Chen et al., 2014; Hursh et al., 2017). Soil properties, such as soil organic carbon (SOC), soil total nitrogen (STN), and soil pH, can also affect Rs in that they can directly or indirectly affect substrate quality and quantity, which strongly control soil microbial activity and heterotrophic respiration (Ryan and Law, 2005; Q. Chen et al., 2010; Chen et al., 2014; Song et al., 2014). Additionally, biotic factors including decomposer microbes and roots (together with associated mycorrhizal fungi) can directly influence soil respiration via heterotrophic and autotrophic respiration, respectively (Ryan and Law, 2005; Bahn et al., 2010). Previous studies have shown that Rs increased with total, aboveground, and belowground net/gross primary production, aboveground biomass (AGB), belowground biomass (BGB), and leaf area index (Raich and Schlesinger, 1992; Hibbard et al., 2005; Bahn et al., 2008; S. Chen et al., 2014; Zhao et al., 2017).
As the response of Rs to temperature is controlled by temperature effects on autotrophic respiration from roots and heterotrophic respiration from SOC decomposition, the temperature sensitivity of Rs should be regulated by plant-related biotic variables and soil-related environmental variables. Several studies have shown that climatic factors strongly controlled the spatial variation of Q10, and Q10 generally decreased with mean annual temperature (MAT) and mean annual precipitation (MAP) (Raich and Schlesinger, 1992; Kirschbaum, 2000; Peng et al., 2009; Song et al., 2014). In addition to climatic variables, the spatial variation of Q10 could be affected by seasonality of plant activity. Previous studies suggested that plant growth plays an important role in the seasonal variation of Rs, and thereby the seasonal dynamic changes in plant activity affect seasonal Q10 (Yuste et al., 2004; Wang et al., 2010). Furthermore, Q10 is also affected by soil properties, such as soil temperature, soil moisture, soil pH, SOC, and STN, which can directly influence root and microbial activities, substrate availability, and nutrient supply (Zhou et al., 2009; Song et al., 2014; Zhao et al., 2017).
Grasslands in China cover 29 %–41 % of its total land area (Shen et al., 2016) and have significant effects on the regional climate and carbon cycle (Ni, 2002). In China, grasslands are widely distributed throughout the country, and the different climate gradients and landforms in China support a number of grassland types, including tropical, warm, temperate, and alpine grassland. (Chen et al., 2002; Shen et al., 2016). Specifically, the temperate arid and semi-arid grasslands in Inner Mongolia and the alpine meadow and steppe in Qinghai-Tibet Plateau comprise the main body of temperate and alpine grasslands, respectively (Shen et al., 2016). In the past two decades, a large number of case studies on Rs have been widely conducted in grasslands across China. However, few have been included in global Rs and Q10 syntheses (Raich and Schlesinger, 1992; Wang et al., 2010; Bond-Lamberty and Thomson, 2010; Chen et al., 2014; Hursh et al., 2017), largely because most studies were published in Chinese journals. Given the diverse grassland types, especially alpine grasslands distributed in China, Rs and Q10 may vary among grassland types due to the differences in abiotic and biotic factors, and the patterns of Rs and Q10 across Chinese grasslands may differ from global terrestrial ecosystems and grasslands. However, how the spatial variation of Rs and Q10 changes with abiotic and biotic factors across Chinese grasslands and their differences among grassland types still remain poorly understood.
In this study, we synthesized all the available data relating to Rs and Q10 in grasslands across China. Our main objectives were to (1) analyze the spatial patterns of Rs and Q10 across various grassland ecosystems in China; (2) compare the differences in Rs and Q10 among grassland types; (3) identify how abiotic and biotic factors drive Rs and Q10 among sites at the regional scale, including geographic variables, climatic factors, soil properties, and biotic factors; and (4) compare the Rs and Q10 in Chinese grasslands with those from previous syntheses at the global and regional scale.
2.1 Data collection
Peer-reviewed journal articles and published theses (including those available online) before 1 December 2017 were searched using the Web of Science and China National Knowledge Infrastructure (CNKI, available online: http://epub.cnki.net, last access: 1 December 2017) with the following search term combinations: (soil respiration OR soil CO2 flux OR soil CO2 efflux OR soil CO2 emission OR soil carbon flux OR soil carbon efflux OR soil carbon emission) AND (grassland OR steppe OR meadow OR grass). Additional searches with the same keywords were conducted on ScienceDirect (Elsevier Ltd., Amsterdam, Nederland), Springer Link (Springer International Publishing AG, Berlin, Germany), and the Wiley Online Library (John Wiley & Sons Ltd., Hoboken, USA). Furthermore, previous global and regional syntheses on the similar topic were also screened to check Chinese grassland data, such as Peng et al. (2009), Wang and Fang (2009), Bond-Lamberty and Thomson (2010), Wang et al. (2010), Q. Chen et al. (2010), and Chen et al. (2014).
To ensure data consistency and accuracy, the following six criteria were applied to select appropriate studies: (1) experimental studies were conducted in the field; (2) experiments with the addition of nitrogen (fertilizer) treatments, increased or decreased precipitation, warming, elevated CO2, simulated acid rain, clipping, and grazing were removed; (3) the study must contain soil respiration or Q10 with a clear record of grassland type and experimental duration; (4) the investigation time for measuring Rs was not less than 12 months so that the annual Rs can be obtained, and modeled annual Rs based on the relationships between Rs rate and temperature were not included; (5) the investigation time for estimating Q10 value was not less than 4 months; and (6) Q10 values were calculated by the van't Hoff equation (Van's Hoff, 1898).
where SR is the measured soil respiration rate, T is the measured soil temperature at a given depth, and the coefficients α and β are fitted parameters. The Q10 values were calculated as
Several studies measured Rs and its temperature sensitivity in different years, and then these Rs and Q10 values were averaged across years. In this case, only the highest (coefficient of determination for calculating Q10 using Eq. 1) was extracted if more than one were available in the same study. In addition, the Q10 values were estimated by Rs measured at different plant growth stages, and they were further categorized into three types according to the Rs measurement period, including growing-season Q10, non-growing-season Q10, and annual Q10. If these three types of Q10 were all available, only the annual Q10 was selected in our database. Within these constraints, 54 measurements of annual Rs rate and 171 estimates of Q10 value were obtained from 108 published experimental studies across Chinese grasslands (Table S1 in the Supplement). Our database contained 14 variables associated with Rs, including annual Rs, growing- and non-growing-season Rs and their proportions to annual Rs, the proportion of autotrophic and heterotrophic respiration to annual Rs, and Q10 values of Rs and their corresponding . Here, the growing season was from May to October, and the non-growing season was from November to April in the following year. The Q10 values were divided into five soil depths with different soil temperatures (ST0, soil surface temperature; ST5, soil temperature at 5 cm; ST10, soil temperature at 10 cm; ST15, soil temperature at 15 cm; and ST20, soil temperature at 20 cm) for the same site. In one study, the Q10 was derived by soil temperature at a depth of 6 cm, and then it was treated as Q10−ST5 because of the little difference in soil temperature between 5 and 6 cm.
In most publications, the Rs, Q10, and its of the model were presented, and they were incorporated into our database directly. The Rs, Q10, and values were recalculated according to the available information if these values were not directly provided in some publications. The growing-season, non-growing-season, and annual Rs were obtained by interpolating the measured Rs rate between respective sampling dates for each seasonal measurement period of the year, and then computing the sum to obtain the corresponding values (Frank and Dugas, 2001; Sims and Bradford, 2001) as follows:
where CSR is cumulative soil respiration during the season, is the time interval between each field measurement within the season, and Fm,k is the average Rs rate over the interval .
In addition, for each study site, we also recorded other supporting information from the original publications, including grassland type, geographic variables (longitude and latitude), climatic factors (MAT and MAP), soil properties (soil temperature, soil moisture, soil pH, SOC, and STN), and biotic factors (microbial biomass carbon (MBC), AGB, and BGB). Missing climatic information was obtained using NASA Surface meteorology and Solar Energy according to the location of the case study site, and the other missing information was obtained from the related references according to the study site and described experiment design. Several studies provided the soil organic matter content, which was converted to SOC by multiplying a conversion factor of 0.50 (Pribyl, 2010). In the case of gravimetrical soil moisture being provided, it was converted to volumetric soil moisture according to soil bulk density. Given that BGB was measured in different soil depths, only BGB measured in 0–40 and 0–50 cm soil depths was selected because roots were mainly distributed in 0–50 cm and there was a minor difference between 0–40 and 0–50 cm. The distributions of selected experimental sites are shown in Fig. 1.
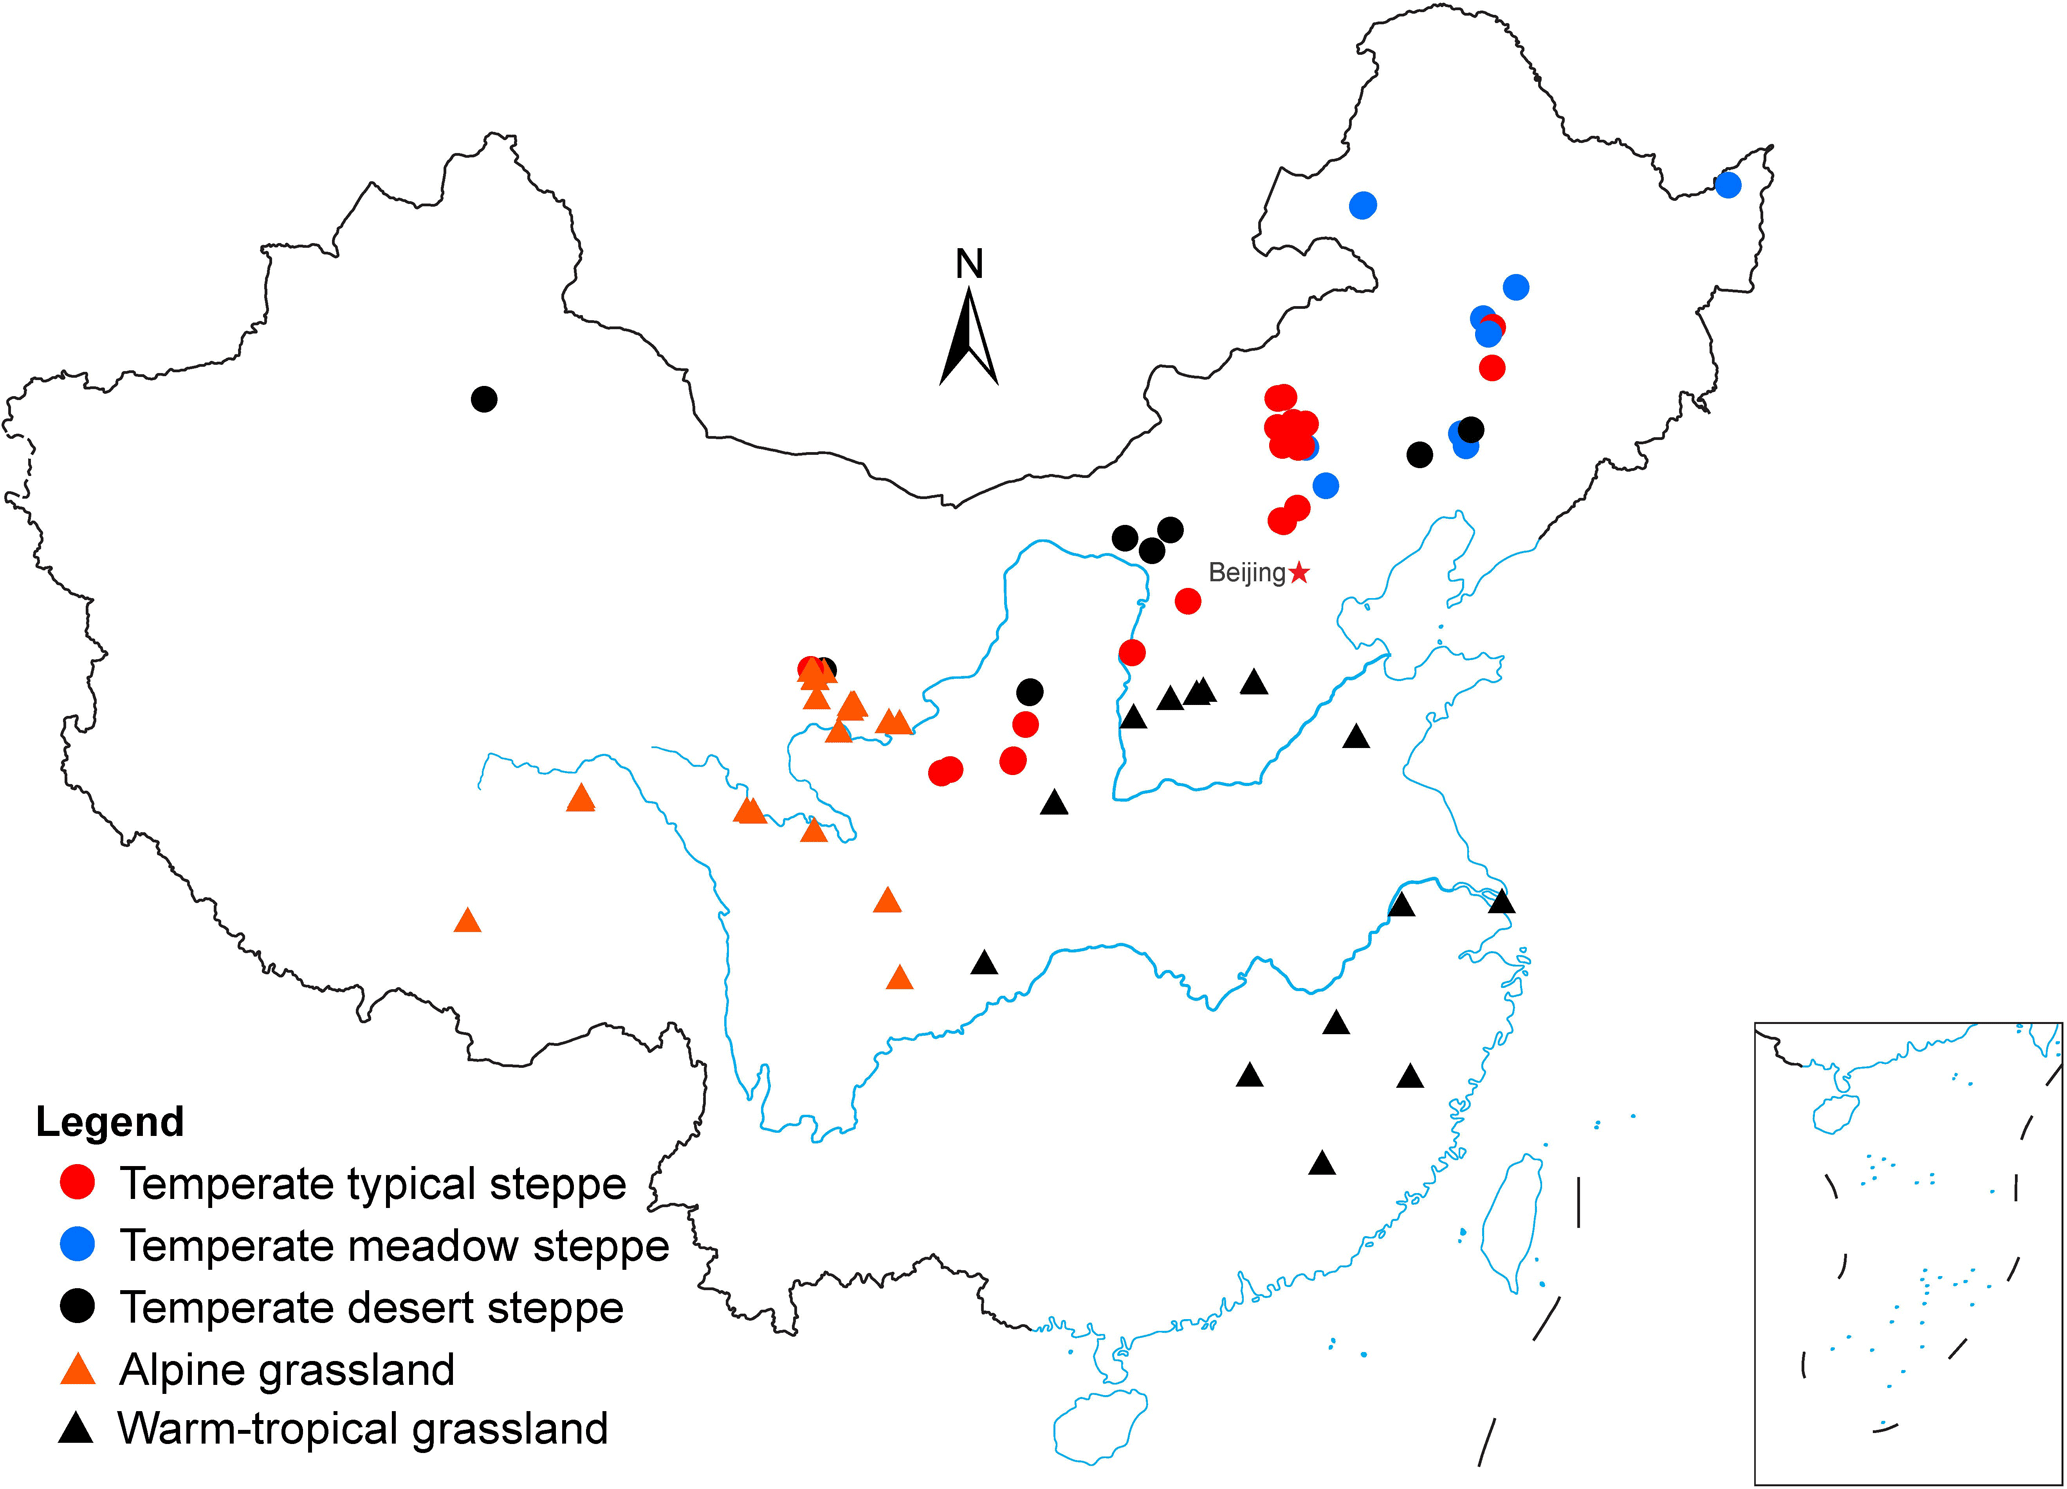
Figure 1The site location of soil respiration studies selected in this study across Chinese grasslands. Publisher's remark: Please note that the above figure contains disputed territories.
2.2 Data analysis
In this study, grasslands were divided into five groups, including temperate typical steppe, temperate meadow steppe, temperate desert steppe, alpine grassland, and warm, tropical grassland. If grassland type was not provided directly, it was determined according to the dominant plant species reported in selected publications and the classification of grassland ecosystems in China (Chen et al., 2002). Detailed statistical parameters for the five grassland types were presented in Table S2.
One-way analysis of variance (ANOVA) was used to examine whether annual Rs and Q10 values differed among grassland types, measuring periods, or measuring methods. In the case of homogeneity of variances, the least significant differences (LSD) test was applied; otherwise, the Dunnett T3 test was applied. A paired-samples t-test was performed to compare the differences between growing-season and non-growing-season Rs and between autotrophic respiration and heterotrophic respiration. The reason for using a paired-samples t-test was that these two corresponding variables were interconnected as they were from the same study sites. In addition, we used two statistical methods to explore the differences for Q10 among measurement depths. The paired-samples t-test was used to compare Q10 among different measurement depths from same sites, whereas the ANOVA was used to compare Q10 among different measurement depths from all sites. Compared with ANOVA, the advantages of the paired-samples t-test was that it avoided the effects of unequal spatial distribution of samples from different depths on Q10 and only compared the effects of measurement depth. The univariate regression analysis was used to identify the relationships between annual Rs, Q10, and a given biotic or abiotic factor mentioned above, except for MBC because of its limited sample size. The multiple linear regression analyses were also performed to identify the comprehensive effects of environmental variables (including MAT, MAP, soil temperature, and soil moisture as they had relatively enough sample sizes) on annual Rs, and Q10 derived by ST5 and ST10. Correlations among these factors were calculated with the Pearson correlation coefficients. All statistical analyses were performed using the software IBM SPSS Statistics 20.0 (IBM Corporation, New York, USA).
3.1 Soil respiration and its controlling factors
3.1.1 Patterns of annual soil respiration across Chinese grasslands
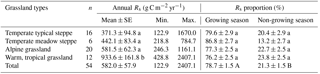
The annual Rs ranged from 122.9 to 2407.1 g C m−2 yr−1, with a total mean (±SE) of 582.0±57.9 g C m−2 yr−1. There were significant differences in annual Rs between grassland types (p<0.001), with the highest annual Rs in the warm, tropical grassland and the lowest annual Rs in the temperate desert steppe (Table 1). The proportions of growing-season or non-growing-season Rs varied slightly among different grassland types (p>0.05), but the proportion of Rs in the growing season was significantly higher than that in the non-growing season (p<0.001). Overall, growing-season and non-growing-season Rs consisted of 78.7 % and 21.3 % of the annual Rs, respectively, across all grasslands in China (Table 1). In addition, growing-season Rs was significantly positively correlated with the annual Rs based on a linear regression model (r2=0.923, p<0.001, Fig. S1). At the annual scale, the mean contribution of heterotrophic respiration to Rs was 72.8 % across Chinese grasslands, which was significantly larger than that of autotrophic respiration with a mean of 27.2 % (p<0.01, Fig. S2).
Table 1The annual soil respiration (Rs) and the proportions of growing-season and non-growing-season Rs to annual Rs in different grassland ecosystems across China. There was no sample for annual Rs in temperate desert steppe, so the data were not presented in this table. The different lowercase letters in each column indicate the significant difference at p=0.05, and different uppercase letters indicate the significant difference between the growing and non-growing season at p=0.001; n represents the number of samples.
3.1.2 Spatial control of abiotic and biotic factors over soil respiration
In the univariate linear regressions, annual Rs significantly increased with MAT, MAP, soil temperature, soil moisture, SOC, and AGB across all grasslands in China, but decreased with soil pH (p<0.05, Fig. 2). In contrast, annual Rs did not correlate well with STN and BGB (p>0.05). The single factor of MAT, MAP, soil temperature, soil moisture, SOC, soil pH, and AGB accounted for 22.4 %, 31.3 %, 20.9 %, 32.0 %, 29.6 %, 20.6 %, and 36.1 % of the spatial variation of annual Rs, respectively (Fig. 2).
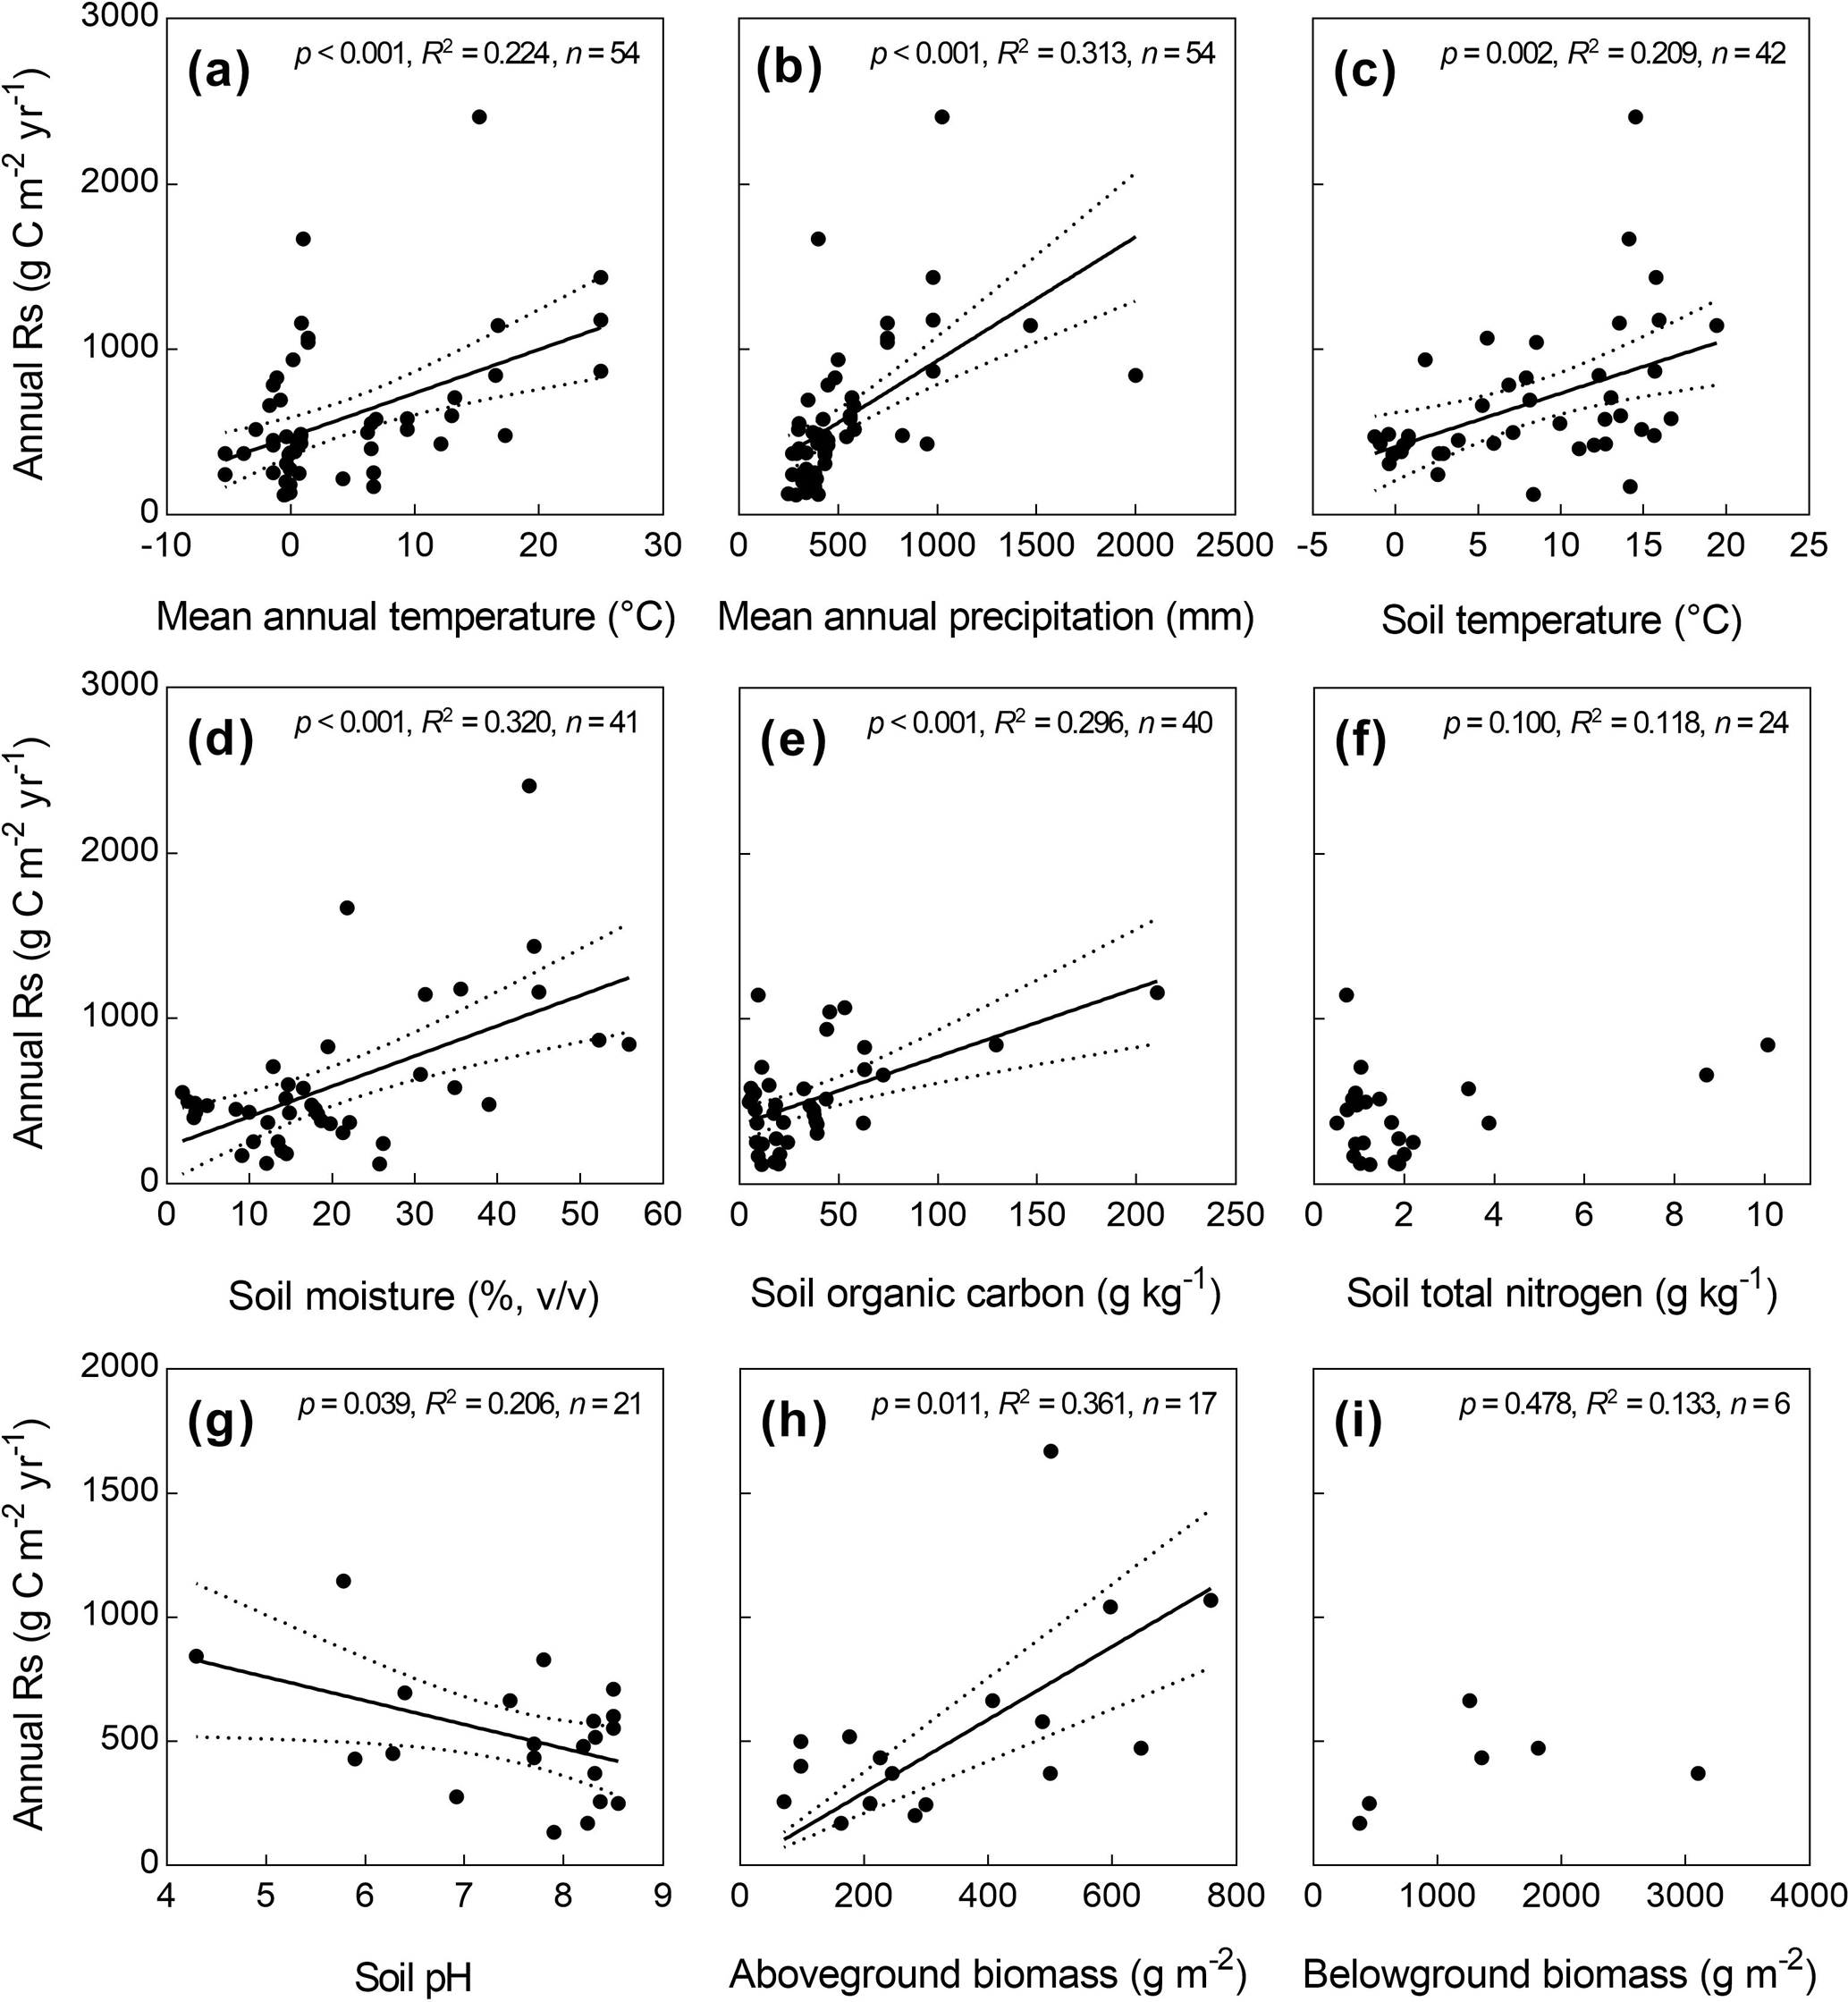
Figure 2Relationships of annual soil respiration (Rs) with abiotic and biotic factors. The dashed lines represent the 95 % confidence interval. When the p value was greater than 0.05, the regression lines were not drawn.
3.2 Temperature sensitivity of soil respiration and its controlling factors
3.2.1 Distributions of Q10 values and their coefficients of determination
Most of the Q10 values (83.0 %) were distributed between 1.5 and 3.8. However, the distributions of Q10 values derived by the five soil depths were different (Fig. 3a–e). The largest relative frequency for Q10−ST5 and Q10−ST10 values was within the range of 1.5 to 3.0 (68.5 %) and 1.5 to 3.5 (83.1 %), respectively, while that of Q10−ST0 was mainly within 1.0–2.0 (88.2 %, Fig. 3). In addition, the distributions of Q10−ST15 and Q10−ST20 were relatively uniform (Fig. 3d and e).
Similarly, the distributions of for Q10 derived by the five soil depths also differed from each other (Fig. 3f and g). The values for Q10−ST5 and Q10−ST10 were mainly distributed in 0.6–0.9 and 0.5–0.7, respectively, while those for Q10−ST15 and Q10−ST20 were mainly distributed in 0.3–0.6. The value for Q10−ST0 was distributed uniformly (Fig. 3f). Overall, only 35.6 % of values for Q10 were within the range of 0.7–1.0.
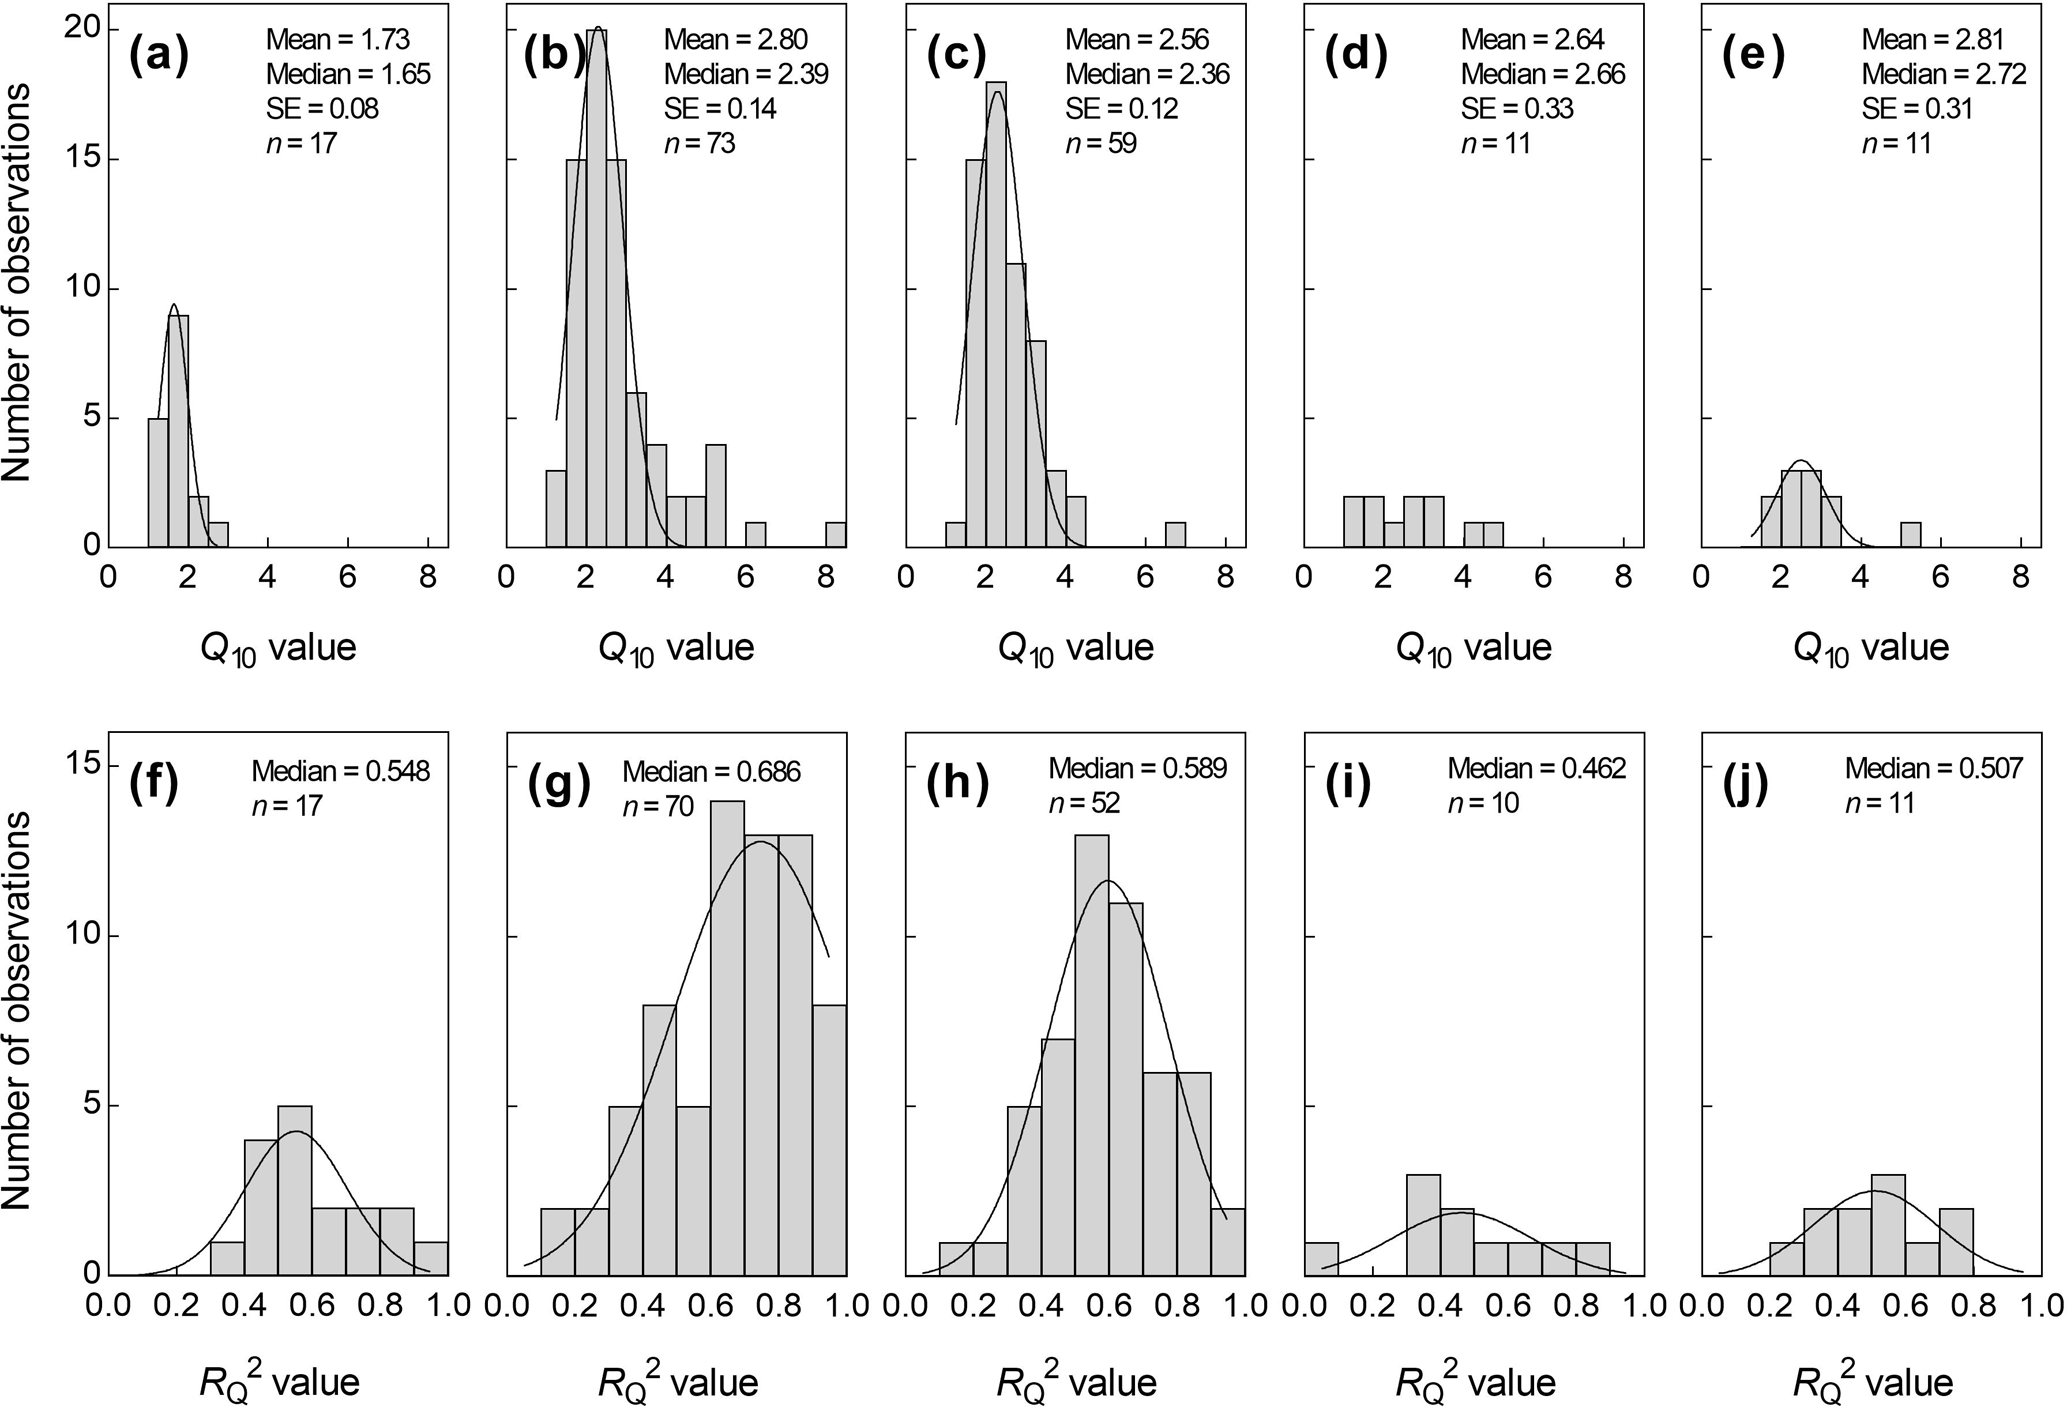
Figure 3Histogram plots for Q10 values (a–e) and the coefficient of determination for Q10 (, f–j) across Chinese grasslands. (a, f) soil surface temperature; (b, g) soil temperature at a depth of 5 cm; (c, h) soil temperature at a depth of 10 cm; (d, i) soil temperature at a depth of 15 cm; (e, j) soil temperature at a depth of 20 cm. n represents the number of samples.
3.2.2 Patterns of Q10 values across Chinese grasslands
Across all grasslands, the overall Q10 values ranged from 1.03 to 8.13, with a mean (±SE) of 2.60±0.08. Specifically, the mean (±SE) of Q10 values derived by ST0, ST5, ST10, ST15, and ST20 was 1.73±0.08, 2.80±0.14, 2.56±0.12, 2.64±0.33, and 2.81±0.31, respectively (Fig. 3a–e). The paired-samples t-test demonstrated that Q10 significantly differed between two adjacent depths in the top 15 cm soil (p<0.05), whereas no difference occurred below 15 cm depth (p>0.05; Fig. 4). Generally, the overall Q10 and paired Q10 increased with soil temperature measurement depth (Figs. 4 and S3). In terms of grassland types, there were significant differences for Q10 derived by ST5 and ST10 among grassland types, respectively (p<0.05, Fig. 4b and c). For Q10 derived by ST5, it was highest in alpine grassland, while for Q10 derived by ST10, the highest value was in warm, tropical grassland. In addition, there were not enough Q10 values derived by ST0, ST15, and ST20 to meet the demand of statistical analysis, so their differences among grassland types were not examined.

Figure 4Comparisons of Q10 values among soil temperature measurement depths (a) and among grassland types (b, c). (a) Q10 values derived by soil temperature at depths of 0, 5, 10, 15, and 20 cm, respectively. (b) Q10 values derived by soil temperature at a depth of 5 cm. (c) Q10 values derived by soil temperature at a depth of 10 cm. TTS, TMS, TDS, ALG, and WTG represent temperate typical steppe, temperate meadow steppe, temperate desert steppe, alpine grassland, and warm, tropical grassland, respectively. Error bars in (a) represent standard errors. In the box plot (b, c), the “+” symbols represent mean values, horizontal lines inside box represent medians, box ends represent the 25th and the 75th quartiles, vertical lines represent 2.5th and 97.5th percentiles, and n represents the number of samples. Different lowercase letters indicate significant differences among soil depths or grassland types at p=0.05.
3.2.3 Spatial control of environmental factors over Q10
The relationships of Q10−ST5 and Q10−ST10 with abiotic and biotic factors were presented in Fig. 5. Among these abiotic and biotic factors, Q10−ST5 significantly positively correlated with SOC, AGB, and BGB, whereas negatively correlated with soil temperature (p<0.05, Fig. 5). In contrast, Q10−ST10 significantly correlated with MAP, soil temperature and SOC (p<0.05, Fig. 5). In addition, combined MAP and MAT, and combined soil temperature and soil moisture affected Q10−ST5, and jointly accounted for 22.1 % and 13.9 % of the spatial variation of Q10−ST5 across Chinese grasslands (Table S4).
4.1 Spatial patterns and controlling factors of annual soil respiration
4.1.1 Annual soil respiration among grassland types
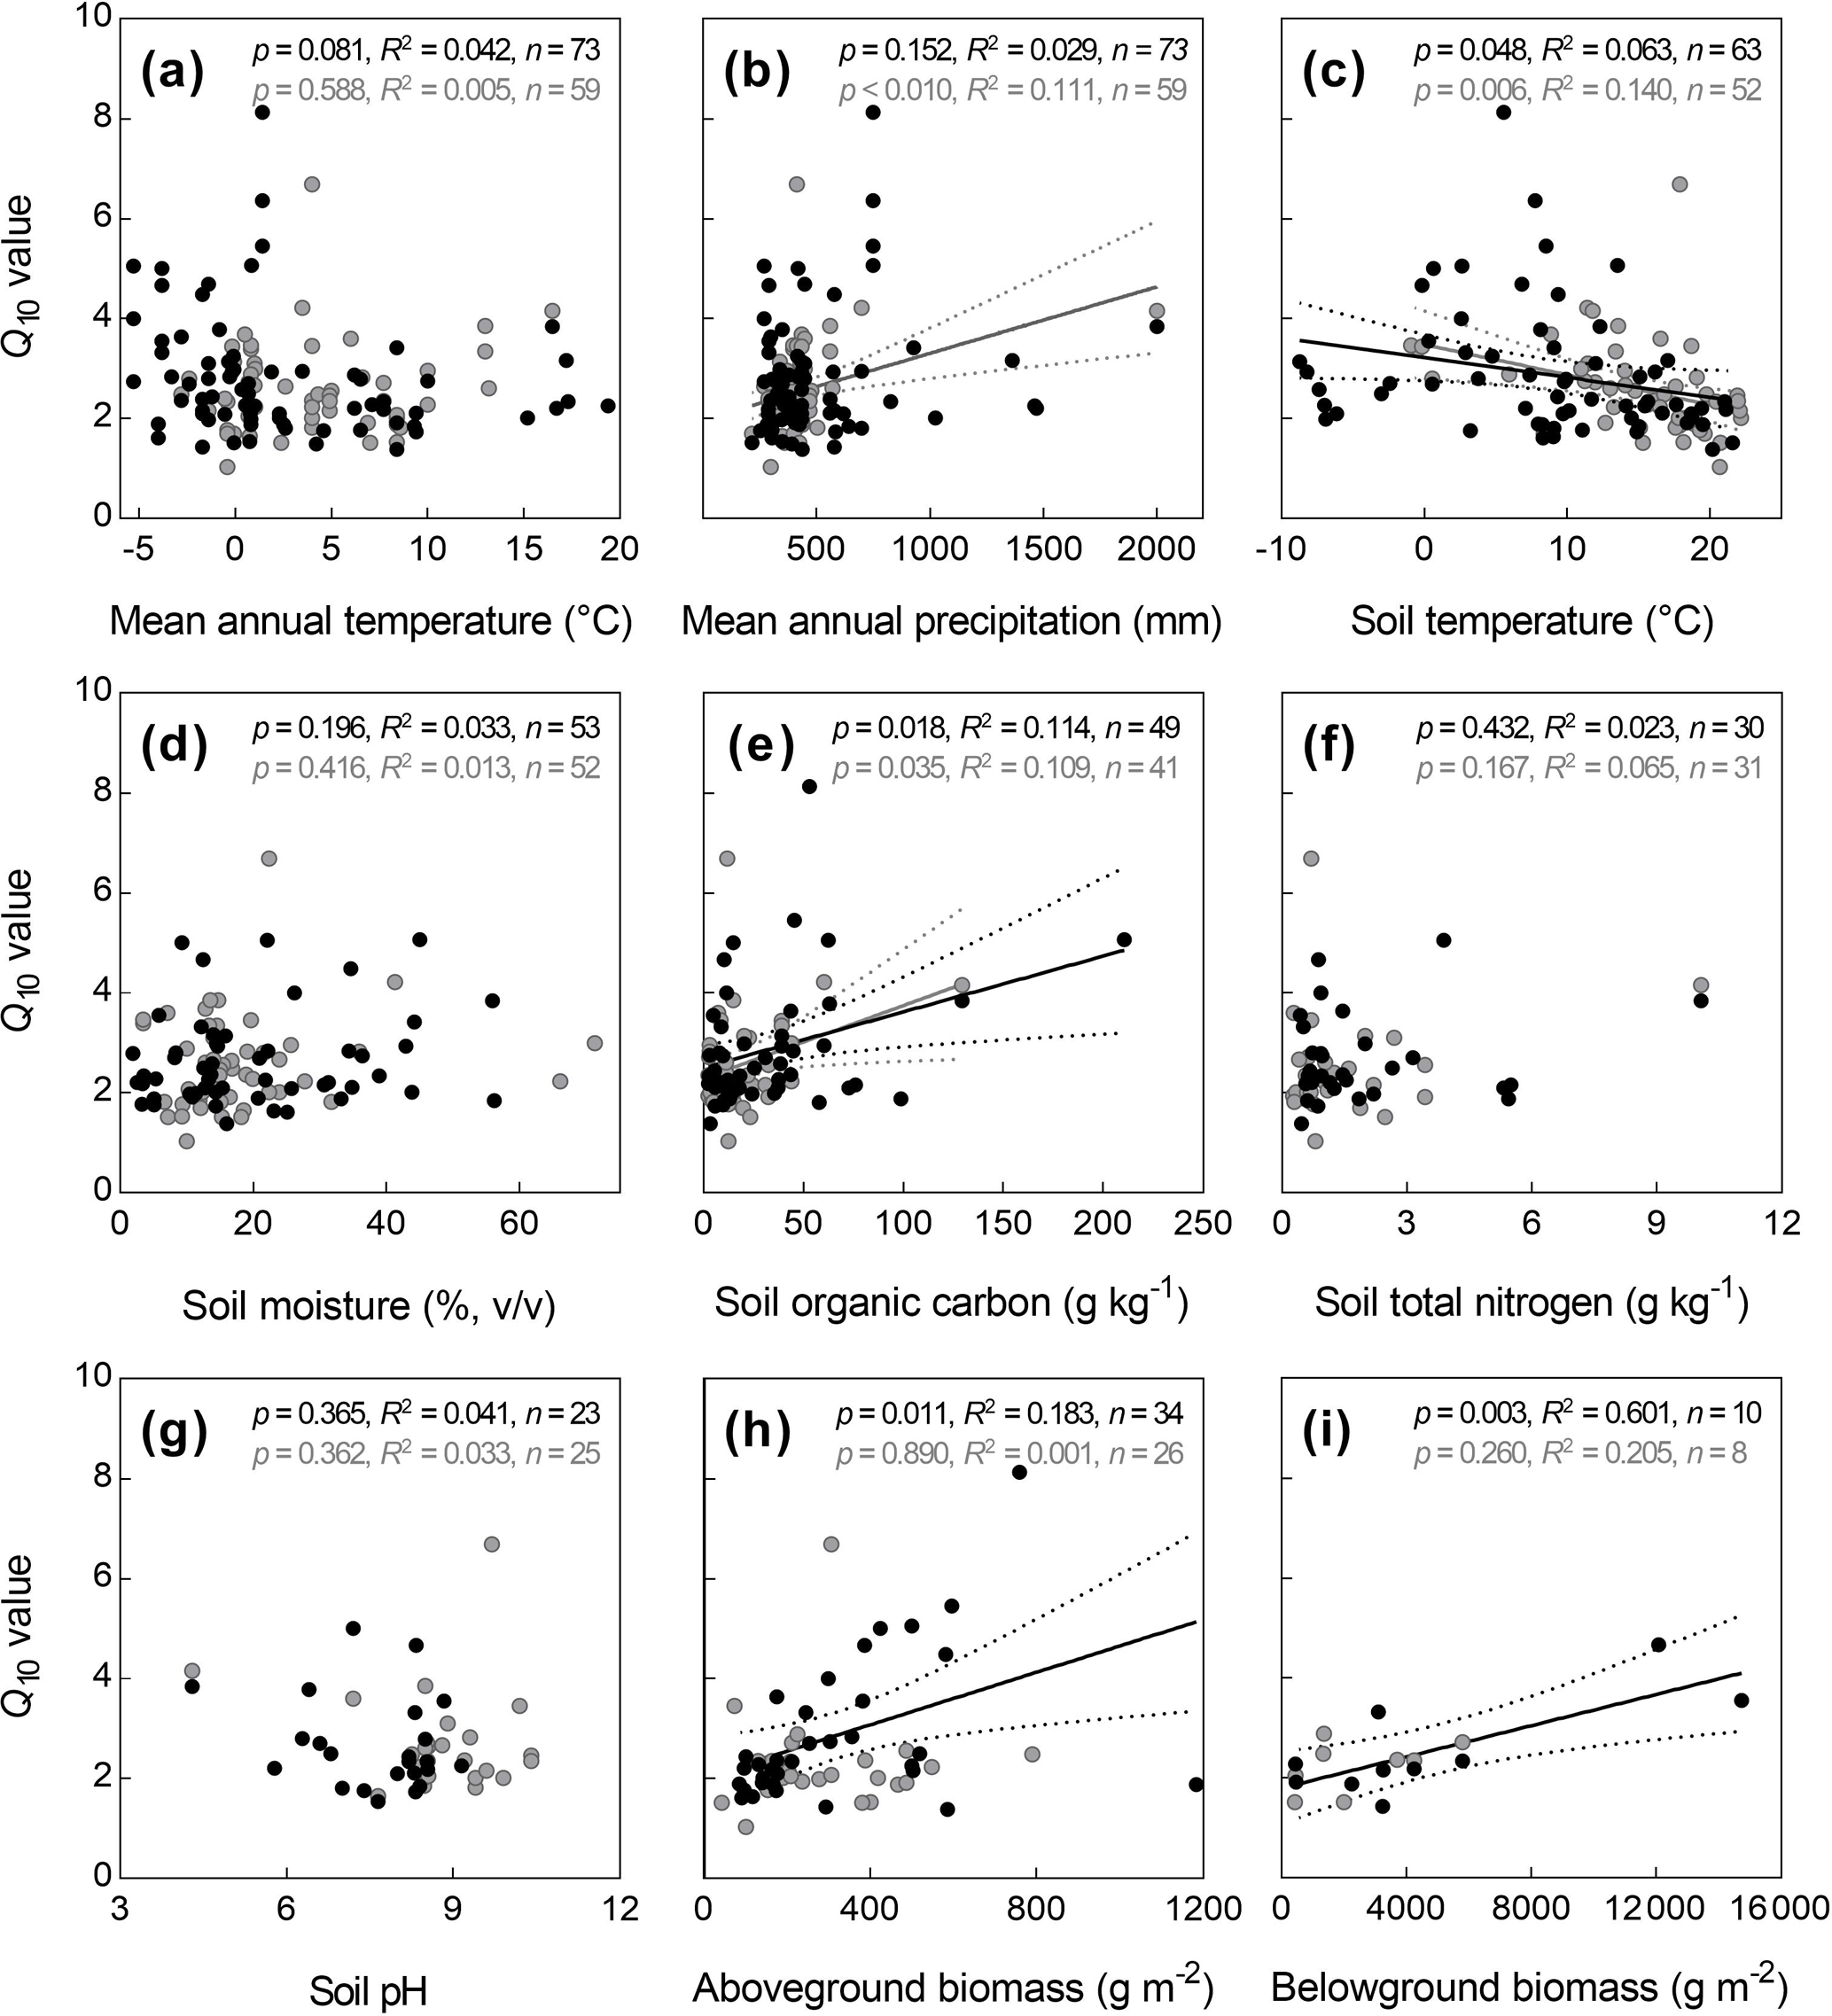
Figure 5Relationships of temperature sensitivity of soil respiration (Q10) with abiotic and biotic factors. The black and gray points represent Q10 derived by soil temperature at depths of 5 and 10 cm, respectively, and the black and gray lines represent their corresponding relationships with environmental factors. When the p value was greater than 0.05, the regression lines were not drawn.
In arid and semi-arid ecosystems, such as grassland and desert, MAP might play a key role in controlling carbon cycling. Our results also suggested that MAP significantly controls mean annual Rs among various grassland types in China (p<0.01, Fig. S4). The significant difference in mean annual Rs might be mainly attributed to the differences in AGB, BGB, and microbial activity induced by precipitation across various grassland types. Previous studies suggested that grasslands with higher MBC had larger heterotrophic respiration (Colman and Schimel, 2013; Ding et al., 2016). Meanwhile, a regional study demonstrated that microbial biomass increased with MAP in grasslands (Y. Chen et al., 2016), which was also found in this study (Table S3). Altogether, these suggested that the regions with high MAP would have larger heterotrophic respiration. Additionally, a previous study demonstrated that both AGB and BGB increased with MAP across Chinese grasslands (not including warm, tropical grasslands) (Ma et al., 2014). In this case, autotrophic respiration would be higher in the grasslands with high plant biomass. Collectively, the grasslands with high MAP would have a relatively higher Rs rate.
4.1.2 Control of environmental factors over annual Rs
Across Chinese grasslands, annual Rs was strongly related to MAT, MAP, soil temperature, and soil moisture, which was consistent with previous results obtained from global terrestrial ecosystems (Raich and Schlesinger, 1992; Raich and Potter, 1995; Chen et al., 2014; Hursh et al., 2017), global grasslands (Wang and Fang, 2009), and Chinese forests (Song et al., 2014; Xu et al., 2015). Compared with MAT and soil temperature, MAP and soil moisture explained more spatial variation of annual Rs, suggesting that these two factors are more important in predicting Rs in arid and semi-arid ecosystems under climate change.
In addition, spatial variation of annual Rs was also controlled by soil properties, such as SOC and soil pH. The relationships between annual Rs and SOC as well as pH were also observed in global, regional, and local terrestrial ecosystems (S. Chen et al., 2010; Chen et al., 2014; Song et al., 2014; Xu et al., 2016). Since Rs involves the process of converting organic carbon into inorganic carbon, the soil CO2 emission from microbial decomposition of soil organic carbon is ultimately determined by the supply of C substrate (Wan et al., 2007). Additionally, soil pH can directly regulate the activities of microbes and C-acquiring enzymes (Turner, 2010). In neutral and alkaline soils, microbial biomass tended to decrease with soil pH (Ding et al., 2016). Therefore, this led to a negative correlation between Rs and soil pH in Chinese grasslands because most of grasslands in China are distributed in neutral and alkaline soils. Further, S. Chen et al. (2010) demonstrated that annual Rs significantly increased with soil total nitrogen at a global scale. Meanwhile, some case studies revealed the similar relationship between growing-season Rs and soil total nitrogen among different grassland types and vegetation communities (Q. Chen et al., 2010; Wang et al., 2015; Xu et al., 2016) at local scales, while annual Rs did not correlate well with STN in this study. Given that SOC and STN are closely associated with one another (Table S3), the insignificant correlation of Rs with STN might be due to the fact that soil total nitrogen might not represent nitrogen availability for plants and microbes well. Therefore, how STN influences Rs across Chinese grasslands at a regional scale should be studied further.
Furthermore, as a source of autotrophic respiration, BGB can directly influence Rs, which has been observed in ecosystems at global and local scales (Q. Chen et al., 2010; Chen et al., 2014). However, no significant correlation between BGB and Rs was observed in the present study, which might be attributed to the limited sample size (n=6) and the uncertainty in measuring BGB (due to inconsistent or insufficient sampling depth). In grassland ecosystems, BGB generally increased with AGB (Ma et al., 2014), and this relationship was also observed in this study (p<0.10, Fig. S5). Therefore, given the significant correlation between AGB and Rs in Chinese grasslands (Fig. 2), BGB may also have the potential to control annual Rs across Chinese grasslands, although this should be investigated further based on accurate quantification of BGB and Rs across a large number of sites.
4.2 Spatial patterns and controlling factors of Q10 values
4.2.1 for Q10 in Chinese grasslands
In this study, only 37.3 % of for Q10 was larger than 0.7, indicating that most of the seasonal variation of the Rs rate cannot be well explained by soil temperature using the van't Hoff equation (Eq. 2). Compared with the results obtained from Chinese forests (Xu et al., 2015), the van't Hoff equation (Eq. 2) was not very suitable to describe the relationships between Rs rate and soil temperature in most Chinese grasslands. This might be associated with the difference in soil moisture between these two ecosystems because besides temperature, soil moisture may strongly influence the apparent Q10 (Subke and Bahn, 2010). Previous studies have suggested that in humid and semi-humid regions the effect of soil moisture on Rs is weak, whereas in arid and semi-arid regions, Rs is significantly influenced by soil moisture (Jia et al., 2006; Li et al., 2011; B. Wang et al., 2014; M. Wang et al., 2014). Moreover, some studies showed that soil moisture and temperature had an interactive effect on the seasonal variation of the Rs rate (Davidson et al., 1998; Jia et al., 2006; M. Wang et al., 2014; Liu et al., 2016), indicating that the two-variable equations could better explain the variation in Rs than the single variable of temperature. Our results also showed that, in general, for Q10 closely increased with MAP and soil moisture (p<0.05, Fig. S6), indicating that the for Q10 tended to be larger in the regions with abundant precipitation. Collectively, for ecosystems (e.g., grassland and desert) in arid and semi-arid regions, Rs could be better estimated by the combined factors of soil temperature and moisture. By comparison, 46.6 % of for Q10−ST5 was distributed in 0.7–1.0, which was higher than those values derived by soil temperature at other depths, suggesting that the seasonal variation of Rs can be better explained by soil temperature at a depth of 5 cm across Chinese grasslands.
4.2.2 Q10 among soil depths and grassland types
In Chinese grasslands, the estimated Q10 generally increased with soil temperature measurement depth, which was consistent with previous synthesis study about Chinese ecosystems (Peng et al., 2009). The differences for Q10 among measurement depths might be due to the seasonal amplitudes of temperature at different soil depths (Pavelka et al., 2007; Graf et al., 2008).
In terms of grassland types, the highest Q10−ST5 value was in the alpine grassland and the lowest in the temperate desert steppe and typical steppe (Fig. 4). This difference could be associated with soil properties and climatic conditions. For example, it is well known that the alpine grasslands are usually distributed in high-altitude regions (above 3000 m), where the climate is relatively colder and SOC is relatively higher than the other grassland types (Table S2). However, the temperate desert steppes and typical steppes are mainly distributed in north China, with relatively high MAT and low MAP that may lead to low Q10. Moreover, as shown in Fig. 4, the highest Q10−ST10 value occurred in warm, tropical grassland, which might be associated with the abundant substrate supply in this grassland type because high substrate availability can enhance apparent Q10 of soil respiration (Davidson et al., 2006; Zhu and Cheng, 2011).
4.2.3 Control of environmental factors over Q10
Generally, the Q10 derived by either ST5 or ST10 did not correlate well with climatic factors, which was inconsistent with previous results at global and regional scales (Chen and Tian, 2005; Peng et al., 2009; Wang et al., 2010; Song et al., 2014; Xu et al., 2015). However, we found that Q10 derived by soil temperature at depths of 5 and 10 cm decreased closely with increasing soil temperature, partly supporting the idea that Q10 tends to be higher in colder regions. Additionally, the positive relationships of Q10−ST5 with SOC, AGB, and BGB indicated that soil properties and plant biomass can also profoundly influence the spatial variation of Q10. Previous studies suggested that higher plant biomass and SOC can lead to more substrate supply for soil respiration and then result in higher Q10 values because apparent Q10 increased with increasing substrate availability (Gershenson et al., 2009; Zhao et al., 2017).
The extremely low R2 value for the relationship of Q10 with climatic variables suggested that the single factor of temperature, precipitation, or soil moisture poorly controls the spatial variation of Q10 in Chinese grasslands. Therefore, the variation of Q10 in Chinese grasslands should be controlled by multiple factors due to the complex and diverse environments among grasslands at a large scale. Multiple linear regression analyses also showed that combined MAT and MAP, and combined soil temperature and moisture could better explain the variation of Q10 derived by ST5 (Table S4), indicating their integrative effects on the spatial variation of Q10−ST5. Additionally, both univariate and multiple regression analyses demonstrated that there were no significant relationships between Q10−ST10 and abiotic and biotic factors (not shown), indicating that the Q10−ST10 might not have a clear spatial pattern or its variation might be controlled by other factors.
In addition to the environment variables discussed above, seasonality of plant activity could also affect the spatial variation of Q10 at a large scale. Plant activity can directly affect Rs via control of root respiration, and can indirectly affect SOC decomposition by microbes via regulation of the rhizosphere priming effect (see Wang et al., 2010). In this study, the dataset covered various climatic regions, and accordingly, seasonal amplitudes of plant activity among grassland types were also different. A previous global synthesis using NDVI (normalized difference vegetation index) as an indicator of plant activity demonstrated that seasonal amplitude of plant activity dominated the variation of seasonal Q10 among different sites (Wang et al., 2010). Therefore, the seasonal amplitude of plant activity might be an important factor explaining the spatial variation of Q10 across Chinese grasslands, and should be studied further.
4.3 Comparisons of Rs and Q10 between Chinese grasslands and the global ecosystems
4.3.1 Comparisons of annual Rs
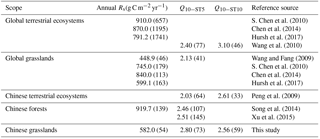
The annual Rs varied largely within and among the grassland types across China (Table 1), with a mean value of 582.0 g C m−2 yr−1, which was much lower than those in global terrestrial ecosystems and in Chinese forests (Table 2). For these results, the main biomes in their dataset were forests, which had relatively high precipitation and net primary productivity (Hursh et al., 2017), leading to relatively higher Rs than grasslands (Table S2). Compared with global grasslands, our result was much lower or higher than the results obtained from S. Chen et al. (2010), Chen et al. (2014) and Wang and Fang (2009), but approximately consistent with Hursh et al. (2017). These differences might be associated with data sources and distributions of case study sites. In general, the mean annual Rs rate across Chinese grasslands was within the lowest and highest Rs across global grasslands.
Across Chinese grasslands, the proportions of Rs during the growing season ranged from 76.2 % to 86.8 %, which were 2.2–5.6 times higher than those during the non-growing season. Microbial activity and plant growth is constrained by temperature and precipitation during the non-growing season, leading to lower decomposition of soil organic carbon and root respiration. In addition, as a whole, heterotrophic respiration contributed 72.8 % of the annual Rs, 2.7 times that of autotrophic respiration, which was close to that of global terrestrial ecosystems and grasslands (Wang and Fang, 2009; Chen et al., 2014) and Chinese forests (Song et al., 2014). Previous studies suggested that the proportions of heterotrophic respiration to total Rs varied with ecosystem type and depended on the magnitude of total Rs (Subke et al., 2006). However, the limited samples (n=7) limited our comparisons among these grassland types. Generally, our findings and previous studies suggested that both Rs during the growing season and heterotrophic respiration were an important part of the annual Rs in Chinese grasslands, respectively, and should be given enough attention.
Table 2Comparisons of annual soil respiration and Q10 between Chinese grasslands and other syntheses. The numbers in parentheses represent the number of samples.
4.3.2 Comparisons of Q10
The overall mean Q10 of 2.60 derived by soil temperature at all measurement depths was similar to 2.40 and 2.54 in global terrestrial ecosystems (Raich and Schlesinger, 1992; Lenton and Huntingford, 2003). The Q10 derived by ST5 varied from 1.39 to 8.13, with a mean of 2.80, which was higher than that of global and Chinese terrestrial ecosystems, Chinese forests, and particularly global grasslands (Table 2). The difference may be partly due to the distribution of grasslands in China and the grassland types. Chinese grasslands are mainly distributed in the high-latitude (temperate grassland) and high-altitude (Qinghai–Tibet Plateau alpine grassland) regions, and Q10 takes relatively higher values in cold regions than in warm regions (Chen and Tian, 2005; Wang et al., 2010). In addition, in this study, averaged Q10−ST5 was highest in alpine grassland with a mean of 3.30, implying that grasslands in alpine regions may release more carbon dioxide under climate warming. However, there were no alpine grasslands in the global database. Collectively, this may lead to higher Q10 values in Chinese grasslands. In terms of Q10 derived by ST10, the mean value for Chinese grasslands was close to Chinese terrestrial ecosystems, but much lower than the global ecosystems (Table 2).
4.4 Uncertainties
In order to ensure data consistency and minimize error, only field experiments in accordance with the six aforementioned criteria were selected. However, the interannual variation in Rs and Q10 might be very large for grassland at one site, which was associated with the interannual variation in annual precipitation and mean temperature (Peng et al., 2014; Wang et al., 2016). Therefore, the interannual variation of Rs would impact the accuracy of the results. Additionally, three methods, including a static closed chamber, a dynamic closed chamber, and alkali absorption, were widely applied to measure Rs in the selected experiments, and previous studies have suggested that measurement methods affected the results of Rs rate and Q10 value (Bekku et al., 1997; Yim et al., 2002; Peng et al., 2009). However, in this study, there were generally no significant differences for Rs, Q10−ST5, and Q10−ST10 among the three measurement methods (Fig. S7). Given that only one sample of annual Rs was measured by alkali absorption, the effects of measurement methods on Rs could be neglected. Therefore, including data measured by the alkali absorption method in our synthesis does not meaningfully change the results of Rs and Q10.
Furthermore, Q10 values measured during three periods, including the growing season, the non-growing season, and the whole year, were selected as long as the investigation time was longer than 4 months. The seasonal dynamics of plant growth and microbial activity may influence autotrophic and heterotrophic respiration, and thus the Q10 of Rs. Our results showed that the measurement period did not significantly affect Q10−ST10, but significantly affected Q10−ST5 (Fig. S7). In terms of Q10−ST5, the significant difference between annual Q10 and non-growing-season Q10 across all sites was mainly caused by alpine grasslands, in which annual Q10 was much higher than non-growing-season Q10 (Fig. S7). The seasonal amplitude of plant activity at an annual scale is likely much greater than that at a non-growing-season scale in alpine regions. Therefore, the different investigation time and measurement period for estimating Q10 would inevitably affect the accuracy of results.
In this study, the selected experiments were mainly conducted in temperate and alpine grasslands, so the limited data obtained from desert and tropical and subtropical grasslands might lead to some uncertainties in these ecosystems. Moreover, grassland management practices, such as land use/cover change, intensity and pattern of livestock grazing, and fencing, can have a significant effect on soil carbon emission (Chen et al., 2013; Y. Zhang et al., 2015; J. Chen et al., 2015, 2016). In the past three decades, several ecological projects relating to grassland have been implemented in China, and have observably increased the grassland area and altered the land cover (H. Zhang et al., 2015). To some extent, these changes can also impact our findings.
Chinese grasslands cover a vast area, have high spatial heterogeneity, and include various grassland types. By synthesizing all the available data relating to Rs and Q10, we analyzed their spatial patterns and driving factors in grasslands across China. Our results showed that annual Rs and Q10 varied greatly within and among grassland types. Across Chinese grasslands, the mean annual Rs and Q10 were 582.0 g C m−2 yr−1 and 2.60, respectively. MAT, MAP, soil temperature, soil moisture, SOC, and AGB all significantly positively affected annual Rs, whereas soil pH negatively affected annual Rs. Among these environmental factors, MAP played an important role in controlling Rs variation across Chinese grasslands. Moreover, the combined factors of MAP and MAT accounted for 22.1 % of the variation of Q10−ST5 across Chinese grasslands. The Q10−ST5 in Chinese grasslands was much higher than that in global ecosystems, mainly attributed to the higher Q10 value in alpine grasslands. These findings together advance our understanding of the spatial variation and environmental control of Rs and Q10 across Chinese grasslands, and also improve our ability to predict soil carbon efflux under climate change at a regional scale. However, the few experiments measuring soil and microbial variables, Rs and Q10, at an annual scale, especially measuring autotrophic and heterotrophic respiration separately, limit our in-depth knowledge on the key drivers of Rs and Q10 in grasslands across China. Therefore, more field measurements are needed to verify the relationships found here and to reveal how environmental variables control Rs and its temperature sensitivity in relatively arid grassland ecosystems.
Data used in this study can be found in the Supplement.
The supplement related to this article is available online at: https://doi.org/10.5194/bg-15-5329-2018-supplement.
BZ and JF conceived and designed the study. JF and YS extracted the data from the literature. JF, JW, and BZ conducted the data analysis, and JF and BZ wrote the first draft of the paper. All authors critically commented on the draft and provided interpretation.
The authors declare that they have no conflict of interest.
This research was financially supported by the National Key Research and
Development Program of China (2017YFC0503903 and 2016YFC0502006), the
National Natural Science Foundation of China (31621091 and 31622013), and the
Key Science and Technology Plan Projects of the Tibet Autonomous Region
(Z2016C01G01/08-004 and Z2016C01G01/03). We thank all the scientists whose
data and work were included in this synthesis. We are also grateful to the
editor (Zhongjun Jia) and two anonymous reviewers for their insightful
comments which improved the manuscript.
Edited
by: Zhongjun Jia
Reviewed by: two anonymous referees
Bahn, M., Janssens, I. A., Reichstein, M., Smith, P., and Trumbore, S. E.: Soil respiration across scales: towards an integration of patterns and processes, New Phytol., 186, 292–296, https://doi.org/10.1111/j.1469-8137.2010.03237.x, 2010.
Bahn, M., Rodeghiero, M., Andersondunn, M., Dore, S., Gimeno, C., Drösler, M., Williams, M., Ammann, C., Berninger, F., and Flechard, C.: Soil respiration in european grasslands in relation to climate and assimilate supply, Ecosystems, 11, 1352–1367, https://doi.org/10.1007/s10021-008-9198-0, 2008.
Bekku, Y., Koizumi, H., Oikawa, T., and Iwaki, H.: Examination of four methods for measuring soil respiration, Appl. Soil Ecol., 5, 247–254, https://doi.org/10.1016/S0929-1393(96)00131-X, 1997.
Bond-Lamberty, B. and Thomson, A.: A global database of soil respiration data, Biogeosciences, 7, 1915–1926, https://doi.org/10.5194/bg-7-1915-2010, 2010.
Boone, R. D., Nadelhoffer, K. J., Canary, J. D., and Kaye, J. P.: Roots exert a strong influence on the temperature sensitivity of soil respiration, Nature, 396, 570–572, https://doi.org/10.1038/25119, 1998.
Chen, H. and Tian, H. Q.: Does a general temperature-dependent Q10 model of soil respiration exist at biome and global scale?, J. Integr. Plant Biol., 47, 1288–1302, https://doi.org/10.1111/j.1744-7909.2005.00211.x, 2005.
Chen, J., Hou, F., Chen, X., Wan, X., and Millner, J.: Stocking rate and grazing season modify soil respiration on the Loess Plateau, China, Rangel. Ecol. Manag., 68, 48–53, https://doi.org/10.1016/j.rama.2014.12.002, 2015.
Chen, J., Zhou, X., Wang, J., Hruska, T., Shi, W., Cao, J., Zhang, B., Xu, G., Chen, Y., and Luo, Y.: Grazing exclusion reduced soil respiration but increased its temperature sensitivity in a meadow grassland on the Tibetan Plateau, Ecol. Evol., 6, 675–687, https://doi.org/10.1002/ece3.1867, 2016.
Chen, Q., Wang, Q., Han, X., Wan, S., and Li, L.: Temporal and spatial variability and controls of soil respiration in a temperate steppe in northern China, Global Biogeochem. Cy., 24, GB2010, https://doi.org/10.1029/2009GB003538, 2010.
Chen, S., Huang, Y., Zou, J., Shen, Q., Hu, Z., Qin, Y., Chen, H., and Pan, G.: Modeling interannual variability of global soil respiration from climate and soil properties, Agr. Forest Meteorol., 150, 590–605, https://doi.org/10.1016/j.agrformet.2010.02.004, 2010.
Chen, S., Zou, J., Hu, Z., Chen, H., and Lu, Y.: Global annual soil respiration in relation to climate, soil properties and vegetation characteristics: Summary of available data, Agri. Forest Meteorol., 198–199, 335–346, https://doi.org/10.1016/j.agrformet.2014.08.020, 2014.
Chen, W., Wolf, B., Zheng, X., Yao, Z., Butterbach-Bahl, K., Brueggemann, N., Han, S., Liu, C., and Han, X.: Carbon dioxide emission from temperate semiarid steppe during the non-growing season, Atmos. Environ., 64, 141–149, https://doi.org/10.1016/j.atmosenv.2012.10.004, 2013.
Chen, Y., Ding, J., Peng, Y., Li, F., Yang, G., Liu, L., Qin, S., Fang, K., and Yang, Y.: Patterns and drivers of soil microbial communities in Tibetan alpine and global terrestrial ecosystems, J. Biogeogr., 43, 2027–2039, https://doi.org/10.1111/jbi.12806, 2016.
Chen, Z., Wang, Y., Wang, S., and Zhou, X.: Preliminary studies on the classification of grassland ecosystem in China, Acta Agrestia Sinica, 10, 81–86, 2002. (in Chinese with English abstract)
Colman, B. P. and Schimel, J. P.: Drivers of microbial respiration and net N mineralization at the continental scale, Soil Biol. Biochem., 60, 65–76, https://doi.org/10.1016/j.soilbio.2013.01.003, 2013.
Davidson, E. A., Belk, E., and Boone, R. D.: Soil water content and temperature as independent or confounded factors controlling soil respiration in a temperate mixed hardwood forest, Glob. Change Biol., 4, 217–227, https://doi.org/10.1046/j.1365-2486.1998.00128.x, 1998.
Davidson, E. A. and Janssens, I. A.: Temperature sensitivity of soil carbon decomposition and feedbacks to climate change, Nature, 440, 165–173, https://doi.org/10.1038/nature04514, 2006.
Davidson, E. A., Janssens, I. A., and Luo, Y. Q.: On the variability of respiration in terrestrial ecosystems: moving beyond Q10, Glob. Change Biol., 12, 154–164, https://doi.org/10.1111/j.1365-2486.2005.01065.x , 2006.
Davidson, E. A., Savage, K., Verchot, L. V., and Navarro, R.: Minimizing artifacts and biases in chamber-based measurements of soil respiration, Agr. Forest Meteorol., 113, 21–37, https://doi.org/10.1016/S0168-1923(02)00100-4, 2002.
Ding, J., Chen, L., Zhang, B., Liu, L., Yang, G., Fang, K., Chen, Y., Li, F., Kou, D., Ji, C., Luo, Y., and Yang, Y.: Linking temperature sensitivity of soil CO2 release to substrate, environmental, and microbial properties across alpine ecosystems, Global Biogeochem. Cy., 30, 1310–1323, https://doi.org/10.1002/2015GB005333, 2016.
Frank, A. B. and Dugas, W. A.: Carbon dioxide fluxes over a northern, semiarid, mixed-grass prairie, Agr. Forest Meteorol., 108, 317–326, https://doi.org/10.1016/S0168-1923(01)00238-6, 2001.
Gershenson, A., Bader, N. E., and Cheng, W.: Effects of substrate availability on the temperature sensitivity of soil organic matter decomposition, Glob. Change Biol., 15, 176–183, https://doi.org/10.1111/j.1365-2486.2008.01827.x, 2009.
Graf, A., Weihermüller, L., Huisman, J. A., Herbst, M., Bauer, J., and Vereecken, H.: Measurement depth effects on the apparent temperature sensitivity of soil respiration in field studies, Biogeosciences, 5, 1175–1188, https://doi.org/10.5194/bg-5-1175-2008, 2008.
Hibbard, K. A., Law, B. E., Reichstein, M., and Sulzman, J.: An analysis of soil respiration across northern hemisphere temperate ecosystems, Biogeochemistry, 73, 29–70, https://doi.org/10.1007/s10533-004-2946-0, 2005.
Hursh, A., Ballantyne, A., Cooper, L., Maneta, M., Kimball, J., and Watts, J.: The sensitivity of soil respiration to soil temperature, moisture, and carbon supply at the global scale, Glob. Change Biol., 23, 2090–2103, https://doi.org/10.1111/gcb.13489, 2017.
Jia, B., Zhou, G., Wang, Y., Wang, F., and Wang, X.: Effects of temperature and soil water-content on soil respiration of grazed and ungrazed Leymus chinensis steppes, Inner Mongolia. J. Arid Environ., 67, 60–76, https://doi.org/10.1016/j.jaridenv.2006.02.002, 2006.
Kirschbaum, M. U. F.: Will changes in soil organic carbon act as a positive or negative feedback on global warming? Biogeochemistry, 48, 21–51, https://doi.org/10.1023/A:1006238902976, 2000.
Kuzyakov, Y.: Sources of CO2 efflux from soil and review of partitioning methods, Soil Biol. Biochem., 38, 425–448, https://doi.org/10.1016/j.soilbio.2005.08.020, 2006.
Lenton, T. M. and Huntingford, C.: Global terrestrial carbon storage and uncertainties in its temperature sensitivity examined with a simple model, Glob. Change Biol., 9, 1333–1352, https://doi.org/10.1046/j.1365-2486.2003.00674.x, 2003.
Li, Z., Wang, X., Zhang, R., Zhang, J., and Tian, C.: Contrasting diurnal variations in soil organic carbon decomposition and root respiration due to a hysteresis effect with soil temperature in a Gossypium s. (cotton) plantation, Plant Soil, 343, 347–355, https://doi.org/10.1007/s11104-011-0722-1, 2011.
Liu, X., Zhang, W., Zhang, B., Yang, Q., Chang, J., and Hou, K.: Diurnal variation in soil respiration under different land uses on Taihang Mountain, North China, Atmos. Environ., 125, 283–292, https://doi.org/10.1016/j.atmosenv.2015.11.034, 2016.
Luo, Y. and Zhou, X.: Soil respiration and the environment, Academic Press/Elsevier, San Diego, USA, 257–305, 2006.
Ma, A., Yu, G., He, N., Wang, Q., and Peng, S.: Above- and below-ground biomass relationships in China's grassland vegetation, Quaternary Sci., 34, 769–776, https://doi.org/10.3969/j.issn.1001-7410.2014.04.09, 2014. (in Chinese with English abstract)
Ni, J.: Carbon storage in grasslands of China, J. Arid Environ., 50, 205–218, https://doi.org/10.1006/jare.2001.0902, 2002.
Pavelka, M., Acosta, M., Marek, M. V., Kutsch, W., and Janous, D.: Dependence of the Q10 values on the depth of the soil temperature measuring point, Plant Soil, 292, 171–179, https://doi.org/10.1007/s11104-007-9213-9, 2007.
Peng, F., You, Q., Xu, M., Guo, J., Wang, T., and Xue, X.: Effects of warming and clipping on ecosystem carbon fluxes across two hydrologically contrasting years in an alpine meadow of the Qinghai-Tibet Plateau, Plos One, 9, e109319, https://doi.org/10.1371/journal.pone.0109319, 2014.
Peng, S., Piao, S., Wang, T., Sun, J., and Shen, Z.: Temperature sensitivity of soil respiration in different ecosystems in China, Soil Biol. Biochem., 41, 1008–1014, https://doi.org/10.1016/j.soilbio.2008.10.023, 2009.
Pribyl, D. W.: A critical review of the conventional SOC to SOM conversion factor, Geoderma, 156, 75–83, https://doi.org/10.1016/j.geoderma.2010.02.003, 2010.
Raich, J. W. and Potter, C. S.: Global patterns of carbon dioxide emissions from soils, Global Biogeochem. Cy., 9, 23–36, https://doi.org/10.1029/94GB02723, 1995.
Raich, J. W. and Schlesinger, W. H.: The global carbon dioxide flux in soil respiration and its relationship to vegetation and climate, Tellus, 44, 81–99, https://doi.org/10.1034/j.1600-0889.1992.t01-1-00001.x, 1992.
Reichstein, M., Subke, J. A., Angeli, A. C., and Tenhunen, J. D.: Does the temperature sensitivity of decomposition of soil organic matter depend upon water content, soil horizon, or incubation time?, Glob. Change Biol., 11, 1754–1767, https://doi.org/10.1111/j.1365-2486.2005.001010.x, 2005.
Ryan, M. G. and Law, B. E.: Interpreting, measuring, and modeling soil respiration, Biogeochemistry, 73, 3–27, https://doi.org/10.1007/s10533-004-5167-7, 2005.
Schindlbacher, A., Zechmeister-Boltenstern, S., and Jandl, R.: Carbon losses due to soil warming: Do autotrophic and heterotrophic soil respiration respond equally?, Glob. Change Biol., 15, 901–913, https://doi.org/10.1111/j.1365-2486.2008.01757.x, 2009.
Shen, H., Zhu, Y., Zhao, X., Geng, X., Gao, S., and Fang, J.: Analysis of current grassland resources in China, Chin. Sci. Bull., 61, 139–154, https://doi.org/10.1360/N972015-00732, 2016. (in Chinese with English abstract)
Sims, P. L. and Bradford, J. A.: Carbon dioxide fluxes in a southern plains prairie, Agr. Forest Meteorol., 109, 117–134, https://doi.org/10.1016/S0168-1923(01)00264-7, 2001.
Song, X., Peng, C., Zhao, Z., Zhang, Z., Guo, B., Wang, W., Jiang, H., and Zhu Q.: Quantification of soil respiration in forest ecosystems across china, Atmos. Environ., 94, 546–551, https://doi.org/10.1016/j.atmosenv.2014.05.071, 2014.
Subke, J. A. and Bahn, M.: On the “temperature sensitivity” of soil respiration: Can we use the immeasurable to predict the unknown? Soil Biol. Biochem., 42, 1653–1656, https://doi.org/10.1016/j.soilbio.2010.05.026, 2010.
Subke, J. A., Inglima, I., and Cotrufo, M. F.: Trends and methodological impacts in soil CO2 efflux partitioning: A metaanalytical review, Glob. Change Biol., 12, 921–943, https://doi.org/10.1111/j.1365-2486.2006.01117.x , 2006.
Turner, B. L.: Variation in pH optima of hydrolytic enzyme activities in tropical rain forest soils, Appl. Environ. Microb., 76, 6485–6493, https://doi.org/10.1128/AEM.00560-10, 2010.
Van's Hoff, J. H.: Lectures on Theoretical and Physical Chemistry, Part 1: Chemical Dynamics, Edward Arnold, London, UK, 224–229, 1898.
Wan, S., Norby, R. J., Ledford, J., and Weltzin, J. F.: Responses of soil respiration to elevated CO2, air warming, and changing soil water availability in a model old-field grassland, Glob. Change Biol., 13, 2411–2424, https://doi.org/10.1111/j.1365-2486.2007.01433.x, 2007.
Wang, B., Zha, T. S., Jia, X., Wu, B., Zhang, Y. Q., and Qin, S. G.: Soil moisture modifies the response of soil respiration to temperature in a desert shrub ecosystem, Biogeosciences, 11, 259–268, https://doi.org/10.5194/bg-11-259-2014, 2014.
Wang, M., Liu, X., Zhang, J., Li, X., Wang, G., Li, X., and Lu, X.: Diurnal and seasonal dynamics of soil respiration at temperate Leymus chinensis meadow steppes in western Songnen Plain, China, Chin. Geogr. Sci., 24, 287–296, https://doi.org/10.1007/s11769-014-0682-5, 2014.
Wang, M., Liu, X., Zhang, J., Li, X., Wang, G., Li, X., and Chen, W.: Soil respiration associated with plant succession at the meadow steppes in Songnen Plain, Northeast China, J. Plant Ecol., 8, 51–60, https://doi.org/10.1093/jpe/rtu006, 2015.
Wang, W. and Fang, J.: Soil respiration and human effects on global grasslands, Global Planet. Change, 67, 20–28, https://doi.org/10.1016/j.gloplacha.2008.12.011, 2009.
Wang, X., Piao, S., Ciais, P., Janssens, I. A., Reichstein, M., Peng, S., and Wang, T.: Are ecological gradients in seasonal Q10 of soil respiration explained by climate or by vegetation seasonality?, Soil Biol. Biochem., 42, 1728–1734, https://doi.org/10.1016/j.soilbio.2010.06.008, 2010.
Wang, Z., Ji, L., Hou, X., and Schellenberg, M. P.: Soil respiration in semiarid temperate grasslands under various land management, Plos One, 11, e0147987, https://doi.org/10.1371/journal.pone.0147987, 2016.
Xu, W., Li, X., Liu, W., Li, L., Hou, L., Shi, H., Xia, J., Liu, D., Zhang, H., Chen, Y., Cai, W., Fu, Y., and Yuan, W.: Spatial patterns of soil and ecosystem respiration regulated by biological and environmental variables along a precipitation gradient in semi-arid grasslands in China, Ecol. Res., 31, 505–513, https://doi.org/10.1007/s11284-016-1355-x, 2016.
Xu, Z., Tang, S., Xiong, L., Yang, W., Yin, H., Tu, L., Wu, F., Chen, L., and Tan, B.: Temperature sensitivity of soil respiration in china's forest ecosystems: patterns and controls, Appl. Soil Ecol., 93, 105–110, https://doi.org/10.1016/j.apsoil.2015.04.008, 2015.
Yim, M. H., Joo, S. J., and Nakane, K.: Comparison of field methods for measuring soil respiration: a static alkali absorption method and two dynamic closed chamber methods, Forest Ecol. Manage., 170, 189–197, https://doi.org/10.1016/S0378-1127(01)00773-3, 2002.
Yuste, J. C., Janssens, I. A., Carrara, A., and Ceulemans, R.: Annual Q10 of soil respiration reflects plant phenological patterns as well as temperature sensitivity, Glob. Change Biol., 10, 161–169, https://doi.org/10.1111/j.1529-8817.2003.00727.x, 2004.
Zhang, H., Fan, J., and Shao, Q.: Land use/land cover change in the grassland restoration program areas in China, 2000–2010, Prog. Geogr. 34, 840–853, https://doi.org/10.18306/dlkxjz.2015.07.006, 2015. (in Chinese with English abstract)
Zhang, Y., Guo, S., Liu, Q., Jiang, J., Wang, R., and Li, N.: Responses of soil respiration to land use conversions in degraded ecosystem of the semi-arid Loess Plateau, Ecol. Eng., 74, 196–205, https://doi.org/10.1016/j.ecoleng.2014.10.003, 2015.
Zhao, J., Li, R., Li, X., and Tian, L.: Environmental controls on soil respiration in alpine meadow along a large altitudinal gradient on the central Tibetan Plateau, Catena, 159, 84–92, https://doi.org/10.1016/j.catena.2017.08.007, 2017.
Zhou, T., Shi, P., Hui, D., and Luo, Y.: Global pattern of temperature sensitivity of soil heterotrophic respiration (Q10) and its implications for carbon-climate feedback, J. Geophys. Res-Biogeo., 114, 271–274, https://doi.org/10.1029/2008JG000850, 2009.
Zhu, B. and Cheng, W. X.: Rhizosphere priming effect increases the temperature sensitivity of soil organic matter decomposition, Glob. Change Biol., 17, 2172–2183, https://doi.org/10.1111/j.1365-2486.2010.02354.x, 2011.