the Creative Commons Attribution 4.0 License.
the Creative Commons Attribution 4.0 License.
 | 06 Nov 2018
Biogenic silica production and diatom dynamics in the Svalbard region during spring
Jeffrey W. Krause
Carlos M. Duarte
Israel A. Marquez
Philipp Assmy
Mar Fernández-Méndez
Ingrid Wiedmann
Paul Wassmann
Svein Kristiansen
Susana Agustí
Diatoms are generally the dominant contributors to the Arctic Ocean spring bloom, which is a key event in regional food webs in terms of capacity for secondary production and organic matter export. Dissolved silicic acid is an obligate nutrient for diatoms and has been declining in the European Arctic since the early 1990s. The lack of regional silicon cycling information precludes understanding the consequences of such changes for diatom productivity during the Arctic spring bloom. This study communicates the results from a cruise in the European Arctic around Svalbard, which reports the first concurrent data on biogenic silica production and export, export of diatom cells, the degree of kinetic limitation by ambient silicic acid, and diatom contribution to primary production. Regional biogenic silica production rates were significantly lower than those achievable in the Southern Ocean and silicic acid concentration limited the biogenic silica production rate in 95 % of samples. Compared to diatoms in the Atlantic subtropical gyre, regional diatoms are less adapted for silicic acid uptake at low concentration, and at some stations during the present study, silicon kinetic limitation may have been intense enough to limit diatom growth. Thus, silicic acid can play a critical role in diatom spring bloom dynamics. The diatom contribution to primary production was variable, ranging from <10 % to ∼100 % depending on the bloom stage and phytoplankton composition. While there was agreement with previous studies regarding the export rate of diatom cells, we observed significantly elevated biogenic silica export. Such a discrepancy can be resolved if a higher fraction of the diatom material exported during our study was modified by zooplankton grazers. This study provides the most direct evidence to date suggesting the important coupling of the silicon and carbon cycles during the spring bloom in the European Arctic.
- Article
(1641 KB) - Full-text XML
- BibTeX
- EndNote


Diatoms and the haptophyte Phaeocystis are the dominant contributors to the Arctic Ocean spring bloom, a cornerstone event supplying much of the annual net community production (Rat'kova and Wassmann, 2002; Vaquer-Sunyer et al., 2013; Wassmann et al., 1999) that fuels Arctic food webs (Degerlund and Eilertsen, 2010, and references therein). Hydrographic and chemical changes in the Arctic water column are expected in the future, but whether these will alter diatoms' contribution to spring primary production and organic matter export remains uncertain. Some studies predict reduction in ice cover will enhance the spring bloom due to increased light availability (Arrigo et al., 2008), while others predict lower productivity driven by increased stratification and reduced nutrient supply (Schourup-Kristensen et al., 2018; Tremblay and Gagnon, 2009). Additionally, models predict that warming will lead to a shift from a diatom-dominated bloom to one increasingly dominated by flagellates and picoautotrophs, which has been observed in certain sectors of the Arctic (Li et al., 2009; Lasternas and Agustí, 2010). Because the spring diatom bloom is arguably the single most important productivity event for the Arctic Ocean ecosystem (Degerlund and Eilertsen, 2010; Holding et al., 2015; Vaquer-Sunyer et al., 2013), understanding how diatoms' ecological and biogeochemical importance changes in response to system-wide physical or chemical shifts is important to predict future food web alterations. Diatoms have an obligate requirement for silicon; therefore understanding regional silicon cycling can provide insights into diatoms' activity. However, there is a current knowledge gap in regional silicon cycling, which precludes robust assessments of the spring bloom in future scenarios, e.g., Tréguer et al. (2018).
Diatom production is dependent on the availability of dissolved silicic acid (Si(OH)4), which they use to build their shells of biogenic silica (bSiO2). [Si(OH)4] has been observed to be low (<5 µM) in the Norwegian Seas and declining over time (Rey, 2012). A more recent analysis demonstrated a decline in pre-bloom [Si(OH)4] concentrations by 1–2 µM across the North Atlantic subpolar and polar regions over the last 25 years (Hátún et al., 2017). This is in stark contrast to the 10–60 µM [Si(OH)4] observed in the surface waters of the Southern Ocean and the marginal ice zone around Antarctica (Nelson and Gordon, 1982; Brzezinski et al., 2001), where [Si(OH)4] is unlikely to limit diatom growth unless iron is replete and stimulates exceptional blooms which consume Si, or assemblages are highly inefficient for Si uptake (Brzezinski et al., 2001). Additionally, the stoichiometry of Si(OH)4 availability relative to nitrate () in the source waters, which fuel the spring bloom in most of the North Atlantic and European polar seas, suggests that during a bloom cycle diatoms may experience Si limitation prior to N limitation, especially if diatoms consumed Si and N in near-equal quantities as in other diatom bloom regions (Brzezinski et al., 1997; Brzezinski, 1985; Dugdale et al., 1995).
Compared to the Southern Ocean, there is a paucity of field Si-cycling studies in the European Arctic. Reports of diatom silica production are only available from the subarctic northeast Atlantic near ∼60∘ N, e.g., between Iceland and Scotland (Allen et al., 2005; Brown et al., 2003), in Oslofjorden (Kristiansen et al., 2000), and in Baffin Bay (limited data; Hoppe et al., 2018; Tremblay et al., 2002); these previous studies are in zones with higher Si(OH)4 availability than in the European Arctic. Other studies have reported standing stocks of bSiO2 and export in Oslofjorden or the European Arctic, e.g., Svalbard vicinity, Laptev Sea (Hodal et al., 2012; Heiskanen and Keck, 1996; Paasche and Ostergren, 1980; Lalande et al., 2016, 2013), but none have concurrent measurements of bSiO2 production. Indeed, in the last major review of the global marine silicon cycle, Tréguer and De La Rocha (2013) reported no studies with published bSiO2 production data from the Arctic.
Currently, we lack a baseline understanding on diatom Si-cycling in the European Arctic and broader high-latitude North Atlantic region. And while models in the Barents Sea use Si as a possible limiting nutrient (Wassmann et al., 2006; Slagstad and Støle-Hansen, 1991), there are no field data to ground truth the modeled parameters governing diatom Si uptake. Thus, there is no contextual understanding to determine the consequences of the observed changes in regional [Si(OH)4] since the 1990s and whether these affect spring bloom dynamics. This study communicates the results from a cruise in the European Arctic around Svalbard reporting the first concurrent data sets on regional bSiO2 production and export, the export of diatom cells, and the degree of kinetic limitation by ambient [Si(OH)4]. Additionally, coupling bSiO2 production rates with contemporaneous primary production measurements provides an independent assessment for the diatom contribution to system primary production.
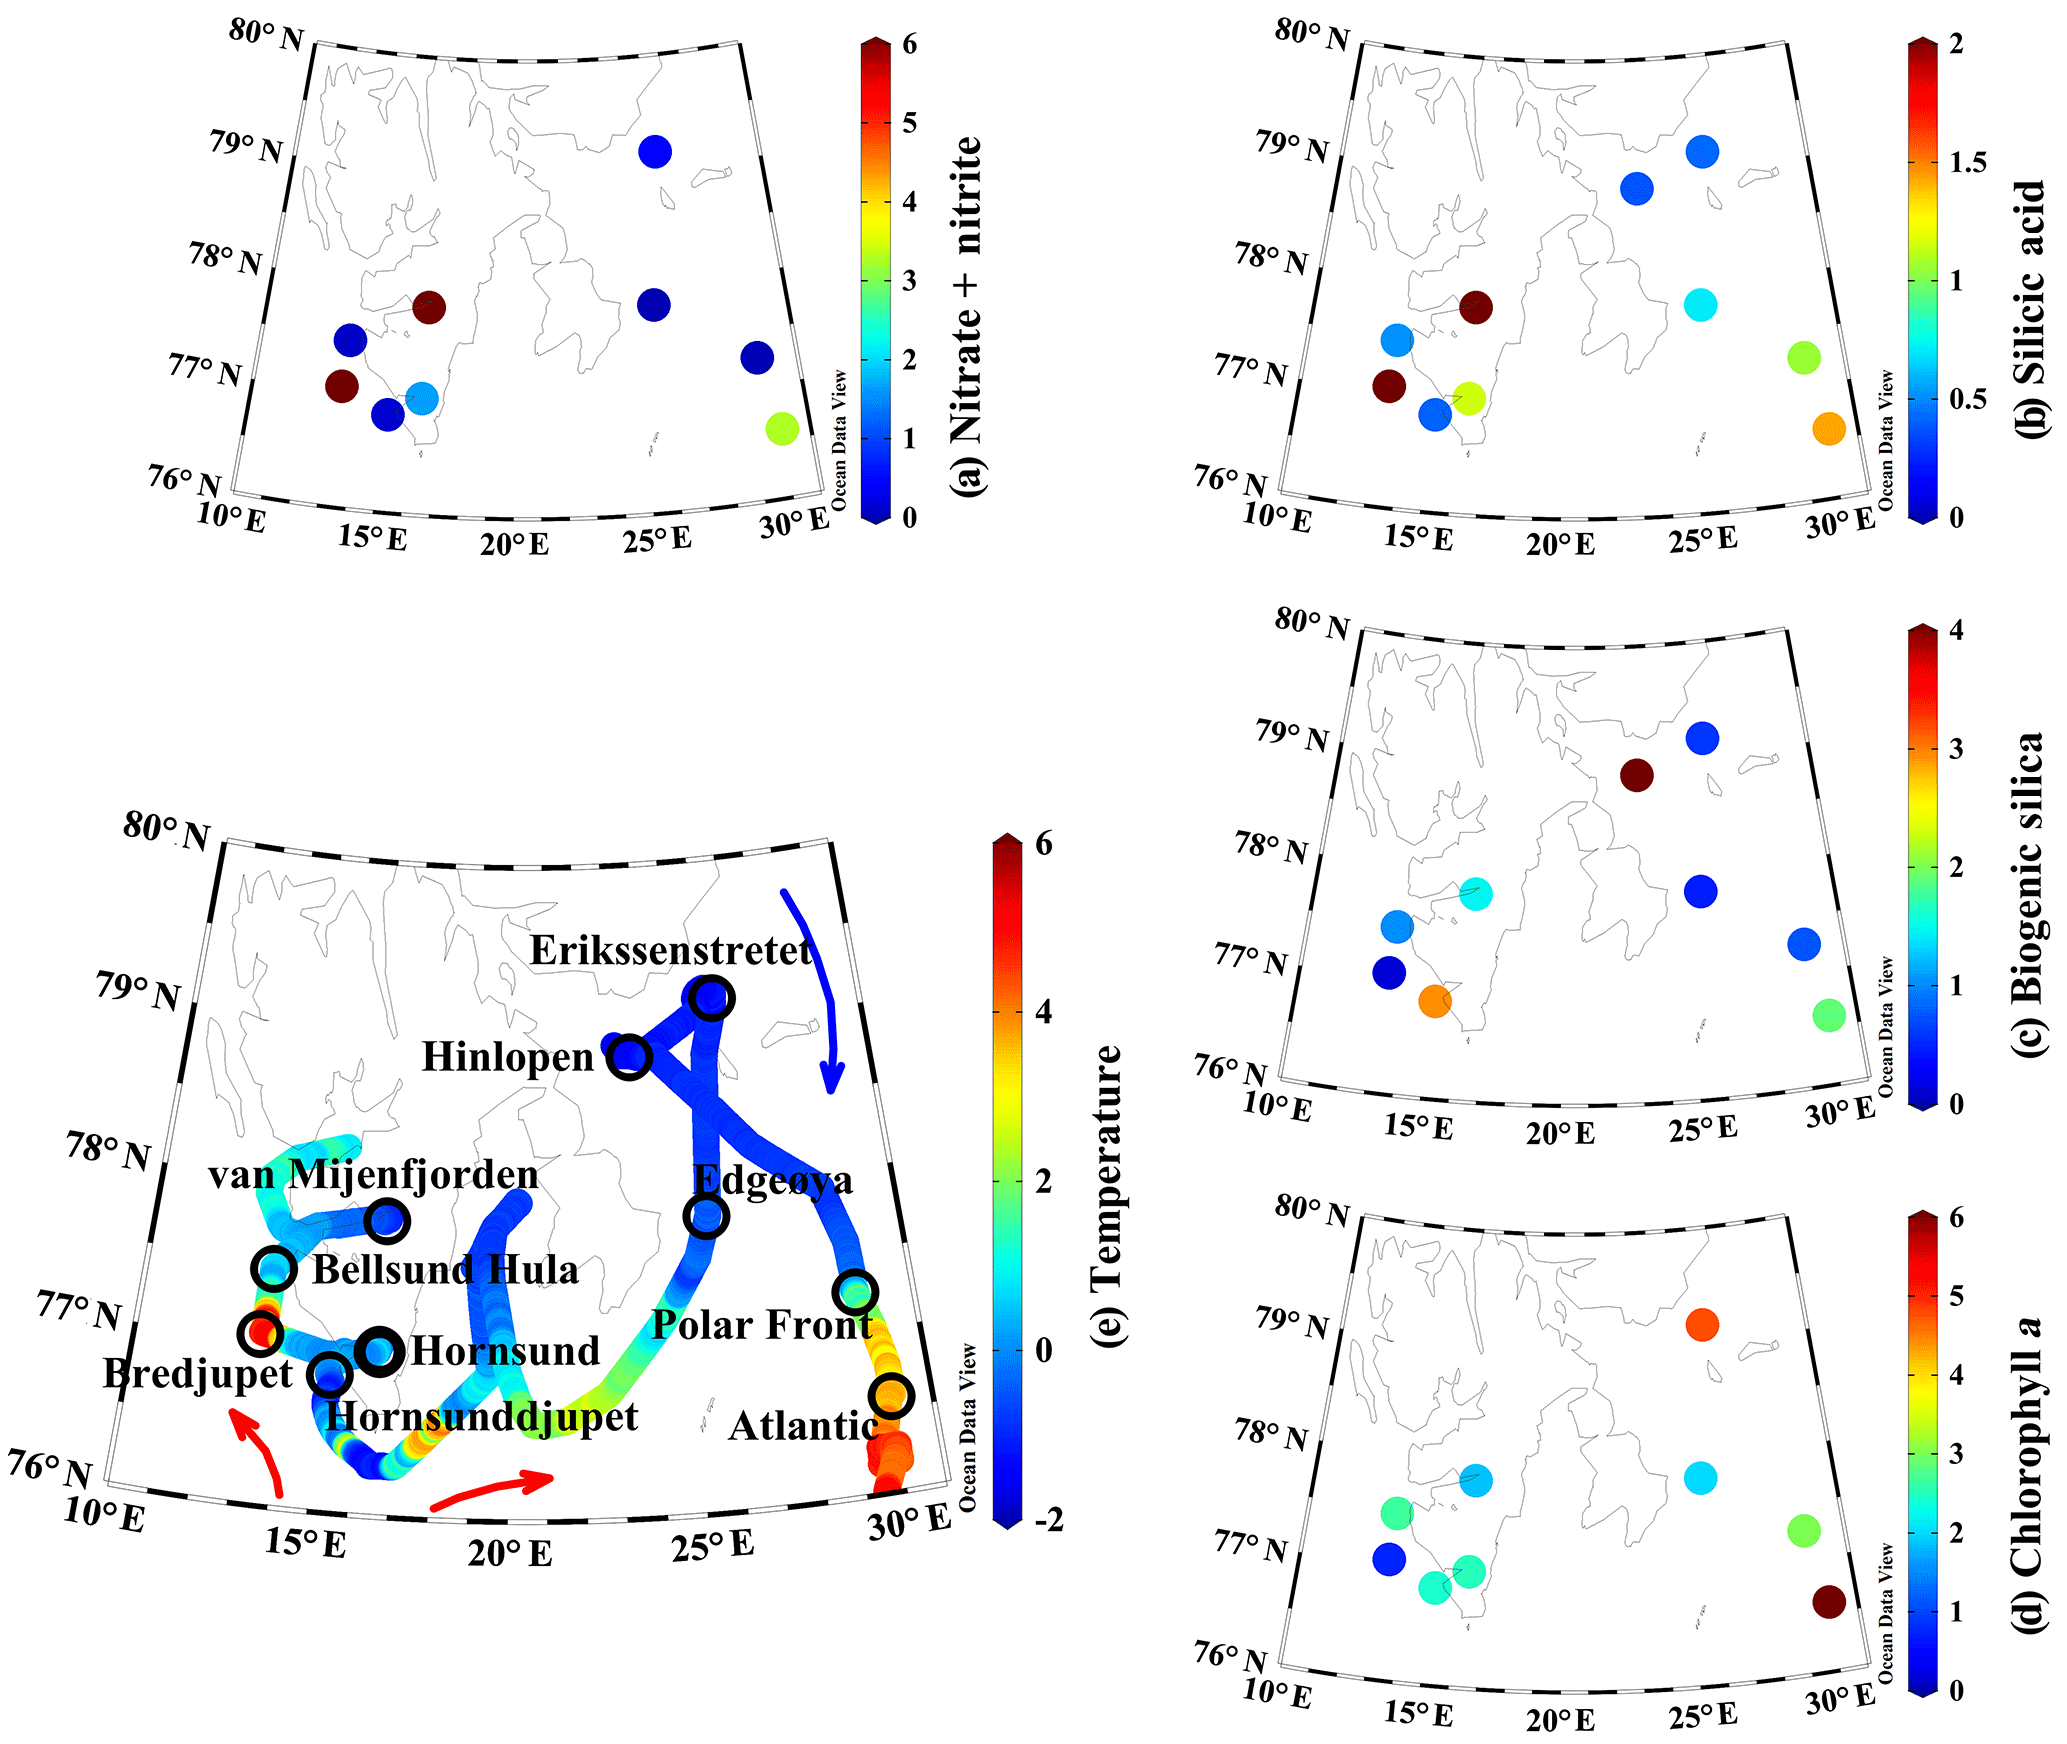
Figure 1Surface properties during 2016 ARCEx cruise including (a) nitrate + nitrite (µM), (b) dissolved silicic acid (µM), (c) biogenic silica (µmol Si L−1), (d) chlorophyll a (µg L−1), and (e) temperature (∘C) overlaid on station map. Station names are denoted on the map and colored arrows generalize the flow of Atlantic-influenced (red) and Arctic-influenced (blue) waters.
2.1 Region and sampling
This study was conducted onboard the RV Helmer Hanssen between 17 and 29 May 2016 as part of the broader project, ARCEx – The Research Centre for ARCtic Petroleum Exploration (http://www.arcex.no/, last access: 29 October 2018). The main goal of this cruise was to study the pelagic and benthic ecosystem during the Arctic spring bloom around Svalbard and in the northern Barents Sea at stations which are influenced by various water masses. The cruise started in the southwestern fjords influenced by relatively warm Atlantic water, then transited east of Svalbard toward more Arctic-influenced water (Fig. 1 blue arrow) before turning south towards stations near the Polar Front and south of the Polar Front in Atlantic-influenced water (Fig. 1 red arrows).
Vertical profiles with a CTD were conducted at all stations. Hydrocasts were conducted using a Seabird Electronics 911 plus CTD with an oxygen sensor, fluorometer, turbidity meter, and PAR sensor (Biospherical/LI-CORR, SN 1060). The CTD was surrounded by a rosette with 12 5 L Niskin bottles. At two stations, Edgeøya and Hinlopen, only surface samples were collected (no vertical profiles with ancillary measurements, Fig. 1). Water was sampled from the rosette at depths within the upper 40 m (i.e., the extent of the photic layer); for any incubation described below, the approximate irradiance at the sample depth during collection was mimicked by placing incubation bottles into a bag made of neutral-density screen. Incubation bags were placed in a onboard acrylic incubator cooled with continuously flowing surface seawater. At Hinlopen, a block of ice was collected by hand within ∼10 m of the vessel and allowed to thaw in a shaded container for 24 h at ambient air temperature. After thawing, the melted solution was homogenized and treated like a water sample for measurement of biomass and rates.
Four sediment trap arrays were deployed and collected particulate material for 19 and 23 h, depending on location. Arrays in van Mijenfjorden and Hornsund were anchored to the bottom (60 and 130 m, respectively), whereas the other two arrays (Erik Eriksenstretet, 260 m bottom depth; Polar Front, 290 m bottom depth) were quasi-Lagrangian and drifted between 14 and 16 km during the deployment. During the Erik Eriksenstretet deployment, the array was anchored to an ice floe. Arrays included sediment trap cylinders (72 mm internal diameter ×450 mm length, ∼1.8 L volume; KC Denmark) at three (van Mijenfjorden) to seven (Atlantic Station) depths between 20 and 150–200 m, based on bathymetry. After recovery, trap contents were pooled and subsampled for bSiO2 and phytoplankton taxonomy.
2.2 Standing stock measurements
A suite of macronutrients were analyzed at all stations except Hinlopen (just Si(OH)4). Water was sampled directly from the rosette, filtered (0.7 µm pore size), and immediately frozen. In the laboratory, nutrients were analyzed using a Flow Solution IV analyzer (OI Analytical, USA) and calibrated with reference seawater (Ocean Scientific International Ltd., UK). Detection limits for [NO3+NO2] and [Si(OH)4] were 0.02 and 0.07 (µM), respectively. No ammonium was measured. To avoid artefacts with prolonged freezing (Clementson and Wayte, 1992; Macdonald et al., 1986), samples were analyzed within 4 months of collection and standard practices were used (e.g., prolonged thawing of Si(OH)4 samples to allow depolymerization, three parallels measured). The median coefficient of variation among parallels was 5 % for [NO3+NO2] and [PO4], 2 % for [Si(OH)4], and 9 % for [NO2]; higher coefficient of variation was observed when the absolute concentrations were low, e.g., <0.1 µM. Reproducibility was sufficient, and no parallels were excluded. Phosphate was analyzed, but N:P ratios for nutrients were, on average, 8 among all stations, suggesting that N was likely more important than P for potentially limiting primary production. These phosphate data (0.1–0.6 µM in the upper 50 m) are not discussed.
Samples for biogenic particulates and phytoplankton community composition were taken directly from the rosette and sediment traps. For bSiO2 samples, 600 mL of seawater was collected from the rosette, filtered through a 1.2 µm polycarbonate filter (Millipore); for sediment trap material, less volume was necessary (e.g., 50–100 mL). Most bSiO2 protocols use a 0.6 µm filter cutoff, e.g., Lalande et al. (2016); however, given the magnitude bSiO2 quantified and the size range for regional diatoms we are confident that there was no meaningful systematic underestimate. After filtration, all samples were dried at 60 ∘C and stored until laboratory analysis using an alkaline digestion in Teflon tubes (Krause et al., 2009). For Chl a, water-column and sediment-trap samples were collected similarly, filtered on Whatman GF/F (0.7 µm pore size), and immediately frozen (−20 ∘C). In the laboratory, Chl a was extracted in 5 mL methanol in the dark at room temperature for 12 h. The solution was quantified using a Turner Designs 10 AU fluorometer, calibrated with Chl a standard (Sigma C6144), before and after adding two drops of 5 % HCl (Holm-Hansen and Riemann, 1978). Phytoplankton taxonomy and abundance samples were collected in 200 mL brown glass bottles from both the water column and sediment traps, immediately fixed with an aldehyde mixture of hexamethylenetetramine-buffered formaldehyde and glutaraldehyde at 0.1 % and 1 % final concentration, respectively, as suggested by Tsuji and Yanagita (1981), and stored cool (5 ∘C) and dark. Samples were analyzed with an inverted epifluorescence microscope (Nikon TE300 and Ti-S, Japan), using the Utermöhl (1958) method, in a service laboratory for diatom taxonomy (>90 individual genera or species categories were identified) and abundance at the Institute of Oceanology Polish Academy of Science.
2.3 Rate measurements
Biogenic silica production was measured using the radioisotope tracer 32Si. Approximately 150 or 300 mL samples, depending on the station biomass, were incubated with 260 Bq of high specific activity 32Si(OH)4 (>20 kBq µmol Si−1). After addition, samples were transported to the onboard incubator and placed in neutral density screened bags, simulating 50 %, 20 %, and 1 % of irradiance just below the surface, for 24 h. After incubation, samples were processed immediately by filtering bottle contents through a 25 mm, 1.2 µm polycarbonate filter (Millipore) matching bSiO2 filtrations. Each filter was then placed on a nylon planchette, covered with Mylar when completely dry, and secured using a nylon ring. Samples were aged into secular equilibrium between 32Si and its daughter isotope, 32P (∼120 days). 32Si activity was quantified on a GM multicounter (Risø National Laboratory, Technical University of Denmark) as described in Krause et al. (2011). A biomass-specific rate (i.e., Vb) was determined by normalizing the gross rate (ρ) to the corresponding [bSiO2] at the same depth of collection using a logistic-growth approach (Kristiansen et al., 2000; Krause et al., 2011). For bSiO2 and ρ, values within a profile were integrated throughout the euphotic zone (i.e., surface to 1 % I0) using a trapezoidal scheme. A depth-weighted Vb was calculated within the euphotic zone by integrating Vb and dividing by depth-integrated values (Krause et al., 2013).
Two methods were used to assess whether ambient silicic acid (Si(OH)4) limited diatom Si uptake. The 32Si activity additions, incubation conditions, and sample processing are as described above. At four stations (Edgeøya, Polar Front, Hinlopen, and Atlantic), eight 300 mL samples collected at a single depth within the euphotic zone were manipulated to make an eight-point concentration gradient between ambient and +18.0 µM [Si(OH)4]; the maximum concentration was assumed to saturate Si uptake. Si uptake has been shown to conform to a rectangular hyperbola described by the Michaelis–Menten equation:
where Vmax is the maximum specific uptake rate and KS is half-saturation constant, i.e., concentration where . Data were fit to Eq. (1) using a nonlinear curve fit algorithm (SigmaPlot 12.3). The second type of experiment used only two points: ambient and +18.0 µM [Si(OH)4]; four-depth profiles were done at three stations (Bellsund Hula, Hornsunddjupet, Erik Eriksenstretet). The ratio of Si uptake at +18.0 µM [Si(OH)4] to Si uptake at ambient [Si(OH)4] defines an enhancement (i.e., Enh) statistic. This two-point approach was conducted at all depths in the euphotic zone; Enh ratios >1.08 imply kinetic limitation beyond analytical error given the methodology (Krause et al., 2012).
Table 1Station properties including surface temperature, nutrients and chlorophyll a (± standard deviation), 20 m integrated biogenic silica stock (∫bSiO2), production (∫ρ), depth-weighted specific production (VAVE), 40 m integrated diatom abundance (∫Diatom), and export of bSiO2 and diatoms at 40 m. The disparity between the integration depths for bSiO2 standing stock and diatom abundance reflects the lack of bSiO2 samples to 40 m depth. Note: Hinlopen (ice) station not included. The Polar Front ∫Diatom is the mean of two profiles.
a Denotes concurrent primary production and biogenic silica
production measurements at one depth.
b 25 m depth.
c Surface values, no profile taken.
Net primary productivity (PP) was quantified concurrently with biogenic silica production at six stations at the depth of approximately 50 % of surface irradiance (Table 1). Carbon uptake rates were measured using a modification of the 14C uptake method (Steemann Nielsen, 1952). Water samples were spiked with 0.2 µCi mL−1 of 14C labeled sodium bicarbonate (Perkin Elmer, USA) and distributed in three clear plastic bottles and one dark (40 mL each). Subsequently, they were incubated for 24 h in the deck incubator with a 50 % light reduction mesh. After incubation, samples were filtered onto 0.2 µm nitrocellulose filters. The filters were stored frozen (−20 ∘C) in scintillation vials with 10 mL EcoLume scintillation liquid (MP Biomedicals LLC, USA) until further processing. Once on land, the particulate 14C was determined using a scintillation counter (TriCarb 2900 TR, Perkin Elmer, USA). The carbon uptake values in the dark were subtracted from the mean of the triplicate carbon uptake values measured in the light incubations. Using contemporaneous ρ measurements and PP measurements, the diatom contribution to PP is estimated as follows:
where the Si:C ratio for diatoms can be used from culture values. The most widely used Si:C ratio is 0.13 (Brzezinski, 1985); however, this study lacked polar diatom strains. Takeda (1998) grew two polar diatoms at 2 ∘C and in iron-replete media and reported Si:C from 0.10 to 0.18; however, this was extrapolated based on direct measurement of cellular N and converting using the Redfield–Ketchum–Richards C:N ratio of 6.6. A more recent study, Lomas and Krause (2018), reported data on 11 polar diatom species grown at 2 ∘C with direct measurement of biogenic silica and particulate organic carbon and nitrogen. For larger diatom species (>1000 µm3 biovolume) these authors observed the average Si:C was 0.25±0.04 (standard error, SE), with a higher ratio for smaller species (<1000 µm3) 0.32±0.04 (SE). Most of the diatom assemblage during ARCEx was composed of larger cells; thus, we use Si:C of 0.25.
Export rates were calculated using the standing stock measurements, length of deployment, and trap opening area (0.004 m2). These approaches are common and detailed elsewhere (Wiedmann et al., 2014; Krause et al., 2009).
3.1 Hydrography and spatial patterns
The regional ecosystem around Svalbard is driven by ice dynamics (Sakshaug, 2004). A majority of the southern Svalbard archipelago had open water 1 week prior to the cruise open water, which was anomalous compared to similar dates in previous years (e.g., 2014, 2015, ice data archived at http://polarview.met.no/, last access: 29 October 2018). By the end of the cruise, Svalbard could have been entirely circled by the vessel, with only open drift ice in the northeastern region. While 2016 was among the lowest years for total Arctic sea ice, the ice extent in Svalbard and the Barents Sea is highly dynamic. Ice edges may be pushed southward into the Barents Sea proper by wind while areas to the north remain ice-free, e.g., Wassmann et al. (1999) and references therein.

Figure 2Vertical profiles for (a) dissolved silicic acid, (b) nitrate + nitrite, (c) biogenic silica standing stock, (d) biogenic silica production rate, and (e) biogenic silica export. Symbols are associated by station, and line connectors are used to denote profile data opposed to individual symbols noting samples at one depth.
Spatial patterns in hydrography and nutrients were highly variable. In the southwestern stations (e.g., fjords and Atlantic-influenced water), the surface temperature ranged between 1 and 4 ∘C; a similar temperature was observed in the Atlantic station south of the Polar Front (Fig. 1e). Northeastern domain stations were more influenced by Arctic water and the surface temperatures ranged between −2 and 1 ∘C (Fig. 1e). Surface nutrient concentrations, particularly [NO3+NO2] and [Si(OH)4], showed a broad range. The highest surface [NO3+NO2] was observed in the southwestern fjords, between 2 and >8 µM, and the Atlantic station (∼3 µM, Fig. 1a). The surface concentrations at the remaining stations were <0.5 µM or near detection limits (Fig. 1a). [Si(OH)4] was lower than [NO3+NO2] (i.e., ) among stations where [NO3+NO2] was >0.1 µM. At high [NO3+NO2] stations, the [Si(OH)4] ranged from 1.1–4.5 µM (Fig. 1b) but the range was lower among other stations (0.4–1.1 µM, Fig. 1b). The bSiO2 concentration (proxy for diatom biomass, Fig. 1c) was typically similar to, or lower than, surface [Si(OH)4]. The highest surface [bSiO2] was observed in the southern stations (Atlantic-influenced waters): ∼2–3 µmol Si L−1 (Fig. 1c). At most other stations the [bSiO2] was <1 µmol Si L−1. Among all stations and depths bSiO2 varied by a factor of ∼40 (does not include Hinlopen ice algae).
Primary productivity, measured at six stations at 5 m (approximately 50 % of surface irradiance), varied by 2 orders of magnitude. The lowest primary productivity rates were observed at the four stations with the lowest surface [NO3+NO2] and ranged from 2 to 13 ; at these stations [Chl a] ranged from 2.0 to 4.8 µg L−1 (Table 1, Fig. 1d). The highest rates were measured at van Mijenfjorden and Bredjupet: 100±65 and 27±1 , respectively, and corresponded to high [NO3+NO2] and low [Chl a] of 1.8 and 0.7 µg L−1, respectively (Table 1, Fig. 1d).
3.2 Vertical profiles
As expected, most stations showed strong vertical gradients in nutrient concentrations. Profiles in the southwestern region of Svalbard (van Mijenfjorden, Bredjupet) had elevated [Si(OH)4], with little vertical structure. Vertical [Si(OH)4] profiles among other stations showed typical nutrient drawdown between the surface and ∼20 m. At these stations, surface [Si(OH)4] concentrations were typically <1.5 µM and subsurface values (to 20 m) ranged from 0.5 to 3.0 µM (Fig. 2a). [NO3+NO2] exceeded [Si(OH)4] among all depths at five stations (Fig. 2b), whereas in the remaining stations [NO3+NO2] exceeded [Si(OH)4] (i.e., ) at depths >5 m (Bellsund Hula), >20 m (Erik Eriksenstretet), and >27 m (Polar Front). For these latter three stations, [NO3+NO2] had a significant drawdown in surface waters, but then increased with depth without a similar degree of vertical enhancement in [Si(OH)4] (Fig. 2).
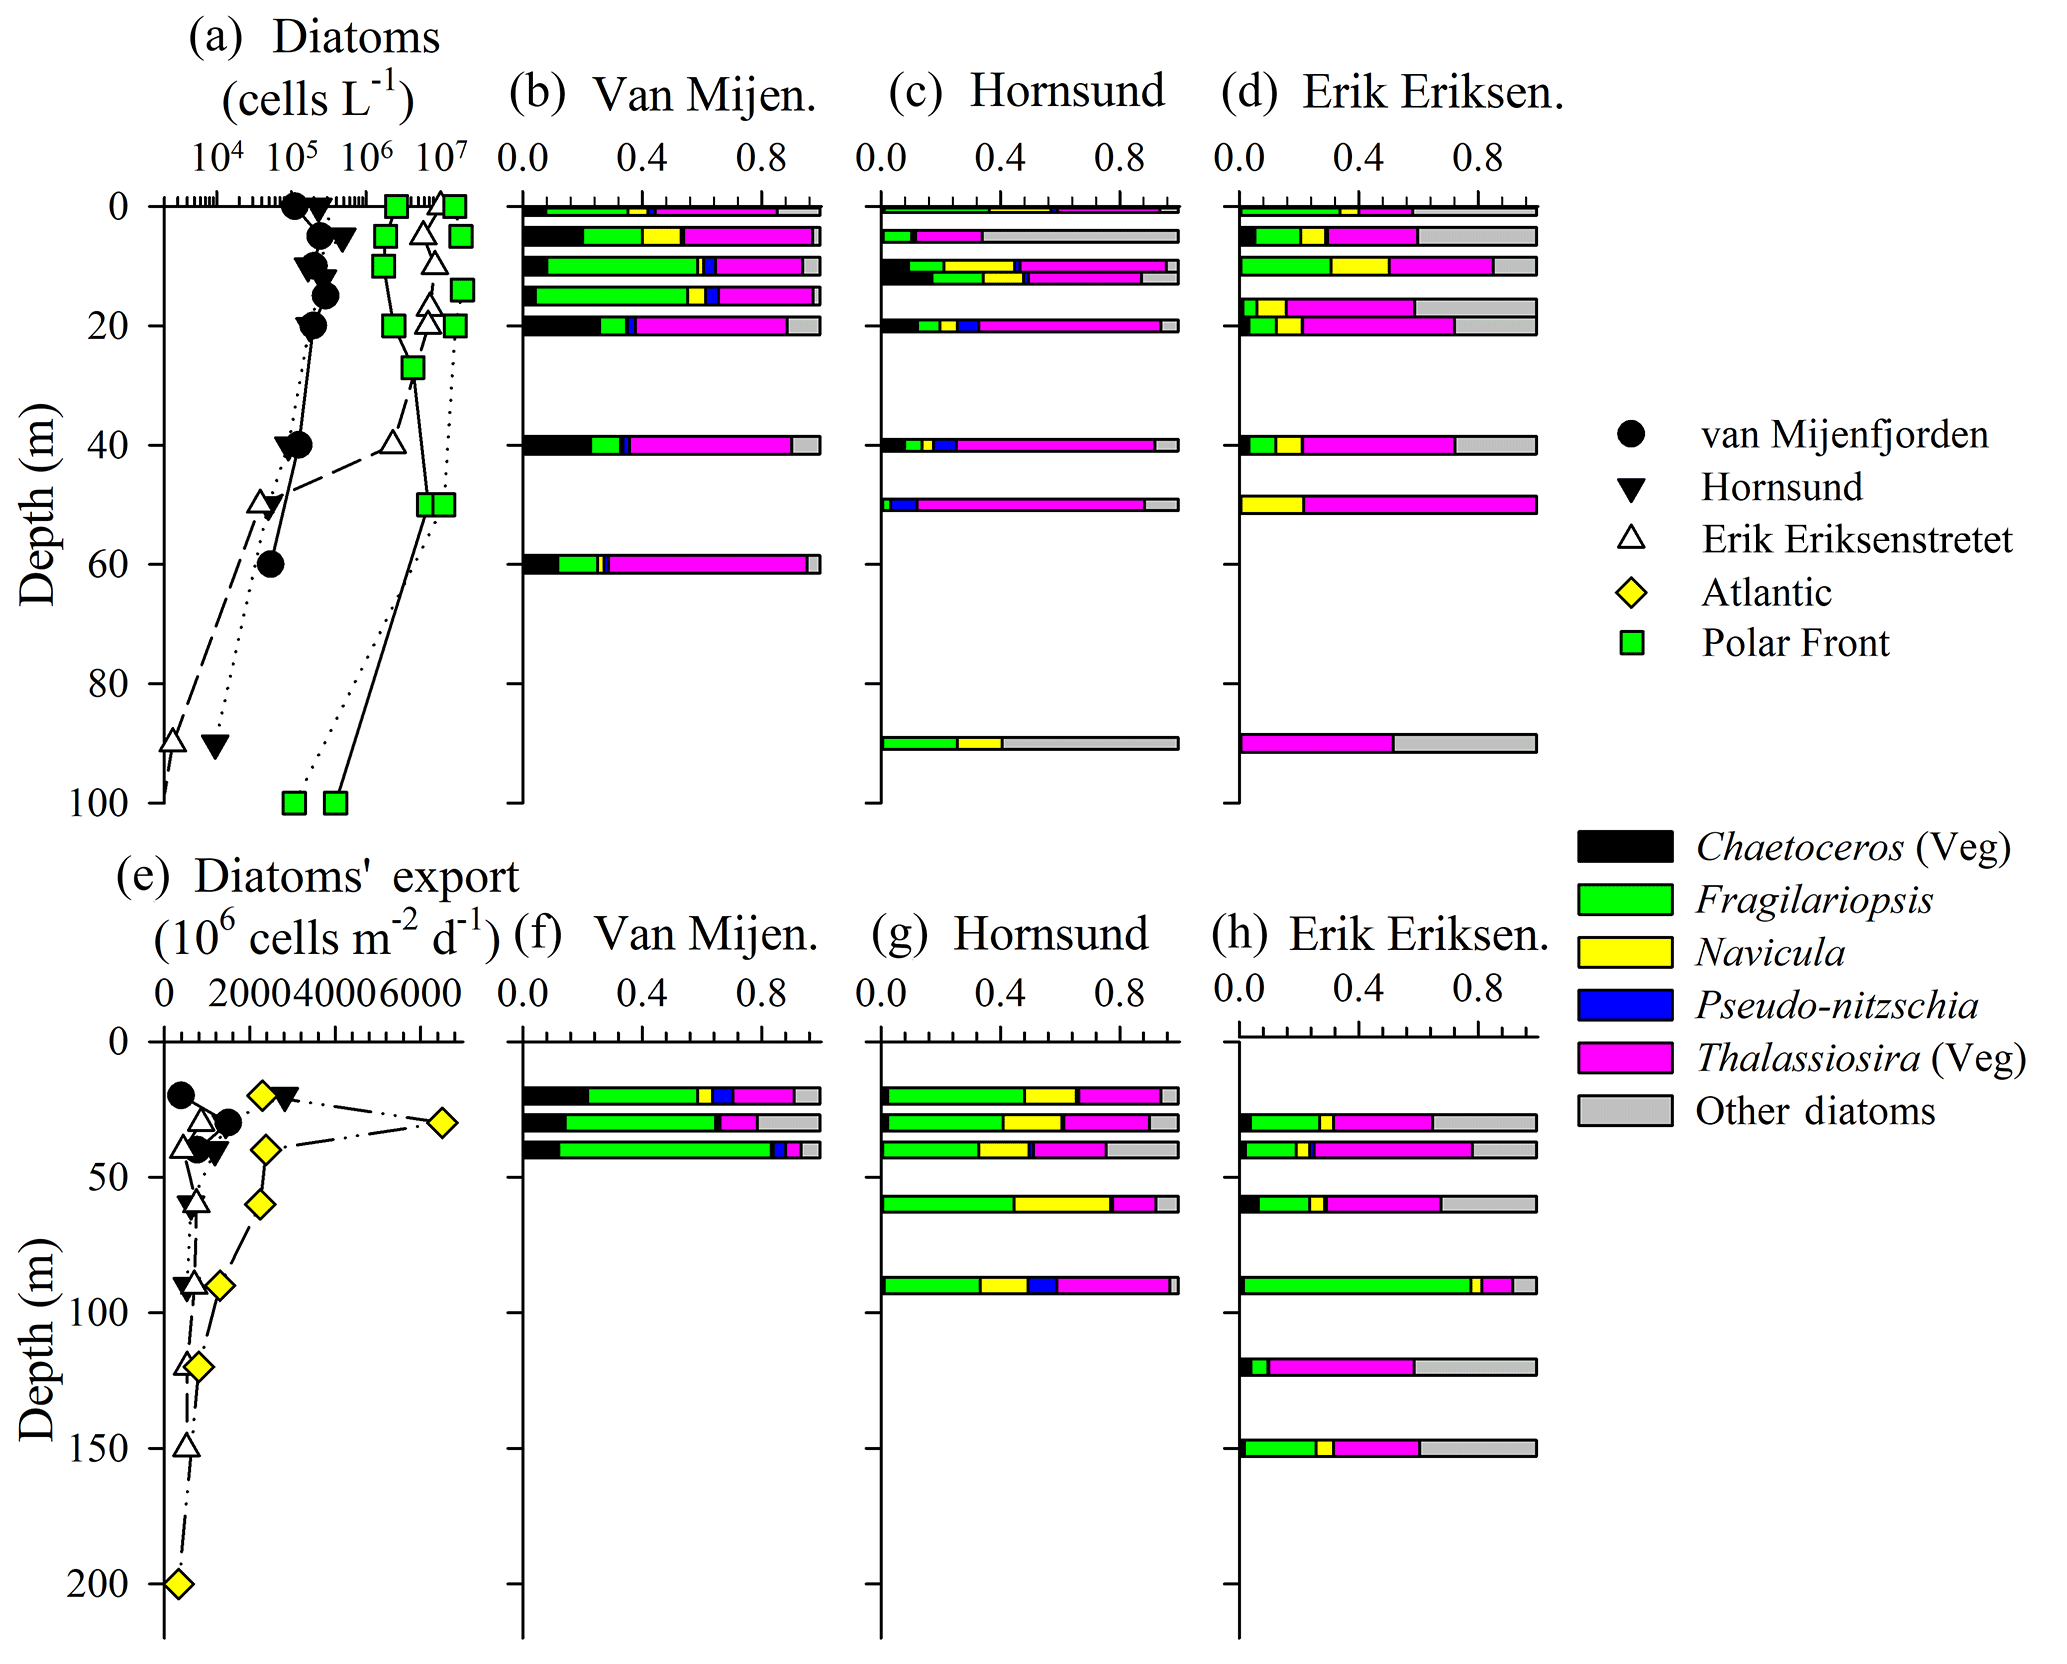
Figure 3Diatom abundance (a) and assemblage composition (b–d) in the water column, and diatom export (e) and assemblage composition (f–h) within sediment traps. Note – taxonomy information only shown for stations where both water-column and sediment-trap data were available (see text for species). Resting spores (e.g., Chaetoceros, Thalassiosira) were absent from the 40 m sediment traps; thus, proportional abundances for spore-producing taxa are entirely for vegetative cells. For (a), there are replicate diatom abundance measurements (from separate hydrocasts) for the Polar Front station.
The [bSiO2] was typically highest at or near the surface, with a maximum of ∼2 µmol Si L−1 (Fig. 2c). At the Bellsund Hula and Erik Eriksenstretet stations, subsurface [bSiO2] maxima were present (Fig. 2c; note – no surface data are available for van Mijenfjorden). Among nonprofile stations, [bSiO2] was within the range observed among vertical profiles except for the Hinlopen ice algae where ice, which was melted at ambient air temperature on the vessel, had exceptionally high [bSiO2] (Fig. 2c). The integrated bSiO2 between the surface and 20 m (∫bSiO2) spanned over an order of magnitude, with a low at Bredjupet (1.9 mmol Si m−2) and a high at Hornsunddjupet (42.4 mmol Si m−2, Table 1) despite their proximity (∼50 km).
Diatom abundance and taxonomy data were sampled at fewer stations, but the vertical and spatial variability generally mirrored trends in [bSiO2]. In the surface waters of van Mijenfjorden and Hornsund, diatom abundances ranged between 5×10⁴ and 5×10⁵ cells L−1 in the upper 50 m (Fig. 3a). However, within the same vertical layer at the Erik Eriksenstretet and Polar Front (duplicate profiles) stations, diatom abundances were enhanced by up to 2 orders of magnitude (4×10⁴–4×10⁷ cells L−1, Fig. 3a). When integrated to 40 m depth (∫Diatom), matching the shallowest sediment-trap depth among the three stations reported (Fig. 3e–h), diatom inventories also showed a variability of 2 orders of magnitude as observed in ∫bSiO2. ∫Diatom was lowest at van Mijenfjorden (7.67×10⁹ cells m−2) and highest at the Polar Front station (527×109 cells m−2, Table 1).
Among the stations which had corresponding sediment trap deployments (van Mijenfjorden, Hornsund, Erik Eriksenstretet), the diatom-assemblage composition was similar despite differences in abundance. The van Mijenfjorden station was dominated by Thalassiosira (e.g., T. antarctica var. borealis, T. gravida, T. hyalina, T. nordenskioeldii), Fragilariopsis cylindrus, and Chaetoceros furcellatus (Fig. 3b). Chaetoceros spp. were nearly absent from Erik Eriksenstretet (Fig. 3d) and of little importance at Hornsund (Fig. 3c). Thalassiosira species (same as van Mijenfjorden) cells also dominated Hornsund and Erik Eriksenstretet among most depths (Fig. 3c, d). However, at Hornsund, deeper depths were dominated by diatom groups less frequently observed (“Other diatom” category, Fig. 3), and with small contributions from Fragilariopsis cylindrus and Navicula vanhoefenii.
Diatom bSiO2 productivity, ρ, mirrored trends in biomass. Among the profiles, rates generally varied from ρ<0.01 to 0.11 (Fig. 2d). The ρ was highest in the Atlantic station (Fig. 2d), which was expected given the higher bSiO2 (Fig. 2c). However, the rates in the Hinlopen ice algae were like those quantified at Hornsunddjupet, ∼0.1 , despite the ice algae station having an order of magnitude more biomass. This suggests the Hinlopen ice algae were senescent or stressed and a sizable portion of the measured bSiO2 was nonactive or detrital. When integrated in the upper 20 m, ∫ρ ranged from 0.27 to 1.46 (Table 1), which is a smaller proportional range than observed in ∫Diatoms and ∫bSiO2. Overall, bSiO2-normalized rates (Vb) were low among all stations and depths (<0.01 to 0.13 day−1). The depth-weighted Vb, i.e., VAVE, had a narrower range of between 0.03 and 0.13 day−1. Thus, doubling times for bSiO2 in the upper 20 m ranged between 5 and 23 days.
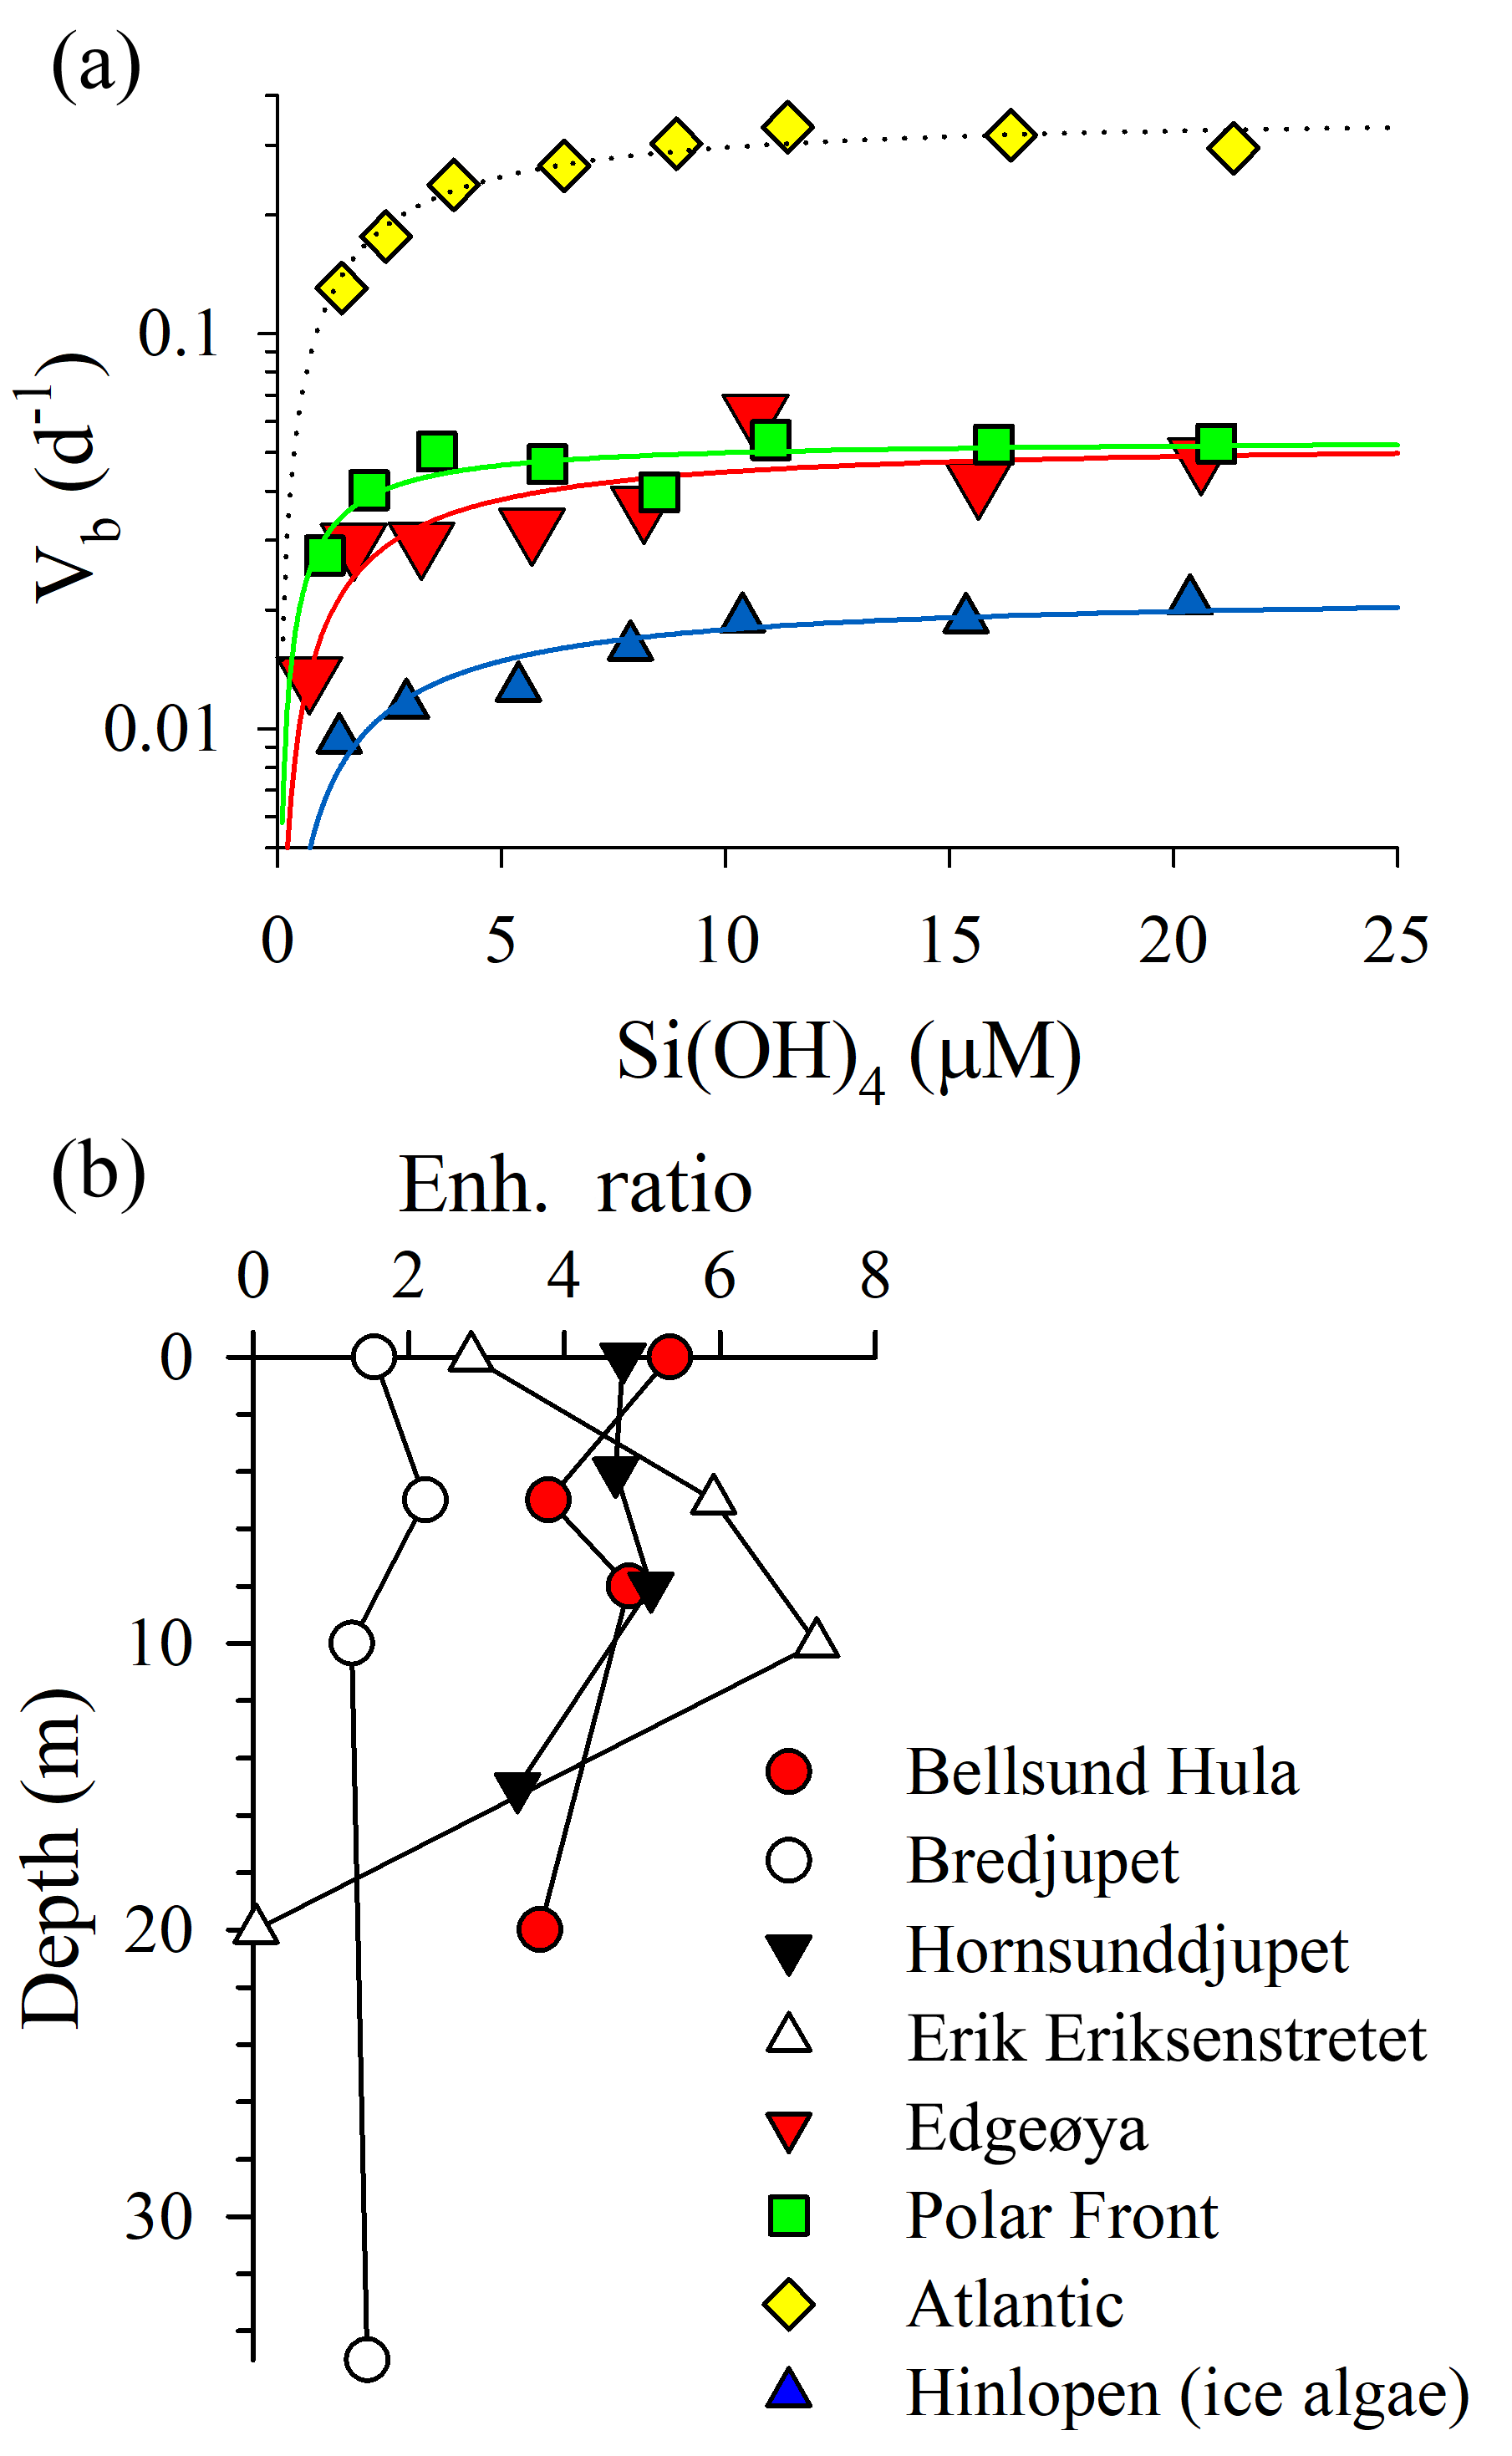
Figure 4Assessment of Si uptake limitation by available silicic acid during ARCEx. (a) Eight-point kinetic experiments taken at four stations (legend next to b). Data were fit to a Michaelis–Menten hyperbola using SigmaPlot 12.3 software. (b) Enh. ratio profiles (i.e., Vb in +18.0 µM [Si(OH)4] treatment relative to Vb in the ambient [Si(OH)4] treatment) at four stations.
The rate of diatom biogenic silica production was kinetically limited by ambient [Si(OH)4] in 95 % of the samples examined. Full kinetic experiments verified that Si uptake conformed to Michaelis–Menten kinetics (Fig. 4a; adjusted R2 ranged 0.64–0.92 among experiments). The highest Vmax was observed in the Atlantic station (0.36±0.02 day−1), which also had the highest ambient [Si(OH)4] among the full kinetic experiments (1.4 µM). Vmax observed at Edgeøya and the Polar Front was nearly identical ( day−1 for both) and was lowest in the Hinlopen ice diatoms ( day−1). KS constants had a narrower range, with a low of 0.8±0.3 µM at the Polar Front and between 2.1 and 2.5 µM among the other three stations. Among these full-kinetic experiments, the Enh ratio ranged from 1.8 to 7.7, with the most intense [Si(OH)4] limitation of uptake observed in the Hinlopen ice diatoms. For profiles where two-point kinetic experiments were conducted, the same trends were observed (Fig. 4b). The Enh ratio was similar among depths at Bellsund Hula (1.5–2.2), Hornsunddjupet, and Bredjupet (3.4–5.4 for latter two stations, Fig. 4b). At Erik Eriksenstretet, Enh ratios were more variable, ranging from 2.8 to 7.3 in the upper 10 m, with no Enh effect (i.e., <1.08) observed at 20 m – this was the only sample and depth which showed no resolvable degree of kinetic limitation for Si uptake.
Rates of bSiO2 and diatom export were variable. Among the three sediment trap regions, bSiO2 export rates ranged from ∼4 to 10 (Fig. 2e). These rates are significant and represent up to 50 % of the ∫bSiO2 in the upper 20 m at van Mijenfjorden (Table 1). For diatom cells, a similar degree of variability was observed. Export at van Mijenfjorden ranged from 390 to 1500×106 , similar to ranges at Hornsund (520–2800×106 ) and Erik Eriksenstretet (510–860×106 , Fig. 3e). The Atlantic station had significantly higher diatom export (800–2300×106 ) among all depths in the upper 120 m (Fig. 3e). The bSiO2 and the export of diatom cells were highly correlated (r=0.67, p<0.01, n=15; Spearman's rho test). Among all stations, Fragilariopsis cylindrus had the highest contribution to diatom export, and Thalassiosira species (e.g., T. antarctica, T. gravida, T. hyalina, T. nordenskioeldii) were also important (Fig. 3f–h). In Hornsund, Navicula (N. vanhoefenii, N. sp.) was an important genus for export (Fig. 3g), but this was not observed elsewhere. Similarly, “Other diatom” groups were proportionally important at Erik Eriksenstretet (Fig. 3h), as were Thalassiosira resting spores at the Atlantic station (data not shown). Among all diatoms, the only groups which were numerically important in both the water column and the sediment traps were Fragilariopsis cylindrus and Thalassiosira species (Fig. 3b–d, f–h).
4.1 Diatom Si cycling relative to other systems
To our knowledge, this is the first report of bSiO2 production data of the natural diatom community in this sector of the Arctic. Other studies have reported ρ data in the subarctic Atlantic Ocean (Brown et al., 2003; Kristiansen et al., 2000; Allen et al., 2005) ∼10–20∘ latitude south of our study region or in Baffin Bay (Hoppe et al., 2018; Tremblay et al., 2002). However, the Hoppe et al. (2018) study only includes ρ measured after a 24 h manipulation experiment and only at one site and depth near the Clyde River just east of Nunavut (Canada); no data are reported for the ambient conditions, and the measurements from Tremblay et al. (2002) are based on net changes in standing stocks instead of gross bSiO2 production. Banahan and Goering (1986) report the only ρ to date in the southeastern Bering Sea; however, Varela et al. (2013) recently reported that [Si(OH)4] in surface waters (>5 µM) is unlikely to be significantly limiting to diatoms in any sector of the Bering, Chukchi, or Beaufort Sea regions. Around Svalbard, some previous studies have examined other Si-cycling components, including variability in bSiO2 in the water column (Hodal et al., 2012) and sediments (Hulth et al., 1996), bSiO2 and diatom export (Lalande et al., 2016, 2013), or trends in [Si(OH)4] (Anderson and Dryssen, 1981). The ρ measurements presented here have no straightforward study for comparison; therefore, we compare these to the previous high-latitude Atlantic data and to well-studied sectors of the Southern Ocean.
During our study, ∫ρ in the Svalbard vicinity was low. In the northeastern Atlantic between Iceland and Scotland, the reported ∫ρ ranged between 6 and 166 (Brown et al., 2003; Allen et al., 2005). These rates are significantly higher than at our four profile stations (Table 1), and the degree of difference does not appear to be driven by differences in integration depth (compared to our study, Table 1). Given the higher [Si(OH)4] in the southern region of the Atlantic subpolar gyre (Hátún et al., 2017), the maximum achievable ∫ρ may vary with latitude. While our profile sampling was opportunistic, it appears we sampled some stations with significant diatom biomass (high ∫bSiO2), but the corresponding production rates (∫ρ) were low, with estimated doubling times on the order of 11–23 days. This suggests these high-biomass stations may have been near, or past, peak bloom conditions (Fig. 2a, b) and the seasonal timing is consistent with regional field and modeling studies inferring diatom bloom dynamics from Chl a trends (Wassmann et al., 2010; Oziel et al., 2017). Kristiansen et al. (2000) reported ρ in Oslofjorden during the late winter (February–March) ranging from 0.03 to 2.0 , over nine sampling periods with corresponding Vb of between <0.01 and 0.28 day−1; however, this system has a higher Si(OH)4 supply and surface concentration at the start of the bloom period (>6 µM), approximately 50 % higher than the highest surface concentrations observed during our study (Fig. 2a). The specific rates observed in our study fall within the lower values reported by Kristiansen et al. (2000), which may be explained by the reduced uptake from lower [Si(OH)4] (e.g., Fig. 4).
The Southern Ocean is one of the most globally significant regions for production of bSiO2. The surface [Si(OH)4] and [NO3+NO2] are among the highest in the ocean and the source waters usually have >50 % excess Si(OH)4 relative to nitrate (Brzezinski et al., 2002). Thus, exceptional Si(OH)4 drawdown relative to nitrate is required for diatom biomass yield to be limited by Si in this region. The mean ∫ρ in sectors of the Southern Ocean are variable. In the Weddell Sea, winter rates range between 2.0 and 3.2 in the seasonal ice zone (Leynaert et al., 1993). Within the sub-Antarctic zone, rates averaged 1.1 and 4.8 in the summer and spring, respectively (Fripiat et al., 2011). At the terminus of diatom blooms in the sub-Antarctic and polar frontal zone, rates can be lower, e.g., 0.1–0.3 (Fripiat et al., 2011); such values are similar to the range observed during our study, especially since these Southern Ocean studies integrated ∫ρ deeper than 40 m (e.g., 50–100 m). Brzezinski et al. (2001) reported average ∫ρ of ∼25 (integrated from surface to 80–120 m) during intense blooms in the seasonal ice zone, which propagated south of the Antarctic polar front. But despite the massive diatom bSiO2 accumulating in these blooms, VAVE generally ranged between 0.05 and 0.15 day−1 (Brzezinski et al., 2001). Given the order-of-magnitude difference in [Si(OH)4] and ∫ρ between the Arctic and Southern Ocean, the similar VAVE in both regions may be more reflective of thermal effects on diatom growth rate, since Si uptake and diatom growth rates are tightly coupled, or of a significant accumulation of detrital bSiO2 (i.e., diatom fragments) in the Southern Ocean, where low temperatures reduce bSiO2 remineralization rates (Bidle et al., 2002).
4.2 Potential for silicon limitation of diatom productivity
Suboptimal silicon availability affects the rate of diatom bSiO2 production and can limit their growth. For diatoms in Svalbard and the broader region of the subpolar and polar European Atlantic, both [Si(OH)4] and its availability relative to N appear to be suboptimal for creating intense diatom blooms, such as those occurring in the Southern Ocean. Yet, the Arctic spring bloom is consistently dominated by diatoms or Phaeocystis (Degerlund and Eilertsen, 2010), which suggests some level of adaptation for diatoms to the low [Si(OH)4] environment. Stoichiometry of silicon availability relative to nitrate can help diagnose Si limitation; the most widely accepted diatom Si:N ratio is ∼1 based on temperate and low-latitude clones (Brzezinski, 1985). The average Si:N ratio for two polar diatom clones (silicic acid and iron replete) reported in Takeda (1998) was 0.96±0.24 (SE). A more recent culture study by Lomas and Krause (2018), reported Si:N for 11 polar diatom clones grown at 2 ∘C among exponential and stationary growth phases, in both replete and N-limiting nutrient conditions; these authors observed Si:N among all clones, treatments, and nutrient conditions (>150 data points) was 1.7±0.10 (SE).
The silicon kinetic data provide clarity for interpreting Si and N nutrient drawdown. Diatoms have an r-selected ecological strategy and are typically the first phytoplankton group to bloom in this region under stratified conditions (Reigstad et al., 2002). The 1.7 Si:N from Lomas and Krause (2018) for nutrient-replete polar diatoms suggests they consume 70 % more Si relative to N. However, under kinetic limitation, diatoms have long been inferred to reduce Si per cell in culture to avoid growth limitation (Paasche, 1973) – this was recently observed directly in the field for the first time (McNair et al., 2018). Given the clear kinetic limitation observed during ARCEx (Fig. 4), this likely reduced the diatom Si:N ratio to closer to the canonical 1:1 ratio. Thus, the kinetic limitation in this region may result in N and Si being consumed in near-equal amounts (i.e., ) and previous inferences of diatom processes based on 1:1 Si:N drawdown appear valid.
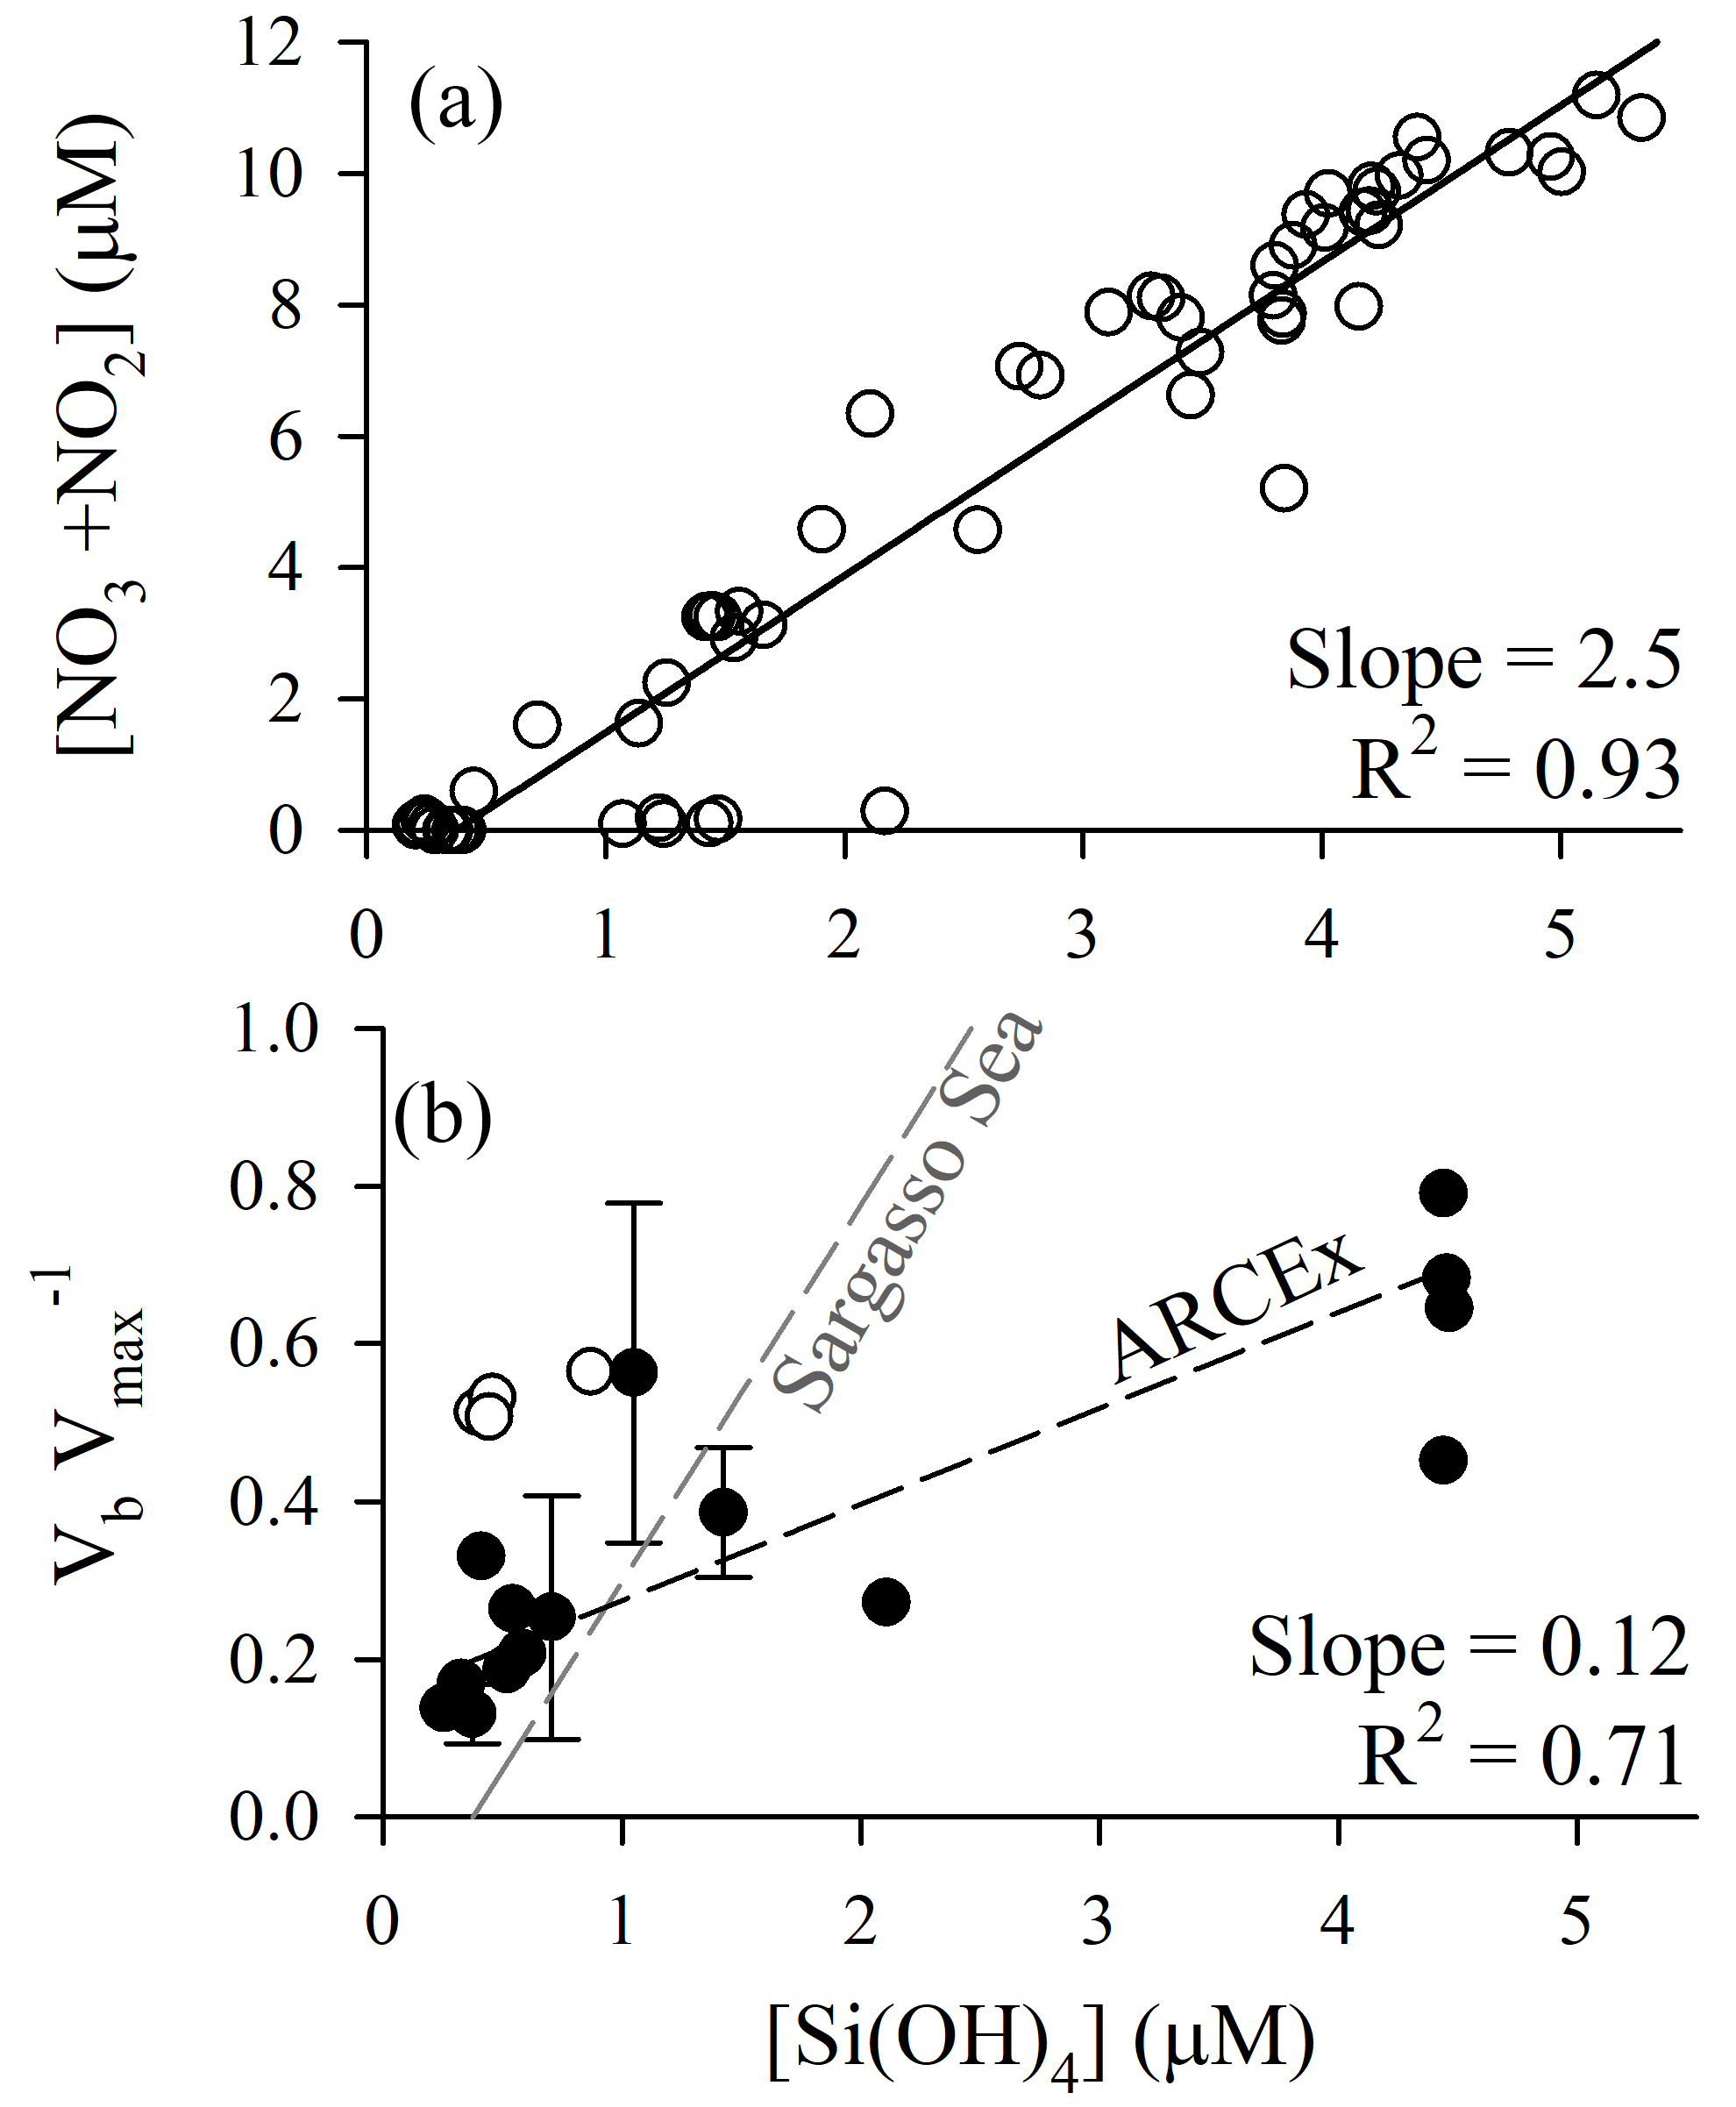
Figure 5Diagnosis of potential silicon limitation for diatom production during ARCEx. (a) Nitrate + nitrite drawdown as a function of dissolved silicic acid. (b) The ratio of Vb at ambient [Si(OH)4] to Vmax versus dissolved silicic acid. In both panels, linear regressions were done using a model II reduced major axis method; for panel (b) the regression line does not include the Hornsunddjupet station (open circles). For comparison, the same relationship for the Sargasso Sea in the North Atlantic subtropical gyre is shown, as synthesized in Krause et al. (2012).
Nutrient relationships support the potential for silicon to be a controlling factor of regional diatom productivity. When plotting [NO3+NO2] as a function of [Si(OH)4] (Fig. 5a) a few trends emerge. (1) The slope of the linear regression relationship (2.5±0.1 mol N (mol Si)−1) denotes that NO3+NO2 is consumed at over twice the rate per unit Si(OH)4. (2) Given that the source water [NO3+NO2] concentration is only roughly twice that of [Si(OH)4], a 2.5 drawdown ratio would predict NO3+NO2 to be depleted before Si(OH)4. The latter observation suggests that Si(OH)4 could be the yield-limiting nutrient for diatoms during a spring bloom period only if they dominate the phytoplankton assemblage and consume Si:N in ratios >1, e.g., 1.7 as reported by Lomas and Krause (2018). Field data demonstrate interannual variability. Nitrate and silicic acid drawdown within the upper 50 m during the spring season (1980–1984) was discussed by Rey et al. (1987) who suggested apparent nitrate limitation (1980, 1981) and silicic acid limitation (1983, 1984). The Reigstad et al. (2002) analysis of nitrate and silicic acid drawdown in the central Barents Sea shows similarities to ARCEx in that the diatom assemblage could only draw down [Si(OH)4] to ∼1 µM (May 1998) and ∼0.5 µM (July 1999). These authors suggest that physical effects on phytoplankton explain the variability, where diatoms dominate in shallow mixed waters as opposed to Phaeocystis pouchetii dominating in deeper mixed waters. Clearly, interannual and local differences in mixing, which may favor Phaeocystis pouchetii over diatoms (Reigstad et al., 2002), can affect the assemblage and nutrient drawdown trajectory (e.g., see points with high [Si(OH)4] and [NO3+NO2] close to detection limit, Fig. 5a); therefore, diagnosis of whether Si limits diatom production should be accompanied by additional analyses.
When considering the European sector of the Arctic and sub-Arctic between 60 and 80∘ N, there is compelling evidence that ambient [Si(OH)4] limits the rate of diatom bSiO2 production. During ARCEx, the relationship between Vb and [Si(OH)4] supports that Si regulates diatom productivity to some degree (Fig. 4). Our kinetic data demonstrate that in three of four experiments KS was ∼2.0 µM, but in the Polar Front the KS was lower ∼0.8 µM. These data are consistent with community kinetic experiments reported in Oslofjorden where KS and Vmax were between 1.7 and 11.5 µM and between 0.16 and 0.64 day−1, respectively, with the lowest Vmax observed during the declining diatom bloom (Kristiansen et al., 2000). These authors concluded that silicon ultimately controlled diatom productivity during this bloom (Kristiansen et al., 2001). In the only other kinetic experiments reported in the northeast Atlantic, Brown et al. (2003) and Allen et al. (2005) observed linear responses in Vb between ambient and 5 µM [Si(OH)4], which suggests uptake did not show any degree of saturation at this concentration (Note: the single experiment reported in Allen et al. (2005) is one of four experiments originally reported in Brown et al., 2003). These field-based KS values are considerably higher than parameters used in Barents Sea models, e.g., 0.5 µM (Slagstad and Støle-Hansen, 1991) and 0.05 µM (Wassmann et al., 2006), which reflect the high-efficiency Si uptake reported for cultures (Paasche, 1975). Fitting a regression to the Vb as a function of [Si(OH)4] (line shown in Fig. 5b) suggests that 2.8 µM is the best constrained half-saturation concentration (i.e., concentration where Vb ) for the regional assemblage. This empirical value excludes the Hornsunddjupet assemblage (white symbols, Fig. 5b), and their inclusion decreases this aggregated half-saturation to 2.3 µM. Unlike diatoms in the North Atlantic Subtropical Gyre, e.g., the Sargasso Sea (Krause et al., 2012), regional diatoms do not appear to be well adapted for maintaining Vb at low [Si(OH)4]. Instead, diatoms during the spring season appear to be best adapted for concentrations exceeding 2.3 µM. It is plausible that as [Si(OH)4] is depleted, diatoms may slow growth from severe limitation of Si uptake (Fig. 5b) and/or biomass yield (i.e., stock of diatom bSiO2 far exceeds Si(OH)4).
To avoid growth limitation under conditions of kinetic limitation (i.e., suboptimal [Si(OH)4]), diatoms can reduce their silicon per cell. A guideline from culture work is that diatoms can alter their silicon per cell by a factor of 4 (Martin-Jézéquel et al., 2000). Thus, when uptake is reduced to <25 % of Vmax (i.e., concentration which promotes uptake at half the half-saturation level) diatoms must slow growth to take up enough Si to produce a new cell. Using the empirical half-saturation constant range (2.3–2.8 µM), calculated from Fig. 5b and using Eq. (1) to solve for the concentrations where Vb (Vmax is a constant), suggests that when [Si(OH)4] is below 0.3–0.8 µM, the degree of kinetic limitation could force diatoms to slow growth in response. This type of limitation could occur even if diatom bSiO2 stock was not sufficiently high to induce yield limitation, e.g., it could not deplete all Si(OH)4 from the assemblage undergoing one division. Such a range is lower than the common interpretation of the Egge and Aksnes (1992) data set showing diatoms may be outcompeted by flagellates when [Si(OH)4]<2 µM, a value which is more reflective of an ecological niche opposed to a physiological threshold, as has been purported in numerous citations of these data. At these inferred limiting [Si(OH)4] there would be up to 0.8 µM [NO3+NO2] remaining (Fig. 5a), which would allow nonsiliceous phytoplankton to draw down the remaining N. Therefore, under shallow stratified conditions which favor diatoms over Phaeocystis (sensu Reigstad et al., 2002), [Si(OH)4] may regulate regional diatom productivity through either yield- or severe-kinetic limitation. This provides the most direct assessment to date, supporting the general ideas proposed for Si regulation of regional diatom productivity (Rey, 2012; Rey et al., 1987; Reigstad et al., 2002).
4.3 Diatom contribution to primary production
Among the six sites with paired PP and ρ measurements, the bloom phase can be inferred from the magnitude of nutrient drawdown, [Chl a], PP, and pCO2 (data not shown). Bredjupet appeared to be a pre-bloom station given the high surface nutrient concentrations, while the van Mijenfjorden station appeared to be in an early bloom phase based on relative high nutrients and moderate [Chl a]. The Erik Eriksenstretet station represented a peak bloom condition, whereas assemblages at Hornsunddjupet and Edgeøya appeared to be postbloom and in a stage of decline. The Polar Front station represented the end or late-phase bloom condition; however, at this station Phaeocystis was abundant (data not shown), suggesting it may have dominated the bloom dynamics instead of diatoms.
The diatom contribution to PP was highly variable. Among the stations with high [NO3+NO2] (van Mijenfjorden, Bredjupet) the diatom contribution to PP (e.g., Eq. 2) was low, at 2 %–3 %. At two stations, Hornsunddjupet and the Polar Front, the diatom contribution to PP increased to 25 %–30 %. In the Edgeøya and Erik Eriksenstretet stations, diatoms accounted for a majority or all of PP, at 70 % and 180 %, respectively. Given that diatoms can reduce their cellular Si in response to kinetic limitation (Paasche, 1973; McNair et al., 2018), the Si:C ratio of 0.25 based on nutrient-replete polar diatoms in culture may systematically underestimate diatom contribution to PP using our approach. For example, if kinetic limitation reduced Si per cell by 50 % (i.e., Vb , Fig. 5b) but did not affect cellular C, then the Si:C ratio would be 0.13 (i.e., temperate Si:C diatom value), and nearly all the calculated diatom contributions would double. Considering the degree of kinetic limitation at most stations (Fig. 5b), this suggests our estimates are conservative except at Erik Eriksenstretet. The unrealistic value at Erik Eriksenstretet underscores the issue with the Si:C ratio (Eq. 2); however, adjusting Si:C downward would increase the diatom contribution. Thus, there may have been lower C per cell for diatoms at this station due to other factors associated with the phase of the bloom and/or the different assemblage; e.g., Porosira glacialis was more abundant at this station and has a large vacuole which could lower C content, thereby increasing Si:C (data not shown).
Clearly, diatoms can play a significant role in local productivity, but these data demonstrate a “boom and bust” nature. At stations at or near peak bloom levels (e.g., Edgeøya, Erik Eriksenstretet), diatoms could account for nearly all primary production. However, they may also contribute an insignificant percentage of primary production prior to the onset of the bloom (e.g., van Mijenfjorden, Bredjupet). But even when physical conditions may favor Phaeocystis blooms, diatoms appear to be significant contributors to primary production (Polar Front station). In such a situation, N would be predicted to be the limiting nutrient as it will be consumed by both Phaeocystis and diatoms whereas Si will only be consumed by the latter.
In the European Arctic, shifts in summer-period phytoplankton communities away from diatom-dominated conditions have been observed in numerous studies. One of the most important observations has been the increasing abundances of Phaeocystis in ice-edge (Lasternas and Agustí, 2010) or under-ice blooms (Assmy et al., 2017). These changes have corresponded with larger-scale shifts in the export of diatoms to depth in the Fram Straight (Nöthig et al., 2015; Lalande et al., 2013; Bauerfeind et al., 2009). The timing of these shifts, e.g., mid-2000s, correspond with the broader regional reduction in winter mixed-layer [Si(OH)4] concurrent with the shift to negative gyre-index state in the latter half of the decade (Hátún et al., 2017). With a reduction in pre-bloom Si(OH)4 supply, diatoms may run into limitation sooner during the bloom cycle and thus leave more residual nitrate for nondiatom phytoplankton. Given the highly variable contribution of diatoms to primary productivity, resolving a climate change or natural physical oscillation signal will be challenging. A similar conclusion about detecting a climate-change signal was made in the eastern Bering Sea by Lomas et al. (2012) given the natural variability in primary production.
4.4 Diatoms and export
The bSiO2 export rates observed during ARCEx were significant relative to the standing stocks. At van Mijenfjorden, the rate of export in the upper 40 m represented 39 % of the ∫bSiO2 standing stock (23.3 mmol Si m−2, integral of data in Fig. 2c) in the same vertical layer. This quantity was much higher than at Erik Eriksenstretet, where the 40 m export rate was <11 % of the ∫bSiO2 in the upper water column (note: no samples were taken deeper than 20 m; thus, additional bSiO2 between 20 and 40 m would lower the 11 % estimate). Given that the van Mijenfjorden site was located within shallow fjord waters (bottom depth approximately 60 m), such a high proportion export relative to standing stock may suggest either lateral focusing processes (e.g., discussed by DeMaster, 2002) and/or resuspension of sediment bSiO2 into the water and resettlement. The rate of bSiO2 export among all export and production stations was also at least a factor of 4 higher than ∫ρ in the upper 20 m (Table 1). It is likely that some fraction of ∫ρ was missed due to lack of sampling between 20 and 40 m, but with a less light at these depths, it is unlikely systematic underestimates of ρ caused the disparity. Given the deeper water at the Erik Eriksenstretet and Atlantic stations, such high bSiO2 export may be driven by previously high ρ and bSiO2 standing stock that accumulated in the overlying waters or, given the dynamic circulation in the region, this signal may have been laterally advected to these station locations.
Relative to previous studies, the bSiO2 export rates were also high. During May 2012 in Kongsfjorden, Lalande et al. (2016) reported bSiO2 export rates between 0.2 and 1.3 in the upper 100 m. A similar range was observed by Lalande et al. (2013) in the eastern Fram Strait using moored sediment traps (2002–2008) collecting at depths between 180 and 280 m. Lalande et al. (2013) concluded that, despite warm anomaly conditions, pulses of bSiO2 export were positively correlated to the presence of ice in the overlying waters, which stratifies the water and helps initiate a diatom bloom. However, if the light was insufficient to stimulate a bloom, Lalande et al. (2013) suggested much of the pulse of bSiO2 exported to depth may have originated in the ice and sank during melting. Indeed, the low Vb (<0.01 day−1) observed at the Hinlopen station (ice algae), despite the moderate ρ measured (0.12 ), suggests that most of the ice-associated bSiO2 was detrital and not associated with living diatoms. Thus, the recent ice retreat observed prior to the ARCEx cruise was a potential source of such high bSiO2 export to depth despite the considerably lower ∫ρ in the upper 20 m.
Among the groups examined, the most important diatom genera for standing stock and export were Thalassiosira and Fragilariopsis, suggesting these groups are important drivers of bulk bSiO2 fluxes. Given the large-size and chain-forming life histories for the dominant species within each genus, it is likely that their dominance in the trap abundances helps explain the high correlation (r=0.67, p<0.01; Spearman's rho test) between bSiO2 and diatom export. Given this degree of correlation, it would be expected that both bSiO2 and diatom export would be similarly enhanced relative to previous studies; however, this was not observed.
Comparing the magnitude of bulk bSiO2 export and the export of diatom cells suggests significant food web repackaging occurred. The export of diatom cells in Kongsfjorden (Lalande et al., 2016) were similar to or a factor of 3 lower than rates quantified during ARCEx (Table 1, Fig. 3e), whereas bSiO2 export during ARCEx was over an order of magnitude higher than bSiO2 export in Kongsfjorden. One possible explanation for the higher degree of bSiO2 export enhancement, relative to diatom-cell export, between studies is that more exported material during ARCEx was repackaged and modified in the food web. For instance, in Erik Eriksenstretet gel traps confirm the presence of aggregates and mesozooplankton fecal pellets (Ingrid Wiedmann, data not shown), and in van Mijenfjorden detrital particles and sediment material were most prominent on the gel traps opposed to clearly recognizable material (e.g., diatom valves). This repackaging is consistent with previous observation in the Barents Sea showing high potential for copepod fecal pellets to be exported in the Polar Front and Arctic-influenced regions during spring (Wexels Riser et al., 2002). It also supports the general ideas for the importance of diatom organic matter in fueling secondary production regionally during this season (Degerlund and Eilertsen, 2010, and references therein).
This is the first regional data set with contemporaneous measurements of diatom bSiO2 standing stock, production, and export and assessment of kinetic limitation by [Si(OH)4] in the European Arctic. Among stations and depths there was widespread limitation of diatom bSiO2 production rates by ambient [Si(OH)4] during spring-bloom conditions. The kinetic parameters for diatom Si uptake (e.g., KS) quantified in our study are significantly higher than rates used in regional models and quantified in polar diatom cultures; therefore, these data will help future modeling efforts better simulate diatom–Si dynamics. Given the trajectories of Si and N consumption, diatom-dominated blooms (vs. Phaeocystis-dominated) could deplete Si(OH)4 prior to nitrate (yield limitation); and at some stations, the degree of kinetic limitation by ambient [Si(OH)4] could have resulted in diatom growth being slowed. Diatom contribution to PP was highly variable, ranging from <10 % to ∼100 % depending on the bloom stage; but even when Phaeocystis appeared to be favored, diatoms still had a significant (∼25 %) contribution to PP. While there was agreement with previous regional studies regarding the export rate of diatom cells, we observed significantly elevated bSiO2 export. Such a discrepancy can be resolved if a higher fraction of the diatom material exported during our study was modified by zooplankton grazers, relative to previous studies, or if much of this bSiO2 was derived from melting ice and/or advection.
All data are available upon request to the authors or are available through the UiT research data bank (https://dataverse.no/dataverse/uit, last access: 29 October 2018).
JWK, CMD, and SA conceived and designed the study and conducted analysis. JWK, CMD, IAM, PA, MFM, IW, and SA conducted the fieldwork. PW and SK conducted analysis. All coauthors contributed to the writing of the paper, led by JWK.
The authors declare that they have no conflict of interest.
The authors thank the science team and crew of the RV Helmer Hanssen.
We also thank Sigrid Øygarden, Emma Kube, Angelika Renner, Daniel Vogedes, Hanne Foshaug, Sydney Acton, David Wiik,
Britt Vaaja, and William Dobbins for logistic support. We also thank two anonymous reviewers for constructive
feedback. Primary data analysis was
supported by the Dauphin Island Sea Lab. Vessel time, ancillary data, and Ingrid Wiedmann's and Paul Wassmann's
contribution was supported by ARCEx, funded by
industry partners and the Research Council of Norway (project no. 228107).
Philipp Assmy was supported by the Research Council of Norway (project
no. 244646). Philipp Assmy and Mar Fernández-Méndez were funded by
Norwegian Ministries of Foreign Affairs and Climate and Environment through
the Arktis 2030 programme (project ID Arctic). Jeffrey W. Krause, Carlos M. Duarte, and
Susana Agustí were supported by internal funding sources at their respective
institutions.
Edited by: S. Wajih A. Naqvi
Reviewed by: two anonymous referees
Allen, J. T., Brown, L., Sanders, R., Moore, C. M., Mustard, A., Fielding, S., Lucas, M., Rixen, M., Savidge, G., and Henson, S.: Diatom carbon export enhanced by silicate upwelling in the northeast Atlantic, Nature, 437, 728–732, 2005.
Anderson, L. and Dryssen, D.: Chemical-constituents of the arctic ocean in the svalbard area, Oceanol. Acta, 4, 305–311, 1981.
Arrigo, K. R., van Dijken, G., and Pabi, S.: Impact of a shrinking Arctic ice cover on marine primary production, Geophys. Res. Lett., 35, L19603, 2008.
Assmy, P., Fernández-Méndez, M., Duarte, P., Meyer, A., Randelhoff, A., Mundy, C. J., Olsen, L. M., Kauko, H. M., Bailey, A., and Chierici, M.: Leads in Arctic pack ice enable early phytoplankton blooms below snow-covered sea ice, Sci. Rep.-UK, 7, 40850, https://doi.org/10.1038/srep40850, 2017.
Banahan, S. and Goering, J. J.: The production of biogenic silica and its accumulation on the southeastern Bering Sea shelf, Cont. Shelf Res., 5, 199–213, 1986.
Bauerfeind, E., Nöthig, E.-M., Beszczynska, A., Fahl, K., Kaleschke, L., Kreker, K., Klages, M., Soltwedel, T., Lorenzen, C., and Wegner, J.: Particle sedimentation patterns in the eastern Fram Strait during 2000–2005: Results from the Arctic long-term observatory HAUSGARTEN, Deep-Sea Res. Pt. I, 56, 1471–1487, 2009.
Bidle, K. D., Manganelli, M., and Azam, F.: Regulation of oceanic silicon and carbon preservation by temperature control on bacteria, Science, 298, 1980–1984, 2002.
Brown, L., Sanders, R., Savidge, G., and Lucas, C. H.: The uptake of silica during the spring bloom in the Northeast Atlantic Ocean, Limnol. Oceanogr., 48, 1831–1845, 2003.
Brzezinski, M. A.: The Si:C:N ratio of marine diatoms: Interspecific variability and the effect of some environmental variables, J. Phycol., 21, 347–357, 1985.
Brzezinski, M. A., Phillips, D. R., Chavez, F. P., Friederich, G. E., and Dugdale, R. C.: Silica production in the Monterey, California, upwelling system, Limnol. Oceanogr., 42, 1694–1705, 1997.
Brzezinski, M. A., Nelson, D. M., Franck, V. M., and Sigmon, D. E.: Silicon dynamics within an intense open-ocean diatom bloom in the Pacific sector of the Southern Ocean, Deep-Sea Res. Pt. II, 48, 3997–4018, 2001.
Brzezinski, M. A., Pride, C. J., Franck, V. M., Sigman, D. M., Sarmiento, J. L., Matsumoto, K., Gruber, N., Rau, G. H., and Coale, K. H.: A switch from Si(OH)4 to depletion in the glacial Southern Ocean, Geophys. Res. Lett., 29, https://doi.org/10.1029/2001GL014349, 2002.
Clementson, L. A. and Wayte, S. E.: The effect of frozen storage of open-ocean seawater samples on the concentration of dissolved phosphate and nitrate, Water Res., 26, 1171–1176, 1992.
Degerlund, M. and Eilertsen, H. C.: Main species characteristics of phytoplankton spring blooms in NE Atlantic and Arctic waters (68–80 N), Estuar. Coast., 33, 242–269, 2010.
DeMaster, D. J.: The accumulation and cycling of biogenic silica in the Southern Ocean: revisiting the marine silica budget, Deep-Sea Res. Pt. II, 49, 3155–3167, 2002.
Dugdale, R. C., Wilkerson, F. P., and Minas, H. J.: The role of a silicate pump in driving new production, Deep-Sea Res. Pt. II, 42, 697–719, 1995.
Egge, J. and Aksnes, D.: Silicate as regulating nutrient in phytoplankton competition, Mar. Ecol. Prog. Ser., Oldendorf, 83, 281–289, 1992.
Fripiat, F., Leblanc, K., Elskens, M., Cavagna, A.-J., Armand, L., André, L., Dehairs, F., and Cardinal, D.: Efficient silicon recycling in summer in both the Polar Frontal and Subantarctic Zones of the Southern Ocean, Mar. Ecol. Prog. Ser., 435, 47–61, 2011.
Hátún, H., Azetsu-Scott, K., Somavilla, R., Rey, F., Johnson, C., Mathis, M., Mikolajewicz, U., Coupel, P., Tremblay, J.-É., and Hartman, S.: The subpolar gyre regulates silicate concentrations in the North Atlantic, Sci. Rep.-UK, 7, 14576, https://doi.org/10.1038/s41598-017-14837-4, 2017.
Heiskanen, A.-S. and Keck, A.: Distribution and sinking rates of phytoplankton, detritus, and particulate biogenic silica in the Laptev Sea and Lena River (Arctic Siberia), Mar. Chem., 53, 229–245, 1996.
Hodal, H., Falk-Petersen, S., Hop, H., Kristiansen, S., and Reigstad, M.: Spring bloom dynamics in Kongsfjorden, Svalbard: nutrients, phytoplankton, protozoans and primary production, Polar Biol., 35, 191–203, 2012.
Holding, J., Duarte, C., Sanz-Martín, M., Mesa, E., Arrieta, J., Chierici, M., Hendriks, I., García-Corral, L., Regaudie-de-Gioux, A., and Delgado, A.: Temperature dependence of CO2-enhanced primary production in the European Arctic Ocean, Nat. Clim. Change, 5, 1079–1082, 2015.
Holm-Hansen, O. and Riemann, B.: Chlorophyll a determination: improvements in methodology, Oikos, 30, 438–447, 1978.
Hoppe, C., Schuback, N., Semeniuk, D., Giesbrecht, K., Mol, J., Thomas, H., Maldonado, M., Rost, B., Varela, D., and Tortell, P.: Resistance of Arctic phytoplankton to ocean acidification and enhanced irradiance, Polar Biol., 41, 399–413, 2018.
Hulth, S., Hall, P. O., Landén, A., and Blackburn, T.: Arctic sediments (Svalbard): pore water and solid phase distributions of C, N, P and Si, Polar Biol., 16, 447–462, 1996.
Krause, J. W., Nelson, D. M., and Lomas, M. W.: Biogeochemical responses to late-winter storms in the Sargasso Sea, II: Increased rates of biogenic silica production and export, Deep-Sea Res. Pt. I, 56, 861–874, https://doi.org/10.1016/j.dsr.2009.01.002, 2009.
Krause, J. W., Brzezinski, M. A., and Jones, J. L.: Application of low level beta counting of 32Si for the measurement of silica production rates in aquatic environments, Mar. Chem., 127, 40–47, https://doi.org/10.1016/j.marchem.2011.07.001, 2011.
Krause, J. W., Brzezinski, M. A., Villareal, T. A., and Wilson, C.: Increased kinetic efficiency for silicic acid uptake as a driver of summer diatom blooms in the North Pacific Subtropical Gyre, Limnol. Oceanogr., 57, 1084–1098, https://doi.org/10.4319/lo.2012.57.4.1084, 2012.
Krause, J. W., Brzezinski, M. A., Villareal, T. A., and Wilson, C.: Biogenic silica cycling during summer phytoplankton blooms in the North Pacific subtropical gyre, Deep-Sea Res. Pt. I, 71, 49–60, https://doi.org/10.1016/j.dsr.2012.09.002, 2013.
Kristiansen, S., Farbrot, T., and Naustvoll, L. J.: Production of biogenic silica by spring diatoms, Limnol. Oceanogr., 45, 472–478, 2000.
Kristiansen, S., Farbrot, T., and Naustvoll, L.-J.: Spring bloom nutrient dynamics in the Oslofjord, Mar. Ecol. Prog. Ser., 219, 41–49, 2001.
Lalande, C., Bauerfeind, E., Nöthig, E.-M., and Beszczynska-Möller, A.: Impact of a warm anomaly on export fluxes of biogenic matter in the eastern Fram Strait, Prog. Oceanogr., 109, 70–77, 2013.
Lalande, C., Moriceau, B., Leynaert, A., and Morata, N.: Spatial and temporal variability in export fluxes of biogenic matter in Kongsfjorden, Polar Biol., 39, 1725–1738, 2016.
Lasternas, S. and Agustí, S.: Phytoplankton community structure during the record Arctic ice-melting of summer 2007, Polar Biol., 33, 1709–1717, 2010.
Leynaert, A., Nelson, D. M., Queguiner, B., and Tréguer, P.: The silica cycle in the Antarctic Ocean: Is the Weddell Sea atypical?, Mar. Ecol. Prog. Ser., 96, 1–15, 1993.
Li, W. K., McLaughlin, F. A., Lovejoy, C., and Carmack, E. C.: Smallest algae thrive as the Arctic Ocean freshens, Science, 326, 539–539, 2009.
Lomas, M. and Krause, J.: Elemental Quotas and Stoichiometry of Polar Diatoms, United States, Antarctica, Baffin Bay, and Norway, 2016–2018, Arctic Data Center, available at: https://arcticdata.io/, last access: 29 October 2018.
Lomas, M. W., Moran, S. B., Casey, J. R., Bell, D. W., Tiahlo, M., Whitefield, J., Kelly, R. P., Mathis, J. T., and Cokelet, E. D.: Spatial and seasonal variability of primary production on the Eastern Bering Sea shelf, Deep-Sea Res. Pt. II, 65–70, 126–140, https://doi.org/10.1016/j.dsr2.2012.02.010, 2012.
Macdonald, R. W., McLaughlin, F. A., and Wong, C. S.: The storage of reactive silicate samples by freezing, Limnol. Oceanogr., 31, 1139–1142, 1986.
Martin-Jézéquel, V., Hildebrand, M., and Brzezinski, M. A.: Silicon metabolism in diatoms: Implications for growth, J. Phycol., 36, 821–840, 2000.
McNair, H. M., Brzezinski, M. A., and Krause, J. W.: Diatom populations in an upwelling environment decrease silica content to avoid growth limitation, Environ. Microbiol., https://doi.org/10.1111/1462-2920.14431, 2018.
Nelson, D. M. and Gordon, L. I.: Production and Pelagic Dissolution of Biogenic Silica in the Southern Ocean, Geochim. Cosmochim. Ac., 46, 491–501, 1982.
Nöthig, E.-M., Bracher, A., Engel, A., Metfies, K., Niehoff, B., Peeken, I., Bauerfeind, E., Cherkasheva, A., Gäbler-Schwarz, S., and Hardge, K.: Summertime plankton ecology in Fram Strait-a compilation of long-and short-term observations, Polar Res., 34, 1, https://doi.org/10.3402/polar.v34.23349, 2015.
Oziel, L., Neukermans, G., Ardyna, M., Lancelot, C., Tison, J. L., Wassmann, P., Sirven, J., Ruiz-Pino, D., and Gascard, J.-C.: Role for Atlantic inflows and sea ice loss on shifting phytoplankton blooms in the Barents Sea, J. Geophys. Res.-Oceans, 122, 5121–5139, 2017.
Paasche, E.: Silicon and the Ecology of Marine Plankton Diatoms. I. Thalassiosira pseudonana (Cyclotella nana) Grown in a Chemostat with Silicate as Limiting Nutrient, Marine Biol., 19, 117–126, 1973.
Paasche, E.: Growth of the plankton diatom Thalassiosira nordenskioeldii Cleve at low silicate concentrations, J. Exp. Mar. Biol. Ecol., 18, 173–183, 1975.
Paasche, E. and Ostergren, I.: The annual cycle of plankton diatom growth and silica production in the inner Oslofjord, Limnol. Oceanogr., 25, 481–494, 1980.
Rat'kova, T. N. and Wassmann, P.: Seasonal variation and spatial distribution of phyto-and protozooplankton in the central Barents Sea, J. Marine Syst., 38, 47–75, 2002.
Reigstad, M., Wassmann, P., Riser, C. W., Øygarden, S., and Rey, F.: Variations in hydrography, nutrients and chlorophyll a in the marginal ice-zone and the central Barents Sea, J. Marine Syst., 38, 9–29, 2002.
Rey, F.: Declining silicate concentrations in the Norwegian and Barents Seas, ICES J. Marine Sci., 69, 208–212, 2012.
Rey, F., Skjoldal, H. R., and Hassel, A.: Seasonal development of plankton in the Barents Sea: a conceptual model, ICES Symposium 56, Santander, Spain, 1987.
Sakshaug, E.: Primary and secondary production in the Arctic Seas, in: The organic carbon cycle in the Arctic Ocean, Springer, Berlin, Heidelberg, 57–81, 2004.
Schourup-Kristensen, V., Wekerle, C., Wolf-Gladrow, D. A., and Völker, C.: Arctic Ocean biogeochemistry in the high resolution FESOM 1.4-REcoM2 model, Prog. Oceanogr., 168, 65–81, https://doi.org/10.1016/j.pocean.2018.09.006, 2018.
Slagstad, D. and Støle-Hansen, K.: Dynamics of plankton growth in the Barents Sea: model studies, Polar Res., 10, 173–186, 1991.
Steemann Nielsen, E.: The use of radio-active carbon (C14) for measuring organic production in the sea, Journal de Conseil, 18, 117–140, 1952.
Takeda, S.: Influence of iron availability on nutrient consumption ratio of diatoms in oceanic waters, Nature, 393, 774–777, 1998.
Tréguer, P. J. and De La Rocha, C. L.: The World Ocean Silica Cycle, Annu. Rev. Marine Sci., 5, 477–501, 2013.
Tréguer, P., Bowler, C., Moriceau, B., Dutkiewicz, S., Gehlen, M., Aumont, O., Bittner, L., Dugdale, R., Finkel, Z., and Iudicone, D.: Influence of diatom diversity on the ocean biological carbon pump, Nat. Geosci., 11, 27–37, 2018.
Tremblay, J.-É. and Gagnon, J.: The effects of irradiance and nutrient supply on the productivity of Arctic waters: a perspective on climate change, in: Influence of climate change on the changing Arctic and sub-Arctic conditions, Springer, Dordrecht, 73–93, 2009.
Tremblay, J.-E., Gratton, Y., Fauchot, J., and Price, N. M.: Climatic and oceanic forcing of new, net, and diatom production in the North Water, Deep-Sea Res. Pt. II, 49, 4927–4946, 2002.
Tsuji, T. and Yanagita, T.: Improved fluorescent microscopy for measuring the standing stock of phytoplankton including fragile components, Mar. Biol., 64, 207–211, 1981.
Utermöhl, H.: Zur Vervollkommung der quantitativen phytoplankton-methodik, Mitteilungen Internationale Vereinigung für Theoretische und Angewandte Limnologie, 9, 38, 1958.
Vaquer-Sunyer, R., Duarte, C. M., Holding, J., Regaudie-de-Gioux, A., García-Corral, L. S., Reigstad, M., and Wassmann, P.: Seasonal patterns in Arctic planktonic metabolism (Fram Strait – Svalbard region), Biogeosciences, 10, 1451–1469, https://doi.org/10.5194/bg-10-1451-2013, 2013.
Varela, D. E., Crawford, D. W., Wrohan, I. A., Wyatt, S. N., and Carmack, E. C.: Pelagic primary productivity and upper ocean nutrient dynamics across Subarctic and Arctic Seas, J. Geophys. Res.-Oceans, 118, 7132–7152, 2013.
Wassmann, P., Ratkova, T., Andreassen, I., Vernet, M., Pedersen, G., and Rey, F.: Spring bloom development in the marginal ice zone and the central Barents Sea, Mar. Ecol., 20, 321–346, 1999.
Wassmann, P., Slagstad, D., Riser, C. W., and Reigstad, M.: Modelling the ecosystem dynamics of the Barents Sea including the marginal ice zone: II. Carbon flux and interannual variability, J. Marine Syst., 59, 1–24, 2006.
Wassmann, P., Slagstad, D., and Ellingsen, I.: Primary production and climatic variability in the European sector of the Arctic Ocean prior to 2007: preliminary results, Polar Biol., 33, 1641–1650, 2010.
Wexels Riser, C., Wassmann, P., Olli, K., Pasternak, A., and Arashkevich, E.: Seasonal variation in production, retention and export of zooplankton faecal pellets in the marginal ice zone and central Barents Sea, J. Marine Syst., 38, 175–188, 2002.
Wiedmann, I., Reigstad, M., Sundfjord, A., and Basedow, S.: Potential drivers of sinking particle's size spectra and vertical flux of particulate organic carbon (POC): Turbulence, phytoplankton, and zooplankton, J. Geophys. Res.-Oceans, 119, 6900–6917, 2014.