the Creative Commons Attribution 4.0 License.
the Creative Commons Attribution 4.0 License.
 | 08 Nov 2018
Impacts of temperature and soil characteristics on methane production and oxidation in Arctic tundra
Jianqiu Zheng
Taniya RoyChowdhury
Ziming Yang
Baohua Gu
Stan D. Wullschleger
Rapid warming of Arctic ecosystems accelerates microbial decomposition of soil organic matter and leads to increased production of carbon dioxide (CO2) and methane (CH4). CH4 oxidation potentially mitigates CH4 emissions from permafrost regions, but it is still highly uncertain whether soils in high-latitude ecosystems will function as a net source or sink for CH4 in response to rising temperature and associated hydrological changes. We investigated CH4 production and oxidation potential in permafrost-affected soils from degraded ice-wedge polygons on the Barrow Environmental Observatory, Utqiaġvik (Barrow), Alaska, USA. Frozen soil cores from flat and high-centered polygons were sectioned into organic, transitional, and permafrost layers, and incubated at −2, +4 and +8 ∘C to determine potential CH4 production and oxidation rates. Significant CH4 production was only observed from the suboxic transition layer and permafrost of flat-centered polygon soil. These two soil sections also exhibited highest CH4 oxidation potentials. Organic soils from relatively dry surface layers had the lowest CH4 oxidation potential compared to saturated transition layer and permafrost, contradicting our original assumptions. Low methanogenesis rates are due to low overall microbial activities measured as total anaerobic respiration and the competing iron-reduction process. Our results suggest that CH4 oxidation could offset CH4 production and limit surface CH4 emissions, in response to elevated temperature, and thus must be considered in model predictions of net CH4 fluxes in Arctic polygonal tundra. Future changes in temperature and soil saturation conditions are likely to divert electron flow to alternative electron acceptors and significantly alter CH4 production, which should also be considered in CH4 models.
- Article
(1337 KB) - Full-text XML
-
Supplement
(281 KB) - BibTeX
- EndNote


This manuscript has been authored by UT-Battelle, LLC under Contract No. DE-AC05-00OR22725 with the U.S. Department of Energy. The United States Government retains and the publisher, by accepting the article for publication, acknowledges that the United States Government retains a non-exclusive, paid-up, irrevocable, world-wide license to publish or reproduce the published form of this manuscript, or allow others to do so, for United States Government purposes. The Department of Energy will provide public access to these results of federally sponsored research in accordance with the DOE Public Access Plan (http://energy.gov/downloads/doe-public-access-plan).
Arctic ecosystems store vast amounts of organic carbon in active layer soils and permafrost (Hugelius et al., 2014; Shiklomanov et al., 2010). Rising temperatures, increased annual thaw depth, and a prolonged thaw season accelerate microbial degradation of this carbon reservoir (Shiklomanov et al., 2010; Schuur et al., 2015; Schuur et al., 2013). The potential carbon loss due to these direct effects is estimated to be 92±17 Pg carbon over the coming century (Schuur et al., 2015). The extent of soil organic matter (SOM) decomposition and partitioning between CO2 and CH4 emissions highly depend upon soil saturation conditions. Thawing of ground ice and ice-wedge degradation cause ground subsidence and significant changes in soil water saturation (Liljedahl et al., 2016) generating heterogeneous surface CH4 fluxes (Schädel et al., 2016), with a current estimate of net CH4 exchange from tundra to the atmosphere ranging widely from 8 to 29 Tg C yr−1 (McGuire et al., 2012). Understanding the factors that control CH4 fluxes is key to reducing model uncertainties and predicting future climate feedbacks.
The unique polygonal ground in Arctic coastal plain tundra creates natural gradients in hydrology, snow pack depth and density, and soil organic carbon storage (SOC) that control CH4 fluxes (Liljedahl et al., 2016; Lara et al., 2015). Thermal contraction processes create cracks in the tundra soil, which can fill with water that freezes to produce massive ground ice (French, 2007). This ice forms wedges that create the borders of three dominant polygon types, defined by their surface relief and subsurface hydrology: low-centered polygons (LCPs), flat-centered polygons (FCPs), and high-centered polygons (HCPs) (MacKay, 2000). Poorly drained LCPs are characterized by wet centers bordered by raised, relatively dry rims and wet troughs. FCPs lack the rims of LCPs and are drier (Wainwright et al., 2015). When ice wedges erode and water drains from the polygons, troughs subside and rims disappear to form drier HCPs. Methane emissions from wet and inundated LCP sites were 1–2 orders of magnitude larger than emissions from drier FCP and HCP sites (Vaughn et al., 2016; Sachs et al., 2010). Although a number of factors – including vegetation height and plant composition (von Fischer et al., 2010), soil inundation (Sturtevant et al., 2012), thaw depth (Sturtevant and Oechel, 2013; Grant et al., 2017), and season (Chang et al., 2014) – were suggested as explanatory factors for CH4 flux variations, the 100-fold difference in CH4 flux between polygon types could not be fully explained by variations in moisture or temperature (Sachs et al., 2010; Vaughn et al., 2016). Measurements of dissolved CH4 concentrations in soil pore waters suggested a huge disconnect between > 100 µM concentrations of dissolved CH4 in the active layer below 20 cm and negligible dissolved CH4 at 10 cm soil depth (∼1 µM). This CH4 gradient is particularly steep in FCPs. δ13C-CH4 data suggested CH4 oxidation played an important role in mitigating CH4 in soil pore water and limiting surface CH4 emissions (Vaughn et al., 2016). However, CH4 oxidation potential is rarely studied in permafrost-affected soils. Therefore, we investigated CH4 cycling in FCP soil for this study.
Methane oxidation mitigates terrestrial CH4 emission. Up to 90 % of CH4 produced in the soil is consumed in the upper dry layers of soil by aerobic CH4 oxidizing bacteria (methanotrophs) before reaching the atmosphere (Le Mer and Roger, 2001). Methane oxidation rates are usually greatest in oxic, surficial soils, although methane oxidation is known to occur under oxygen-limiting conditions as well (Roslev and King, 1996). In the classical model of CH4 oxidation profiles, there is usually a vertical gradient of decreasing O2 concentration in the top centimeters of the soil column that is inversely correlated with an increasing gradient of CH4 through the suboxic/anoxic active layer. Methanogens are relatively abundant in the deeper layer where oxygen is limiting (Lee et al., 2015; Kim and Liesack, 2015). Methane oxidation potential in wetlands and peat bogs is highest near the water table, while most CH4 is produced below the water table (Whalen and Reeburgh, 2000). In contrast, methanogenic and methanotrophic communities can overlap in the rhizosphere (Liebner et al., 2012; Knoblauch et al., 2015), where roots or Sphagnum create an oxic/anoxic interface providing a substantial amount of oxygen for methanotrophs (Laanbroek, 2010; Parmentier et al., 2011) and organic acid substrates for methanogenesis.
Soil CH4 fluxes result from the net effect of microbial CH4 production and oxidation, coupled with transport processes. The rates of CH4 oxidation are mainly governed by the abundance and composition of methanotrophic microbial communities and environmental factors including CH4 and O2 availability, soil air-filled porosity, and soil-water content (Preuss et al., 2013). Previous studies of boreal lakes and wetlands showed that CH4 production is more sensitive to temperature changes than CH4 oxidation, as CH4 oxidation rates respond more strongly to CH4 availability than temperature increase (Liikanen et al., 2002; Segers, 1998). Soils at the Barrow Environmental Observatory in Utqiaġvik (Barrow), Alaska, experience a wide range of arctic temperatures, from −20 to +4 ∘C (Shiklomanov et al., 2010). Soil respiration and methanogenesis continue at low temperatures close to 0 ∘C, even after the soil surface freezes trapping gas under ice. Therefore, substantial annual CH4 and CO2 emissions from the Alaskan Arctic occur during the spring thaw (Commane et al., 2017; Raz-Yaseef et al., 2017; Zona et al., 2016). However, it is unclear how accelerated warming in Arctic soils affects the opposing processes of CH4 production and oxidation due to their nonlinear response to temperature changes (Treat et al., 2015).
In this study, we investigated the rates and temperature sensitivities of CH4 production and oxidation from permafrost-affected soils in Utqiaġvik (Barrow), Alaska. Although various studies have identified significant and frequently correlated factors affecting CH4 and CO2 production in permafrost ecosystems upon thawing, the oxidation of CH4 is not considered in most incubation studies (Treat et al., 2015). Here we used the natural geomorphic gradient of FCP and HCP soils to represent degraded polygon tundra soils with relatively oxic active layers that will potentially act as CH4 sinks. Methane production and oxidation assays were performed separately using anoxic or oxic incubations at three temperatures. We also measured additional mechanisms influencing CH4 production, including accumulation of organic acids and competing anaerobic respiration through iron reduction (Lipson et al., 2010). Specifically, we tested the following hypotheses regarding CH4 dynamics in FCP and HCP soils: (I) CH4 production is localized in the more reduced subsurface while CH4 oxidation occurs at the soil surface; (II) CH4 production is more sensitive to temperature increase than CH4 oxidation and will likely exceed CH4 oxidation in wet areas in response to warming.
2.1 Site description and soil sampling
The study site is located at the Barrow Environmental Observatory (BEO), Utqiaġvik (Barrow), Alaska, as part of the intensive study site areas B (high-centered polygon, HCP) and C (flat-centered polygon, FCP) of the Next Generation Ecosystem Experiments in the Arctic project. The centers of HCPs in area B were covered by lichens, moss, and dry tundra graminoids, while centers of FCPs in area C hosted wet tundra graminoids, mosses, and bare ground (Langford et al., 2016). Intact frozen soil cores from the centers of a water-saturated FCP (71∘16.791′ N, 156∘35.990′ W) and a well-drained HCP (71∘16.757′ N, 156∘36.288′ W) were collected with a modified SIPRE auger containing a sterilized liner (3 in. inner diameter), driven by a hydraulic drill during a field campaign in April 2012 (Herndon et al., 2015a, b; Roy Chowdhury et al., 2015). All samples were kept frozen during core retrieval, storage, and shipment to Oak Ridge National Laboratory (Oak Ridge, TN, USA). The frozen cores were stored at −20 ∘C until processing. The thaw depth measured in September 2012 in the HCP center was 40 cm, and thaw depths in the FCP varied from 41 to 47 cm.
The frozen soil cores were inspected and processed inside an anaerobic chamber (Coy Laboratory Products, MI, USA; H2 ≤ 2 % and O2 < 1 ppm). Both cores were sectioned into 10 cm segments, and each segment was inspected for evidences of roots and undecomposed organic matter. Soil Munsell color was recorded to qualitatively infer redoximorphic conditions. The soil core collected from the FCP center showed evidence of buried and discontinuous organic matter at approximately 50 cm depth, below the active, organic layer and above the permafrost. This transition layer was attributed to episodic thawing and cryoturbation (Schuur et al., 2008; Bockheim, 2007). Soil geochemical properties were measured for each 10 cm segment to assess soil geochemical depth profiles. Specifically, we measured soil gravimetric water content and soil pH, using the 1:2 soil slurry method within 1 M KCl. Fe(II) concentrations were measured to characterize redox conditions in the soil segments. Briefly, a soil subsample (∼2 g) was extracted with 0.1 M KCl solution for 30 min in an anaerobic chamber. The extracts were filtered with 2 µm syringe filters and analyzed immediately using the colorimetric 1,10-phenanthroline method (Hach method 8146). Absorbance was determined at 510 nm using a DU 800 spectrophotometer (Beckman Coulter, CA, USA).
2.2 Soil pore water gas measurements
Dissolved gas (CO2 and CH4) concentrations in soil pore water were determined at each 10 cm depth interval from the FCP and HCP cores. A 1:1 (w:v) soil slurry was prepared by mixing 10 g wet soil in 10 mL deionized and degassed water under anoxic conditions inside an anaerobic chamber. The samples were then placed in 15 mL crimp-sealed serum vials (Wheaton, NJ, USA). Vials were inverted and shaken at 4 ∘C for 12 h to allow for exchange between the dissolved and soil gas phases. Then, ∼5 mL of the aqueous phase was exchanged with Ar (99.9 % purity) using a gastight syringe (Hamilton, NV, USA), and samples were manually shaken vigorously for 5 min to allow for equilibration between the aqueous and gas phases. Subsequently, a 500 µL headspace sample was drawn and immediately analyzed with an SRI 8610C gas chromatograph using the method previously described (Roy Chowdhury et al., 2015). The detection limit for CH4 was 1 ppmv. Concentrations of CH4 and CO2 were corrected for dissolved gases based on temperature and pH-dependent Henry's law constants (Sander, 2015).
2.3 Low temperature respiration experiments
To investigate the temperature response of CH4 production and overall organic carbon mineralization rates, samples of FCP and HCP soil cores were incubated at −2, +4, or +8 ∘C for approximately 90 days. Based on measured geochemical similarities, core segments were combined to represent the organic layer that comprises most of the active layer, transition layer (only present in FCP), and permafrost. Soils from each layer were homogenized inside an anaerobic chamber using sterile tools and equipment to establish microcosms (Roy Chowdhury et al., 2015). Our homogenization method using an oscillating power tool inside a glove box disrupts large, frozen soil clumps and removes gravel or litter, allowing us to place representative soil samples inside the serum vials. This method does not affect the soil microaggregate structure or expose the samples to oxidation, drying, or significant warming that could disrupt anaerobic microbial processes. Gases for the microcosm headspaces were selected based on gravimetric water contents and concentrations of reduced Fe(II) (Howeler and Bouldin, 1971) to best represent field conditions. Thus, organic layer soils from both FCP and HCP cores were incubated under air, while the transition layer and permafrost of FCP and HCP cores were incubated under anoxic conditions with N2 headspaces. All vials were sealed with butyl rubber septa and crimp sealed to prevent evaporation and gas exchange. Anoxic microcosms were flushed with N2 three times after sealing to remove residual H2 and O2 from the headspace. It is important to note that at −2 ∘C soil water remained unfrozen in these samples due to freezing point depression (Romanovsky and Osterkamp, 2000).
A subsample of the combined, homogenized soil (∼10 g) was placed in a sterile 70 mL serum bottle sealed with a blue butyl stopper and aluminum crimp seal to form a soil microcosm. For each homogenized soil layer, nine replicate microcosms were constructed at each incubation temperature (Fig. 1). Headspace CO2 and CH4 concentrations were measured at 2- to 15-day intervals using gas chromatography (see Sect. 2.2). After 5, 10, or 20 days of incubation, three replicated microcosms were destructively sampled for methane oxidation assays (see Sect. 2.4 and Fig. 1) and additional soil geochemical analysis (Zheng et al., 2017).
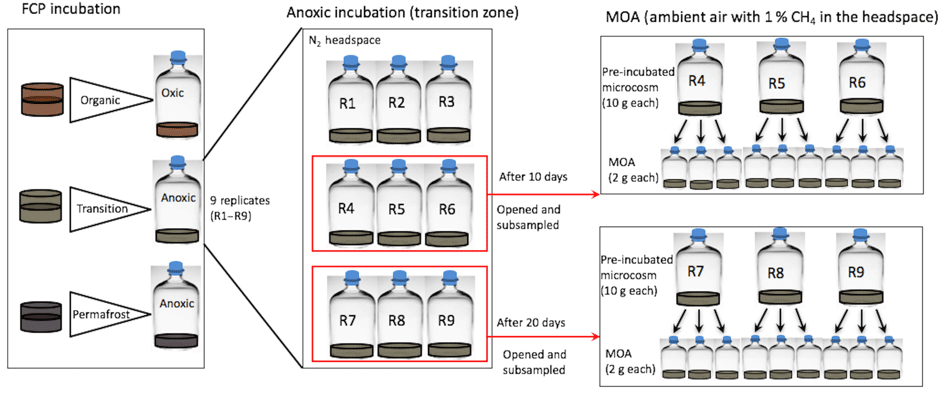
Figure 1Soil incubation and methane oxidation assay (MOA) experimental design. Soils from the transitional layer of a FCP core were used here to illustrate how incubations and MOAs were constructed at a given temperature. Incubation replicates were destructively sampled after 10 or 20 days to set up MOA with pre-incubated soils. For example, nine replicate microcosms were created for the FCP transition-layer soil, incubated under anoxic conditions. CO2 and CH4 in the headspace were cumulatively measured. After 10 days, three were opened and subsampled for triplicate MOAs. After 20 days, another three were opened and subsampled for triplicate MOAs.
Subsamples from microcosms opened after 10, 20, and 90 days incubation time were further processed for analysis of pH, Fe(II), and total organic acids. The pH and Fe(II) concentrations were measured as described in Sect. 2.1. Iron reduction rates were estimated by the changes in measured Fe(II) concentration. Organic acids were analyzed using NH4HCO3 extracts. Briefly, NH4HCO3 extractions (12 h) were centrifuged for 15 min at 6500 g, then the supernatants were filtered through 0.2 µm membrane filters before analysis. Filtered samples were analyzed for low-molecular-weight organic acids using a Dionex ICS-5000+ system (Thermo Fisher Scientific, MA, USA) equipped with an IonPac AS11-HC column with a KOH mobile phase. Total organic acid concentrations (TOA) were calculated by summing molar C equivalents for each measured species, normalized per gram of dry soil.
2.4 Methane oxidation potential assay
Soil samples were incubated in oxic conditions supplemented with ample CH4 substrate to measure CH4 oxidation potential (Roy Chowdhury et al., 2014). Methanogenesis is expected to be negligible under these oxic conditions. The methane oxidation assays (MOAs) were constructed using both freshly thawed (labeled as 0 day) and pre-incubated (labeled as various days of pre-incubation) samples to account for potential delays in the overall microbial activities (Fig. 1). Replicated samples (about 2 g) were slurried in a 1:1 (w:v) ratio with autoclaved deionized water in 26 mL serum bottles under ambient conditions. A 1 % CH4 headspace was introduced into each crimp-sealed bottle by replacing 0.23 mL of headspace with 99.99 % CH4 (Scott, Air Liquide). For freshly thawed samples, nine replicates were constructed for each incubation temperature and each soil layer. For pre-incubated samples at the designated sampling day, three replicated incubations (∼10 g per sample) were destructively sampled to construct nine replicates of MOAs to incubate at the same incubation temperature they were pre-incubated (Fig. 1). Due to the limited number of shaking incubators, only the 4 ∘C MOA from FCP and 8 ∘C MOA from HCP were shaken to minimize potential gas–liquid phase transfer limitations. Headspace CO2 and CH4 concentrations in MOAs were measured at 2- to 15-day time intervals using gas chromatography (Sect. 2.2).
2.5 Rate estimation, temperature sensitivity, and statistical analyses
Concentrations of CH4 and CO2 from soil microcosms were fitted with hyperbolic, sigmoidal, or linear functions (Roy Chowdhury et al., 2015). Rates of CO2 production were calculated using derivatives of the best curve-fitting equations with parameters listed in Supplement Table S3. Methane oxidation rates were calculated from the loss of headspace CH4, which were best fitted with simple linear regression. All rate calculations are reported on per gram soil dry weight basis (denoted dwt in figures). The temperature dependence was calculated using the conventional Q10 relationship by taking the ratio of maximum production or oxidation rates at 8 and −2 ∘C based on triplicate measurements.
Changes in soil physicochemical properties were evaluated with one-way ANOVA, Tukey's honest significant difference (HSD) test. The effect of soil layers (organic, transition layer, and permafrost) and incubation temperature (−2, 4, and 8 ∘C) were examined with Tukey's HSD test. All curve fittings and statistical analyses are performed with R 3.4.0 (The R Foundation for Statistical Computing) and validated with Prism (GraphPad Software, ver. 7.0a).
2.6 Calculation of net CH4 emission
To evaluate the net result of CH4 production and oxidation and how this result changes in response to temperature increase, we applied a simplified model simulation. Representation of the CH4 oxidation rate (Roxi) is based on Michaelis–Menten kinetics with linear dependence on the biomass of methanotrophs (Xu et al., 2015), while the CH4 production rate (Rpro) is calculated from measurements directly
where Bmethanotrophs and Bmethanogens represent the estimated biomass of methanotrophs and methanogens, respectively. and are the half-saturation coefficients (mM) with respect to CH4 and O2 concentrations, respectively. Values of and vary within different models. We started with and (Riley et al., 2011) and further applied a wide uncertainty range of 0.0005–0.05 and 0.002–0.2, respectively. The maximum CH4 oxidation rate Vmax, oxi and CH4 production rate Vmeasure, pro were obtained from the incubations. Initial CH4 and O2 concentrations were calculated from soil pore water dissolved gas measurement and soil air-filled porosity estimations. With the above parameters, we estimated the biomass ratio of methanogens to methanotrophs (Bmethanogens∕Bmethanotrophs) under both net CH4 production and net CH4 oxidation scenarios, and further evaluated how the biomass ratio would change in response to rising temperature to keep the soil as a net source or sink of CH4.
3.1 Soil attributes and pore water characteristics
Soil cores from FCP and HCP center positions showed distinct vertical profiles of soil moisture expressed as gravimetric water content (g g−1 dry soil). The soil core from FCP was characterized by a wet surface within the top 10 cm below ground, a much drier organic layer between 10 and 40 cm, and a bottom layer below 40 cm with significantly higher water content. In the HCP core, soil moisture gradually increased from the top to the bottom (Fig. 2). Soil bulk density (g cm−3) is negatively correlated with gravimetric water content in both FCP and HCP along the depth profile ( and , respectively). A similar water distribution has been recorded by continuous field measurements of volumetric water content at the nearby NGEE_BRW_C soil pit monitoring site (http://permafrostwatch.org, last access: 3 November 2018.). Fe(II) concentration showed a strong positive correlation with gravimetric water content in both FCP and HCP cores (R2=0.81 and R2=0.91, respectively). The soil pH in FCP increased steadily with soil depth (R2=0.95), with an average of 4.7. In the HCP soil core, soil pH varied by 1.5 pH units, with an average of 5.4. Overall, soil moisture, Fe(II) concentration, and pH increased with depth in the centers of both polygon types.
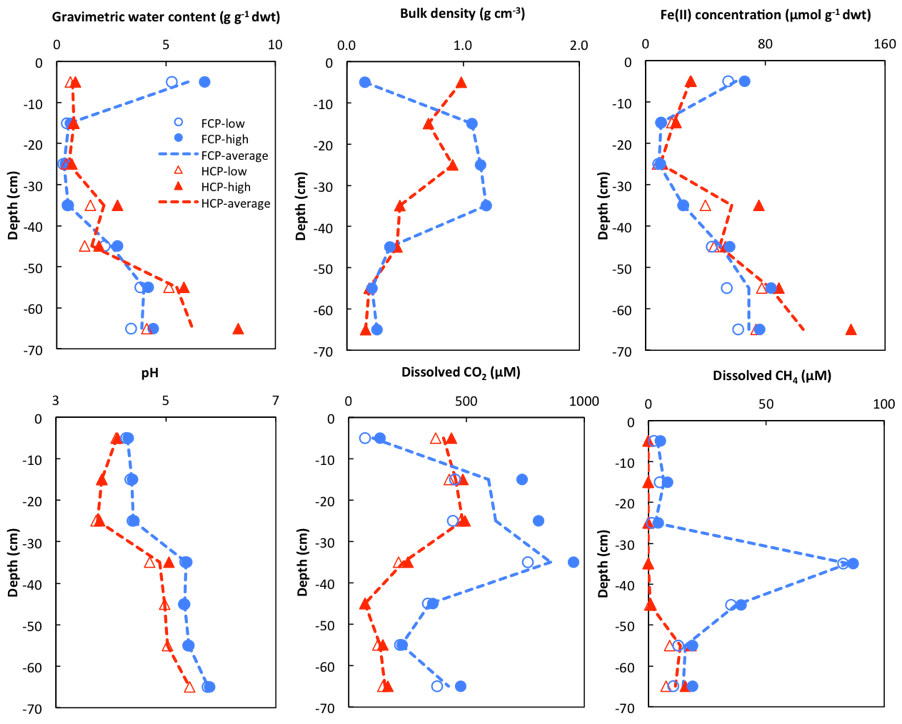
Figure 2Depth profile of gravimetric water content, bulk density, Fe(II) concentration, pH, and soil pore water dissolved CO2 and CH4 concentrations from FCP (blue) and HCP (red) cores. Replicate measurements were plotted as high and low values in each soil section as blue filled and empty circles (FCP) and red triangles (HCP). Trend lines were plotted based on the average values.
Dissolved CO2 in soil pore water showed a similar general trend in both FCP and HCP cores. The concentration of dissolved CO2 increased from 100 µM in the surface soil (0–10 cm) to approximately 950 µM at 30 to 40 cm depth in FCP, and it decreased below 40 cm. In HCP, approximately 400 µM dissolved CO2 was measured in the surface soil. The concentration was 400–500 µM in the top 30 cm and also decreased significantly below 40 cm. A strong correlation between dissolved CO2 concentration and soil bulk density was observed for both FCP and HCP (R2=0.91 and R2=0.85, respectively).
The highest dissolved CH4 concentration (about 85 µM) was found between 30 and 40 cm in soil pore water of FCP, approximately 10 times the CH4 concentration measured from the top 10 cm and 2–4 times higher than the CH4 concentration measured below 40 cm. In HCP, significant CH4 accumulation in soil pore water was found below 50 cm of the HCP core, while no dissolved CH4 was detected above 50 cm.
Soil cores of FCP and HCP were divided into organic, transitional, and permafrost layers to facilitate incubation setup. The top 10 cm of both cores contained mostly plant material, litter, and ice or snow: these sections contained little soil and were not studied further. The organic layers of FCP and HCP cores were both oxic, with low Fe(II) concentrations and minimal dissolved CH4 in soil pore water, while deeper layers were more reduced with 5- to 7-fold higher Fe(II) concentrations and more dissolved CH4 (Figs. 1 and S1). Measured total carbon and nitrogen content showed distinct patterns in FCP and HCP cores (Table S1). The total carbon content of the FCP permafrost (31 %) was nearly twice as large as the organic layer. The FCP transition layer contained much less carbon than the adjacent layers (20 % of FCP permafrost), leading to a low C∕N ratio of 16. For the HCP, the total carbon contents of organic and permafrost layers were 21 % and 17 %, respectively, significantly lower than that of the FCP permafrost. Inorganic carbon quantified as CO2 released upon acid treatment was less than 0.001 % for each layer of the FCP and HCP cores.
3.2 Temperature responses of CH4 production and oxidation
Thawed FCP and HCP soil samples were incubated in microcosms at fixed temperatures to assess methanogenesis rates. CH4 production was only observed in microcosms from the transition layer and permafrost of FCP, which were incubated under anoxic conditions. CH4 production started within 5 days after the anoxic incubations were set up (Fig. 3). Cumulative CH4 concentrations at all temperatures were best fitted with a linear model (Table S2). Soils from the transition layer yielded about 10 times more CH4 than permafrost at same incubation temperatures. Transition-soil showed a stronger temperature effect than permafrost. CH4 production rate increased by 1.6 and 3.1 times as the temperature increased from −2 to 4 and 8 ∘C, respectively. Measurements of CH4 concentrations in the headspace of HCP permafrost were mostly below the quantification limit of the gas chromatograph flame ionization detector (1 ppmv, Fig. S2 in the Supplement). Organic soils from both FCP and HCP were incubated with air to best represent the field condition, and methanogenesis was unlikely to occur under oxic conditions. Headspace O2 was not completely consumed after 90 days incubation (calculations not shown).
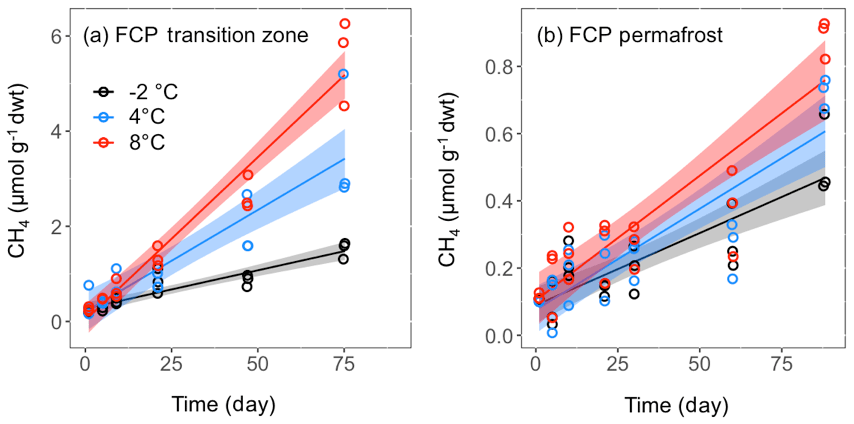
Figure 3CH4 production in soil microcosms from (a) transition layer, and (b) permafrost layers of FCP at indicated temperatures. The temporal profiles of CH4 production were best fitted with the linear regression model, and the shaded area represents the 95 % confidence interval.
Potential rates of aerobic CH4 oxidation were measured in freshly thawed and pre-incubated soils to minimize total microbial growth limitations. Pre-incubated soils showed much higher CH4 oxidation potential compared to corresponding freshly thawed soil in both FCP and HCP. In FCP soil, CH4 oxidation potentials measured in soils from the transition layer and permafrost were significantly higher than those measured in organic soils (Fig. 4a, b). Similarly, permafrost from HCP showed higher CH4 oxidation potentials than organic soils (Fig. 4c, d). Overall, CH4 oxidation rates in HCP soils were 80 %–90 % lower than rates from the equivalent FCP soil layers.
Rates of both CH4 production and oxidation responded positively to temperature increase (Fig. 5). In the transition layer of FCP, CH4 production showed much higher temperature sensitivity than CH4 oxidation from both freshly thawed and pre-incubated soils, with an estimated Q10 value of 4.1. The Q10 value of CH4 oxidation was 2.0 from freshly thawed soils and only 1.1 in pre-incubated soils. Similarly, the Q10 value for CH4 oxidation in permafrost also dropped from 1.7 in freshly thawed soils to 1.0 in pre-incubated soils. However, CH4 production in the permafrost responded slowly to temperature increase, with an estimated Q10 value of 1.7. Overall, permafrost showed significantly lower CH4 production rates than soils from the upper transition layer, and also had a much lower temperature sensitivity for CH4 production. However, the measured CH4 oxidation potentials were similar in both soils, with similar temperature responses.

Figure 4CH4 oxidation potential measured from soils incubated at the indicated temperatures from (a) FCP after 0 days, (b) FCP after 20 days, (c) HCP after 5 days, and (d) HCP after 10 days. Error bars indicate ±1 standard deviation from three replicate incubations.
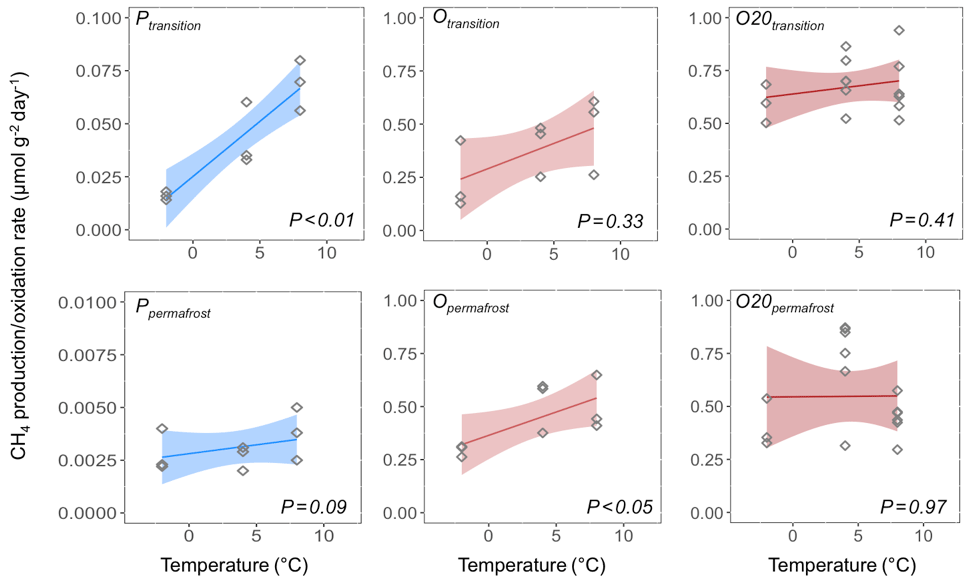
Figure 5Temperature sensitivity of CH4 production and oxidation measured from the transition and permafrost layers of FCPs. Temperature responses of CH4 oxidation rates from freshly thawed (Otransition and Opermafrost) and pre-incubated (O20transition and O20permafrost) soils were both estimated.
3.3 Soil respiration in response to rising temperature
Total soil respiration was evaluated using CO2 production to characterize the observed variation in CH4 production. Soils in all of the microcosm incubations produced CO2, by aerobic respiration under oxic conditions or by anaerobic respiration and fermentation under anoxic conditions. CO2 production started immediately in microcosms of FCP samples, including organic soils that were incubated under oxic conditions and soils from transition layer and permafrost samples that were incubated under anoxic conditions (Fig. 6). CO2 accumulation was best modeled by a hyperbolic function, except the organic layer soil incubated at −2 or +4 ∘C, where the best fit was a linear function (Table S3, Fig. 6). This exception is likely due to continuous aerobic respiration at lower temperatures, indicating that substrate limitation was not reached within 90 days. The transitional layer had the slowest CO2 production rates and least carbon loss via CO2, in contrast to its relatively high rate of methanogenesis.
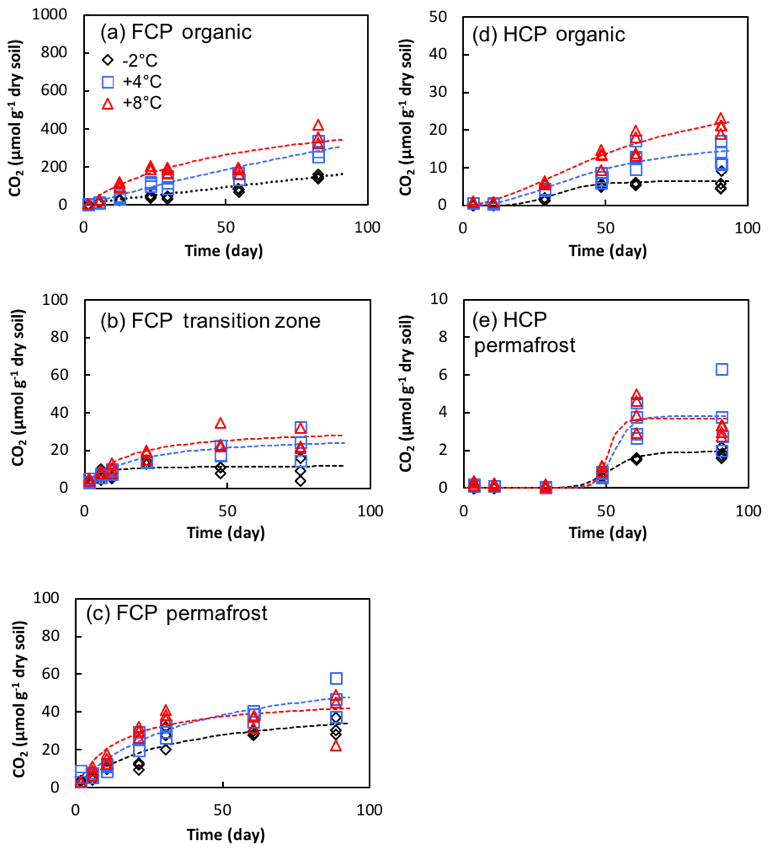
Figure 6Cumulative CO2 production in soil microcosms from FCP and HCP samples at indicated temperatures.
CO2 production in microcosms of HCP samples was significantly delayed with much lower production compared to FCP soils. The HCP cumulative CO2 production profiles were best fitted with a sigmoidal model, compared to the hyperbolic model that best fit FCP data (Table S3). A prolonged delay in CO2 accumulation was observed in both HCP organic and permafrost samples. CO2 production started about 10 days after the microcosm setup in the organic layer and reached a maximum rate at 30 days (+4 and +8 ∘C) or 75 days (−2 ∘C). The delay was longer in permafrost incubations, with a rapid increase after 40 to 50 days followed by a plateau. Therefore, microorganisms mineralized more carbon from FCP soils than HCP soils, and CO2 production began sooner in FCP than HCP soil incubations.
Temperature showed significant effects on CO2 production from the organic and transitional layers of FCP during 90-day incubations (p < 0.01 for each layer, Fig. 6). FCP soils incubated at +8 ∘C produced substantially more CO2 than those incubated at lower temperatures. In the permafrost layer of FCP, CO2 production was significantly higher at +8 ∘C compared to 2 ∘C (p < 0.05, ANOVA with Tukey's multiple comparisons test). Anaerobic CO2 production in FCP permafrost showed much higher temperature sensitivity than that from FCP transition layer (Q10=2.3–3.3 and 1.2–1.3, respectively, Table S4).
3.4 Organic acids production and iron reduction in FCP soils
Organic acids were produced as intermediate metabolites during microbial degradation of organic matter, and they probably fueled methanogenesis and iron reduction. Specific organic acids were analyzed from soil extracts from FCP transitional and permafrost layers (Table S5). The dominant organic acids included formate, acetate, propionate, butyrate, and oxalate, consistent with previous analyses from LCP soils (Herndon et al., 2015a). Trace amount of lactate, pyruvate, and succinate were detected, with concentrations less than 0.05 µmol g−1 soil. To compare the changes in organic acids over time, total organic carbon contained in formate, acetate, propionate, butyrate, and oxalate products was calculated (TOA, µmol C g−1; Fig. 7a, b). Concentrations of dominant organic acids measured in the permafrost were approximately 10 times higher than those measured in the transition layer. The difference could be partly explained by much lower SOC content (5.8 %) in the transitional layer than that in the permafrost (30.8 %). TOA increased by 23 %, 70 %, and 65 % at −2, 4, and 8 ∘C, respectively, in transitional soils during 90-day anoxic incubations. Permafrost initially contained a much higher concentration of organic acids, and TOA increased by a lower percentage, by 1 %, 15 %, and 25 % at −2, 4, and 8 ∘C, respectively.
Significant increases in Fe(II) concentrations were observed from anoxic incubations of FCP samples over the incubation period (Fig. 7c, d). In soils from the transition layer, Fe(II) concentrations stayed at a similar level during the first 20 days of anoxic incubation, and then increased significantly from ∼50 to ∼100 µmol g−1 between 20 and 90 days of incubation at −2, 4, and 8 ∘C. In the permafrost, the highest level of iron reduction within the first 20 days was observed in samples incubated at −2 ∘C. Between 20 and 90 days, the highest iron reduction rates were observed in samples incubated at 8 ∘C. The estimated Q10 values were 1.2 and 1.3 for transition layer and permafrost, respectively. If we assume that iron reduction is coupled to acetate oxidation to produce CO2, stoichiometric calculations suggest that iron reduction could account for 96 % and 70 % of CO2 produced in the transitional and permafrost layers at −2 ∘C. At 8 ∘C iron reduction could account for 74 % and 61 % of acetate oxidation in the transitional and permafrost layers.
The widespread ice-wedge degradation in the Arctic causes morphological succession and hydrological changes in tundra ecosystems (Liljedahl et al., 2016). FCP and HCP features represent successively more degraded polygons. Despite clear geomorphological differences between polygon types that affect drainage, vegetation, and snow cover, the frozen FCP and HCP organic layers share similar gravimetric water contents, pH, SOC, and Fe(II) concentrations. Permafrost from both polygons contains more water, dissolved CH4, and Fe(II) than organic layer soils indicating more reducing environments. Concentrations of CH4 measured in soil pore water from FCP and HCP cores increased with depth. These results are consistent with field measurements of CH4 dissolved in soil water sampled from the sites during the thaw season (Herndon et al., 2015b). This CH4 gradient suggests CH4 oxidation in the upper organic layer. Therefore, we developed the following hypotheses for CH4 production and oxidation, which were informed by previous studies of methane cycling in temperate ecosystems but untested in the Arctic. (1) CH4 is produced in the more reduced subsurface, and consumed by methane oxidizers at the upper section of the soil column where O2 is available. (2) Methane production has a higher temperature sensitivity than CH4 oxidation, and is likely to exceed the CH4 consumption rate in wet areas in response to warmer temperature.
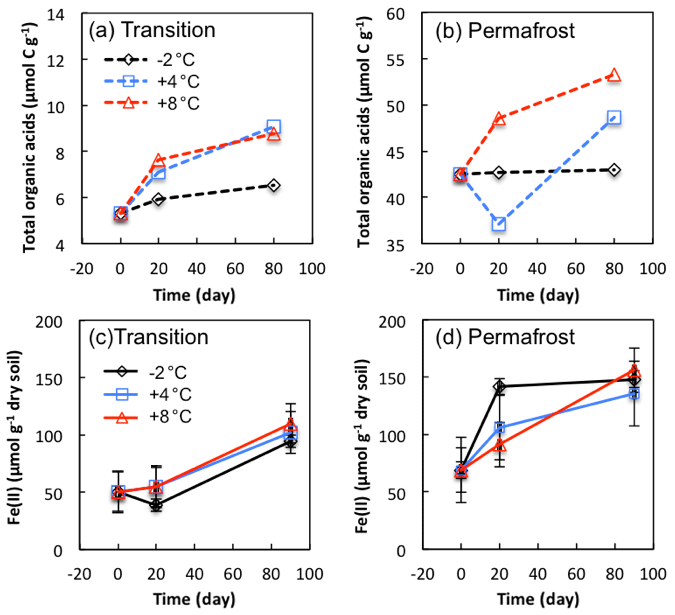
Figure 7Changes in total organic acids carbon (a, b) and Fe(II) concentrations (c, d) in soils from transition layer and permafrost of FCP during anoxic incubations. Total organic acids (µmol C g−1) were calculated from the concentrations of individual organic acids (Table S5). Error bars for Fe(II) concentrations are ±1 standard deviation from three replicate incubations.
Aerobic CH4 oxidation is usually assumed to be limited by O2 and CH4 diffusion. Therefore, upper layers of soil, the rhizosphere, and soil at the water table would be expected to have the highest CH4 oxidation activities (Shukla et al., 2013; Gulledge et al., 1997). The abundance of the pmoA marker gene for CH4 oxidation decreased with soil depth in HCP trough soils (Yang et al., 2017) and in permafrost-affected soils from the Canadian Arctic (Frank-Fahle et al., 2014), consistent with that conceptual model. Thus, the organic layers of FCP and HCP in the BEO tundra would have higher potential for CH4 oxidation. However, the highest CH4 oxidation potentials were observed in the transitional and permafrost layers of FCP, the only layers with active methanogenesis. This result suggests that most active methanotrophs are found in these deeper soil layers, where CH4 is available as a carbon and energy source.
Our results demonstrated that CH4 oxidation might not be primarily O2 diffusion limited, but rather limited by the availability of CH4 in this system. The highest CH4 oxidation potentials were measured below the rhizosphere, in suboxic layers where CH4 has accumulated. Given that half-saturation constants for CH4 and O2 used in methanotrophy models vary over 1–2 orders of magnitude (Segers, 1998; Riley et al., 2011), aerobic CH4 oxidation could occur throughout much of the soil column, as advective, diffusive, or plant-mediated transport processes introduce O2 into the soil. Others have observed deep soil CH4 oxidation activity in peatlands (Hornibrook et al., 2009), fens (Cheema et al., 2015), and wet tundra (Barbier et al., 2012), often correlated with water table depth (Sundh et al., 1994).
The water table in the center of Barrow LCPs and FCPs varies somewhat during the thaw season but remains close to the surface (< 10 cm below surface for most of the thaw season; Liljedahl et al., 2015, 2016). Precipitation balances evapotranspiration during the thaw season, with little lateral runoff (Dingman et al., 1980), and volumetric water contents remain constant for these features (http://permafrostwatch.org, last access: 3 November 2018). In HCPs, the water table drops up to 20 cm below the surface following snowmelt (Liljedahl et al., 2015), and the soils have a lower volumetric water content. Due to limited drainage in the flat coastal plain, the frozen cores analyzed here are representative of field conditions for much of the thaw season. Water isotope analysis demonstrated that most water in the deep active layer comes from summer precipitation rather than seasonal ice melt (Throckmorton et al., 2016). Precipitation during September and October 2011 was above average for Utqiaġvik (http://climate.gi.alaska.edu/, last access: 3 November 2018), suggesting a high water table and limited gas diffusion during the winter freeze-up before we collected soil cores in early 2012. As a result of these annual and transient changes in saturation, methanotrophs could colonize a broad range of the soil column below the rhizosphere. A comparison of methanogenesis and methane oxidation potential in peat bogs demonstrated that methanotrophs survived temporary exposure to anoxic conditions, suggesting these organisms can tolerate rapid changes in the water table and redox potential (Whalen and Reeburgh, 2000). These observations argue against hypotheses that CH4 oxidation occurs primarily at the surface layer or at the water table interface.

Figure 8Simulations of active biomass ratio Bmethanotrophs∕Bmethanogens distribution for Arctic soils to act as CH4 sink or source in response to rising temperature. Dissolved CH4 and O2 concentrations of 0.1 mM in soil pore water are assumed. Half saturation constants ( and ) represent the baseline value (grey), high (blue), and low (red) range for sensitivity analysis. Biomass ratios below the curves indicate the system could be a CH4 source, while biomass ratios above the curves suggest a CH4 sink.
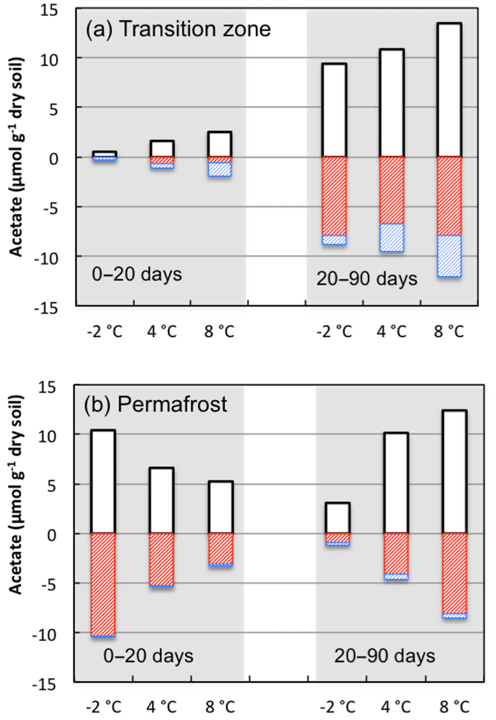
Figure 9Changes in acetate concentrations associated with production (white bars) and consumption by iron-reducing bacteria (red bars) or methanogens (blue bars) were estimated using stoichiometric calculations based on measurements of methane and Fe(II) during incubations from 0 to 20 days and from 20 to 90 days at the indicated incubation temperatures.
The net effect of CH4 production and oxidation in response to temperature change determines the sign of surface–atmosphere CH4 flux. The 4.1-fold increase in CH4 production in the transition layer due to a 10 ∘C rise in temperature (Q10) was similar to the average value of 4.26 reported in a recent meta-analysis of permafrost-affected soils (Schädel et al., 2016). These values are substantially higher than the temperature sensitivity of CH4 oxidation from both freshly thawed and pre-incubated samples (Q10=1 to 2). While both CH4 production and oxidation respond positively to increased temperature, CH4 production rates are predicted to increase more rapidly with higher temperature at this critical interface between the organic layer and permafrost. This difference in temperature sensitivity of CH4 production and oxidation was also found in Arctic lakes (Lofton et al., 2014). CH4 oxidation potential from freshly thawed FCP soils showed a temperature sensitivity coefficient (Q10) between 1.7 and 2.0, which is consistent with reported values from peat (Segers, 1998). Higher Q10 values for CH4 oxidation were reported in drier mineral Arctic cryosols with low organic carbon content (Jørgensen et al., 2015; Christiansen et al., 2015). Q10 relationships are strictly empirical representations of a processes' temperature sensitivity. Microbial community changes, differences in gene expression and enzyme production, and enzyme kinetics are all grouped together in this term, along with any changes in sorption or transport rates. Current process-enabled models do not distinguish between these factors, but future field experiments and model structures could provide a framework to differentiate mechanisms.
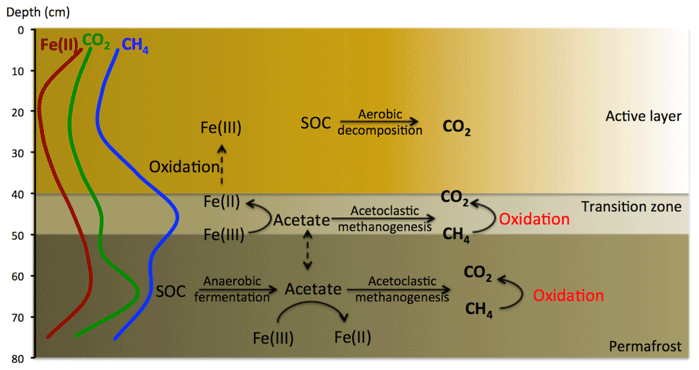
Figure 10Conceptual model of aerobic and anaerobic soil organic carbon decomposition pathways and the release of CO2 and CH4 from a flat-centered polygon (FCP). Lines on the left marked as Fe(II), CO2, and CH4 represent measurements across the soil column.
We simulated the net effect of CH4 production and oxidation based on rate measurements from the transitional layer of FCP that exhibited the highest CH4 oxidation potential. Methane oxidation rates are 14, 9, and 7 times the methanogenesis rate at −2, 4, and 8 ∘C, respectively. It is quite likely that methanogenesis will outpace CH4 oxidation under much warmer temperature if there is no change in soil water content. We introduced model representations to explore this possibility, as previous studies suggest CH4 oxidation rate is strongly regulated by the CH4 supply (Liikanen et al., 2002; Lofton et al., 2014). Excluding diffusion in this thin layer, we modeled the distribution of the active biomass ratio between methanogens and methanotrophs (Bmethanotrophs∕Bmethanogens), which would cause Arctic soils to act as CH4 sink or source in response to rising temperature (Fig. 8). Given the large difference in the rates of CH4 production and oxidation, CH4 oxidation would easily exceed methane production even with an active biomass ratio, Bmethanotrophs∕Bmethanogens, lower than 1. A much lower biomass ratio, Bmethanotrophs∕Bmethanogens (0.07–0.26), would make the soil a net source of CH4. Studies of functional genes involved in methane production (mcrA) and oxidation (pmoA) in the active layers in the western Canadian Arctic region suggested substantial variation in the pmoA/mcrA abundance ratio: the range is between and 7.6×10² (Frank-Fahle et al., 2014). Thus, accurate prediction of soil CH4 production requires quantification of methanogen and methanotroph populations as model constraints. These results suggest the importance of parameterizing the temperature response function and biomass growth function specifically for methanogenesis and methane oxidation in model simulations to determine if the rates of methanogenesis and methane oxidation offset each other. These results support the hypothesis that methanogenesis can be offset by high methane oxidation rates in degraded tundra, although comprehensive simulations of surface gas fluxes will need to account for gas transport through the full soil column.
The incubations of thawed FCP and HCP soils from all layers revealed substantial differences in the temporal dynamics of CO2 production. An initial lag was observed from HCP samples at all temperatures, suggesting low initial microbial activity, which might be due to low initial microbial biomass or substrate limitation. In contrast, rapid CO2 production in FCP soils was observed from both the organic layer incubated under oxic conditions and the transitional and permafrost layers incubated under anoxic conditions. This temporal pattern of rapid accumulation after thawing was also observed for anaerobic respiration from LCP soils and HCP trough soils (Roy Chowdhury et al., 2015; Yang et al., 2016).
Coupled iron reduction and organic carbon oxidation processes made substantial contributions to total anaerobic CO2 production relative to fermentation and methanogenesis. Acetate was the most abundant intermediate and exhibited the most dynamic concentration changes among individual organic acids measured from the soils. Using reaction stoichiometry for acetoclastic methanogenesis and anaerobic respiration through iron reduction (Istok et al., 2010), we estimated the amount of acetate being consumed by these parallel processes in soils from the transition layer and permafrost (Fig. 9). In transition-layer soils, about half of the available acetate was consumed by methanogenesis during the first 20 days of incubation (1.34 µmol g−1 out of 2.54 µmol g−1), while Fe(III) reduction consumed approximately 23 % of available acetate (0.60 out of 2.54 µmol g−1). In contrast, the partitioning of methanogenesis and Fe(III) reduction inverted during 20 to 90 days of anoxic incubation. Methanogenesis and Fe(III) reduction consumed 31 % and 59 % of available acetate, respectively. Permafrost contained a higher level of available acetate at the beginning of the incubation, and over 60 % of the available acetate was rapidly consumed by Fe(III) reduction during the first 20 days of incubation. From 20 to 90 days of incubation, iron reduction still consumed over half of the depleted acetate in the permafrost. This estimate is consistent with our initial characterization of the FCP core, where the soils from the transition layer contained the highest dissolved CH4 concentrations, and permafrost was associated with significantly higher Fe(II) concentrations (Fig. S1). If hydrogen or other organic anions such as formate or propionate were oxidized by methanogens or iron reducers, then estimated acetate production levels would decrease slightly. These simulations indicate that Fe(III) reduction is responsible for most of the acetate mineralized and CO2 produced in these soil incubations. As a significant anaerobic respiratory process in Arctic soils, Fe(III) reduction should also be included in CH4 models to better predict greenhouse gas production in response to a changing climate.
Based on these findings, we propose the following scheme of soil carbon biogeochemistry in the FCP (Fig. 10). (1) Increasing temperature facilitates aerobic decomposition of organic carbon in the organic layer, and accelerates anaerobic carbon decomposition in the lower active layer and transition layer through fermentation, iron reduction, and methanogenesis to form CH4 and CO2. (2) CH4 produced in the transitional and permafrost layers is oxidized close to the site of production or transported to the atmosphere. (3) Fe(III) reduction is the primary anaerobic process responsible for the depletion of acetate, the major SOC decomposition intermediate. In this scheme, the oxic–anoxic interface could dynamically move in the soil column with changes in the water table and pore water distribution. Although the transitional layer contained much less carbon than the permafrost layer, the total carbon loss as the sum of CO2 and CH4 was comparable to that from permafrost. Laboratory measurements suggested that acetate accumulated in the organic layer could be transported into deeper layers to support iron reduction and methanogenesis (Yang et al., 2016). This transport might occur through vertical movement of dissolved organic compounds or mixing through cryoturbation (Drake et al., 2015). We will use results from these incubation experiments to structure and parameterize a thermodynamically based microbial growth model that improves simulations of anaerobic organic matter decomposition with CO2 and CH4 production.
Increased warming is predicted to accelerate the transition from wet LCPs to drier FCPs and HCPs in Arctic tundra, which probably function as potential CH4 sinks. This study demonstrated that CH4 oxidation capacity was tightly linked to CH4 availability. Thus, the zone of highest CH4 oxidation potential is at the suboxic area near the FCP transition layer and the upper permafrost. The measured CH4 oxidation potential is an order of magnitude higher than the methanogenesis rate. With higher CH4 residence time in the soil column due to limited gas diffusion in the field, CH4 oxidation could easily consume CH4 produced in deep permafrost soil at warming temperature. Given that iron reduction-coupled respiration predominates anaerobic organic carbon decomposition, CO2 is likely to remain the major form of carbon emission from degraded polygons. This finding provides critical information about the dynamics of CH4 production and oxidation with increasing temperature that needs to be incorporated into Arctic terrestrial ecosystem models for better predictions.
The dataset can be found in Zheng et al. (2017, https://doi.org/10.5440/1288688).
The supplement related to this article is available online at: https://doi.org/10.5194/bg-15-6621-2018-supplement.
DEG, SDW, and BG conceived and organized the research study; TR, DEG, and SDW collected core samples; JZ, TR, and ZY performed experiments and acquired data; JZ, TR, and DEG analyzed and interpreted data; JZ and DEG drafted the manuscript. All authors contributed revisions to the manuscript and have given approval to the final version of the manuscript.
The authors declare that they have no conflict of interest.
We thank Ji-Won Moon for assistance with ion chromatography, and Bob Busey,
Larry Hinzman, Kenneth Lowe, and Craig Ulrich for assistance obtaining frozen
core samples, as well as UMIAQ, LLC for logistical assistance. The
Next-Generation Ecosystem Experiments in the Arctic (NGEE Arctic) project is
supported by the Biological and Environmental Research program in the US
Department of Energy (DOE) Office of Science. Oak Ridge National Laboratory
is managed by UT-Battelle, LLC, for the DOE under Contract
no. DE-AC05-00OR22725.
Edited by: Minhan
Dai
Reviewed by: Jianwu Tang and two anonymous referees
Barbier, B. A., Dziduch, I., Liebner, S., Ganzert, L., Lantuit, H., Pollard, W., and Wagner, D.: Methane-cycling communities in a permafrost-affected soil on Herschel Island, Western Canadian Arctic: active layer profiling of mcrA and pmoA genes, FEMS Microbiol. Ecol., 82, 287–302, https://doi.org/10.1111/j.1574-6941.2012.01332.x, 2012.
Bockheim, J. G.: Importance of cryoturbation in redistributing organic carbon in permafrost-affected soils, Soil. Sci. Soc. Am. J., 71, 1335–1342, https://doi.org/10.2136/Sssaj2006.0414n, 2007.
Chang, R. Y.-W., Miller, C. E., Dinardo, S. J., Karion, A., Sweeney, C., Daube, B. C., Henderson, J. M., Mountain, M. E., Eluszkiewicz, J., Miller, J. B., Bruhwiler, L. M. P., and Wofsy, S. C.: Methane emissions from Alaska in 2012 from CARVE airborne observations, P. Natl. Acad. Sci. USA, 111, 16694–16699, https://doi.org/10.1073/pnas.1412953111, 2014.
Cheema, S., Zeyer, J., and Henneberger, R.: Methanotrophic and methanogenic communities in Swiss alpine fens dominated by Carex rostrata and Eriophorum angustifolium, Appl. Environ. Microb., 81, 5832–5844, https://doi.org/10.1128/aem.01519-15, 2015.
Christiansen, J. R., Romero, A. J. B., Jørgensen, N. O. G., Glaring, M. A., Jørgensen, C. J., Berg, L. K., and Elberling, B.: Methane fluxes and the functional groups of methanotrophs and methanogens in a young Arctic landscape on Disko Island, West Greenland, Biogeochemistry, 122, 15–33, https://doi.org/10.1007/s10533-014-0026-7, 2015.
Commane, R., Lindaas, J., Benmergui, J., Luus, K. A., Chang, R. Y.-W., Daube, B. C., Euskirchen, E. S., Henderson, J. M., Karion, A., Miller, J. B., Miller, S. M., Parazoo, N. C., Randerson, J. T., Sweeney, C., Tans, P., Thoning, K., Veraverbeke, S., Miller, C. E., and Wofsy, S. C.: Carbon dioxide sources from Alaska driven by increasing early winter respiration from Arctic tundra, P. Natl. Acad. Sci. USA, 114, 5361–5366, https://doi.org/10.1073/pnas.1618567114, 2017.
Dingman, S. L., Barry, R. G., Weller, G., Benson, C., LeDrew, E. F., and Goodwin, C. W.: Climate, snow cover, microclimate, and hydrology, in: An Arctic ecosystem : the coastal tundra at Barrow, Alaska, edited by: Brown, J., Miller, P. C., Tieszen, L. L., and Bunnell, F., Dowden, Hutchison & Ross, Stroudsburg, PA, 30–65, 1980.
Drake, T. W., Wickland, K. P., Spencer, R. G. M., McKnight, D. M., and Striegl, R. G.: Ancient low–molecular-weight organic acids in permafrost fuel rapid carbon dioxide production upon thaw, P. Natl. Acad. Sci. USA, 112, 13946–13951, https://doi.org/10.1073/pnas.1511705112, 2015.
Frank-Fahle, B. A., Yergeau, É., Greer, C. W., Lantuit, H., and Wagner, D.: Microbial Functional Potential and Community Composition in Permafrost-Affected Soils of the NW Canadian Arctic, PLoS ONE, 9, e84761, https://doi.org/10.1371/journal.pone.0084761, 2014.
French, H. M.: The Periglacial Environment, 3rd ed., John Wiley & Sons, Chichester, 2007.
Grant, R. F., Mekonnen, Z. A., Riley, W. J., Arora, B., and Torn, M. S.: Mathematical Modelling of Arctic Polygonal Tundra with Ecosys: 2. Microtopography Determines How CO2 and CH4 Exchange Responds to Changes in Temperature and Precipitation, J. Geophys. Res.-Biogeo., 122, 3174–3187, https://doi.org/10.1002/2017JG004037, 2017.
Gulledge, J., Doyle, A. P., and Schimel, J. P.: Different -inhibition patterns of soil CH4 consumption: A result of distinct CH4-oxidizer populations across sites?, Soil Biol. Biochem., 29, 13–21, https://doi.org/10.1016/S0038-0717(96)00265-9, 1997.
Herndon, E. M., Mann, B. F., Roy Chowdhury, T., Yang, Z., Wullschleger, S. D., Graham, D., Liang, L., and Gu, B.: Pathways of anaerobic organic matter decomposition in tundra soils from Barrow, Alaska, J. Geophys. Res.-Biogeo., 120, 2345–2359, https://doi.org/10.1002/2015JG003147, 2015a.
Herndon, E. M., Yang, Z., Bargar, J., Janot, N., Regier, T. Z., Graham, D. E., Wullschleger, S. D., Gu, B., and Liang, L.: Geochemical drivers of organic matter decomposition in arctic tundra soils, Biogeochemistry, 126, 397–414, https://doi.org/10.1007/s10533-015-0165-5, 2015b.
Hornibrook, E. R. C., Bowes, H. L., Culbert, A., and Gallego-Sala, A. V.: Methanotrophy potential versus methane supply by pore water diffusion in peatlands, Biogeosciences, 6, 1491–1504, https://doi.org/10.5194/bg-6-1491-2009, 2009.
Howeler, R. H. and Bouldin, D. R.: The Diffusion and Consumption of Oxygen in Submerged Soils, Soil. Sci. Soc. Am. J., 35, 202–208, https://doi.org/10.2136/sssaj1971.03615995003500020014x, 1971.
Hugelius, G., Strauss, J., Zubrzycki, S., Harden, J. W., Schuur, E. A. G., Ping, C.-L., Schirrmeister, L., Grosse, G., Michaelson, G. J., Koven, C. D., O'Donnell, J. A., Elberling, B., Mishra, U., Camill, P., Yu, Z., Palmtag, J., and Kuhry, P.: Estimated stocks of circumpolar permafrost carbon with quantified uncertainty ranges and identified data gaps, Biogeosciences, 11, 6573–6593, https://doi.org/10.5194/bg-11-6573-2014, 2014.
Istok, J. D., Park, M., Michalsen, M., Spain, A. M., Krumholz, L. R., Liu, C., McKinley, J., Long, P., Roden, E., Peacock, A. D., and Baldwin, B.: A thermodynamically-based model for predicting microbial growth and community composition coupled to system geochemistry: Application to uranium bioreduction, J. Contam. Hydrol., 112, 1–14, https://doi.org/10.1016/j.jconhyd.2009.07.004, 2010.
Jørgensen, C. J., Lund Johansen, K. M., Westergaard-Nielsen, A., and Elberling, B.: Net regional methane sink in High Arctic soils of northeast Greenland, Nat. Geosci., 8, 20–23, https://doi.org/10.1038/ngeo2305, 2015.
Kim, Y. and Liesack, W.: Differential Assemblage of Functional Units in Paddy Soil Microbiomes, PLoS ONE, 10, e0122221, https://doi.org/10.1371/journal.pone.0122221, 2015.
Knoblauch, C., Spott, O., Evgrafova, S., Kutzbach, L., and Pfeiffer, E.-M.: Regulation of methane production, oxidation, and emission by vascular plants and bryophytes in ponds of the northeast Siberian polygonal tundra, J. Geophys. Res.-Biogeo., 120, 2525–2541, https://doi.org/10.1002/2015JG003053, 2015.
Laanbroek, H. J.: Methane emission from natural wetlands: interplay between emergent macrophytes and soil microbial processes. A mini-review, Ann. Bot.-London, 105, 141–153, https://doi.org/10.1093/aob/mcp201, 2010.
Langford, Z., Kumar, J., Hoffman, F., Norby, R., Wullschleger, S., Sloan, V., and Iversen, C.: Mapping Arctic Plant Functional Type Distributions in the Barrow Environmental Observatory Using WorldView-2 and LiDAR Datasets, Remote Sens.-Basel, 8, 733, https://doi.org/10.3390/rs8090733, 2016.
Lara, M. J., McGuire, A. D., Euskirchen, E. S., Tweedie, C. E., Hinkel, K. M., Skurikhin, A. N., Romanovsky, V. E., Grosse, G., Bolton, W. R., and Genet, H.: Polygonal tundra geomorphological change in response to warming alters future CO2 and CH4 flux on the Barrow Peninsula, Glob. Change Biol., 21, 1634–1651, https://doi.org/10.1111/gcb.12757, 2015.
Lee, H. J., Jeong, S. E., Kim, P. J., Madsen, E. L., and Jeon, C. O.: High resolution depth distribution of Bacteria, Archaea, methanotrophs, and methanogens in the bulk and rhizosphere soils of a flooded rice paddy, Front. Microbiol., 6, 639, https://doi.org/10.3389/fmicb.2015.00639, 2015.
Le Mer, J. and Roger, P.: Production, oxidation, emission and consumption of methane by soils: A review, Eur. J. Soil Biol., 37, 25–50, https://doi.org/10.1016/s1164-5563(01)01067-6, 2001.
Liebner, S., Schwarzenbach, S. P., and Zeyer, J.: Methane emissions from an alpine fen in central Switzerland, Biogeochemistry, 109, 287–299, https://doi.org/10.1007/s10533-011-9629-4, 2012.
Liikanen, A., Huttunen, J. T., Valli, K., and Martikainen, P. J.: Methane cycling in the sediment and water column of mid-boreal hyper-eutrophic Lake Kevätön, Finland, Ark. Hydrobiol., 154, 585–603, https://doi.org/10.1127/archiv-hydrobiol/154/2002/585, 2002.
Liljedahl, A. K., Wilson, C., Kholodov, A., Chamberlain, A., Lee, H., Daanen, R., Cohen, L., Hayes, S., Iwahana, G., Iverson, A., Weiss, T., Hoffman, A., Wullschleger, S., and Hinzman, L.: Ground Water Levels for NGEE Areas A, B, C and D, Barrow, Alaska, 2012–2014, https://doi.org/10.5440/1183767, 2015.
Liljedahl, A. K., Boike, J., Daanen, R. P., Fedorov, A. N., Frost, G. V., Grosse, G., Hinzman, L. D., Iijma, Y., Jorgenson, J. C., Matveyeva, N., Necsoiu, M., Raynolds, M. K., Romanovsky, V. E., Schulla, J., Tape, K. D., Walker, D. A., Wilson, C. J., Yabuki, H., and Zona, D.: Pan-Arctic ice-wedge degradation in warming permafrost and its influence on tundra hydrology, Nat. Geosci., 9, 312–318, https://doi.org/10.1038/ngeo2674, 2016.
Lipson, D. A., Jha, M., Raab, T. K., and Oechel, W. C.: Reduction of iron (III) and humic substances plays a major role in anaerobic respiration in an Arctic peat soil, J. Geophys. Res., 115, G00I06, https://doi.org/10.1029/2009jg001147, 2010.
Lofton, D. D., Whalen, S. C., and Hershey, A. E.: Effect of temperature on methane dynamics and evaluation of methane oxidation kinetics in shallow Arctic Alaskan lakes, Hydrobiologia, 721, 209–222, https://doi.org/10.1007/s10750-013-1663-x, 2014.
MacKay, J. R.: Thermally induced movements in ice-wedge polygons, western Arctic coast: a long-term study, Geogr. Phys. Quatern., 54, 41–68, https://doi.org/10.7202/004846ar, 2000.
McGuire, A. D., Christensen, T. R., Hayes, D., Heroult, A., Euskirchen, E., Kimball, J. S., Koven, C., Lafleur, P., Miller, P. A., Oechel, W., Peylin, P., Williams, M., and Yi, Y.: An assessment of the carbon balance of Arctic tundra: comparisons among observations, process models, and atmospheric inversions, Biogeosciences, 9, 3185–3204, https://doi.org/10.5194/bg-9-3185-2012, 2012.
Parmentier, F. J. W., van Huissteden, J., Kip, N., Op den Camp, H. J. M., Jetten, M. S. M., Maximov, T. C., and Dolman, A. J.: The role of endophytic methane-oxidizing bacteria in submerged Sphagnum in determining methane emissions of Northeastern Siberian tundra, Biogeosciences, 8, 1267–1278, https://doi.org/10.5194/bg-8-1267-2011, 2011.
Preuss, I., Knoblauch, C., Gebert, J., and Pfeiffer, E.-M.: Improved quantification of microbial CH4 oxidation efficiency in arctic wetland soils using carbon isotope fractionation, Biogeosciences, 10, 2539–2552, https://doi.org/10.5194/bg-10-2539-2013, 2013.
Raz-Yaseef, N., Torn, M. S., Wu, Y., Billesbach, D. P., Liljedahl, A. K., Kneafsey, T. J., Romanovsky, V. E., Cook, D. R., and Wullschleger, S. D.: Large CO2 and CH4 emissions from polygonal tundra during spring thaw in northern Alaska, Geophys. Res. Lett., 44, 504–513, https://doi.org/10.1002/2016GL071220, 2017.
Riley, W. J., Subin, Z. M., Lawrence, D. M., Swenson, S. C., Torn, M. S., Meng, L., Mahowald, N. M., and Hess, P.: Barriers to predicting changes in global terrestrial methane fluxes: analyses using CLM4Me, a methane biogeochemistry model integrated in CESM, Biogeosciences, 8, 1925–1953, https://doi.org/10.5194/bg-8-1925-2011, 2011.
Romanovsky, V. E. and Osterkamp, T. E.: Effects of unfrozen water on heat and mass transport processes in the active layer and permafrost, Permafrost Periglac., 11, 219–239, https://doi.org/10.1002/1099-1530(200007/09)11:3<219::aid-ppp352>3.0.co;2-7, 2000.
Roslev, P. and King, G. M.: Regulation of methane oxidation in a freshwater wetland by water table changes and anoxia, FEMS Microbiol. Ecol., 19, 105–115, https://doi.org/10.1016/0168-6496(95)00084-4, 1996.
Roy Chowdhury, T., Mitsch, W. J., and Dick, R. P.: Seasonal methanotrophy across a hydrological gradient in a freshwater wetland, Ecol. Eng., 72, 116–124, https://doi.org/10.1016/j.ecoleng.2014.08.015, 2014.
Roy Chowdhury, T., Herndon, E. M., Phelps, T. J., Elias, D. A., Gu, B., Liang, L., Wullschleger, S. D., and Graham, D. E.: Stoichiometry and temperature sensitivity of methanogenesis and CO2 production from saturated polygonal tundra in Barrow, Alaska, Glob. Change Biol., 21, 722–737, https://doi.org/10.1111/gcb.12762, 2015.
Sachs, T., Giebels, M., Boike, J., and Kutzbach, L.: Environmental controls on CH4 emission from polygonal tundra on the microsite scale in the Lena river delta, Siberia, Glob. Change Biol., 16, 3096–3110, https://doi.org/10.1111/j.1365-2486.2010.02232.x, 2010.
Sander, R.: Compilation of Henry's law constants (version 4.0) for water as solvent, Atmos. Chem. Phys., 15, 4399–4981, https://doi.org/10.5194/acp-15-4399-2015, 2015.
Schädel, C., Bader, M. K. F., Schuur, E. A. G., Biasi, C., Bracho, R., Capek, P., De Baets, S., Diakova, K., Ernakovich, J., Estop-Aragones, C., Graham, D. E., Hartley, I. P., Iversen, C. M., Kane, E., Knoblauch, C., Lupascu, M., Martikainen, P. J., Natali, S. M., Norby, R. J., O'Donnell, J. A., Chowdhury, T. R., Santruckova, H., Shaver, G., Sloan, V. L., Treat, C. C., Turetsky, M. R., Waldrop, M. P., and Wickland, K. P.: Potential carbon emissions dominated by carbon dioxide from thawed permafrost soils, Nat. Clim. Change, 6, 950–953, https://doi.org/10.1038/nclimate3054, 2016.
Schuur, E. A. G., Bockheim, J., Canadell, J. G., Euskirchen, E., Field, C. B., Goryachkin, S. V., Hagemann, S., Kuhry, P., Lafleur, P. M., Lee, H., Mazhitova, G., Nelson, F. E., Rinke, A., Romanovsky, V. E., Shiklomanov, N., Tarnocai, C., Venevsky, S., Vogel, J. G., and Zimov, S. A.: Vulnerability of permafrost carbon to climate change: implications for the global carbon cycle, BioScience, 58, 701–714, https://doi.org/10.1641/b580807, 2008.
Schuur, E. A. G., Abbott, B. W., Bowden, W. B., Brovkin, V., Camill, P., Canadell, J. G., Chanton, J. P., Chapin, F. S., Christensen, T. R., Ciais, P., Crosby, B. T., Czimczik, C. I., Grosse, G., Harden, J., Hayes, D. J., Hugelius, G., Jastrow, J. D., Jones, J. B., Kleinen, T., Koven, C. D., Krinner, G., Kuhry, P., Lawrence, D. M., McGuire, A. D., Natali, S. M., O'Donnell, J. A., Ping, C. L., Riley, W. J., Rinke, A., Romanovsky, V. E., Sannel, A. B. K., Schädel, C., Schaefer, K., Sky, J., Subin, Z. M., Tarnocai, C., Turetsky, M. R., Waldrop, M. P., Walter Anthony, K. M., Wickland, K. P., Wilson, C. J., and Zimov, S. A.: Expert assessment of vulnerability of permafrost carbon to climate change, Climatic Change, 119, 359–374, https://doi.org/10.1007/s10584-013-0730-7, 2013.
Schuur, E. A. G., McGuire, A. D., Schädel, C., Grosse, G., Harden, J. W., Hayes, D. J., Hugelius, G., Koven, C. D., Kuhry, P., Lawrence, D. M., Natali, S. M., Olefeldt, D., Romanovsky, V. E., Schaefer, K., Turetsky, M. R., Treat, C. C., and Vonk, J. E.: Climate change and the permafrost carbon feedback, Nature, 520, 171–179, https://doi.org/10.1038/nature14338, 2015.
Segers, R.: Methane production and methane consumption: a review of processes underlying wetland methane fluxes, Biogeochemistry, 41, 23–51, 1998.
Shiklomanov, N. I., Streletskiy, D. A., Nelson, F. E., Hollister, R. D., Romanovsky, V. E., Tweedie, C. E., Bockheim, J. G., and Brown, J.: Decadal variations of active-layer thickness in moisture-controlled landscapes, Barrow, Alaska, J. Geophys. Res.-Biogeo., 115, G00I04, https://doi.org/10.1029/2009JG001248, 2010.
Shukla, P. N., Pandey, K. D., and Mishra, V. K.: Environmental Determinants of Soil Methane Oxidation and Methanotrophs, Crit. Rev. Environ. Sci. Technol., 43, 1945–2011, https://doi.org/10.1080/10643389.2012.672053, 2013.
Sturtevant, C. S., Oechel, W. C., Zona, D., Kim, Y., and Emerson, C. E.: Soil moisture control over autumn season methane flux, Arctic Coastal Plain of Alaska, Biogeosciences, 9, 1423–1440, https://doi.org/10.5194/bg-9-1423-2012, 2012.
Sturtevant, C. S. and Oechel, W. C.: Spatial variation in landscape-level CO2 and CH4 fluxes from arctic coastal tundra: influence from vegetation, wetness, and the thaw lake cycle, Glob. Change Biol., 19, 2853–2866, https://doi.org/10.1111/gcb.12247, 2013.
Sundh, I., Nilsson, M., Granberg, G., and Svensson, B. H.: Depth distribution of microbial production and oxidation of methane in northern boreal peatlands, Microb. Ecol., 27, 253–265, https://doi.org/10.1007/bf00182409, 1994.
Throckmorton, H. M., Newman, B. D., Heikoop, J. M., Perkins, G. B., Feng, X., Graham, D. E., O'Malley, D., Vesselinov, V. V., Young, J., Wullschleger, S. D., and Wilson, C. J.: Active layer hydrology in an arctic tundra ecosystem: quantifying water sources and cycling using water stable isotopes, Hydrol. Process., 30, 4972–4986, https://doi.org/10.1002/hyp.10883, 2016.
Treat, C. C., Natali, S. M., Ernakovich, J., Iversen, C. M., Lupascu, M., McGuire, A. D., Norby, R. J., Roy Chowdhury, T., Richter, A., Šantrůčková, H., Schädel, C., Schuur, E. A. G., Sloan, V. L., Turetsky, M. R., and Waldrop, M. P.: A pan-Arctic synthesis of CH4 and CO2 production from anoxic soil incubations, Glob. Change Biol., 21, 2787–2803, https://doi.org/10.1111/gcb.12875, 2015.
Vaughn, L. J. S., Conrad, M. E., Bill, M., and Torn, M. S.: Isotopic insights into methane production, oxidation, and emissions in Arctic polygon tundra, Glob. Change Biol., 22, 3487–3502, https://doi.org/10.1111/gcb.13281, 2016.
von Fischer, J. C., Rhew, R. C., Ames, G. M., Fosdick, B. K., and von Fischer, P. E.: Vegetation height and other controls of spatial variability in methane emissions from the Arctic coastal tundra at Barrow, Alaska, J. Geophys. Res.-Biogeo., 115, G00I03, https://doi.org/10.1029/2009jg001283, 2010.
Wainwright, H. M., Dafflon, B., Smith, L. J., Hahn, M. S., Curtis, J. B., Wu, Y., Ulrich, C., Peterson, J. E., Torn, M. S., and Hubbard, S. S.: Identifying multiscale zonation and assessing the relative importance of polygon geomorphology on carbon fluxes in an Arctic tundra ecosystem, J. Geophys. Res.-Biogeo., 120, 788–808, https://doi.org/10.1002/2014JG002799, 2015.
Whalen, S. C., and Reeburgh, W. S.: Methane Oxidation, Production, and Emission at Contrasting Sites in a Boreal Bog, Geomicrobiol. J., 17, 237–251, https://doi.org/10.1080/01490450050121198, 2000.
Xu, X., Elias, D. A., Graham, D. E., Phelps, T. J., Carroll, S. L., Wullschleger, S. D., and Thornton, P. E.: A microbial functional group-based module for simulating methane production and consumption: Application to an incubated permafrost soil, J. Geophys. Res.-Biogeo., 120, 1315–1333, https://doi.org/10.1002/2015JG002935, 2015.
Yang, Z., Wullschleger, S. D., Liang, L., Graham, D. E., and Gu, B.: Effects of warming on the degradation and production of low-molecular-weight labile organic carbon in an Arctic tundra soil, Soil Biol. Biochem., 95, 202–211, https://doi.org/10.1016/j.soilbio.2015.12.022, 2016.
Yang, Z., Yang, S., Van Nostrand, J. D., Zhou, J., Fang, W., Qi, Q., Liu, Y., Wullschleger, S. D., Liang, L., Graham, D. E., Yang, Y., and Gu, B.: Microbial community and functional gene changes in Arctic tundra soils in a microcosm warming experiment, Front. Microbiol., 8, 1741, https://doi.org/10.3389/fmicb.2017.01741, 2017.
Zheng, J., RoyChowdhury, T., and Graham, D. E.: CO2 and CH4 Production and CH4 Oxidation in Low Temperature Soil Incubations from Flat- and High-Centered Polygons, Barrow, Alaska, 2012, https://doi.org/10.5440/1288688, 2017.
Zona, D., Gioli, B., Commane, R., Lindaas, J., Wofsy, S. C., Miller, C. E., Dinardo, S. J., Dengel, S., Sweeney, C., Karion, A., Chang, R. Y.-W., Henderson, J. M., Murphy, P. C., Goodrich, J. P., Moreaux, V., Liljedahl, A., Watts, J. D., Kimball, J. S., Lipson, D. A., and Oechel, W. C.: Cold season emissions dominate the Arctic tundra methane budget, P. Natl. Acad. Sci. USA, 113, 40–45, https://doi.org/10.1073/pnas.1516017113, 2016.