the Creative Commons Attribution 4.0 License.
the Creative Commons Attribution 4.0 License.
 | 21 Nov 2018
Evaluation of simulated ozone effects in forest ecosystems against biomass damage estimates from fumigation experiments
Martina Franz
Rocio Alonso
Almut Arneth
Patrick Büker
Susana Elvira
Giacomo Gerosa
Lisa Emberson
Zhaozhong Feng
Didier Le Thiec
Riccardo Marzuoli
Elina Oksanen
Johan Uddling
Matthew Wilkinson
Sönke Zaehle
Regional estimates of the effects of ozone pollution on forest growth depend on the availability of reliable injury functions that estimate a representative ecosystem response to ozone exposure. A number of such injury functions for forest tree species and forest functional types have recently been published and subsequently applied in terrestrial biosphere models to estimate regional or global effects of ozone on forest tree productivity and carbon storage in the living plant biomass. The resulting impacts estimated by these biosphere models show large uncertainty in the magnitude of ozone effects predicted. To understand the role that these injury functions play in determining the variability in estimated ozone impacts, we use the O-CN biosphere model to provide a standardised modelling framework. We test four published injury functions describing the leaf-level, photosynthetic response to ozone exposure (targeting the maximum carboxylation capacity of Rubisco (Vcmax) or net photosynthesis) in terms of their simulated whole-tree biomass responses against data from 23 ozone filtration/fumigation experiments conducted with young trees from European tree species at sites across Europe with a range of climatic conditions. Our results show that none of these previously published injury functions lead to simulated whole-tree biomass reductions in agreement with the observed dose–response relationships derived from these field experiments and instead lead to significant over- or underestimations of the ozone effect. By re-parameterising these photosynthetically based injury functions, we develop linear, plant-functional-type-specific dose–response relationships, which provide accurate simulations of the observed whole-tree biomass response across these 23 experiments.
- Article
(818 KB) - Full-text XML
- BibTeX
- EndNote


Ozone is a phytotoxic air pollutant which enters plants mainly through the leaf stomata, where reactive oxygen species (ROSs) are formed that can injure essential leaf functioning (Ainsworth et al., 2012). Ozone-induced declines in net photosynthesis (Morgan et al., 2003; Wittig et al., 2007) have been observed as the result of injury of the photosynthetic apparatus and increased respiration rates caused by investments in the repair of injury, as well as the production of defence compounds (Ainsworth et al., 2012; Wieser and Matyssek, 2007). At the leaf-scale, ozone injury occurs and accumulates when the instantaneous stomatal ozone uptake of leaves surpasses the ability of the leaf to detoxify ozone (Wieser and Matyssek, 2007). These effects are likely the primary cause for reduced rates of net photosynthesis and a decreased supply of carbon and energy for growth and net primary production (NPP), which contributes to the commonly observed ozone-induced reductions in leaf area and plant biomass (Lombardozzi et al., 2013; Morgan et al., 2003; Wittig et al., 2009). Changes in tropospheric ozone abundance and associated changes in ozone-induced injury thus have the potential to affect the ability of the terrestrial biosphere to sequester carbon (Harmens and Mills, 2012; Oliver et al., 2018). However, a quantitative understanding of the effect of ozone pollution on forest growth and carbon sequestration at the regional scale is still lacking. Terrestrial biosphere models can be used to obtain regional or global estimates of ozone damage based on an understanding of how ozone affects plant processes leading to C assimilation and growth. Modelling algorithms to estimate regional or global impacts of ozone on gross primary production (GPP) have been developed for several of these terrestrial biosphere models (Franz et al., 2017; Lombardozzi et al., 2012a, 2015; Oliver et al., 2018; Sitch et al., 2007). However, simulated reductions in GPP due to ozone-induced injury vary substantially between models and model versions (Franz et al., 2017; Lombardozzi et al., 2012a, 2015; Sitch et al., 2007).
This uncertainty is predominantly due to the different approaches that these models use to relate ozone uptake (or ozone exposure) to reductions in whole-tree biomass and in the exact parameterisation of the injury functions and dose–response relationships applied (Karlsson et al., 2004; Lombardozzi et al., 2012a, 2013; Pleijel et al., 2004; Wittig et al., 2007). The injury functions employed by current terrestrial biosphere models differ decidedly in their slope (i.e. the change in injury per unit of time-integrated ozone uptake), intercept (ozone injury at zero time-integrated ozone uptake) and their assumed threshold, below which the ozone uptake rate is considered sufficiently low that ozone will be detoxified before any injury occurs (Karlsson et al., 2004; Lombardozzi et al., 2012a; Pleijel et al., 2004). For example, Sitch et al. (2007) relates the instantaneous ozone uptake exceeding a flux threshold to net photosynthetic injury via an empirically derived factor. An alternative approach has been to relate ozone injury to net photosynthesis in response to the accumulated ozone uptake rather than to the instantaneous ozone uptake as in Sitch et al. (2007), e.g. by using the CUOY, which refers to the cumulative canopy O3 uptake above a flux threshold of Y nmol m−2 s−1 (Cailleret et al., 2018; Lombardozzi et al., 2012a, 2013; Wittig et al., 2007).
The effect of ozone on plant growth has been investigated by ozone filtration/fumigation experiments either at the individual experimental level or by pooling data from multiple experiments that have been conducted according to a standardised experimental method. These experiments typically rely on young trees because of their small size. A challenge in developing and testing process-based models of ozone damage from these ozone fumigation experiments is that often only the difference in biomass accumulation between plants grown in an ozone treatment and in ambient or charcoal-filtered air at the end of the experiment are reported. Data from these studies provide evidence for a linear, species-specific relationship between accumulated ozone uptake and reductions in plant biomass (Mills et al., 2011; Nunn et al., 2006; Pleijel et al., 2004). Sitch et al. (2007) for instance calibrated their instantaneous leaf-level injury function between ozone uptake and photosynthesis by relating simulated annual net primary production and accumulated ozone uptake to observed biomass dose–response relationships developed by Karlsson et al. (2004) and Pleijel et al. (2004), where biomass/yield damage is related to the phytotoxic ozone dose (PODy). The PODy refers to the accumulated ozone uptake above a flux threshold of y nmol m−2 s−1 by the leaves representative of the upper-canopy leaves of the plant. Such an approach applies biomass dose–response relationships of young trees to mature trees. However, the effects of ozone on leaf physiology (e.g. net photosynthesis and stomatal conductance) or plant carbon allocation may differ between juvenile and adult trees (Hanson et al., 1994; Kolb and Matyssek, 2001; Paoletti et al., 2010; Samuelson and Kelly, 1996). Whether or not biomass dose–response relationships can be used to calibrate injury functions for mature trees is uncertain.
An alternative approach is to directly simulate ozone injury to photosynthesis, which may have been a major cause for the observed decline in plant biomass production (Ainsworth et al., 2012). Possible injury targets in the simulations can be, for example, the net photosynthesis or leaf-specific photosynthetic activity (such as represented by the maximum carboxylation capacity of Rubisco, Vcmax). For instance, Lombardozzi et al. (2012a) based their injury function on an experimental study involving a single forest tree species, whereas more recent publications (e.g. Lombardozzi et al., 2015 and Franz et al., 2017) have used injury functions from meta-analyses of a far larger set of filtration/fumigation studies. Meta-analyses have attempted to summarise the responses of plant performance to ozone exposure across a wider range of experiments and vegetation types (Feng and Kobayashi, 2009; Li et al., 2017; Lombardozzi et al., 2013; Wittig et al., 2007, 2009) and to develop injury functions for plant groups that might provide an estimate of mean plant group responses to ozone. However, these meta-analyses suffer from a lack of consistency in the derivation of either plant injury or ozone exposure and generally report a large amount of unexplained variance. A further complication in the meta-analyses of ozone injury (Lombardozzi et al., 2013; Wittig et al., 2007) is that they have to indirectly estimate the cumulative ozone uptake underlying the observed ozone injury based on a restricted amount of data, which causes uncertainty in the derived injury functions.
Büker et al. (2015) provides an independent data set of whole-tree biomass plant responses to ozone uptake which is independent of data sets that were used to describe injury functions by Wittig et al. (2007) and Lombardozzi et al. (2013). This data set has been collected from experiments that follow a more standardised methodology to assess dose–responses and has associated meteorological and ozone data at a high time resolution that allow more accurate estimates of modelled ozone uptake to be made. These dose–response relationships describe whole-tree biomass reductions in young trees derived from standardised ozone filtration/fumigation methods for eight European tree species at 10 locations across Europe (Büker et al., 2015). These data thus provide an opportunity to evaluate simulations of biosphere models that use leaf-level injury functions (describing the effect of ozone uptake on photosynthetic variables) to estimate C assimilation, growth and ultimately whole-tree biomass against these robust empirical dose–response relationships that relate ozone exposure directly to whole-tree biomass response.
Here we test four alternative, previously published ozone injury functions that target either net photosynthesis or the leaf carboxylation capacity (Vcmax), which have been included in state-of-the-art terrestrial biosphere models (Franz et al., 2017; Lombardozzi et al., 2012a, 2015) against these new biomass dose–response relationships by Büker et al. (2015). We incorporate these injury functions into a single modelling framework, the O-CN model (Franz et al., 2017; Zaehle and Friend, 2010). To reduce model–data mismatch, we test the functions in simulations that mimic to the extend possible the conditions of each of the experiments in the Büker et al. (2015) data set, in particular the young age, such that we can directly compare the simulated to the observed whole-tree biomass reductions in the empirically derived dose–response relationships. This allows us to identify the contribution of these alternative injury function formulations on the simulated whole-tree biomass response. The simulated biomass dose–response relationships are then compared to the data from the experiments to evaluate the capability of the different model versions to reproduce observed dose–response relationships. Based on these comparisons we use a similar approach to that of Sitch et al. (2007) and develop alternative parameterisations of the injury functions to improve the capability of the O-CN model to simulate the whole-tree biomass responses observed in the fumigation experiments, with the notable exception that we explicitly simulate in-fumigation experiments and the approximate age of the trees. Finally, we explore whether or not there is a substantial difference in the biomass response to ozone of young or mature trees by using a sequence of model simulations and comparing the response both in terms of whole-tree biomass as well as net primary production.
We use the O-CN terrestrial biosphere model (Franz and Zaehle, 2018; Zaehle and Friend, 2010), which is an extension of the ORCHIDEE model (Krinner et al., 2005) to simulate conditions of the ozone fumigation experiments described in Büker et al. (2015). The O-CN model, an average–individual dynamic vegetation model, simulates the terrestrial coupled carbon (C), nitrogen (N) and water cycles for up to 12 plant functional types and is driven by climate data and atmospheric composition.
O-CN simulates a multilayer canopy with up to 20 layers with a thickness of up to 0.5 leaf area index each. Net photosynthesis is calculated according to a modified Farquhar scheme for shaded and sunlit leaves considering the light profiles of diffuse and direct radiation (Zaehle and Friend, 2010). Leaf nitrogen concentration and leaf area determine the photosynthetic capacity. Increases in the leaf nitrogen content increase Vcmax and Jmax (nitrogen-specific rates of maximum light harvesting, electron transport) and hence maximum net photosynthesis and stomatal conductance per leaf area. The leaf N content is highest at the top of the canopy and exponentially decreases with increasing canopy depth (Friend, 2001; Niinemets et al., 2015). Following this net photosynthesis, stomatal conductance and ozone uptake are generally highest in the top canopy and decrease with increasing canopy depth.
Canopy-integrated assimilated carbon enters a labile non-structural carbon pool, which can either be used to fuel maintenance respiration (a function of tissue nitrogen), storage (for seasonal leaf and fine-root replacement and buffer of inter-annual variability in assimilation) or biomass growth. The labile pool responds within days to changes in GPP; the long-term reserve has a response time of several months, depending on its use to support seasonal foliage and fine-root development or sustain growth in periods of reduced photosynthesis. After accounting for reproductive production (flowers and fruits), biomass growth is partitioned into leaves, fine roots and sapwood according to a modified pipe model (Zaehle and Friend, 2010), accounting for the costs of biomass formation (growth respiration). In other words, changes in leaf-level productivity affect the build-up of plant pools and storage and thereby feed back on the ability of plants to acquire C through photosynthesis or nutrients through fine-root uptake.
2.1 Ozone injury calculation in O-CN
Throughout the paper we refer to the biological response to O3 uptake at the leaf level as “injury” and to responses of plant production, growth and biomass at the ecosystem level as “damage” following Guderian (1977). The relationship between ozone uptake and injury is called “injury function”; the relationship between ozone uptake and damage is called “dose–response relationship”.
Leaf-level ozone uptake is determined by stomatal conductance and atmospheric O3 concentrations, as described in Franz et al. (2017). To mimic the conditions of the fumigation experiments with plot-level controlled atmospheric O3 concentrations, simulations are conducted with a model version of O-CN, in which atmospheric O3 concentrations are directly used to calculate ozone uptake into the leaves, and the transfer and destruction of ozone between the atmosphere and the surface is ignored (ATM model version in Franz et al., 2017). Deviating from Franz et al. (2017), stomatal conductance gst here is calculated based on the Ball and Berry formulation (Ball et al., 1987) as
where net photosynthesis (An,l) is calculated as described in Zaehle and Friend (2010) as a function of the leaf-internal partial pressure of CO2, absorbed photosynthetic photon flux density on shaded and sunlit leaves, leaf temperature, the nitrogen-specific rates of maximum light harvesting, electron transport (Jmax) and carboxylation rates (Vcmax). RH is the atmospheric relative humidity, f(heightl) the water-transport limitation with canopy height, Ca the atmospheric CO2 concentration, g0 the residual conductance when An approaches zero, and g1 the stomatal-slope parameter as in Krinner et al. (2005). The index l indicates that gst is calculated separately for each canopy layer.
The stomatal conductance to ozone is calculated as
where the factor 1.51 accounts for the different diffusivity of O3 from water vapour (Massman, 1998).
For each canopy layer, the O3 stomatal flux (fst,l, nmol m−2 (leaf area) s−1) is calculated from the atmospheric O3 concentration the plants in the field experiments were fumigated with (), and gst,l is calculated as
where the leaf-internal O3 concentration () is assumed to be zero (Laisk et al., 1989).
The accumulation of ozone fluxes above a threshold of Y nmol m−2 (leaf area) s−1 (, nmol m−2 (leaf area) s−1) with
gives the CUOYl. The canopy value of CUOY is calculated by summing CUOYl over all canopy layers (Franz et al., 2017).
For comparison to observations, the POD (mmol m−2) can be diagnosed by the accumulation of fst,l for the top canopy layer (l=1), in accordance with LRTAP-Convention (2017) and Büker et al. (2015). The accumulation of ozone fluxes of the top canopy layer above a threshold of y nmol m−2 (leaf area) s−1 gives the PODy . The estimates of PODy (both POD2 and POD3) can be used offline to re-construct dose–response relationships equivalent to those described in Büker et al. (2015). These modelled dose–response relationships can then be compared with the empirically derived dose–response relationships to assess the ability of the model to estimate injury. As such, the POD2 and POD3 used for the formation of these modelled dose–response relationships are purely diagnostic variables and not involved in the injury calculation of the model. The flux thresholds (2 and 3 nmol m−2 (leaf area) s−1) are not the flux thresholds that are used to estimate biomass response in the O-CN model simulations.
Ozone injury, i.e. the fractional loss of carbon uptake associated with ozone uptake , is calculated as a linear function of the cumulative leaf-level uptake of ozone above a threshold of Y nmol m−2 (leaf area) s−1 (CUOYl)
where a is the intercept and b is the slope of the injury function. The injury fraction () is calculated separately for each canopy layer l based on the specific accumulated ozone uptake of the respective canopy layer (CUOYl) and takes values between 0 and 1. The magnitude of in Eq. (5) varies between the canopy layers because CUOYl varies driven by within-canopy gradients in stomatal conductance and photosynthetic capacity.
The effect of ozone injury on plant carbon uptake is calculated by
where xl is either leaf-level net photosynthesis An,l or the maximum photosynthetic capacity (Jmax,l and Vcmax,l), which is used in the calculation of An,l. Jmax,l and Vcmax,l are reduced in proportion such that the ratio between the two is not altered. While there is some evidence that ozone can affect the ratio between Jmax and Vcmax, we believe that for the purpose of this paper, it is justifiable to assume a fixed ratio between them.
Reductions in An,l cause a decline in stomatal conductance (gst,l) due to the tight coupling between both. Other stress factors that impact gst,l are accounted for in the preceding calculation of the gst,l uninjured by ozone (see Eq. 1). Reductions in gst,l decrease the O3 uptake into the plant (fst,l) and slow the increase in CUOYl and thus ozone injury.
2.2 Model set-up
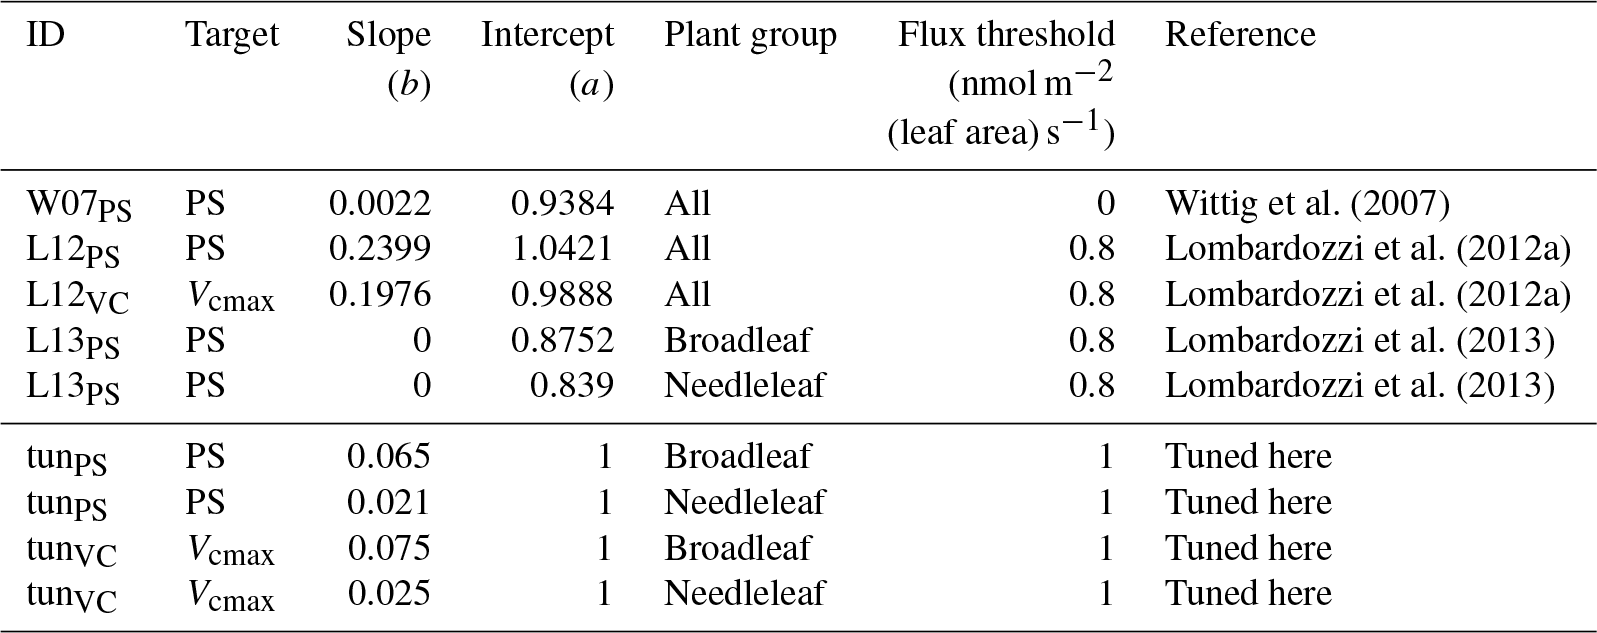
Four published injury functions were applied within the O-CN model (see Table 1 for the respective slopes, intercepts and flux thresholds). As shown below in Fig. 1 and explained in the results section, these did not match well with the observed biomass dose–response relationships by Büker et al. (2015). Following this we manually calibrated two additional injury relationships – one each for An or Vcmax – based on the data presented in Büker et al. (2015) (see Table 1 for slopes and intercepts). For these calibrated injury functions, we chose a flux threshold value of 1 nmol m−2 (leaf area) s−1, as suggested by LRTAP-Convention (2017). We forced the intercept (a) of these relationships to 1 to simulate zero ozone injury at zero accumulated O3 (for ozone levels that cause less then 1 nmol m−2 (leaf area) s−1 instantaneous ozone uptake). As described above, in all model versions, ozone injury is calculated independently for each canopy layer based on the accumulated O3 uptake (CUOYl) in that layer, above a specific flux threshold of Y nmol m−2 (leaf area) s−1 for the respective injury function (see Table 1).
Wittig et al. (2007)Lombardozzi et al. (2012a)Lombardozzi et al. (2012a)Lombardozzi et al. (2013)Lombardozzi et al. (2013)Table 1Slopes and intercepts, partly PFT specific, of all four published (W07PS, L12PS, L12VC, L13PS) and two tuned (tunPS, tunVC) injury functions included in O-CN. Targets of ozone injury are net photosynthesis (PS) or Vcmax. Injury calculations base on the CUOY with a specific flux threshold for each injury function.
2.3 Model and protocol for young trees
Single-point simulations were run for each fumigation experiment using meteorological input from the daily CRU-NCEP climate data set (CRU-NCEP version 5; LSCE (https://vesg.ipsl.upmc.fr/thredds/catalog/store/p529viov/cruncep/V5_1901_2013/catalog.html, last access: 15 November 2018) at the nearest grid cell to the coordinates of the experiment sites. The meteorological data provided by the experiments incompletely described the atmospheric boundary conditions required to drive the O-CN model. Atmospheric CO2 concentrations were taken from Sitch et al. (2015), and reduced as well as oxidised nitrogen deposition in wet and dry forms was provided by the EMEP model (Simpson et al., 2014). Hourly O3 concentrations were obtained from the experiments, as in Büker et al. (2015).
Büker et al. (2015) report data for eight tree species at 11 sites across Europe (see Table A2 for experiment and simulation details). The O-CN model simulates 12 plant functional types (PFTs) rather than explicit species; therefore, the species from the experiments were assigned to the corresponding PFT: all broadleaved species except Quercus ilex were assigned to the temperate broadleaved summer-green PFT. Quercus ilex was classified as temperate broadleaved evergreen PFT. All needleleaf species were assigned to the temperate needleleaf evergreen PFT.
The fumigation experiments were conducted on young trees or cuttings. Prior to the simulation of the experiment, the model was run in an initialisation phase from bare ground until the simulated stand-scale tree age was stable and representative of 1–2 year old trees. During this initialisation, O-CN was run with the climate of the years preceding the experiment and zero atmospheric O3 concentrations. Using ambient ozone concentrations during the initialisation phase would have resulted in different initial biomass values for the different response functions, which would have reduced the comparability of the different model runs. The impact of the ozone concentrations in the initialisation phase on our results here can be considered negligible since we only evaluate the simulated biomass from different treatments in relation to each other and do not evaluate it in absolute terms.
The duration of the initialisation phase depends on the site and PFT and averages 7.8 years (mean over all simulated experiments). Some of the published injury functions and/or parameterisations applied have intercepts unequal to 1 (a in Eq. 5; see Table 1), which induces reductions (a<1) or increases (a>1) in photosynthesis at zero ozone concentration and thus causes a bias in biomass and in particular foliage area at the end of the initialisation phase. To eliminate this bias, the nitrogen-specific photosynthetic capacity of a leaf was adjusted for each of the six parameterisations of the model to obtain comparable leaf area index (LAI) values at the beginning of the experiment (see Table A1). This adaption of the nitrogen-specific photosynthetic capacity of a leaf only counterbalances the fixed increases or decreases in the calculation of photosynthesis implied by the intercepts unequal to 1 and has no further impact on ozone uptake and injury calculations.
The simulations of the experiments relied on the meteorological and atmospheric forcing of the experiment years. Simulations were made for all reported O3 treatments of the specific experiment, including the respective control treatments. Büker et al. (2015) obtained estimates of biomass reductions due to ozone by calculating the hypothetical biomass at zero ozone uptake for all experiments that reported ozone concentrations greater than zero for the control group (e.g. for charcoal-filtered or non-filtered air) and calculated the biomass damage from the treatments against a completely undamaged biomass. Our model allows us to run simulations with zero ozone concentrations and skip the calculation of the hypothetical biomass at zero ozone concentrations as done by Büker et al. (2015). Following this, we ran additional reference simulations with zero O3 and based our biomass damage calculations upon them.
2.4 Modelling protocol for mature trees
To test whether biomass dose–response relationships of mature forests will show a similar relationship as observed in the simulations of young trees, we ran additional simulations with mature trees. To allow the development of a mature forest where biomass accumulation reached a maximum, and high and medium turnover soil pools reached an equilibrium, the model was run for 300 years in the initialisation phase. The simulations were conducted with the respective climate previous to the experiment period and zero atmospheric O3 concentration. For the simulation years previous to 1901, the yearly climate is randomly chosen from the years 1901–1930. Constant values of atmospheric CO2 concentrations are used in simulated years previous to 1750 followed by increasing concentrations up to the experiment years. The subsequent experiment years are simulated in the same way as the simulations with the young trees. The ozone injury for mature trees is calculated based on the same tunVC injury function (see Table 1) that is used in the simulation of young trees (see Sect. 2.5 for details on the development of tunVC).
2.5 Calculation of the biomass damage relationships
The ozone-induced biomass damage is calculated from the difference between a treatment and a control simulation. At each experiment site and for all treatments, the annual reduction in biomass due to ozone (RB) is calculated as in Büker et al. (2015):
where BMtreat represents the biomass of a simulation which experienced an O3 treatment and BMzero the biomass of the control simulation with zero atmospheric O3 concentration. The exponent imposes an equal fractional biomass reduction across all simulation years for experiments lasting longer than 1 year.
Büker et al. (2015) report the dose–response relationships for biomass reduction with reference to PODy with flux thresholds y of 2 and 3 nmol m−2 (leaf area) s−1 (POD2 and POD3) for the needleleaf and broadleaf category, respectively, where the PODy values were derived from simulations with the DO3SE model (Emberson et al., 2000) given site-specific meteorology and ozone concentrations. To be able to compare the simulated biomass reduction by O-CN with these estimates, we also diagnosed these PODy values for each simulation from the accumulated ozone uptake of the top canopy layer (POD). Note that the PODyO-CN is purely diagnostic and not used in the injury calculations, which are based on the CUOYl (see Eq. 5). As O-CN computes continuous, half-hourly values of ozone uptake (see Franz et al., 2017, for details), the PODyO-CN values have to be transformed to be comparable to the simulated mean annual PODy values reported in Büker et al. (2015). For deciduous species, the yearly maximum of PODyO-CN was taken as a yearly increment PODyO-CN,i. The PODyO-CN of evergreen species was continuously accumulated over several years. To obtain the yearly increment PODyO-CN,i, the PODyO-CN at the beginning of the year i is subtracted from the PODyO-CN at the end of the year i.
The selected yearly PODyO-CN,i was used to calculate mean annual values necessary for the formation of the dose–response relationships integrating all simulation years (POD) as
where PODyO-CN,i is the PODy of the ith year calculated by O-CN. The POD values are used to derive biomass dose–response relationships.
Separate biomass dose–response relationships were estimated by grouping site data for broadleaved and needleleaf species. The biomass dose–response relationships are obtained from the simulation output by fitting a linear model to the simulated values of RB and POD (with flux thresholds of 2 and 3 nmol m−2 (leaf area) s−1 for needleleaf and broadleaved species, respectively), where the regression line is forced through 1 at zero POD. Büker et al. (2015) report two alternative dose–response relationships for their data set: the simple and the standard model – BSI and BST, respectively. We evaluate our different model versions regarding their ability to reach the area between those two functions (target area) with the biomass dose–response relationships computed from their output. The tuned injury relationships tunPS and tunVC were obtained by adjusting the slope b in Eq. (5) such that the corresponding biomass dose–response relationships fits the target area. The intercept of the injury relationships are forced to 1 to simulate zero ozone injury at ozone fluxes lower than 1 nmol m−2 (leaf area) s−1.
3.1 Testing published injury functions
None of the versions where ozone injury is calculated based on previously published injury functions fit the observations well. Some versions strongly overestimate the simulated biomass dose–response relationship and others strongly underestimate it (see Fig. 1) compared to the dose–response relationships developed by Büker et al. (2015).
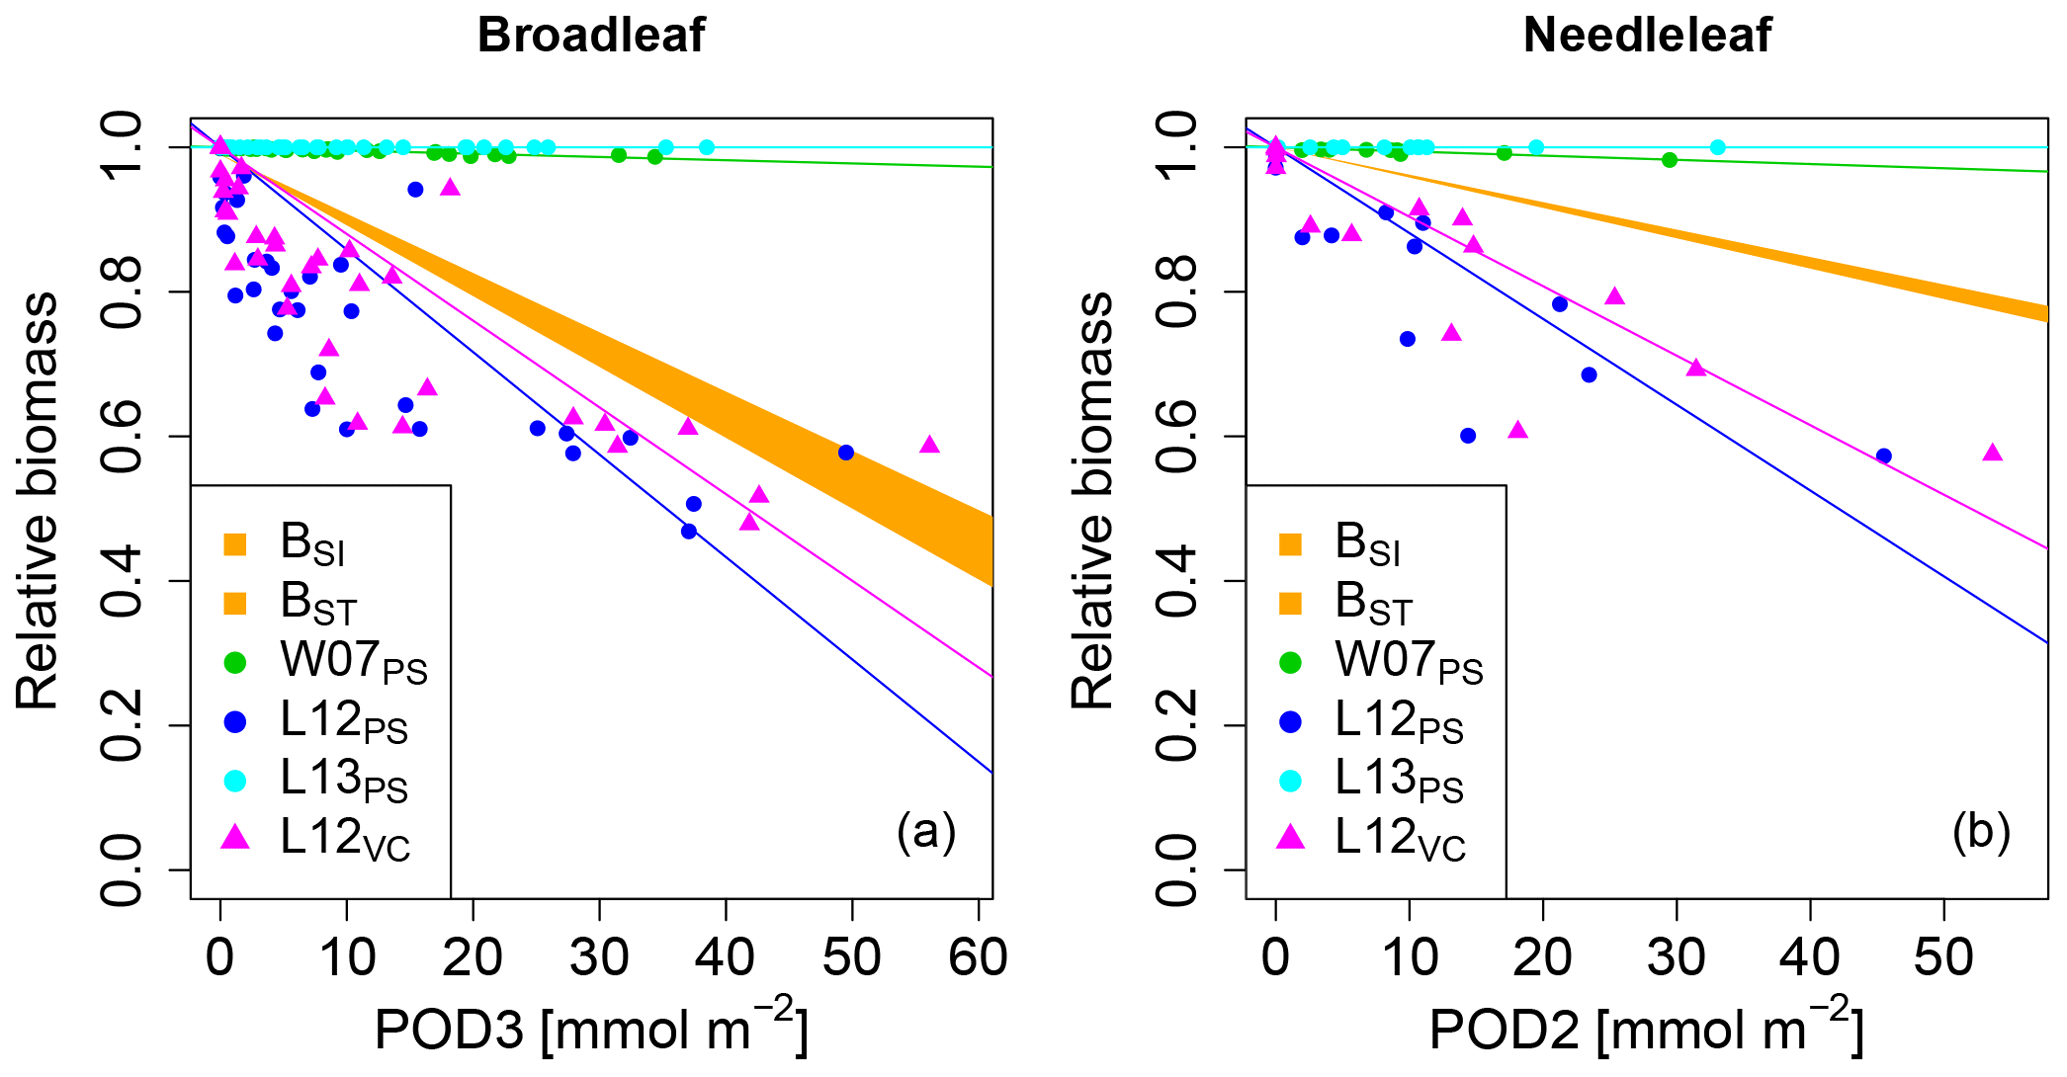
Figure 1Biomass dose–response relationships for simulations based on published injury relationships, separate for (a) broadleaved species and (b) needleleaf species. The dose–response relationships by Büker et al. (2015) (BSI and BST) define the target area (orange). The displayed dose–response relationships are simulated by model versions which base injury calculations either on net photosynthesis W07PS (Wittig et al., 2007), L12PS(Lombardozzi et al., 2012a) and L13PS (Lombardozzi et al., 2013) or on Vcmax L12VC (Lombardozzi et al., 2012a) (see Table 1 for more details). See Tables A3 and A4 for slopes, intercepts, R2 and p values of the displayed regression lines. Injury calculation in the simulations is based on CUOY (see Table 1) and not on POD2 or POD3 (see Sec. 2.5 for more details).
In the W07PS simulations, where injury is calculated based on the injury function by Wittig et al. (2007), biomass damage is strongly underestimated compared to the estimates from Büker et al. (2015). Ozone injury estimates are mainly driven by the intercept of the relationship, which assumes a reduction in net photosynthesis by 6.16 % at zero ozone uptake. Little additional ozone damage occurs due to the accumulation of ozone uptake. As a consequence, the ozone treatments and reference simulations differ little in their simulated biomass. Similarly, the Lombardozzi et al. (2013) injury function (L13PS) calculates ozone injury as a fixed reduction in net photosynthesis independent of the actual accumulated ozone uptake. The reference simulations with zero atmospheric ozone thus equal the simulations with ozone treatments and result in an identical simulated biomass. We tested accounting for effects of ozone on stomatal conductance besides net photosynthesis as suggested by Lombardozzi et al. (2013). However, this additional direct injury to stomatal conductance yielded a minimal decrease in simulated biomass accumulation in needleleaf trees, but did not qualitatively change the results (results not shown). These results indicate that injury functions, with a large intercept and a very shallow (or non-existing) slope cannot simulate the impact of spatially varying O3 concentrations or altered atmospheric O3 concentrations.
The simulations L12PS and L12VC (net photosynthesis and Vcmax injury according to Lombardozzi et al. (2012a), respectively) strongly overestimate biomass damage compared to Büker et al. (2015). Both injury functions assume an extensive injury to carbon fixation at low ozone accumulation values (CUOY) of about 5 mmol O3. This results in a very steep decline in relative biomass at low values of POD3. Notably, despite a linear injury function, the very steep initial decline in biomass of broadleaved trees at low values of POD3 is not continued at higher exposure, resulting in a non-linear biomass dose–response relationships. Higher accumulation of ozone doses does not result in higher injury rates beyond a threshold of about 5 mmol O3 m−2 leaf area, and relative biomass declines remain at 50 % to 70 %. Whereas non-linear dose–response relationships are observed in experiments, e.g. for leaf injury (Marzuoli et al., 2009), such a non-linear relationship is not produced in the biomass dose–response relationship by Büker et al. (2015).
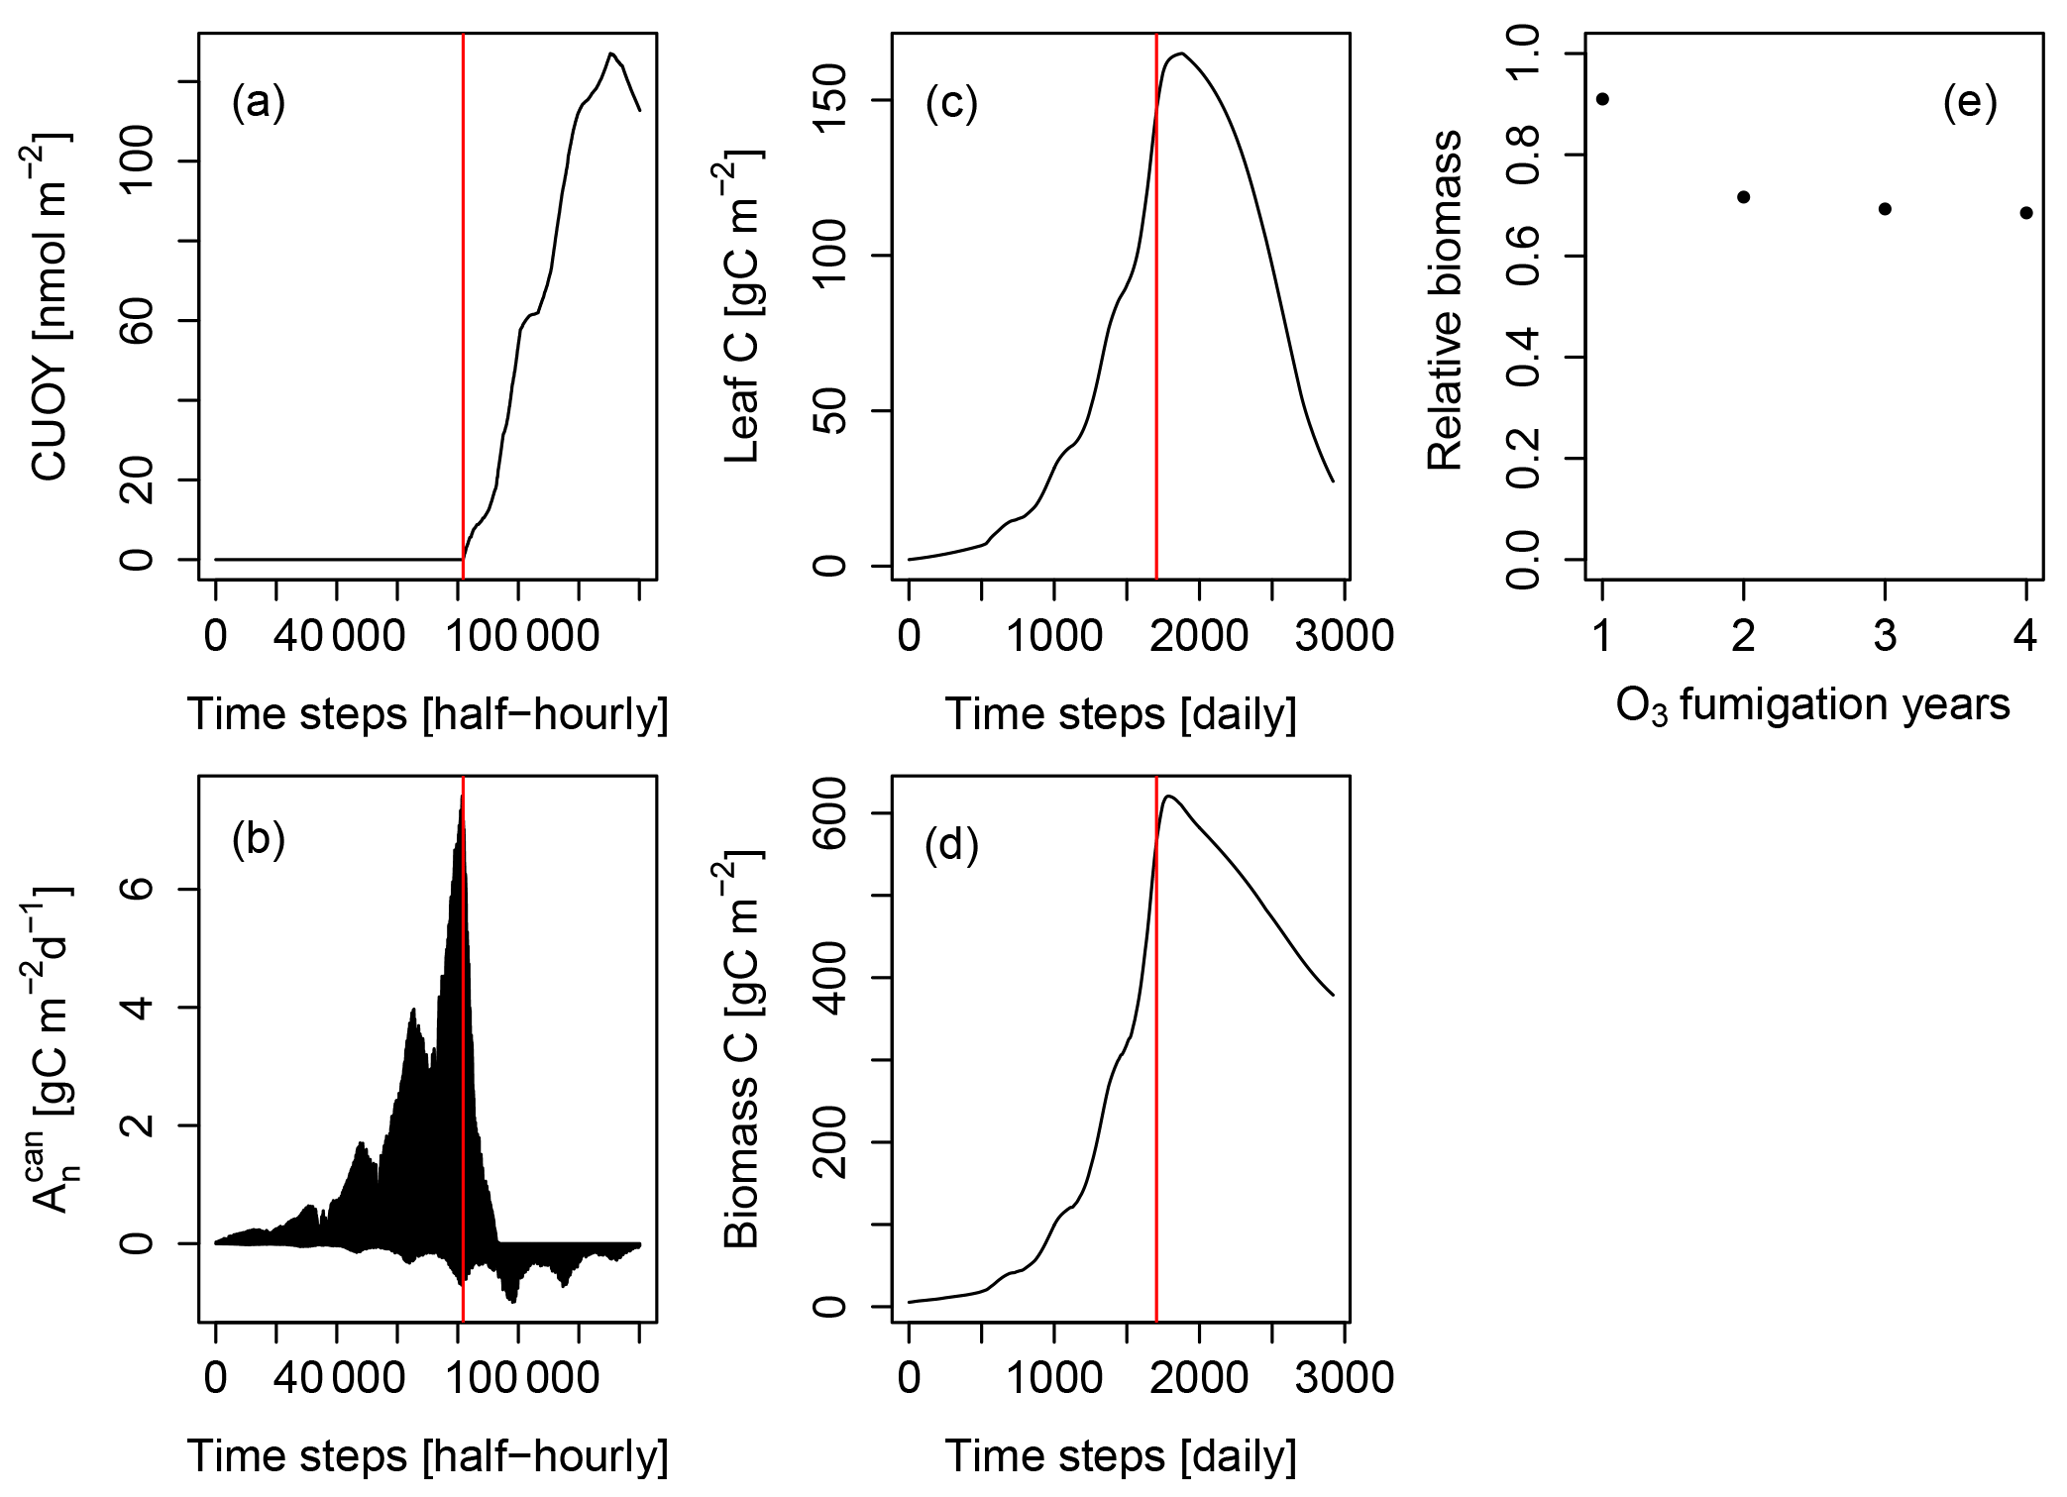
Figure 2Simulated cumulative ozone uptake above a threshold of 0.8 nmol m−2 (leaf area) s−1 (CUOY), canopy-integrated net photosynthesis (), leaf carbon content (Leaf C), total carbon in biomass (biomass C) and relative biomass (RB) of Pinus halepensis at the Ebro Delta fumigated with the NF+ ozone treatment. Simulations are conducted with the L12PS model version. Panels (a-d) display the entire simulation period. The red line indicates the onset of O3 fumigation (NF+) in the fifth of eight simulations years. The relative biomass compared to a control simulation with zero O3 concentration (e) is displayed for the O3 fumigation years.
We investigated the cause for this using the example of the Pinus halepensis stand in the Ebro Delta with a high ozone treatment as shown in Fig. 2. The simulated CUOY quickly increases after the onset of fumigation (Fig. 2a) and is paralleled by a rapid decline in canopy-integrated net photosynthesis (, see Fig. 2b). Once all canopy layers accumulated more than 5 mmol O3 m−2, the canopy photosynthesis is fully reduced, and becomes negative as a consequence of ongoing leaf maintenance respiration. Thereafter, leaf and total biomass steadily decline (Fig. 2c, d), and the plants are kept alive only by the consumption of stored non-structural carbon reserves. Despite the 100 % reduction in gross photosynthesis, the biomass compared to a control simulation (relative biomass, RB) reaches only values of approximately 0.7 (Fig. 2e) because of the remaining woody and root tissues (see Eq. 7 for the calculation of RB).
3.2 Tuned injury relationships
We next tested whether a linear injury function is in principle able to reproduce the observed biomass dose–response relationships. Simulations conducted with our tuned injury relationships produce biomass dose–response relationships which fit the target area defined by the BSI and BST dose–response relationships by Büker et al. (2015) (see Fig. 3 and Tables A5, A6). For the calibrated relationships used in these simulations, we chose a flux threshold value of 1 nmol m−2 (leaf area) s−1, as suggested by LRTAP-Convention (2017). We forced the intercept (a) of these relationships through 1, to simulate zero ozone injury at ozone fluxes lower than 1 nmol m−2 (leaf area) s−1. The resulting slope of the tunPS function for broadleaved PFTs is approximately 30 times higher compared to the slope suggested by Wittig et al. (2007) and a fourth of the slope by Lombardozzi et al. (2012a). For the needleleaf PFT, the tuned slope (tunPS) is approximately 10 times higher (lower) than the slopes by Wittig et al. (2007) and Lombardozzi et al. (2012a), respectively. Notably, we did not observe any difference in the model performance irrespective of whether net photosynthesis or photosynthetic capacity (Vcmax and simultaneously Jmax) was reduced.
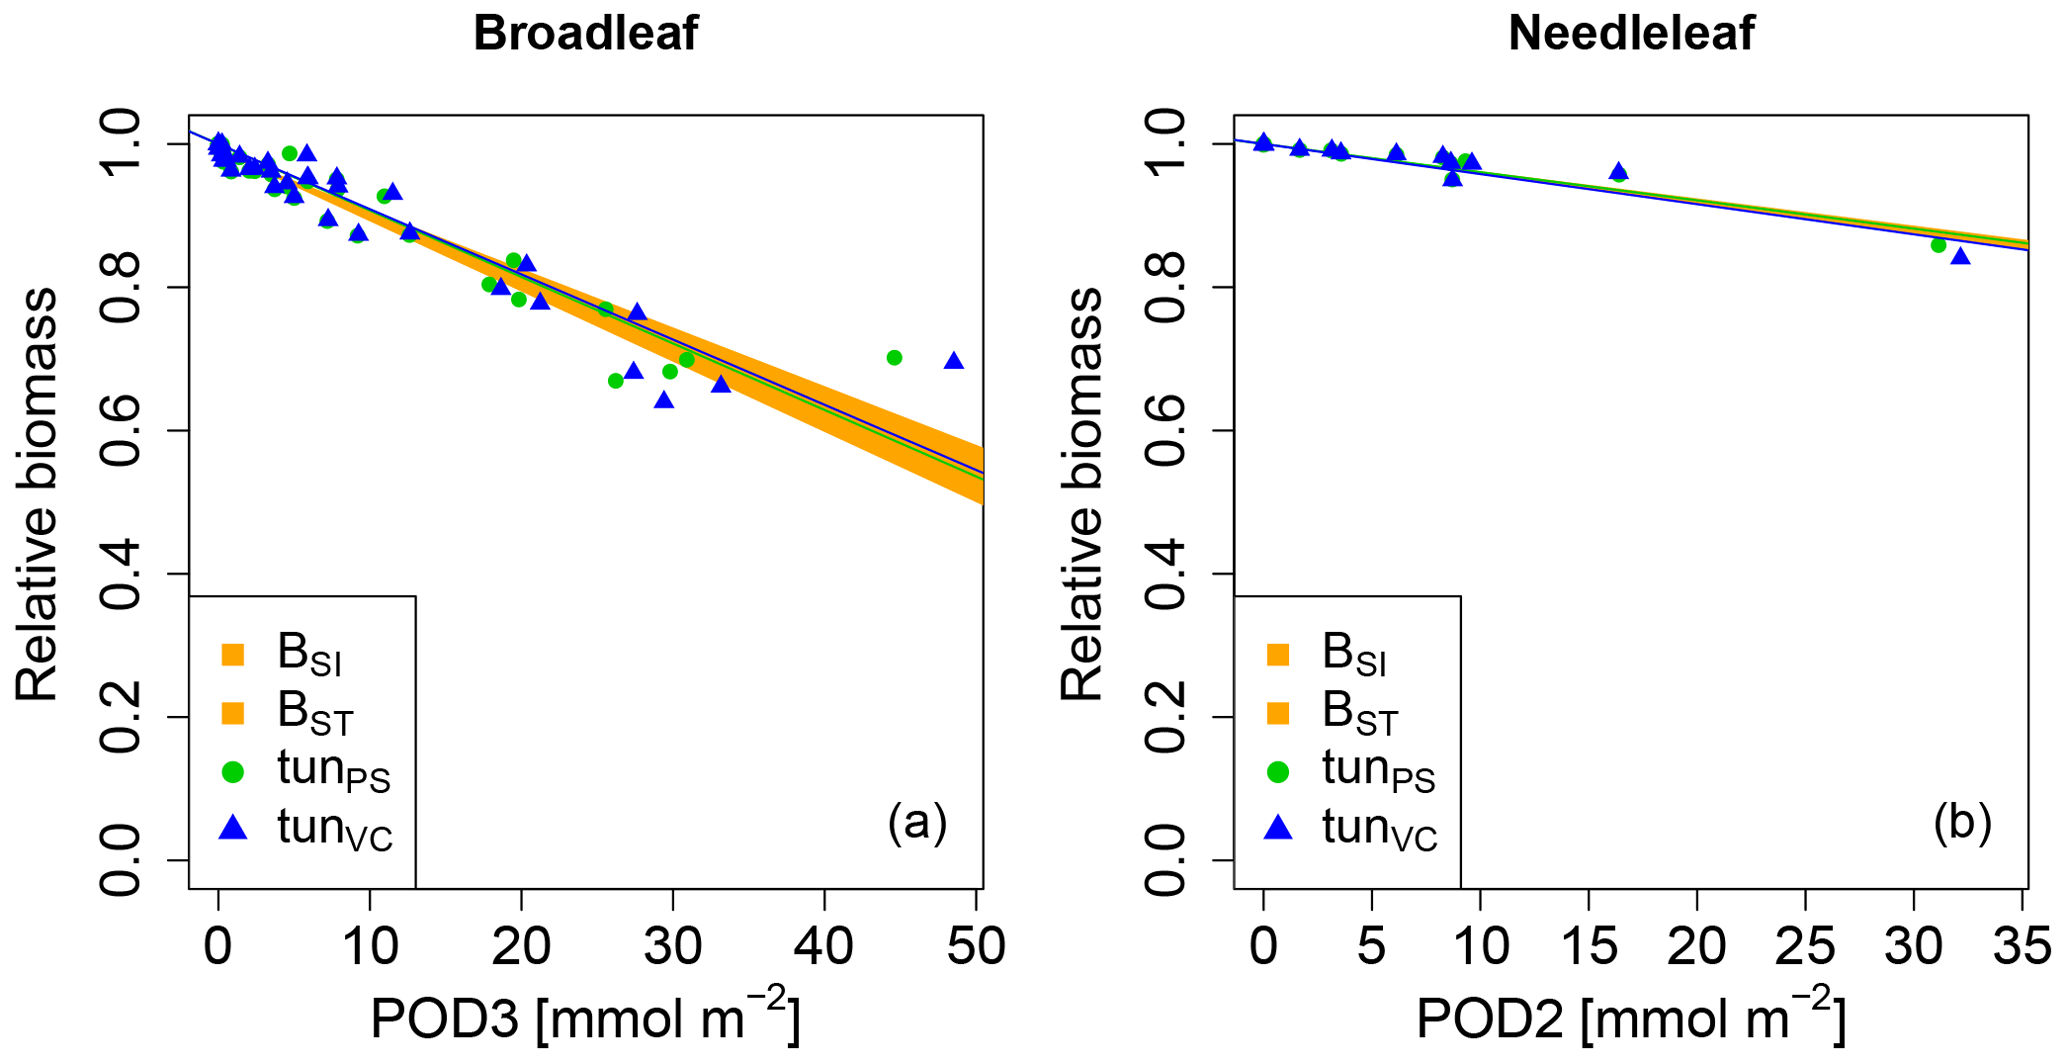
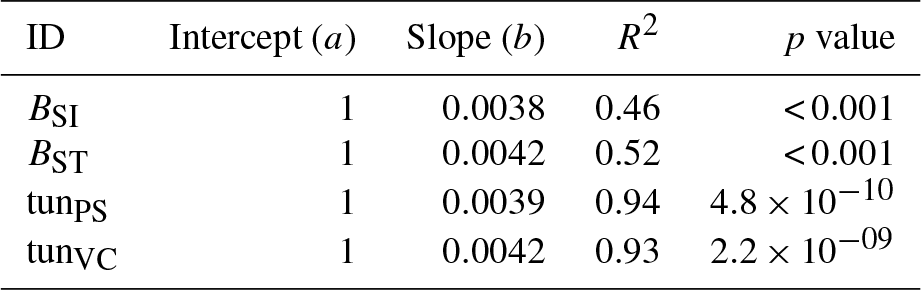
Figure 3Biomass dose–response relationships for simulations based on tuned injury functions (see Table 1 for abbreviations), separate for (a) broadleaved species and (b) needleleaf species. The dose–response relationships by Büker et al. (2015) (BSI and BST) define the target area (orange). See Tables A5 and A6 for slopes, intercepts, R2 and p values of the displayed regression lines. Injury calculation in the simulations is based on CUO1 (see Table 1) and not on POD2 or POD3 (see Sect. 2.5 for more details).
3.3 Ozone injury to mature trees
The simulation of young trees (simulated as in the previous section) compared to adult trees with the same model version reveals a distinct difference between the simulated-versus-observed dose–response relationship when expressed as reduction in biomass. Ozone injury causes a much shallower simulated biomass dose–response relationship for adult trees (tun in Fig. 4a, b) compared to young trees , both for broadleaved and needleleaf species. It is worth noting that this is primarily the consequence of the higher initial biomass of the adult trees before ozone fumigation starts . Comparing the dose–response relationship of young and mature trees based on the annual NPP shows nearly identical slopes for needleleaf species (Fig. 4d and Table 3), whereas the slopes for broadleaved tree species (Fig. 4c and Table 2) suggest only a slightly lower reduction in NPP in mature compared to young trees, likely related to the larger amount of non-structural reserves that increases the resilience of mature versus young trees.
Table 2Slopes and intercepts of biomass (RB) and NPP (RN) dose–response relationships (DRRs) for broadleaved species simulated by the tunVC model version (see Table 1). The fumigation of young trees with O3 is compared to the fumigation of mature trees .

Table 3Slopes and intercepts of biomass (RB) and NPP (RN) dose–response relationships (DRRs) for needleleaf species simulated by the tunVC model version (see Table 1). The fumigation of young trees with O3 is compared to the fumigation of mature trees .
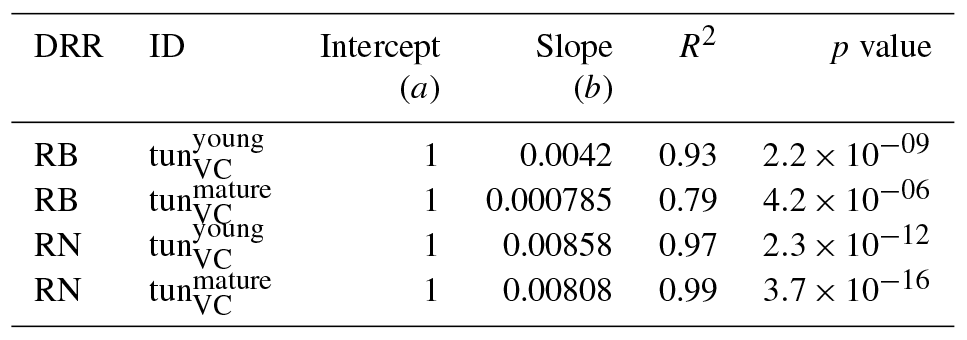
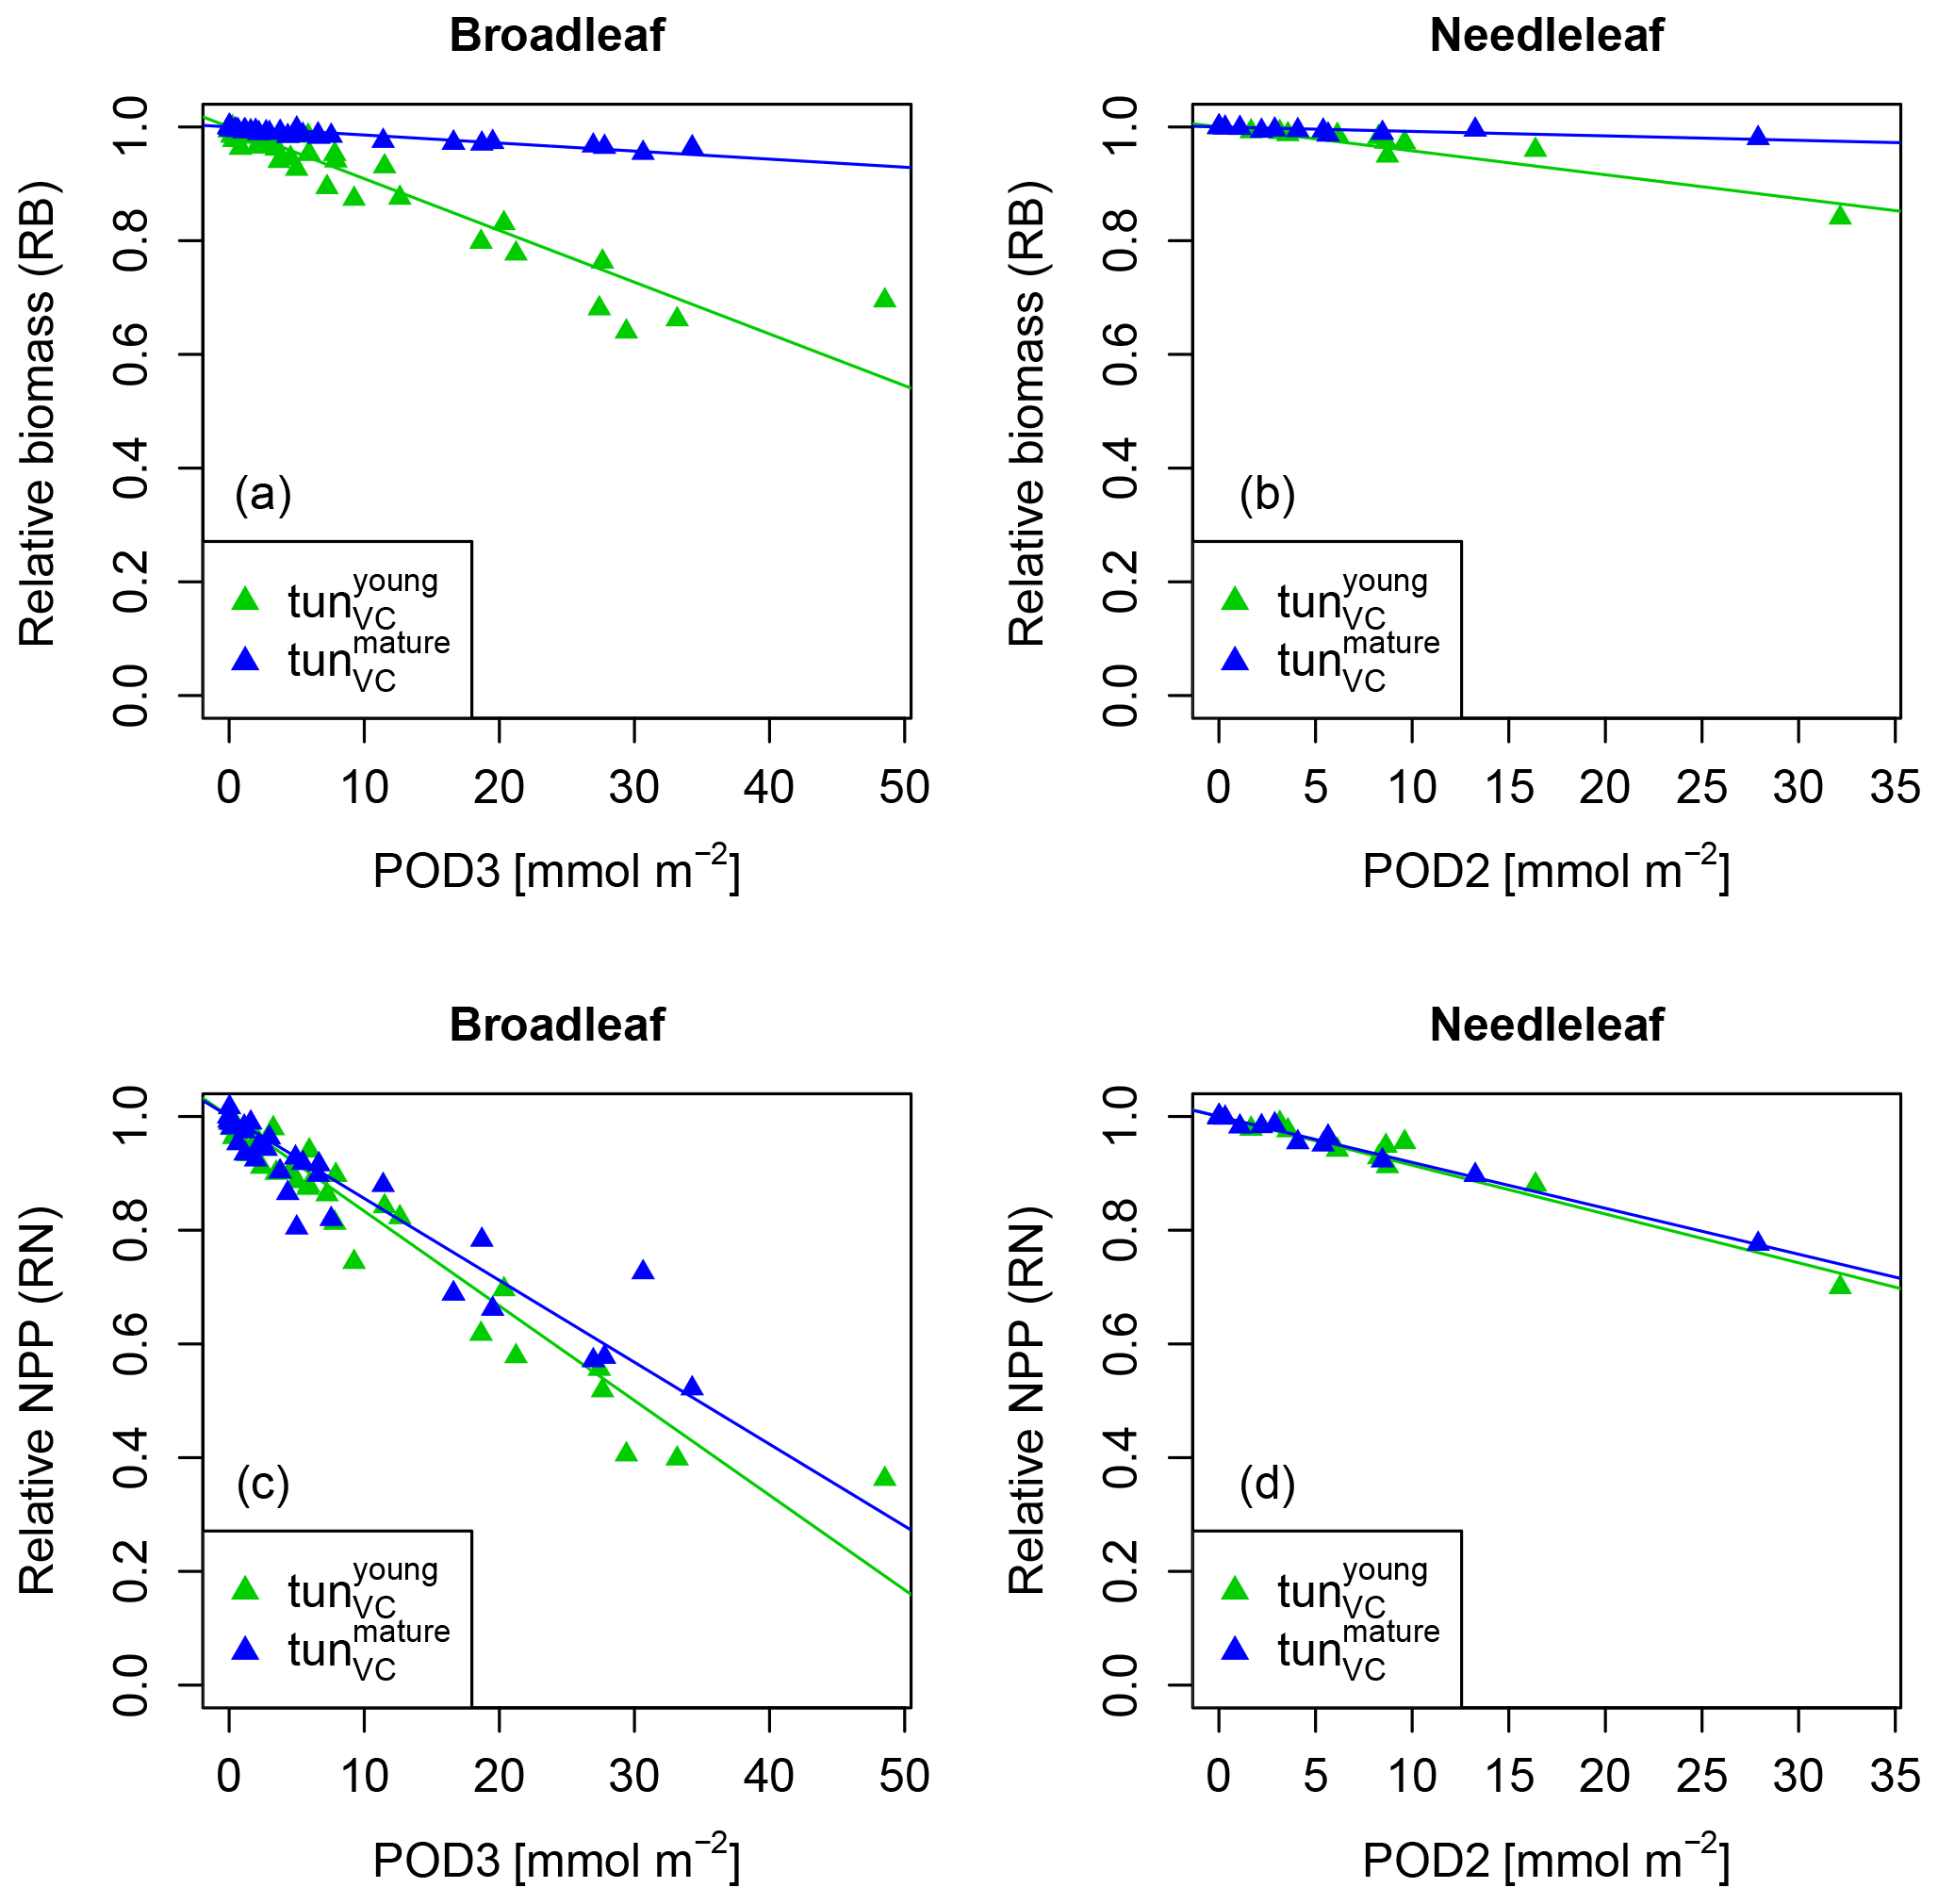
Figure 4Biomass (RB) and NPP (RN) dose–response relationships of simulations with young (tun) and mature trees (tun) separately for (a, c) broadleaf species and (b, d) needleleaf species.
Injury functions that relate accumulated ozone uptake to fundamental plant processes such as photosynthesis are a key component for models that aim to estimate the potential impacts of ozone pollution on forest productivity, growth and carbon sequestration. We tested four published injury functions for net photosynthesis and Vcmax within the framework of the O-CN model to assess their ability to reproduce the empirical whole-tree biomass dose–response relationships derived by Büker et al. (2015). The biomass dose–response relationships calculated from the O-CN simulations show that the parameterisation of the injury functions included in the model has a large impact on the simulated whole-tree biomass: the published injury functions either substantially over- or substantially underestimated whole-tree biomass reduction compared to the data presented by Büker et al. (2015). Our results highlight the importance for improved evaluation of injury functions applied in the simulation of ozone damage for large-scale risk assessments, and we discuss a number of important considerations for an improved parameterisation below.
The simulation results from the O-CN version applying an injury function based on a single, ozone-sensitive species (Lombardozzi et al., 2012a) to a range of European tree species leads to a strong overestimation of the simulated biomass damage compared to the observations used in this study. The problem of using such injury parameterisations based on short-term experiments of ozone-sensitive species is further highlighted when applying them in simulations of multiple season fumigation experiments and/or high ozone concentrations. Under such conditions, fumigation with high O3 concentrations can lead to lethal doses, which might not be observed in field experiments due to restricted experiment lengths. Previous studies have suggested that in large areas of Europe, the eastern US and southeast Asia average growing season values of CUOY for recent years range between 10 and 100 mmol O3 m−2 (Franz et al., 2017; Lombardozzi et al., 2015). The injury relationships L12PS and L12VC by Lombardozzi et al. (2012a) assume a 100 % injury to net photosynthesis or Vcmax at accumulation values of about 5 mmol O3 m−2. This would imply that in these large geographic regions, photosynthesis would have been completely impaired by ozone, which is clearly not the case. This result highlights the need for a representative set of species for the development of injury functions for large-scale biosphere models. Overall, our results suggest that the estimates by Lombardozzi et al. (2012a) of global GPP reduction as a result of ozone pollution are strongly overestimated.
Meta-analyses (Lombardozzi et al., 2013; Wittig et al., 2007) are designed to minimise the effect of species-specific ozone sensitivities and provide estimates of the average species response. However, we found that the relationships derived by these meta-analyses substantially underestimate biomass damage. Technically, the reasons for this are a weak or non-existent increase in the ozone injury with increased ozone uptake (shallow or non-existent slopes) and/or high ozone injury at zero accumulated ozone uptake (intercept lower than 1). Apparently, the diversity of species responses and experimental settings that are assembled in the meta-analyses by Wittig et al. (2007) and Lombardozzi et al. (2013), together with uncertainties in precisely estimating accumulated ozone uptake in these databases preclude the identification of injury functions that are consistent with the damage estimates by Büker et al. (2015). The high intercepts in the meta-analyses by Wittig et al. (2007) and Lombardozzi et al. (2013), which assume a considerable injury fraction even when no ozone is taken up at all, seem to be ecologically illogical and suggest that an alternative approach is necessary to simulate ozone injury. As a consequence of these points, the Europe-wide GPP reduction estimates by Franz et al. (2017), which have been based on the injury function by Wittig et al. (2007), may substantially underestimate actual GPP reduction. Similarly, global estimates as well as spatial variability in ozone damage to GPP by Lombardozzi et al. (2015), based on Lombardozzi et al. (2013), are virtually independent of actual ozone concentrations or uptake for all tree plant functional types and should be interpreted with caution.
A crucial aspect in forming dose–response relationships is the calculation of the accumulated ozone uptake (e.g. PODy or CUOY). The calculation of accumulated ozone uptake is realised in different ways in the meta-analyses and the study by Büker et al. (2015) as well as in our approach here. Experiments synthesised in the meta-analyses generally do not have access to stomatal conductance values at high resolution measured throughout the experiment, which impedes precise determination of O3 uptake. The uncertainty in the necessary approximations of accumulated ozone uptake can be assumed to be considerable, and it is thus highly recommendable to measure and report required observations in future ozone fumigation experiments. Büker et al. (2015) use the DO3SE model to simulate ozone uptake and accumulation in a similar way as in our model here. These modelled values for ozone uptake and accumulation can be assumed to be more reliable since both models simulate processes that determine ozone uptake continuously for the entire experiment length at high temporal resolution. They account for diurnal changes in stomatal conductance as well as climate factors restricting stomatal conductance and hence ozone uptake. However, both models vary in their complexity of the simulated plants, carbon assimilation and growth processes, which will also impact the estimates of ozone accumulation (PODy) and hence their suggested biomass dose–response relationships.
The meta-analyses do not account for non-stomatal ozone deposition (e.g. to the leaf cuticle or soil), which imposes a bias towards overestimating ozone uptake and accumulation, contrary to the DO3SE model used by Büker et al. (2015), which accounts for this. The O-CN model in principle can simulate non-stomatal ozone deposition from the free atmosphere to ground level (see Franz et al., 2017). The leaf boundary layer is implicitly included in the calculation of the aerodynamic resistance of O-CN and included in Franz et al. (2017). However, for the simulation of the chamber experiments we used the observed chamber O3 concentrations, rather than estimating the canopy-level O3 concentration based on the free atmosphere (approximately 45 m above the surface) and atmospheric turbulence. This required not accounting for aerodynamic resistance and therefore also the leaf-boundary layer resistance as it prevented the calculation of the non-stomatal deposition, which may lead to a slight overestimation of ozone uptake and accumulation in our simulations.
The calibration of injury functions to net photosynthesis and Vcmax shows that, in principle, the linear structure of Eq. (5) is sufficient to simulate biomass dose–response relationships comparable to Büker et al. (2015) in O-CN. An advantage of the injury functions derived here compared to previously published injury functions (Lombardozzi et al., 2012a, 2013; Wittig et al., 2007) is the intercept of 1, implying that simulated ozone injury is zero at zero accumulated O3 and steadily increases with increased ozone accumulation. The flux threshold used in the simulations is 1 nmol m−2 (leaf area) s−1 as suggested by the LRTAP-Convention (2017). Since the tuned injury functions are structurally identical to previously published injury functions based on accumulated ozone uptake, they can be directly compared to them. Slopes of the tuned injury functions lie in between the values proposed by Wittig et al. (2007) and Lombardozzi et al. (2012a) and thus take values in an expected range. We did not find any significant difference in simulated biomass responses between the use of net photosynthesis or leaf-specific photosynthetic capacity (Vcmax) as a target for the ozone injury function, although we do note that the slopes were slightly lower for the net photosynthesis-based functions. The simulation of ozone effects on leaf-specific photosynthetic capacity (Vcmax) seems preferable over the adjustment of net photosynthesis because Vcmax and Jmax are parameters in the calculation of net photosynthesis and thus are likely more easily transferable between models. Models with different approaches to simulate net photosynthesis might obtain better comparable results by using injury relationships that target Vcmax instead of net photosynthesis.
All injury functions included in the O-CN model base injury calculations on the injury index CUOY (canopy value) rather than PODy, as used by some other models, e.g. the DO3SE model (Emberson et al., 2000). We tested the effect of basing the injury calculation on POD1 rather than CUO1 and found that these produced comparable biomass dose–response relationships as the injury relationships based on CUO1 presented in Fig. 3 (results not shown). The slopes of injury functions based on POD1 are approximately two-thirds and half compared to the slopes based on CUO1 for broadleaved and needleleaf species, respectively. The difference in the slope values associated with POD1 and CUO1 results from the different calculation and application of them. PODy is calculated in the top canopy layer and the respective injury fraction is then applied uniformly to all canopy layers. CUOY and the associated injury fraction is calculated separately for each canopy layer and varies with the canopy profile of stomatal conductance and therefore the distribution of light and photosynthetic capacity (other factors such as vertical gradients of temperature or ozone are currently not represented in O-CN). More analysis of the gradients of ozone injury within deep canopies are required to evaluate whether the scaling of top-of-the-canopy injury to whole-canopy injury is appropriate or if alternative simulation approaches need to be developed. Higher-frequency data on the ozone injury incurred by plants are required to disentangle whether an ozone injury parameterisation based on instantaneous (e.g. similar to the approach by Sitch et al., 2007) or accumulated ozone uptake results in a more accurate simulation of the seasonal effects of ozone fumigation.
Further aspects that determine ozone sensitivity and damage to the carbon gain of plants, like leaf morphology (Bussotti, 2008; Calatayud et al., 2011), different sensitivity of sunlit and shaded leafs (Tjoelker et al., 1995; Wieser et al., 2002), early senescence (Ainsworth et al., 2012; Gielen et al., 2007), and costs for the detoxification of ozone and/or the repair of ozone injury that likely increases the plant's respiration costs (Dizengremel, 2001; Wieser and Matyssek, 2007), are not considered by either approach. Marzuoli et al. (2016) observed an ozone-induced reduction in biomass but no significant reduction in physiological parameters like Vcmax. They suggest that the reduced growth is caused by higher energy investments and reducing power for the detoxification of ozone whereas the photosynthetic apparatus remained uninjured (Marzuoli et al., 2016).
Species within the same plant functional type are known to exhibit different sensitivities to ozone (Büker et al., 2015; Mills et al., 2011; Wittig et al., 2007, 2009). This suggests that the application of a single injury function for a large set of species and plant functional types may not be sufficient to yield reliable estimates of large-scale damage estimates. Species interaction and competition, differing genotypes, and individuals ontogeny may further alter ozone impacts on plants and ecosystems (Matyssek et al., 2010). For instance, a modelling study using an individual-based forest model showed that ozone may not reduce the carbon sequestration capacity in forests if at the ecosystem level the reduced carbon fixation of ozone-sensitive species is compensated for by an increased carbon fixation of less ozone-sensitive species (Wang et al., 2016). First-generation dynamic global vegetation models such as O-CN do not simulate separate species but are based on plant functional types, which combine a large set of species. This restricts per se the ability of global models to simulate ozone-induced community dynamics and may therefore lead to overestimates of the net ozone impact if the parameterisation of the damage functions is entirely based on ozone-sensitive species. In our study, we have presented an approach to use the existing experimental evidence to parameterise a globally applicable model in a simple design to generate injury functions which are based on a relevant range of species rather than relying on species-specific injury functions as a first step towards a more reliable parameterisation of large-scale ozone damage.
Some studies have found that ozone-affected stomata respond much more slowly to environmental stimuli than unaffected cells (Paoletti and Grulke, 2005), which can delay closure and trigger stomatal sluggishness, an uncoupling of stomatal conductance and photosynthesis (Lombardozzi et al., 2012b; Reich, 1987; Tjoelker et al., 1995) and thus impact transpiration rates (Lombardozzi et al., 2012b; Mills et al., 2009; Paoletti and Grulke, 2010) and the plant's water use efficiency (Lombardozzi et al., 2012b; Mills et al., 2009; Wittig et al., 2007). The O-CN model is able to directly impair stomatal conductance, by uncoupling injury to net photosynthesis from the subsequent injury to stomatal conductance. In this version of the O-CN model, both net photosynthesis and stomatal conductance can directly be injured by individual injury functions. The simulation of this kind of direct injury to stomatal conductance additional to the injury of net photosynthesis, both according to the injury functions by Lombardozzi et al. (2013), have a negligible impact on biomass production compared to not accounting for direct injury to the stomata (results not shown). However, our above-mentioned concerns regarding the structure of the injury relationships by Lombardozzi et al. (2013) should be taken into account when considering this result.
A key challenge for the use of fumigation experiments to parameterise ozone injury in models is that trees (as opposed to grasses fumigated from seeds) typically possess a certain amount of biomass at the beginning of the fumigation experiment. Even at lethal ozone doses, the relative biomass thus cannot decline to zero, and tree death may occur at values of a relative biomass greater than zero. The relative biomass is positive even if carbon fixation is fully reduced and the plants survive due to the use of stored carbon. The higher the initial biomass and the slower the annual biomass growth rate of the tree is, the harder it is to obtain low values of RB. When comparing RB values obtained from trees with substantially different initial biomass and tree species with different growth rates, proportionate damage rates thus cannot be directly inferred. This indicates that the explanatory value of the relative biomass between a control and a treatment to estimate long-term plant damage at a given O3 concentration is limited. This is particularly the case when evaluating the damage of more mature forests. The simulated biomass dose–response relationships of adult trees are much more shallow than dose–response relationships of young trees (see Fig. 4) because of the high initial biomass prior to fumigation. This suggests that the use of biomass injury functions derived from experiments with young trees to parameterise the biomass loss of adult trees, as done in Sitch et al. (2007), will likely lead to an overestimation of plant damage and loss of carbon storage. Dose–response relationships based on biomass increments or growth rates might be better transferable between young and mature trees and hence better suitable for parameterising global terrestrial biosphere models.
Our approach to overcome this challenge was to alter the vegetation model to simulate the ozone damage of young trees, where we could directly compare simulated biomass reductions to observations. Since we used injury relationships that are based on the calculation of leaf-level photosynthesis, we are able to apply the calibrated model also for mature stands. Our simulations have demonstrated that despite the different sizes of young and mature trees and associated changes in the wood growth rate and the available amount of non-structural carbon reserves to repair incurred injury, the simulated effect of ozone on the net annual biomass production (NPP) was very similar when using an injury function associated with leaf-level photosynthesis. Overall our findings support the idea that the photosynthesis-based injury relationships developed here and evaluated against fumigation experiments of young trees might be useful to estimate effect on forest production of older trees. Monitoring approaches of ozone damage that are either capable of measuring the actual increment of biomass or quantify at the leaf and canopy level the change in net photosynthesis over the growing season would allow us to develop injury/damage estimates that could be more readily translated into modelling frameworks.
The extrapolation of results from short-term experiments with young trees to estimate responses of adult trees grown under natural conditions is subject to several issues, e.g. due to the differing environmental conditions and changing ozone sensitivities with increasing tree size or age (Cailleret et al., 2018; Schaub et al., 2005). It is still uncertain whether the simulation of injury to photosynthesis based on experiments with young trees can indeed be transferred to adult trees to yield realistic biomass damage estimates. The sparse knowledge of ozone effects on the biomass of adult forest trees prevents an evaluation of simulated ozone damage of adult trees. Ozone fumigation is mostly found to reduce the biomass or diameter of adult trees (e.g. Matyssek et al., 2010 for an overview), but this is not always the case (Percy et al., 2007; Samuelson et al., 1996). Results from phytotron and free-air fumigation studies suggest that in natural forests, a multitude of abiotic and biotic factors exist that have the potential to impact the plants ozone effects (Matyssek et al., 2010). If more data become available, e.g. regarding the changes in ozone sensitivity between young and mature trees, a more realistic damage parameterisation of mature forests in terrestrial biosphere models might become possible.
Terrestrial biosphere models in general assume that plant growth is primarily determined by carbon uptake. However, an alternative concept proposes that plant growth is more limited by direct environmental controls (temperature, water and nutrient availability) than by carbon uptake and photosynthesis (Fatichi et al., 2014). The O-CN model provides a first step into this direction because it separates the step of carbon acquisition from biomass production, both in terms of a non-structural carbon buffer as well as a stoichiometric nutrient limitation on growth independent of the current photosynthetic rate. This would in principle allow us to account for ozone effects on the carbon sink dynamics within plants. However, it is not clear that data readily exist to parameterise such effects. Instead of targeting net photosynthesis as done in our approach here, ozone injury might be better simulated by targeting biomass growth rates or processes that limit these, e.g. stomatal conductance, which impacts the plants' water balance, assuming that suitable data to parameterise a large-scale model become available.
All in all, a multitude of aspects that impact ozone damage to plants has not yet been incorporated into global terrestrial biosphere models. The ongoing discussion of which processes are major drivers for observed damage, how they interact and impact different species and plant types, and the lack of suitable data needed to parameterise a global model are reasons why the simulation of ozone damage has up to now focussed only on a few aspects where suitable data are available, as presented in our study.
The inclusion of previously published injury functions in the terrestrial biosphere model O-CN led to a strong over- or underestimation of simulated biomass damage compared to the biomass dose–response relationship by Büker et al. (2015). Injury functions included in terrestrial biosphere models are a key aspect in the simulation of ozone damage and have a great impact on the estimated damage in large-scale ozone risk assessments. The calibration of injury functions performed in this study provides the advantage of calculating ozone injury close to where the actual physiological injury might occur (photosynthetic apparatus) and simultaneously reproduces observed biomass damage relationships for a range of European forest species used by Büker et al. (2015). The calibration of ozone injury functions similar to our approach here in other ozone sub-models of terrestrial biosphere models might improve damage estimates compared to previously published injury functions and might lead to better estimates of terrestrial carbon sequestration. The comparison of simulated biomass dose–response relationships of young and mature trees shows strongly different slopes. This suggests that observed biomass damage relationships from young trees might not be suitable for estimating the biomass damage of mature trees. The comparison of simulated NPP dose–response relationships of young and mature trees shows similar slopes and suggests that they might more readily be transferred between trees differing in age.
For data on the ozone fumigation/filtration experiments, please see Büker et al. (2015). The model source code can be found in Franz and Zaehle (2018).
Table A1Original and adapted values of the nitrogen-specific photosynthetic capacity of a leaf (npl) for three out of four different O-CN versions (ID) including published injury functions. The intercept of the fourth O-CN version (L12VC) is very close to 1 and simulations produce comparable LAI values without an adaption of npl.
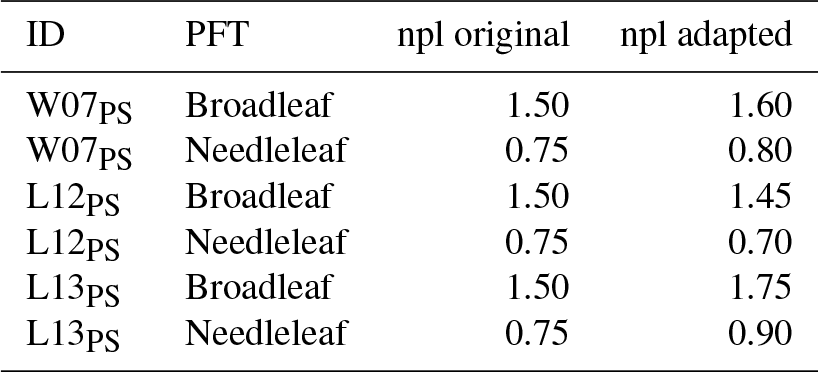
Table A2List of fumigation experiments used by Büker et al. (2015) and simulated here.
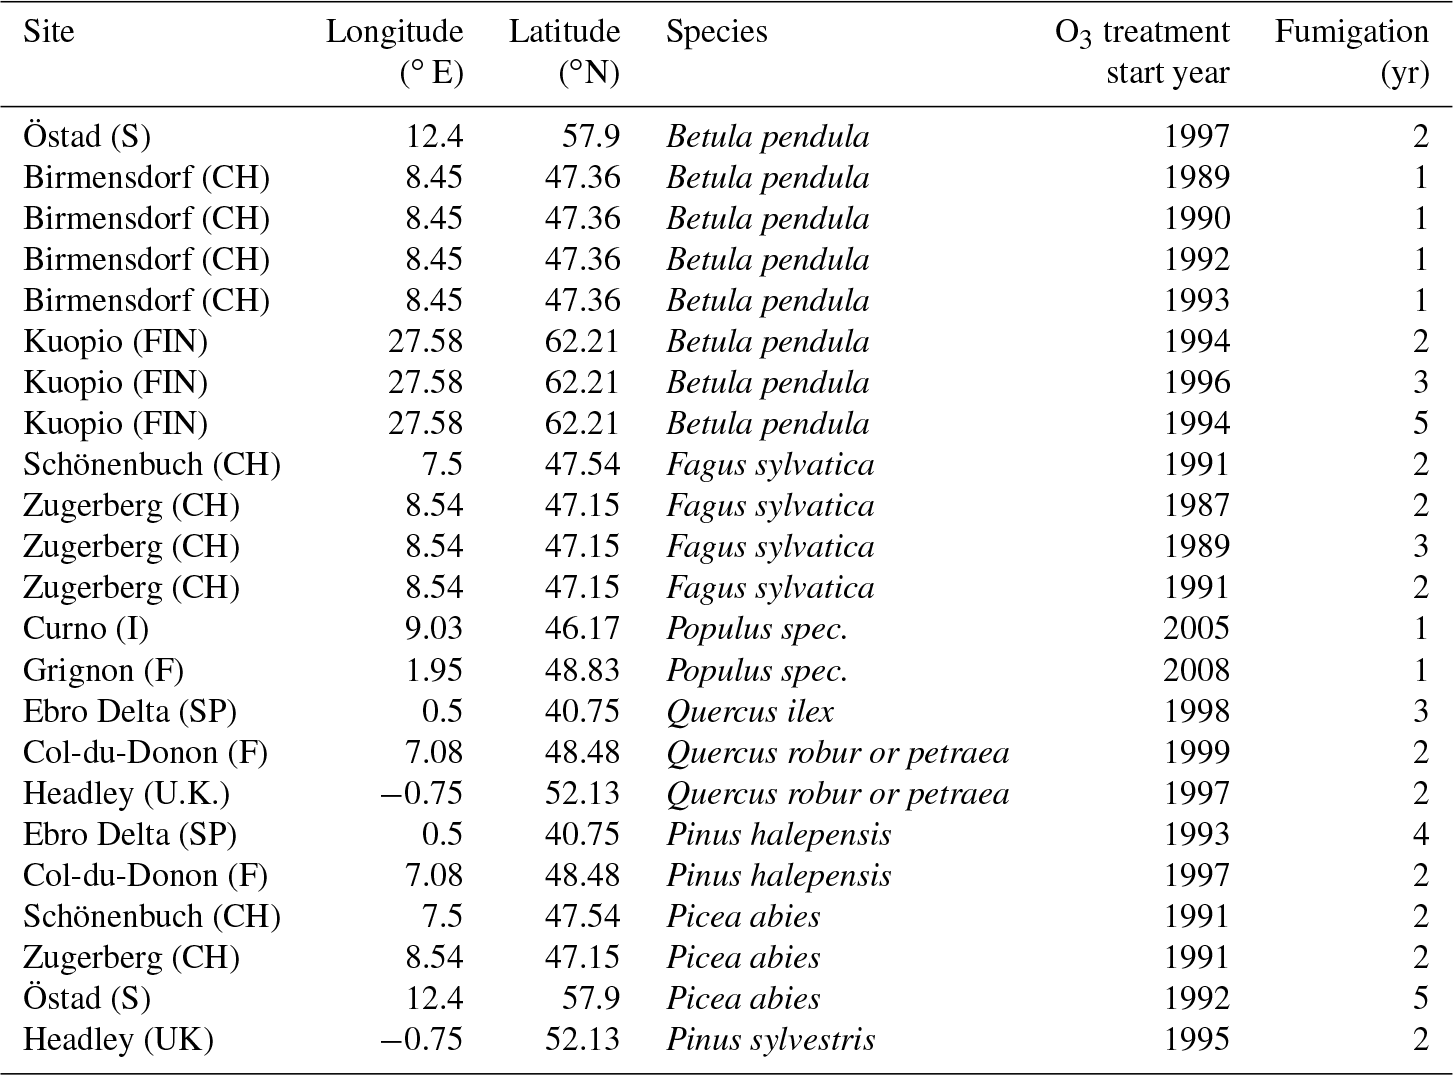
Table A3Slopes and intercepts of biomass dose–response relationships for broadleaved species simulated by O-CN versions based on published injury functions to net photosynthesis or Vcmax (see Table 1). BSI and BST represent the simple and standard model of Büker et al. (2015). A dash (“–”) indicates that no values were available.
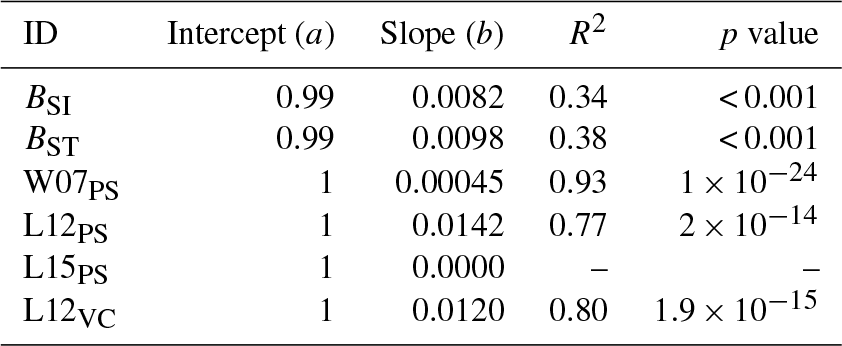
Table A4Slopes and intercepts of biomass dose–response relationships for needleleaf species simulated by O-CN versions based on published injury functions to net photosynthesis or Vcmax (see Table 1). BSI and BST represent the simple and standard model by Büker et al. (2015). A dash (“–”) indicates that no values were available.
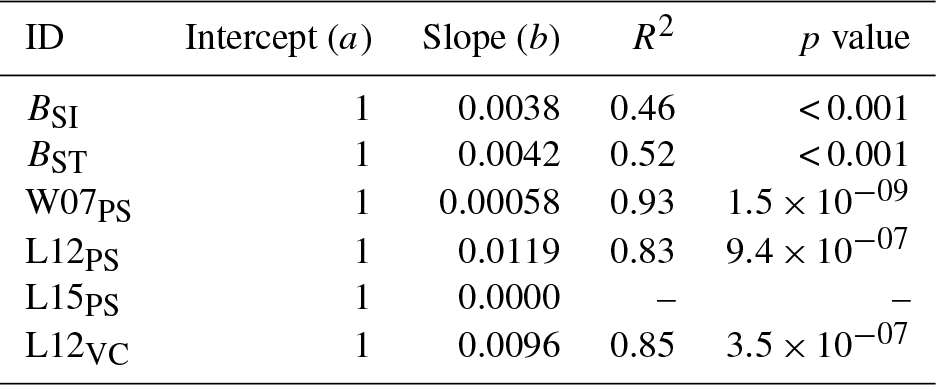
Table A5Slopes and intercepts of biomass dose–response relationships for broadleaved species simulated by O-CN versions based on tuned injury functions to net photosynthesis or Vcmax (see Table 1). BSI and BST represent the simple and standard model by Büker et al. (2015).

Table A6Slopes and intercepts of biomass dose–response relationships for needleleaf species simulated by O-CN versions based on tuned injury functions to net photosynthesis or Vcmax (see Table 1). BSI and BST represent the simple and standard model by Büker et al. (2015).
MF and SZ developed the experiment design. MF developed the model, performed the simulations and analyses, and led the writing of the paper. PB shared the data from Büker et al. (2015). All co-authors contributed to writing of the paper.
The authors declare that they have no conflict of interest.
We would like to thank Per Erik Karlsson of the IVL Swedish Environmental
Research Institute, Göteborg, Sweden, Sabine Braun of the Institute for
Applied Plant Biology, Witterswil, Switzerland, and Gerhard Wieser of the
Federal Research and Training Centre for Forests, Natural Hazards and
Landscape (BFW), Innsbruck, Austria, for providing collected data from their
ozone fumigation experiments. The research leading to this publication was
supported by the EU Framework programme through grant no. 282910 (ECLAIRE) and the Max Planck Society for the Advancement of Science e.V. through the
ENIGMA project. This project has received funding from the European Research
Council (ERC) under the European Union's Horizon 2020 research and innovation
programme (grant agreement no. 647204; QUINCY).
The article processing charges for this open-access
publication were covered by the Max Planck Society.
Edited by: Martin De Kauwe
Reviewed by: Bin Wang and Marcus Schaub
Ainsworth, E. A., Yendrek, C. R., Sitch, S., Collins, W. J., and Emberson, L. D.: The Effects of Tropospheric Ozone on Net Primary Productivity and Implications for Climate Change, Annu. Rev. Plant Biol., 63, 637–661, 2012. a, b, c, d
Ball, J. T., Woodrow, I. E., and Berry, J. A.: A model predicting stomatal conductance and its contribution to the control of photosynthesis under different environmental conditions, Prog. Photosynthesis Res. Proc. Int. Congress 7th, Providence, 10–15 August 1986, 221–224, 1987. a
Büker, P., Feng, Z., Uddling, J., Briolat, A., Alonso, R., Braun, S., Elvira, S., Gerosa, G., Karlsson, P., Le Thiec, D., Marzuoli, R., Mills, G., Oksanen, E., Wieser, G., , Wilkinson, M., and Emberson, L.: New flux based dose-response relationships for ozone for European forest tree species, Environ. Pollut., 206, 163–174, https://doi.org/10.1016/j.envpol.2015.06.033, 2015. a, b, c, d, e, f, g, h, i, j, k, l, m, n, o, p, q, r, s, t, u, v, w, x, y, z, aa, ab, ac, ad, ae, af, ag, ah, ai, aj, ak, al, am, an, ao
Bussotti, F.: Functional leaf traits, plant communities and acclimation processes in relation to oxidative stress in trees: a critical overview, Glob. Change Biol., 14, 2727–2739, 2008. a
Cailleret, M., Ferretti, M., Gessler, A., Rigling, A., and Schaub, M.: Ozone effects on European forest growth – Towards an integrative approach, J. Ecol., 106, 1377–1389, 2018. a, b
Calatayud, V., Cerveró, J., Calvo, E., García-Breijo, F.-J., Reig-Armiñana, J., and Sanz, M. J.: Responses of evergreen and deciduous Quercus species to enhanced ozone levels, Environ. Pollut., 159, 55–63, 2011. a
Dizengremel, P.: Effects of ozone on the carbon metabolism of forest trees, Plant Physiol. and Bioch., 39, 729–742, 2001. a
Emberson, L., Simpson, D., Tuovinen, J., Ashmore, M., and Cambridge, H.: Towards a model of ozone deposition and stomatal uptake over Europe, EMEP MSC-W Note, 6, 1–57, 2000. a, b
Fatichi, S., Leuzinger, S., and Koerner, C.: Moving beyond photosynthesis: from carbon source to sink-driven vegetation modeling, New Phytol., 201, 1086–1095, https://doi.org/10.1111/nph.12614, 2014. a
Feng, Z. and Kobayashi, K.: Assessing the impacts of current and future concentrations of surface ozone on crop yield with meta-analysis, Atmos. Environ., 43, 1510–1519, 2009. a
Franz, M. and Zaehle, S.: O-CN ozone version rev 298, available at: https://projects.bgc-jena.mpg.de/OCN/browser/branches/ozone (last access: 19 November 2018.), 2018. a, b
Franz, M., Simpson, D., Arneth, A., and Zaehle, S.: Development and evaluation of an ozone deposition scheme for coupling to a terrestrial biosphere model, Biogeosciences, 14, 45–71, https://doi.org/10.5194/bg-14-45-2017, 2017. a, b, c, d, e, f, g, h, i, j, k, l, m, n
Friend, A.: Modelling canopy CO2 fluxes: are “big-leaf” simplifications justified?, Global Ecol. Biogeogr., 10, 603–619, 2001. a
Gielen, B., Löw, M., Deckmyn, G., Metzger, U., Franck, F., Heerdt, C., Matyssek, R., Valcke, R., and Ceulemans, R.: Chronic ozone exposure affects leaf senescence of adult beech trees: a chlorophyll fluorescence approach., J. Exp. Bot., 58, 785–795, https://doi.org/10.1093/jxb/erl222, 2007. a
Guderian, R.: Air Pollution. Phytotoxicity of Acidic Gases and Its Significance in Air Pollution Control, Springer-Verlag, New York, 1977. a
Hanson, P., Samuelson, L., Wullschleger, S., Tabberer, T., and Edwards, G.: Seasonal patterns of light-saturated photosynthesis and leaf conductance for mature and seedling Quercus rubra L. foliage: differential sensitivity to ozone exposure, Tree Physiol., 14, 1351–1366, 1994. a
Harmens, H. and Mills, G.: Ozone Pollution: Impacts on carbon sequestration in Europe, NERC/Centre for Ecology & Hydrology, 2012. a
Karlsson, P. E., Uddling, J., Braun, S., Broadmeadow, M., Elvira, S., Gimeno, B. S., Le Thiec, D., Oksanen, E., Vandermeiren, K., Wilkinson, M., and Emberson, L.: New critical levels for ozone effects on young trees based on AOT40 and simulated cumulative leaf uptake of ozone, Atmos. Environ., 38, 2283–2294, 2004. a, b, c
Kolb, T. and Matyssek, R.: Limitations and perspectives about scaling ozone impacts in trees, Environ. Pollut., 115, 373–393, 2001. a
Krinner, G., Viovy, N., de Noblet-Ducoudré, N., Ogée, J., Polcher, J., Friedlingstein, P., Ciais, P., Sitch, S., and Prentice, I.: A dynamic global vegetation model for studies of the coupled atmosphere-biosphere system, Global Biogeochem. Cy., 19, GB1015, https://doi.org/10.1029/2003GB002199, 2005. a, b
Laisk, A., Kull, O., and Moldau, H.: Ozone concentration in leaf intercellular air spaces is close to zero, Plant Physiol., 90, 1163–1167, 1989. a
Li, P., Feng, Z., Catalayud, V., Yuan, X., Xu, Y., and Paoletti, E.: A meta-analysis on growth, physiological and biochemical responses of woody species to ground-level ozone highlights the role of plant functional types, Plant Cell Environ., 40, 2369–2380, 2017. a
Lombardozzi, D., Levis, S., Bonan, G., and Sparks, J. P.: Predicting photosynthesis and transpiration responses to ozone: decoupling modeled photosynthesis and stomatal conductance, Biogeosciences, 9, 3113–3130, https://doi.org/10.5194/bg-9-3113-2012, 2012a. a, b, c, d, e, f, g, h, i, j, k, l, m, n, o, p, q, r, s
Lombardozzi, D., Sparks, J., Bonan, G., and Levis, S.: Ozone exposure causes a decoupling of conductance and photosynthesis: implications for the Ball-Berry stomatal conductance model, Oecologia, 169, 1–9, 2012b. a, b, c
Lombardozzi, D., Sparks, J. P., and Bonan, G.: Integrating O3 influences on terrestrial processes: photosynthetic and stomatal response data available for regional and global modeling, Biogeosciences, 10, 6815–6831, https://doi.org/10.5194/bg-10-6815-2013, 2013. a, b, c, d, e, f, g, h, i, j, k, l, m, n, o, p, q, r
Lombardozzi, D., Levis, S., Bonan, G., Hess, P., and Sparks, J.: The Influence of Chronic Ozone Exposure on Global Carbon and Water Cycles, J. Climate, 28, 292–305, 2015. a, b, c, d, e, f
LRTAP-Convention: Manual on Methodologies and Criteria for Modelling and Mapping Critical Loads and Levels; and Air Pollution Effects, Risks and Trends, available at: https://icpvegetation.ceh.ac.uk/sites/default/files/Chapter 3 - Mapping critical levels for vegetation.pdf (last access: 14 November 2018), 2017. a, b, c, d
Marzuoli, R., Gerosa, G., Desotgiu, R., Bussotti, F., and Denti, A. B.: Ozone fluxes and foliar injury development in the ozone-sensitive poplar clone Oxford (Populus maximowiczii x Populus berolinensis): a dose-response analysis, Tree Physiol., 29, 67–76, https://doi.org/10.1093/treephys/tpn012, 2009. a
Marzuoli, R., Monga, R., Finco, A., and Gerosa, G.: Biomass and physiological responses of Quercus robur (L.) young trees during 2 years of treatments with different levels of ozone and nitrogen wet deposition, Trees, 30, 1995–2010, 2016. a, b
Massman, W.: A review of the molecular diffusivities of H2O, CO2, CH4, CO, O3, SO2, NH3, N2O, NO, AND NO2 in air, O2 AND N2 near STP, Atmos. Environ., 32, 1111–1127, https://doi.org/10.1016/S1352-2310(97)00391-9, 1998. a
Matyssek, R., Karnosky, D. F., Wieser, G., Percy, K., Oksanen, E., Grams, T. E. E., Kubiske, M., Hanke, D., and Pretzsch, H.: Advances in understanding ozone impact on forest trees: Messages from novel phytotron and free-air fumigation studies, Environ. Pollut., 158, 1990–2006, https://doi.org/10.1016/j.envpol.2009.11.033, 2010. a, b, c
Mills, G., Hayes, F., Wilkinson, S., and Davies, W.: Chronic exposure to increasing background ozone impairs stomatal functioning in grassland species, Glob. Change Biol., 15, 1522–1533, 2009. a, b
Mills, G., Pleijel, H., Braun, S., Büker, P., Bermejo, V., Calvo, E., Danielsson, H., Emberson, L., Fernández, I., Grünhage, L., Harmens, H., Hayes, F., Karlsson, P., and Simpson, D.: New stomatal flux-based critical levels for ozone effects on vegetation, Atmos. Environ., 45, 5064–5068, 2011. a, b
Morgan, P., Ainsworth, E., and Long, S.: How does elevated ozone impact soybean? A meta-analysis of photosynthesis, growth and yield, Plant Cell Environ., 26, 1317–1328, 2003. a, b
Niinemets, Ü., Keenan, T. F., and Hallik, L.: A worldwide analysis of within-canopy variations in leaf structural, chemical and physiological traits across plant functional types, New Phytol., 205, 973–993, 2015. a
Nunn, A., Weiser, G., Reiter, I., Häberle, K., Grote, R., Havranek, W., and Matyssek, R.: Testing the unifying theory of ozone sensitivity with mature trees of Fagus sylvatica and Picea abies, Tree Physiol., 26, 1391–1403, 2006. a
Oliver, R. J., Mercado, L. M., Sitch, S., Simpson, D., Medlyn, B. E., Lin, Y.-S., and Folberth, G. A.: Large but decreasing effect of ozone on the European carbon sink, Biogeosciences, 15, 4245–4269, https://doi.org/10.5194/bg-15-4245-2018, 2018. a, b
Paoletti, E. and Grulke, N.: Does living in elevated CO2 ameliorate tree response to ozone? A review on stomatal responses, Environ. Pollut., 137, 483–493, 2005. a
Paoletti, E. and Grulke, N.: Ozone exposure and stomatal sluggishness in different plant physiognomic classes, Environ. Pollut., 158, 2664–2671, 2010. a
Paoletti, E., Contran, N., Bernasconi, P., Günthardt-Goerg, M. S., and Vollenweider, P.: Erratum to “Structural and physiological responses to ozone in Manna ash (Fraxinus ornus L.) leaves of seedlings and mature trees under controlled and ambient conditions”, Sci. Total Environ., 408, 2014–2024, 2010. a
Percy, K., Nosal, M., Heilman, W., Dann, T., Sober, J., Legge, A., and Karnosky, D.: New exposure-based metric approach for evaluating O3 risk to North American aspen forests, Environ. Pollut., 147, 554–566, 2007. a
Pleijel, H., Danielsson, H., Ojanperä, K., Temmerman, L. D., Högy, P., Badiani, M., and Karlsson, P.: Relationships between ozone exposure and yield loss in European wheat and potato – a comparison of concentration-and flux-based exposure indices, Atmos. Environ., 38, 2259–2269, 2004. a, b, c, d
Reich, P.: Quantifying plant response to ozone: a unifying theory, Tree Physiol., 3, 63–91, 1987. a
Samuelson, L. and Kelly, J.: Carbon partitioning and allocation in northern red oak seedlings and mature trees in response to ozone, Tree Physiol., 16, 853–858, 1996. a
Samuelson, L., Kelly, J., Mays, P., and Edwards, G.: Growth and nutrition of Quercus rubra L. seedlings and mature trees after three seasons of ozone exposure, Environ. Pollut., 91, 317–323, 1996. a
Schaub, M., Skelly, J., Zhang, J., Ferdinand, J., Savage, J., Stevenson, R., Davis, D., and Steiner, K.: Physiological and foliar symptom response in the crowns of Prunus serotina, Fraxinus americana and Acer rubrum canopy trees to ambient ozone under forest conditions, Environ. Pollut., 133, 553–567, 2005. a
Simpson, D., Andersson, C., Christensen, J. H., Engardt, M., Geels, C., Nyiri, A., Posch, M., Soares, J., Sofiev, M., Wind, P., and Langner, J.: Impacts of climate and emission changes on nitrogen deposition in Europe: a multi-model study, Atmos. Chem. Phys., 14, 6995–7017, https://doi.org/10.5194/acp-14-6995-2014, 2014. a
Sitch, S., Cox, P., Collins, W., and Huntingford, C.: Indirect radiative forcing of climate change through ozone effects on the land-carbon sink, Nature, 448, 791–794, 2007. a, b, c, d, e, f, g, h
Sitch, S., Friedlingstein, P., Gruber, N., Jones, S. D., Murray-Tortarolo, G., Ahlström, A., Doney, S. C., Graven, H., Heinze, C., Huntingford, C., Levis, S., Levy, P. E., Lomas, M., Poulter, B., Viovy, N., Zaehle, S., Zeng, N., Arneth, A., Bonan, G., Bopp, L., Canadell, J. G., Chevallier, F., Ciais, P., Ellis, R., Gloor, M., Peylin, P., Piao, S. L., Le Quéré, C., Smith, B., Zhu, Z., and Myneni, R.: Recent trends and drivers of regional sources and sinks of carbon dioxide, Biogeosciences, 12, 653–679, https://doi.org/10.5194/bg-12-653-2015, 2015. a
Tjoelker, M., Volin, J., Oleksyn, J., and Reich, P.: Interaction of ozone pollution and light effects on photosynthesis in a forest canopy experiment, Plant Cell Environ., 18, 895–905, 1995. a, b
Wang, B., Shugart, H. H., Shuman, J. K., and Lerdau, M. T.: Forests and ozone: productivity, carbon storage, and feedbacks, Sci. Rep.-UK, 6, 22133, https://doi.org/10.1038/srep22133, 2016. a
Wieser, G. and Matyssek, R.: Linking ozone uptake and defense towards a mechanistic risk assessment for forest trees, New Phytol., 174, 7–9, 2007. a, b, c
Wieser, G., Hecke, K., Tausz, M., Haberle, K., Grams, T., and Matyssek, R.: The role of antioxidative defense in determining ozone sensitivity of Norway spruce (Picea abies (L.) Karst.) across tree age: Implications for the sun-and shade-crown, PHYTON-HORN-, 42, 245–254, 2002. a
Wittig, V., Ainsworth, E., and Long, S.: To what extent do current and projected increases in surface ozone affect photosynthesis and stomatal conductance of trees? A meta-analytic review of the last 3 decades of experiments, Plant Cell Environ., 30, 1150–1162, 2007. a, b, c, d, e, f, g, h, i, j, k, l, m, n, o, p, q, r, s
Wittig, V., Ainsworth, E., Naidu, S., Karnosky, D., and Long, S.: Quantifying the impact of current and future tropospheric ozone on tree biomass, growth, physiology and biochemistry: a quantitative meta-analysis, Glob. Change Biol., 15, 396–424, 2009. a, b, c
Zaehle, S. and Friend, A.: Carbon and nitrogen cycle dynamics in the O-CN land surface model: 1. Model description, site-scale evaluation, and sensitivity to parameter estimates, Global Biogeochem. Cy., 24, GB1005, https://doi.org/10.1029/2009GB003521, 2010. a, b, c, d, e