the Creative Commons Attribution 4.0 License.
the Creative Commons Attribution 4.0 License.
 | 27 Nov 2018
Alteration of nitrous oxide emissions from floodplain soils by aggregate size, litter accumulation and plant–soil interactions
Martin Ley
Moritz F. Lehmann
Pascal A. Niklaus
Jörg Luster
Semi-terrestrial soils such as floodplain soils are considered potential hot spots of nitrous oxide (N2O) emissions. Microhabitats in the soil – such as within and outside of aggregates, in the detritusphere, and/or in the rhizosphere – are considered to promote and preserve specific redox conditions. Yet our understanding of the relative effects of such microhabitats and their interactions on N2O production and consumption in soils is still incomplete. Therefore, we assessed the effect of aggregate size, buried leaf litter, and plant–soil interactions on the occurrence of enhanced N2O emissions under simulated flooding/drying conditions in a mesocosm experiment. We used two model soils with equivalent structure and texture, comprising macroaggregates (4000–250 µm) or microaggregates (<250 µm) from a N-rich floodplain soil. These model soils were planted with basket willow (Salix viminalis L.), mixed with leaf litter or left unamended. After 48 h of flooding, a period of enhanced N2O emissions occurred in all treatments. The unamended model soils with macroaggregates emitted significantly more N2O during this period than those with microaggregates. Litter addition modulated the temporal pattern of the N2O emission, leading to short-term peaks of high N2O fluxes at the beginning of the period of enhanced N2O emission. The presence of S. viminalis strongly suppressed the N2O emission from the macroaggregate model soil, masking any aggregate-size effect. Integration of the flux data with data on soil bulk density, moisture, redox potential and soil solution composition suggest that macroaggregates provided more favourable conditions for spatially coupled nitrification–denitrification, which are particularly conducive to net N2O production. The local increase in organic carbon in the detritusphere appears to first stimulate N2O emissions; but ultimately, respiration of the surplus organic matter shifts the system towards redox conditions where N2O reduction to N2 dominates. Similarly, the low emission rates in the planted soils can be best explained by root exudation of low-molecular-weight organic substances supporting complete denitrification in the anoxic zones, but also by the inhibition of denitrification in the zone, where rhizosphere aeration takes place. Together, our experiments highlight the importance of microhabitat formation in regulating oxygen (O2) content and the completeness of denitrification in soils during drying after saturation. Moreover, they will help to better predict the conditions under which hot spots, and “hot moments”, of enhanced N2O emissions are most likely to occur in hydrologically dynamic soil systems like floodplain soils.
- Article
(1262 KB) - Full-text XML
-
Supplement
(268 KB) - BibTeX
- EndNote


Nitrous oxide (N2O) is a potent greenhouse gas with a global warming potential over a 100-year time horizon that is 298 times higher than the one of carbon dioxide (Forster et al., 2007). Given its role as a climate-relevant gas and in the depletion of stratospheric ozone (Ravishankara et al., 2009), the steady increase in its average atmospheric concentration of 0.75 ppb yr−1 (Hartmann et al., 2013) asks for a quantitative understanding of its sources and the factors that control its production. On a global scale, vegetated soils are the main natural terrestrial source of N2O. Agriculture is the main anthropogenic source, and the main driver of increasing atmospheric N2O concentrations (Ciais et al., 2013).
In soils, several biological nitrogen (N) transformation processes produce N2O either as a mandatory intermediate or as a by-product (Spott et al., 2011). Under oxic conditions, the most important process is obligate aerobic nitrification, which yields N2O as by-product when hydroxylamine decomposes (Zhu et al., 2013). Under low oxygen (O2) availability, nitrifier denitrification and heterotrophic denitrification with N2O as intermediate become more relevant (Philippot et al., 2009). At stably anoxic conditions and low concentrations of nitrate (), complete denitrification consumes substantial amounts of previously produced N2O by further reduction to N2 (Baggs, 2008; Vieten et al., 2009). In environments that do not sustain stable anoxia, but undergo sporadic transitions between oxic and anoxic conditions, the activity of certain N2O reductases can be suppressed by transiently elevated O2 concentrations and thus can lead to the accumulation of N2O (Morley et al., 2008).
Nitrous oxide emissions from soils depend on the availability of carbon (C) and N substrates that fuel the involved microbial processes. On the other hand, given its dependency on O2, N2O production is also governed by the diffusive supply of O2 through soils. Similarly, soil N2O emissions are modulated by diffusive N2O transport from the site of production to the soil surface (e.g. Böttcher et al., 2011; Heincke and Kaupenjohann, 1999). Substrate availability, gas diffusivity and the distribution of soil organisms are highly heterogeneous in soils at a small scale, with micro-niches in particular within soil aggregates, within the detritusphere and within the rhizosphere. These can result in “hot spots” with high denitrification activity (Kuzyakov and Blagodatskaya, 2015).
Soil aggregate formation is a key process in building soil structure and pore space. Soil aggregates undergo different stages in their development, depending on the degradability of the main binding agent (Tisdall and Oades, 1982). Initially, highly persistent primary organo-mineral clusters (20–250 µm) are held together by root hairs and hyphae, thus forming macroaggregates (>250 µm). Upon decomposition of these temporary binding agents and the subsequent disruption of the macroaggregates, microaggregates (<250 µm) are released (Elliott and Coleman, 1988; Oades, 1984; Six et al., 2004). These consist of clay-encrusted fragments of organic debris coated with polysaccharides and proteins. This multi-stage development leads to a complex relationship between aggregate size, intra-aggregate structure and soil structure (Ball, 2013; Totsche et al., 2017, 2018), which influences soil aeration, substrate distribution and pore water dynamics (Six et al., 2004). Often, micro-site heterogeneity increases with aggregate size, thus fostering the simultaneous activity of different N2O producing microbial communities with distinct functional traits (Bateman and Baggs, 2005). Aggregate size effects on N2O production and consumption have generally been studied in static batch incubation experiments with a comparatively small number of isolated aggregates of uniform size, at constant levels of water saturation (Diba et al., 2011; Drury et al., 2004; Jahangir et al., 2011; Khalil et al., 2005; Sey et al., 2008) and through modelling approaches (Renault and Stengel, 1994; Stolk et al., 2011). Previous work provided partially inconsistent results, which led to an ongoing discourse about the interplay of physicochemical properties and different aggregate sizes in controlling N2O emission. Such inconsistencies may in part be attributed to the use of different aggregate size classes, changes in soil structure by aggregate separation, other methodological constraints (water saturation, redox potential) and differences in microbial communities. The effects of specific aggregate sizes within a simulated soil structure, in combination with fluctuating water saturation, on soil N2O emissions have, to our knowledge, not been specifically addressed.
Similar to soil aggregates, the detritusphere and the rhizosphere (the zone of soil that is affected by root activity; Baggs, 2011; Luster et al., 2009) can be considered biogeochemical hot spots (Kuzyakov and Blagodatskaya, 2015; Myrold et al., 2011). Here, carbon availability is much higher than in the bulk soil and thus rarely limiting microbial process rates. The detritusphere consists of dead organic material, which spans a wide range of recalcitrance to microbial decomposition. Spatially confined accumulations of variably labile soil litter form microhabitats that are often colonized by highly active microbial communities (Parkin, 1987). Aggregation of litter particles has been shown to affect N2O emissions (Loecke and Robertson, 2009). Hill (2011) identified buried organic-rich litter horizons in a stream riparian zone as hot spots of N cycling. Similarly, in the rhizosphere, root exudates and exfoliated root cells provide ample degradable organic substrate for soil microbes (Robertson and Groffman, 2015). Yet plant growth may also affect soil microbial communities through competition for water and nutrients (e.g. fixed N; Bender et al., 2014; Myrold et al., 2011). The combined effects of these plant–soil interactions on N2O production have been reviewed by Philippot et al. (2009). Root-derived bioavailable organic compounds can stimulate heterotrophic microbial activity, specifically N mineralization and denitrification. Nitrification in turn can be enhanced by the elevated N turnover and mineralization rates, but may also be negatively affected by specific inhibitors released from the root or through plant-driven ammonium depletion. The ability of some plants adapted to water-saturated conditions to “pump” air into the rhizosphere via aerenchyma (gas conductive channels in the root) leads to an improved oxygenation of the rhizosphere and a stimulation of nitrification (Philippot et al., 2009). Surrounded by otherwise anoxic sediments, such aerated micro-environments may create optimal conditions for coupled nitrification–denitrification (Baldwin and Mitchell, 2000; Koschorreck and Darwich, 1998). On the other hand, transport of N2O produced in the soil to the atmosphere may be facilitated via these internal plant channels, bypassing diffusive transport barriers and enhancing soil–atmosphere gas fluxes (Jørgensen et al., 2012).
The dynamics of N2O emissions are strongly coupled to the dynamics of pore water. Re-wetting of previously dried soil can lead to strong N2O emissions (Goldberg et al., 2010; Ruser et al., 2006), likely fostered by a wetting-induced flush in N mineralization (Baldwin and Mitchell, 2000). On the other hand, the drying phase after water saturation of sediments and soils can lead to a period of enhanced N2O emissions (e.g. Baldwin and Mitchell, 2000; Groffman and Tiedje, 1988; Rabot et al., 2014; Shrestha et al., 2012) when water-filled pore space (WFPS) exceeds 60 % (Beare et al., 2009; Rabot et al., 2014). The increased N2O production has been attributed to enhanced coupled nitrification–denitrification (Baldwin and Mitchell, 2000). Depending on the spatial distribution of water films around soil particles and tortuosity (which is a function of aggregate size and soil structure); the uneven drying of the soil after full saturation may generate conditions that are conducive to the formation of anaerobic zones in otherwise oxic environments (Young and Ritz, 2000). Pore water thereby acts as a diffusion barrier for gas exchange, limiting the O2 availability in the soil pore space (Butterbach-Bahl et al., 2013). Moreover, pore water serves as a medium for the diffusive dispersal of dissolved C and N substrates, e.g. from the site of litter decomposition to spatially separated N2O producing microbial communities (Hu et al., 2015). Therefore, fluctuations in water saturation efficiently promote the development of hot spots and “hot moments” of N2O emissions in floodplain soils and other semi-terrestrial soils (Hefting et al., 2004; Shrestha et al., 2012).
The main objective of the present experimental study was to assess both the relative and combined effects of soil microhabitats associated with soil aggregates, the detritusphere and plant–soil interactions on N2O emissions from floodplain soils under changing pore-space saturation. We simulated a flooding event in mesocosm experiments with a main focus on the dynamics of N2O emissions during hot moments in the drying phase after flooding. To isolate the effect of aggregate-size and to minimize confounding effects of differences in soil structure, we prepared model soils by mixing aggregate size fractions of a floodplain soil with suitable inert material. The combined effects of soil aggregate size and plant detritus or plant–soil interactions were addressed by mixing the model soils with leaf litter or by planting them with willow cuttings (Salix viminalis L.).
We demonstrate that the level of soil aggregation significantly affects N2O emission rates from floodplain soils through its modulating control on the model soil's physicochemical properties. We further show that these effects can be modified by the presence of detritus and by root–soil interactions, changing C and N substrate availability and redox conditions.
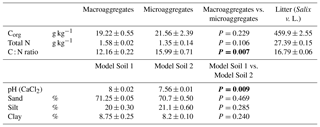
Table 1Physicochemical properties of the two aggregate size fractions (macroaggregates and microaggregates) and added leaf litter. Corg and TN of the aggregates were measured in triplicates. The leaf litter was analysed in quadruplicates. Final pH and texture of Model Soil 1 and Model Soil 2 were measured in duplicates (means ± SD). Significant differences in the t tests (P<0.05) are highlighted in bold.
2.1 Model soils
In February 2014, material from the uppermost 20 cm of a N-rich gleyic Fluvisol (calcaric, humic siltic) with 20 % sand and 18 % clay (Samaritani et al., 2011) was collected in the restored Thur river floodplain near Niederneunforn (northeast Switzerland 47∘35′ N, 8∘46′ E; 453 m a.s.l.; mean annual temperature, MAT, 9.1 ∘C; mean annual precipitation, MAP, 1015 mm). After removing plant residues such as roots, twigs and leaves, the soil was mixed and air-dried to a gravimetric water content of 24.7 % ± 0.4 %. In the next step, the original floodplain soil material, consisting of 18.5 % ± 4.6 % aggregates smaller than 250 µm and 81.5 % ± 4.6 % macroaggregates (mean ± SD; n=10) was separated into a macroaggregate fraction (250–4000 µm) and a microaggregate fraction (<250 µm) by dry sieving. The threshold of 250 µm between macroaggregates and microaggregates was chosen based on Tisdall and Oades (1982). Soil aggregate fractions were then used to compose model soils. In order to preserve soil structure, the remaining aggregate size fractions were complemented with an inert matrix replacing the removed aggregate size fraction of the original soil. Model Soil 1 (LA) was composed of soil macroaggregates mixed in a 1:1 (w/w) ratio with glass beads of 150–250 µm size serving as inert matrix material replacing the microaggregates of the original soil. Similarly, Model Soil 2 (SA) was composed of soil microaggregates mixed at the same ratio with fine quartz gravel of 2000–3200 µm size. To generate an even mixture of original soil aggregates and the respective inert matrix a Turbula mixer (Willy A. Bachofen AG, Muttenz, Switzerland) was used. The proportions of the aggregate size fractions in the model soils were different from the original soil, and 50 % microaggregates may be more than what is found in most natural or agricultural soils (often less than 10 %). Nevertheless, we chose to use equal amounts of micro- and macroaggregates, in order to be able to separate the effects of aggregate size from effects of aggregate amount (soil mass). These proportions were still well in the range of common top soils (e.g. Cantón et al., 2009; Gajić et al., 2010; Six et al., 2000). The physicochemical properties of the two soils were determined by analysing three random samples of each model soil. Texture of the complete model soils was determined using the pipette method (Gee and Bauder, 1986) and pH was measured potentiometrically in a stirred slurry of 10 g soil in 20 mL of 0.01 M CaCl2, as recommended in Hendershot et al. (2007). Additionally, organic carbon (Corg) and total nitrogen (TN) were analysed in both aggregate size fractions without the inert material, using the method described by Walthert et al. (2010). The two model soils displayed very similar physicochemical properties (Table 1), except for the C : N ratio that was lower in macroaggregates than in microaggregates. The latter was due to the slightly lower organic C content in concert with slightly higher TN values in the macroaggregates. The high calcium carbonate (CaCO3) content of the source material of our model soils (390±3 g CaCO3 kg−1; Samaritani et al., 2011) buffered the systems at an alkaline pH of 8.00±0.02 for LA and 7.56±0.01 for SA, respectively (Table 1), ensuring that the activity of key N-transforming enzymes was not hampered by a too low pH, and that the potential for simultaneous production and consumption of N2O in our experiment was fully intact (Blum et al., 2018; Frame et al., 2017).

Figure 1Schematic of a mesocosm with gas sampling valves (1), Ag/AgCl reference electrode (2), Pt redox electrodes (3), suction cups (4), volumetric water content sensors (5), vent (6), and water inlet or outlet (7). The top part is only attached during gas sampling.
2.2 Mesocosms
For the mesocosm experiments, transparent polyvinyl chloride (PVC) cylinders with polymethyl methacrylate (PMMA) couplings were used. A mesocosm comprised a bottom column section, containing the soil material and a drainage layer as described below, and the upper headspace section with a detachable headspace chamber (Fig. 1). Each column section was equipped with two suction cups (Rhizon MOM soil moisture samplers, Rhizosphere Research Products, the Netherlands; pore size 0.15 µm) for soil solution sampling. The suction cups were horizontally inserted at 5 and 20 cm below soil surface. For redox potential measurements, two custom-made Pt electrodes (tip with diameter of 1 mm and contact length of 5 mm) were placed horizontally at a 90∘ angle to the suction cups at the same depths, with the sensor tip being located 5 cm from the column wall. A Ag/AgCl reference electrode (B 2820, SI Analytics, Germany) was installed as shown in Fig. 1. A volumetric water content (VWC) sensor (EC-5, Decagon, USA) was installed 15 cm below the soil surface. To avoid undesired waterlogging, each column section contained a 5 cm thick drainage layer composed of quartz sand with the grain size decreasing with depth from 1 mm to 5.6 mm (Fig. 1). The upper cylinder section was equipped with three-way valves for gas sampling, and an additional vent for pressure compensation.
2.3 Experimental setup
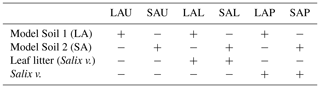
The mesocosm experiment had a factorial experimental design consisting of two factors (model soil and treatment), with the first factor containing two levels (macroaggregates, microaggregates) and the second factor containing three levels (unamended, litter added, plant presence). This experimental design resulted in six treatments, each replicated six times (Table 2). As basic material, each mesocosm contained 8.5 kg of either of the two model soils. Unamended model soils were used to exclusively investigate the effect of aggregate size, abbreviated as LAU (large aggregates, unamended) and SAU (small aggregates, unamended). In order to specifically assess the effect of enhanced availability of labile C in the detritusphere for the N2O producing or consuming soil microbial community, two sets of mesocosms were amended with freshly collected leaves of basket willow (Salix viminalis L.). Those leaves were cut into small pieces, autoclaved and then added to the model soil components (8 g kg−1 model soil) during the mixing procedure to create treatments LAL (large aggregates, litter) and SAL (small aggregates, litter). The sterilization step was included to create equal starting conditions in all litter treatments by reducing any potential effect of, and interaction with, the phyllosphere microbial community even though a direct involvement of the phyllosphere community in N2O production was unlikely according to the literature (Bringel and Couée, 2015). A third set of mesocosms was planted with cuttings collected from the same Salix viminalis creating treatments LAP (large aggregates, plant) and SAP (small aggregates, plant), respectively to evaluate the effects of root–soil interactions in the respective model soils. For each mesocosm, one cutting was inserted 10 cm into the soil, protruding from the surface about 3 cm.
The addition of leaf litter to the model soils led to an increase in Corg and TN in LAL relative to LAU by 41 % and 35 %, respectively, and in SAL relative to SAU by 58 % and 44 %, respectively. The bulk density of the unamended model soil SAU (1.27±0.01 g cm−3) was slightly higher than the one of LAU (1.22±0.01 g cm−3; adj. P: <0.0001). Regarding the litter addition treatments, the bulk density of LAL (1.13±0.01 g cm−3) was significantly smaller than the one of LAU (adj. P: <0.0001), whereas the bulk density of SAL (1.27±0.02 g cm−3) did not differ significantly from the one of SAU. The soils in the treatments with plants exhibited a similar bulk density (LAP: 1.23±0.02 g cm−3; SAP: 1.24±0.01 g cm−3) as in the respective unamended treatments.
Table 2Overview of treatments in the flooding–drying experiment. Model Soil 1, containing soil macroaggregates is abbreviated LA, whereas Model Soil 2 contains soil microaggregates and is abbreviated SA. The last character of each abbreviation stands for unamended (U), litter addition (L) or plant presence (P). Each treatment was replicated six times.
The experiments were conducted inside a climate chamber set to constant temperature (20±1 ∘C) and relative air humidity (60 % ± 10 %), with a light/dark cycle of 14∕10 h (photosynthetically active radiation, PAR, 116.2±13.7 µmol m−2 s−1). The experimental period was divided into four consecutive phases: the conditioning phase (Phase 1) lasted for 15 weeks and allowed the model soils to equilibrate and the plants to develop a root system. This was followed by the first experimental phase of nine days (Phase 2), serving as a reference period under steady-state conditions. During Phase 1 and Phase 2, the soils were continuously irrigated with artificial river water (Na+: 0.43 µM; K+: 0.06 µM; Ca2+: 1.72 µM; Mg2+: 0.49 µM; Cl−: 4.04 µM; : 0.16 µM; : 0.5 µM; : 0.11 µM; pH: 7.92) via suction cups to maintain a volumetric water content of 35 % ± 5 %. In Phase 3, the mesocosms were flooded by pumping artificial river water through the drainage vent at the bottom into the cylinder (10 mL min−1, using a peristaltic pump; IPC-N-24, Ismatec, Germany) until the water level was 1 cm above the soil surface. After 48 h of flooding, the water was allowed to drain and the soil to dry for 18 days without further irrigation (Phase 4).
2.4 Sampling and analyses
During the entire experiment, water content and redox potential were automatically logged every 5 min (EM5b, Decagon, USA, and CR1000, Campbell scientific, USA, respectively).
At selected time points during the experiment, soil-emitted gas and soil solution were sampled. For N2O flux measurements, 20, 40 and 60 min after closing the mesocosms, headspace gas samples (20 mL) were collected using a syringe and transferred to pre-evacuated Exetainer vials. The samples were analysed for their N2O concentration using a gas chromatograph (Agilent 6890, Santa Clara, USA; Porapak Q column, Ar/CH4 carrier gas, micro-ECD detector). Measured headspace N2O concentrations were converted to moles using the ideal gas law and headspace volume. The N2O efflux rates were calculated as the slope of the linear regression of the N2O amounts at the three sampling times, relative to the exposed soil surface area (Fig. 1, Shrestha et al., 2012).
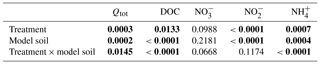
Table 3Results of the two-way analysis of variance (ANOVA) of the integrated fluxes (Qtot) and the mean concentrations of chemical properties in soil solution (n=6) during the period of enhanced N2O emissions (from day 11 to day 25). Shown are P values with significant differences (P<0.05) highlighted in bold characters.
For soil water sampling, 20 mL of soil solution were collected using the suction cups. Water samples were analysed for dissolved organic carbon (DOC) and TN concentrations with an elemental analyzer (FormacsHT∕TN, Skalar, the Netherlands). Nitrate and ammonium concentrations were measured by ion chromatography (IC 940, Metrohm, Switzerland), and nitrite () concentrations were determined photometrically (DR 3900, Hach Lange, Germany).
2.5 Data analyses
We were interested in effects on cumulated N2O emissions during hot moments following flooding. We therefore analysed data aggregated over this period rather than the raw full time series data. This procedure also helped to avoid potential issues with small shifts in the timing of emissions that might have been significant but which were irrelevant for the total fluxes we focused on. The total amount of N2O emitted during the period of enhanced N2O fluxes in Phase 4, Qtot, was calculated by integrating the N2O fluxes between day 11 and 25 of the experiment as follows:
where Δn is the time period between the nth and the n+1th measurement, and qn and qn+1 the mean flux on the nth and n+1th measurement day, respectively. “n=1” refers to day 11, and nmax to day 25 of Phase 4. The integrated N2O fluxes, as well as the average DOC and N-species concentrations in the soil solution during this period, were analysed by performing two-way ANOVAs with the fixed terms treatment and model soil including their interaction. In case of significant model soil, treatment or model soil × treatment effects, their causes were inspected with the Tukey's honestly significant difference (HSD) post hoc test. For all data, the residuals of the ANOVA models were inspected, and the Shapiro–Wilk normality test was applied to ensure that the values follow a Gaussian distribution. In case that this requirement for ANOVA was not met, the respective data set was log-transformed. Significance and confidence levels were set at α<0.05. The results of the performed ANOVAs are summarized in Table 3. For the statistical analyses we used GraphPad Prism (GraphPad Software Inc., 2017) and R (R Core Team, 2018).

Figure 2Mean N2O emission during the flooding–drying experiment from large-aggregate model soil (LA; filled circles) and small-aggregate model soil (SA, open circles). The corresponding water-filled pore space (WFPS) in LA (filled triangles) and SA (open triangles) are depicted on the right y axis; unamended soils (a), litter addition (b) and plant treatment (c). Flooding phase indicated by the grey area. Symbols indicate means; error bars are SE; n=6.
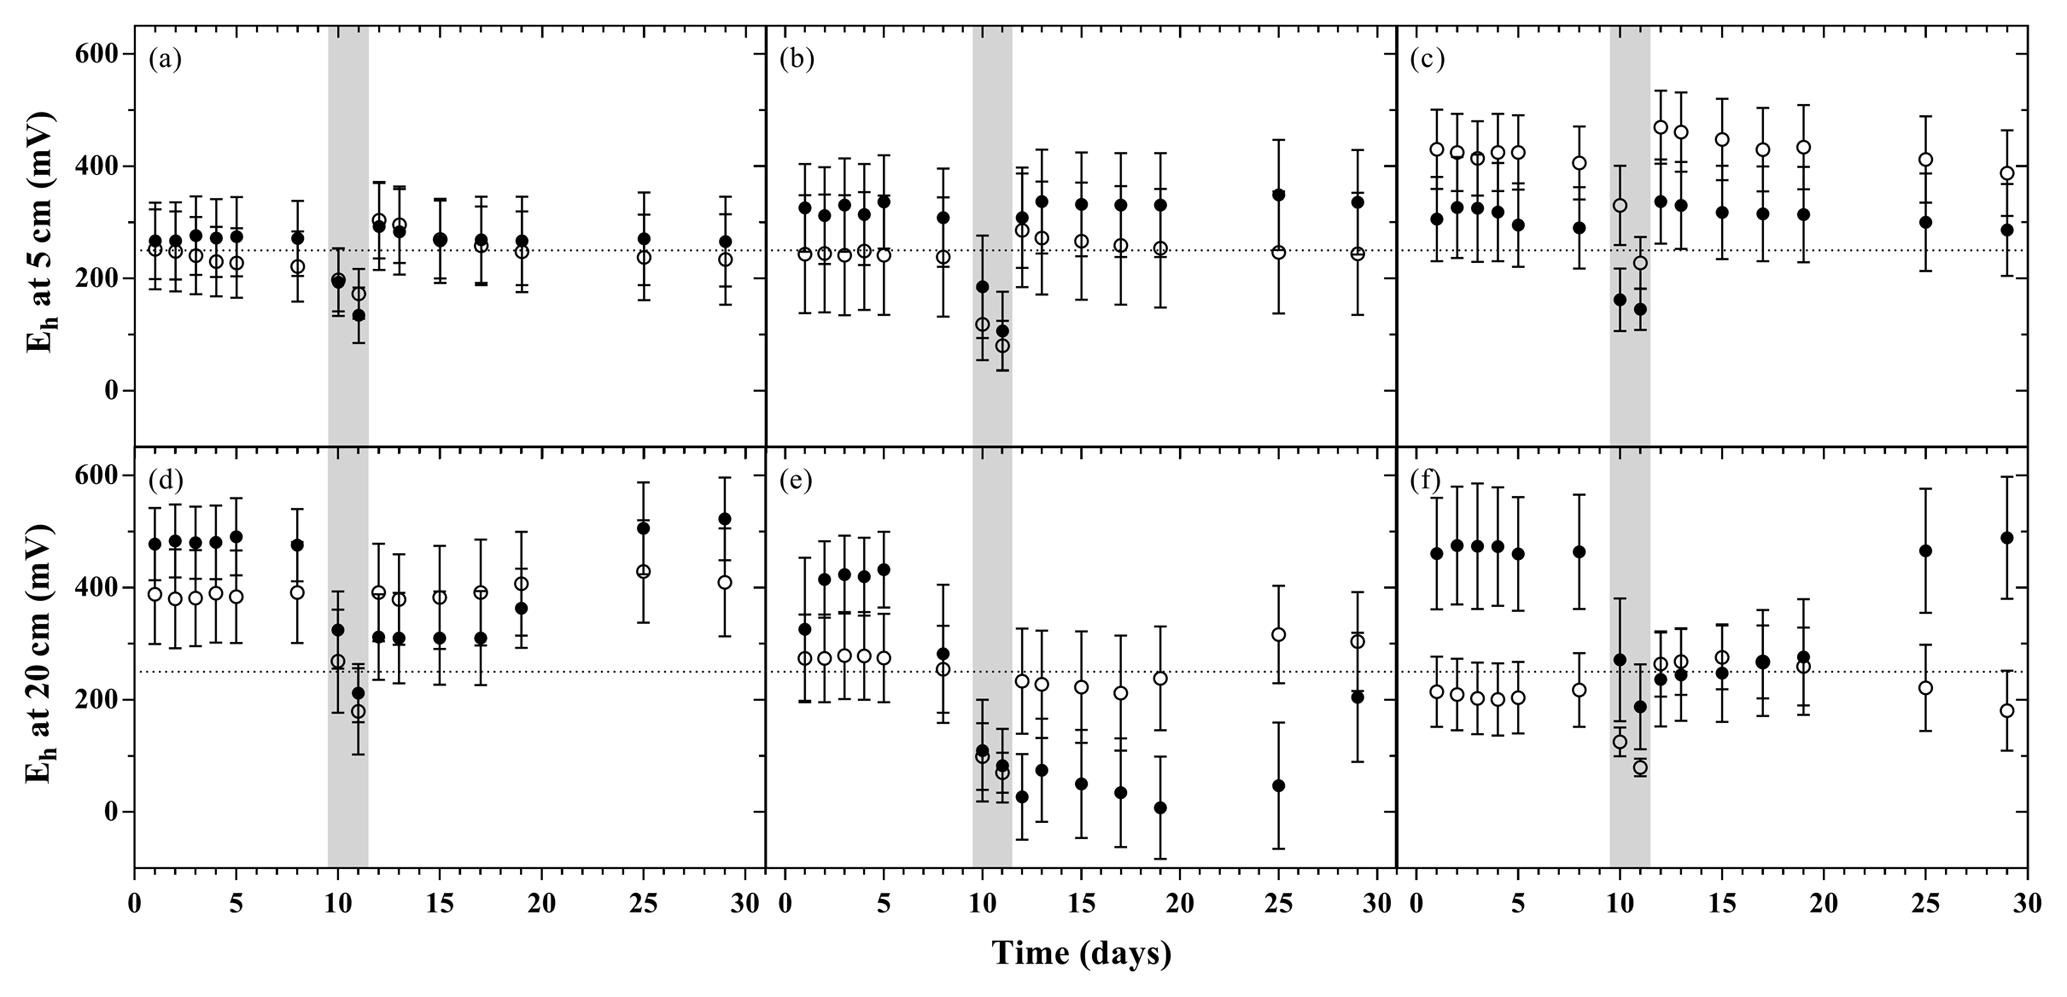
Figure 3Redox potential relative to standard hydrogen electrode during the flooding–drying experiment at 5 and 20 cm depth (mean ± SE; n=6); unamended soils (a and d), litter addition (b and e) and plant treatment (c and f). LA (filled circles) and SA (open circles); the dotted line at 250 mV marks the threshold, below which denitrification is expected to occur.
3.1 Soil moisture and redox potential
During Phase 1 and Phase 2, saturation levels stabilized at 53.0 % ± 2.1 % WFPS (water-filled pore space) in the treatments with LA soils, and were slightly higher in SA treatments (57.8 % ± 2.0 %; Fig. 2). The flooding of the mesocosms for 48 h with artificial river water raised the WFPS for all LA soils to 87.8 % ± 0.1 %, significantly exceeding the increase in WFPS in SA soils (80.6 % ± 0.1 %). The water release from the system after the simulated flood resulted in an immediate drop of the WFPS, except for the LAU treatment (Fig. 2). This was followed by slow drying for 1 week, and a more marked decrease in WFPS during the second week after the flood. During the latter period, the plant treatments dried faster than the other treatments. As a result, at the end of the experiment, WFPS was still above pre-flood values in unamended and litter treatments, while WFPS levels in the treatments with plants were lower than before the flooding.
The time course of the redox potential measured at 5 and 20 cm depth exhibited distinct patterns depending on the respective model soil (Fig. 3). In all treatments, flooding induced a rapid decrease in the redox potential to values below 250 mV within 36 h. Upon water release, the redox potential returned rapidly to pre-flood values at both measurement depths only in SA soils. In the LA treatments (most pronounced in LAL), soils at 20 cm depth underwent a prolonged phase of continued reducing conditions, returning to the initial redox levels only towards the end of the experiment.
3.2 Hydrochemistry of soil solutions
Considering individual treatments, DOC concentrations varied only little with time. Yet the DOC concentrations were generally much higher in treatments with LA than with SA soils. This main effect of model soil was highly significant, as was the interaction with treatments due to a smaller difference in the litter addition treatments than in the unamended and plant treatments (Table 3). Nitrate was the most abundant dissolved reactive N species in the soil solution, with pre-flood concentrations of 1 to 5 mM (Fig. 4d–f). In the unamended and plant treatments, concentrations were markedly higher in SA than in LA soils, whereas they were similar in both litter addition treatments. Two distinct temporal patterns in the evolution of concentration could be discerned. In the unamended and litter-addition treatments, concentrations decreased after the flooding, consistently reaching a minimum on day 19, in the case of the litter treatments below the detection limit of 0.2 µM, before increasing again during the latter drying phase (Fig. 4d and e). In contrast, in the treatments with plants, concentrations steadily declined from concentrations of 1–2 mM to around 0.5 mM at the end of the experiment (Fig. 4f). Nitrite was found at significant concentrations only in LA soils, with highest concentrations in the LAU treatment right after the flooding (33.6 µM) and decreasing concentrations throughout the remainder of the experiment (Fig. 4g–i). In SA soils concentration was always <5 µM, without much variation. Similarly, in most treatments except SAL, ammonium () concentrations were <10 µM, and particularly towards the end of the experiment very close to the detection limit (Fig. 4j and l). In the SAL treatment, concentrations peaked 5 days after the flood with concentrations of around 70 µM (Fig. 4k). This deviation from the other temporal patterns prompted a significant interaction effect between model soil and treatments.
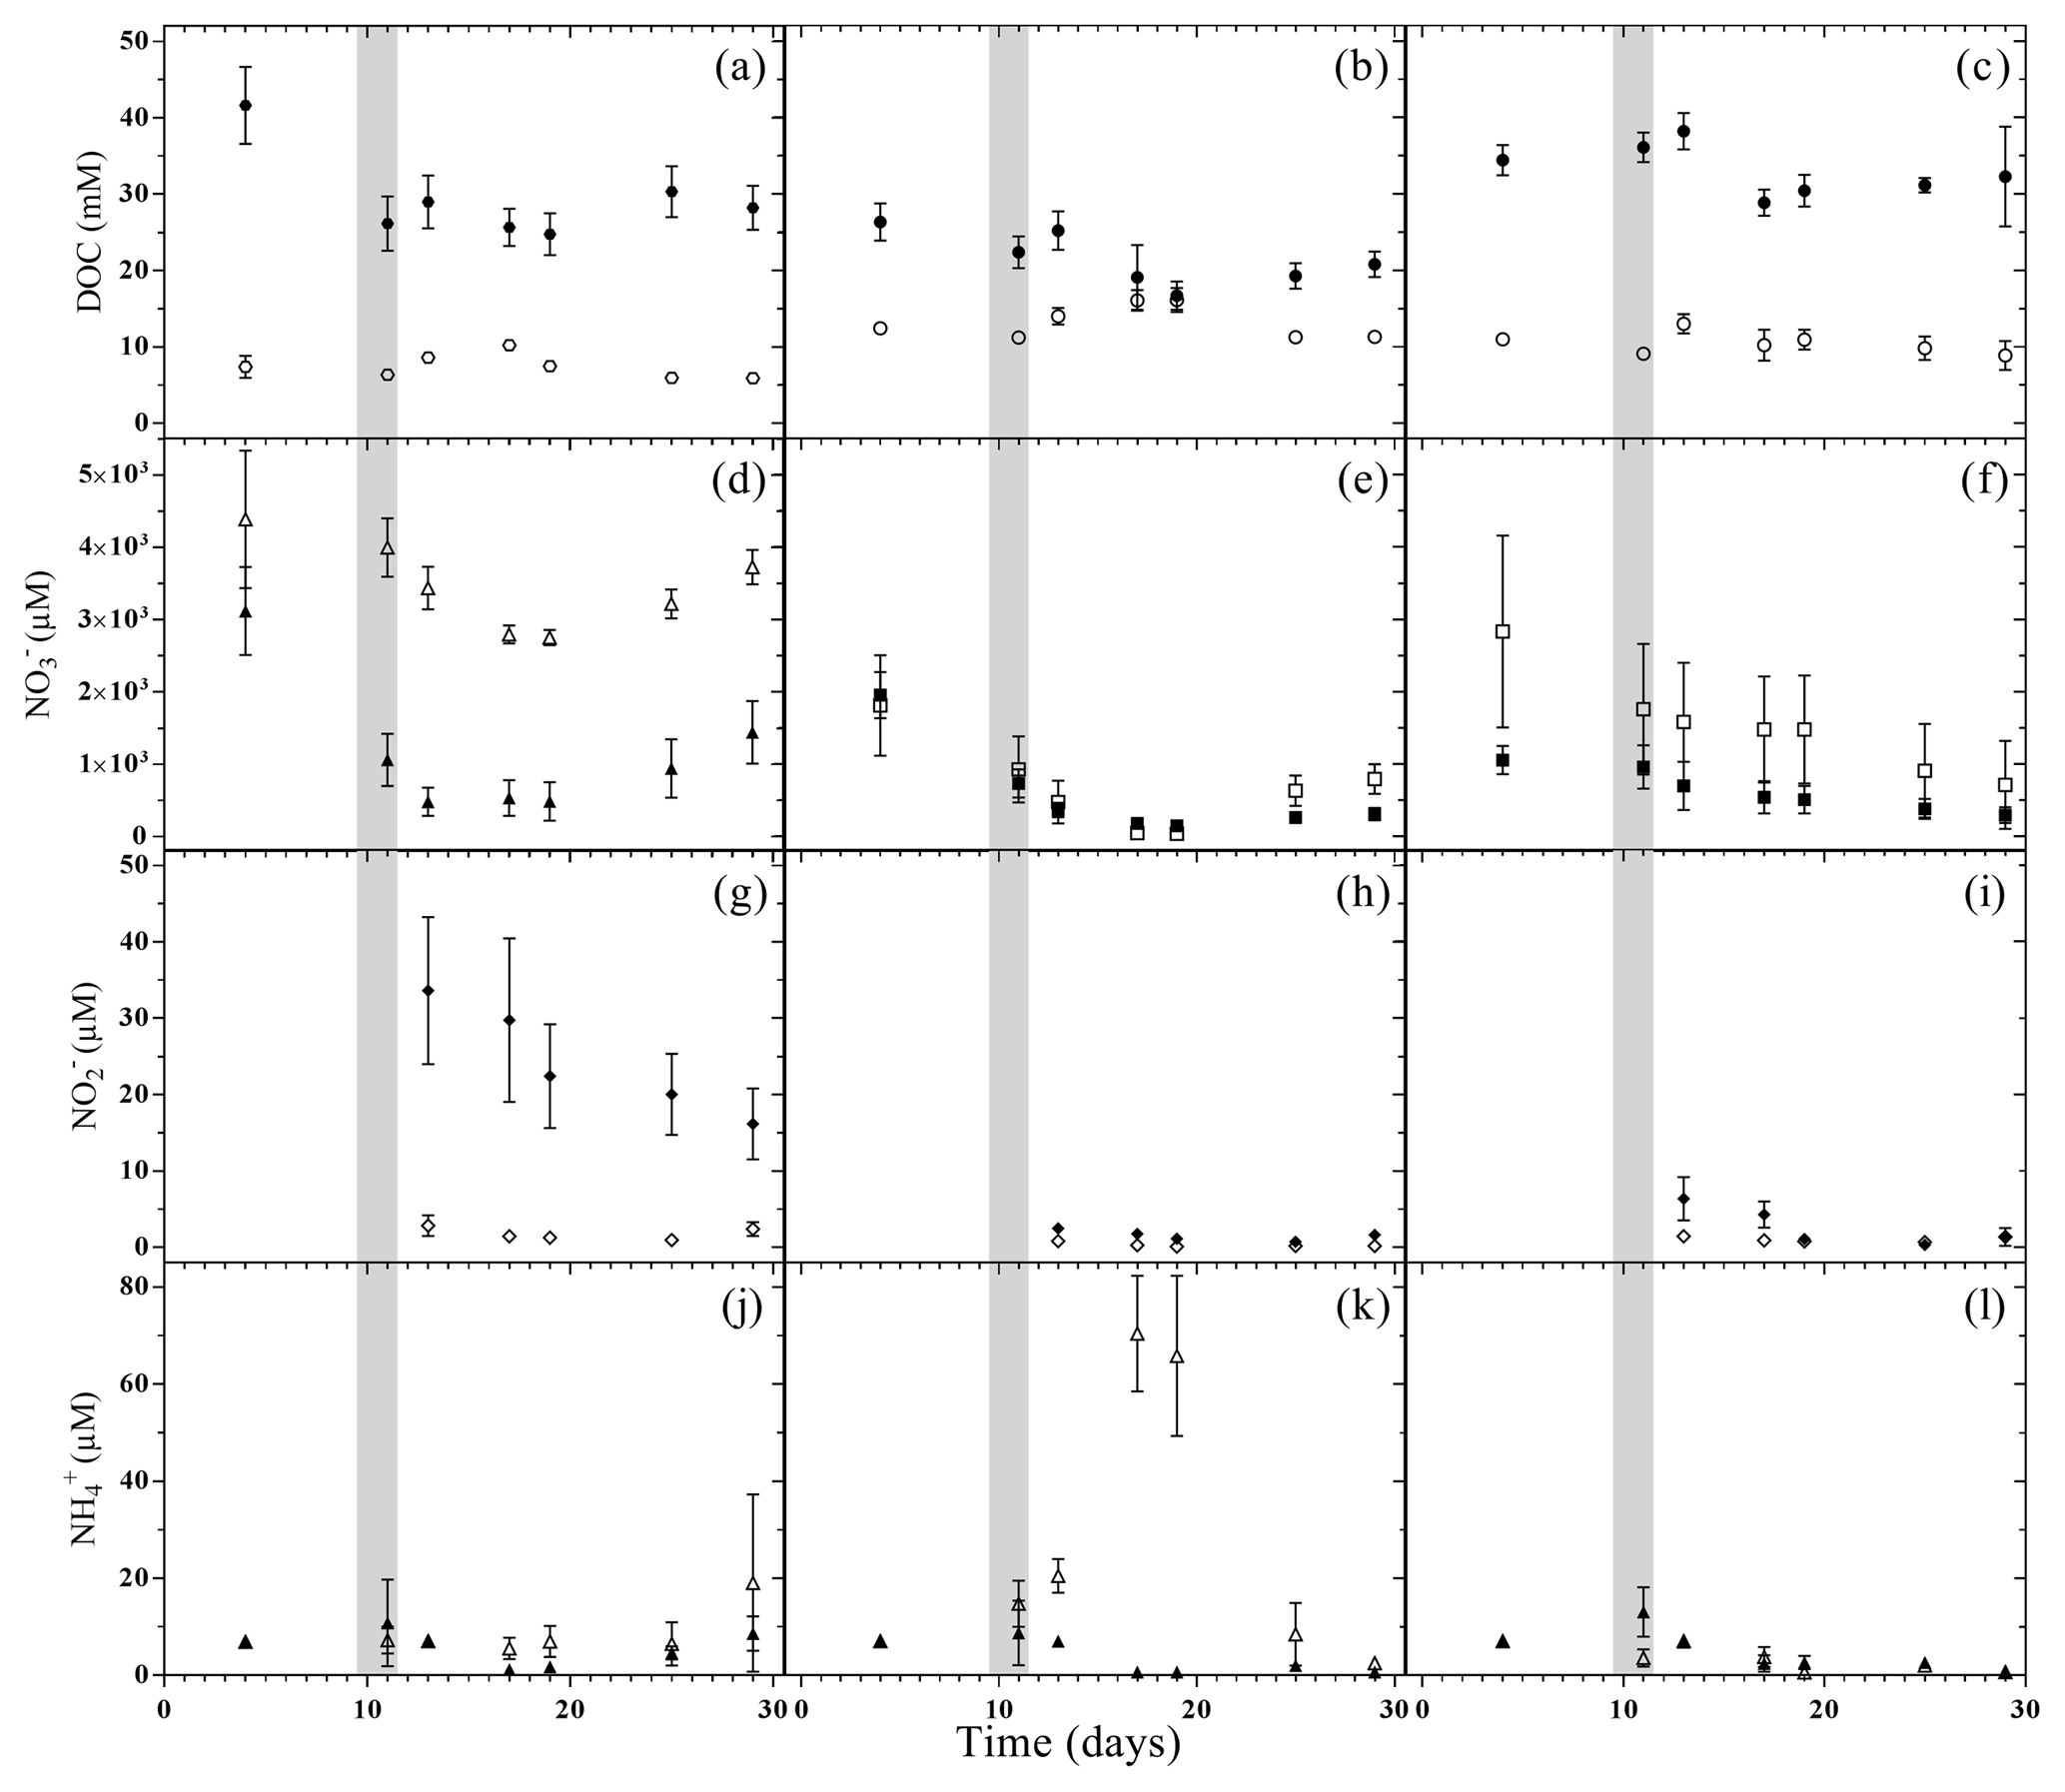
Figure 4Dissolved organic carbon (DOC, circles), nitrate (squares), nitrite (diamonds) and ammonium (triangles) concentrations in pore water during the flooding–drying experiment. LA (filled symbols) and SA (empty symbols); unamended soils (a, d, g and j), litter addition (b, e, h and k) and plant treatment (c, f, i and l).; (mean ± SE; n=6).
3.3 Nitrous oxide emissions
During Phase 2 (i.e. before the flooding), N2O fluxes were generally low (<1 µmol m−2 h−1; Fig. 2); however, fluxes in the LAL treatment were significantly higher than in the other treatments (adj. P=0.002–0.039; Fig. 2). The flooding triggered the onset of a “hot moment”, defined here as a period with strongly increased N2O emissions, which lasted for about 1 week independent of the treatment (Fig. 2). The maximum efflux was observed immediately after the flood. The subsequent decline in N2O emission rates followed different patterns among the various treatments. Normalizing the N2O flux to the maximum measured efflux for each replicated treatment revealed a slower decrease with time for the unamended soils than for the litter and plant treatments (Fig. S1 in the Supplement). The strongest peak emissions were observed in the LAL treatment (91.6±14.0 µmol m−2 h−1; mean ± SD). Throughout most of the drying phase, the LAU and LAL treatments exhibited higher N2O emissions than the corresponding SAU and SAL experiments. In contrast, there was no such difference in the treatments with plant cuttings, and peak N2O emissions were overall lower than in the other treatments. The integrated N2O fluxes during the hot moments (days 11 to 25 of the experiment) were significantly higher for the LAU and LAL than for all other treatments (Fig. 5), and the aggregate size effect was also significant within the unamended (adj. P=0.045) and litter-addition treatments (adj. P=0.008). The integrated N2O emissions in the two plant treatments did not differ significantly from each other, but were significantly smaller than in the LAU (adj. P=0.001), and the LAL (adj. P=0.005) treatments. Overall, the effects of model soil and treatments were significant, as was the interaction between the two factors due to the different aggregate size effect in the plant compared to the unamended and litter addition treatments (Table 3).
In our experiment, we could confirm the occurrence of periods of enhanced N2O emissions in the drying phase shortly after flooding, as expected based on previous research (Baldwin and Mitchell, 2000; Groffman and Tiedje, 1988; Rabot et al., 2014; Shrestha et al., 2012). We observed that the six treatments had a substantial effect on the magnitude and temporal pattern of N2O emissions that could only be captured by observations at relatively high temporal resolution. The fast occurrence of strong N2O fluxes over a comparatively short period in the litter-amended treatment on the one side, and the relatively weak response to the flooding in the plant treatment on the other, suggests complex interactive mechanisms related to distinct microhabitat effects leading to characteristic periods of enhanced N2O emission. Rabot et al. (2014) explained N2O emission peaks during the desaturation phase with the release of previously produced and entrapped N2O. Such a mechanism may partly contribute to high N2O emissions in our experiment initially, but the continuing depletion of and during the phase of high N2O emissions indicates that the flooding and drying has strong effects on N transformations mediated by microorganisms in the soil (e.g. the balance and overall rates of nitrification, nitrifier–denitrification and denitrification). Hence, physical controls alone clearly do not explain the observed timing and extent of hot moments with regard to N2O emission. In the following sections we will discuss how the effect of flooding on microbial N2O production is modulated by differential microhabitat formation (and hence redox conditions) in the various treatments.
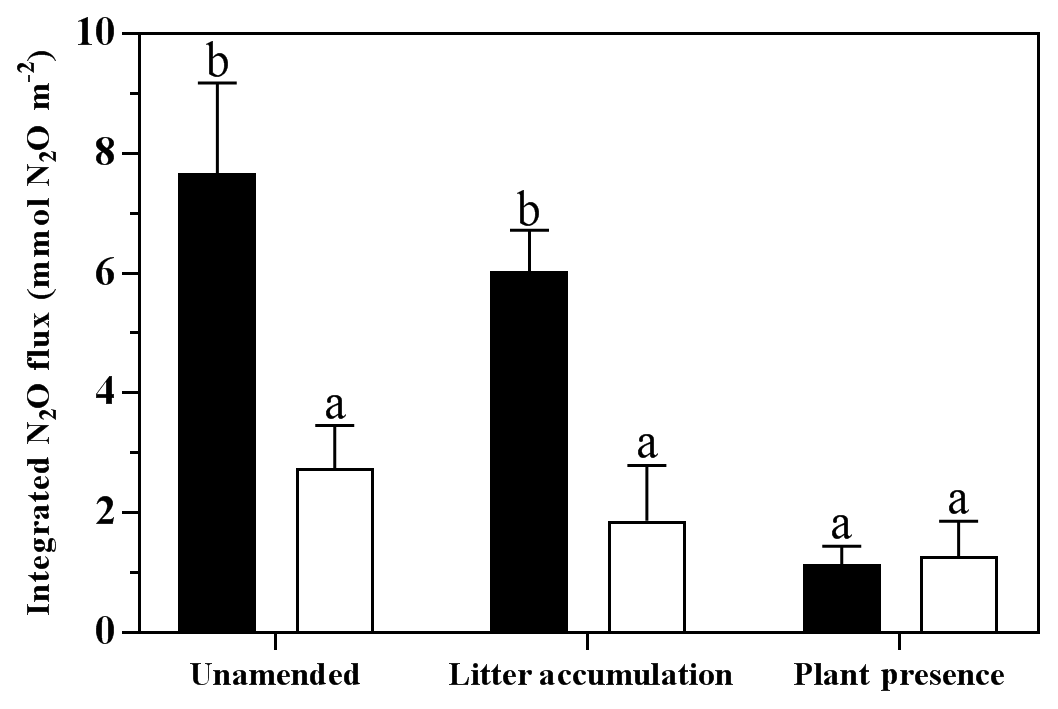
Figure 5Integrated N2O fluxes over the 14-day period of elevated N2O emissions in the drying phase of the flooding–drying experiment (mean ± SE; n=6). Black bars represent Model Soil 1 (macroaggregates 250–4000 µm), whereas Model Soil 2 (microaggregates <250 µm) is depicted as white bars. Significant differences among the six treatments are denoted by different lower case letters at adj. P<0.05.
4.1 Effect of aggregate size on N2O emissions
LA model soils exhibited both higher peak and total N2O emissions during the hot moment in the drying phase than SA model soils (Figs. 2 and 5). By contrast, in the presence of a growing willow, there was no detectable effect of aggregate size on the overall N2O emission (further discussion below). The aggregate size effects observed in the unamended and litter treatments can be explained by factors controlling (i) gas diffusion (e.g. water film distribution, tortuosity of the intra-aggregate pore space) and (ii) decomposition of encapsulated soil organic matter (SOM) regulating the extent of N2O formation (Neira et al., 2015). In order to isolate the effect of aggregate size (i.e. to minimize the effect of other factors that are likely to influence gas diffusion), we created model soils of similar soil structure and texture (see Sect. 2). We thereby implicitly accepted that potential interactions of the two size fractions with each other, or with soil structures larger than 4 mm could not be assessed in this experiment. Although this approach thus represents only an approximation of real-world conditions, it was still an improvement compared to experiments where no attempts were made to conserve soil structure. Similarly, the bulk soil chemical properties of the two aggregate size fractions, such as Corg content and TN, are essentially the same. Despite differences in the initial C : N ratio and pH, although statistically significant, the two model soils can be considered equivalent in the ecological context, e.g. in terms of organic matter degradability. Therefore, we assume in the following that the differences in N2O emissions among the treatments can mainly be attributed to size-related aggregate properties and their interactions with litter addition or rhizosphere effects.
During Phase 3 with near-saturated conditions, no aggregate size effect was observed. A high WFPS seems to have limited the gas diffusion (O2 and N2O) independent of the aggregate size, limiting soil–atmosphere gas exchange in both model soils equally (Neira et al., 2015; Thorbjørn et al., 2008). As a consequence of inhibited gas exchange and soil aeration, a sharp drop in the redox potential was observed in all treatments, indicating a rapid decline in O2 availability to suboxic/anoxic conditions. Together with an incipient decrease in soil solution , this indicates that N2O production is primarily driven by denitrification in this phase.
The aggregate size effects on the formation of moments of enhanced N2O emission became evident during the subsequent drying period. During the initial drying phase, when a heterogeneous distribution of water films around soil particles or aggregates develops (Young and Ritz, 2000), the macroaggregates in the LA model soils appear to foster micro-environmental conditions that are more beneficial to N2O production. This could be related to the longer diffusive distances for re-entering O2 caused by the higher tortuosity of the intra-aggregate pore space of macroaggregates, as reported by Ebrahimi and Or (2016). This may have helped to maintain, or even extend, reducing conditions due to microbial activity inside the core of macroaggregates during drying. Thus, on the one hand, large aggregates favour the emergence of anoxic microhabitats expanding the zones where denitrification occurs. On the other hand, the overall higher porosity of the LA soils supports a better aeration in drained parts of the soil (Sey et al., 2008), and aerobic processes (e.g. nitrification) are supported. As a result, ideal conditions for spatially coupled nitrification–denitrification are created (Baldwin and Mitchell, 2000; Koschorreck and Darwich, 1998). Indeed, the emergence of heterogeneously distributed and spatially confined oxygen minimum zones during soil drying may be reflected by the high variability in the redox conditions observed in replicate mesocosms and, on average, the tendency towards lower redox potentials for a prolonged period of time in the subsoils of the LA model soils (Fig. 3d–f). In this context, the relevance of water films for the emergence of periods of enhanced N2O emissions is further highlighted by the fact that elevated flux rates were only observed as long as the WFPS was above 65 %. This is consistent with work by Rabot et al. (2014) and Balaine et al. (2013) who found similar soil water saturation thresholds for elevated N2O emissions from soils, attributing this phenomenon to suboptimal environmental conditions for both nitrification and denitrification at lower saturation levels.
Given the arguments above, we assume that N2O emissions during the drying phase originate to a large degree from heterotrophic denitrification, and that they are mainly governed by the aggregate-size-dependent redox conditions within the semi-saturated soils. This conclusion stands in good agreement with findings from Drury et al. (2004), who found higher production of N2O due to enhanced denitrification with increasing size of intact arable soil aggregates in a laboratory incubation study. In contrast, the much lower emissions from the SA treatments can best be explained by a rapid return to pre-flood oxic conditions in most of the pore space, under which N2O production driven by denitrification is inhibited. Enhanced reduction of N2O to N2 in the SA versus LA treatments seems less likely as an explanation for lowered net N2O emission rates, since the relatively high redox potential represents an impediment to complete denitrification to N2. Furthermore, according to Manucharova et al. (2001) and Renault and Stengel (1994), aggregates smaller than 200 µm are simply not large (and reactive) enough (i.e. molecular diffusive distances for oxygen are too short) to develop suboxic or anoxic conditions in the centre, let alone denitrifying zones. Hence, only a relatively small fraction of the total number of microaggregates in the SA soils would have been large enough (between 200 and 250 µm) to host denitrification and act as a site of anaerobic N2O production.
Under natural conditions, frequent hydrological disturbance in floodplains creates a highly dynamic and small-scaled mosaic of different aggregate size distributions. In this regard, our results, demonstrating the effect aggregate size has on N2O emissions, may help to understand the seemingly erratic spatial and temporal distribution of enhanced N2O emissions from floodplain areas. Moreover they imply that zones with a relatively high percentage of macroaggregates would be particularly prone to high emissions of N2O after a flood event.
4.2 Litter effect on N2O emissions
We expected that litter addition would increase N2O emissions from model soils with both small and large aggregates, as was found earlier (e.g. Loecke and Robertson, 2009; Parkin, 1987). The addition of litter to the model soils changed the temporal dynamics of the N2O emission substantially, but its effect on the net integrated N2O emission was rather minor (Fig. 5). More precisely, highest peak emission rates of all treatments were observed in the LAL treatment, but peak emission rates were followed by a faster return to low pre-flood emission rates in the LAL and the SAL treatments relative to the unamended treatments (Fig. 2). This confirms that surplus organic C can, in the short-term, boost N2O emissions, particularly in the large-aggregate treatment. The fast midterm return to low N2O emission suggests that N2O production by heterotrophic denitrification becomes limited by substrates other than carbon and/or that the carbon added to the soils affects the redox biogeochemistry in a way that shifts the balance between N2O production and consumption in favour of consumption. Loecke and Robertson (2009) reported similar temporal N2O emission patterns in field experiments with litter-amended soil, and attributed the observed dynamic of a rapid decline after peak emission to an increased demand for terminal electron acceptors during denitrification shortly after the carbon addition. Nitrate or nitrite limitation ultimately leads, under stable anoxic conditions, to the complete reduction of produced N2O to N2 decreasing net N2O emission. Indeed, the rapid decrease in N2O emissions after the emission rate peak in the litter addition treatments was accompanied by the complete depletion of in the soil solution at low redox potential, suggesting nitrate limitation. The increased demand for electron acceptors can be attributed to the increased availability of labile C compounds and nutrients provided by the mineralization of litter, and the concomitant stimulation of aggregate-associated microbial communities during the flooding (Li et al., 2016). At the same time, the litter-stimulated soil respiration increases the soil's oxygen demand, maintaining stable low redox conditions for a longer period of time during the drying phase. Since high activity of N2O reductase requires very low O2 concentrations (Morley et al., 2008), such conditions may be particularly favourable for complete denitrification to N2, an additional, or alternative, explanation for the low N2O emission rates shortly after the N2O emission peak.
4.3 Effects of Salix viminalis
Planted willow cuttings resulted in relatively low maximum N2O emission rates (LAP: 19.75±9.31 µmol m−2 h−1; SAP: 15.07±12.07 µmol m−2 h−1; mean ± SD), independent of aggregate size. The high values for WFPS throughout the hot moment, and a low redox potential in the subsoil, imply optimal conditions for denitrification or nitrifier denitrification; but compared to unamended and litter-addition treatments, only little N2O was emitted (both during peak N2O emission rates and with regards to the integrated N2O flux). S. viminalis suppressed peak N2O emissions, overriding the positive effect of large aggregates on N2O emissions observed otherwise. The specific mechanisms involved are uncertain. Fender et al. (2013) found – in laboratory experiments with soil from a temperate broad-leaved forest planted with ash saplings (Fraxinus excelsior L.) – N2O fluxes and plant effects very similar to the ones observed in our study. They partly attributed reduced N2O emissions in the presence of ash to plant uptake of nutrients that reduced availability to denitrifiers. Fast-growing plant species like Salix are particularly effective in removing soil inorganic N (Kowalik and Randerson, 1994). Such a causal link between reduced N2O emissions and plant growth is, however, not supported by our data. More precisely, the concentrations during the hot moment of N2O emissions were always relatively high (>0.5 mM), and above the levels observed in the litter treatments.
An alternative explanation for the reduced N2O emissions in the plant treatments could be rhizosphere aeration by aerenchyma, a physiological trait of Salix viminalis roots, which prevents the formation of anoxia in their close vicinity (Blom et al., 1990; Randerson et al., 2011), and thus inhibits anaerobic N2O production. Indeed, redox potentials in the topsoil were higher in SAP and LAP compared to the other treatments. By contrast, the redox potential in the saturated subsoil below was even lower than observed for the unamended soils. This indicates that the aeration effect by aerenchyma is constrained to the upper soil, or is, in the deeper soil portions, compensated by respiratory rhizosphere processes. On the other hand, aerenchyma can also aid in the gas exchange between the soil and the atmosphere, leading to an accelerated transport of N2O by bypassing the soil matrix. This phenomenon is well documented for various grasses such as Oryza (Baruah et al., 2010), Triticum (Smart and Bloom, 2001) or Phalaris arundinacea (Jørgensen et al., 2012). However, we are not aware of any reports on enhanced N2O emissions via aerenchyma by willows (Salix sp.), and indeed our results do not indicate any increased N2O emission via plants. In fact, we observed the lowest ecosystem flux rates and lowest total integrated N2O emissions in the mesocosms with S. viminalis.
According to Fender et al. (2013), in vegetated soils, microbial respiration is stimulated by deposition of root exudates, which in concert with root respiration in a highly saturated pore space leads to severe and ongoing oxygen depletion. Under such stable anoxic conditions complete denitrification would take place generating N2 and not N2O as the dominant final product and therefore N2O emissions would be low.
While oxygen depletion by root-exudation-stimulated microbial respiration likely occurs in the rhizosphere of any plant, rhizosphere aeration is restricted to plants possessing aerenchyma. However, the latter is a characteristic of many plants adapted to temporary flooding, and has also been described for Poaceae or for ash. Furthermore, it is reasonable to expect this trait to be found in other Salicaceae like Populus sp. and other species of softwood floodplain forests. In areas with monospecific stands of, for example, Salix sp., which are often found on restored river banks, this N2O-emission reducing trait can be a welcome side effect.
In this study, we investigated the distinct effects of aggregate size and surplus organic C from litter and vegetation on N2O emission from model soils after flooding. Flooding and drying were always associated with hot moments of N2O production, most likely due to heterotrophic denitrification as a result of suboxic O2 levels at high WFPS. Our results demonstrate that aggregate size is a very important factor in modulating N2O emission from soils under changing pore space water saturation. Aggregates of a diameter > 250 µm appear to foster suboxic microhabitats that favour denitrification and associated N2O emission. This soil aggregate size effect may be amplified in the presence of excess carbon substrate, as long as heterotrophic denitrification, as the main N2O producing process, is not electron-acceptor limited, and extremely reducing conditions in organic-rich soils do not promote complete denitrification leading to further reduction of N2O to N2. On the other hand, the higher porosity of the soils with macroaggregates may aid in the formation of microsites at the surface of aggregates where nitrification is re-initialized during drying, supporting favourable conditions for spatially coupled nitrification–denitrification. The mechanisms by which processes in the rhizosphere of Salix viminalis effectively suppress N2O emissions, and thus mask any aggregate size effect, remain ambiguous. Distinct physiological features of Salix viminalis, its root metabolism, in combination with microbial respiration can lead to the simultaneous aeration of some parts of the rhizosphere, and the formation of strongly reducing zones in others. In both cases, redox conditions seem to be an impediment for extensive net N2O production.
Our results demonstrate the importance and complexity of the interplay between soil aggregate size, labile organic C availability, respiratory processes in the rhizosphere and plant-induced aeration of soils under changing soil water content. Those interactions emerged as modulators of N2O emissions by controlling the O2 distribution in the soil matrix. Indeed, O2 appears as the unifying master variable that ultimately sets the boundary conditions for N2O production and/or consumption.
The main scope of this work was to expand our knowledge on the controls on net N2O emissions from floodplain soils. The systematic relationships observed in this study are likely to help anticipating where and when hot spots and hot moments of N2O emissions are most likely to occur in hydrologically dynamic soil systems like floodplain soils. Further understanding of the complex interaction between plants and soil microorganisms, the detritusphere and soil aggregation, as well as their influence on N turnover and N2O accumulation in soils, should focus on how the tested parameters affect the actual activity of the nitrifying and denitrifying communities, with an in-depth investigation into the biogeochemical pathways involved.
Data will be openly available at https://datadryad.org/ (Dryad Data Repository, 2018).
The supplement related to this article is available online at: https://doi.org/10.5194/bg-15-7043-2018-supplement.
The authors declare that they have no conflict of interest.
The initial concept of the experiment was developed by JL, MFL and PAN. ML planned the experiment in detail, set it up and performed it. PAN supervised the measurement of N2O gas concentrations, whereas ML conducted all other measurements and data analyses. ML wrote the manuscript with major contributions by JL, MFL and PAN.
The authors thank the Department of Evolutionary Biology and Environmental Studies of the
University of Zurich and René Husi for performing the GC measurements. We are also
very grateful to the Environmental Geoscience research group in the Department of
Environmental Sciences of the University of Basel and Judith Kobler-Waldis for helping us
with the IC measurements. We thank the WSL central laboratory and Daniel Christen,
Roger Köchli and Noureddine Hajjar of the Swiss Federal Institute for Forest, Snow
and Landscape Research (WSL) for assistance with chemical analyses. This study was funded
by the Swiss National Science Foundation (SNSF) under the grant number 200021_147002 as
well as by financial resources of WSL and the University of Basel.
Edited by: Ivonne Trebs
Reviewed by: Yit Arn Teh and one
anonymous referee
Baggs, E. M.: A review of stable isotope techniques for N2O source partitioning in soils: recent progress, remaining challenges and future considerations, Rapid Commun. Mass Spectrom., 22, 1664–1672, https://doi.org/10.1002/rcm.3456, 2008.
Baggs, E. M.: Soil microbial sources of nitrous oxide: Recent advances in knowledge, emerging challenges and future direction, Curr. Opin. Environ. Sustain., 3, 321–327, https://doi.org/10.1016/j.cosust.2011.08.011, 2011.
Balaine, N., Clough, T. J., Beare, M. H., Thomas, S. M., Meenken, E. D., and Ross, J. G.: Changes in Relative Gas Diffusivity Explain Soil Nitrous Oxide Flux Dynamics, Soil Sci. Soc. Am. J., 77, 1496–1505, https://doi.org/10.2136/sssaj2013.04.0141, 2013.
Baldwin, D. S. and Mitchell, A. M.: The effects of drying and re-flooding on the sediment and soil nutrient dynamics of lowland river–floodplain systems: a synthesis, Regul. Rivers Res. Manage., 16, 457–467, https://doi.org/10.1002/1099-1646(200009/10)16:5<457::AID-RRR597>3.3.CO;2-2, 2000.
Ball, B. C.: Soil structure and greenhouse gas emissions: A synthesis of 20 years of experimentation, Eur. J. Soil Sci., 64, 357–373, https://doi.org/10.1111/ejss.12013, 2013.
Baruah, K. K., Gogoi, B., Gogoi, P., and Gupta, P. K.: N2O emission in relation to plant and soil properties and yield of rice varieties, Agron. Sustain. Dev., 30, 733–742, https://doi.org/10.1051/agro/2010021, 2010.
Bateman, E. J. and Baggs, E. M.: Contributions of nitrification and denitrification to N2O emissions from soils at different water-filled pore space, Biol. Fert. Soils, 41, 379–388, https://doi.org/10.1007/s00374-005-0858-3, 2005.
Beare, M. H., Gregorich, E. G., and St-Georges, P.: Compaction effects on CO2 and N2O production during drying and rewetting of soil, Soil Biol. Biochem., 41, 611–621, https://doi.org/10.1016/j.soilbio.2008.12.024, 2009.
Bender, S. F., Plantenga, F., Neftel, A., Jocher, M., Oberholzer, H.-R., Köhl, L., Giles, M., Daniell, T. J., and van der Heijden, M. G.: Symbiotic relationships between soil fungi and plants reduce N2O emissions from soil, Int. Soc. Microb. Ecol. J., 8, 1336–1345, https://doi.org/10.1038/ismej.2013.224, 2014.
Blom, C. W. P. M., Bögemann, G. M., Laan, P., van der Sman, A. J. M., van de Steeg, H. M., and Voesenek, L. A. C. J.: Adaptations to flooding in plants from river areas, Aquat. Bot., 38, 29–47, https://doi.org/10.1016/0304-3770(90)90097-5, 1990.
Blum, J. M., Su, Q., Ma, Y., Valverde-Pérez, B., Domingo-Félez, C., Jensen, M. M., and Smets, B. F.: The pH dependency of N-converting enzymatic processes, pathways and microbes: Effect on net N2O production, Environ. Microbiol., 20, 1623–1640, https://doi.org/10.1111/1462-2920.14063, 2018.
Böttcher, J., Weymann, D., Well, R., Von Der Heide, C., Schwen, A., Flessa, H., and Duijnisveld, W. H. M.: Emission of groundwater-derived nitrous oxide into the atmosphere: model simulations based on a 15N field experiment, Eur. J. Soil Sci., 62, 216–225, https://doi.org/10.1111/j.1365-2389.2010.01311.x, 2011.
Bringel, F. and Couée, I.: Pivotal roles of phyllosphere microorganisms at the interface between plant functioning and atmospheric trace gas dynamics, Front. Microbiol., 6, 1–14, https://doi.org/10.3389/fmicb.2015.00486, 2015.
Butterbach-Bahl, K., Baggs, E. M., Dannenmann, M., Kiese, R., and Zechmeister-Boltenstern, S.: Nitrous oxide emissions from soils: how well do we understand the processes and their controls?, Philos. T. Roy. Soc. Lond. B, 368, 20130122, https://doi.org/10.1098/rstb.2013.0122, 2013.
Cantón, Y., Solé-Benet, A., Asensio, C., Chamizo, S., and Puigdefábregas, J.: Aggregate stability in range sandy loam soils Relationships with runoff and erosion, Catena, 77, 192–199, https://doi.org/10.1016/j.catena.2008.12.011, 2009.
Ciais, P., Sabine, C., Bala, G., Bopp, L., Brovkin, V., Canadell, J., Chhabra, A., DeFries, R., Galloway, J., Heimann, M., Jones, C., Le Quéré, C., Myneni, R. B., Piao, S., and Thornton, P.: Carbon and Other Biogeochemical Cycles, in: Climate Change 2013 – The Physical Science Basis, edited by: Intergovernmental Panel on Climate Change, Cambridge University Press, Cambridge, 465–570, 2013.
Diba, F., Shimizu, M., and Hatano, R.: Effects of soil aggregate size, moisture content and fertilizer management on nitrous oxide production in a volcanic ash soil, Soil Sci. Plant Nutr., 57, 733–747, https://doi.org/10.1080/00380768.2011.604767, 2011.
Drury, C., Yang, X., Reynolds, W., and Tan, C.: Influence of crop rotation and aggregate size on carbon dioxide production and denitrification, Soil Till. Res., 79, 87–100, https://doi.org/10.1016/j.still.2004.03.020, 2004.
Dryad Data Repository: https://datadryad.org/, last access: 15 October 2018.
Ebrahimi, A. and Or, D.: Microbial community dynamics in soil aggregates shape biogeochemical gas fluxes from soil profiles – upscaling an aggregate biophysical model, Global Change Biol., 22, 3141–3156, https://doi.org/10.1111/gcb.13345, 2016.
Elliott, A. E. T. and Coleman, D. C.: Let the soil work for us, Ecol. Bull., 39, 22–32, 1988.
Fender, A.-C., Leuschner, C., Schützenmeister, K., Gansert, D., and Jungkunst, H. F.: Rhizosphere effects of tree species – Large reduction of N2O emission by saplings of ash, but not of beech, in temperate forest soil, Eur. J. Soil Biol., 54, 7–15, https://doi.org/10.1016/j.ejsobi.2012.10.010, 2013.
Forster, P., Ramaswamy, V., Artaxo, P., Berntsen, T., Betts, R., Fahey, D. W., Haywood, J., Lean, J., Lowe, D. C., Myhre, G., Nganga, J., Prinn, R., Raga, G., Schulz, M., and Van Dorland, R.: Changes in Atmospheric Constituents and in Radiative Forcing, in: Climate Change 2007: The Physical Science Basis, edited by: Solomon, S., Qin, D., Manning, M., Chen, Z., Marquis, M., Averyt, K. B., Tignor, M., and Miller, H. L., Cambridge University Press, Cambridge, UK and New York, NY, USA, 129–234, 2007.
Frame, C. H., Lau, E., Joseph Nolan, E., Goepfert, T. J., and Lehmann, M. F.: Acidification enhances hybrid N2O production associated with aquatic ammonia-oxidizing microorganisms, Front. Microbiol., 7, 1–23, https://doi.org/10.3389/fmicb.2016.02104, 2017.
Gajić, B., Đurović, N., and Dugalić, G.: Composition and stability of soil aggregates in Fluvisols under forest, meadows, and 100 years of conventional tillage, J. Plant Nutr. Soil Sci., 173, 502–509, https://doi.org/10.1002/jpln.200700368, 2010.
Gee, G. W. and Bauder, J. W.: Particle-size Analysis, in: Physical and Mineralogical Methods-Agronomy Monograph no. 9, edited by: Klute, A., American Society of Agronomy-Soil Science Society of America, Madison, WI., 383–411, 1986.
Goldberg, S. D., Knorr, K. H., Blodau, C., Lischeid, G., and Gebauer, G.: Impact of altering the water table height of an acidic fen on N2O and NO fluxes and soil concentrations, Global Change Biol., 16, 220–233, https://doi.org/10.1111/j.1365-2486.2009.02015.x, 2010.
GraphPad Software Inc.: GraphPad Prism 7.04, La Jolla, CA, available at: https://www.graphpad.com/ (last access: 15 October 2018), 2017.
Groffman, P. M. and Tiedje, J. M.: Denitrification Hysteresis During Wetting and Drying Cycles in Soil, Soil Sci. Soc. Am. J., 52, 1626, https://doi.org/10.2136/sssaj1988.03615995005200060022x, 1988.
Hartmann, D. J., Klein Tank, A. M. G., Rusticucci, M., Alexander, L. V, Brönnimann, S., Charabi, Y. A.-R., Dentener, F. J., Dlugokencky, E. J., Easterling, D. R., Kaplan, A., Soden, B. J., Thorne, P. W., Wild, M., and Zhai, P.: Observations: Atmosphere and Surface, in: Climate Change 2013 – The Physical Science Basis, edited by: Intergovernmental Panel on Climate Change, Cambridge University Press, Cambridge, 159–254, 2013.
Hefting, M., Clément, J.-C., Dowrick, D., Cosandey, A. C., Bernal, S., Cimpian, C., Tatur, A., Burt, T. P., and Pinay, G.: Water table elevation controls on soil nitrogen cycling in riparian wetlands along a European climatic gradient, Biogeochemistry, 67, 113–134, https://doi.org/10.1023/B:BIOG.0000015320.69868.33, 2004.
Heincke, M. and Kaupenjohann, M.: Effects of soil solution on the dynamics of N2O emissions: a review, Nutr. Cycl. Agroecosyst., 55, 133–157, https://doi.org/10.1023/A:1009842011599, 1999.
Hendershot, W. H., Lalande, H., and Duquette, M.: Soil Reaction and Exchangeable Acidity, in Soil Sampling and Methods of Analysis, edited by: Carter, M. R. and Gregorich, E. G., CRC Press Inc, Boca Raton, FL, 173–178, 2007.
Hill, A. R.: Buried organic-rich horizons: their role as nitrogen sources in stream riparian zones, Biogeochemistry, 104, 347–363, https://doi.org/10.1007/s10533-010-9507-5, 2011.
Hu, H.-W., Macdonald, C. A., Trivedi, P., Holmes, B., Bodrossy, L., He, J.-Z., and Singh, B. K.: Water addition regulates the metabolic activity of ammonia oxidizers responding to environmental perturbations in dry subhumid ecosystems, Environ. Microbiol., 17, 444–461, https://doi.org/10.1111/1462-2920.12481, 2015.
Jahangir, M. M. R., Roobroeck, D., Van Cleemput, O., and Boeckx, P.: Spatial variability and biophysicochemical controls on N2O emissions from differently tilled arable soils, Biol. Fert. Soils, 47, 753–766, https://doi.org/10.1007/s00374-011-0580-2, 2011.
Jørgensen, C. J., Struwe, S., and Elberling, B.: Temporal trends in N2O flux dynamics in a Danish wetland – effects of plant-mediated gas transport of N2O and O2 following changes in water level and soil mineral-N availability, Global Chang. Biol., 18, 210–222, https://doi.org/10.1111/j.1365-2486.2011.02485.x, 2012.
Khalil, K., Renault, P., and Mary, B.: Effects of transient anaerobic conditions in the presence of acetylene on subsequent aerobic respiration and N2O emission by soil aggregates, Soil Biol. Biochem., 37, 1333–1342, https://doi.org/10.1016/j.soilbio.2004.11.029, 2005.
Koschorreck, M. and Darwich, A.: Nitrogen dynamics in sesonally flooded soils in the Amazon floodplain, Wetl. Ecol. Manage., 11, 317–330, 1998.
Kowalik, P. J. and Randerson, P. F.: Nitrogen and phosphorus removal by willow stands irrigated with municipal waste water – A review of the Polish experience, Biomass Bioenergy, 6, 133–139, https://doi.org/10.1016/0961-9534(94)90092-2, 1994.
Kuzyakov, Y. and Blagodatskaya, E.: Microbial hotspots and hot moments in soil: Concept & review, Soil Biol. Biochem., 83, 184–199, https://doi.org/10.1016/j.soilbio.2015.01.025, 2015.
Li, X., Sørensen, P., Olesen, J. E., and Petersen, S. O.: Evidence for denitrification as main source of N2O emission from residue-amended soil, Soil Biol. Biochem., 92, 153–160, https://doi.org/10.1016/j.soilbio.2015.10.008, 2016.
Loecke, T. D. and Robertson, G. P.: Soil resource heterogeneity in terms of litter aggregation promotes nitrous oxide fluxes and slows decomposition, Soil Biol. Biochem., 41, 228–235, https://doi.org/10.1016/j.soilbio.2008.10.017, 2009.
Luster, J., Göttlein, A., Nowack, B., and Sarret, G.: Sampling, defining, characterising and modeling the rhizosphere – the soil science tool box, Plant Soil, 321, 457–482, https://doi.org/10.1007/s11104-008-9781-3, 2009.
Manucharova, N. A., Stepanov, A. L., and Umarov, M. M.: Microbial transformation of nitrogen in water-stable aggregates of various soil types, Eurasian Soil Sci., 34, 1125–1131, 2001.
Morley, N., Baggs, E. M., Dörsch, P., and Bakken, L.: Production of NO, N2O and N2 by extracted soil bacteria, regulation by and O2 concentrations, FEMS Microbiol. Ecol., 65, 102–112, https://doi.org/10.1111/j.1574-6941.2008.00495.x, 2008.
Myrold, D. D., Pett-Ridge, J., and Bottomley, P. J.: Nitrogen Mineralization and Assimilation at Millimeter Scales, in: Methods in Enzymology, vol. 496, Academic Press, New York, USA, 91–114, 2011.
Neira, J., Ortiz, M., Morales, L., and Acevedo, E.: Oxygen diffusion in soils: Understanding the factors and processes needed for modeling, Chil. J. Agric. Res., 75, 35–44, https://doi.org/10.4067/S0718-58392015000300005, 2015.
Oades, J. M.: Soil organic matter and structural stability: mechanisms and implications for management, Plant Soil, 76, 319–337, https://doi.org/10.1007/BF02205590, 1984.
Parkin, T. B.: Soil Microsites as a Source of Denitrification Variability, Soil Sci. Soc. Am. J., 51, 1194–1199, 1987.
Philippot, L., Hallin, S., Börjesson, G., and Baggs, E. M.: Biochemical cycling in the rhizosphere having an impact on global change, Plant Soil, 321, 61–81, https://doi.org/10.1007/s11104-008-9796-9, 2009.
Rabot, E., Hénault, C., and Cousin, I.: Temporal Variability of Nitrous Oxide Emissionsby Soils as Affected by Hydric History, Soil Sci. Soc. Am. J., 78, 434–444, https://doi.org/10.2136/sssaj2013.07.0311, 2014.
Randerson, P. F., Moran, C., and Bialowiec, A.: Oxygen transfer capacity of willow (Salix viminalis L.), Biomass Bioenergy, 35, 2306–2309, https://doi.org/10.1016/j.biombioe.2011.02.018, 2011.
Ravishankara, A. R., Daniel, J. S., and Portmann, R. W.: Nitrous Oxide (N2O): The Dominant Ozone-Depleting Substance Emitted in the 21st Century, Science, 326, 123–125, https://doi.org/10.1126/science.1176985, 2009.
R Core Team: R: A Language and Environment for Statistical Computing, R Found. Stat. Comput., Vienna, available at: https://www.R-project.org/, last access: 15 October 2018.
Renault, P. and Stengel, P.: Modeling Oxygen Diffusion in Aggregated Soils: I. Anaerobiosis inside the Aggregates, Soil Sci. Soc. Am. J., 58, 1017, https://doi.org/10.2136/sssaj1994.03615995005800040004x, 1994.
Robertson, G. P. and Groffman, P. M.: Nitrogen Transformations, in: Soil Microbiology, Ecology and Biochemistry, Elsevier, London, UK, 421–446, 2015.
Ruser, R., Flessa, H., Russow, R., Schmidt, G., Buegger, F., and Munch, J. C.: Emission of N2O, N2 and CO2 from soil fertilized with nitrate: Effect of compaction, soil moisture and rewetting, Soil Biol. Biochem., 38, 263–274, https://doi.org/10.1016/j.soilbio.2005.05.005, 2006.
Samaritani, E., Shrestha, J., Fournier, B., Frossard, E., Gillet, F., Guenat, C., Niklaus, P. A., Pasquale, N., Tockner, K., Mitchell, E. A. D., and Luster, J.: Heterogeneity of soil carbon pools and fluxes in a channelized and a restored floodplain section (Thur River, Switzerland), Hydrol. Earth Syst. Sci., 15, 1757–1769, https://doi.org/10.5194/hess-15-1757-2011, 2011.
Sey, B. K., Manceur, A. M., Whalen, J. K., Gregorich, E. G., and Rochette, P.: Small-scale heterogeneity in carbon dioxide, nitrous oxide and methane production from aggregates of a cultivated sandy-loam soil, Soil Biol. Biochem., 40, 2468–2473, https://doi.org/10.1016/j.soilbio.2008.05.012, 2008.
Shrestha, J., Niklaus, P. a, Frossard, E., Samaritani, E., Huber, B., Barnard, R. L., Schleppi, P., Tockner, K., and Luster, J.: Soil nitrogen dynamics in a river floodplain mosaic, J. Environ. Qual., 41, 2033–2045, https://doi.org/10.2134/jeq2012.0059, 2012.
Six, J., Paustian, K., Elliott, E. T., and Combrink, C.: Soil Structure and Organic Matter, Soil Sci. Soc. Am. J., 64, 681–689, https://doi.org/10.2136/sssaj2000.642681x, 2000.
Six, J., Bossuyt, H., Degryze, S., and Denef, K.: A history of research on the link between (micro)aggregates, soil biota, and soil organic matter dynamics, Soil Till. Res., 79, 7–31, https://doi.org/10.1016/j.still.2004.03.008, 2004.
Smart, D. R. and Bloom, A. J.: Wheat leaves emit nitrous oxide during nitrate assimilation, P. Natl. Acad. Sci. USA, 98, 7875–7878, https://doi.org/10.1073/pnas.131572798, 2001.
Spott, O., Russow, R., and Stange, C. F.: Formation of hybrid N2O and hybrid N2 due to codenitrification: First review of a barely considered process of microbially mediated N-nitrosation, Soil Biol. Biochem., 43, 1995–2011, https://doi.org/10.1016/j.soilbio.2011.06.014, 2011.
Stolk, P. C., Hendriks, R. F. A., Jacobs, C. M. J., Moors, E. J., and Kabat, P.: Modelling the effect of aggregates on N2O emission from denitrification in an agricultural peat soil, Biogeosciences, 8, 2649–2663, https://doi.org/10.5194/bg-8-2649-2011, 2011.
Thorbjørn, A., Moldrup, P., Blendstrup, H., Komatsu, T., and Rolston, D. E.: A Gas Diffusivity Model Based on Air-, Solid-, and Water-Phase Resistance in Variably Saturated Soil, Vadose Zone J., 7, 1276, https://doi.org/10.2136/vzj2008.0023, 2008.
Tisdall, J. M. and Oades, J. M.: Organic matter and water-stable aggregates in soils, J. Soil Sci., 33, 141–163, https://doi.org/10.1111/j.1365-2389.1982.tb01755.x, 1982.
Totsche, K. U., Amelung, W., Gerzabek, M. H., Guggenberger, G., Klumpp, E., Knief, C., Lehndorff, E., Mikutta, R., Peth, S., Prechtel, A., Ray, N., and Kögel-Knabner, I.: Microaggregates in soils, J. Plant Nutr. Soil Sci., 181, 104–136, https://doi.org/10.1002/jpln.201600451, 2017.
Vieten, B., Conen, F., Neftel, A., and Alewell, C.: Respiration of nitrous oxide in suboxic soil, Eur. J. Soil Sci., 60, 332–337, https://doi.org/10.1111/j.1365-2389.2009.01125.x, 2009.
Walthert, L., Graf, U., Kammer, A., Luster, J., Pezzotta, D., Zimmermann, S., and Hagedorn, F.: Determination of organic and inorganic carbon, δ13C, and nitrogen in soils containing carbonates after acid fumigation with HCl, J. Plant Nutr. Soil Sci., 173, 207–216, https://doi.org/10.1002/jpln.200900158, 2010.
Young, I. and Ritz, K.: Tillage, habitat space and function of soil microbes, Soil Till. Res., 53, 201–213, https://doi.org/10.1016/S0167-1987(99)00106-3, 2000.
Zhu, X., Burger, M., Doane, T., and Horwath, W. R.: Ammonia oxidation pathways and nitrifier denitrification are significant sources of N2O and NO under low oxygen availability, P. Natl. Acad. Sci. USA, 110, 6328–6333, https://doi.org/10.1073/pnas.1219993110, 2013.
hot momentsof enhanced N2O emissions from floodplain soils during the drying phase after saturation occur. Larger aggregate size led to higher integrated flux rates when soil was unamended or mixed with leaf litter, whereas planting with willow significantly reduced emissions. Also, emission time patterns differed among the treatments.