the Creative Commons Attribution 4.0 License.
the Creative Commons Attribution 4.0 License.
 | 30 Nov 2018
Ecosystem fluxes of carbonyl sulfide in an old-growth forest: temporal dynamics and responses to diffuse radiation and heat waves
Bharat Rastogi
Max Berkelhammer
Sonia Wharton
Mary E. Whelan
Frederick C. Meinzer
David Noone
Christopher J. Still
Carbonyl sulfide (OCS) has recently emerged as a tracer for terrestrial carbon uptake. While physiological studies relating OCS fluxes to leaf stomatal dynamics have been established at leaf and branch scales and incorporated into global carbon cycle models, the quantity of data from ecosystem-scale field studies remains limited. In this study, we employ established theoretical relationships to infer ecosystem-scale plant OCS uptake from mixing ratio measurements. OCS fluxes showed a pronounced diurnal cycle, with maximum uptake at midday. OCS uptake was found to scale with independent measurements of CO2 fluxes over a 60 m tall old-growth forest in the Pacific Northwest of the US (45∘49′13.76 N, 121∘57′06.88 W) at daily and monthly timescales under mid–high light conditions across the growing season in 2015. OCS fluxes were strongly influenced by the fraction of downwelling diffuse light. Finally, we examine the effect of sequential heat waves on fluxes of OCS, CO2, and H2O. Our results bolster previous evidence that ecosystem OCS uptake is strongly related to stomatal dynamics, and measuring this gas improves constraints on estimating photosynthetic rates at the ecosystem scale.
- Article
(2028 KB) - Full-text XML
- BibTeX
- EndNote


Carbonyl sulfide (OCS) is the most abundant sulfur gas in the atmosphere, with a mean atmospheric concentration of ∼ 500 ppt (parts per trillion), and therefore a significant part of the tropospheric and stratospheric sulfur cycles, with implications for the global radiation budget and ozone depletion (Johnson et al.,1993; Notholt et al., 2003). The dominant sink of atmospheric OCS is vegetation (Kesselmeier and Merk, 1993; Kettle et al., 2002; Montzka et al., 2007, and references therein), through rapid and irreversible hydrolysis by the ubiquitous enzyme carbonic anhydrase (Protoschill-Krebs et al., 1996; Protoschill-Krebs and Kesselmeier, 1992). Recent advances in spectroscopic technology have enabled continuous in situ measurements of OCS on timescales that are relevant to understanding stomatal function at the leaf-scale (Stimler et al., 2010a, b), branch scale (Berkelhammer et al., 2014), and the ecosystem scale (Kooijmans et al., 2017; Wehr et al., 2017). An important distinction between OCS and CO2 cycling is the absence of a retro-flux from actively photosynthesizing leaves (OCS emissions have been reported from stressed crops following severe fungal infection; Bloem et al., 2012). However, the normalized leaf uptake ratio of OCS : CO2 (LRU; Sandoval-Soto et al., 2005) is relatively constant at medium to high light levels (Maseyk et al., 2014; Stimler et al., 2010), making it an excellent proxy for quantifying plant productivity (gross primary productivity – GPP; Asaf et al., 2013; Billesbach et al., 2014; Blonquist et al., 2011). On the other hand, both uptake and emissions of OCS from soils have been identified (Whelan et al., 2016; Sun et al., 2015; Maseyk et al., 2014; Kesselmier et al., 1999). While ecosystem-scale measurements of OCS continue to establish links between OCS uptake and GPP in different ecosystems (for a comprehensive list of ecosystem-scale studies, readers are referred to Fig. 2 in Whelan et al., 2018), inconsistencies persist. For example, in an oak–savanna woodland in southern France, Belviso et al. (2016) found that OCS exchange was strongly influenced by photosynthesis during early morning hours, while meaningful values of LRU could only by calculated for a few days in the early afternoons. Commane et al. (2015) were unable to explain midsummer emissions of OCS in a midlatitude deciduous forest. Uncertainties highlighted above argue for field-scale measurements of OCS in a variety of ecosystems, particularly as OCS flux predictions have recently been incorporated to inform estimates of plant productivity in global carbon cycle models (Campbell et al., 2017a; Hilton et al., 2017; Launois et al., 2015).
OCS fluxes have not been previously reported for old-growth forests, although a recent study using flask samples inferred a large uptake of OCS in coastal redwood forests in northern California (Campbell et al., 2017b). Rastogi et al. (2018) found large drawdowns in mixing ratios of OCS at an old-growth forest in the Pacific Northwest of the US and significant uptake of this gas by various components of the ecosystem (leaves, soils, and epiphytes). In this study, we report estimates of OCS fluxes from an old-growth forest and place them in the context of ecosystem carbon and water cycling. Additionally, we investigate the response of CO2, H2O, and OCS fluxes to changes in the fraction of downwelling diffuse radiation as well as heat wave events through the growing season. Technological constraints posed limitations on measuring fast-response OCS fluxes, so instead we combine continuous in situ measurements of OCS mixing ratios above and within the canopy with established theoretical equations for OCS uptake (see Berry et al., 2013; Commane et al., 2015; Seibt et al., 2010) to characterize OCS fluxes using a simple empirical model and compare them with ecosystem uptake of CO2 from colocated eddy covariance measurements.
2.1 Site description
Measurements were made at the Wind River Experimental Forest (WR), located within the Gifford Pinchot National Forest in southwest Washington state, USA (45∘ 49′13.76 N, 121∘57′06.88 W; 371 m a.s.l.). The site is well studied and described in great detail (Paw U et al., 2004; Shaw et al., 2004; Wharton and Falk, 2016; Winner et al., 2004). The climate is classified as temperate oceanic with a strong summer drought. The forest is 478 ha of preserved old-growth evergreen needleleaf forest, with dominant tree species of Douglas fir (Pseudotsuga menziesii) and western hemlock (Tsuga heterophylla). The tallest Douglas fir trees are between 50 and 60 m, while the shade-tolerant hemlocks are typically between 20 and 30 m high. Maximum rooting depth is 1–2 m for the tallest, dominant Douglas fir trees although most of the root biomass is concentrated in the first 0.5 m (Shaw et al., 2014). The cumulative leaf area index (LAI) is estimated to be 8–9 m2 m−2 (Parker et al., 2004). Additionally, the ecosystem hosts a large diversity of mosses, lichens and other epiphytic plants, which play an important role in canopy OCS dynamics Rastogi et al., 2018). The soils are volcanic in origin, although most of the forest surface is comprised of decaying organic matter (Shaw et al., 2004).
2.2 Study period
Measurements reported here are from between 18 April and 31 December 2015. However, in early November an intake line at the top of the canopy was damaged after a rainstorm. Measurements continued at the other intake heights (see Sect. 2.4 and 2.9). Therefore, ecosystem fluxes and related analyses in this study cover 136 days between 18 April and 31 October while chamber-based soil fluxes are reported for the months of August–December. Gaps in the time series due to analyzer maintenance correspond to 26–28 June, 6–17 July, 4–7 August, 24 August, and 4–7 October. April–October roughly corresponds to most of the growing season, although at this site GPP usually peaks early in March–April, when soil moisture is high and ecosystem respiration flux is low, while plant productivity is typically severely light and temperature limited in the months of November–December (Wharton and Falk, 2016). Environmental conditions during the measurement campaign are shown in Fig. 1 and represent a typical Mediterranean-type climate, with temperature peaking in July and minimal to no measured rainfall between June and September. This results in high summertime atmospheric vapor pressure deficit (VPDa), and soil moisture declines steadily through the summer period, with some recharge following rare precipitation events in September and then more commonly in October. The measurement period also encompasses three distinct heat waves, characterized by anomalously high air temperatures and midday VPDa values (often exceeding 4 kPa). We examine the response of OCS and CO2 fluxes during these heat waves.
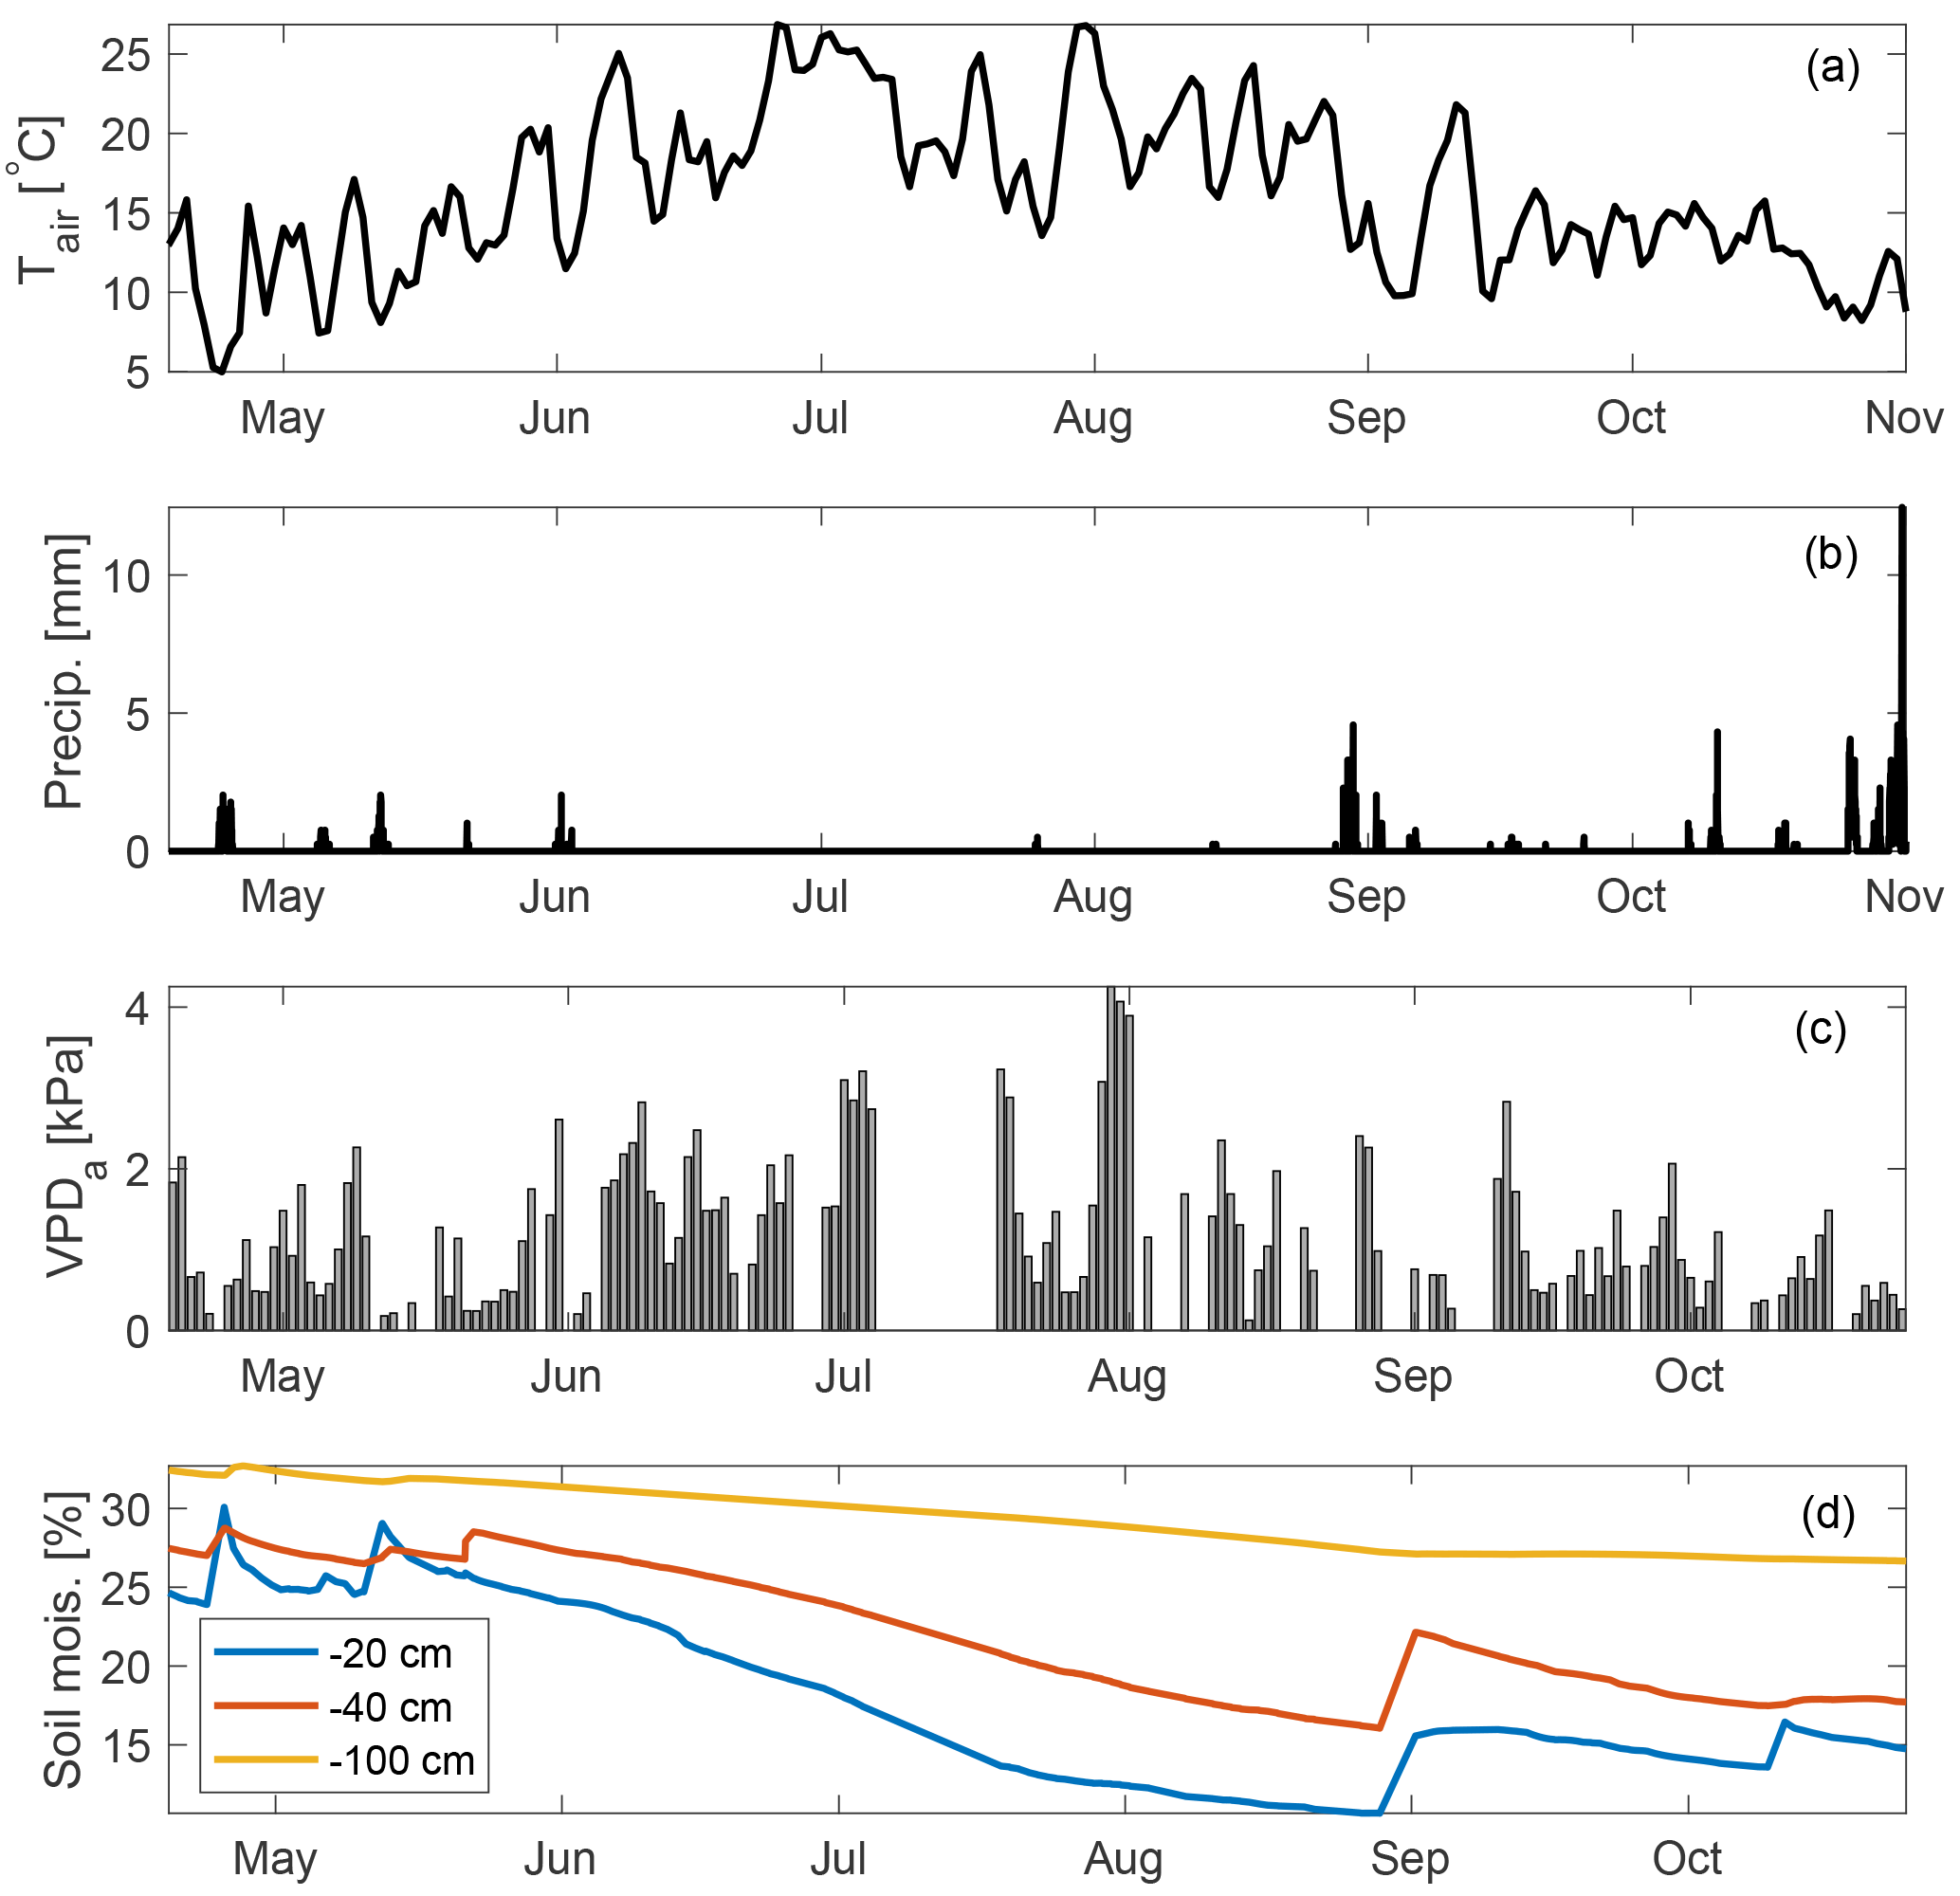
Figure 1Environmental conditions at Wind River during the measurement campaign: daily mean air temperature (a), precipitation (b) midday VPDa (c), and soil moisture measured at three depths (d) are shown.
2.3 CO2 and H2O eddy flux measurements
Carbon, water, and energy fluxes have been collected since 1998 at the Wind River AmeriFlux tower (US-wrc; Paw U et al., 2004). For further details, readers are referred to Falk et al. (2008; instrumentation and data processing) and Wharton et al. (2012) and Wharton and Falk (2016) for multiyear carbon and water flux measurements and synthesis.
2.4 OCS measurements
A commercially available off-axis integrated cavity output spectroscopy analyzer manufactured by Los Gatos Research Inc. (LGR; model 914-0028) was deployed at the base of the tower in an insulated and temperature-controlled shed. The instrument measures mixing ratios of OCS, CO2, H2O, and CO simultaneously at a maximal scan rate of 5 Hz. The system uses a 4.87 µm cascade laser coupled to a high-finesse 800 cm3 optical cavity, and light transmitted through the cavity is focused into a cooled and amplified HgCdTe detector. OCS is detected at ∼ 2050.40 cm−1, CO2 at 2050.56 cm−1, CO at ∼ 2050.86 cm−1, and H2O at ∼ 2050.66 cm−1. Pressure broadening associated with changes in the concentration of water vapor in the samples is corrected for in the analysis routine. Air was sampled through 0.25 in. diameter PFA (polyfluoroacetate) tubing using a diaphragm pump at a flow rate of 2 L min−1, from inlets located at 70 (at the height of the eddy flux instrumentation), 60 (canopy top), 20, 10, and 1 m. The sampling frequency was 0.1 Hz, and the sampling interval was 5 min. The first minute of each sampling interval was removed to avoid any inter-sample mixing. The remaining data were checked for temperature and pressure fluctuations inside the measurement chamber, and a moving window filter was used to eliminate any sudden outliers in the data. Mixing ratios were aggregated to provide hourly means. For detailed information regarding instrumentation and the measurement, readers are referred to Rastogi et al. (2018), Berkelhammer et al. (2014), and Belviso et al. (2016).
2.5 Calibration
Calibration was performed using ambient air stored in insulated tanks as a secondary reference. Air was sampled into the analyzer daily, and tank pressure was routinely monitored to check for leaks. Glass flasks were randomly sampled from calibration tanks and measured against an NOAA GMD (Global Monitoring Division ) reference standard. Cross-referencing revealed that the accuracy of the measurement was within the reported minimum uncertainty of the instrument (of 12.6 pmol mol−1; Berkelhammer et al., 2016).
2.6 Thermal camera measurements
Leaf temperatures were measured from 28 October 2014 to 28 January 2016 using a FLIR A325sc thermal camera (FLIR System Inc., Wilsonville, OR), in which a FLIR IR 30 mm lens (focal length: 30.38 mm; field of view: 15∘ × 11.25∘) was installed. The thermal camera has a pixel resolution of 320 × 240. Within the field of view (FOV), spot sizes of a single pixel are 0.83 cm from 10 m distance and 8.3 cm from 100 m distance. Manufacturer-reported errors in original measured thermal temperatures are ±2 ∘C or ±2 % of the measurements. The camera model is identical to one used in another study at an AmeriFlux site in central Oregon (US Me-2), and the detailed specifications can be found in Kim et al. (2016). To monitor a larger canopy region, a pan–tilt unit (PTU) was used for motion control, allowing multiple canopy thermal image acquisition within one motion cycle. We used a FLIR PTU-D100E (FLIR System Inc., Wilsonville, OR; (http://www.flir.com/mcs, last access: 21 November 2018) to move the thermal camera vertically and horizontally at specific pan and tilt angles. We selected five pan–tilt angle (PT) positions representing the upper canopy (i.e., ∼ 40 to 60 m above the forest floor) to estimate leaf temperatures in this study.
2.7 Diffuse light measurement and analyses
An SPN1 Sunshine Pyranometer (Delta-T Devices Ltd., Cambridge, UK) was installed at the top of the canopy and collected direct and diffuse shortwave downwelling radiation from April to December 2015. Measurements were made every 1 min and then aggregated to hourly means. We limited our analyses of diffuse radiation data to include only midday hours (between 11:00 and 13:00) to minimize the influence of solar angles on diffuse radiation fractions. We defined three distinct periods based on the ratio of diffuse radiation to total incoming solar radiation (henceforth referred to as fdiff). Data were characterized as clear if fdiff <0.2, as partly cloudy if fdiff >0.2 and fdiff <0.8, and as overcast if fdiff >0.8.
2.8 OCS flux estimation
Canopy-scale leaf OCS flux was estimated using flux-gradient similarity, following Commane et al. (2015).
where FOCS, , ΔOCS, and are the fluxes and gradients of OCS and H2O, respectively, and SOCS is the change in storage flux of OCS. A change in storage flux is subject to large uncertainties, and estimates have been shown to vary depending on the averaging time and vertical resolution of the storage profile (Yang et al., 2007), horizontal resolution, and site heterogeneity (de Araújo et al., 2010; Nicolini et al., 2018) as well as canopy decoupling (Jocher et al., 2018). Since large parts of the canopy at the site are decoupled from the bulk air at all times (Pyles et al., 2004), we inferred change in storage as the height-integrated change in the time derivative of mixing ratios between the canopy top and above the canopy. Following Seibt et al. (2010) and Berry et al. (2013), we assume that OCS is irreversibly and rapidly consumed inside leaves, such that the gradient between ambient air and the leaf interior effectively reduces to the ambient measured OCS mixing ratio:
where ΔOCS is defined as the gradient of OCS between ambient air and the leaf intercellular spaces (χ is the mixing ratio of OCS, and superscripts a and l refer to ambient and leaf, respectively). In our study, is the measured mixing ratio at the canopy top (60 m) instead of above canopy (70 m) to account for turbulent transport between the canopy top and air that is above the canopy top. We use the vapor pressure deficit (VPD) as the corresponding gradient for H2O, under the key assumption that the intercellular leaf surfaces are saturated with water vapor. While VPD is usually calculated using air temperature, a more accurate calculation can be performed with leaf temperatures, which can deviate significantly from air temperatures (Kim et al., 2016), leading to significant differences between the VPD of ambient air and that at the leaf surface (Figs. 2a and 3d in this study). Previously, leaf temperatures have been inferred from sensible heat fluxes, wind speed, and air temperatures (e.g., Wehr et al., 2017); here, we use explicit measurements of leaf skin temperatures to estimate leaf–air VPD (VPDl). Analogous to Eq. (3),
where ei is saturation vapor pressure in the leaf sub-stomatal cavity (kPa), using leaf skin temperature, ea is the actual vapor pressure (kPa), P is the measured atmospheric pressure (kPa) at the tower top, and and (ppth) are the leaf and ambient H2O mixing ratios at the canopy top. Finally, since gradients of OCS and H2O are estimated between ambient air and the leaf intercellular spaces, these are normalized by the ratio of diffusivities of these two species in air (Seibt et al., 2010; Wohlfahrt et al., 2012).
was measured using eddy covariance at the tower top (70 m). In high-LAI forests with minimal exposed soil, such as those of the Pacific Northwest, fluxes of can be treated as a good proxy for transpiration, since soil evaporation is minimal. We excluded rainy days, as well as two days following rainfall, to only capture periods when can be assumed to be dominated by transpiration. Equation (1) was evaluated only under the condition mmol m−2 s−1. We restricted our analyses to daytime, when OCS flux is assumed to be related to leaf CO2 uptake (Maseyk et al., 2014; Wehr et al., 2017).
Leaf relative uptake was calculated following Seibt et al. (2010).
where GPP was estimated from CO2 fluxes measured at the tower top, using a nighttime based partitioning approach (Reichstein et al., 2005), which was optimized for the site (Falk et al., 2008). Finally, canopy conductance (Gc) was estimated using a simple flux-gradient approach with the assumption that the canopy (or ecosystem) acts as a single big leaf.
2.9 Surface fluxes
A long-term automatic soil survey chamber (Li-Cor 8100-104, 20 cm diameter) was installed at three 0.03 m2 surface sites in series, within 1 m of each other. All plastic and rubber parts had been removed from the chamber and replaced with materials compatible with OCS measurements: stainless steel, PFA plastic, and Volara foam. Blank measurements were performed in the laboratory before deployment, and OCS concentrations in the chamber were found to be statistically indistinguishable from incoming ambient concentrations. The stainless-steel chamber top opened and closed automatically on a timer. Gas was drawn through the chamber via a pump downstream of the analyzer, and the 3 L min−1 flow rate was confirmed with a mass flow meter. When the chamber was open, ambient near-surface air was observed. When the chamber was closed, trace gas concentrations reached a stable state for at least 2 min during the 10 min incubation time. The difference between the ambient concentration and the stable closed-chamber concentration were used to calculate the surface fluxes of OCS and CO2.
where Mc is the measured flow rate into the chamber (converted from L min−1 to mol−1 using the ideal gas law), ΔX is the difference between mixing ratios of OCS or CO2 in ambient air and the chamber, and A is the surface area of the chamber. The minimum flux detectable with this method was 1.2 pmol m−2 s−1 uptake or production.
Care was taken to select sites characteristic of the surface, which was generally springy and covered in a mat of mosses and lichen. Surface flux observations were made at site 1 from 6 to 16 July, site 2 from 13 August to 7 October, and site 3 from 6 November to 2 December 2015. The first site was visually similar to the subsequent two sites at the surface, though the chamber base of the first site was installed into the moss layer and a barely decomposed fallen tree. When a soil sample was attempted to be extracted from the footprint of the chamber base, several liters of intact wood litter were removed. The influence of the developed soil on site 1 is therefore considered minimal. Site 2 was selected nearby and observations were made until a dominant tree fell on the soil chamber. The chamber was repaired and re-installed a month later at site 3, and observations continued without incident until the chamber was removed in advance of the soil freezing.
3.1 Ecosystem fluxes
The composite diurnal cycles for CO2, water vapor, and OCS and fluxes are shown (Fig. 2a–d). The total ecosystem flux of OCS (FOCS; Fig. 2d) follows a pronounced diurnal cycle that peaks at midday. The vertical profile of mixing ratios measured throughout the canopy is also shown (Fig. 2b). OCS mixing ratios are highest at the canopy top and lowest near the forest floor, but mixing ratios increase from the early morning to midafternoon. Together these processes are indicative of ecosystem uptake and downward entrainment of boundary layer air (Rastogi et al., 2018a). The shape of the FOCS curve is very similar to those of net and gross carbon fluxes (Fig. 2b–c), although FOCS was consistently negative during daylight hours. Leaf relative uptake, a ratio of FOCS : GPP normalized by the mean mixing ratios of OCS : CO2, showed a strong light dependence (Fig. 2e). High-light, midday values ranged between 3–4, which is higher than those observed in other forest systems (Kooijmans et al., 2017; Wehr et al., 2017) but well within the spread of values obtained in a recent meta-analyses of OCS studies for vegetated ecosystems (Whelan et al., 2018). The diurnal cycle was found to be asymmetric, with peak values observed in the early morning, when stomatal conductance is likely to be high (Winner et al., 2004), but GPP is limited by low light. It is important to note that LRU is likely influenced by large amounts of epiphyte and understory vegetation, which assimilate OCS even at times when ecosystem CO2 uptake is low or zero. Epiphytic assimilation of OCS is highly influenced by moisture content (Gimeno et al., 2017) and is typically higher through the night and in the early mornings at this site (Rastogi et al., 2018). Moreover, in tall old-growth forests, leaf area is vertically distributed over a much larger part of the canopy compared to other forests (Parker et al., 2004). While leaves at the canopy top exercise tight stomatal control to limit water loss and minimize hydraulic failure (Woodruff et al., 2007), leaves lower down in the canopy, including those of understory vegetation, likely impose less stomatal control of transpiration (Winner et al., 2004). Lower-canopy leaves may therefore continue to disproportionately assimilate OCS, even under low rates of carbon assimilation (as CO2 uptake is additionally light limited).

Figure 2Diurnal cycle of measured H2O flux (blue curve) and VPD estimated from air and leaf temperatures (red and yellow curves, respectively) (a); diurnal cycles of OCS mixing ratio profiles measured along the canopy (left axis) and mean PAR (right axis) (b); inferred storage flux of CO2 (blue curve), measured turbulent flux of CO2 (NEE; red curve), and estimated flux of GPP (yellow curve, plotted as a negative quantity to show uptake) are shown in (c); the diurnal cycle of change in storage flux of OCS (SOCS; blue curve), the estimated flux of OCS using flux-gradient similarity (FOCS-FG; red curve), and the sum of the two fluxes (FOCS; yellow curve) (d); the mean diurnal cycle of leaf relative uptake estimated according to Eq. (4) (e) colored according to mean PAR. Shaded regions in (a–d) and vertical bars in (e) represent 1 standard error.
3.2 Daily and seasonal dynamics
Daytime fluxes of OCS (estimated as fluxes when PAR (photosynthetically active radiation) was higher than 100 µmol m−2 s−1) were correlated to independent estimates of GPP (Fig. 3a), and the uptake of both OCS and CO2 reduced as soil moisture declined. Variability in the relationship between fluxes of OCS and CO2 and soil moisture was related to VPD, which fluctuated as a response to changing cloud cover (discussed later in Sect. 3.4).
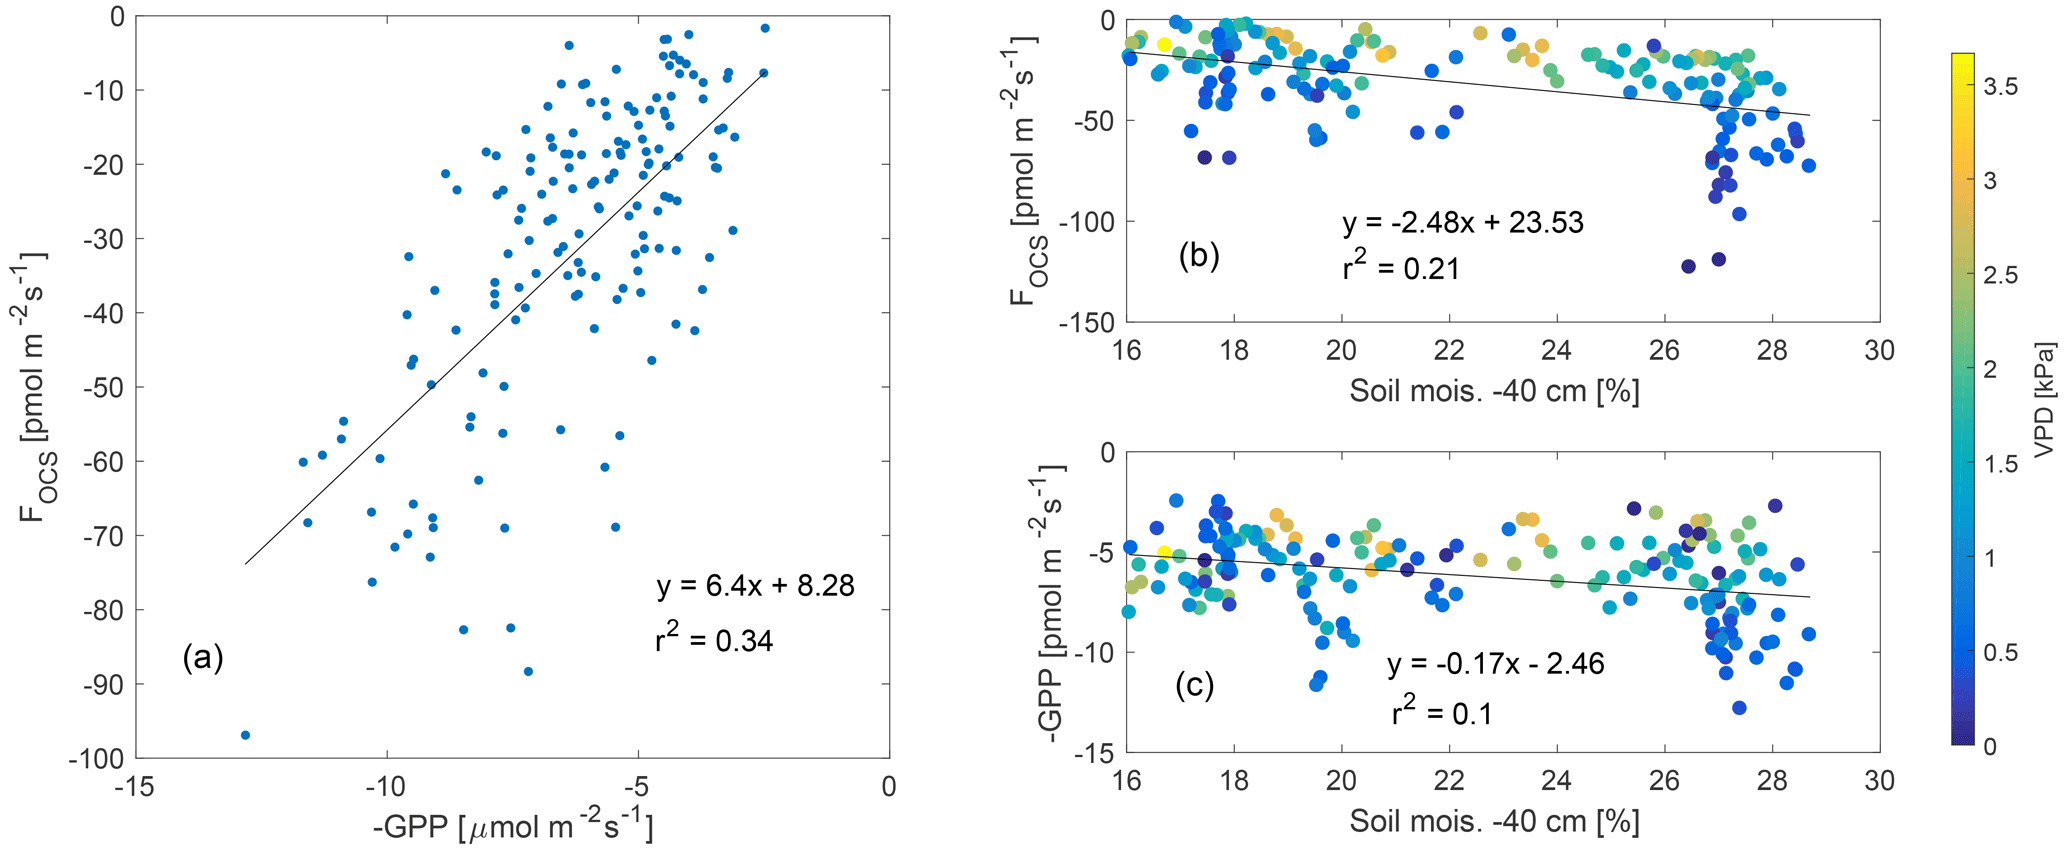
Figure 3FOCS was linearly correlated to GPP (plotted as a negative quantity to show ecosystem uptake a), while both FOCS and GPP reduced as a function of decreasing soil moisture (b–c). Data presented here are midday means; data in (b–c) are colored according to VPD.
Ecosystem uptake of OCS and CO2 (as well as GPP) was highest in April (Fig. 4a) and declined as the soil drought progressed (Fig. 4f). The mean monthly maximum OCS flux was estimated as pmol m−2 s−1, while daily mean maximum GPP over this period was estimated as 10±1 µmol m−2 s−1 (plotted as a negative quantity in Fig. 4b to show ecosystem uptake). While the steepest declines in FOCS, NEE (net ecosystem exchange of CO2) and GPP happened between the months of May and June, FOCS continued to decline through the rest of the summer, with a minimum in August, and remained low in September and October. CO2 fluxes flattened between June and September, before declining again in October. While the uptake of OCS and CO2 followed similar patterns, the H2O flux remained high until midsummer (Fig. 4c) and decreased in August, presumably due to a combination of high VPD (Fig. 4d) and declining soil moisture (Fig. 4f), as plants exercised greater control over stomata. This can be clearly seen in the seasonal cycle of canopy conductance (Gc; Fig. 4e). Mean monthly Gc was highest in the months of April and May and then declined in response to increasing VPD and decreasing soil moisture, before increasing again slightly in September and October following soil recharge and decreased VPD due to precipitation events. In October, soil water recharge, several rain-free days (Fig. 1), and lower VPD (Fig. 4d) do not result in increased gas exchange, likely due to the downregulation of photosynthesis (Eastman and Camm, 1995), induced by photo-protective changes in the xanthophyll cycle (Adams and Demmig-Adams, 1994).
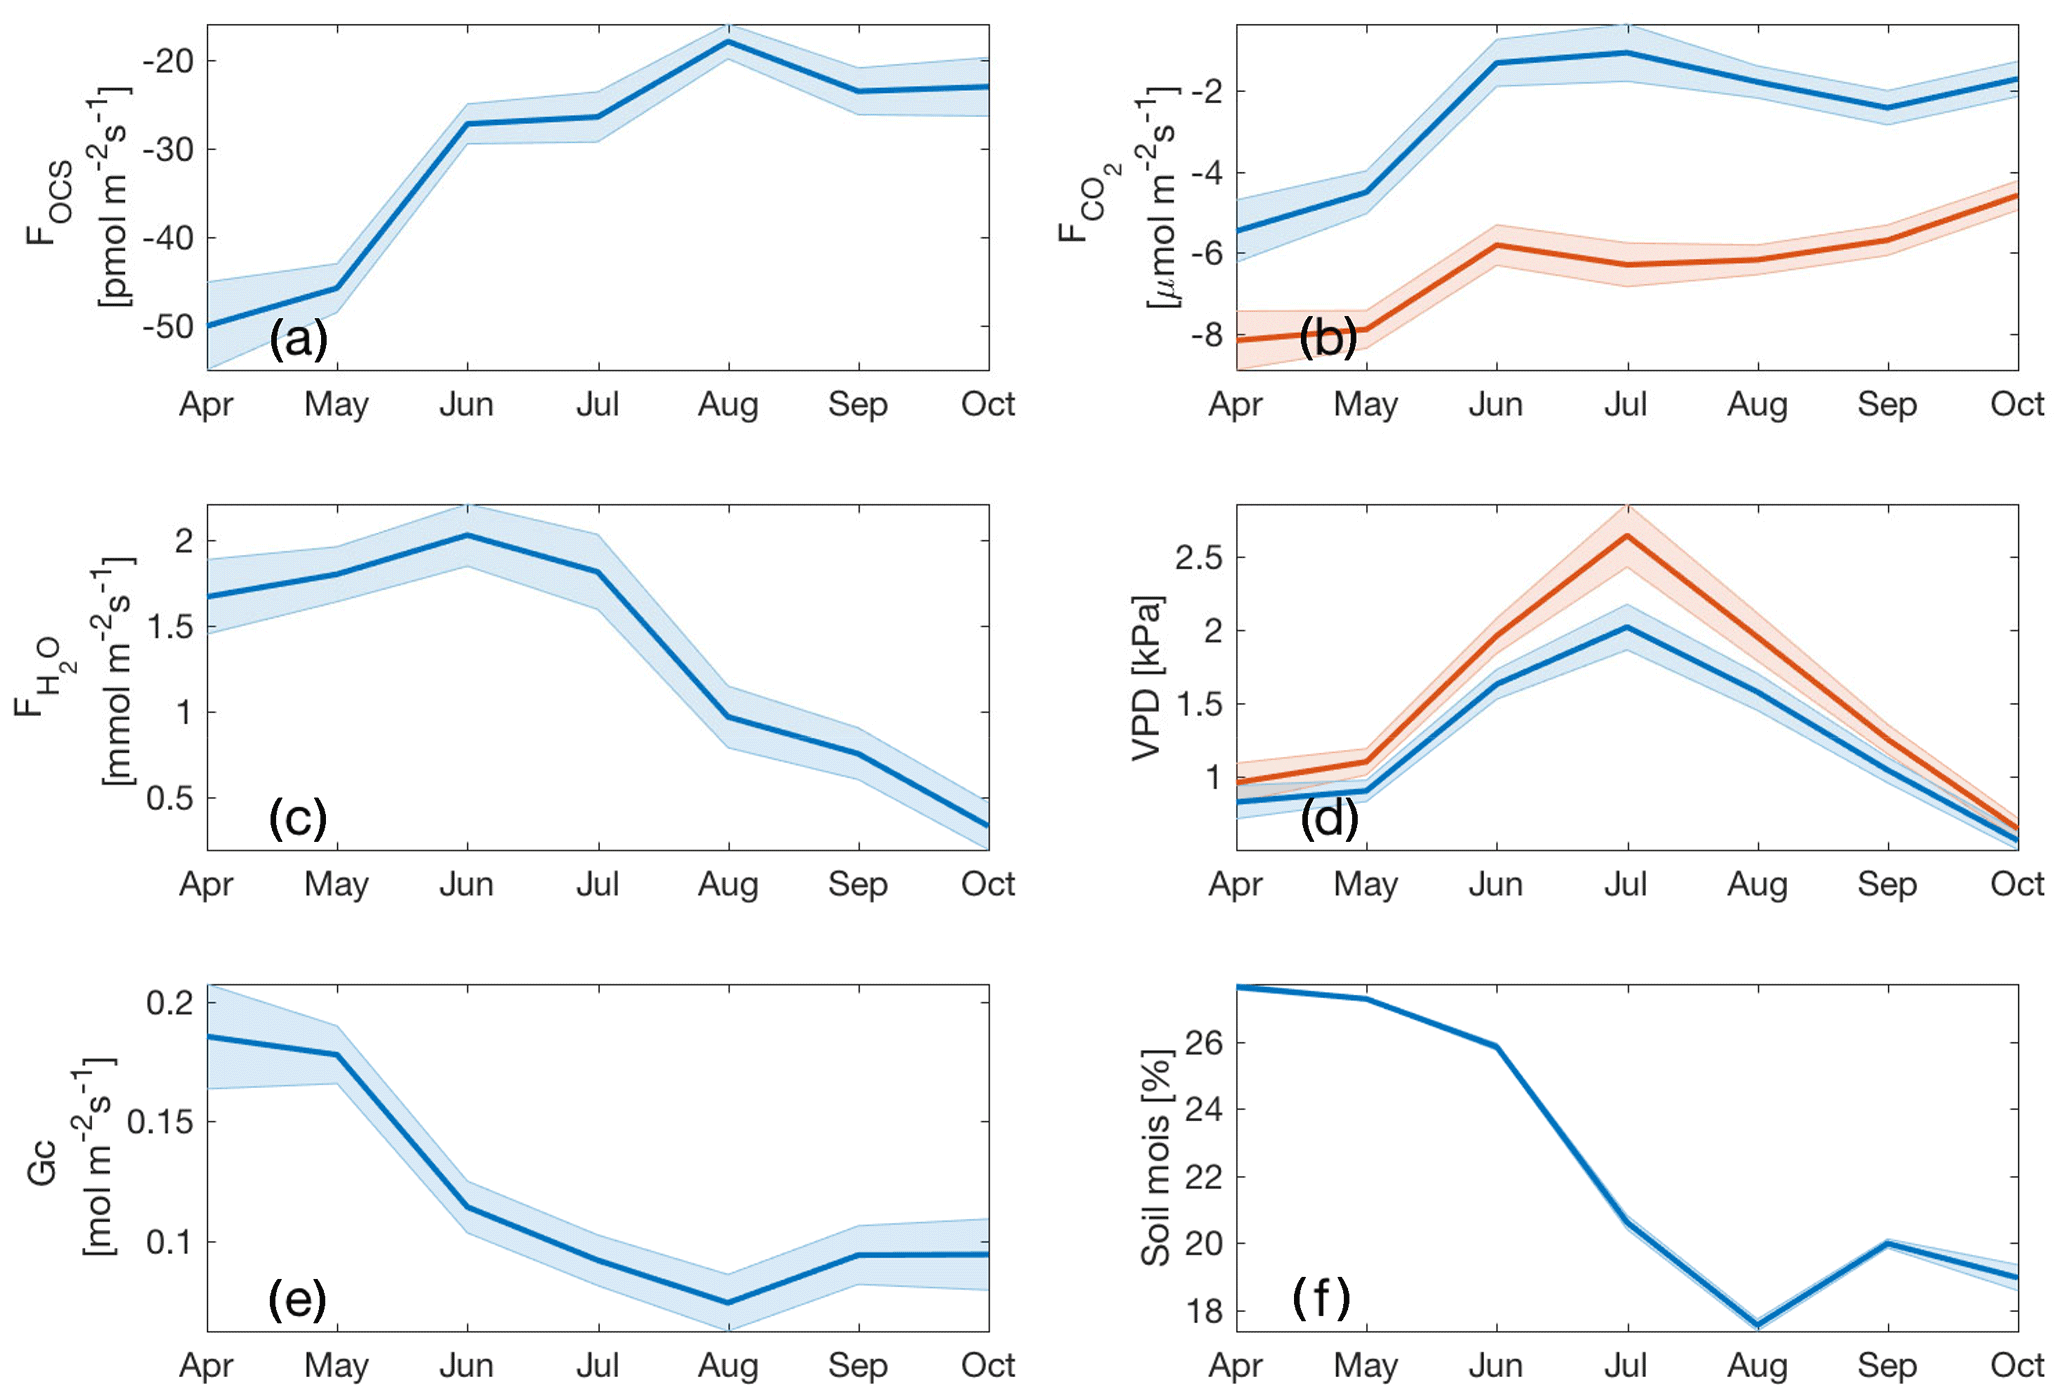
Figure 4Monthly means for daytime FOCS (a); NEE and GPP (blue and red curves; b); water vapor flux (c); VPDa and VPDl (blue and red curves, respectively; d); canopy conductance (Gc; e); and soil moisture at −40 cm depth (f). Shaded regions indicate standard error.
3.3 Surface fluxes
Forest floor OCS fluxes were observed from three sites in series and within 1 m of each other. Site 1 had approximately twice the OCS uptake compared to the subsequent two sites and had a substantial layer of intact woody debris under the chamber footprint. Sites 2 and 3 had OCS fluxes similar to previous surface fluxes reported for forests (Whelan et al., 2018). For all sites, there was no clear diurnal pattern. For site 2, uptake immediately following chamber installation was higher (∼ 6 pmol m−2 s−1) than fluxes later on (all <6 pmol m−2 s−1) when temperatures were lower (Fig. 5). Site 3 did not have high uptake after chamber installation and had consistent fluxes between the detection limit and −6.2 pmol m−2 s−1 for the first few weeks. When ambient air temperatures dropped below freezing, uptake remained unchanged, except for the largest uptake observed (6 to 12 pmol m−2 s−1) during two events when average air temperature fluctuated from a cooling to warming trend. Soil temperature never dropped below freezing during the experiment and was generally colder over time. We did not observe any OCS emissions from the chamber-based measurements, consistent with recent studies that find that cooler, moist (Maseyk et al., 2014; Sun et al., 2016; Whelan et al., 2016), and radiation-limited (Kitz et al., 2017) soils do not emit OCS.
Surface CO2 emissions exhibited a relationship with temperature, where highest production (∼ 25 µmol m−2 s−1) corresponded with temperatures ∼ 15 ∘C and maximum flux values decreased for warmer and colder temperatures. CO2 emissions had a diurnal pattern, with lowest emissions at night and maximum emissions in late morning to mid- afternoon. No obvious relationship emerges from CO2 emission and OCS uptake, though the high OCS uptake events in late November and early December have a linear relationship with CO2 emissions. For sites 2 and 3, the ratio of OCS emission to CO2 production, normalized by the concentration of OCS and CO2 in the closed chamber, was between −0.25 and −3.5 with a mean of −1. In contrast, the same ratio for site 1 varied from −5 to −19 with a mean of −10.

Figure 5Surface FOCS and from chamber measurements from sites 2 and 3. Site 1 was atypical (see Sect. 2.7), and therefore fluxes are not shown. Values for site 1 FOCS and were pmol m−2 s−1 and µmol m−2 s−1, respectively. Error bars indicate standard deviation.
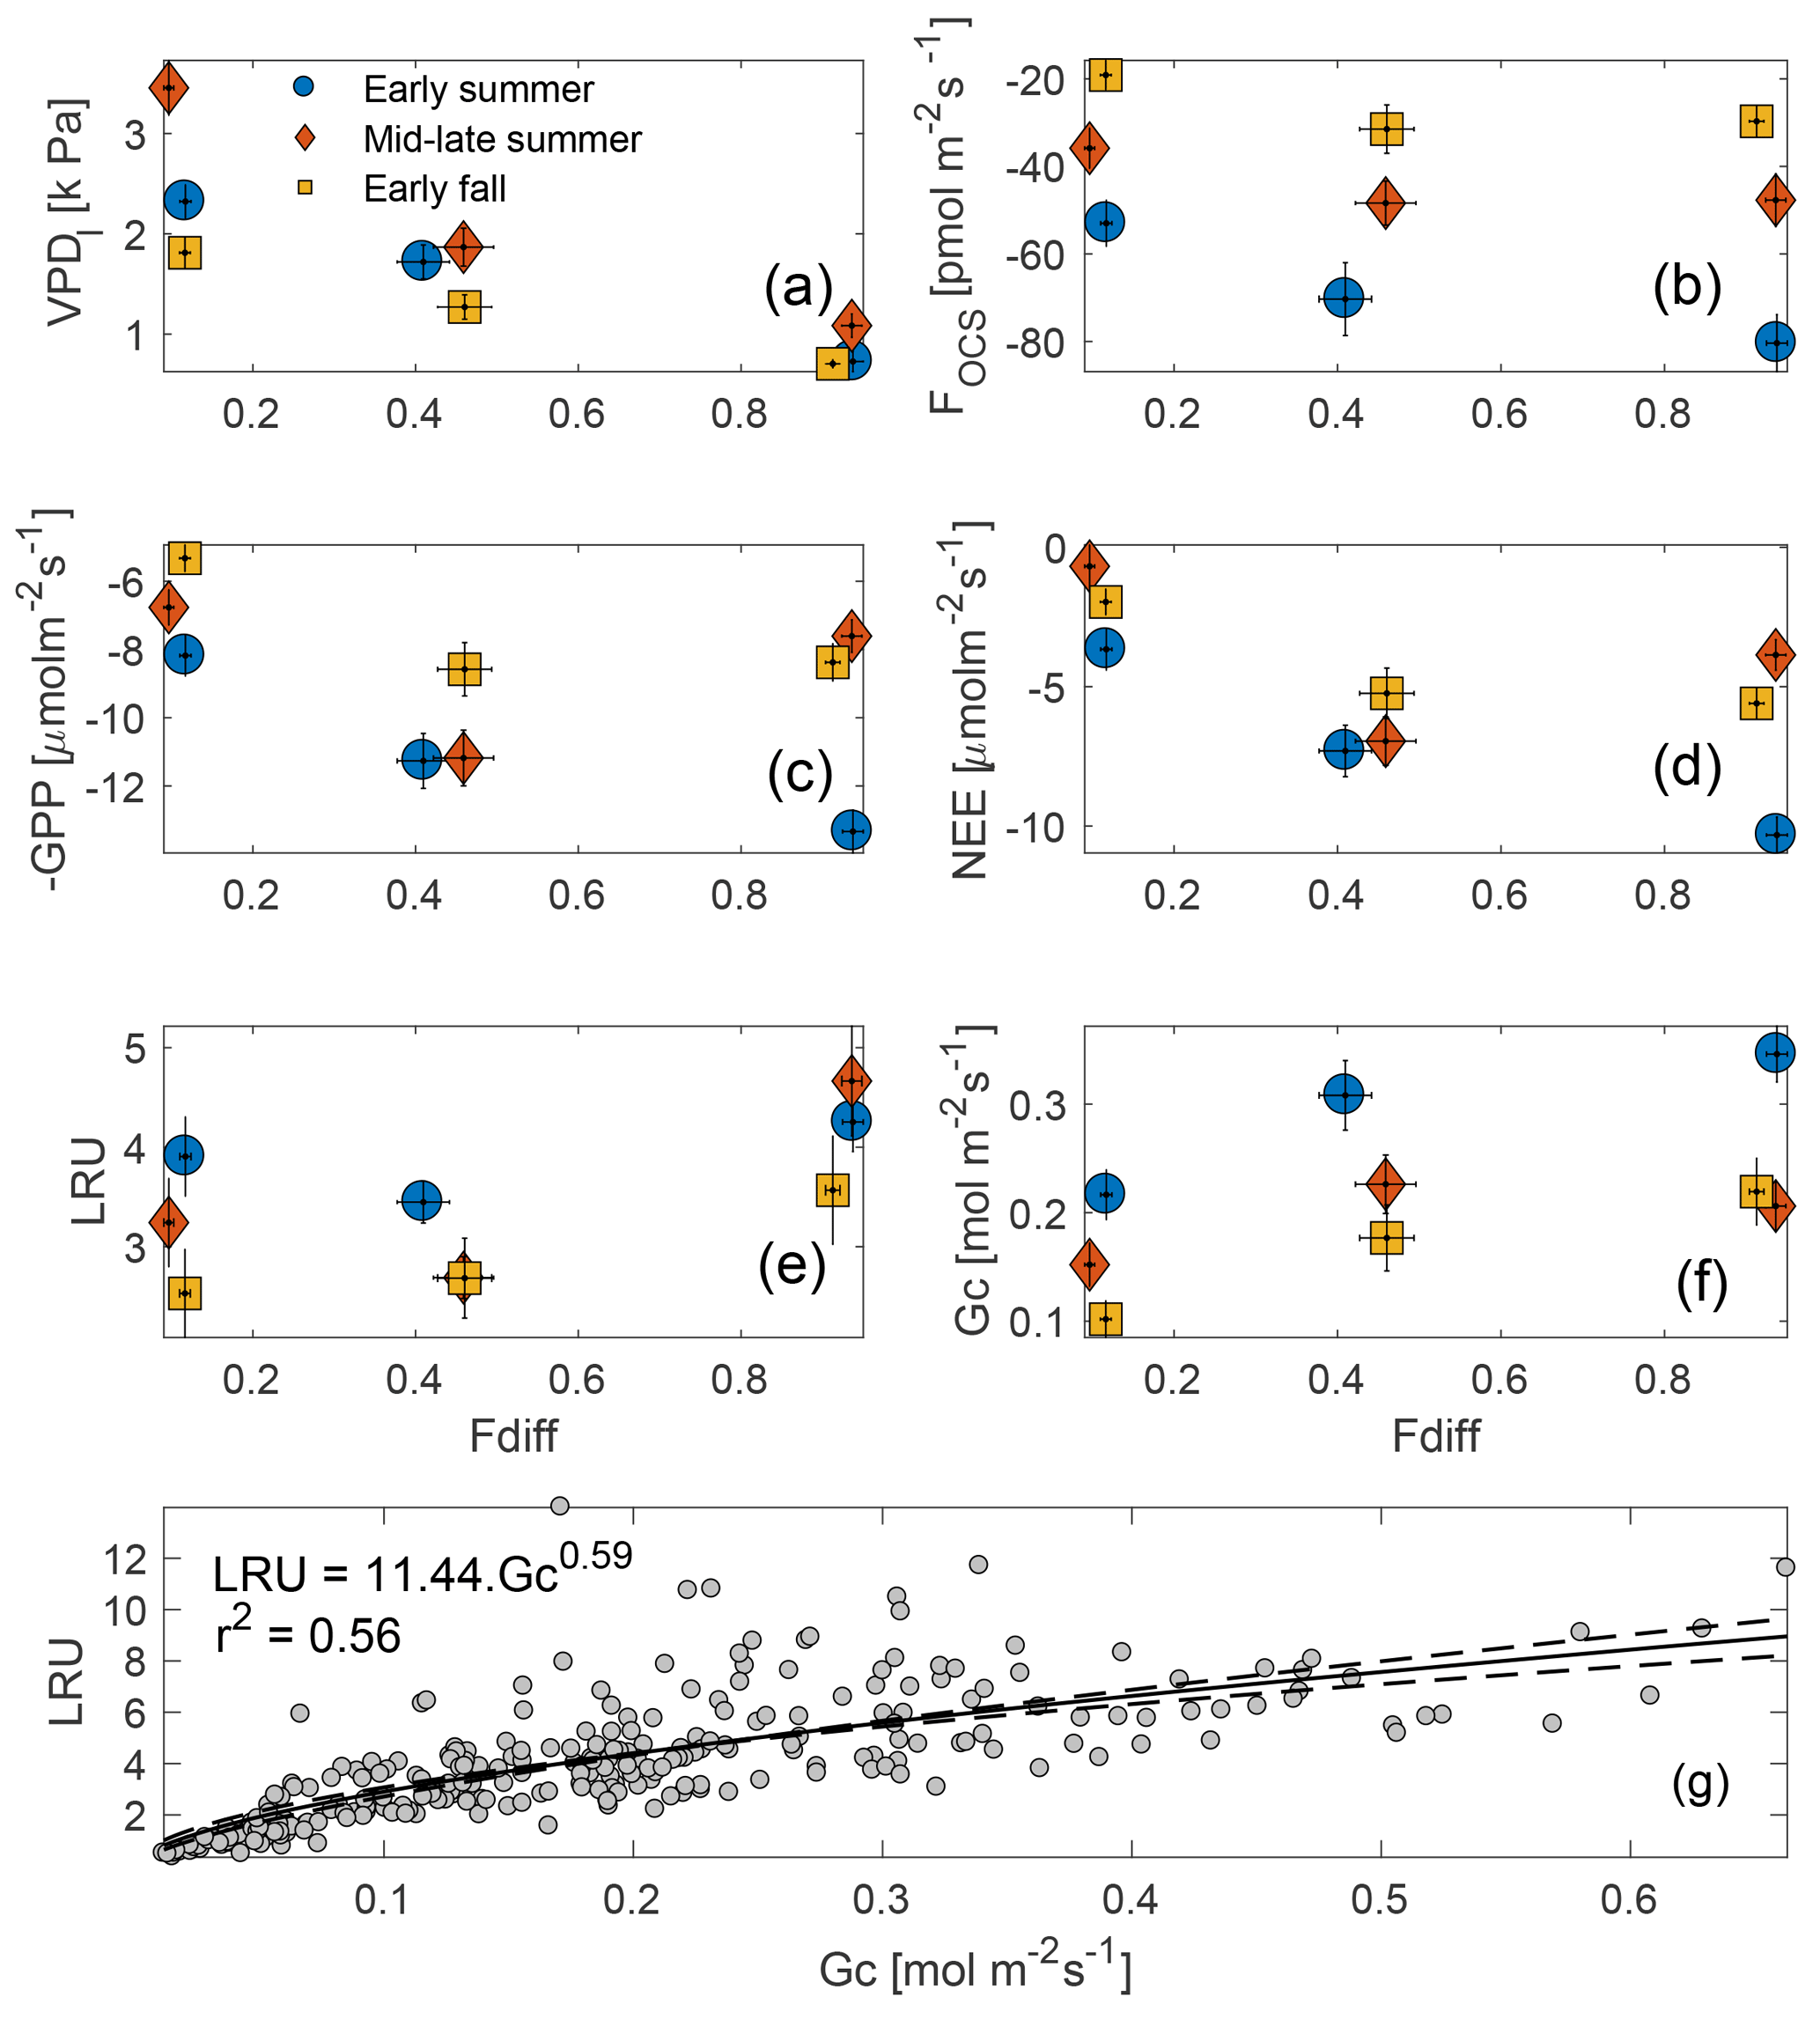
Figure 6Midday VPDl, FOCS, NEE, and GPP plotted against the fraction of diffuse downwelling shortwave radiation (a–d) for early summer, mid–late summer, and early fall of 2015 (these periods are defined in Sect. 3.4). High values on the x axis indicate completely overcast or cloudy conditions, whereas as low values indicated clear skies. LRU increases with increasing fdiff during each period, but the increase is most pronounced in the early summer (e). Gc increases from clear to partly cloudy conditions across the three periods and plateaus during overcast sky conditions (f). Vertical bars indicate 1 SE. Across the three periods, LRU increased with Gc and leveled off at Gc values greater than ∼ 0.5 mol m−2 s−1 (g).
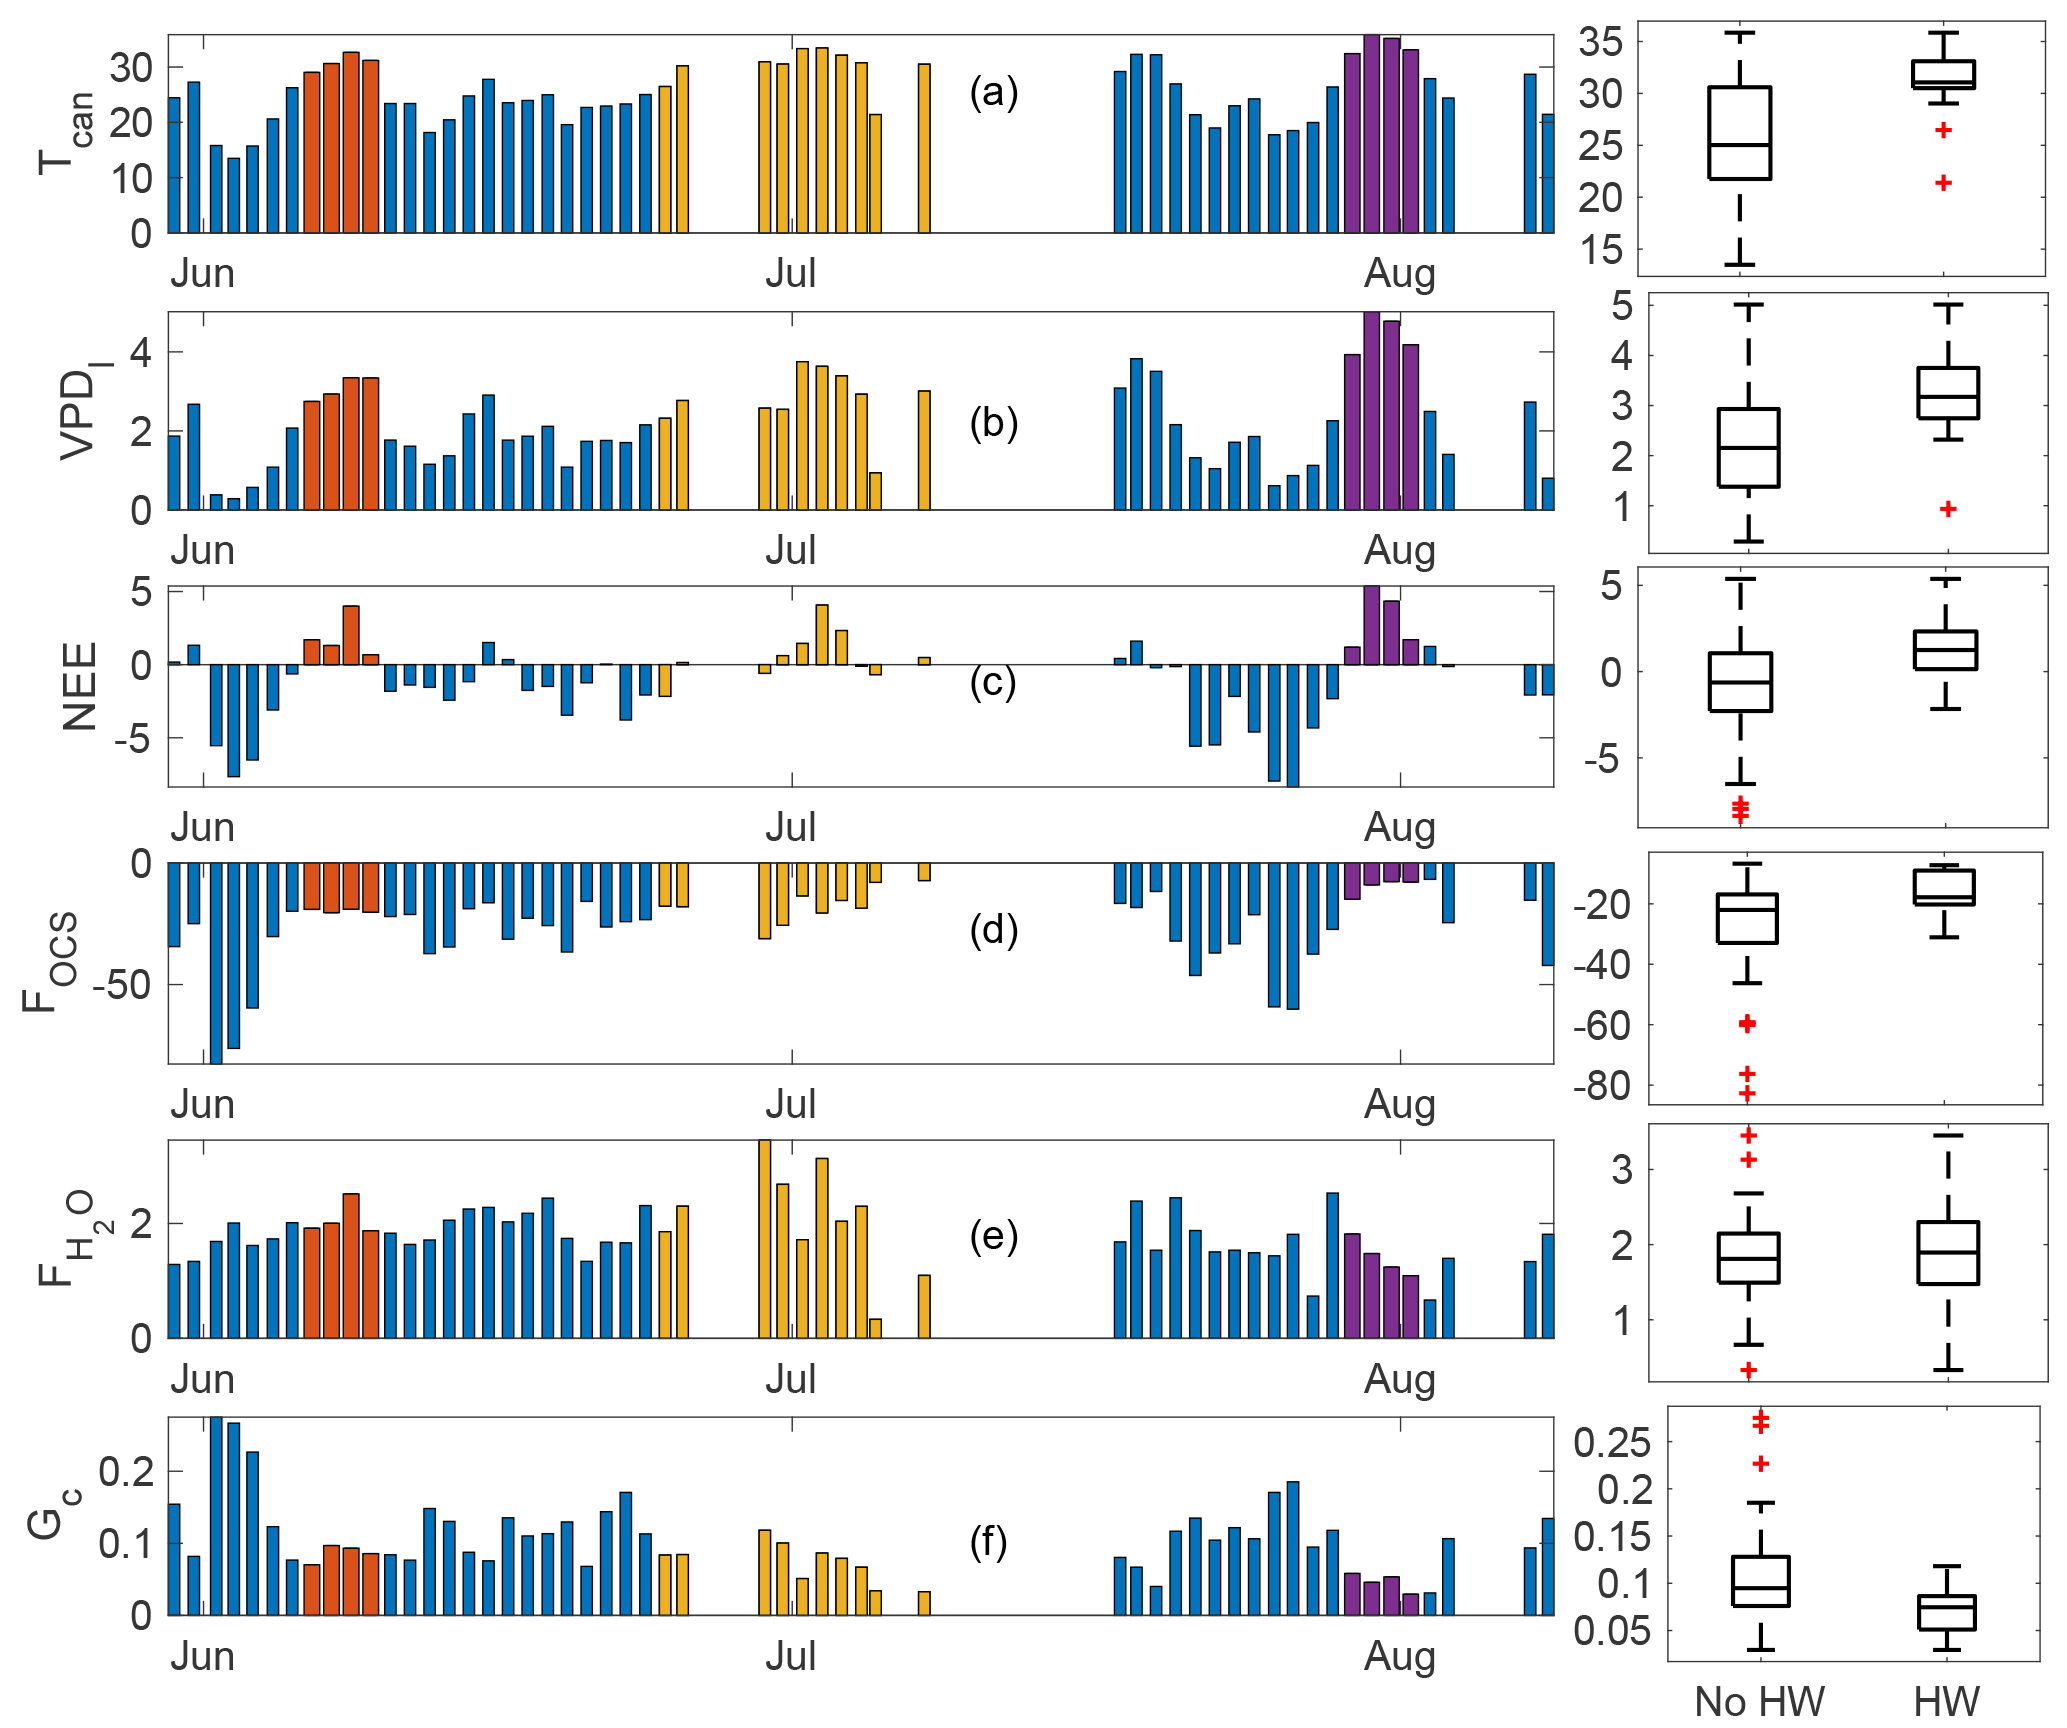
Figure 7Daytime means (defined as periods when PAR >100 µmol m−2 s−1) for three heat wave periods (plotted as red, yellow, and purple, while the overall time series is shown in blue). Variables displayed are canopy temperature (∘C; a), VPD-leaf (b), FOCS (c), NEE (d), water vapor flux (e), and canopy conductance (Gc, f). Units for each panel are the same as specified in previous figures.
3.4 Sensitivity to diffuse light
Midday fluxes of OCS and CO2 were found to be sensitive to changes in the fraction of diffuse : total incoming shortwave radiation (fdiff; Fig. 6b–c). For these analyses, data were separated into three periods corresponding to early summer (day of year, DOY 109–180), mid–late summer (DOY 180–240), and early fall (DOY 240–297) and were binned into three categories: clear-sky conditions, partly cloudy, and overcast (defined in Sect. 2.7). Midday VPD was highest under clear-sky conditions and lowest under overcast skies but was most different across the three periods during clear skies (Fig. 6a). Consequently, OCS and CO2 uptake was highest (most negative fluxes) under overcast conditions during the early summer, and generally declined as fdiff decreased across all time periods (Fig. 6b–d). Across the three periods, the rate of decrease was much higher as fdiff changed from partially cloudy to clear. During the mid–late summer, however (red diamonds in Fig. 6a–f), the diffuse light effect resulted in GPP and NEE being almost as high as during the early summer. FOCS was also highest under partially cloudy skies during this time and only showed a very weak decline under completely overcast conditions. Overall, the behavior of OCS and CO2 fluxes was similar during the later time periods. LRU (calculated according to Eq. 5) was lowest under partly clear skies and highest under overcast conditions. This is because under highly diffuse conditions, carbon uptake is additionally limited by light, whereas FOCS is not (Wehr et al., 2017; Maseyk et al., 2014). The shape of the LRU curves can additionally be explained by examining canopy conductance (Gc; Fig. 6f), which was also higher under overcast skies. LRU increased with Gc across all three periods (Fig. 6g) and appeared to be constant for Gc greater than ∼ 400 mmol m−2 s−1.
The diffuse light enhancement of stomatal and canopy conductance is well documented across a range of forest ecosystems (Alton et al., 2007; Cheng et al., 2015; Hollinger et al., 2017; Urban et al., 2007; Wharton et al., 2012). Lower VPD (Fig. 6a) and light levels allow plants to keep stomata open at midday and continue fixing CO2. Lower VPD reduces transpirational losses, and the lack of VPD-induced partial stomatal closure reduces the resistance to CO2 diffusion into the leaf. Correspondingly, the less directional nature of diffuse solar radiation allows greater penetration into the canopy, thus increasing photosynthesis across the entire canopy, even as a reduction in canopy top leaf photosynthesis is observed due to a reduction in total radiation. In a multiyear analysis at Wind River, Wharton et al. (2012) found that cloudy and partly cloudy sky conditions during the peak-growing season lead to an increase in CO2 uptake. During our study, Gc was generally higher in the early growing season but increased as sky conditions changed from clear skies to overcast. This increase was similar across the three time periods, even as the response of OCS and CO2 fluxes was different across these periods. This indicates that declining soil moisture (Fig. 3b–c) potentially limits gas exchange as the summer progresses, even as canopy conductance can be reasonably high under overcast skies. It is important to note that in the absence of concurrent leaf and root water potential measurements, it is not possible to attribute reduction in gas exchange to declining soil moisture.
3.5 Response to heat waves
The year 2015 was the warmest over large parts of the Pacific Northwest since records began in the 1930s (Dalton et al., 2017). We observed three distinct heat waves during the 2015 summer. These were in early June (DOY 157–160), end of June–early July (DOY 175–188), and late July–early August (DOY 210–213). The three heat waves are shown as red, yellow, and dark purple bars in Fig. 7; the overall time series is shown in blue (daytime means are plotted for all variables, where daytime is defined as PAR exceeding 100 µmol m−2 s−1). Additionally, box plots for “non-heat-wave” and “heat wave” days are shown (labeled as “No HW” and “HW”, respectively). Midday temperatures exceeded 30 ∘C during these heat wave events, while VPD-leaf exceeded 3 kPa during the first heat wave and increased to a mean daily maximum of 5.1 kPa during the last event (Fig. 7b). The canopy was a net source of CO2 during all three events, while midday means for NEE were usually negative (implying CO2 sink) before and after the heat wave periods (Fig. 7c). During the first event, FOCS was similar to days immediately preceding it (Fig. 7d). The third event led to a reduction in FOCS, even though the canopy had received some rainfall in the preceding weeks (Fig. 1c). Overall, mean daytime OCS uptake decreased from −27 (pmol m−2 s−1) on non-heat-wave days (daytime means presented as blue bars in Fig. 7) to −16 (pmol m−2 s−1) during heat wave days (daytime means from data presented as red, yellow, and purple bars in Fig. 7). Water vapor fluxes (Fig. 7e) increased during the first heat wave, compared to days immediately prior. The increased water vapor flux is likely to form an increase in transpiration under high VPDl (red bars in Fig. 7b), which ensures a steady transpirational flux (purple bars in Fig. 7e). was not significantly different between heat wave and non-heat-wave days (box plots in Fig. 7e) even as VPDl was significantly higher during these events, leading to a suppression in canopy conductance (Fig. 7f).
Over hourly, daily, and seasonal timescales, estimates of FOCS generally tracked fluctuations in GPP, implying stomatal control of carbon, water, and OCS fluxes at the site. We used continuous in situ measurements of OCS mixing ratios, collocated measurements of water vapor fluxes and air and canopy temperatures to calculate OCS uptake. We found the forest to be a large sink for OCS, with sink strength peaking during daylight hours. The mean LRU was ∼ 4 and varied in response to changing light conditions and canopy conductance. These LRUs are larger than observed from other ecosystem-scale studies but well within the range of reported values (Whelan et al., 2018; Sandoval-Soto et al., 2005). The forest surface was found to be a soil-moisture-dependent sink of OCS. Ecosystem fluxes of OCS and CO2 were found to be strongly sensitive to the ratio of diffuse : direct radiation reaching the top of the canopy. Uptake of both OCS and CO2 increased as sky conditions changed from clear to partly cloudy. A much smaller increase in uptake was observed as sky conditions changed from partly cloudy to overcast, except during the early summer, when soil moisture was not limiting. This change was mediated by the sensitivity of stomata to changing cloudiness and soil moisture, as estimated from canopy conductance. Finally, we examined the response of OCS, CO2, and H2O fluxes on heat waves, and found that sequential heat waves lead to suppression in the stomatal gas exchange of OCS and CO2 fluxes, but not in the flux of water vapor.
Our results support the growing body of work that suggests ecosystem-scale OCS uptake is controlled by stomatal dynamics. While moist old-growth forests in the Pacific Northwest of the US do not represent a very large fraction of the global terrestrial surface area, results from this study are likely relevant for other old-growth forests, particularly high-LAI and very wet forests with extensive epiphyte cover, which are widespread in the humid tropics.
Data collected and used in this study can be accessed at https://doi.org/10.5281/zenodo.1516332 (Rastogi et al., 2018).
Funding was obtained by CS. Data collection was carried out by BR, MB, DN, CS, and MW. The methodology was developed by BR, CS, FM, and MB. Formal analyses were carried out BR, SW, and MW. All authors contributed to writing, reviewing and editing the paper.
This work was partly funded by NASA SBIR Phase II award NNX12CD21P to LGR, Inc. (“Ultrasensitive Analyzer for Realtime, In-Situ Airborne and Terrestrial Measurements of OCS, CO2, and CO.”), and an LGR instrument was used to collect the data reported in the study.
We would like to
thank the US Forest Service and the University of Washington for letting us
use the research facility at Wind River. In particular, we wish to sincerely
acknowledge Ken Bible and Matt Schroeder for their help with setting up the
experiment as well as maintenance throughout the measurement campaign.
Edited by: David Bowling
Reviewed by: two anonymous referees
Adams, W. W. and Demmig-Adams, B.: Carotenoid composition and down regulation of photosystem II in three conifer species during the winter, Physiol. Plant., 92, 451–458, https://doi.org/10.1111/j.1399-3054.1994.tb08835.x, 1994.
Alton, P. B., North, P. R., and Los, S. O.: The impact of diffuse sunlight on canopy light-use efficiency, gross photosynthetic product and net ecosystem exchange in three forest biomes, Glob. Chang. Biol., 13, 776–787, https://doi.org/10.1111/j.1365-2486.2007.01316.x, 2007.
Asaf, D., Rotenberg, E., Tatarinov, F., Dicken, U., Montzka, S. A., and Yakir, D.: Ecosystem photosynthesis inferred from measurements of carbonyl sulphide flux, Nat. Geosci., 6, 186–190, https://doi.org/10.1038/ngeo1730, 2013.
Belviso, S., Reiter, I. M., Loubet, B., Gros, V., Lathière, J., Montagne, D., Delmotte, M., Ramonet, M., Kalogridis, C., Lebegue, B., Bonnaire, N., Kazan, V., Gauquelin, T., Fernandez, C., and Genty, B.: A top-down approach of surface carbonyl sulfide exchange by a Mediterranean oak forest ecosystem in southern France, Atmos. Chem. Phys., 16, 14909–14923, https://doi.org/10.5194/acp-16-14909-2016, 2016.
Berkelhammer, M., Asaf, D., Still, C., Montzka, S., Noone, D., Gupta, M., Provencal, R., Chen, H., and Yakir, D.: Constraining surface carbon fluxes using in situ measurements of carbonyl sulfide and carbon dioxide, Global Biogeochem. Cy., 28, 161–179, https://doi.org/10.1002/2013GB004644, 2014.
Berkelhammer, M., Steen-Larsen, H. C., Cosgrove, A., Peters, A. J., Johnson, R., Hayden, M., and Montzka, S. A.: Radiation and atmospheric circulation controls on carbonyl sulfide concentrations in themarine boundary layer, J. Geophys. Res., 121, 13113–13128, https://doi.org/10.1002/2016JD025437, 2016.
Berry, J., Wolf, A., Campbell, J. E., Baker, I., Blake, N., Blake, D., Denning, A. S., Kawa, S. R., Montzka, S. A., Seibt, U., Stimler, K., Yakir, D., and Zhu, Z.: A coupled model of the global cycles of carbonyl sulfide and CO2?: A possible new window on the carbon cycle, J. Geophys. Res.-Biogeo., 118, 842–852, https://doi.org/10.1002/jgrg.20068, 2013.
Billesbach, D. P., Berry, J. A., Seibt, U., Maseyk, K., Torn, M. S., Fischer, M. L., Abu-Naser, M., and Campbell, J. E.: Growing season eddy covariance measurements of carbonyl sulfide and CO2 fluxes: COS and CO2 relationships in Southern Great Plains winter wheat, Agric. For. Meteorol., 184, 48–55, https://doi.org/10.1016/j.agrformet.2013.06.007, 2014.
Bloem, E., Haneklaus, S., Kesselmeier, J., and Schnug, E.: Sulfur fertilization and fungal infections affect the exchange of H2S and COS from agricultural crops, J. Agric. Food Chem., 60, 7588–7596, https://doi.org/10.1021/jf301912h, 2012.
Blonquist, J. M., Montzka, S. A., Munger, J. W., Yakir, D., Desai, A. R., Dragoni, D., Griffis, T. J., Monson, R. K., Scott, R. L., and Bowling, D. R.: The potential of carbonyl sulfide as a proxy for gross primary production at flux tower sites, J. Geophys. Res.-Biogeo., 116, 1–18, https://doi.org/10.1029/2011JG001723, 2011.
Campbell, J. E., Berry, J., Seibt, U., Smith, S., and Nature, S. M.: Large historical growth in global terrestrial gross primary production, Nature, 544, 84–87, 2017a.
Campbell, J. E., Whelan, M. E., Berry, J. A., Hilton, T. W., Zumkehr, A., Stinecipher, J., Lu, Y., Kornfeld, A., Seibt, U., Dawson, T. E., Montzka, S. A., Baker, I. T., Kulkarni, S., Wang, Y., Herndon, S. C., Zahniser, M. S., Commane, R., and Loik, M. E.: Plant Uptake of Atmospheric Carbonyl Sulfide in Coast Redwood Forests, J. Geophys. Res.-Biogeo., 122, 3391–3404, https://doi.org/10.1002/2016JG003703, 2017b.
Cheng, S. J., Bohrer, G., Steiner, A. L., Hollinger, D. Y., Suyker, A., Phillips, R. P., and Nadelhoffer, K. J.: Variations in the influence of diffuse light on gross primary productivity in temperate ecosystems, Agric. Meteorol., 201, 98–110, https://doi.org/10.1016/j.agrformet.2014.11.002, 2015.
Commane, R., Meredith, L. K., Baker, I. T., Berry, J. A., Munger, J. W., Montzka, S. A., Templer, P. H., Juice, S. M., Zahniser, M. S., and Wofsy, S. C.: Seasonal fluxes of carbonyl sulfide in a midlatitude forest, P. Natl. Acad. Sci. USA, 112, 14162–14167, https://doi.org/10.1073/pnas.1504131112, 2015.
Dalton, M. M., Dello, K. D., Hawkins, L., Mote, P. W., and Rupp, D. E.: The third Oregon climate assessment report, Oregon Clim. Chang. Res. Institute, Coll. Earth, Ocean Atmos. Sci. Oregon State Univ. Corvallis, OR, 2017.
de Araújo, A. C., Dolman, A. J., Waterloo, M. J., Gash, J. H. C., Kruijt, B., Zanchi, F. B., de Lange, J. M. E., Stoevelaar, R., Manzi, A. O., Nobre, A. D., Lootens, R. N., and Backer, J.: The spatial variability of CO2 storage and the interpretation of eddy covariance fluxes in central Amazonia, Agric. For. Meteorol., 150, 226–237, https://doi.org/10.1016/j.agrformet.2009.11.005, 2010.
Eastman, P. A. K. and Camm, E. L.: Regulation of photosynthesis in interior spruce during water stress: changes in gas exchange and chlorophyll fluorescence, Tree Physiol., 15, 229–235, 1995.
Falk, M., Wharton, S., Schroeder, M., Ustin, S. L., and Paw U, K. T.: Flux partitioning in an old-growth forest: seasonal and interannual dynamics, Tree Physiol., 28, 509–520, https://doi.org/10.1093/treephys/28.4.509, 2008.
Gimeno, T. E., Ogée, J., Royles, J., Gibon, Y., West, J. B., Burlett, R., Jones, S. P., Sauze, J., Wohl, S., Benard, C., Genty, B., and Wingate, L.: Bryophyte gas-exchange dynamics along varying hydration status reveal a significant carbonyl sulphide (COS) sink in the dark and COS source in the light, New Phytol., 215, 965–976, https://doi.org/10.1111/nph.14584, 2017.
Hilton, T., Whelan, M., Zumkehr, A., Kulkarni, S., Berry, J. A., Baker, I. T., Montzka, S. A., Sweeney, C., Miller, B. R., and Campbell, J. E.: Peak growing season gross uptake of carbon in North America is largest in the Midwest USA, Nat. Clim. Change, 7, 450–454, 2017.
Hollinger, A. D. Y., Kelliher, F. M., Byers, J. N., Hunt, J. E., Mcseveny, T. M., Weir, L., Ecology, S., and Jan, N.: Carbon dioxide exchange between an undisturbed old-growth temperate forest and the atmosphere, Ecology, 75, 134–150, 2017.
Jocher, G., Marshall, J., Nilsson, M. B., Linder, S., De Simon, G., Hörnlund, T., Lundmark, T., Näsholm, T., Ottosson Löfvenius, M., Tarvainen, L., Wallin, G., and Peichl, M.: Impact of Canopy Decoupling and Subcanopy Advection on the Annual Carbon Balance of a Boreal Scots Pine Forest as Derived From Eddy Covariance, J. Geophys. Res.-Biogeo., 123, 303–325, https://doi.org/10.1002/2017JG003988, 2018.
Johnson, J. E., Bandy, A. R., Thornton, D. C., and Bates, T. S.: Measurements of atmospheric carbonyl sulfide during the NASA Chemical Instrumentation Test and Evaluation project: Implications for the global COS budget, J. Geophys. Res., 98, 23443, https://doi.org/10.1029/92JD01911, 1993.
Kettle, A. J., Kuhn, U., Von Hobe, M., Kesselmeier, J., and Andreae, M. O.: Global budget of atmospheric carbonyl sulfide: Temporal and spatial variations of the dominant sources and sinks, J. Geophys. Res.-Atmos., 107, 4658, https://doi.org/10.1029/2002JD002187, 2002.
Kim, Y., Still, C. J., Hanson, C. V., Kwon, H., Greer, B. T., and Law, B. E.: Canopy skin temperature variations in relation to climate, soil temperature, and carbon flux at a ponderosa pine forest in central Oregon, Agric. For. Meteorol., 226–227, 161–173, https://doi.org/10.1016/j.agrformet.2016.06.001, 2016.
Kitz, F., Gerdel, K., Hammerle, A., Laterza, T., Spielmann, F. M., and Wohlfahrt, G.: In situ soil COS exchange of a temperate mountain grassland under simulated drought, Oecologia, 183, 851–860, https://doi.org/10.1007/s00442-016-3805-0, 2017.
Kooijmans, L. M. J., Maseyk, K., Seibt, U., Sun, W., Vesala, T., Mammarella, I., Kolari, P., Aalto, J., Franchin, A., Vecchi, R., Valli, G., and Chen, H.: Canopy uptake dominates nighttime carbonyl sulfide fluxes in a boreal forest, Atmos. Chem. Phys., 17, 11453–11465, https://doi.org/10.5194/acp-17-11453-2017, 2017.
Launois, T., Peylin, P., Belviso, S., and Poulter, B.: A new model of the global biogeochemical cycle of carbonyl sulfide – Part 2: Use of carbonyl sulfide to constrain gross primary productivity in current vegetation models, Atmos. Chem. Phys., 15, 9285–9312, https://doi.org/10.5194/acp-15-9285-2015, 2015.
Maseyk, K., Berry, J. A., Billesbach, D., Campbell, J. E., Torn, M. S., Zahniser, M., and Seibt, U.: Sources and sinks of carbonyl sulfide in an agricultural field in the Southern Great Plains, P. Natl. Acad. Sci. USA, 111, 9064–9069, https://doi.org/10.1073/pnas.1319132111, 2014.
Montzka, S. A., Calvert, P., Hall, B. D., Elkins, J. W., Conway, T. J., Tans, P. P., and Sweeney, C.: On the global distribution, seasonality, and budget of atmospheric carbonyl sulfide (COS) and some similarities to CO2, J. Geophys. Res.-Atmos., 112, D09302, https://doi.org/10.1029/2006JD00766, 2007.
Nicolini, G., Aubinet, M., Feigenwinter, C., Heinesch, B., Lindroth, A., Mamadou, O., Moderow, U., Mölder, M., Montagnani, L., Rebmann, C., and Papale, D.: Impact of CO2 storage flux sampling uncertainty on net ecosystem exchange measured by eddy covariance, Agric. For. Meteorol., 248, 228–239, https://doi.org/10.1016/j.agrformet.2017.09.025, 2018.
Notholt, J., Kuang, Z., Rinsland, C. P., Toon, G. C., Rex, M., Jones, N., Albrecht, T., Deckelmann, H., Krieg, J., and Weinzierl, C.: Enhanced upper tropical tropospheric COS: Impact on the stratospheric aerosol layer, Science, 300, 307–310, doi:10.1126/science.1080320, 2003.
Parker, G. G., Harmon, M. E., Lefsky, M. A., Chen, J., Pelt, R. Van, Weis, S. B., Thomas, S. C., Winner, W. E., Shaw, D. C., and Frankling, J. F.: Three-dimensional Structure of an Old-growth Pseudotsuga-Tsuga Canopy and Its Implications for Radiation Balance, Microclimate, and Gas Exchange, Ecosystems, 7, 440–453, https://doi.org/10.1007/s10021-004-0136-5, 2004.
Paw U, K. T., Falk, M., Suchanek, T. H., Ustin, S. L., Chen, J., Park, Y.-S., Winner, W. E., Thomas, S. C., Hsiao, T. C., Shaw, R. H., King, T. S., Pyles, R. D., Schroeder, M., and Matista, A. A.: Carbon Dioxide Exchange between an Old-Growth Forest and the Atmosphere, Ecosystems, 7, 513–524, https://doi.org/10.1007/s10021-004-0141-8, 2004.
Protoschill-Krebs, G., Wilhelm, C., and Kesselmeier, J.: Consumption of carbonyl sulphide (COS) by higher plant carbonic anhydrase (CA), avilable at: https://www.sciencedirect.com/science/article/pii/135223109600026X (last access: 29 January 2018), Atmos. Environ., 30, 3151–3156, 1996.
Protoschill-Krebs, G. and Kesselmeier, J.: Enzymatic pathways for the consumption of carbonyl sulphide (COS) by higher plants, available at: http://onlinelibrary.wiley.com/doi/10.1111/j.1438-8677.1992.tb00288.x/full (last access: 29 January 2018), Bot. Acta, 105, 206–212, 1992.
Pyles, R. D., Paw U, K. T., and Falk, M.: Directional wind shear within an old-growth temperate rainforest: Observations and model results, Agric. For. Meteorol., 125, 19–31, https://doi.org/10.1016/j.agrformet.2004.03.007, 2004.
Rastogi, B., Berkelhammer, M., Wharton, S., Whelan, M. E., Itter, M. S., Leen, J. B., Gupta, M. X., Noone, D., and Still, C. J.: Large uptake of atmospheric OCS observed at a moist old growth forest: Controls and implications for carbon cycle applications, J. Geophys. Res.-Biogeo., https://doi.org/10.1029/2018JG004430, 2018.
Reichstein, M., Falge, E., Baldocchi, D., Papale, D., Aubinet, M., Berbigier, P., Bernhofer, C., Buchmann, N., Gilmanov, T., and Granier, A.: On the separation of net ecosystem exchange into assimilation and ecosystem respiration: review and improved algorithm, Glob. Chang. Biol., 11, 1424–1439, 2005.
Sandoval-Soto, L., Stanimirov, M., von Hobe, M., Schmitt, V., Valdes, J., Wild, A., and Kesselmeier, J.: Global uptake of carbonyl sulfide (COS) by terrestrial vegetation: Estimates corrected by deposition velocities normalized to the uptake of carbon dioxide (CO2), Biogeosciences, 2, 125–132, https://doi.org/10.5194/bg-2-125-2005, 2005.
Seibt, U., Kesselmeier, J., Sandoval-Soto, L., Kuhn, U., and Berry, J. A.: A kinetic analysis of leaf uptake of COS and its relation to transpiration, photosynthesis and carbon isotope fractionation, Biogeosciences, 7, 333–341, https://doi.org/10.5194/bg-7-333-2010, 2010.
Shaw, D., Franklin, J., Bible, K., Klopatek, J., Freeman, E., Greene, S., and Parker, G.: Ecological Setting of the Wind River Old-growth Forest, Ecosystems, 7, 427–439, https://doi.org/10.1007/s10021-004-0135-6, 2004.
Stimler, K., Nelson, D., and Yakir, D.: High precision measurements of atmospheric concentrations and plant exchange rates of carbonyl sulfide using mid-IR quantum cascade laser, Glob. Change Biol., 16, 2496–2503, https://doi.org/10.1111/j.1365-2486.2009.02088.x, 2010a.
Stimler, K., Montzka, S. A., Berry, J. A., Rudich, Y., and Yakir, D.: Relationships between carbonyl sulfide (COS) and CO2 during leaf gas exchange, New Phytol., 186, 869–878, https://doi.org/10.1111/j.1469-8137.2010.03218.x, 2010b.
Sun, W., Maseyk, K., Lett, C., and Seibt, U.: Litter dominates surface fluxes of carbonyl sulfide in a Californian oak woodland, J. Geophys. Res.-Biogeo., 121, 438–450, https://doi.org/10.1002/2015JG003149, 2016.
Urban, O., Janouš, D., Acosta, M., Czerný, R., Marková, I., Navrátil, M., Pavelka, M., Pokorný, R., Šprtová, M., Zhang, R., Špunda, V. R., Grace, J., and Marek, M. V.: Ecophysiological controls over the net ecosystem exchange of mountain spruce stand. Comparison of the response in direct vs. diffuse solar radiation, Glob. Chang. Biol., 13, 157–168, https://doi.org/10.1111/j.1365-2486.2006.01265.x, 2007.
Wehr, R., Commane, R., Munger, J. W., McManus, J. B., Nelson, D. D., Zahniser, M. S., Saleska, S. R., and Wofsy, S. C.: Dynamics of canopy stomatal conductance, transpiration, and evaporation in a temperate deciduous forest, validated by carbonyl sulfide uptake, Biogeosciences, 14, 389–401, https://doi.org/10.5194/bg-14-389-2017, 2017.
Wharton, S. and Falk, M.: Climate indices strongly influence old-growth forest carbon exchange, Environ. Res. Lett., 11, 1–11, https://doi.org/10.1088/1748-9326/11/4/044016, 2016.
Wharton, S., Falk, M., Bible, K., Schroeder, M., and Paw U, K. T.: Old-growth CO2 flux measurements reveal high sensitivity to climate anomalies across seasonal, annual and decadal time scales, Agric. For. Meteorol., 161, 1–14, https://doi.org/10.1016/j.agrformet.2012.03.007, 2012.
Whelan, M. E., Hilton, T. W., Berry, J. A., Berkelhammer, M., Desai, A. R., and Campbell, J. E.: Carbonyl sulfide exchange in soils for better estimates of ecosystem carbon uptake, Atmos. Chem. Phys., 16, 3711–3726, https://doi.org/10.5194/acp-16-3711-2016, 2016.
Whelan, M. E., Lennartz, S. T., Gimeno, T. E., Wehr, R., Wohlfahrt, G., Wang, Y., Kooijmans, L. M. J., Hilton, T. W., Belviso, S., Peylin, P., Commane, R., Sun, W., Chen, H., Kuai, L., Mammarella, I., Maseyk, K., Berkelhammer, M., Li, K.-F., Yakir, D., Zumkehr, A., Katayama, Y., Ogée, J., Spielmann, F. M., Kitz, F., Rastogi, B., Kesselmeier, J., Marshall, J., Erkkilä, K.-M., Wingate, L., Meredith, L. K., He, W., Bunk, R., Launois, T., Vesala, T., Schmidt, J. A., Fichot, C. G., Seibt, U., Saleska, S., Saltzman, E. S., Montzka, S. A., Berry, J. A., and Campbell, J. E.: Reviews and syntheses: Carbonyl sulfide as a multi-scale tracer for carbon and water cycles, Biogeosciences, 15, 3625–3657, https://doi.org/10.5194/bg-15-3625-2018, 2018.
Winner, W., Thomas, S., Berry, J., Bond, B., Cooper, C., Hinckley, T., Ehleringer, J., Fessenden, J., Lamb, B., McCarthy, S., McDowell, N., Phillips, N., and Williams, M.: Canopy Carbon Gain and Water Use: Analysis of Old-growth Conifers in the Pacific Northwest, Ecosystems, 7, 482–497, https://doi.org/10.1007/s10021-004-0139-2, 2004.
Wohlfahrt, G., Brilli, F., Hörtnagl, L., Xu, X., Bingemer, H., Hansel, A., and Loreto, F.: Carbonyl sulfide (COS) as a tracer for canopy photosynthesis, transpiration and stomatal conductance: Potential and limitations, Plant, Cell Environ., 35, 657–667, https://doi.org/10.1111/j.1365-3040.2011.02451.x, 2012.
Woodruff, D. R., Mcculloh, K. A., Warren, J. M., Meinzer, F. C., and Lachenbruch, B.: Impacts of tree height on leaf hydraulic architecture and stomatal control in Douglas-fir, Plant. Cell Environ., 30, 559–569, https://doi.org/10.1111/j.1365-3040.2007.01652.x, 2007.
Yang, B., Hanson, P. J., Riggs, J. S., Pallardy, S. G., Heuer, M., Hosman, K. P., Meyers, T. P., Wullschleger, S. D., and Gu, L. H.: Biases of CO2 storage in eddy flux measurements in a forest pertinent to vertical configurations of a profile system and CO2 density averaging, J. Geophys. Res.-Atmos., 112, 1–15, https://doi.org/10.1029/2006JD008243, 2007.