the Creative Commons Attribution 3.0 License.
the Creative Commons Attribution 3.0 License.
Anatomical structure overrides temperature controls on magnesium uptake – calcification in the Arctic/subarctic coralline algae Leptophytum laeve and Kvaleya epilaeve (Rhodophyta; Corallinales)
Merinda C. Nash
Walter Adey
Calcified coralline red algae are ecologically key organisms in photic benthic environments. In recent decades they have become important climate proxies, especially in the Arctic and subarctic. It has been widely accepted that magnesium content in coralline tissues is directly a function of ambient temperature, and this is a primary basis for their value as a climate archive. In this paper we show for two genera of Arctic/subarctic corallines, Leptophytum laeve and Kvaleya epilaeve, that previously unrecognised complex tissue and cell wall anatomy bears a variety of basal signatures for Mg content, with the accepted temperature relationship being secondary. The interfilament carbonate has lower Mg than adjacent cell walls and the hypothallial cell walls have the highest Mg content. The internal structure of the hypothallial cell walls can differ substantially from the perithallial radial cell wall structure. Using high-magnification scanning electron microscopy and etching we expose the nanometre-scale structures within the cell walls and interfilament. Fibrils concentrate at the internal and external edges of the cell walls. Fibrils ∼ 10 nm thick appear to thread through the radial Mg-calcite grains and form concentric bands within the cell wall. This banding may control Mg distribution within the cell. Similar fibril banding is present in the hypothallial cell walls but not the interfilament. Climate archiving with corallines can achieve greater precision with recognition of these parameters.
- Article
(13505 KB) - Full-text XML
- BibTeX
- EndNote


Understanding tissue complexity and the structural organisation of cell wall calcification in crustose coralline algae (CCA) is important for many reasons, including the growing use of these organisms as climate proxies and concern for the ecological effects of ocean acidification. There is a burgeoning interest in using coralline crusts as environmental proxies for late Holocene temperature (Hetzinger et al., 2009; Gamboa et al., 2010; Halfar et al., 2010), Arctic ice sheet coverage (Halfer et al., 2013) and pH changes with time (Krayesky-Self et al., 2016). Typically magnesium content is used as a key indicator of late Holocene temperature fluctuations (Adey et al., 2013). Yet despite this utilisation of coralline carbonate crusts for proxy climate research, there has been little study of tissue and cellular-scale physiology as it relates to the distribution of magnesium within the crust. Nor are the basic mechanisms of calcification fully understood (Adey, 1998). This is in stark contrast to the status of other calcifiers used for proxy work, e.g. corals (Barnes and Lough, 1993), foraminifera (Bentov and Erez, 2005) and bivalves (Wanamaker et al., 2008). However, these well-known climate proxies have little application in the Arctic region of greatest climate change affects (Adey et al., 2013), and without a greater understanding of coralline calcification physiology, precision proxy analysis of temperature and other environmental conditions, using coralline algae, is limited.
One of the key roles of corallines is the building of carbonate substrate that underpins many ecosystems globally: for example, the thick bioherms found in coral reef structures (Adey, 1978a, b, 1998), the extensive rhodolith beds off South American (Amado-Filho et al., 2012; Bahia et al., 2010) and Australian (Harvey et al., 2016) shores, maerl substrate in the Mediterranean (Martin et al., 2014), and the dominant rocky benthos biostromes and rhodoliths in many Arctic and subarctic environments (Adey et al., 2013). There are concerns that as atmospheric pCO2 increases and consequent ocean acidification increases, there will be negative impacts on the capacity of corallines to continue building these important substrates (e.g. McCoy and Kamenos, 2015), although there are experimental studies that find no negative impacts (e.g. Cox et al., 2017). The pace of research on the effects of temperature and climate change on coralline algae has outpaced both the published data on anatomy and our understanding of the biochemical processes controlling their carbonate skeletal building. For developing reliable past climate proxy information using corallines and anticipating future climate change impacts on these keystone calcifiers, as with any other organism, it is first necessary to understand how these algae organise their tissues, build their skeleton, and control cellular-scale magnesium content.
While numerous studies of coralline growth rates under a wide range of temperature and light conditions have been published (Adey and McKibben, 1970; Adey, 1970, 1973; Adey and Vassar, 1975; Kamenos et al., 2008; Diaz-Pulido et al., 2014; Vásquez-Elizondo and Enríquez, 2016), little attempt has been made to relate this information to calcification processes. Also, it is only recently, with the use of higher magnification scanning electron microscopy (SEM; Adey et al., 2005, 2015a), that the earlier implications of anatomical complexity (Adey, 1964, 1965, 1966a; Cabioch and Giraud, 1986) have been fully appreciated. It has been proposed that calcification is a result of locally elevated pH during photosynthesis leading to super-saturation and associated mineral precipitation (Ries, 2010). However, some parasitic corallines lack photosynthetic pigments and have haustoria to derive nutrition from their hosts and yet present typical tissue and calcified wall structures (Adey and Sperapani, 1971; Adey et al., 1974). Also, anatomical and magnesium content studies of Arctic corallines demonstrate that growth continues in Arctic winter darkness (Halfar et al., 2010; Adey et al., 2013), indicating that calcification is not likely a straight forward association with micro-saturation state, as seen in some algae (e.g. Halimeda; Adey, 1998; Sinutok et al., 2012).
Following on from the classical coralline studies, maturing around the turn of the 19th century, Adey (1964, 1965, 1966a, b) laid out the basic tissue-structured anatomy of crustose corallines, adding the epithallium, intercalary meristem and cellular elongation (while calcified) to the classical model of perithallium and hypothallium. Later, SEM (Adey et al., 2005, 2013) demonstrated greater sub-tissue complexity and added the calcified cell wall components inner wall (IW) and interfilament (IF). It should be noted that while the interfilament is a minor component of total calcification in the species of this paper, it can be a major component in some genera (Adey et al., 2013, 2015a).
In this paper, we show for the first time the cellular-scale and anatomical controls on magnesium distribution within the carbonate skeletons of two Arctic/subarctic coralline species. These are Leptophytum laeve (Stromfelt) Adey, and the epiphytic (and non-photosynthetic parasitic) Kvaleya epilaeve Adey and Sperapani, from the northern Labrador coast. L. laeve is photosynthetic and forms expansive but thin crusts (up to 1 mm in thickness) generally on shell fragments and pebbles in deeper water (Adey, 1966a, 1970). K. epilaeve is an epiphytic parasite, lacking in photosynthetic pigment, and producing hypothallial haustoria that penetrate upper perithallial cells of L. laeve (Adey and Sperapani, 1971). It is similar in physiology to the North Pacific subarctic parasite Ezo epiyessoense (Adey et al., 1974), which, along with its host Lithophyllum yessoense, lies in a distantly related coralline group. K. epilaeve is the only known Arctic genus of algae (Adey et al., 2008) and is absent or of very limited occurrence in subarctic waters, where the host continues to be abundant (Adey and Sperapani, 1971). Understanding and contrasting calcification within these two species, both growing in the same temperature, light, and pH conditions, offers an opportunity to examine the wide variance of Mg content as a function of skeletal anatomy and metabolic processes.
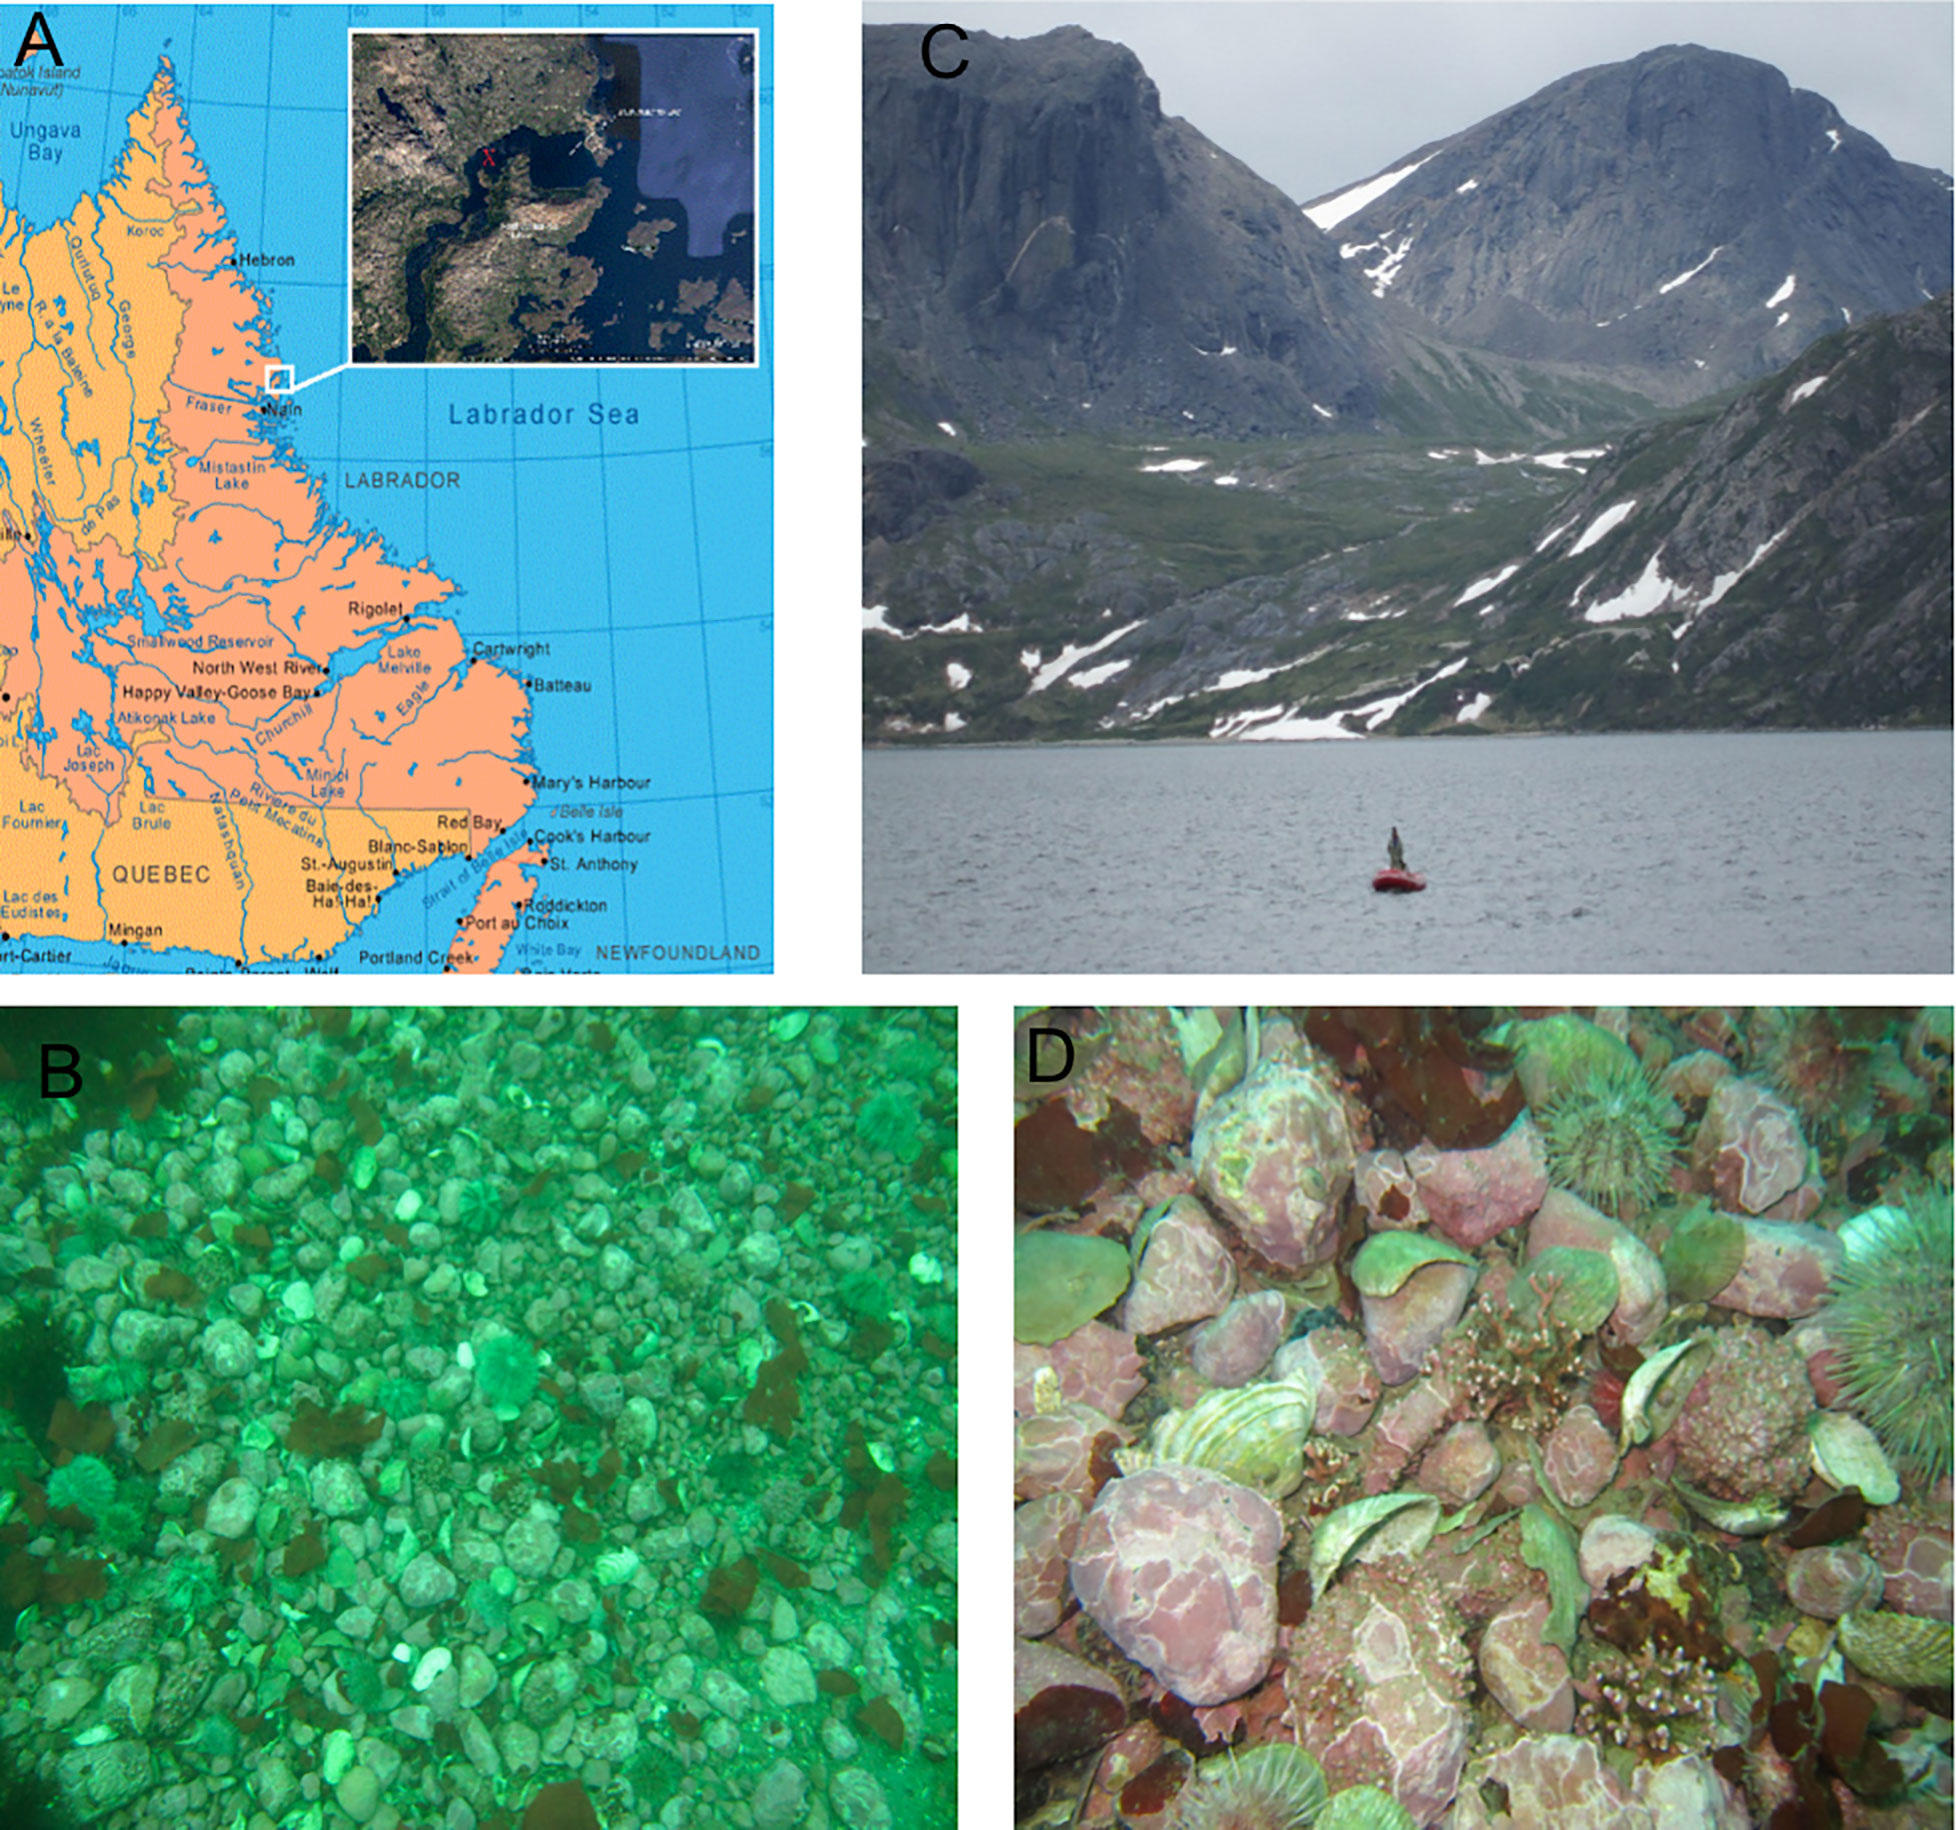
Figure 1(a) Port Manvers Bay Station, Labrador, Canada. (b) Pebble–shell bottom with occasional rhodoliths at 15–17 m. Coralline-covered pebbles range from about 5–10 cm diameter. (c) Collecting site in western Port Manvers Bay. (d) Close-up of bottom shown in Fig. 1c.
2.1 Sample collection and site information
The sample was collected on 22 July 2013, at the commencement of Arctic summer, from 16 to 18 m depth at inner Port Manvers Bay, Labrador, Canada. The collection site lies at 56∘57.1′ N, 61∘32.8′ W, near the northern end of the 50 km long Port Manvers Run, a north–south passageway inside of South Aulatsivik Island (Fig. 1a, c). Sea ice is extensive from November through early July, and the inter-island passages and bays are covered with sea ice through much of that period. At the collection site, the bottom was a shell–pebble gravel bed primarily of shell fragments and pebbles encrusted with L. laeve, L. foecundum, and Clathromorphum compactum; scattered coarse rhodoliths Lithothamnion glaciale and Lithothamnion tophiforme were also present (Fig. 1b, d). K. epilaeve occurred on L. laeve and L. laeve grew on both sides of the shell fragments. Salinity was 30 and measured using electronic induction instrumentation. November to July near-surface water temperatures, below the sea ice, are within the −1.5 to −1.8 ∘C range. Bottom summer temperature measured at the site on 22 July 2013 was 0.5 ∘C. Since this is relatively early in the summer season, peak temperatures are likely to be between 3 and 5 ∘C (Adey et al., 2015b) with a mean growing season temperature of ∼ 2 ∘C. This mean estimate is based on measurements from eight sites in the region (182 km S to 35 km N) with surface to bottom temperature records for 1964 (Adey, 1966c) and 2013 (Adey et al., 2015b). These ranged from 1.9 to 5.6 ∘C during summer at 15–20 m. The snow-covered land-fast sea ice overlying the gravel rhodolith bed from which the samples were taken likely precludes significant solar energy from reaching the bottom for 8 months of each year.
The original sample is 2013–2011 (1) at the National Museum of Natural History.
3.1 Scanning electron microscopy–energy dispersive spectroscopy (SEM-EDS)
The sample was fractured, mounted using carbon tape and platinum-coated prior to scanning electron microscopy energy dispersive spectroscopy (SEM-EDS). For these analyses, we used a Zeiss UltraPlus field emission scanning electron microscope (FESEM) equipped with an HKL electron backscatter diffraction (EBSD) operated at 15 kV, with 11 mm working distance. SEM was carried out at the Australian National University Centre for Advanced Microscopy. SEM-EDS was used for spot analyses to quantify the elemental composition of representative parts of the crust. A range of SEM settings were used for imaging. A range of SEM settings were used for imaging; secondary (SE) electron showing topography, and backscatter electron imaging (BSE), which shows higher magnesium areas as darker carbonate and is useful for rapid visual identification of mineral distribution.
A second round of EDS was undertaken using a NOVA NanoSEM FEI at the National Museum of Natural History's Department of Mineralogy. Typically EDS measurements are made using an accelerating voltage of 15 kV (Nash et al., 2011) so that there is sufficient energy to dislodge electrons from a range of elements, e.g. from lighter magnesium up to heavier strontium. The EDS beam interacts with a roughly spherical-shaped region of carbonate beneath the surface. This region is referred to as the interaction volume. At 15 kV the interaction volume is ∼ 3 µm in diameter whereas the average cell wall thickness ranges from only 500 nm up to ∼ 2 µm (occasionally thicker, up to 3 µm). Interfilament in these species may be only a few grains wide, ranging from 200–500 nm to 2 µm. These narrow areas of interest, in contrast to the larger beam interaction volume, pose a problem for obtaining accurate Mg measurements for only cell wall or interfilament. For example, a measurement of the cell wall may include minor amounts of carbonate from the adjacent interfilament and vice versa. Generally, even with this beam crossover, in our experience 15 kV is sufficient to identify a significant offset in magnesium while still collecting information that may be of interest such as strontium levels. However, where there are only a few grains of interfilament, as in the L. laeve, the 3 µm interaction volume is problematic. A range of EDS settings were tested aiming to reduce the beam interaction volume so that Mg content for each the cell wall and the interfilament could be individually measured without the beam crossing into the adjacent substrate. A setting of 7 kV, working distance 6.4 mm and 1 nA current was used to measure the interfilament grains in the L. laeve with a count time of 20 s. The sample was carbon-coated. This was calculated to have an interaction volume of < 1 µm. These results are reported separately to the main dataset.
3.2 Sample preparation
Initially the crust was fractured using shears and mounted in superglue. After first imaging of the fractured crust, the sample was polished using 2000 gsm wet and dry sandpaper then sonically cleaned in unbuffered deionised water for 2 min. This preparation was used for SEM EDS measurements; 8–9 measurements were made for each carbonate type of interest. Subsequently the sample was sonically cleaned in unbuffered deionised water for 20 min. The deionised water has a pH of ∼ 6.5. When cleaned for 2 min the surface is very lightly etched allowing differentiation between different Mg-calcite morphologies without altering the measured Mg content. After cleaning for 20 min there is a visible difference in the surface with much of the interfilament Mg-calcite and smaller grains removed, allowing imaging of nanometre-scale cellular structures.
3.3 X-ray diffraction methods
Powder X-ray diffraction (XRD) was carried out using a SIEMENS D501 Bragg–Brentano diffractometer equipped with a graphite monochromator and scintillation detector, using Cu Kα radiation. A subsample was broken off the edge of the crust. This piece included L. laeve with surficial K. epilaeve. The sample was ground using a mortar and pestle. Fluorite was added as an internal standard. The sample was not bleached and acetone was not added during the grinding as this has been found to occasionally induce alteration and precipitation of other minerals in other coralline samples we have worked with. Scan interpretation for mol % MgCO3 followed the methods described by Nash et al. (2013a, b).
3.4 Terminology
In this paper, we rename the inner wall the cell wall and retain the terminology interfilament, noting this is equivalent to the middle lamella in higher plants (Esau, 1953); interfilament has also been referred to as interstitial (Ragazzola et al., 2016). We use the abbreviations PCW and PIF (perithallial cell wall and perithallial interfilament) and HCW and HIF (hypothallial cell wall and interfilament) to designate the carbonate wall components.
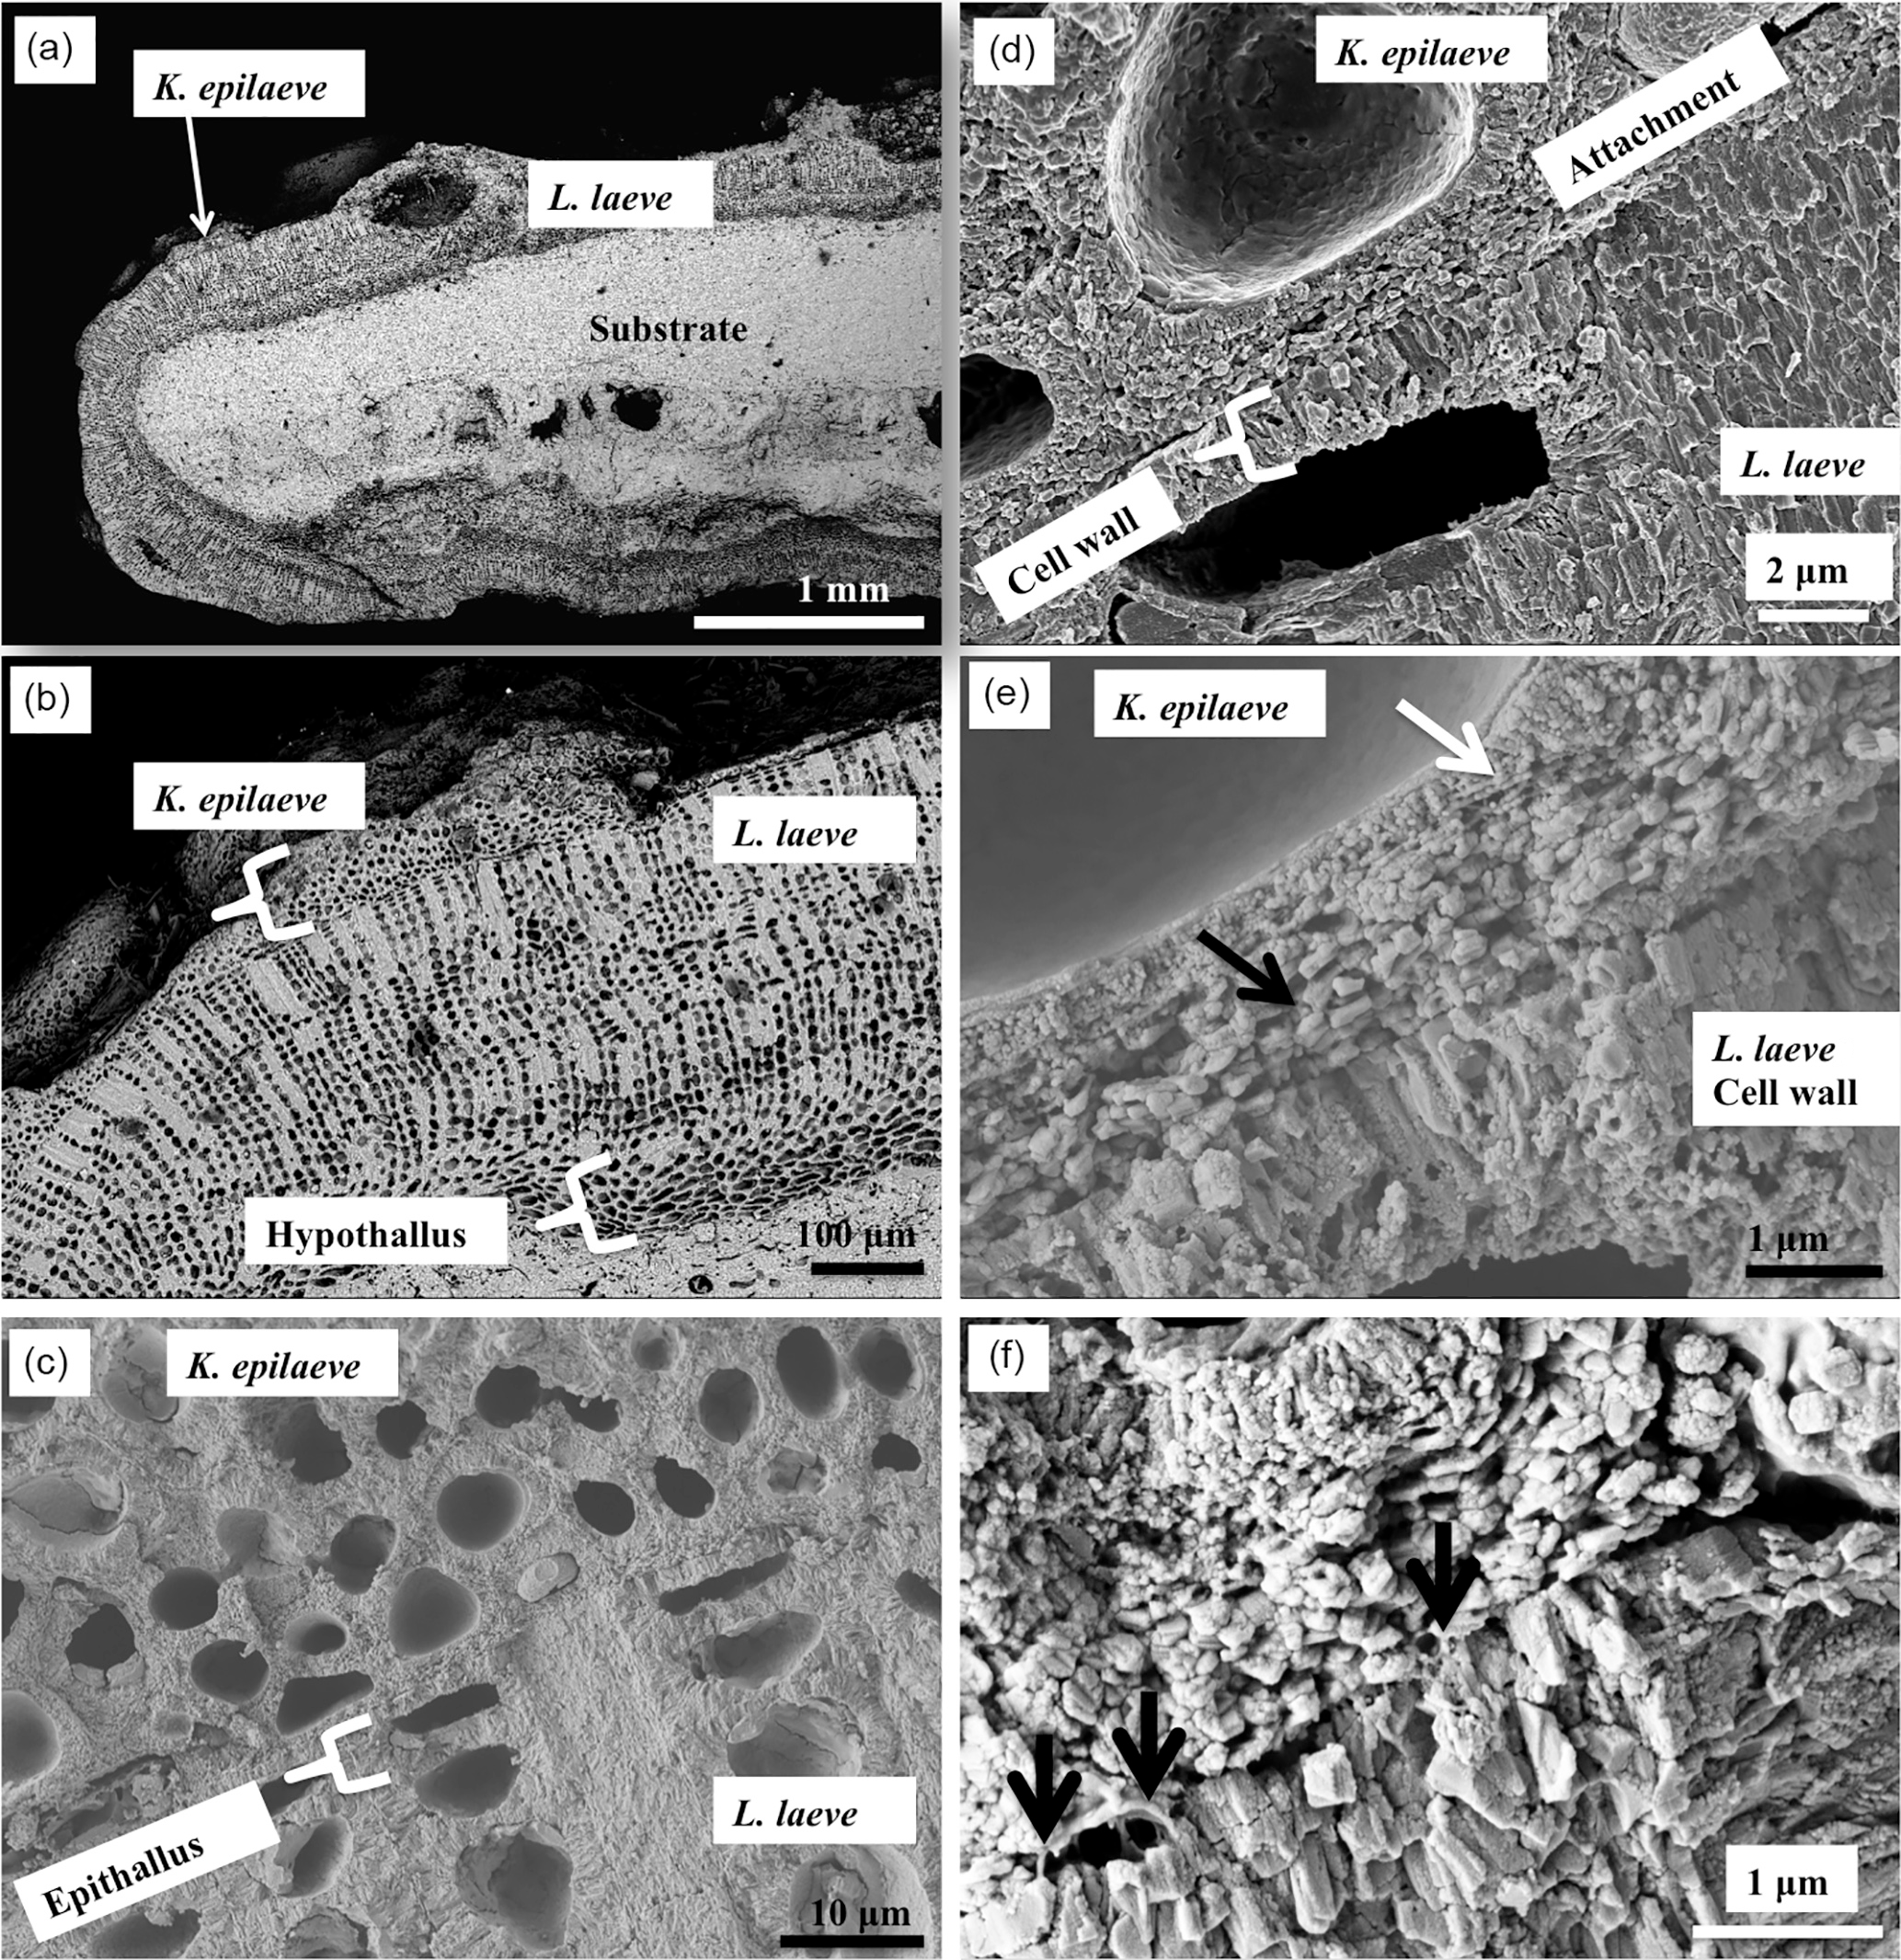
Figure 2Overview of K. epilaeve on L. laeve. (a) Overview (BSE). L. laeve has been partly overgrown by K. epilaeve. (b) Closer up (BSE), K. epilaeve has a very thin perithallium with thicker buildup for its conceptacle. (c) Close up (SE) and (d) showing attachment zone of K. epilaeve hypothallus on the epithallus of the L. laeve. (e) (SE) The cell wall in the L. laeve is roughly radial whereas the K. epilaeve cell wall does not appear properly mineralised with nanometre-scale beads of Mg-calcite along what appears to be organic fibrils (white arrow). The K. epilaeve Mg-calcite layer at the attachment zone has coarse angular grains roughly parallel to the L. laeve surface (black arrow). (f) (SE) Organic fibrils are visible (black arrows) between the base of the K. epilaeve and the surface of the L. laeve, suggesting this is the attachment mechanism.
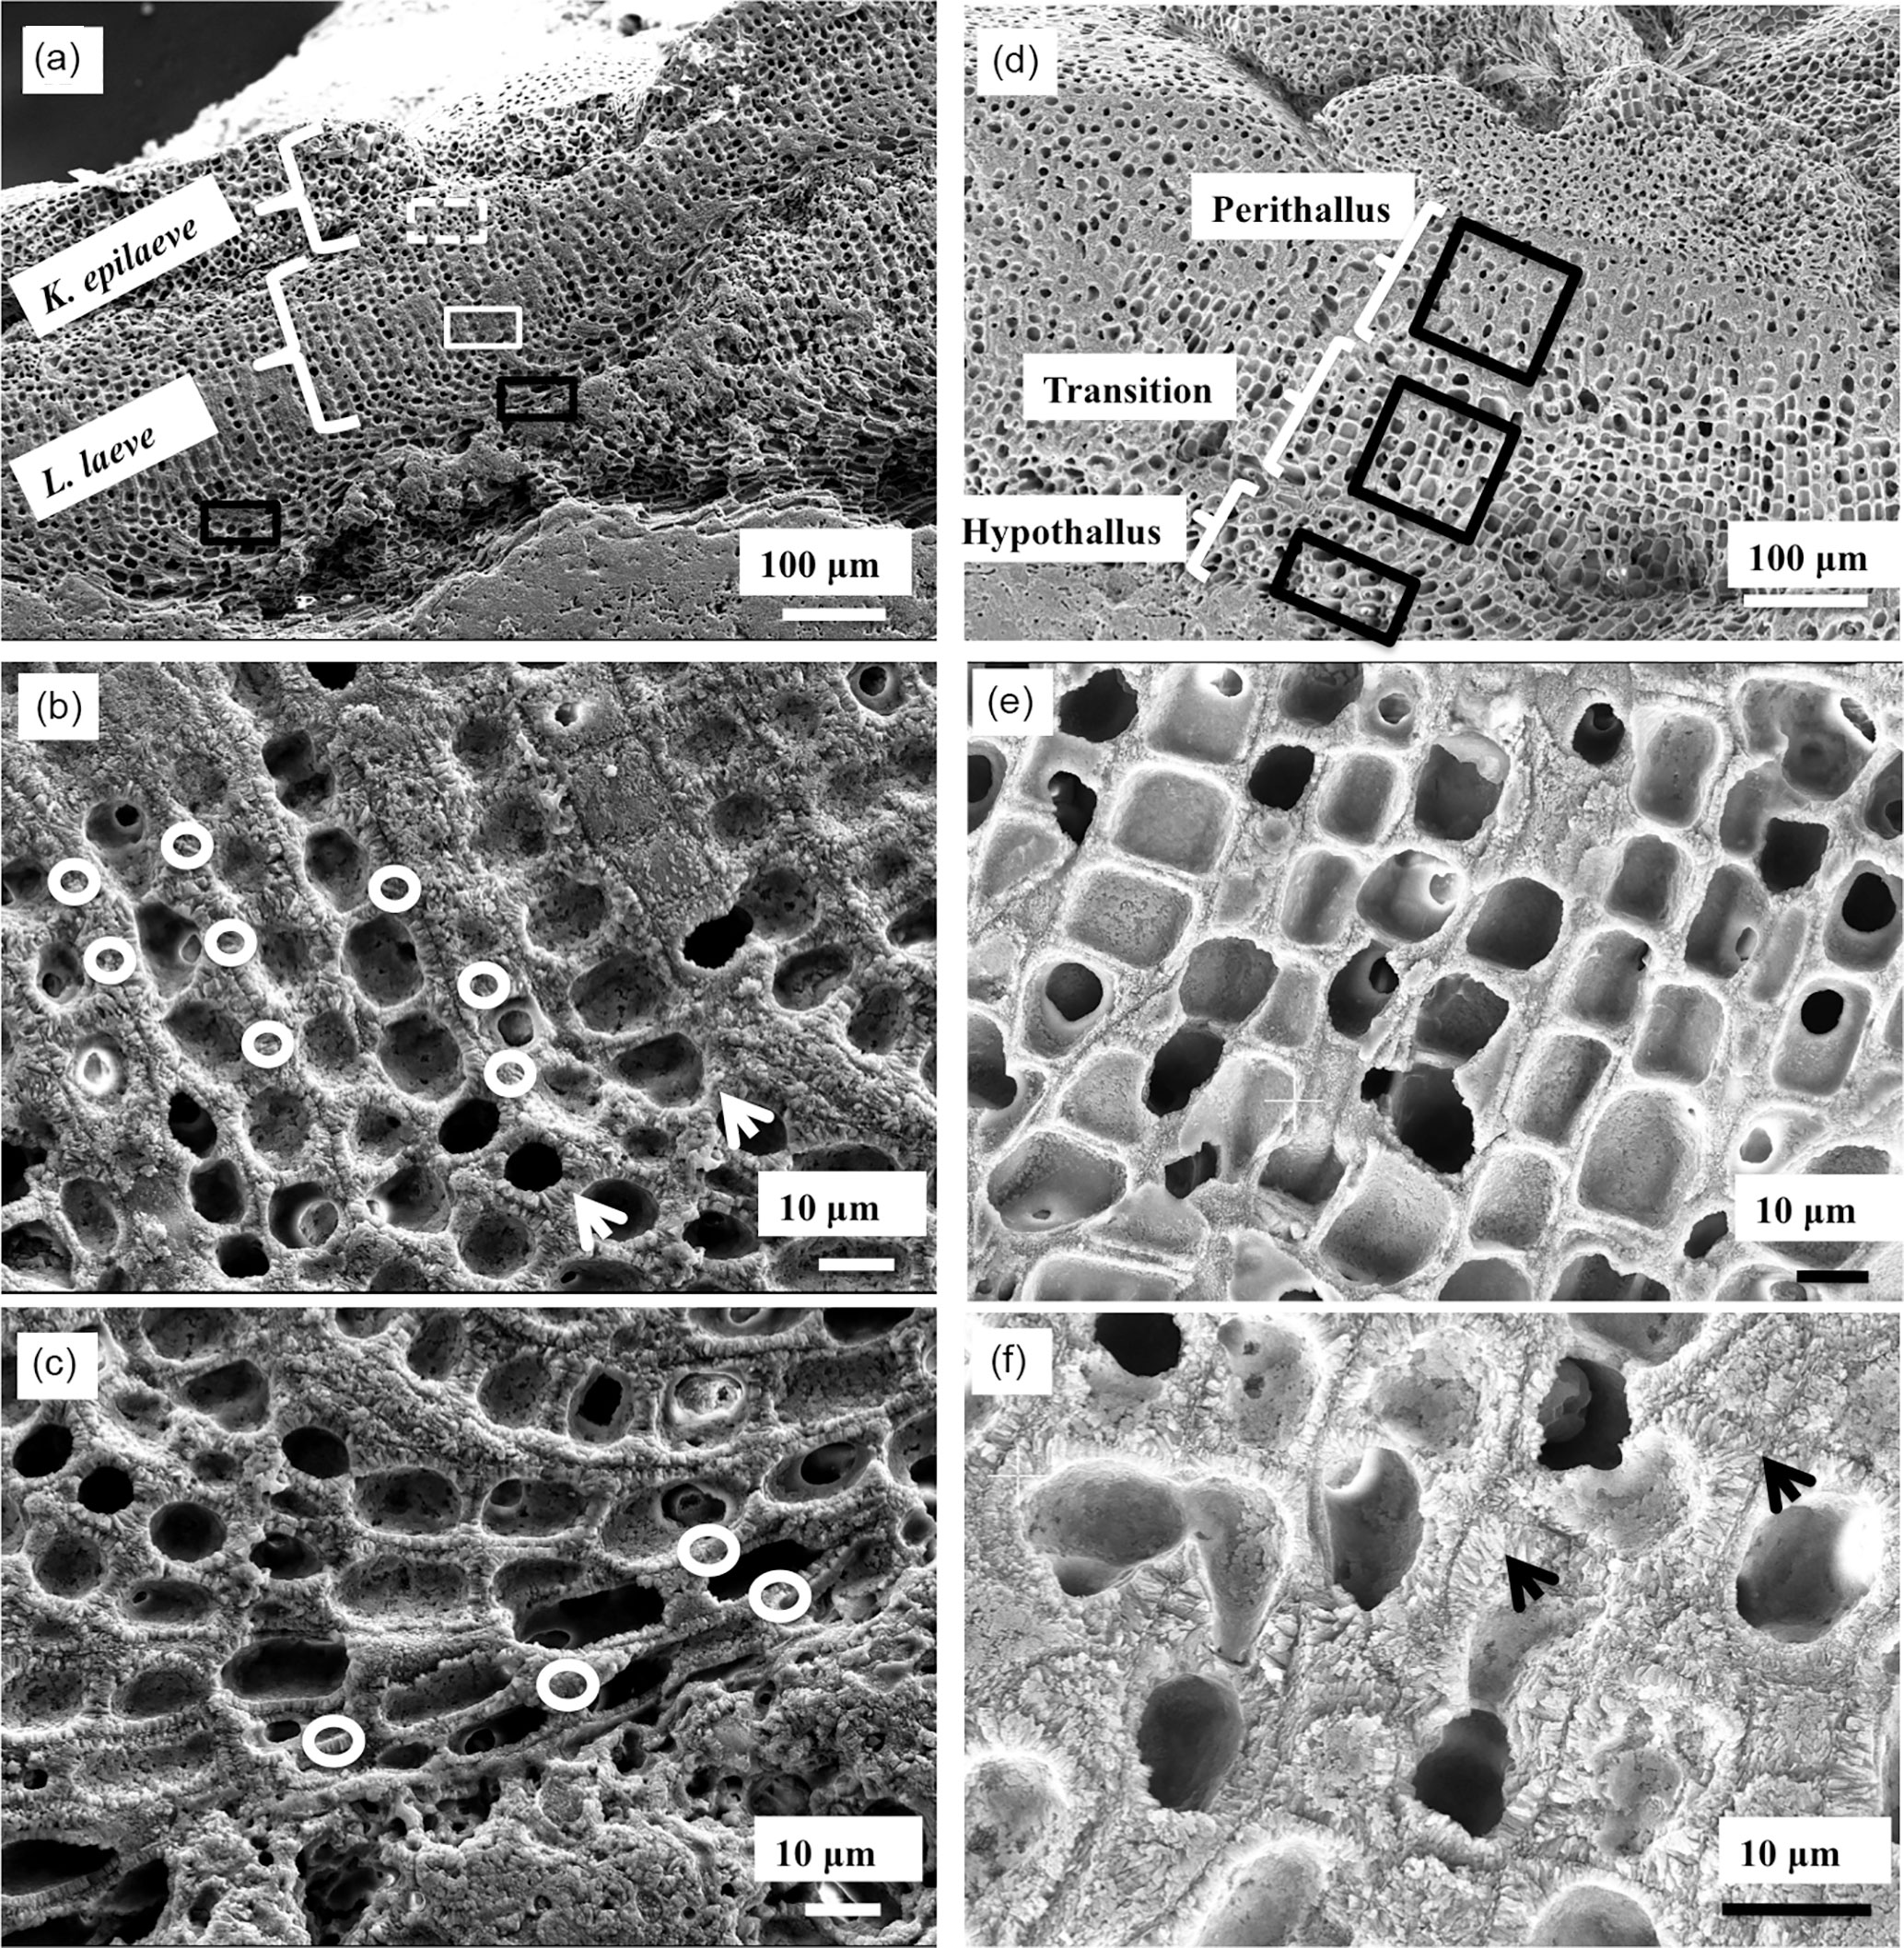
Figure 3Overview of L. laeve and K. epilaeve and EDS sites (white circles) in L. laeve. (a–c) Sites on the underside of the pebble. (d–f) Sites on the upper side of the pebble. (a) White dashed box – cell wall and interfilament in K. epilaeve. White box – perithallial cell wall L. laeve. Black box – hypothallus L. laeve. (b) EDS sites for cell wall measurements of L. laeve. Circle size indicates approximate area of measurement (3 µms). Cell wall radial Mg-calcite (arrowheads). (c) EDS sites for hypothallus (right box in a). (d) EDS sites on sample upper side for L. laeve. (e) L. laeve. (f) L. laeve. Cell walls in upper side are visually comparable to cell walls in underside with radial Mg-calcite (arrowheads) in cell walls and minimal interfilament.
4.1 SEM imaging overview
The specimen of L. laeve encased an aragonite carbonate shell (Fig. 2a). The crust is approximately 500 µm thick (Fig. 2b) with a basal hypothallus ∼ 80 µm thick. K. epilaeve has been considered to be an adelphoparasite, a species very closely related to its host. Although diminutive, and superficially appearing as scattered white sand grains, K. epilaeve can densely coat L. laeve. Although often appearing as densely crowded conceptacles, it can possess the full basic array of anatomical features: hypothallium, perithallium and epithallium (the latter mostly absent; Adey and Sperapani, 1971; Fig. 2b). L. laeve typically has an epithallium that is one cell layer of rounded ovoid, thin-walled cells that are often absent in SEM sections. The K. epilaeve grows directly on the L. laeve meristem (Fig. 2c, d) and there was no evidence of excavation required (by borers or grazers) prior to settlement. This suggests that unlike the typical sloughing relationship with epiphytes wherein epithallium builds up under the epiphyte until it sloughs off, the L. laeve does not recognise K. epilaeve as foreign. The perithallial cell walls of L. laeve contain radially oriented grains of Mg-calcite; the interfilament is thin and has carbonate grains randomly orientated in a plane parallel to the filament axis or cell top/bottom. The interfilament shows up strongly as stripes on vertical fracture sections (Fig. 2b, c). Note that, for easiest viewing of the fine structures, the figure images are best viewed on screen rather than in print.
The first layer formed by the K. epilaeve has angular grains parallel to the L. laeve surface (Fig. 2e). The bottom part of the cell wall is without radial structure and has submicron beads appearing to calcify along and within organic fibrils (Fig. 2e). Organic fibrils are visible between the basal layer of K. epilaeve carbonate grains and the meristem of the L. laeve (Fig. 2f), suggesting a method of attachment in addition to the haustoria developed by some hypothallial cells (Adey and Sperapani, 1971). There were no haustoria visible in our SEM sample. Fine radial grains typically observed in cells of L. laeve beneath the meristem were not apparent in the cell walls of the L. laeve meristem (Fig. 2e, f), suggesting this surficial carbonate may have been altered or remineralised during the attachment process.
4.2 SEM-EDS
Measurements for magnesium content in Leptophytum laeve were undertaken on both the upper (side with conceptacles) and under (without conceptacles) crusts (Fig. 3a, d). The parasite Kvaleya epilaeve was present on both surfaces (Figs. 2a, b, 3a). Measurements of K. epilaeve were made on the underside.
The Mg content of the perithallial and hypothallial cell walls of L. laeve was measured (Fig. 3a–d) as well as what appeared to be a transitional cell type between the basal hypothallus and the typical perithallial cells (Fig. 2d–f). These transitional cells are within the perithallus but have thin cell walls similar to the hypothallial cells. There are clear visual differences between the cell walls of the three cell types. The perithallial cell walls are 1–2 µm wide with clearly radial Mg-calcite (Fig. 2b, f). The basal hypothallial cells are elongated relative to the perithallial cells and their cell walls are narrower and do not always show radial cell wall structure (Fig. 2c). The transitional cells have elongate cells relative to the perithallus but less so than the hypothallus, and their cell walls are thinner, ∼ 0.5–1 µm, and do not show radial structures. The interfilament of L. laeve has only a single layer of Mg-calcite grains (Fig. 2b, f), as noted above, showing as a thin line on longitudinal axial fractures; fractures along the interfilament appear as conspicuous vertical stripes (Fig. 2c).
The K. epilaeve in the portion of the sample mounted for SEM did not present the typical elongated hypothallial cells as shown by Adey and Sperapani (1971), as this cut is not longitudinally placed on a growing lobe. The key difference between the perithallus of the L. laeve and K. epilaeve was the presence of wide (1–2 µm) areas of interfilament in the K. epilaeve (Fig. 3f, 4a, c). In many corallines (Adey et al., 2005), including the L. laeve studied for this paper, there is only a single layer of interfilament grains, and these are present as vertical stripes on vertical fractures (Fig. 3b). EDS measurements were taken for both the K. epilaeve cell wall and interfilament (Fig. 4a, b). As the interaction volume of the EDS beam is ∼ 3 µm (Methods) and the cell wall and interfilament thickness range from 1–3 µm, the values measured for both may include small amounts of the other, although every effort was made to place the beam on the widest part of the appropriate band. A second set of measurements was taken for the L. laeve cell wall and interfilament using lower voltage, and the results are reported separately.
Table 1SEM-EDS results. Conversion of mol % to Mg ∕ Ca is included.
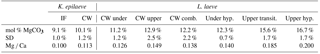
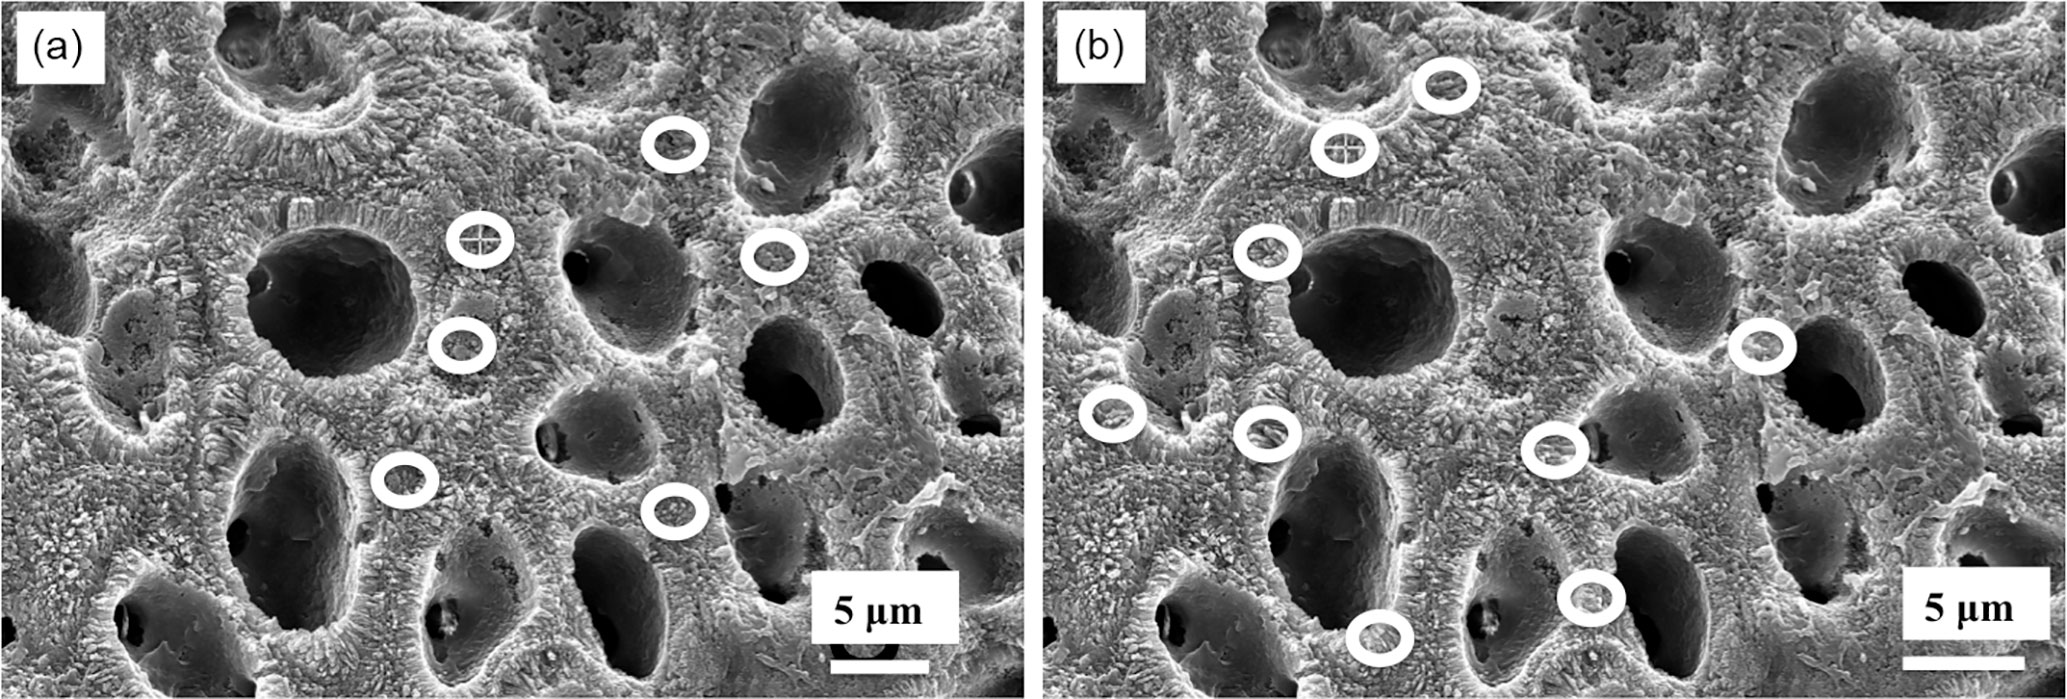
Figure 4Detail of EDS sites in K. epilaeve (dashed white box in Fig. 2a). (a) EDS sites (white circles) for interfilament. (b) EDS sites for cell wall.
4.3 Mg content
Bulk whole sample content of Mg, determined by powder XRD, was 10.8 mol % MgCO3 (Mg ∕ Ca 0.13). The EDS-determined average Mg content ranged from 9.1 (K. epilaeve perithallial interfilament) to 16.7 mol % MgCO3 (L. laeve upper hypothallial cell wall; Table 1, Fig. 6). The highest measured individual Mg content, 19.6 mol % MgCO3, was in the L. laeve upper crust HCW. Generally the Mg content of interfilament was lower than cell walls, and perithallial cell walls had the highest Mg content. The lowest values were for the K. epilaeve PIF and PCW, 9.1 and 10.1 mol % MgCO3 respectively, not significantly different at significance level of 0.05 but significantly different at significance level of 0.1 (p= 0.068; Table 2). Keeping in mind that the values for the cell wall and interfilament include a small amount of carbonate from the other, we consider the p= 0.068 result likely does represent a true significant difference between the two. The PCW for the L. laeve was slightly higher at 11.2 and 12.9 mol % MgCO3 (under and upper crust respectively); these were not significantly different from each other (p= 0.112). The combined average of the upper and under L. laeve cell walls (12.2 mol % MgCO3) was significantly higher (p= 0.025) than the K. epilaeve cell wall. However, comparing only the L. laeve cell wall of the under crust, the same side as the K. epilaeve, there was no significant difference (p= 0.124). The greatest difference between the upper and under L. laeve crust was found between the hypothallial cell walls. The under HCW averaged 12.3 mol % MgCO3, whereas the upper HCW was 4.4 mol % higher at 16.7 mol % MgCO3. The upper HCW was significantly higher than that of the L. laeve PCW but not different from that of the transitional CW (15.6 mol % MgCO3). Based on the graph in Fig. 5 this upper range of Mg would equate to temperatures above 9.3 ∘C, more than double the known summertime highs at the sampling site.
The results for comparison of the cell wall and interfilament grains in the L. laeve using 7 kV showed the interfilament was significantly lower, 8.5 mol % MgCO3 (n= 6) (p= 0.001), than the cell wall, 11.1 mol % MgCO3 (n= 8).
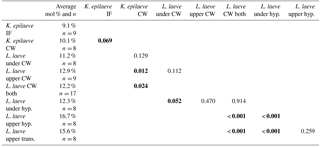
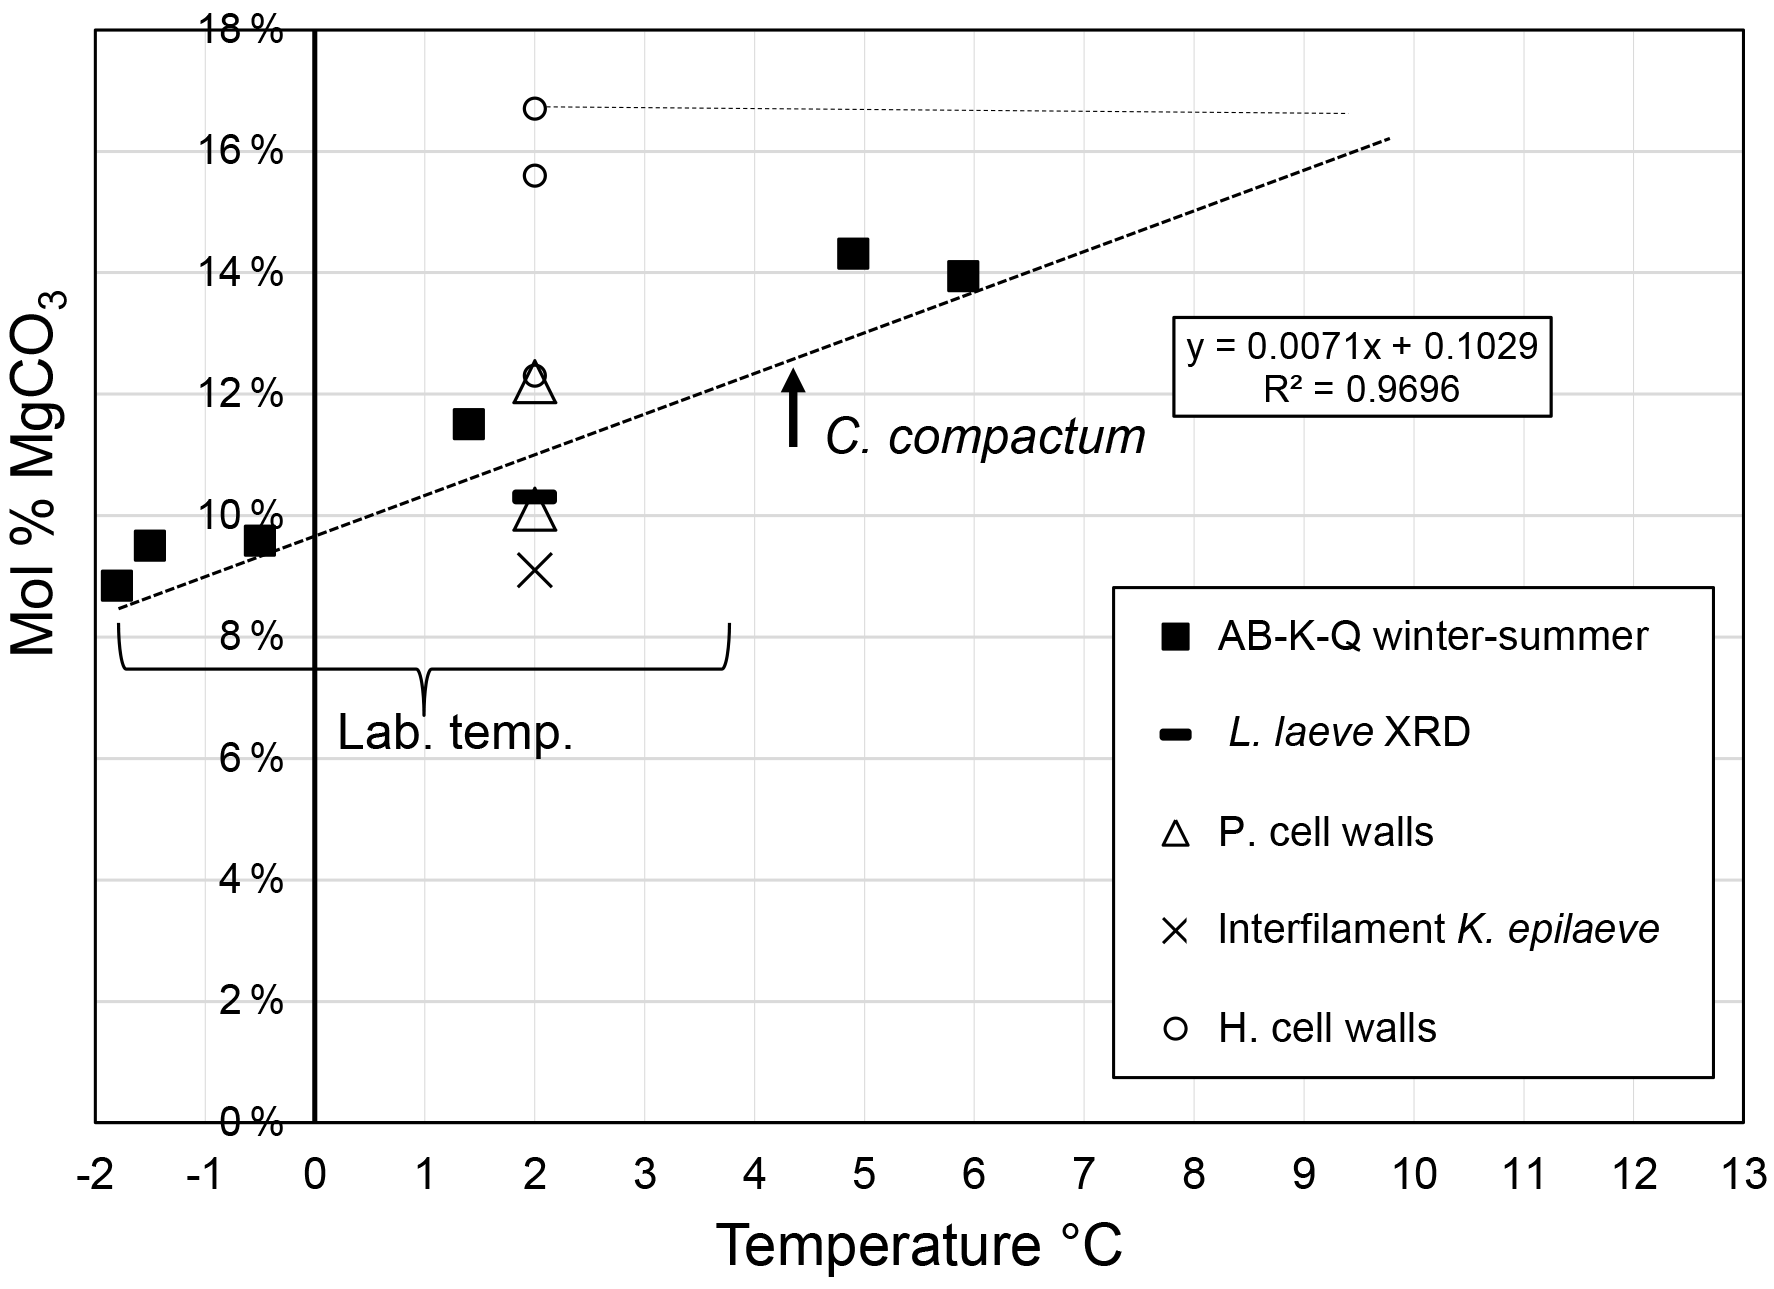
Figure 5A range of SEM settings were used for imaging: secondary (SE) electron showing topography, and backscatter electron imaging (BSE) which shows higher magnesium areas as darker carbonate and is useful for rapid visual identification of mineral distribution. L. laeve and K. epilaeve Mg content relative to Clathromorphum compactum from Arctic Bay, Kingitok, and Quirpon (Halfar et al., 2010, 2013). Lab – Labrador Sea. Heavy dashed line indicates best fit for C. compactum. Light dashed line indicates the temperature equivalent on the C. compactum line for the L. laeve hypothallial Mg content.
5.1 Cell wall
Within the radial Mg-calcite structure (PCW) of the K. epilaeve, a concentric banding pattern is present (Fig. 7a–c). The radial Mg-calcite grains are not always one continuous long grain. The banding is aligned to the presence of organic fibrils that appear regularly throughout the PCW (Fig. 7b). Organic fibrils, ∼ 10 nm thick, are parallel to the cell wall edges. These are spaced 30–40 nm apart throughout the middle of the cell wall. It appears that the fibrils are mineralised. At the outer edges of the cell wall the number of fibrils increases and appears as a dense mesh approaching a membrane (Fig. 7b, c) that is infilled with carbonate. The parallel fibrils are connected to the radial Mg-calcite grains, appearing as if to continue through the grain (Fig. 7c), similar to fence wire threading through fence posts at pre-defined spacing. There are also fibrils that drape over the grains. Where the fibrils concentrate to a mesh, this is also calcified but with smaller grains without regular shape. In the K. epilaeve interfilament (PIF), the grains are aligned to the cell wall surface (Fig. 7c). Fibrils also run through the PIF and attach to the interfilament grains but not with the regular pattern seen in the cell wall. From looking at a cross section of the cell wall from the top down (Fig. 7d), the fibrils can be seen to form a dense mesh.
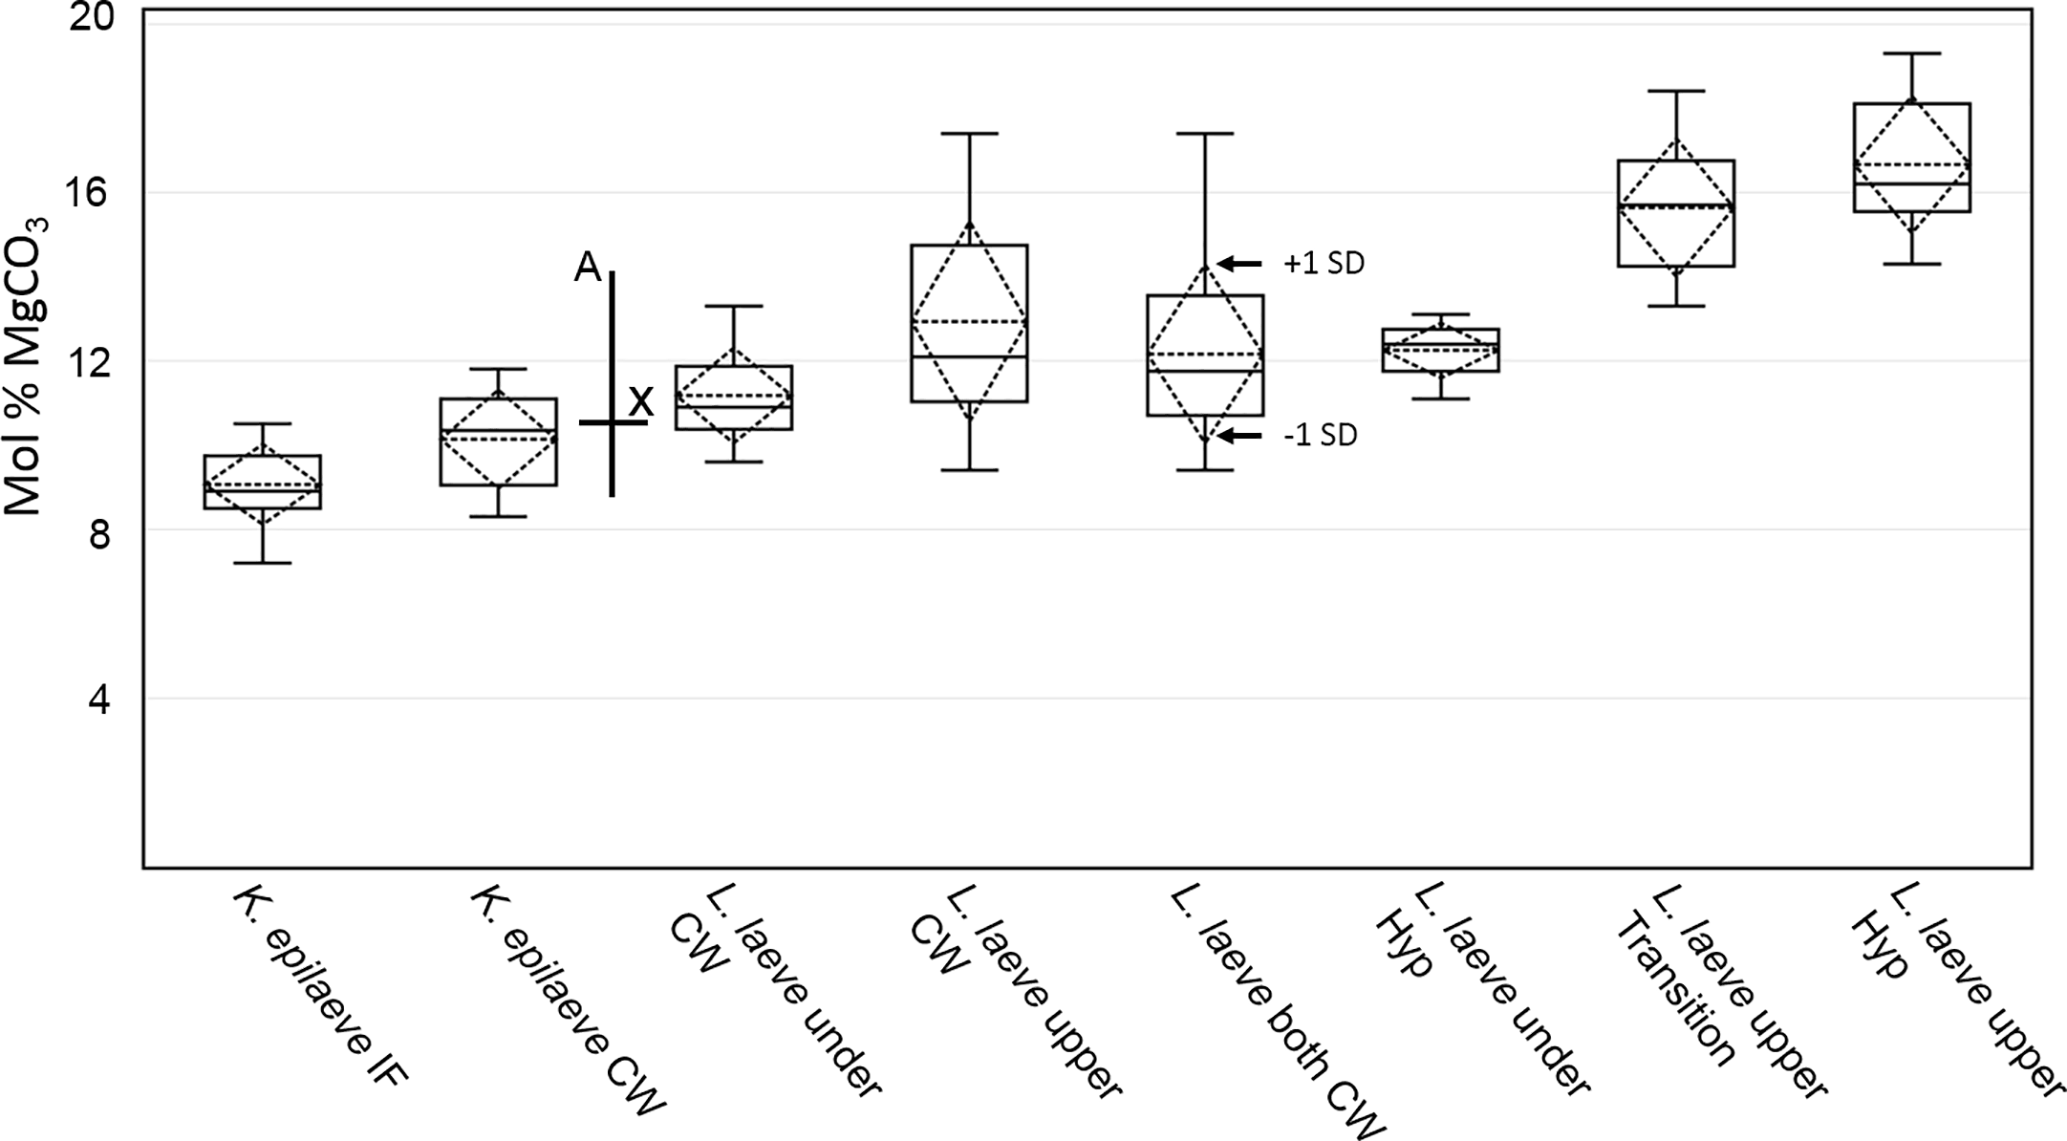
Figure 6Box plot of EDS mol % MgCO3 results. Boxes represent the second and third quartiles. The lower and upper bars are the minimum and maximum values (excluding an outlier for L. laeve under cell wall). The solid middle line within the box is the median value and the dash middle line the average. The dashed diamond box represents one standard deviation. The drawn-on cross represents the XRD mol % (X) and the seasonal range (a) of mol % for the Arctic Bay–Kingitok–Quirpon dataset in Fig. 5.
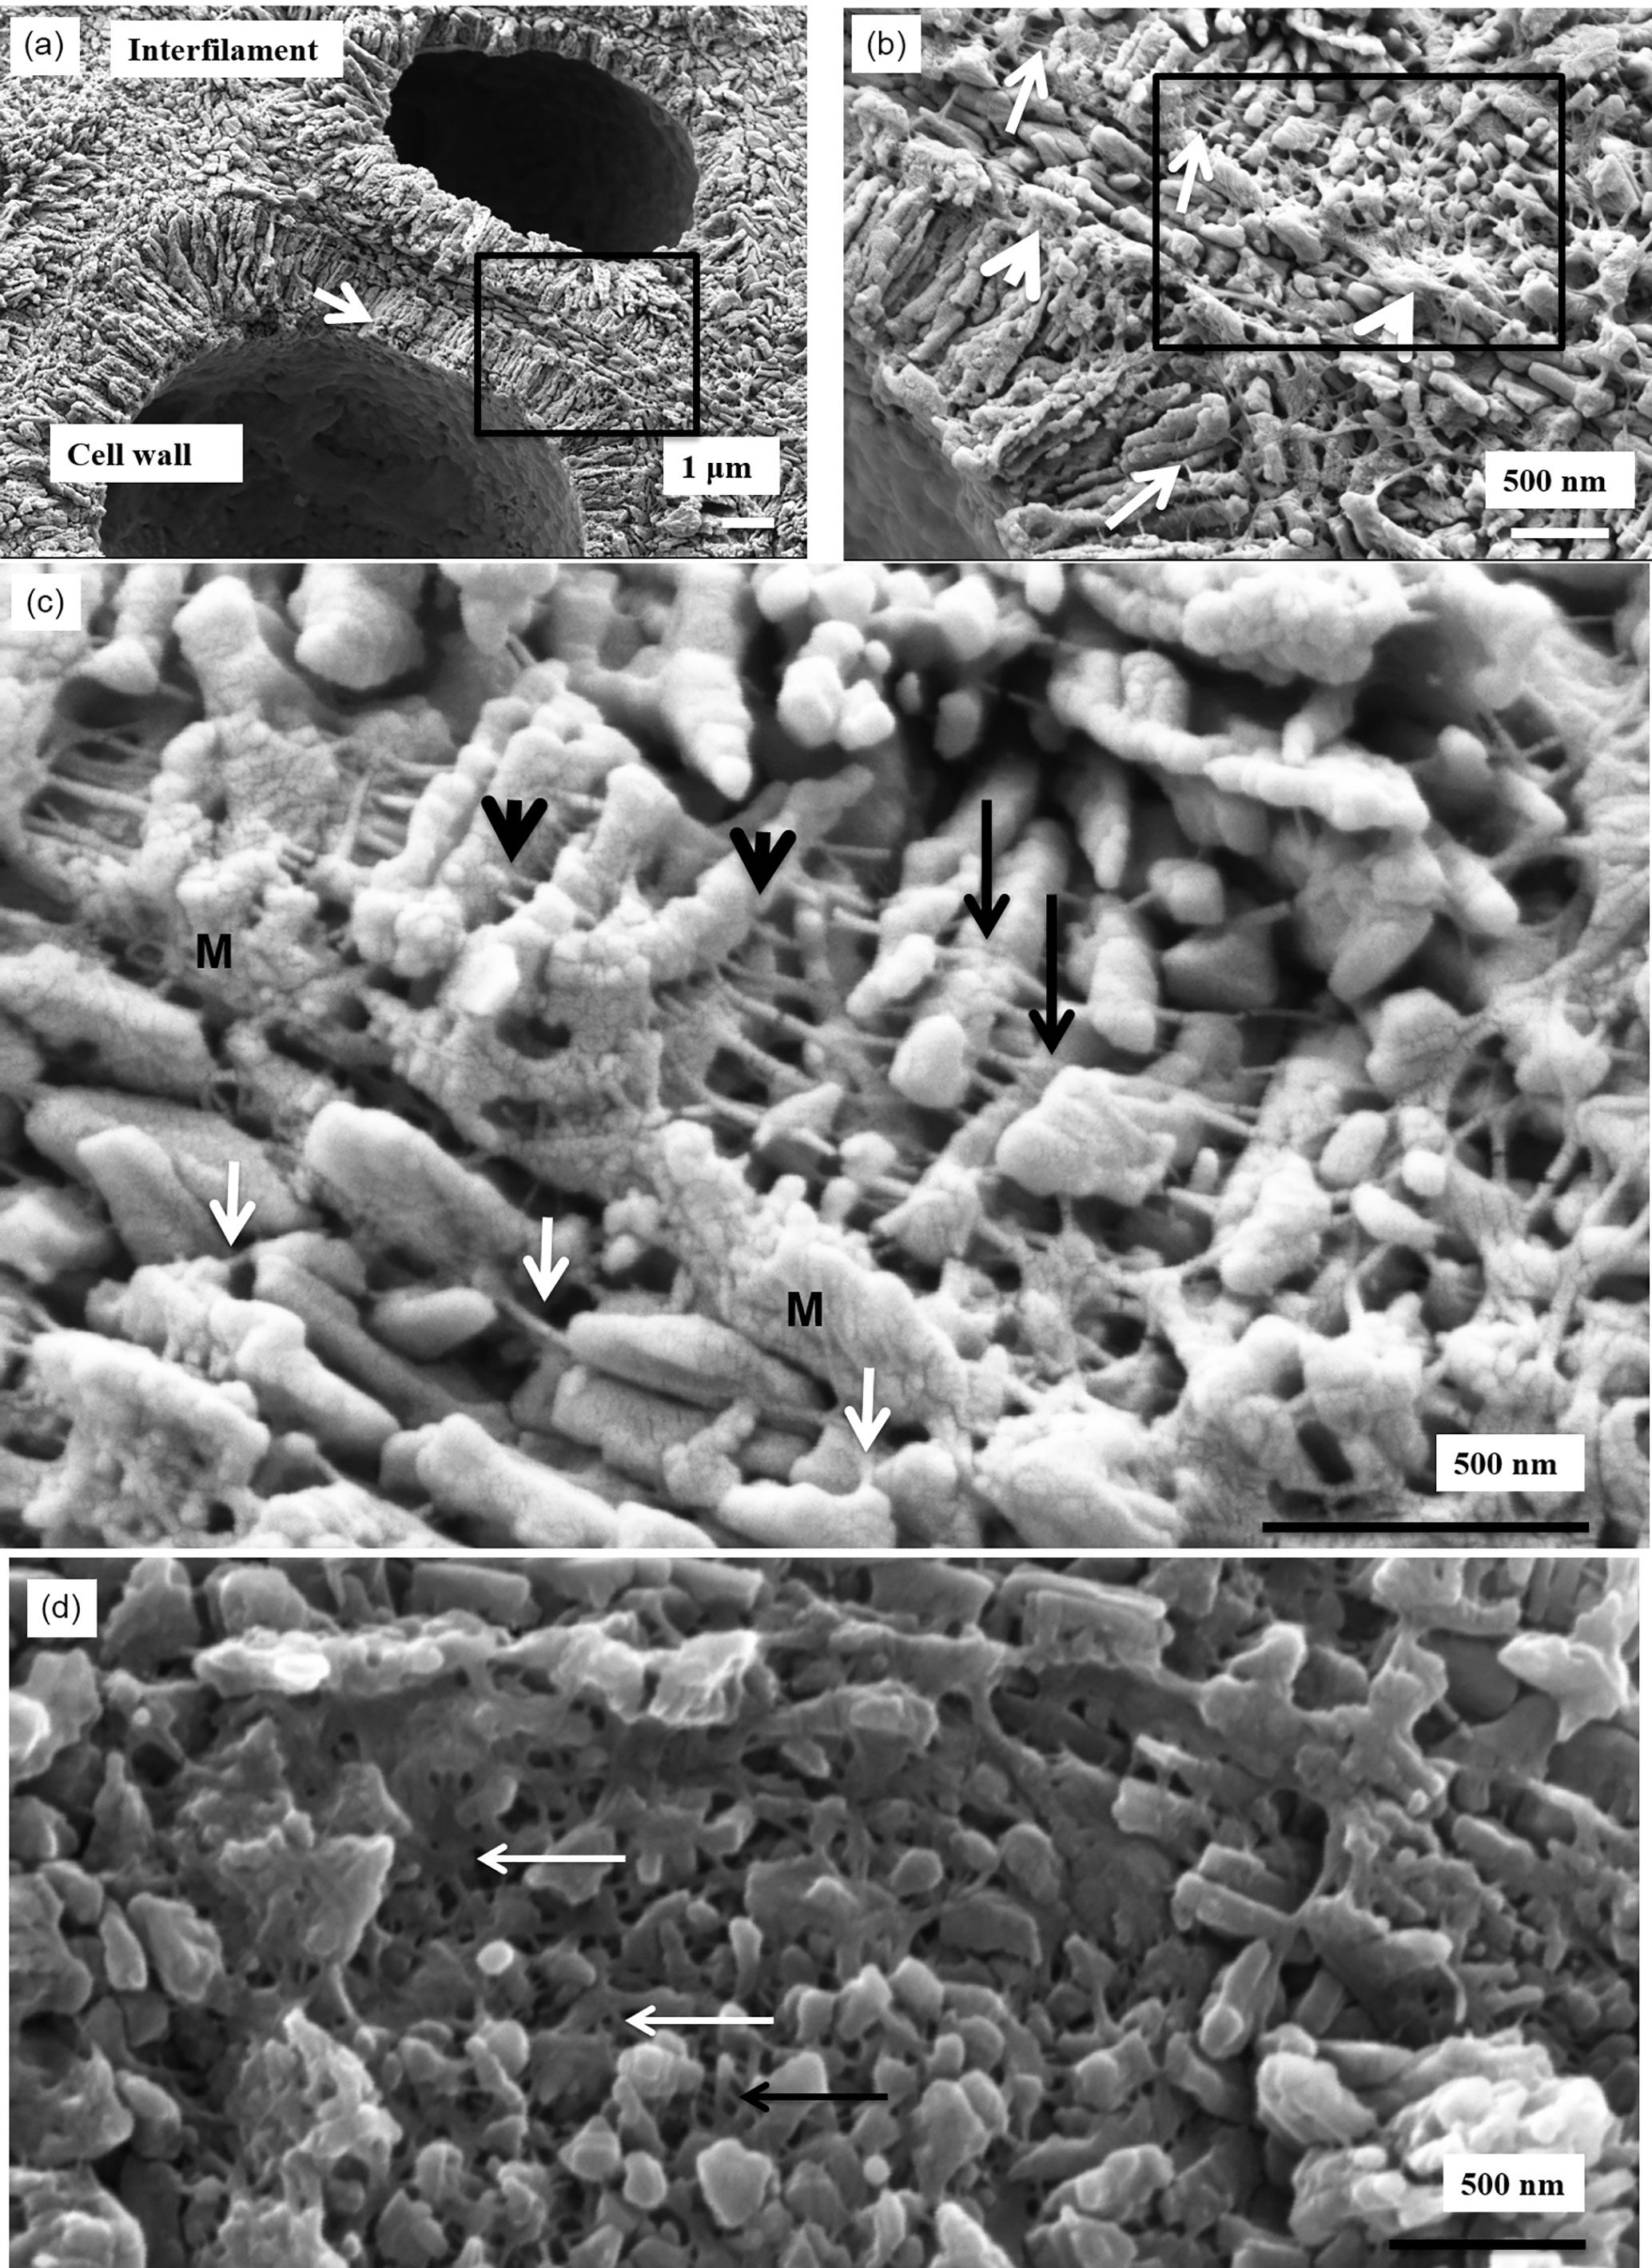
Figure 7K. epilaeve cell wall structure. Crust polished and cleaned for 2 min. (a) Cell walls have radial Mg-calcite, whereas the interfilament grains are orientated either parallel to the filament axis or randomly within the corner junctions. Within the radial cell walls a secondary concentric banding pattern is visible (white arrow). Black box enlarged in (b). (b) Organic fibrils, ∼ 10 nm wide, run parallel to cell wall edges (black arrows). Fibrils are concentrated along the outer of the cell wall (white arrows). Black box enlarged in (c). (c) The cell wall fibrils appear to string through the centre of the radial grains (black arrowheads); other fibrils drape over the grains (black arrows). Fibrils are present in the interfilament (white arrows). M – mineralised membrane. (d) Plan view of cell wall grains. Organic fibrils form a dense mesh (white arrows).
Similar features are visible in the L. laeve PCW (Fig. 8a, b), although the organic fibrils are not as well exposed. Possibly, these cell wall grains are less susceptible to dissolution in the etching treatment, making it more difficult to expose the organic features. The radial cell wall grains appear anchored to the external edge of the cell wall, immediately adjacent the interfilament.
After etching for 20 min, more of the organic fibrils are exposed in the K. epilaeve interfilament (Fig. 9a), revealing a porous membrane. PIF grains have angular edges in contrast to the rounded sides of the cell wall grains. The L. laeve perithallial interfilament has rice-grain-shaped Mg-calcite flattened against the external side of the cell wall (Fig. 9b) with attachment fibrils. Fibrils are visible stretching between the flattened interfilament grains on adjacent cells (Fig. 9c).
Hypothallial cell walls at 200–500 nm wide are much thinner than perithallial cell walls (Fig. 10a–c). The HCW internal structure appears roughly radial (Fig. 10a–c). However, the radial structure is not always well developed, with parts of the HCW exhibiting a distinct break down the middle of the radial structures (Fig. 10c). There are fibrils parallel to the cell wall appearing to go through the wall grains, similarly to the perithallial cell walls. Interfilament grains are present, as in perithallial cells (Fig. 10b, c). The HCW wall can have two clearly defined morphologies (Fig. 10c). The wall adjacent to the interfilament is narrowest at ∼ 200 nm, has closely spaced organic fibrils, and is poorly calcified compared to the inner part of the wall (300–400 nm wide) and appears more like a mineralised membrane. The wider inner part of the cell wall has radial grains but without the well-defined shape of the PCW radial grains. Similar to the perithallial cell walls, there are fibrils appearing to thread through the hypothallial cell wall grains.
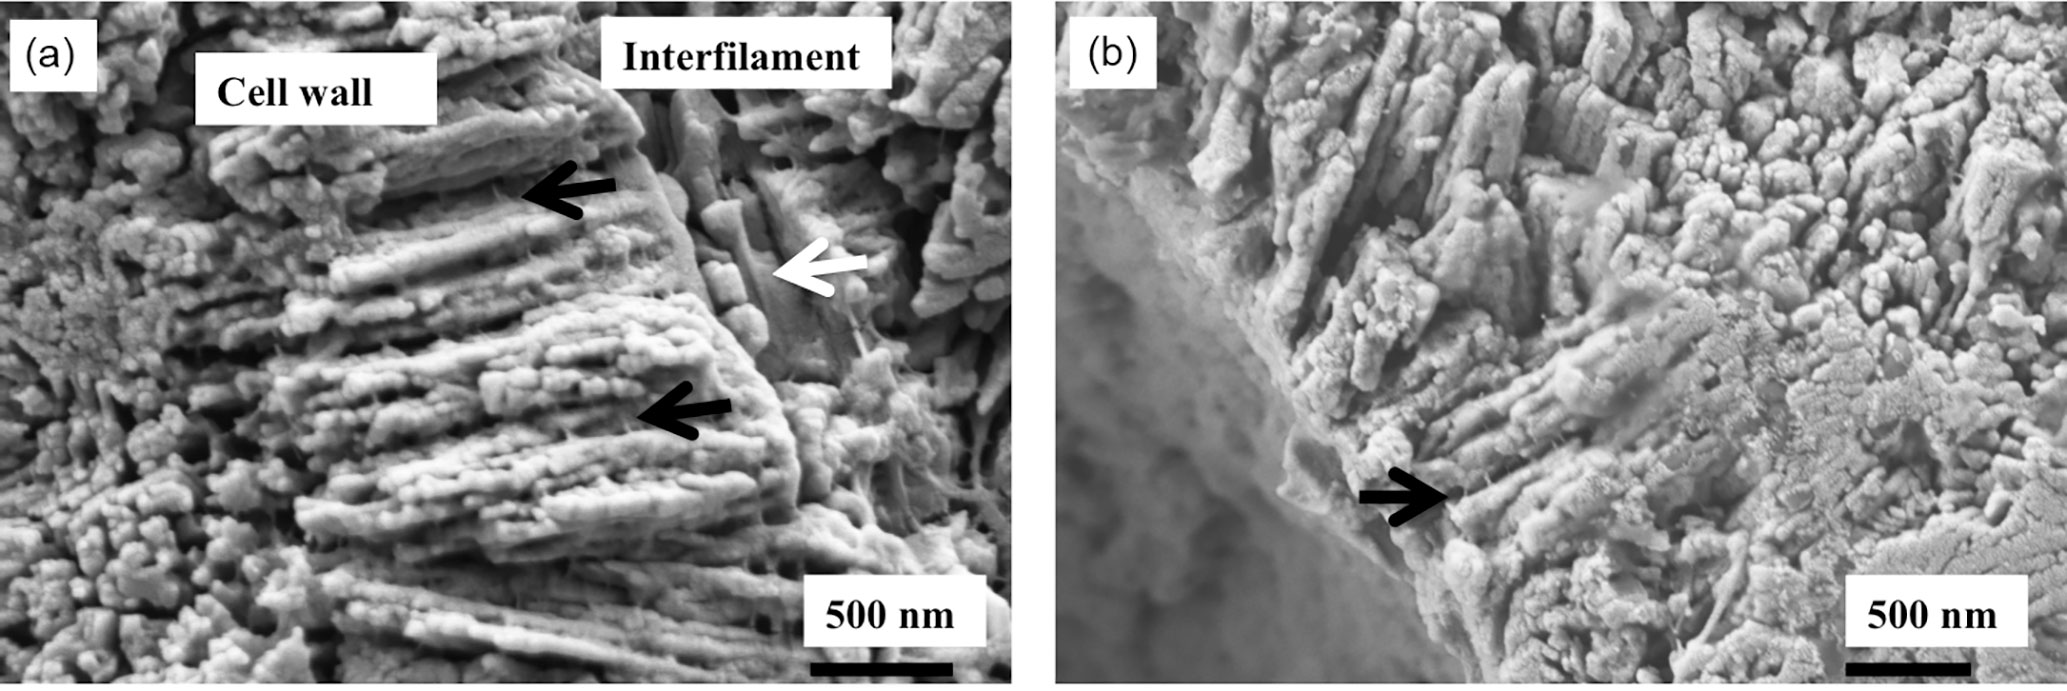
Figure 8L. laeve cell wall structure. (a) Cleaned for 2 min. Cell wall radial crystals are 1.5 µm length cylindrical grains. Fibrils are present (black arrows) but not as easy to see as in the K. epilaeve. Interfilament grains parallel to cell wall, with organic fibrils (white arrows) also running parallel to cell wall. (b) Etched for 20 min. Fibrils appear similarly to in the K. epilaeve with the fence post-wire structure (black arrows).
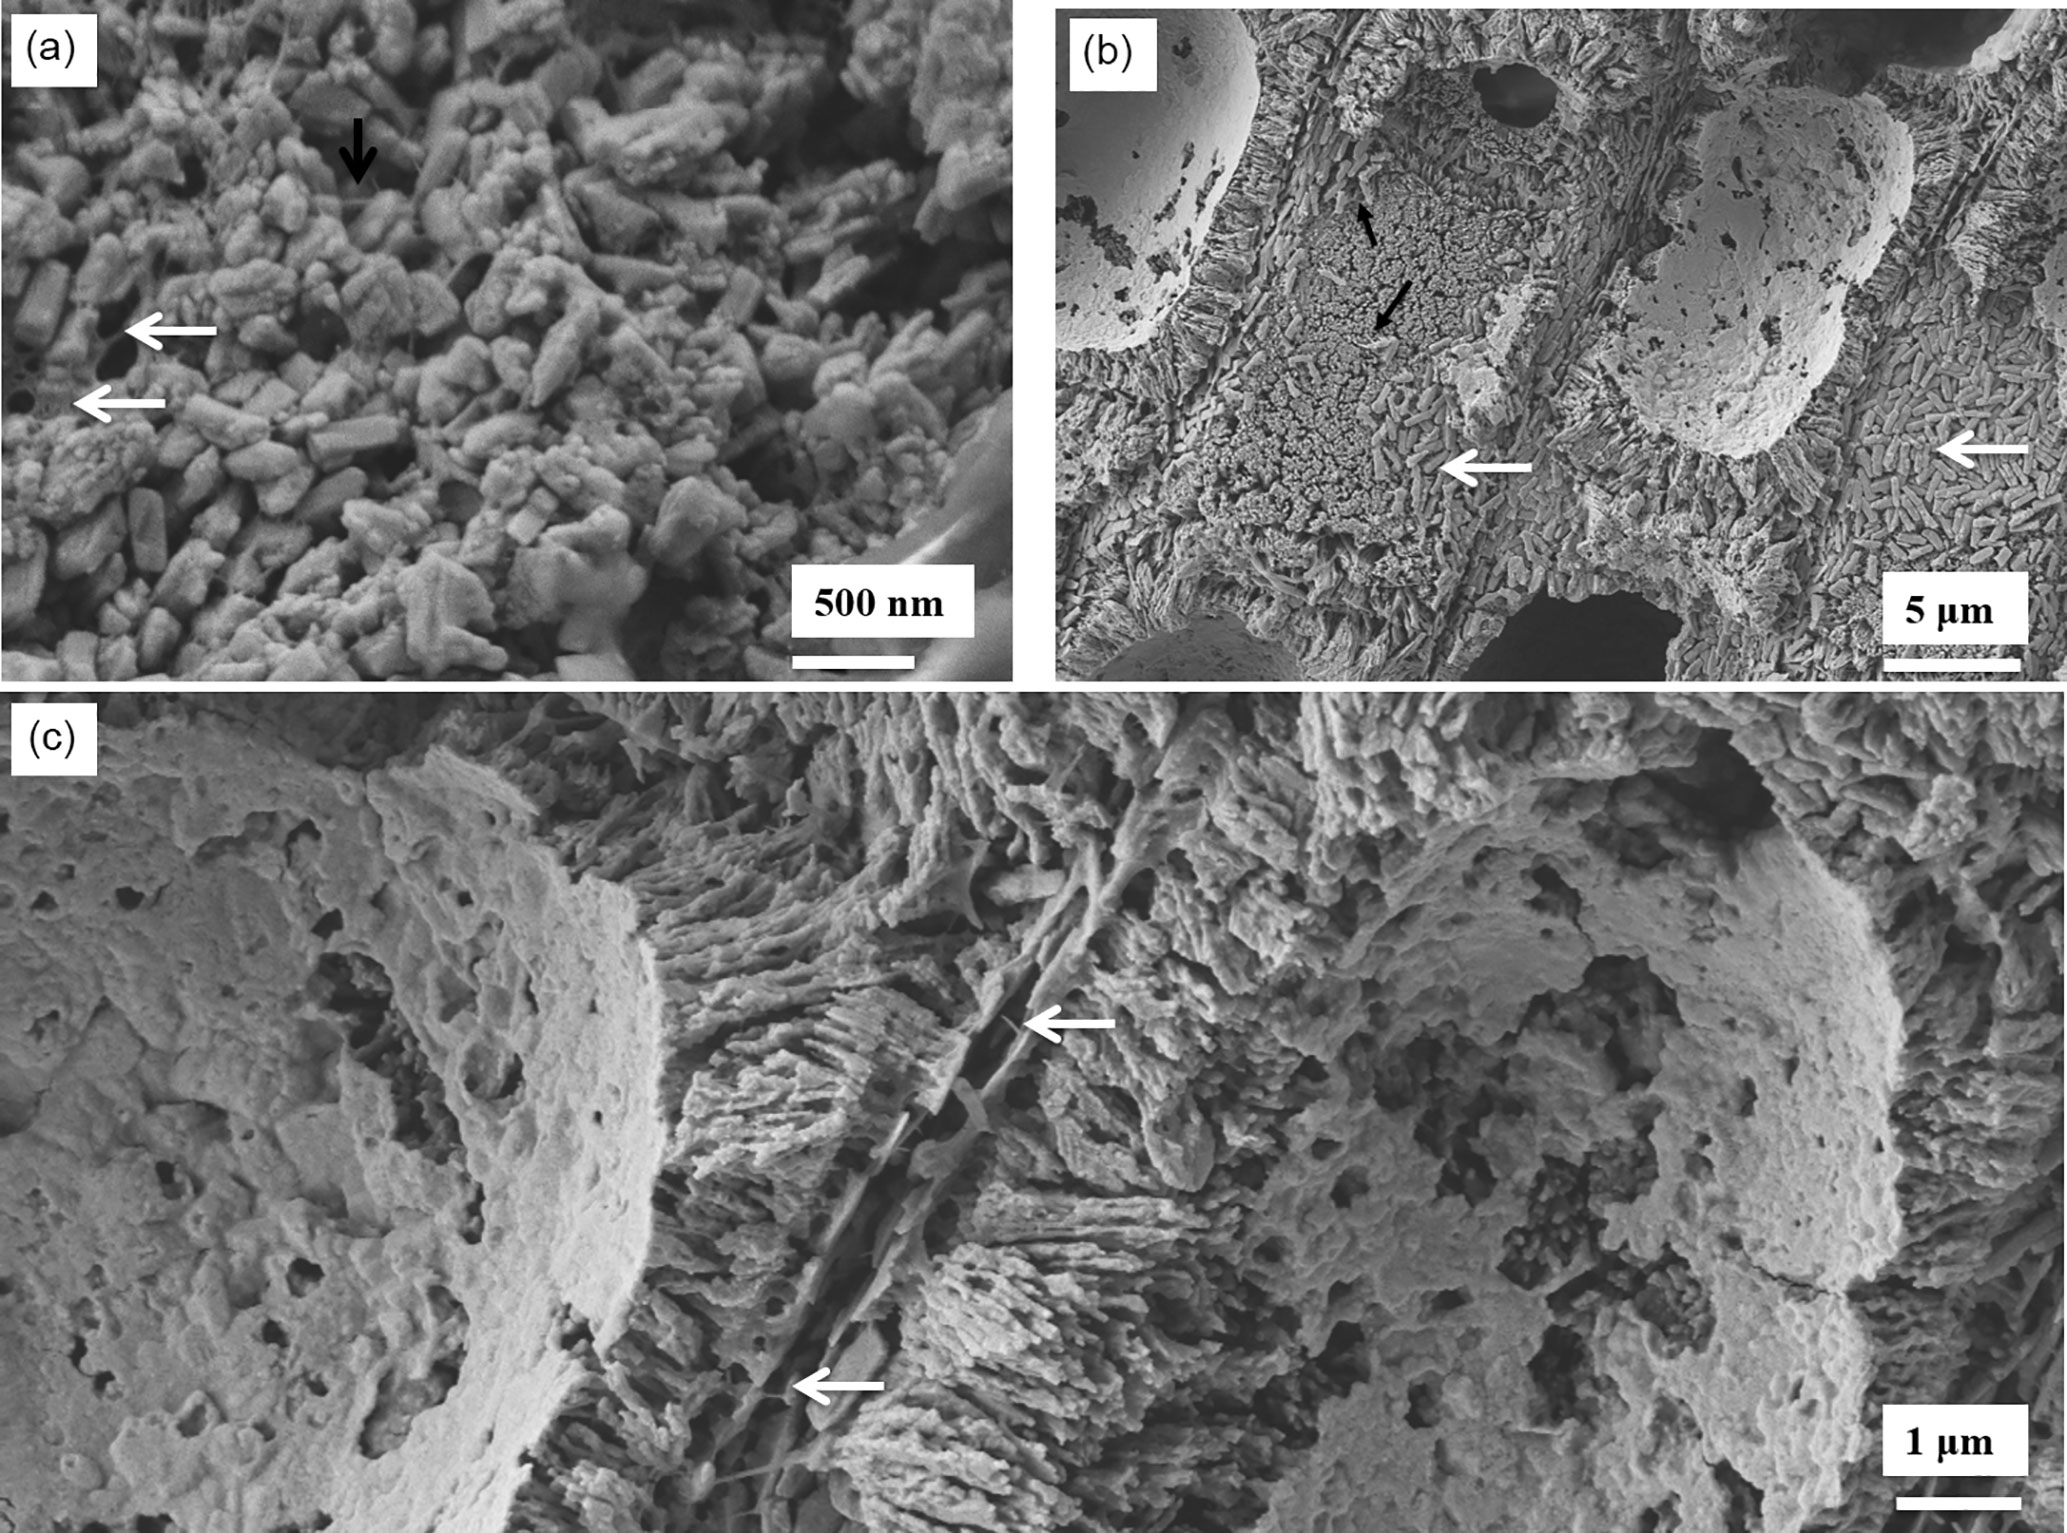
Figure 9Interfilament structures in K. epilaeve (a) and L. laeve (b, c). (a) K. epilaeve etched for 20 min. Fibrils (black arrow) and porous membrane (white arrows). (b) L. Laeve etched for 20 min. Interfilament grains are flattened against the external sides of the cell wall (white arrows) attached by fibrils (black arrows). (c) Fibrils visible stretched across the space between cell walls with two layers of interfilament grains (white arrows).
The transitional cells between the hypothallus and perithallus have features from both types present (Fig. 10d). The cell walls can be narrow, < 200 nm, and poorly mineralised, similarly to the outer part of the hypothallial cell wall. Parts of the cell wall resemble the perithallial cell walls, with radial grains and wall width of nearly 1 µm, although along the same wall this changes to ∼ 200 nm wide and a poorly mineralised membrane. The parallel fibrils are also present within the transitional cell walls. Interfilament grains are present comparably to those between hypothallial and perithallial cells.
6.1 Site temperature, ecology, and growth
The site of collection for this specimen (Fig. 1a) is a pavement of coralline-encrusted, roughly flat to ovoid shells and pebbles often with dish shapes. Many of these, such as the specimen employed in this study, have a concave surface (due to the original mollusk shape). The benthic surface that we show in Fig. 1b is likely quite stable with time in the moderate reversing tidal current environment of the site. The conceptacles of L. laeve, requiring considerable solar energy for construction, all appear on the upper side of the specimen and further assist our determination of orientation. Since the sea ice does not clear the area until late June or early July, solar energy has already peaked by the time the benthos at 15–17 m receives significant light. Effectively, the growing season is July through November, and with a mean growing season temperature of < 2 ∘C. Based on the lateral growth rates (5–7 µm day−1) found by Adey (1970), a season of lateral growth would provide less than 1 mm of extension. As we discuss below, the vertical growth in this species is slower than the lateral growth. The layering seen in Fig. 2b likely represents 4–5 years of vertical growth. At 80–100 µm of perithallial addition per year, this relates well to the 100–200 µm yr−1 found with extensive data in the same region for Clathromorphum compactum (Adey et al., 2015b).
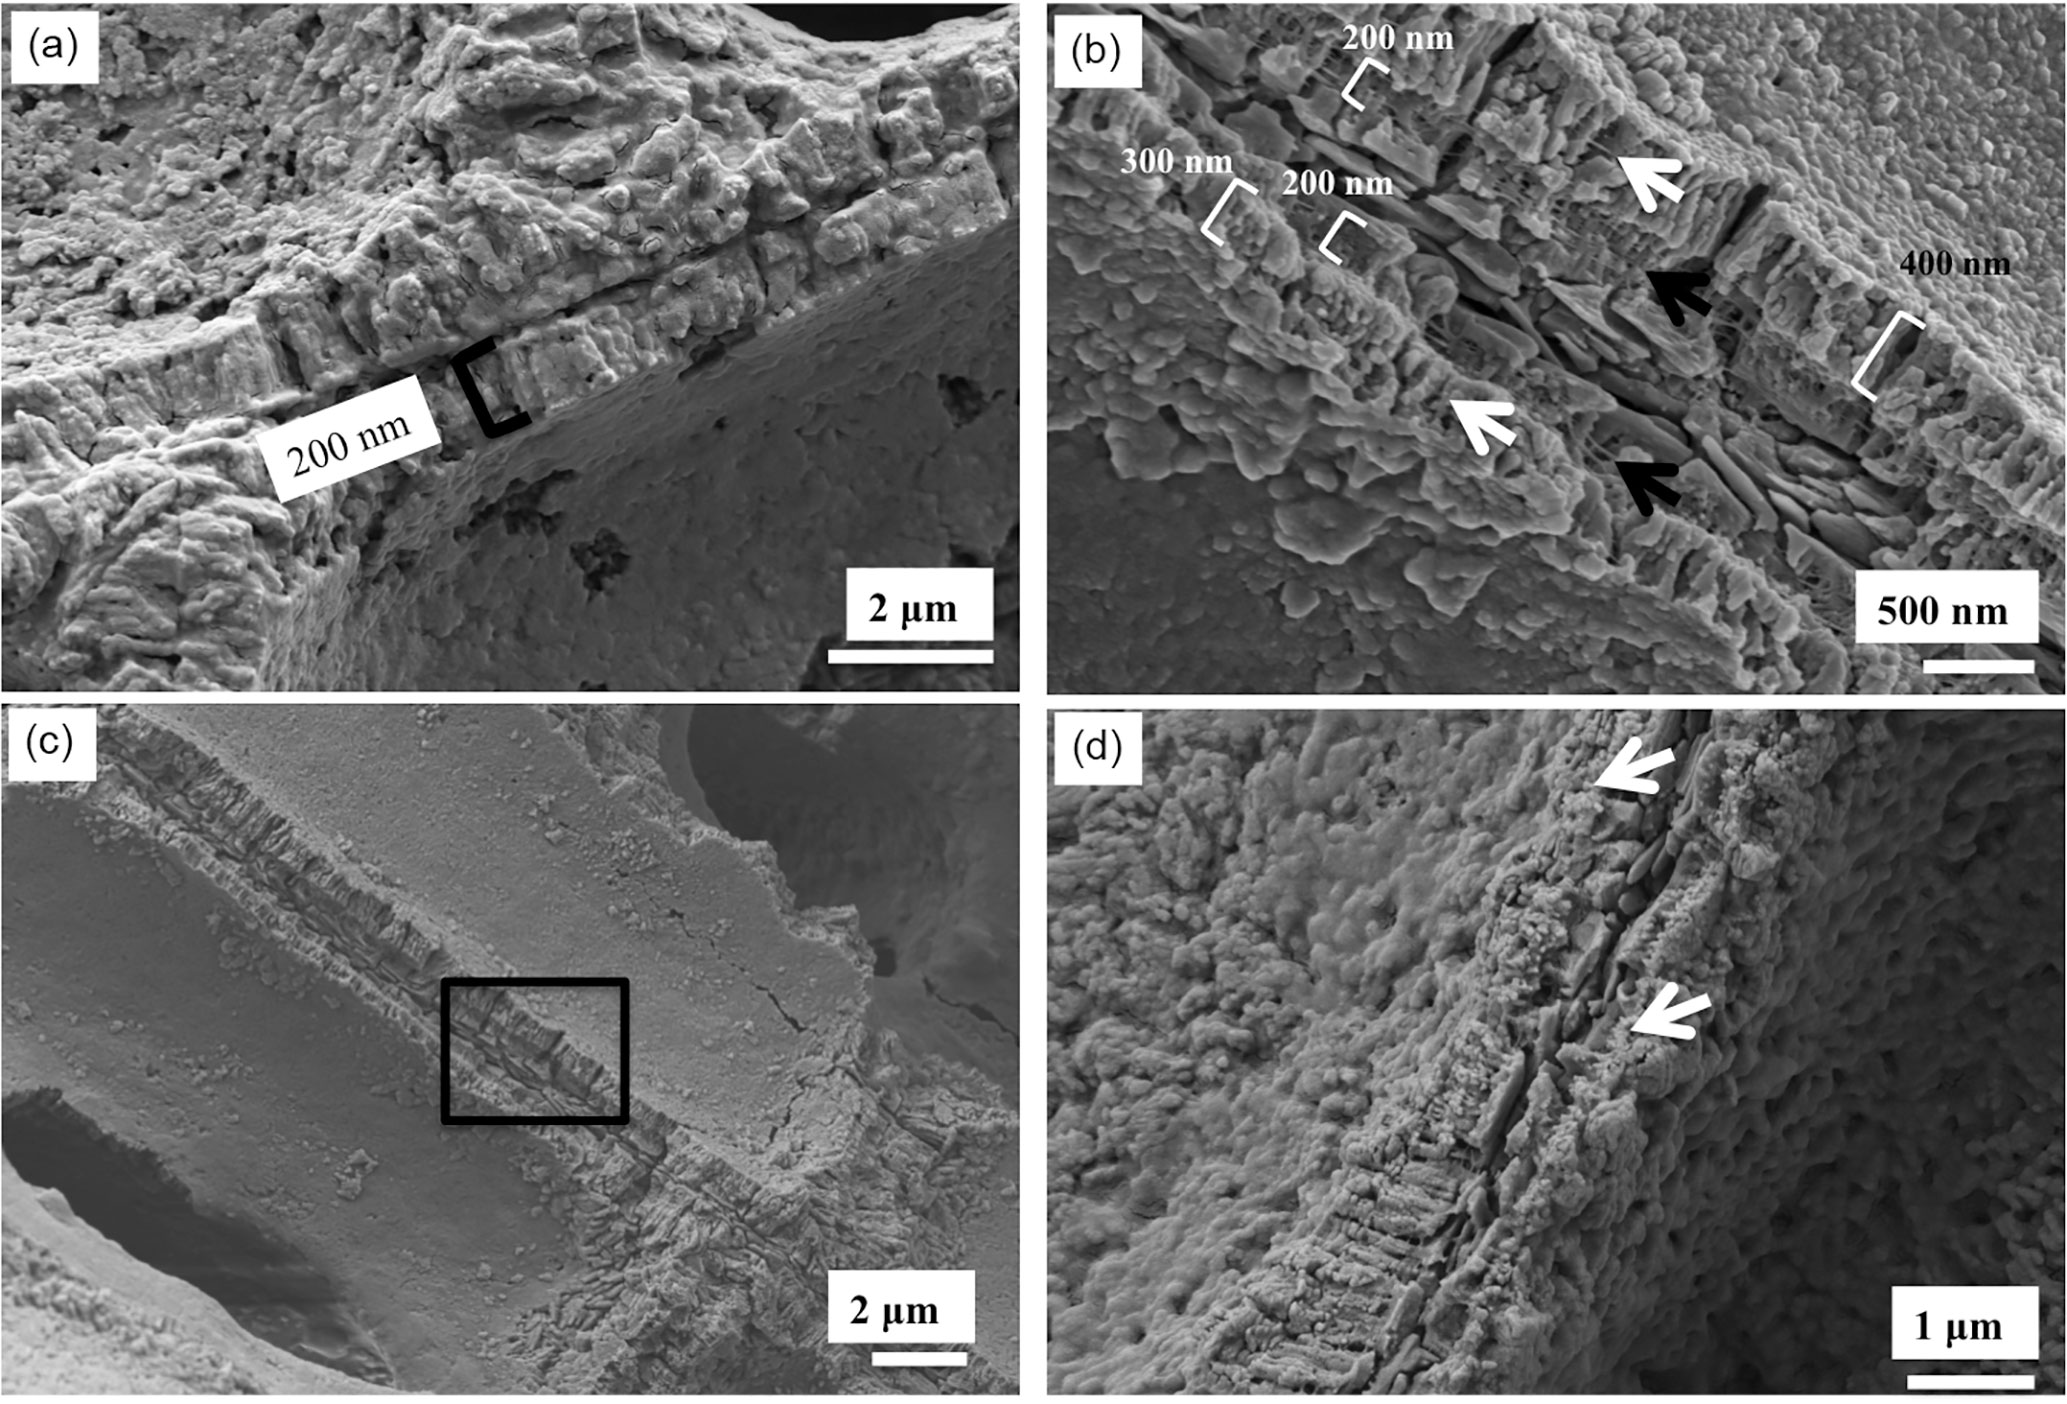
Figure 10Hypothallus and transitional cells in L. laeve. Cleaned 2 min. (a) Hypothallus underside. Organic film covering wall structures. Walls ∼ 200 nm wide, roughly radial structure within cell wall. (b) Cleaned 2 min, hypothallus in upper crust. Roughly radial structure within cell walls. Black box enlarged in (c). (c) The wall adjacent to the interfilament is narrowest at ∼ 200 nm, has closely spaced organic fibrils (black arrows) and is poorly calcified compared to the inner part of the wall (300–400 nm wide) where radial grains are present. There are fibrils parallel to the cell wall appearing to go through the wall grains similarly to the perithallial cell walls (white arrows). (d) Transitional cell wall. The calcification in the lower of the left side wall is comparable to the perithallial cell wall with radial grains. The right side wall and upper part of the left side (white arrows) are poorly calcified and appear as a calcified membrane rather than a properly developed cell wall.
Considering that Leptophytum laeve crusts can be many centimetres broad and rarely exceed 500 µm in thickness, except by overgrowing of earlier crusts, it can be assumed that, after initial formation, upwards perithallial growth is very slow, perhaps limited by the development of conceptacles for which considerable photosynthate must be dedicated. L. laeve is a deep water species (Adey 1966a, b; Adey and Sperapani, 1971) and requires little solar energy to grow and carry out its life cycle; however, as shown by Adey (1970), the rate of hypothallial extension falls with light reduction, and it would be expected that growth on the underside of a shell-encased fragment would be present but less than that on the upper surface.
6.2 Temperature and magnesium
One of the challenges using samples collected at a single point in time is that the growth history cannot always be precisely tied to previous points in time and temperature. As discussed in the previous section, this crust likely represents 4–5 years of growth. Thus, the XRD mol % MgCO3 is an average for that period. The individual EDS measurement spots cannot be tied to a particular time of year or temperature. However, the annual temperature range is not large, estimated to be ∼ 4 ∘C across the growing season.
The XRD Mg content is within the range for average winter and summer Mg contents for Clathromorphum compactum collected from Arctic Bay, Kingitok, and Quirpon (Halfar et al., 2011, 2013). The EDS-determined average Mg content for each carbonate type had a range of 7.6 mol % MgCO3, from 9.1 (K. epilaeve interfilament) to 16.7 mol % MgCO3 (L. laeve upper crust hypothallus). The L. laeve upper hypothallus has 84 % more Mg than the K. epilaeve interfilament. Although the exact time and temperature of formation for each component is not known, the temperature range (∼ 4 ∘C) alone is highly unlikely to explain the Mg difference. Studies on Mg content in CCA for temperature proxies have used regressions with temperature records to determine a range of responses from 0.266 mol % (Williamson et al., 2014), ∼ 1.0 (Halfar et al., 2000; Darrenougue et al., 2013) to 1.76 mol % MgCO3 (Kamenos et al., 2008) per degree Celsius of temperature increase. Only the Kamenos et al. (2008) calibration is close to explaining the range here. However, that calibration was for branches of the rhodolith Lithothamnion glaciale. Using temperature calibrations for crust CCA in experimental treatments, where temperature was the only condition changed (Diaz-Pulido et al., 2014; Nash et al., 2016), a calibration of 0.33 mol % ∘C−1 is obtained. This rate is in agreement with results from Williamson et al. (2014), Chave and Wheeler (1964), and Adey (1965). Using 0.33, a shift of 7.6 mol % equates to 23 ∘C of change, nearly 4 times greater than the maximum annual range at this site. The magnesium offsets in different parts of the crust are clearly aligned to anatomical features and not controlled by temperature. This proposal is supported by recent results for species of CCA Phymatolithon that also demonstrated anomalously higher Mg in hypothallial cells across four species collected from differing locations (Nash and Adey, 2017). Within these offsets there may still be a response to temperature over the seasons, but it was beyond the capacity of this study to investigate seasonal changes. It is noteworthy that the upper crust hypothallus average of 16.7 mol % MgCO3 is equivalent to new surface crust of tropical Porolithon onkodes grown at 30 ∘C (Diaz Pulido et al., 2014).
6.3 Structural features
There are three main types of calcified structures within the vegetative tissues of Leptophytum laeve and Kvaleya epilaeve: (1) the radial Mg-calcite within the cell walls of the perithallium, (2) the interfilament in both the perithallium and hypothallium, and (3) the thin hypothallial cell walls. Each has distinctively different features and magnesium content. The more elongate (and thinner-walled) cells of the hypothallus have been reported for other species of Melobesioideae (Adey, 1964, 1965, 1966a). However, this is the first study to show that the internal cell wall Mg-calcite structures and their magnesium content differs from perithallial cell wall. Probably, these thinner elongated hypothallial cell walls are a result of relatively rapid growth during lateral extension. There are numerous examples documenting higher Mg in parts of crusts that have grown faster during the warmer seasons (e.g. Clathromorphum compactum and C. nereostratum by Adey et al., 2013). In this case the Mg increase is associated with anatomical change, not temperature. The mechanistic process by which more Mg is incorporated into the HCW and how this relates to growth rate is not known. The K. epilaeve perithallial cells had lower Mg than the L. laeve perithallial cells. Cabioch and Giraud (1986) described the perithallial cells as being a later stage of development than epithallial cells. Epithallial cells do not have fully developed rounded cell walls of the perithallial cells (Adey, 2015a, b). Although Mg content of epithallial carbonate is lower than the perithallial values (Diaz-Pulido et al., 2014; Nash et al., 2015, 2016), the lower Mg measured here is not considered a result of different cell type as the K. epilaeve cell walls have the radial calcite similarly to the perithallial L. laeve, indicating that these are similarly well developed. Considering the time of collection in early summer, it is quite possible that the K. epilaeve growth closest to the L. laeve surface was laid down closer to winter and in cooler temperatures, this being a likely explanation for the lower Mg content.
6.4 Calcification and photosynthesis
The parasitic epiphyte K. epilaeve is not known to photosynthesise. The similarity of cell wall and interfilament features to those of the photosynthesising host, L. laeve, suggests that the precipitation of the Mg-calcite is not directly driven by photosynthesis as has been suggested for coralline algae (Ries, 2010) and demonstrated for calcifying green algae Halimeda, (e.g. Adey, 1998; Sinutok et al., 2012). Rather, considering also the evidence for continued calcification during the Arctic winter (Halfar et al., 2011; Adey et al., 2013), it seems likely the first control is the provision of the organic substrate that subsequently either becomes calcified or induces calcification. This does not negate the possibility of increased calcification as photosynthetic rates increase (e.g. Borowitzka, 1981).
6.5 Banding and magnesium uptake
The concentric banding of organic fibrils within the perithallial cell wall may offer insight into controls on Mg variation within the cell wall. The dominant visual morphological pattern is the radial Mg-calcite crystals. In contrast, other work indicates the dominant pattern of Mg distribution within the cell may be unrelated to the radial features. Concentric zonations of higher Mg content have been shown, using backscatter electron imaging, in cell walls of tropical Porolithon onkodes (Nash et al., 2011). Ragazzola et al. (2016), using NanoSIMS, also showed clear concentric banding of Mg within summer cell walls of Lithothamnion glaciale. These published observations together with the results in this study suggest there could be a strong organic control on Mg distribution within the cell, with this being related to the concentric fibrils. Possibly the fibril organics enable higher Mg incorporation than the organics involved in the radial structures. Ragazzola et al. (2016) further documented a decreased prominence of Mg banding in winter cells of L. glaciale and for those grown in CO2-enriched conditions. Results from our study offer an insight as to possible temperature or CO2-driven ultrastructure changes that may result in decreased Mg content. If the banded fibrils observed in this study are normally similarly present in the L. glaciale, then an absence of the Mg bands for their winter and elevated CO2 treatment suggests that these fibrils could either be absent or the organic structure or composition has changed and no longer enables elevated Mg.
6.6 Relevance to climate archiving
This study has several implications for climate archiving using corallines. Most importantly, anatomical controls can override temperature influences on Mg composition. We do not suggest current studies are inadequate because the finer-scale (submicron) variations are not captured. These fine-scale variations will not change the general trends or conclusions. Rather, we suggest caution regarding interpretation of data where a change in Mg is visibly associated with a change in cell type as temperature may not be the only possible driver of Mg change. While hypothallial areas can usually be easily excluded from most climate archiving (but see Bougeois et al., 2015), less obvious anatomically different tissues such as the elevated Mg transitional cell walls may not be noticeable at low magnification. This may lead to a false positive result identifying such a region as reflecting a time of higher temperature. As well as these tissue-scale differences, the cellular-scale differences may also need to be considered. Any seasonal change in relative proportion of CW to IF can shift the [Mg] in the absence of any temperature-influenced change. For example if CW = 10 mol % MgCO3 and IF = 8 mol % MgCO3, and crust changes from 90:10 CW : IF to 50:50, this would equate to a change in of 9.8 to 9 mol % for measurements of bulk crust (i.e. spot sizes larger than the cell size, or smaller spot sizes averaged without reference to their anatomical placement). This change equates to a 2–3∘ using a temperature calibration of 0.33 mol % MgCO3 ∘C. Should the difference in cell wall and interfilament mol % MgCO3 be larger, then the total average will change more substantially. Furthermore, the bulk magnesium results for different CCA species with differing proportions of cell wall : interfilament from the same temperature environments will have a range of non-temperature-related Mg content that is controlled by the cell wall : interfilament. This change in structure, if seasonally correlated, will be indirectly related to temperature, but there may be other influences such as light. For example, CCA continue to grow in darkness using stored photosynthates, after ice sheets have formed above (Halfar et al., 2013); however, it is not known whether a switch to using stored energy results in any anatomical changes. If there were changes, these would only be indirectly related to temperature. More recently Sletten et al. (2017) found anatomical changes (banding) in Lithothamnion rhodoliths were unrelated to temperature and proposed these were driven by differences in light exposure. Thus, the best CCA temperature climate archives, as compared to seasonal archives, are likely to be those with the least seasonally varying ultrastructure changes.
Understanding the combined contribution of anatomical and temperature changes to measured magnesium may help explain the variation of Mg-temperature calibrations in the published literature. Typically it is the rhodoliths that show the highest response of Mg to temperature, e.g. Lithothamnion glaciale at 1–1.76 mol % MgCO3 (Halfar et al., 2000; Kamenos et al., 2008) per degree Celsius of temperature increase compared to Clathromorphum compactum at 0.7 mol % MgCO3 (Halfar et al., 2010). The L. glaciale has distinct seasonal changes shifting to a clear band of elongated cells during summer. The rhodolith summer cells have similarities in appearance to the hypothallial cells in this study. Possibly the higher measured Mg in the long cells of the rhodolith is a result in part of a switch towards a more perithallial style cell and may not be entirely temperature-related. This proposition is supported by Sletten et al. (2017), who found a switch to elongated cells with higher Mg that was unrelated to seasonality. In contrast, anatomical changes in C. compactum (Adey et al., 2013) are not so extreme.
6.7 Suggestions for improving analytical methods
Our work is ongoing in this area of research and as more species and ultrastructures are studied we expect to be able to provide more detailed guidance on utilising Mg from CCA for climate proxies. However, in the interim, there are several steps that could be incorporated into routine analyses to improve the accuracy of Mg climate proxies. Firstly, it should become a routine part of analyses that the ultrastructure is assessed to determine whether the ratio of cell wall to interfilament carbonate changes regularly with seasons. Second, when possible, in addition to the larger spot sizes used in sampling transects, e.g. 10–20 µm, make discrete spot analyses using the smallest reliable interaction volume possible to determine indicative Mg offsets between the cell wall and interfilament so that this can be adjusted for if necessary, in the final interpretation. Third, ensure that hypothallial growth is not included in sampling transects. Usually the basal hypothallus is easily avoided, but secondary hypothallus and transitional cells may be harder to avoid without careful SEM analysis.
It appears that, within CCA, there is a strong control on the uptake of Mg in relation to the different anatomical components. This is in contrast to the suggestion by Ries (2010), based on Mg : Ca in seawater manipulation experiments, that corallines exert little or no control over their Mg uptake other than to specify the polymorph. Recent work indicates that the interfilament and perithallial carbonate react similarly to temperature, but the responsive hypothallial carbonate is inconclusive (Nash and Adey, 2017). It would be interesting to identify whether each of interfilament, perithallial and hypothallial cell walls reacted similarly to changes in seawater Mg : Ca, or whether there were differences in anatomical controls. Crucially, it is necessary to keep in mind the biological controls on Mg uptake when using CCA Mg changes as a climate proxy.
While the focus of this study has been the distribution of Mg with different anatomical features, the high-magnification images are the first to show the cellular-scale organic structures together with the carbonate components. The orientation of the crystals in the interfilament and the cell walls are in agreement with lower-magnification SEM studies on a range of algal species (Cabioch and Giraud, 1986; Adey et al., 2013). The combination of gentle etching and high-magnification SEM has revealed previously unknown features such as the fibrils threading through the radial Mg-calcite (Fig. 7c). Further, showing that the Mg content varies with anatomical features suggests that the calcification may be a different process, or have different controls, for each carbonate type. This adds an extra level of complexity when considering how environmental changes, such as increasing temperature, may impact on the capacity of the CCA to continue their important substrate provision ecological role.
All data are provided in the paper.
The authors declare that they have no conflict of interest.
Thanks to the Centre for Advanced Microscopy at the Australian National
University and the Mineral Sciences department at the Smithsonian
Institution for assistance with SEM-EDS.
Edited by: Lennart de Nooijer
Reviewed by: Jan Fietzke and Annalisa Caragnano
Adey, W.: The Genus Phymatolithon in the Gulf of Maine, Hydrobiologia, 24, 377–420, 1964.
Adey, W.: The Genus Clathromorphum in the Gulf of Maine, Hydrobiologia, 26, 539–573, 1965.
Adey, W.: The Genera Lithothamnium, Leptophytum (nov. gen.) and Phymatolithon in the Gulf of Maine, Hydrobiologia, 28, 321–368, 1966a.
Adey, W.: The Genus Pseudolithophyllum in the Gulf of Maine, Hydrobiologia, 27, 479–597, 1966b.
Adey, W.: The Distribution of Saxicolous Crustose Corallines in the Northwestern North Atlantic, J. Phycol., 2, 49–54, 1966c.
Adey, W.: The Effects of Light and Temperature on Growth Rates in Boreal–Subarctic Crustose Corallines, J. Phycol., 6, 269–276, 1970.
Adey, W.: Temperature Control of Reproduction and Productivity in a Subarctic Coralline Alga, Phycologia, 12, 111–118, 1973.
Adey, W.: Coral Reef Morphogenesis: A Multidimensional Model, Science, 202, 831–837, 1978a.
Adey, W.: Algal Ridges of the Caribbean Sea and West Indies, Phycologia, 17, 361–367, 1978b.
Adey, W.: Coral Reefs: algal structured and mediated ecosystems in shallow, turbulent alkaline seas, J. Phycol., 34, 393–406, 1998.
Adey, W. and McKibbin, D.: Studies of the Maerl Species of the Ria de Vigo, Bot. Mar., 8, 100–106, 1970.
Adey, W. and Sperapani, C.: The Biology of Kvaleya epilaeve, A New Parasitic Genus and Species of Corallinaceae, Phycologia, 10, 29–42, 1971.
Adey, W. and Vassar, J. M.: Colonization, Succession and Growth Rates of Caribbean Crustose Corallines, Phycologia, 14, 55–69, 1975.
Adey, W., Masaki, T., and Akioka, H.: Ezo epiyessoense, A New Parasitic Genus and species of Corallinaceae, Phycologia, 13, 329–344, 1974.
Adey, W., Chamberlain, Y., and Irvine, L.: A SEM-Based Analysis of the Morphology, reproduction and ecology of Lithothamnion tophiforme Unger (Corallinales, Rhodophyta), an Arctic coralline, J. Phycol., 41, 1010–1024, 2005.
Adey, W., Lindstrom, S., Hommersand, M., and Muller, K.: The biogeographic origin of Arctic endemic seaweeds: A thermogeographic view, J. Phycol., 44, 1384–1394, 2008.
Adey, W., Halfar, J., and Williams, B.: The coralline genus Clathromorphum Foslie emend Adey; biological, physiological and ecological factors controlling carbonate production in an Arctic/Subarctic climate archive, Smithsonian Contributions to the Marine Sciences, 40, 1–83, 2013.
Adey, W., Hernandez-Kantun, J. J., Johnson, G., and Gabrielson, P.: DNA sequencing, anatomy and calcification patterns support a monophyletic, Subarctic, carbonate reef-forming Clathromorphum (Hapalidiaceae, Corallinales, Rhodophyta), J. Phycol., 51, 189–203, 2015a.
Adey, W., Halfar, J., Humphreys, A. Belanger, D., Gagnon, P., and Fox, M.: Subarctic rhodolith beds promote longevity of crustose coralline algal buildups and their climate archiving potential, Palaios, 30, 281–293, 2015b.
Amado-Filho, G., Moura, R., Bastos, A., Salgado, L., Sumida, P., Guth, A., Francini-Filho, R., Pereira-Filho, G., Abrantes, D., Brasileiro, P., Bahia, R., Leal, R., Kaufman, L., Kleypas, J., Farina, M., and Thompson, F.: Rhodolith Beds are major CaCO3 bio-factories in the Tropical South West Atlantic, Plos One, 7, e35171, https://doi.org/10.7773/cm.v33i4.1148, 2012.
Bahia, R., Abrantes, D., Brasileiro, P., Pereira-Filho, G., and Amado-Filho, G.: Rhodolith bed structure along a depth gradient on the northern coast of Bahia State, Brazil, Braz. J. Oceanogr., 58, 323–337, 2010.
Barnes, D. J. and Lough, J. M.: On the nature and causes of density banding in massive coral skeletons, J. Exp. Mar. Biol. Ecol., 167, 91–108, 1993.
Bentov, S. and Erez, J.: Novel observations on biomineralization processes in foraminifera and implications for Mg/Ca ratio in the shells, Geology, 33, 841–844, 2005.
Borowitzka, M. A.: Photosynthesis and Calcificaton in the Articulated Coralline Red Algae Amphiroa anceps and A. foliacea, Mar. Biol., 62, 17–23, 1981.
Bougeois, L., Williams, B., Halfar, J., Konar, B., Adey, W., Kronz, A., and Wortmann, U. G.: Does the coralline alga Leptophytum fœcundum (Kjellman) capture paleoenvironmental variability in the Arctic Ocean?, Arct. Antarct. Alp. Res., 47, 375–387, 2015.
Cabioch, J. and Giraud, G.: Structural aspects of biomineralization in the coralline algae (calcified Rhodophyceae), in: Biomineralization in Lower Plants and Animals, 141–156, 1986.
Chave, K. and Wheeler, B.: Mineralogical changes during growth in the red alga Clathromorphum compactum, Science, 147, 621, https://doi.org/10.1126/science.147.3658.621, 1965.
Cox, T. E., Nash, M., Gazeau, F., Déniel, M., Legrand, E., Alliouane, S., Mahacek, P., Le Fur, A., Gattuso, J.-P., and Martin, S.: Effects of in situ CO2 enrichment on Posidonia oceanica epiphytic community composition and mineralogy, Mar. Biol., 164, 103, https://doi.org/10.1007/s00227-017-3136-7, 2017.
Darrenougue, N., De Deckker, P., Payri, C., Eggins, S., and Fallon, S.: Growth and chronology of the rhodolith-forming, coralline red alga Sporolithon durum, Mar. Ecol.-Prog. Ser., 474, 105–119, 2013.
Diaz-Pulido, G., Nash, M. C., Anthony, K. R., Bender, D., Opdyke, B. N., Reyes-Nivia, C., and Troitzsch, U.: Greenhouse conditions induce mineralogical changes and dolomite accumulation in coralline algae on tropical reefs, Nat. Commun., 5, https://doi.org/10.1038/ncomms4310, 2014.
Esau, K.: Plant Anatomy, John Wiley and Sons, New York, 735 pp., 1953.
Gamboa, G., Halfar, J., Hetzinger, S., Adey, W., Zack, T., B. Kunz, B., and Jacob, D.: Mg/Ca ratios in coralline algae as proxies for NW Atlantic temperature variations, J. Geophys. Res.-Oceans, 115, 1–12, 2010.
Halfar, J., Zack, T., Kronz, A., and Zachos, J. C.: Growth and high-resolution paleoenvironmental signals of rhodoliths (coralline red algae)- A new biogenic archive, J. Geophys. Res., 105, 22–107, 2000.
Halfar, J., Hetzinger, S., Adey, W., Zack, T., Gamboa, G., Kunz, B., Williams, B., and Jacob, D.: Coralline algal growth increment widths archive North Atlantic climate variability, Palaeogeogr. Palaeoecl., 302, 71–80, 2010.
Halfar, J., Adey, W., Kronz, A., Edinger, E., and Fitzhugh, W.: Unprecedented sea-ice decline archived by novel multi-century annual-resolution algal proxy, P. Natl. Acad. Sci. USA, 110, 197837–19741, 2013.
Harvey, A. S., Harvey, R. M., and Merton, E.: The distribution, significance and vulnerability of Australian rhodolith beds: a review, Mar. Freshwater Res., 68, 411–428, https://doi.org/10.1071/MF15434, 2016.
Hetzinger, S., Halfar, J., Kronz, A., Steneck, R. S., Adey, W., Lebednik, P. A., and Schone, B. R.: High-Resolution Mg/Ca Ratios in a coralline Red Alga As a Proxy for Bering Sea Temperature Variations from 1902–1967, Palaios 24, 406–412, 2009.
Kamenos, N., Cusack, M., and Moore, P. G.: Coralline Algae Are Global Paleothermometers with Bi-Weekly Resolution, Geochim. Cosmochim. Ac., 72, 771–779, 2008.
Kamenos, N. A. and Law, A.: Temperature controls on coralline algal skeletal growth, J. Phycol., 46, 331–335, 2010.
Krayesky-Self, S., Richards, J., Rahmatian, M., and Fredericq, S.: Aragonite infill in overgrown conceptacles of coralline Lithothamnion spp (Hapalidaceae, Hapalidiales, Rhodophyta): new insights in biomineralization and phylominerology, J. Phycol., 52, 161–173, 2016.
Martin, C. S., Giannoulaki, M., De Leo, F., Scardi, M., Salomidi, M., Knittweis, L., Pace, M. L., Garofalo, G., Gristina, M., Ballesteros, E., Bavestrello, G., Belluscio, A., Cebrian, E., Gerakaris, V., Pergent, G., Pergent-Martini, C., Schembri, P. J., Terribile, K., Rizzo, L., Ben Souissi, J., Bonacorsi, M., Guarnieri, G., Krzelj, M., Macic, V., Punzo, E., Valavanis, V., and Fraschetti, S.: Coralligenous and maërl habitats: predictive modelling to identify their spatial distributions across the Mediterranean Sea, Sci. Rep., 4, https://doi.org/10.1038/srep05073, 2014.
McCoy, S. J. and Kamenos, N. A.: Coralline algae (Rhodophyta) in a changing world: integrating ecological, physiological, and geochemical responses to global change, J. Phycol., 51, 6–24, 2015.
Nash, M. C. and Adey, W.: Multiple phases of mg-calcite in crustose coralline algae suggest caution for temperature proxy and ocean acidification assessment: lessons from the ultrastructure and biomineralisation in Phymatolithon (Rhodophyta, Corallinales), J. Phycol, 53, 970–984, https://doi.org/10.1111/jpy.12559, 2017.
Nash, M. C., Troitzsch, U., Opdyke, B. N., Trafford, J. M., Russell, B. D., and Kline, D. I.: First discovery of dolomite and magnesite in living coralline algae and its geobiological implications, Biogeosciences, 8, 3331–3340, https://doi.org/10.5194/bg-8-3331-2011, 2011.
Nash, M. C., Opdyke, B. N., Wu, Z., Xu, H., and Trafford, J. M.: Simple X-ray diffraction techniques to identify Mg calcite, dolomite, and magnesite in tropical coralline algae and assess peak asymmetry, J. Sediment Res., 83, 1085–1099, 2013a.
Nash, M. C., Opdyke, B. N., Troitzsch, U., Russell, B. D., Adey, W. H., Kato, A., Diaz-Pulido G., Brent, C., Gardner, M., Prichard, J., and Kline, D. I.: Dolomite-rich coralline algae in reefs resist dissolution in acidified conditions, Nat. Clim. Change, 3, 268–272, 2013b.
Nash, M. C., Uthicke, S., Negri, A. P., and Cantin, N. E.: Ocean acidification does not affect magnesium composition or dolomite formation in living crustose coralline algae, Porolithon onkodes in an experimental system, Biogeosciences, 12, 5247–5260, https://doi.org/10.5194/bg-12-5247-2015, 2015.
Nash, M. C., Martin, S., and Gattuso, J.-P.: Mineralogical response of the Mediterranean crustose coralline alga Lithophyllum cabiochae to near-future ocean acidification and warming, Biogeosciences, 13, 5937–5945, https://doi.org/10.5194/bg-13-5937-2016, 2016.
Ragazzola, F., Foster, L. C., Jones, C. J., Scott, T. B., Fietzke, J., Kilburn, M. R., and Schmidt, D. N.: Impact of high CO2 on the geochemistry of the coralline algae Lithothamnion glaciale, Sci. Rep.-UK, 6, 20572 https://doi.org/10.1038/srep20572, 2016.
Ries, J. B.: Review: geological and experimental evidence for secular variation in seawater Mg/Ca (calcite-aragonite seas) and its effects on marine biological calcification, Biogeosciences, 7, 2795–2849, https://doi.org/10.5194/bg-7-2795-2010, 2010.
Sinutok, S., Hill, R., Doblin, M. A., Kühl, M., and Ralph, P. J.: Microenvironmental changes support evidence of photosynthesis and calcification inhibition in Halimeda under ocean acidification and warming, Coral Reefs, 31, 1201–1213, 2012.
Sletten, H. R., Andrus, C. F. T., Guzmán, H. M., and Halfar, J.: Re-evaluation of using rhodolith growth patterns for paleoenvironmental reconstruction: An example from the Gulf of Panama, Palaeogeogr. Palaeocl., 465, 264–277, 2017.
Vásquez-Elizondo, R. M. and Enríquez, S.: Coralline algal physiology is more adversely affected by elevated temperature than reduced pH, Sci. Rep.-UK, 6, 19030, https://doi.org/10.1038/srep19030, 2016.
Wanamaker, A., Kreutz, K., Schone, B., Pettigrew, N., Borns, H., Introne, D., Belknap, D., Maasch, K., and Feindel, S.: Coupled North Atlantic slope water forcing on Gulf of Maine temperatures over the past millennium, Clim. Dynam., 31, 183–194, 2008.
Williamson, C. J., Najorka, J., Perkins, R., M. L. Yallop, M. L., and Brodie, J.: Skeletal mineralogy of geniculate corallines: providing context for climate change and ocean acidification research, Mar. Ecol.-Prog. Ser., 513, 71–84, 2014.