the Creative Commons Attribution 4.0 License.
the Creative Commons Attribution 4.0 License.
 | 21 Mar 2019
On the role of soil water retention characteristic on aerobic microbial respiration
Teamrat A. Ghezzehei
Benjamin Sulman
Chelsea L. Arnold
Nathaniel A. Bogie
Asmeret Asefaw Berhe
Soil water status is one of the most important environmental factors that control microbial activity and rate of soil organic matter (SOM) decomposition. Its effect can be partitioned into effect of water energy status (water potential) on cellular activity, effect of water volume on cellular motility, and aqueous diffusion of substrate and nutrients, as well as the effect of air content and gas-diffusion pathways on concentration of dissolved oxygen. However, moisture functions widely used in SOM decomposition models are often based on empirical functions rather than robust physical foundations that account for these disparate impacts of soil water. The contributions of soil water content and water potential vary from soil to soil according to the soil water characteristic (SWC), which in turn is strongly dependent on soil texture and structure. The overall goal of this study is to introduce a physically based modeling framework of aerobic microbial respiration that incorporates the role of SWC under arbitrary soil moisture status. The model was tested by comparing it with published datasets of SOM decomposition under laboratory conditions.
- Article
(7177 KB) - Full-text XML
- BibTeX
- EndNote


Soil moisture is one of the primary physical factors that control microbial activity (Harris, 1981). Short- and long-term temporal variations in soil moisture are strongly correlated with heterotrophic respiration rates (Carbone et al., 2011; Yuste et al., 2007). Therefore, the moisture–decomposition relationship is an important determinant of geographic distribution and climatic sensitivity of soil organic carbon (SOC) stocks (Moyano et al., 2013; Schmidt et al., 2011). The microhabitats that influence the community structure and activity of soil microbes (Tecon and Or, 2017) are far too small compared to the macroscopic measures of average soil water status, such as volumetric water content, relative saturation, or water holding capacity. At pore and subpore scales, the volume and connectivity of water pools and films are dependent on matric potential – a measure of the strength by which water is held in pores and on surfaces. Matric potential determines the thickness of water films (on very dry soils), curvature of the capillary menisci, and the largest drained pore throat. The relationship between the bulk soil water content and the corresponding volumetric-average matric potential – commonly referred to as soil water characteristic (SWC) or water retention curve (WRC) – is a macroscopic measure of hydrologically relevant pore-size distribution and surface area (Hillel, 1998). As such, it is also a reflection of soil texture, which controls surface area and pore-size distribution, and structure, which controls total porosity and abundance of intra- and interaggregate porosity. In addition, the interaction of microbes with pore water is influenced by the concentration of chemical species that can lower the osmotic potential.
In process-oriented mathematical models of soil organic matter (SOM) dynamics (Coleman and Jenkinson, 1996; Parton et al., 1998), sensitivity of SOM decomposition to soil moisture is often modeled in terms of functions that scale the maximum decomposition rate as a function of volumetric water content (Sulman et al., 2012). The optimal decomposition rate has been shown to peak at or near field capacity (defined interchangeably as matric potential of −30 kPa or water content after a saturated soil is drained for 24–48 h) with significant reductions in decomposition towards the wet and dry ends of the soil moisture range (Franzluebbers, 1999; Linn and Doran, 1984; Monard et al., 2012; Sierra et al., 2017; Tecon and Or, 2017). Typically, such bell-shaped soil moisture sensitivity curves are described using dimensionless polynomial scalars that are calibrated against experimental data (Sulman et al., 2012; Wickland and Neff, 2007).
Skopp et al. (1990) proposed one of the earliest conceptual models that attempted to provide mechanistic rationale for why decomposition of SOM exhibits a peak rate at a certain water content in terms of balance between substrate diffusion and gas diffusion. The model describes aerobic respiratory activity as a process limited by gaseous diffusion and/or aqueous diffusion, at the wet and dry ranges of the soil moisture spectrum, respectively,
where P is an index of decay rate, γ is the relative weight (importance) of aqueous diffusion of nutrients, and DN and DO are water content (θ) dependent effective diffusion coefficients of nutrients and oxygen, respectively. This model, which results in an inverted V-shaped curve, has sufficient flexibility to capture results from lab incubation experiments. Beyond bulk organic matter (OM) dynamics, this model formulation was shown to capture how nitrification rate of texturally contrasting soils correlates with gas diffusivity under high water content (Schjønning et al., 2003, 2011). Furthermore, the model has been able to capture observed increases in decomposition rate with water content (hence aqueous diffusion; Franzluebbers, 1999; Linn and Doran, 1984; Miller et al., 2005; Thomsen et al., 1999).
However, the direct influence of water potential (sum of matric and osmotic potentials) on microbial activity and decomposition rate has not been widely adopted in SOM dynamics models (Moyano et al., 2013, 2012). In aqueous media, microorganisms can react to increasing osmotic stress (low osmotic potential) by accumulating electrolytes and small organic solutes that counter the water potential gradient across their membranes (Wood, 2011). The resulting high intracellular osmotic potential inhibits production and activity of enzymes in bacteria (Csonka, 1989; Skujins and McLaren, 1967) as well as fungi (Grajek and Gervais, 1987; Kredics et al., 2000). Thus, enzymatic activity, community composition, and overall activity of bacteria and fungi inhabiting unsaturated soils are significantly impacted by both concentration of dissolved solutes (osmotic potential) and reduced water content (matric potential) (Chowdhury et al., 2011a, b; Manzoni and Katul, 2014; Stark and Firestone, 1995; Tecon and Or, 2017). It is important to note that soil drying concentrates solutes in pore water, further reducing osmotic potential (changing towards larger negative values). However, because water content and matric potential are strongly correlated through the SWC, their effects on microbial respiration and decomposition of SOM are often lumped together or considered interchangeable (Moyano et al., 2012, 2018; Sierra et al., 2017; Yan et al., 2018).
Unless empirical moisture sensitivity curves are calibrated individually for each soil, ignoring the independent contributions of water potential and water content on microbial activity is tantamount to discounting the role of soil texture and structure on soil moisture sensitivity curves. This drawback is especially critical in land-surface models that might be applied across many different soil types. In long-term simulations of land-surface processes, the feedback of changes in SOM stocks on soil aggregation and structure – hence SOM decomposition rate – may not be accurately captured if the effects of water content and water potential are lumped together. It is also an important limitation in modeling SOM dynamics in soils that undergo drastic structural change over short period of time, e.g., via tillage or slaking of dry aggregates during rapid rewetting.
The objective of this study was to provide a modeling framework that allows integration of SWC in SOM dynamics modeling. We introduce a conceptual and mathematical model of SOM dynamics that accounts for the independent roles of matric potential, dissolved oxygen, and substrate accessibility. For simplicity, we limit our analysis and illustration of the model to a single pool of SOM under isothermal conditions. However, the framework can be readily expanded to multiple pools and the dynamic thermal regime.
Process-based SOM dynamics models provide a conceptual basis for quantitatively describing the biophysical interactions within the soil system that determine the fate of SOM. However, the model parameters that represent soil and SOM properties and biophysical factors are difficult to determine a priori. Thus, these parameters must be extracted from experimental data via inverse modeling (fitting). Whether the fitted parameters retain their physical significance when the models are applied to contexts and scales that are not represented in the experimental data is a major challenge for most predictive modeling applications (Finsterle and Persoff, 1997). The pitfalls in this regard include strong correlation between fitted parameters and overfitting of experimental data (fitting of random errors at the expense of retaining the ability to generalize). These pitfalls can be partially avoided by reducing the number of tuneable free parameters and/or determining some of the parameters independently of the experimental data that are to be fitted.
The overall goal of the model proposed in this study is to incorporate the role of SWC in modeling of SOM dynamics under arbitrary soil moisture status. To achieve this goal in a robust and generalizable manner, we chose to represent SOM dynamics using a simple single-pool first-order kinetics. This model relies on only two parameters: the size of the active SOM pool and a constant decay rate. The effect of soil water status and SWC are incorporated into these parameters by relying on well-established relations of multiphase flow and transport concepts and independently fitted SWC curves. This was done without adding new free parameters that are tuned to fit observed SOM decomposition data.
2.1 Soil water characteristic (SWC)
Soil water characteristic is a constitutive relationship between the soil volumetric water content and matric potential. It embodies the pore-size distribution and as such is a quantitative representation of soil texture and structure. This soil-specific relationship determines macroscopic and microscopic water content distributions and indirectly influences flow of water, transport of dissolved constituents, and gas fluxes. It also has a strong bearing on the activity of soil microorganisms and plant roots. The wet end of SWC readily responds to changes in soil structure (e.g., tillage and compaction, root and macro fauna activity, freezing and thawing, drying and rewetting; Aravena et al., 2013; Ghezzehei, 2000; Or et al., 2000; Ruiz et al., 2015).
SWC is typically represented by a monotonic sigmoid function, the most common being van Genuchten's (van Genuchten, 1980) equation
where is the effective water saturation; θ, θr, and θS are volumetric water content, residual water content, and saturated water content, respectively; ψ (kPa) is matric potential; α−1 (kPa) is a parameter that indicates the matric potential at which the water retention curve exhibits the steepest slope; and n () and are shape parameters that reflect the spread of the SWC function. Matric potential can be related to an effective pore-throat diameter using the Young–Laplace law as , where σ (N m−1) is surface tension of pore water. Therefore, the SWC function (Eq. 2) can be rewritten in terms of the pore-throat diameter as
where represents the relative saturation or cumulative pore-size distribution. Equation (3) is a reinterpretation of SWC as cumulative pore-size distribution and D0≈4ασ is the mode of the pore-throat diameter distribution. In Fig. 1, Eqs. (2) and (3) are illustrated by the solid blue line. The corresponding pore-size density function is shown as the blue-shaded bell-shaped curve. The pore-throat diameter scale is shown on the top axis of Fig. 1. This form of SWC is a good approximation for soils with a unimodal pore-size distribution.
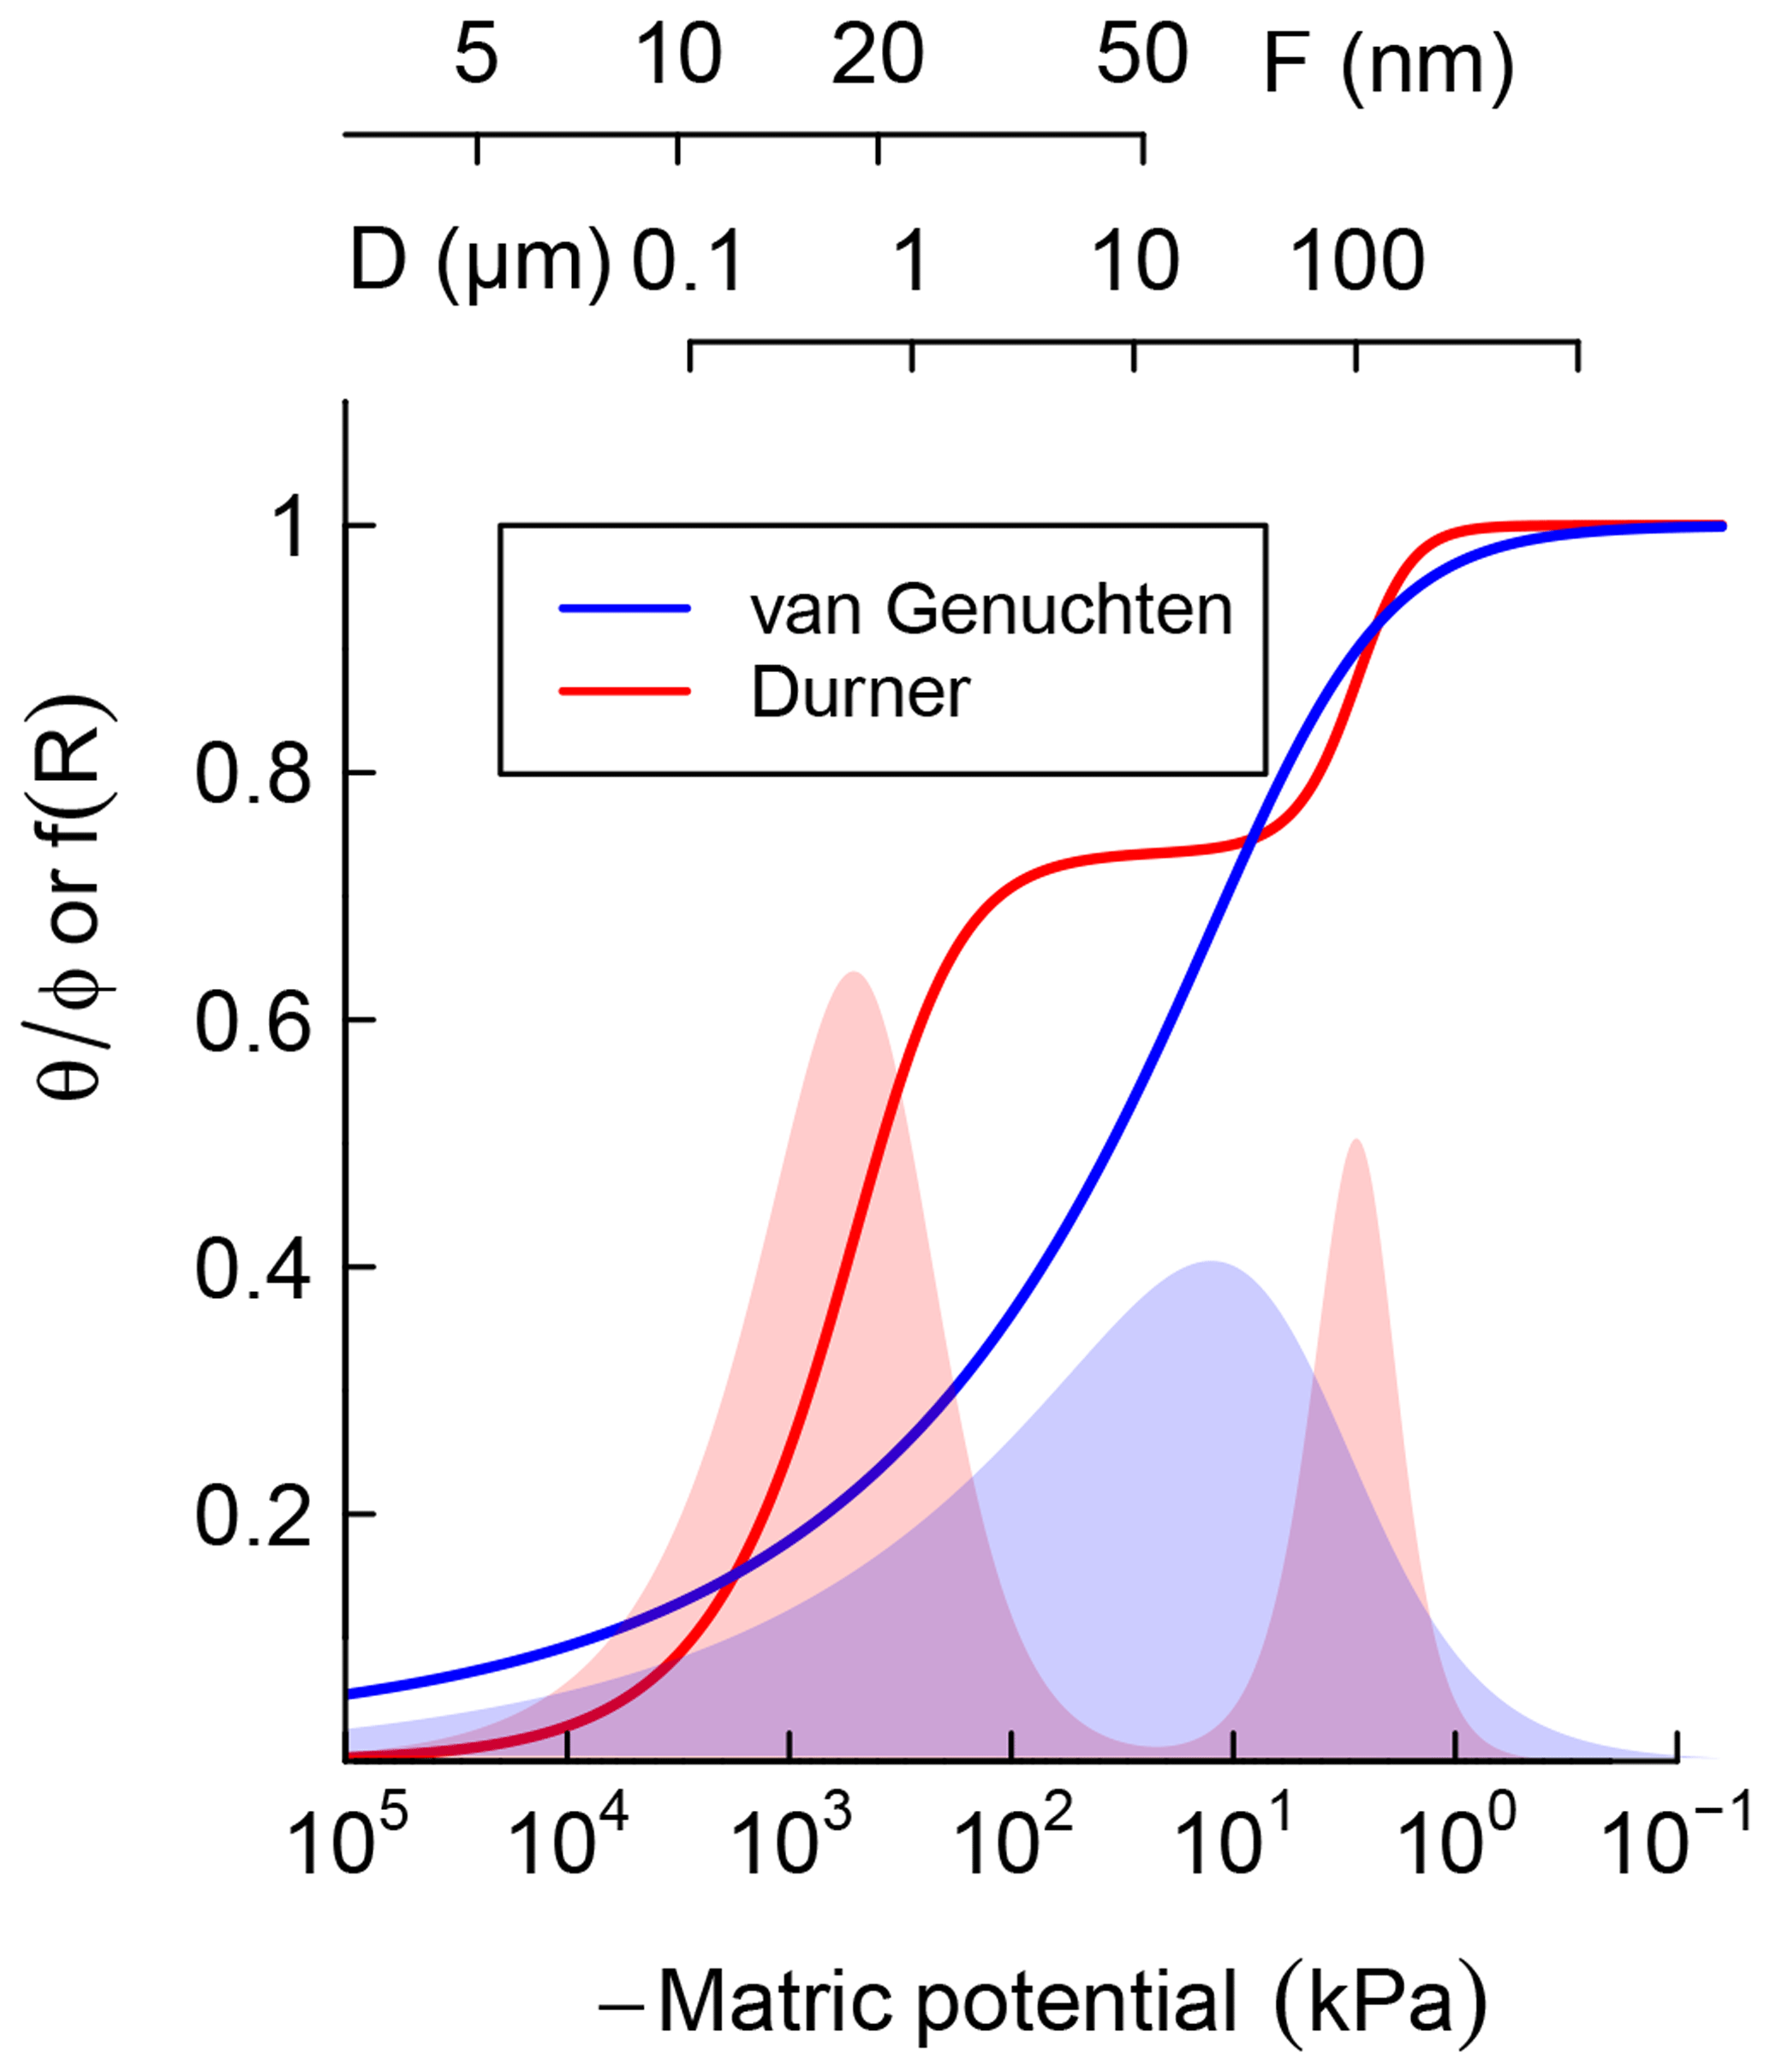
Figure 1Schematic comparison of unimodal vs. bimodal soil water characteristic (SWC) curves, represented using van Genuchten (1980) and Durner (1994) models, respectively. Shaded regions are distribution functions of effective pore-throat diameter. Scales on top show the thickness of adsorbed film and pore-throat diameter corresponding to the water potentials.
However, soils with a significant level of aggregation, clumping, and/or biopores exhibit multimodal pore-size distributions, e.g., with fine intra-aggregate pores and coarse interaggregate pores. Such soils can be represented by summation of two or more unimodal pore-size distributions. The SWC of soils that exhibit a bimodal pore-size distribution can be described by sums of two van Genuchten curves (Durner, 1994):
where represents the relative weights of the inter- and intra-aggregate pore populations. In Fig. 1, Eq. (4) is illustrated by the solid red line. The corresponding bimodal pore-size density function is shown as a red-shaded curve. The bimodal curve was used only for soils that exhibited a rapid drop in water content with the application of low suction, which is a characteristic feature of structured soils.
It is important to note that water retention is dominated by capillary attraction at the wet end of the SWC curve, approximately kPa and D>1 µm, while adsorption of the thin water film on mineral surfaces dominates in the dry range (Or and Tuller, 1999). Thus, soil texture is the most important determinant at the dry end of SWC while structure and water-stable aggregation dominate in the wet end. The latter is strongly influenced by the amount and nature of SOM and readily responds to changes in SOM content.
2.2 SOM dynamics modeling
The conceptual basis for our model is that soil organic matter is comprised of a single pool characterized by a first-order rate of decomposition
where C (mg-C ∕ g-SOC0) is the active C pool remaining at any given time, expressed as a fraction of the total initial SOC, and the rate constant κ (day−1) is a measure of SOM decomposition largely driven by living decomposers. Therefore, we consider it to be a composite parameter that accounts for the abundance of decomposer population as well as the activity of an average decomposer. Both of these factors are impacted when soil moisture level changes. Chowdhury et al. (2011b) observed that the abundance of active decomposers declines while maintaining the same level of average activity as water potential dropped from ψ=0 kPa to kPa. Organisms subjected to low total water potential exhibit reduced population growth as substantial proportion of their energy intake is routed towards osmoregulation (Harris, 1981; Watson, 1970). Upon further drying, however, the population remained constant, but the activity declined sharply (Chowdhury et al., 2011a, b). Previously, Stark and Firestone (1995) used two independent techniques to evaluate (a) the relative importance of water potential on cytoplasmic dehydration and (b) the role of water content diffusional limitations in controlling soil microbial activity. They used nitrifying (ammonium oxidizing) bacteria as a model system, in which nitrification rate was considered a surrogate for microbial activity. In the first experiment, they used well-mixed soil slurries, in which NH4 was maintained at high concentrations and osmotic potential was regulated by the addition of K2SO4. In a companion experiment, they incubated moist soils at a wide range of matric potential and kept N level elevated by the addition of NH3 gas. In the former experiment, the nitrification rate declined exponentially with reduction in water potential of the slurries (0 to kPa). The latter experiment exhibited a steeper decline of nitrification across the same range of total water potential as the first experiment, demonstrating that diffusional limitation exacerbates the cytoplasmic-dehydration effect of lower total water potential. Similarly, Tresner and Hayes (1971) showed that in the absence of diffusion limitation the survival probability of fungi declines with water potential. Therefore, we treat the effects of (a) reduced diffusion (which depends on water content) on accessibility of SOC (Davidson et al., 2012) and (b) reduced matric potential on cytoplasmic dehydration as distinct interacting factors.
Another moisture-related factor that impacts the rate constant of decomposition by aerobic processes is availability of dissolved O2 in pore water. Because diffusion of aqueous O2 is 4 orders of magnitude slower than that of gaseous O2, gas diffusivity is the primary factor that indicates O2 limitation in SOM dynamics (Skopp et al., 1990). Schjønning et al. (2003) compared the nitrification rate of cores sampled from three soils of contrasting textures and equilibrated at seven matric potential levels, −0.015 to 1.5 kPa, near the wet end of the moisture spectrum. They observed nitrification rates increased in all soils as water content was reduced from saturation, and then decreased with further decline in water content. The initial increase was not correlated with water content or matric potential. However, consistent with the model of Skopp et al. (1990), relative gas diffusivity was a good predictor of nitrification.
Based on the above observations, we propose to expand the decomposition rate κ into the product of multiple interacting components that represent biophysical factors,
where κi are dimensionless constants representing the biophysical factors. Here we focus on two such factors, namely matric potential (κψ) and availability of dissolved O2 (κa). The parameter κo (day−1) is an intrinsic (maximum) rate constant and represents the lumped effect of all the remaining unresolved biophysical factors such as temperature, pH, soil mineralogy, OM composition, and nutrient availability. In principle, Eq. (5) can be expanded to accommodate as many variables as needed. This general formulation has been used to represent the effects of various enzyme activities and temperature (Sierra et al., 2017).
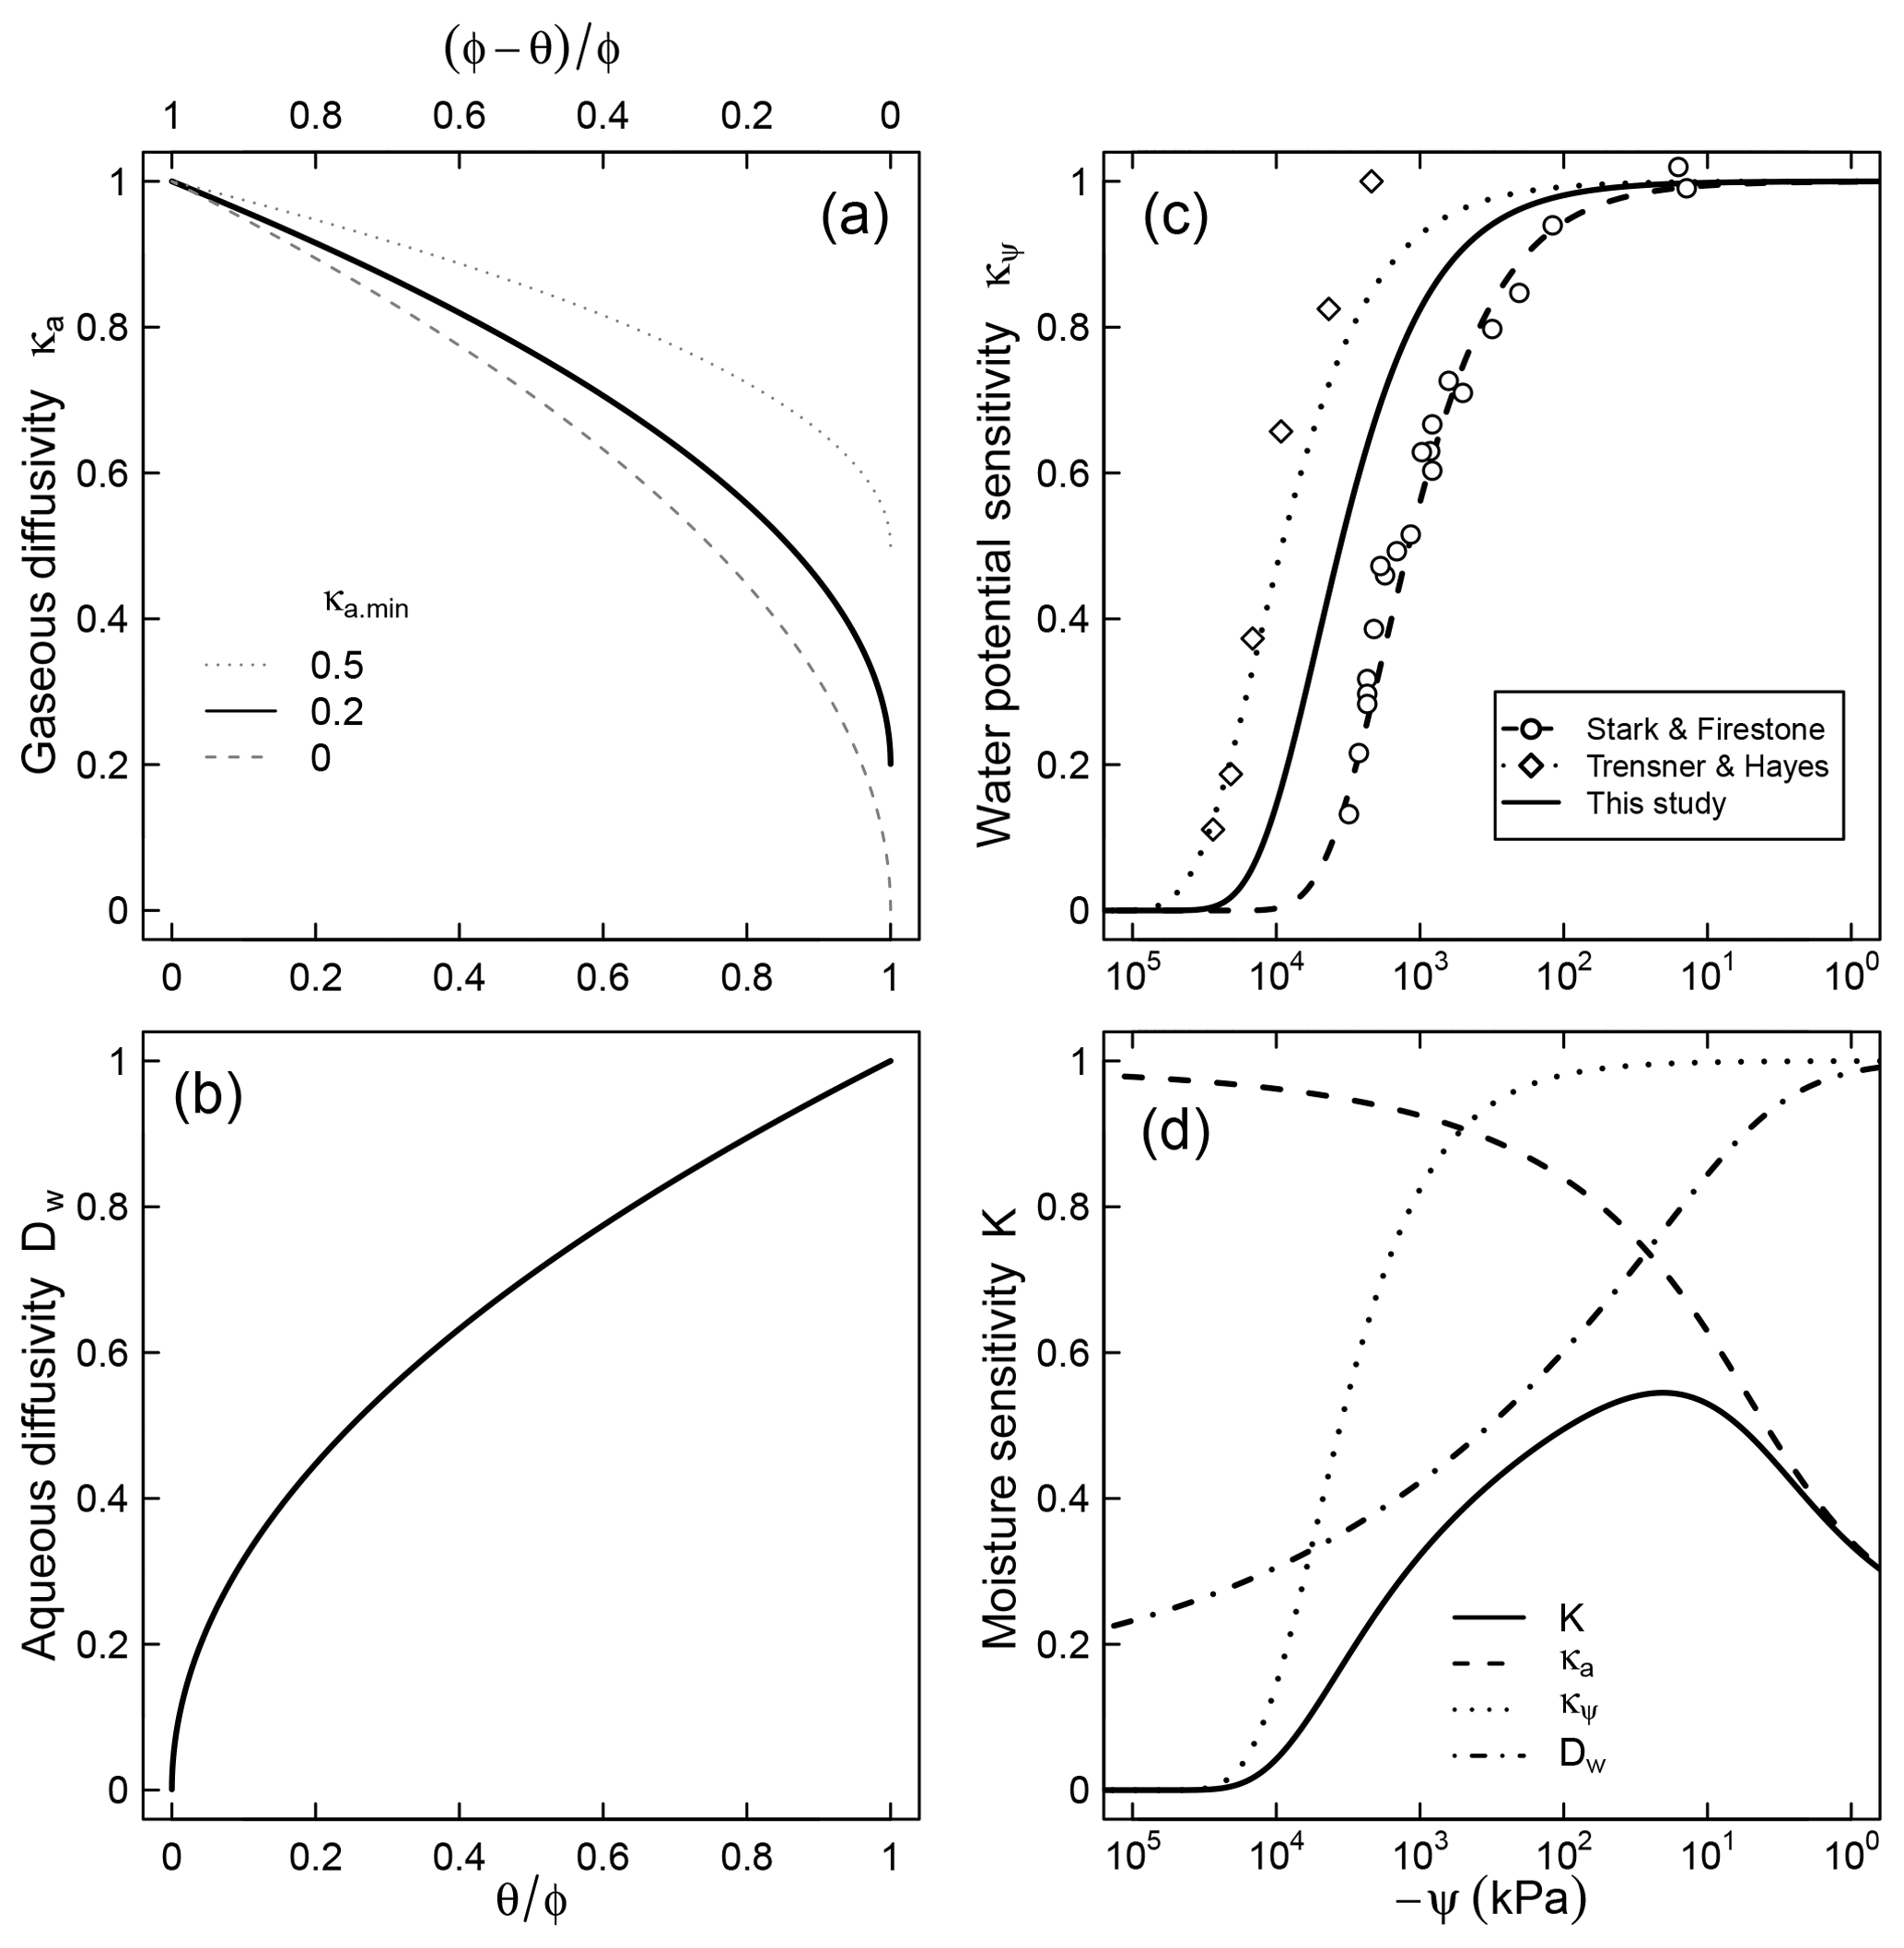
Figure 2Relative contributions of (a) air diffusion on access to O2, (b) aqueous diffusion limitation on substrate access, (c) limiting effect of water potential on microbial activity, and (d) the combined effect of the three factors for a soil characterized by a unimodal SWC curve shown in Fig. 1.
2.2.1 Effect of matric potential
Here we propose an exponential equation to describe the dependence of soil microbial activity on water potential,
where λ (kPa−1) is a factor that represents the dependence of respiration rate on matric potential. Note that κψ≤1 because matric potential cannot be positive (ψ≤0). This trend is assumed to account for the decline in population of decomposers as well as reduced per capita activity at very low water potentials. The model fits well the trend of nitrification in slurries observed by Stark and Firestone (1995) () and the survival probability of fungi in the absence of diffusion limitation observed by Tresner and Hayes (1971) (). Here we utilize the geometric mean of these two coefficients () to account for the fact that both bacteria and fungi are involved in soil respiration and that nitrification is more sensitive to resource limitation than respiration (Schjønning et al., 2003; Scott et al., 1996). A comparison between the proposed trend and the dimensionless nitrification data of Stark and Firestone (1995) is shown in Fig. 2c. The steepest decline in effective microbial activity occurs in the range kPa. Note that although the primary state variable in Eq. (7) is matric potential, it is tacitly assumed that the equation also accounts for the decrease in osmotic potential that accompanies concentration of solutes in drying soils (Chowdhury et al., 2011b).
2.2.2 Effect of dissolved oxygen
Following Skopp et al. (1990), we assume the relative dependence of SOM decomposition on dissolved O2 can be explained by the relative gas-phase diffusivity, which in turn is inversely correlated with tortuosity of the gas phase,
where Dg, 0 and Dg are diffusivities in open air and soil, respectively, and τa is tortuosity of the gas phase. Here we use the well-known parameter free Bruggeman expression for tortuosity , where is the air-filled porosity (Pisani, 2011). However, this model does not account for the distance from the air-exposed soil surface. In lab incubation studies, short cores and/or cores with large exposed surfaces do not exhibit significant O2 limitation as the average diffusion distance is short. Conversely, in field conditions, O2 availability becomes increasingly limiting with depth as transport length increases and cumulative O2 consumption increases (Angert et al., 2015). Therefore, we add a correction term that accounts for these variations,
The parameter κa.min represents the minimum relative SOM decomposition rate when the soil is fully saturated and the O2 supply rate is at its lowest. A value of implies that no O2 limitation would occur even when the local supply rate is at its lowest. One possible cause for such a phenomenon could be inherently low O2 demand because of other limiting factors (e.g., lack of essential nutrients or presence of inhibiting factors). It is also reasonable to expect high values of κa.min for well-aerated conditions (e.g., shallow soil depth or small samples), in which gaseous O2 replenishment occurs readily. In contrast, when the inherent respiration rate is high (e.g., substrate and essential nutrients are abundant and minimal inhibiting factors exist) or the rate of replenishment is slow (e.g., deep within soil profile), the value of κa.min is expected to approach zero. Further controlled experiments are needed to better constrain how this parameter varies with depth or the inherent O2 demand of soils. The effect of κa.min on the overall trend of the relative decomposition rate is illustrated in Fig. 2a.
2.2.3 Effect of water content on substrate accessibility
Water content also determines substrate accessibility to decomposer microorganisms, thereby influencing the rate of SOM decomposition. Aqueous-phase diffusivity of soluble substrates becomes increasingly limited as liquid-phase connectivity is reduced and transport distance increases (Moldrup et al., 2004; Skopp et al., 1990). We assume the fraction of the active SOC pool that is accessible to decomposers scales with relative aqueous diffusivity. Therefore, the accessible fraction of the SOC pool is proportional to the liquid-phase tortuosity. Here, we use the Bruggeman expression for tortuosity,
where CA stands for the fraction of the active pool of SOC that is accessible to decomposers at the ambient moisture level (Fig. 2b), Dw, 0 and Dw are diffusivities in free water and soil, respectively, and τw is tortuosity of the liquid phase. Similar concepts have been successfully used to describe diffusion limitation on substrate accessibility independently from biogeochemical reaction rates (Tang and Riley, 2013; Yan et al., 2016; Manzoni et al., 2016). Equation (10) implies that the active pool is accessible in its entirety when soil pores are saturated with water. Additionally, it is possible to experience a reduction of the absolute quantity of substrate in aqueous phase solution as the increased concentration of dissolved substrates induces sorption (complexation with mineral surfaces; Šimůnek et al., 2016). This latter effect, which requires inclusion of reactivity of the mineral surfaces, is not incorporated into this study but can be readily added if the requisite properties of the solid phase and SOM are known.
2.2.4 Integrated model
The SOM dynamics under arbitrary fluctuation of soil water status (i.e., θ(t) and ψ(t)) can be described by rearranging Eq. (5), subject to initial active pool of SOC, , as
where τ is a dummy variable of integration and K(θ(t), ψ(t)) is the moisture sensitivity function (which varies with time for the nonsteady moisture regime). An expression for K is derived by combining modifiers that represent effects of matric potential (Eq. 7), O2 diffusion (Eq. 9), and accessibility of SOM (Eq. 10),
Moisture sensitivity calculated using a typical unimodal SWC is illustrated in Fig. 2d. Note that a closed-form solution for the integral in Eq. (11) exists only at steady water content and water potential status, leading to a simple closed-form solution,
These solutions have only two free parameters, which are not dependent on water content: initial fraction of the active pool C0 and the maximum decay rate κo. Water content and matric potential are linked via the appropriate SWC equation (Eq. 2 or 3). Variations in SOM decomposition between different water content levels are explained by independently determined SWC. It is important to note here that characterization of SWC has become more accessible in the past decade with the introduction of apparatus that rely on evaporation rather than regulated pressure (Schindler et al., 2010). Moreover, pedotransfer functions that predict SWC parameters from routinely measured soil properties (e.g., texture, bulk density, and SOM) are becoming increasingly more reliable (Zhang and Schaap, 2017)
For comparison with incubation experiments, cumulative CO2−C evolution can be evaluated by subtracting the dynamic SOC content (Eq. 10 or 11) from the initial active stock.
where stands for the cumulative evolved C expressed as a fraction of the initial SOC.

2.3 Data for model testing
Testing the validity of the model in simulating SOM dynamics requires cumulative CO2−C evolution data from incubation experiments conducted at multiple constant water content levels as well as knowledge of concurrent water content and matric potential values. We obtained laboratory incubation data that meet these requirements, comprising 31 soils, from four published sources. These soils span a wide range of textural classes, SOM concentrations, and soil structural states. Three of the studies were from experiments conducted at a steady wetness level and one is from a study involving drying and episodic rewetting. A summary of the datasets used is given in Table 1. The datasets used are described briefly below. The fact that none of the datasets include fully saturated soil is recognized as a drawback in the present state model validation.
-
Arnold et al. (2015). They incubated soils from high-elevation meadows in the Sierra Nevada, California, at five different water potentials (−10 to −400 kPa) and measured the CO2 efflux 11 times over 395 days. Soil samples were collected from three distinct hydrologic regions within the meadow area (wet, intermediate, and dry) at three depths. The wet meadow soils were classified as a fibrous peat in the surface layer, but the intermediate and dry locations had mineral soils with high organic matter content. SWC data were collected on separate samples using a pressure-plate apparatus. All the SWC data were fitted with the bimodal SWC model of Durner (1994) because they exhibited the characteristic rapid decrease in water content at low suction. The best-fit SWC curves were used to estimate the water content levels of each treatment.
-
Franzluebbers (1999). They collected samples from the surface (0–10 cm) of 15 variably eroded soils of the Madison-Cecil-Pacolet, near Farmington, Georgia. Samples were packed into bottles at two bulk density levels: naturally settled and lightly compressed. The resulting 30 distinct soils were incubated at eight water content levels and CO2 efflux was measured three times over an incubation period of 24 days. Matric potentials of the samples were measured at the end of the incubation experiment by the filter-paper method. A digitized version of this dataset was published as supplemental material by Moyano et al. (2012).
-
A. Don (Moyano et al., 2012). Additionally, a previously unpublished dataset by Axel Don, that included a 32-day incubation of one soil at five water content levels was obtained from the supplemental dataset published by Moyano et al. (2012). CO2 efflux data were provided hourly. Matric potential values were inferred from a unimodal SWC curve (van Genuchten, 1980) that was estimated using the pedotransfer function ROSETTA (Schaap et al., 2001).
-
Miller et al. (2005): they performed a laboratory incubation to evaluate the impact of short-term fluctuations in soil moisture on long-term carbon and nitrogen dynamics. The study was designed to mimic seasonal wetting of dry soils that is characteristic to many arid and semiarid environments. Sandy clay loam soil samples collected from the Sequoia National Park, with a C concentration of 2.3 % were incubated in centrifuge tubes. The tubes were wetted to 60 % water holding capacity (WHC) and then allowed to dry by evaporation until they were due for rewetting treatment. WHC was defined as the gravimetric water content of saturated soil allowed to drain for 6 h. Four- and 2-week rewetting intervals were tested over a 16-week incubation period. Daily CO2 efflux and water content (expressed in terms of WHC) were provided. The corresponding matric potential values were inferred from a unimodal SWC curve (van Genuchten, 1980) representative for the textural class (Schaap et al., 2001).
2.4 Fitting of model to data
The first step of fitting the model to experimental data involves calculating the concurrent water content and matric potential levels at all times as described above. For each of the unique soil types considered, the cumulative CO2 efflux data from all the different water content levels were fitted together by optimizing the initial fraction of the active pool C0 and the maximum decay rate κo, using a nonlinear Levenberg–Marquardt algorithm implemented in the minpack package (Elzhov et al., 2016) of R (R Core Team, 2017). For all the soils used in this study, we tested two values of the parameter that represents O2 limitation in saturated soils ( and 0.8). The data–model comparisons reported use , which corresponds to 90 % O2 in the single aggregate level model of Ebrahimi and Or (2016). The relationships between κa.min and soil depth, soil type, and sample size (for lab experiments) need further investigation.
Simultaneously measured water content and matric potential data from the studies of Arnold et al. (2015) and Franzluebbers (1999), along with the best-fit bimodal and unimodal SWC curves, are reported in Figs. 3 and 4, respectively. The best SWC parameters of all the soils used in this study are reported in Table A1. The SOM-rich meadow soils of Arnold et al. (2015) were developed in a cold high-altitude environment where estimated annual input of SOM far exceeds decomposition. In these soils, SOM content and porosity decrease with depth in all three hydrologic regimes. SOM and porosity across the three sites are ranked as wet > intermediate > dry. All the meadow soils studied exhibit two distinct pore-size classes representing (a) large pores between decomposing fibers of organic matter (in the surface peats) and between aggregates (in the subsoils) and (b) finer pores between processed SOM and mineral fractions. The macropores of these soils drain when subjected to low suction (approx. −5 kPa). However, the soils remain fairly wet until they are subjected to matric potentials lower than approx. −300 kPa.
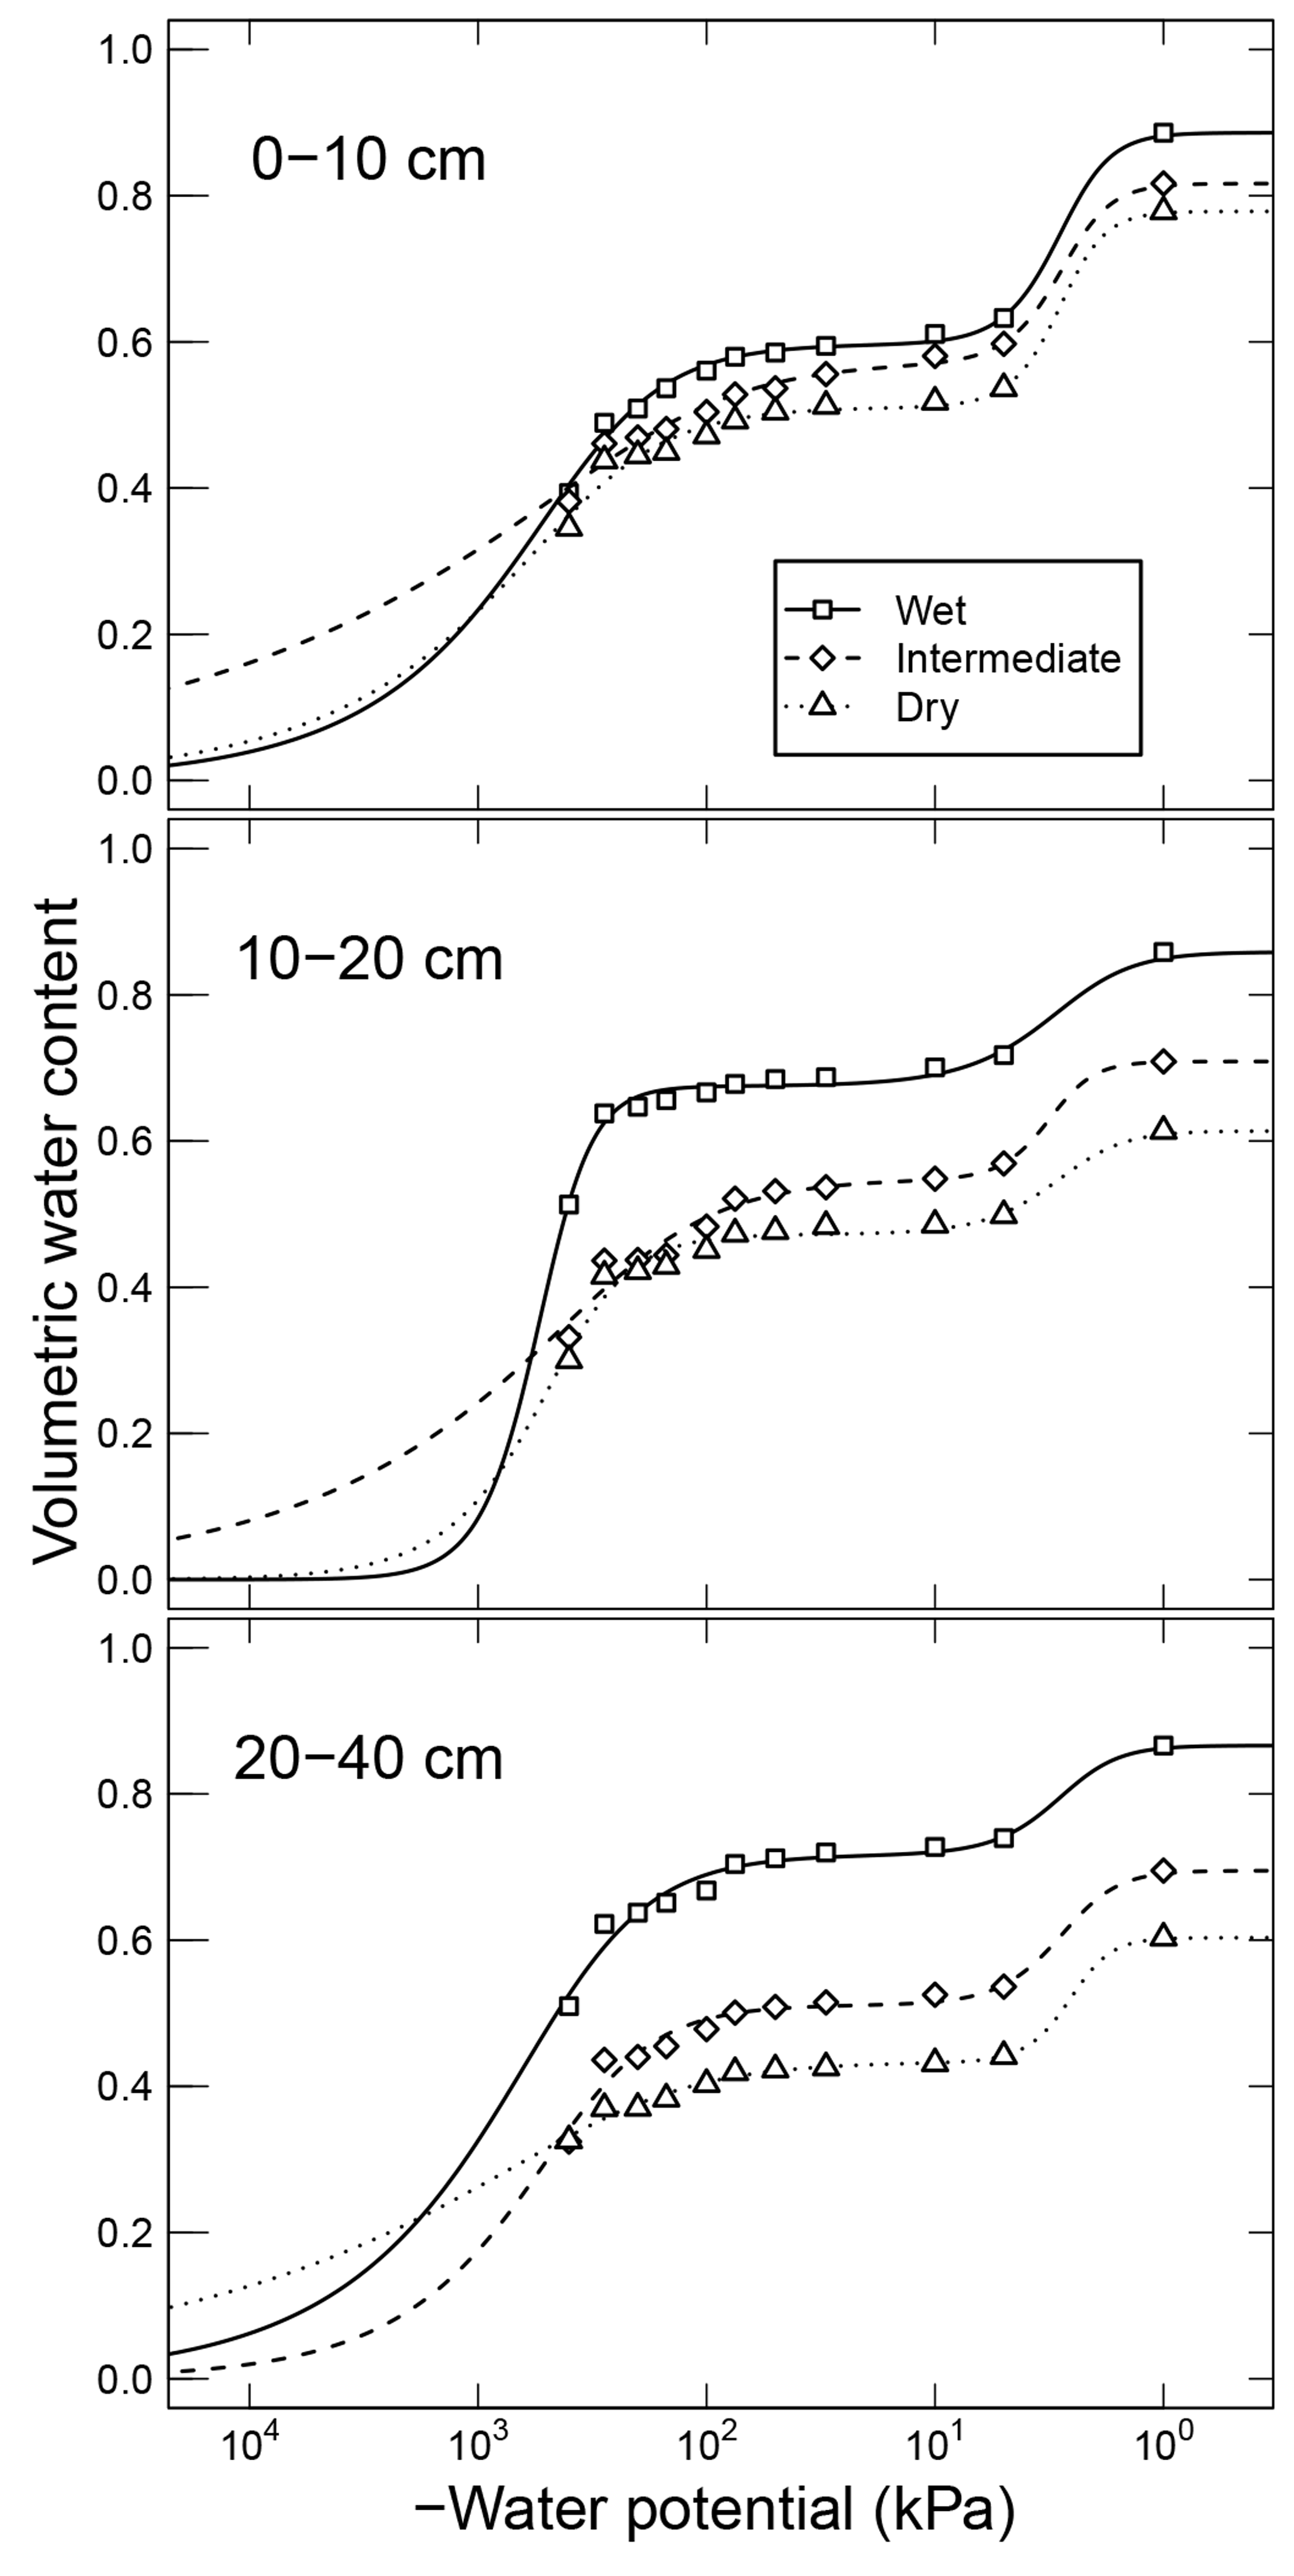
Figure 3Water retention characteristics of meadow soils (Arnold et al., 2014) that were used to derive the relative effect of water potential on overall mineralization rate.

Figure 4Soil moisture characteristics of soils analyzed by Franzluebers (1999); symbols are measured values and lines are van Genuchten model fits. The best-fit n parameters are shown. Soils at natural (triangle symbol and dashed line) and compacted (circle and solid lines) states were studied.
The mineral soils, in contrast, exhibited unimodal SWC (Franzluebbers, 1999). The compressed samples had slightly lower porosity than their naturally settled counterparts across all textures investigated. The water content decreased continuously as the matric potential was lowered progressively. However, the compressed soils needed lower matric potential to drain to the same level of wetness. This indicates that compression caused the pores to shrink across most of the pore-size distribution.
In the proposed model, sensitivity of SOM decomposition to soil moisture dynamics is explained in its entirety by the SWC, which directly dictates air content, water content, and matric potential. Moisture sensitivity curves of all soils calculated using Eq. (11) are depicted in Fig. 5. The difference between the soils with unimodal and bimodal SWC curves is mostly reflected in the water potential range for peak decomposition. In addition, compaction results in a shift of the moisture sensitivity curves to the dry end, which is a reflection of reduced mean pore size.
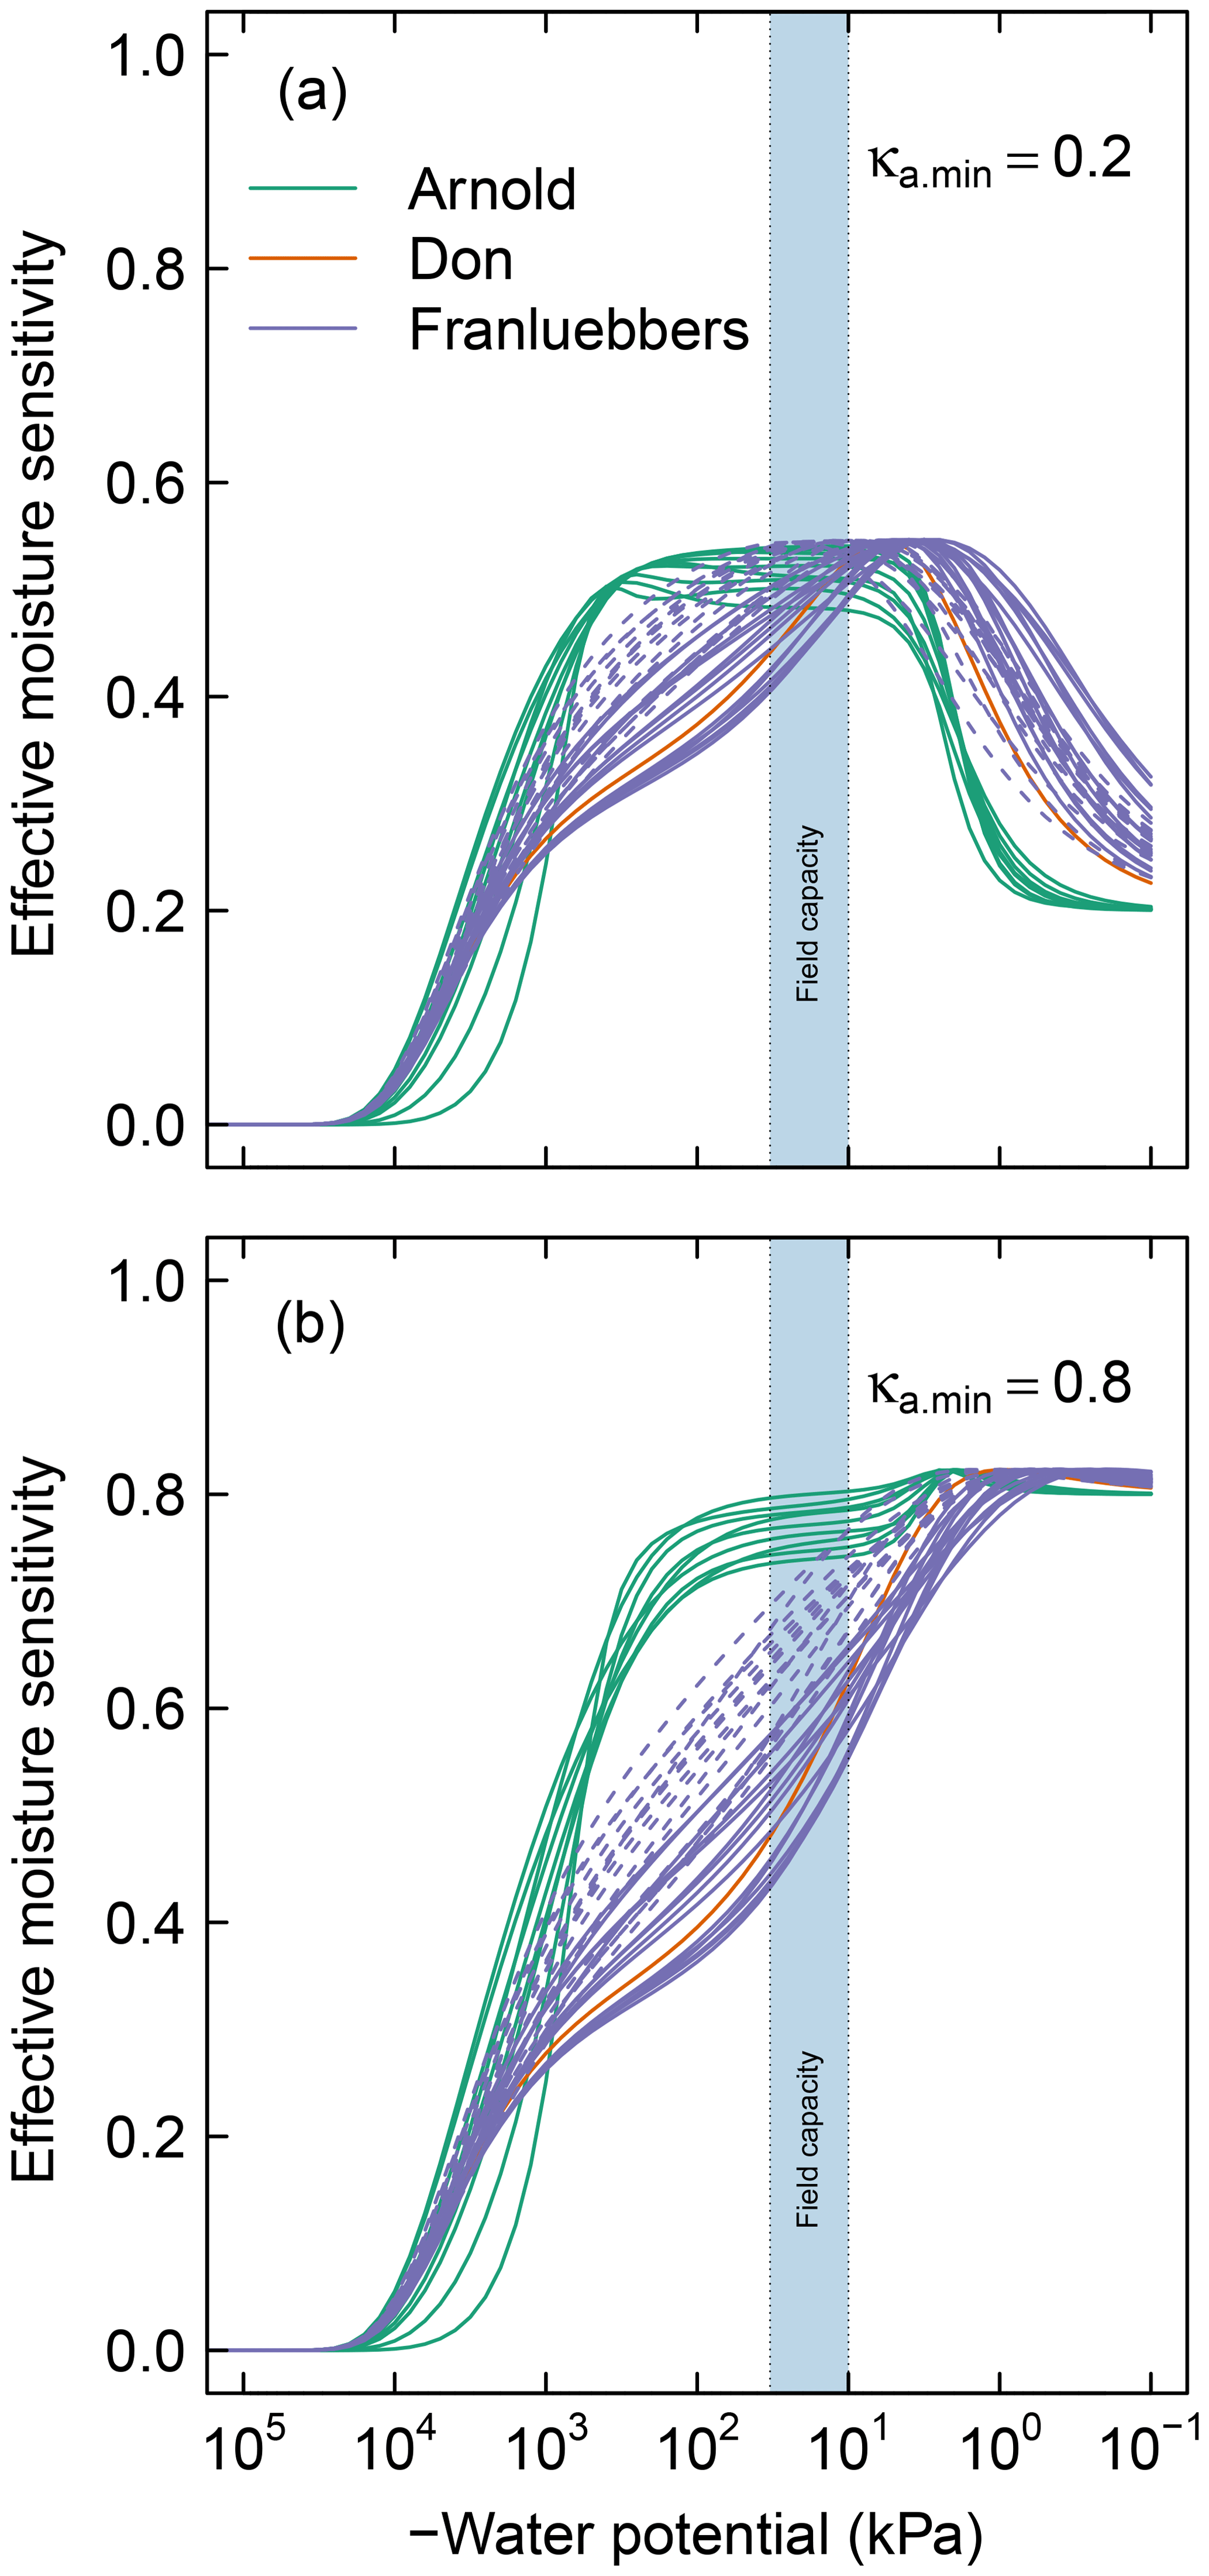
Figure 5Effective soil moisture sensitivity functions for all soils. These curves were calculated as illustrated in Fig. 2 using (a) and (b). The dashed lines of the Franzluebbers soils denote compressed samples. The shaded region () denotes the typical range of field capacity.
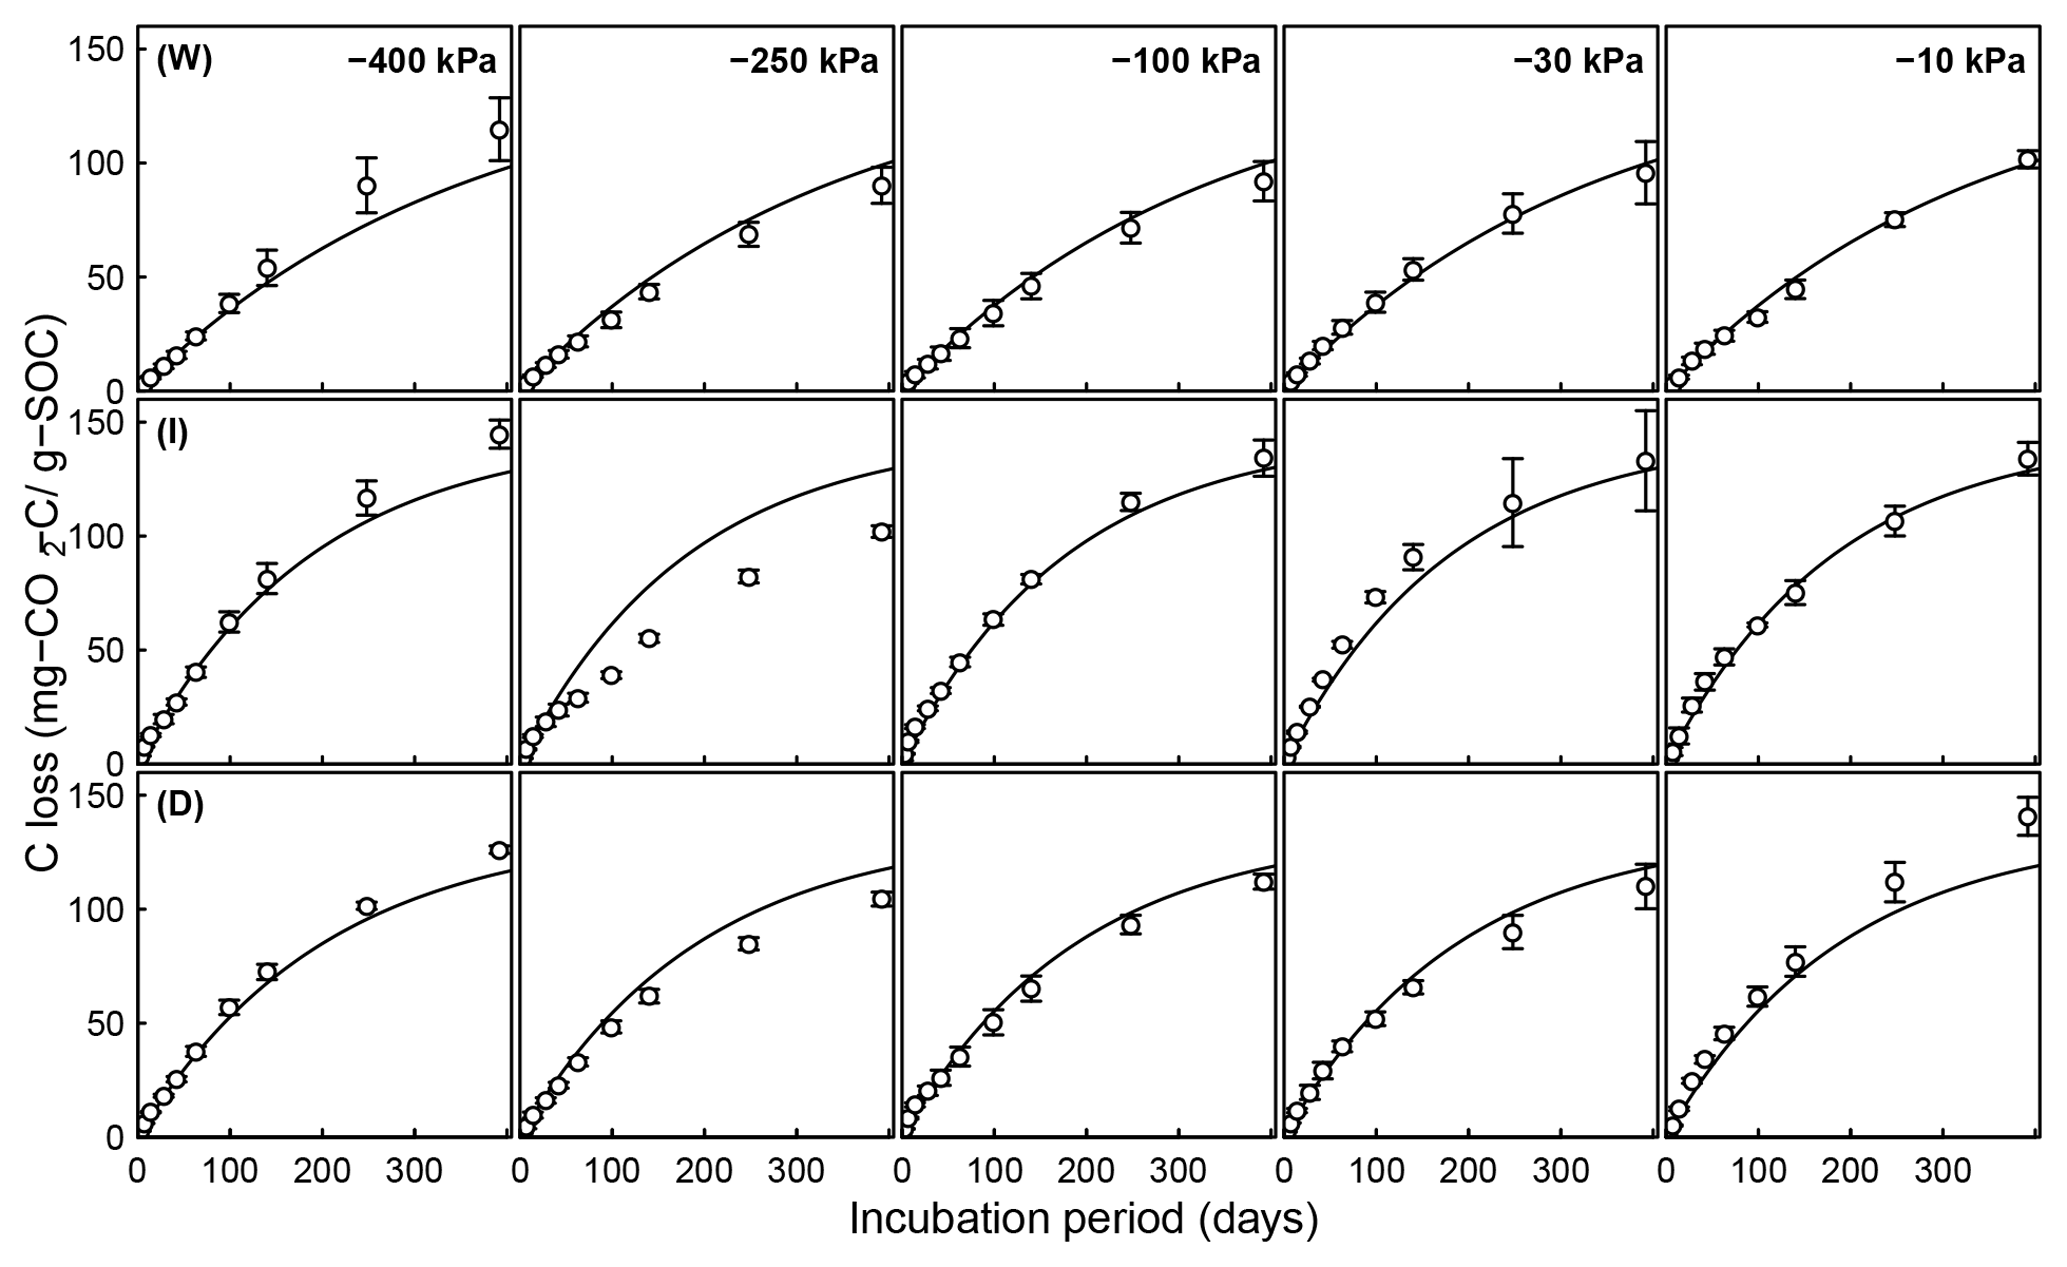
Figure 6Evolution of CO2 during a 395-day incubation of soils collected from SOM-rich meadow soils (Arnold et al., 2015) over a wide range of water potentials. Data from only 0–10 cm depth are shown; other depths are provided in the Appendix. Soils from three hydrologic regimes are shown in the three rows: W is wet (top row), I is intermediate (middle row), and D is dry (bottom row). The columns represent equilibrium matric potential conditions.
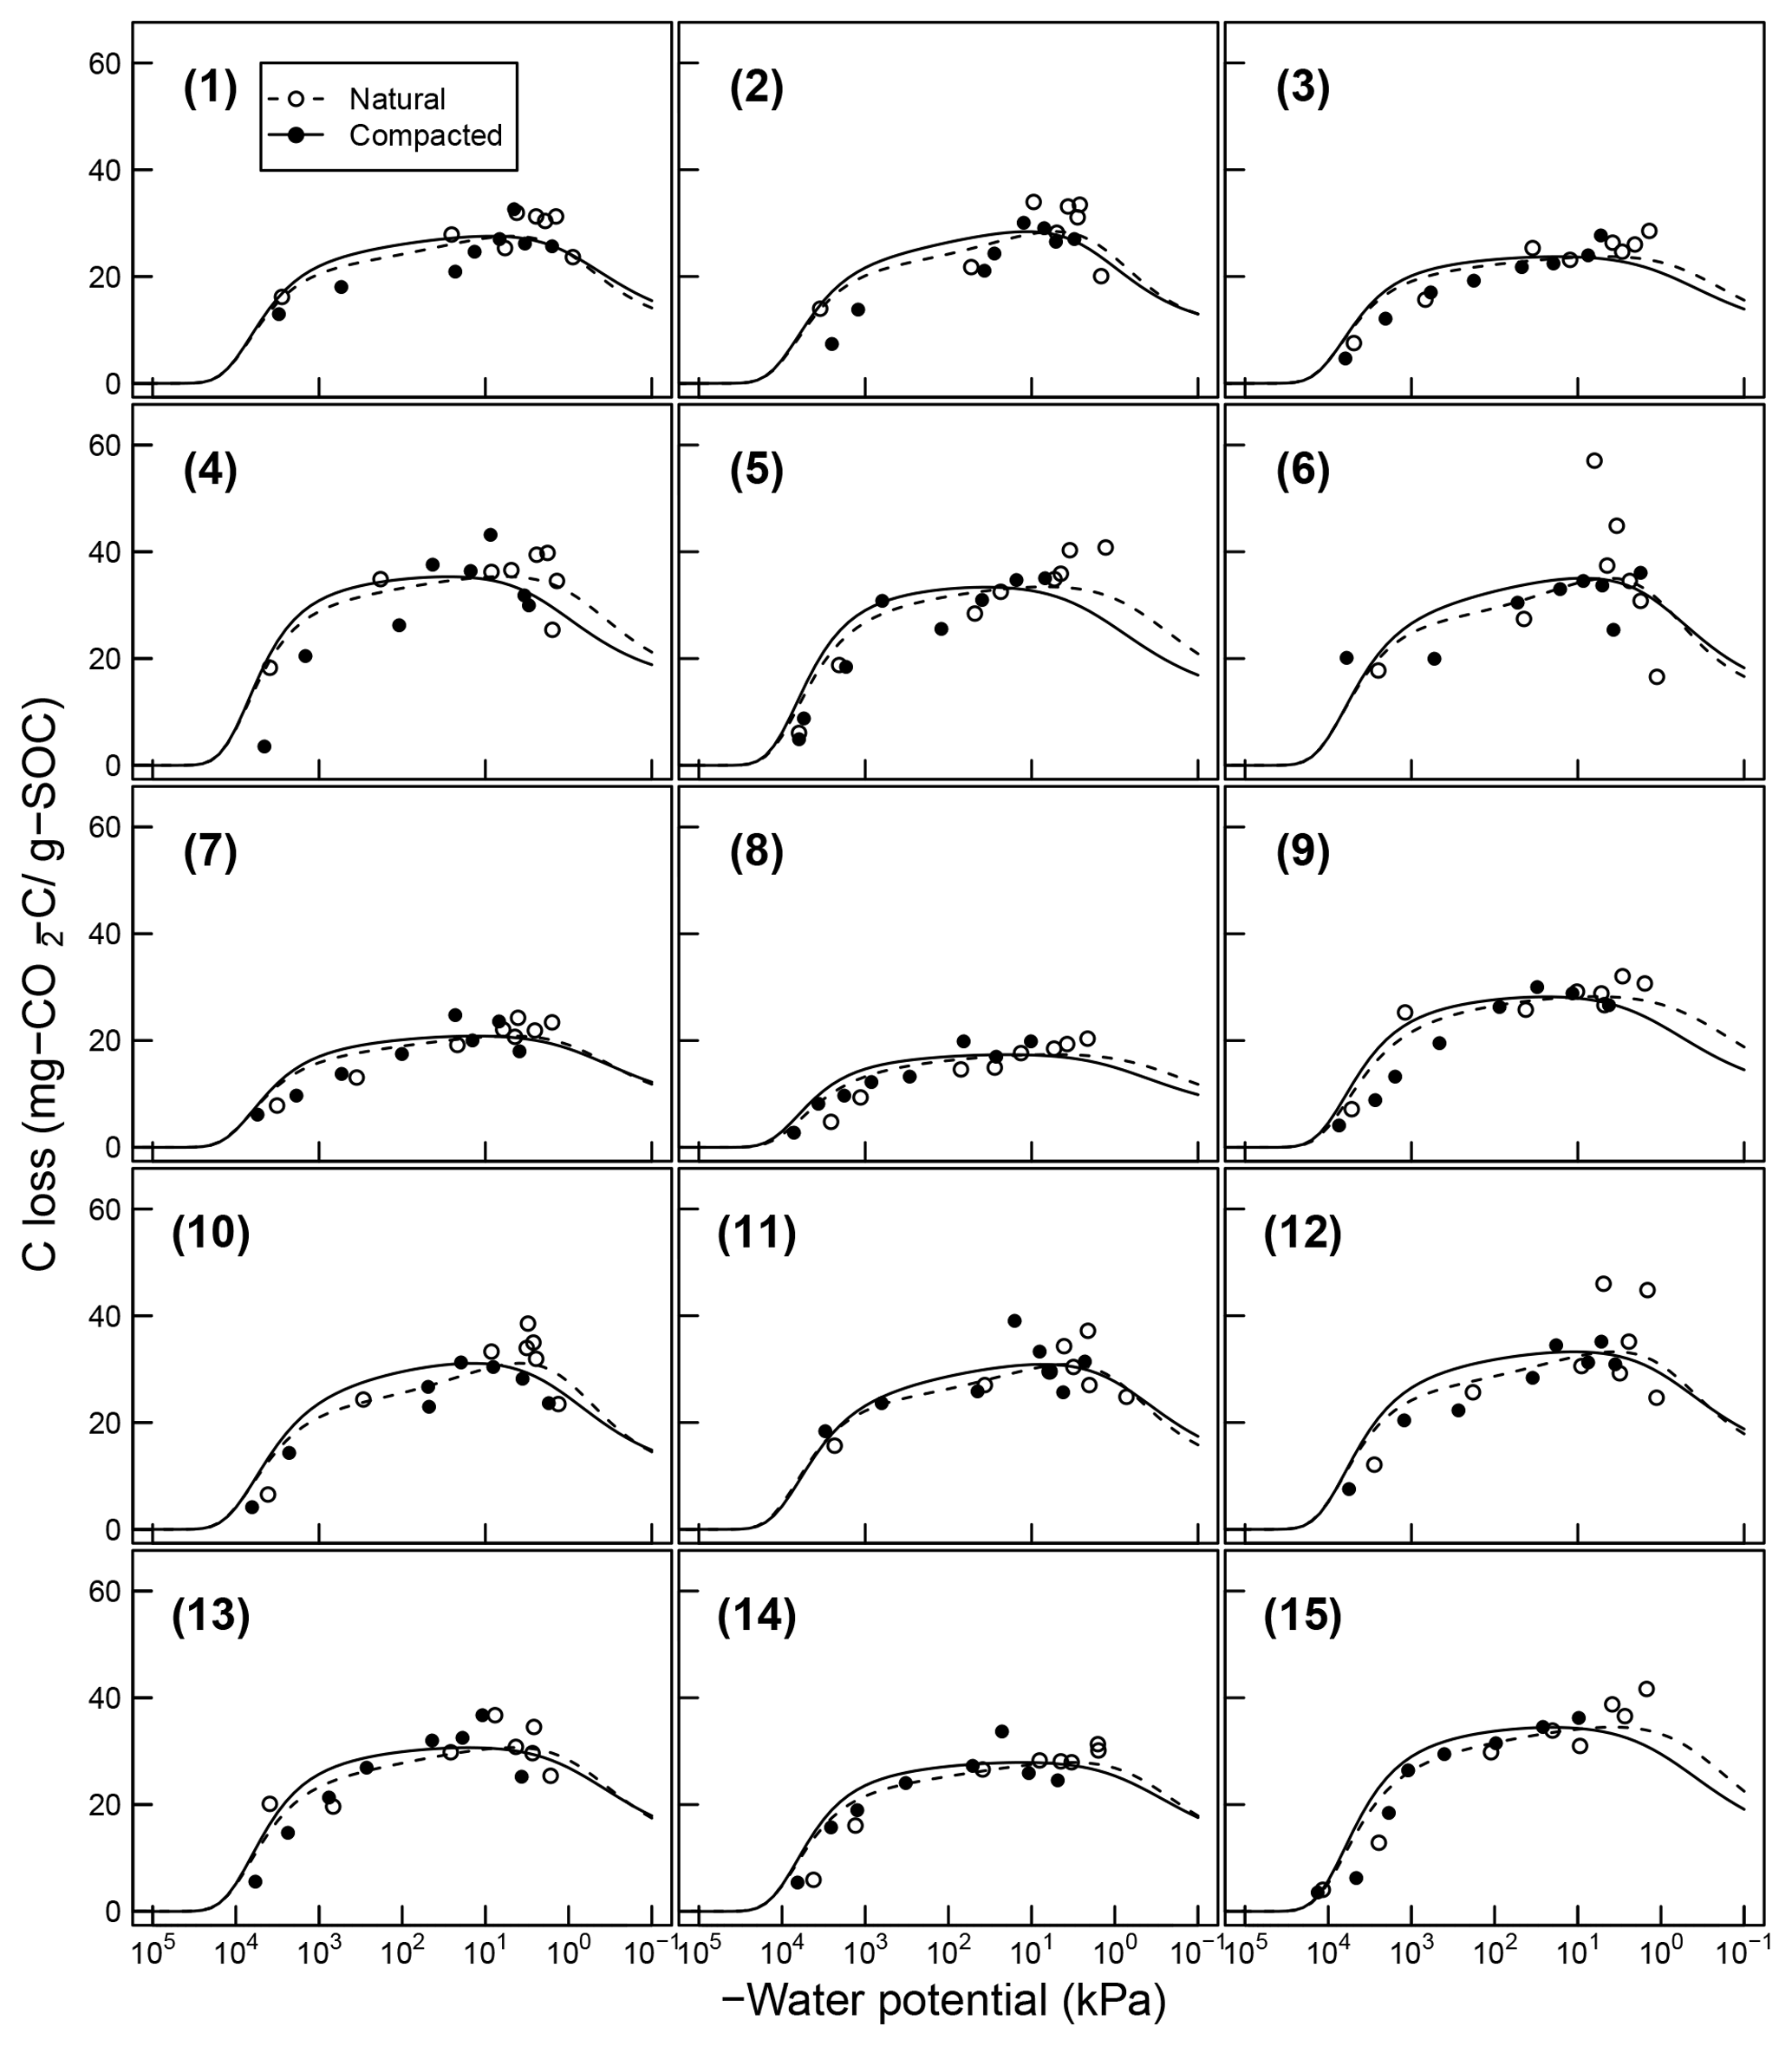
Figure 7Comparison of total SOC loss during a 24-day incubation of 15 soils analyzed by Franzluebers (1999) (at naturally settled and compressed states); symbols are measured values and lines are model simulations using van Genuchten SWC curves and decomposition parameters, C0 and κo, fitted individually to each of the 15 soil types.
Temporal CO2 evolution data for a subset of SOM-rich meadow soils (0–10 cm; Arnold et al., 2015) are compared with best-fit model simulations in Fig. 6. We assumed compaction does not alter the optimal decay rate and active pool. Thus, the datasets from the naturally settled and compacted samples were fitted with common parameters. As indicated above, only the initial fraction of the active pool C0 and the optimal decomposition rate κo were optimized for each of the soils. The complete set of best-fit plots and fitted parameters are given Fig. A2. For the mineral soils of Franzluebbers (1999), the final SOC loss during a 24-day incubation is compared with model fits in Fig. 7. The corresponding temporal CO2 evolution data and best-fit model simulations for all the mineral soils are depicted in Fig. A3. Bulk density levels of individual samples of the same soil that were incubated at different levels of matric potential were not consistent. Bulk densities of individual samples are indicated within each subpanel in Fig. A3. Due to the variation in bulk densities, the differences between compacted and naturally settled samples were not consistent across the matric potential spectrum. Therefore, in fitting SWC curves to the soil water content and matric potential, intersample heterogeneities were not accounted for. The mismatch between measured and simulated CO2 evolution includes this discrepancy. Temporal CO2 evolution data and best-fit model simulations for all the mineral soil of Don (Moyano et al., 2012) are depicted in Fig. A4. The best-fit model parameters for all the soils are provided in Table A1.
The best-fit optimal decay rates for all the steady-moisture experiments are plotted against (Fig. 8a) SOC and (Fig. 8b) the initial active fraction of SOC (C0), and incubation period in Fig. 8. The overall SOC decomposition rate (log (κo)) was negatively correlated with both log (SOC) and log (C0). These correlations suggest that, in the long run, accumulation of high SOC leaves behind C that recycles at an increasingly slower rate. Furthermore, comparison of Fig. 8a and b suggests that soils with higher SOC are also likely to have a higher proportion in the active pool (C0). However, these interpretations should be taken with caution considering the duration of the incubation experiments of Franzluebbers (1999) and Don (unpublished data cited in Moyano et al., 2012) were much shorter than that of Arnold et al. (2015; 24 and 31 days vs. 395 days, respectively).
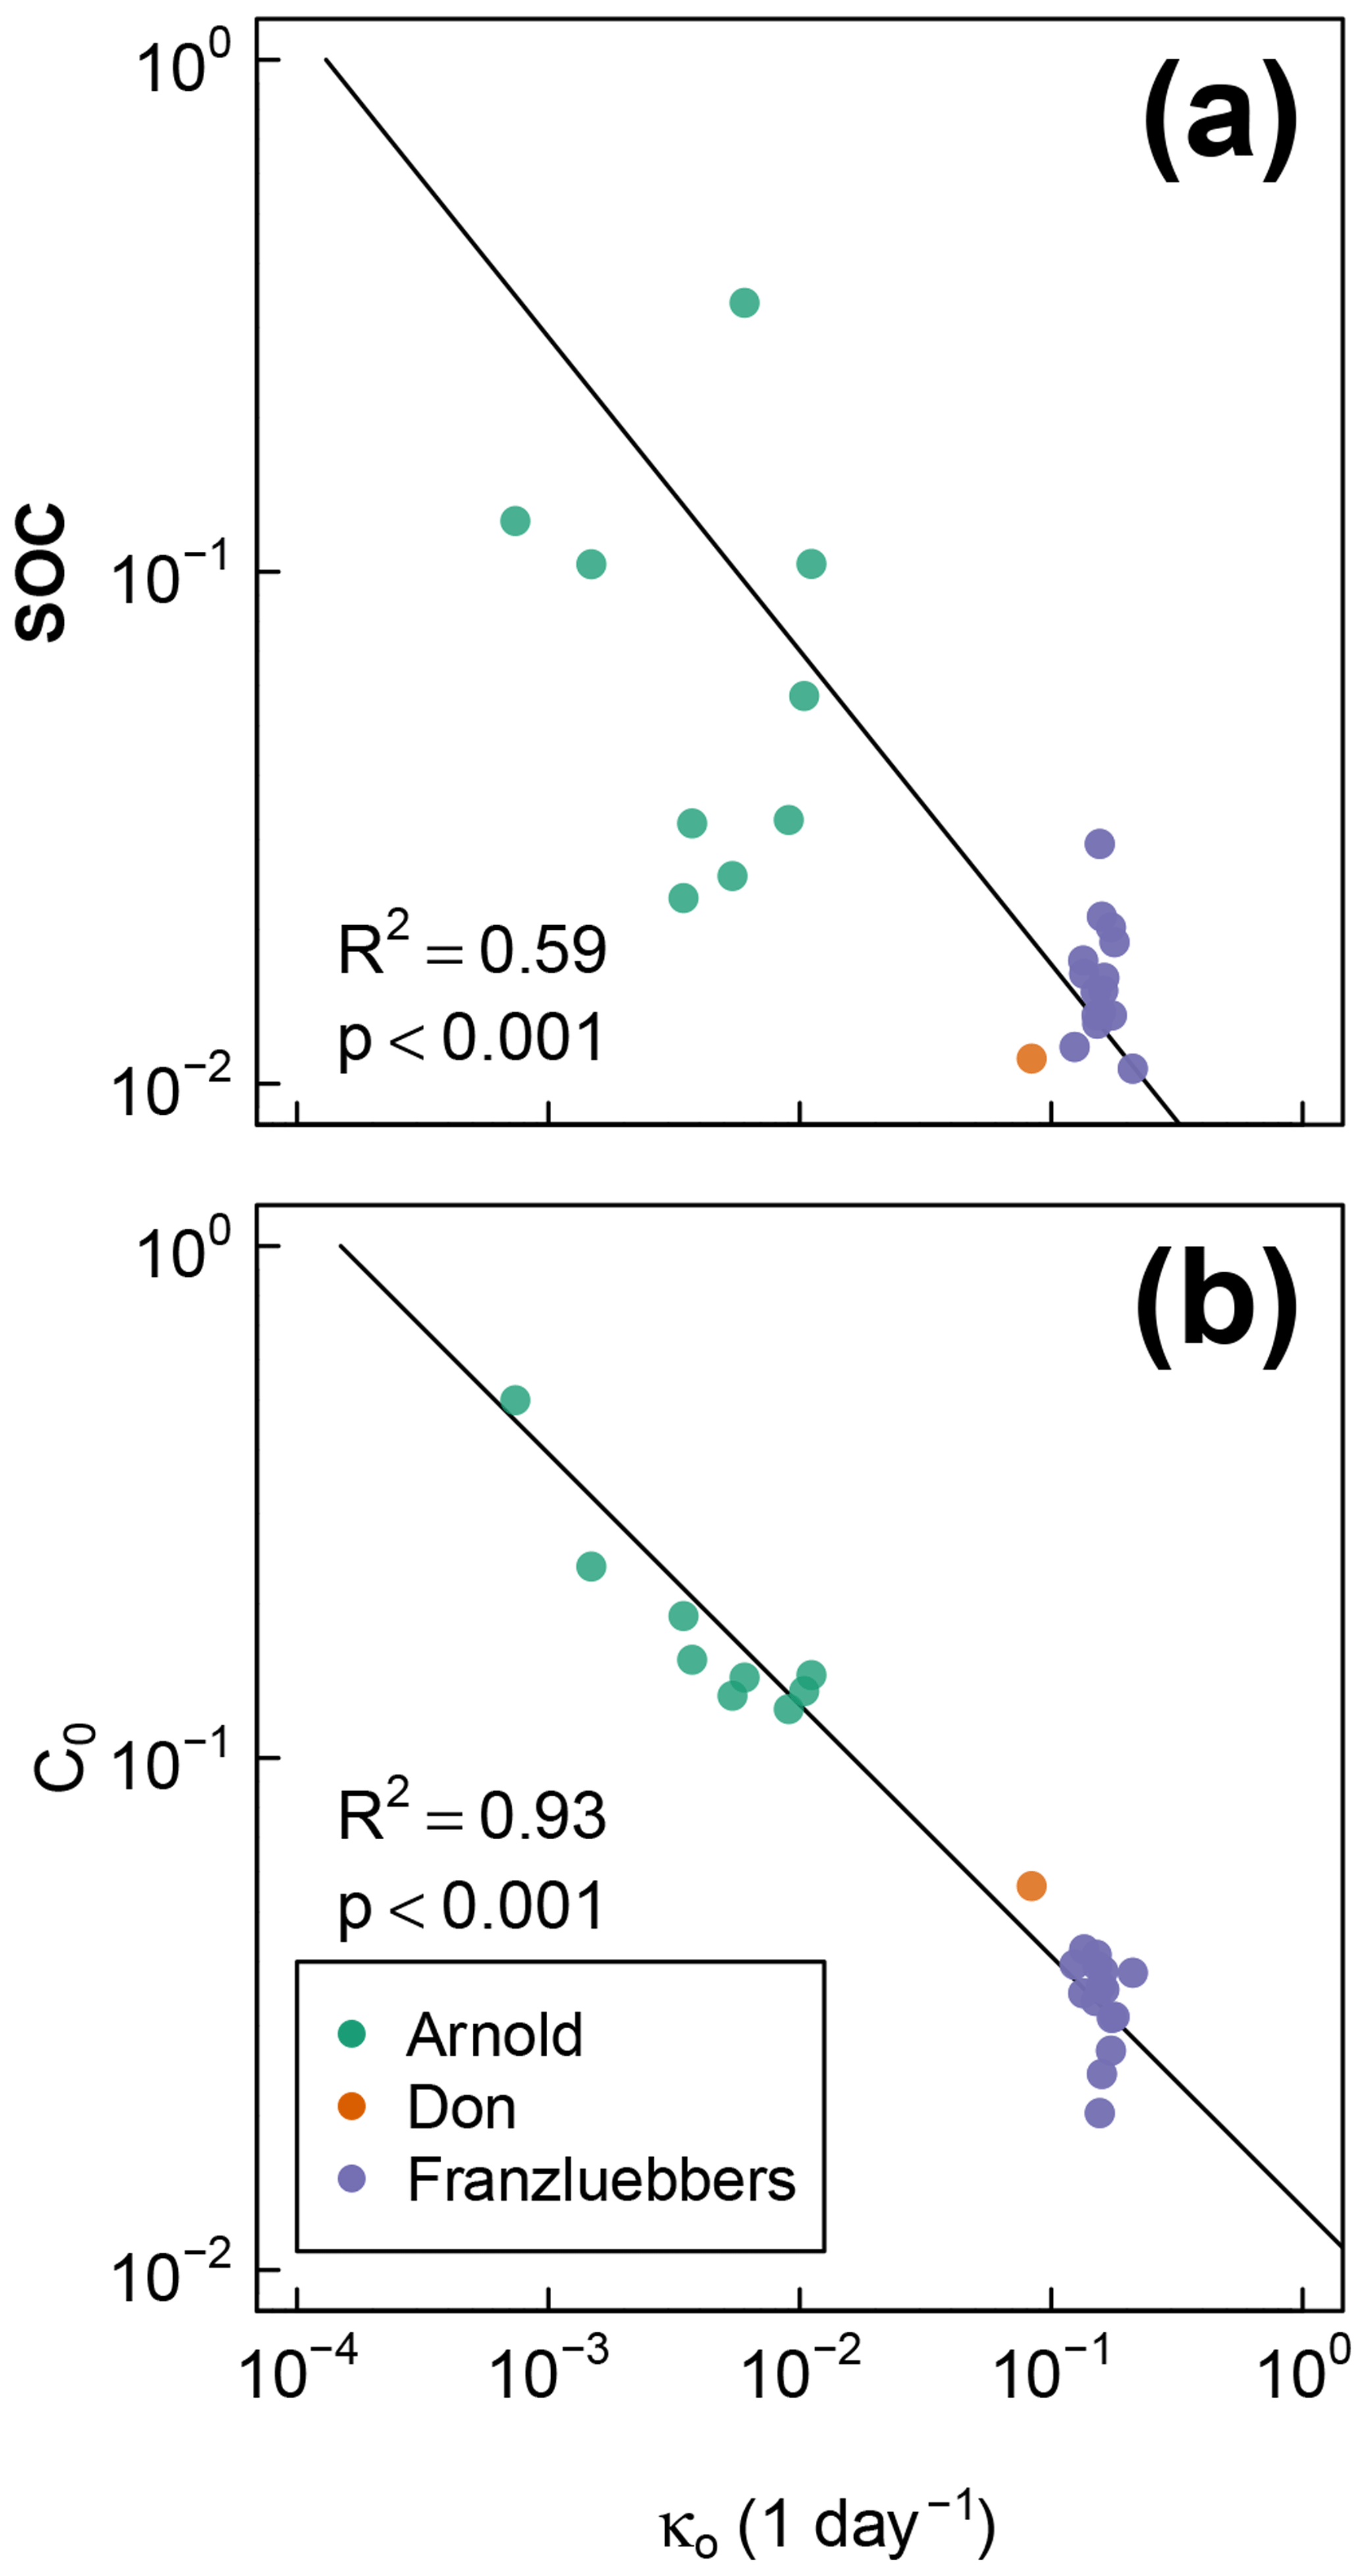
Figure 8Relationships between fitted overall decomposition rate κo with (a) the total SOC and (b) the fitted active fraction of SOC C0.
Finally, the measured CO2 evolution data from all the three studies (1375 data points representing 40 different soils) are compared with the model fits in logarithmic scale and linear scale (inset) in Fig. 9. The color intensity of the points reflects the density of data points. Overall, the model is in excellent agreement with experimental observations across the full range of measured data.
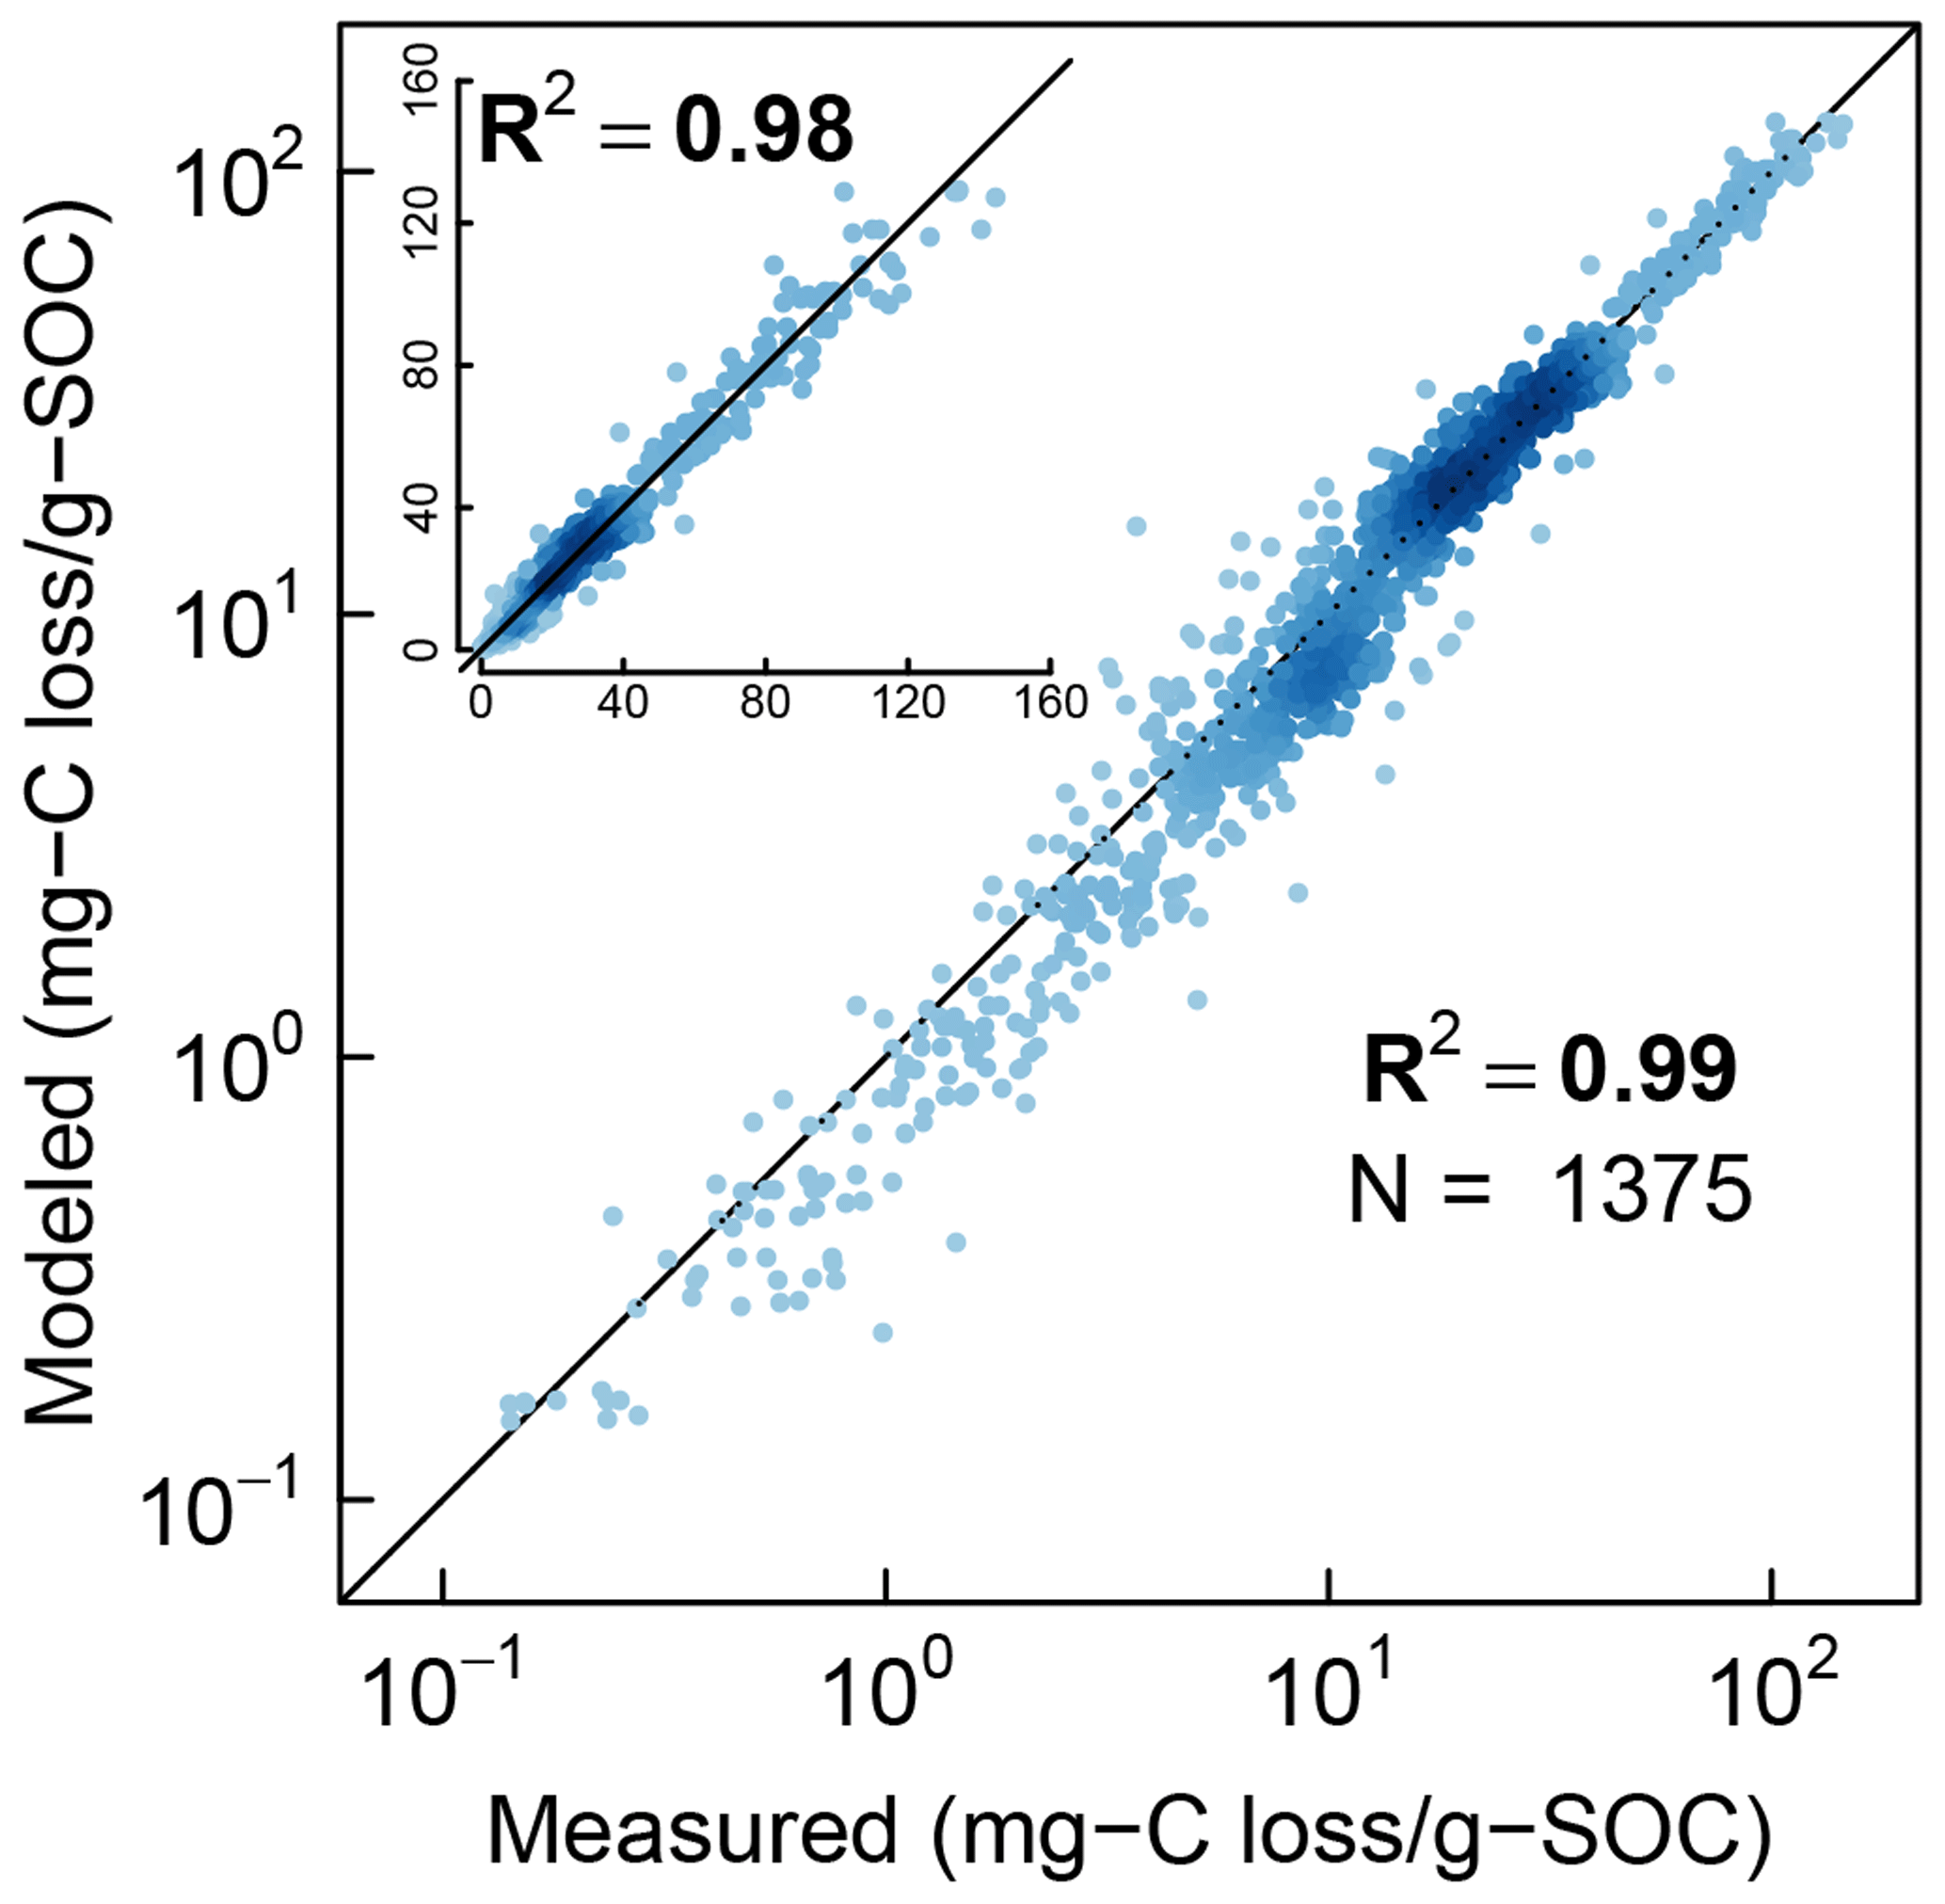
Figure 9Comparison of model simulations with measured cumulative CO2 evolution data from all incubation studies at steady-water content.
Comparisons of CO2 evolution data of Miller et al. (2005) under drying and rapid-wetting conditions with model simulations are shown in Fig. 10. The fluctuation in the CO2 evolution rate is explained by the dynamics of water content (Fig. 10a) and matric potential. Because a closed-form solution does not exist for arbitrary fluctuations of soil moisture, the integral in Eq. (10) was evaluated numerically. Two sets of model fits were performed. In the first, data from the 2- and 4-week rewetting intervals were fitted together using one set of initial fraction of the active pool C0 and the optimal decomposition rate κo (Fig. 10b). However, as shown in Fig. 10, the two intervals started with a distinct difference at the initial measurement period, which is assumed to reflect a significant intersample difference. Therefore, a second model fit was conducted by treating the two intervals separately (Fig. 10c). The efflux of CO2 immediately after rewetting was consistently much higher than subsequent readings at comparable wetness level. This effect of drying and rewetting, the Birch (1958) effect, is not accounted for in the proposed model.
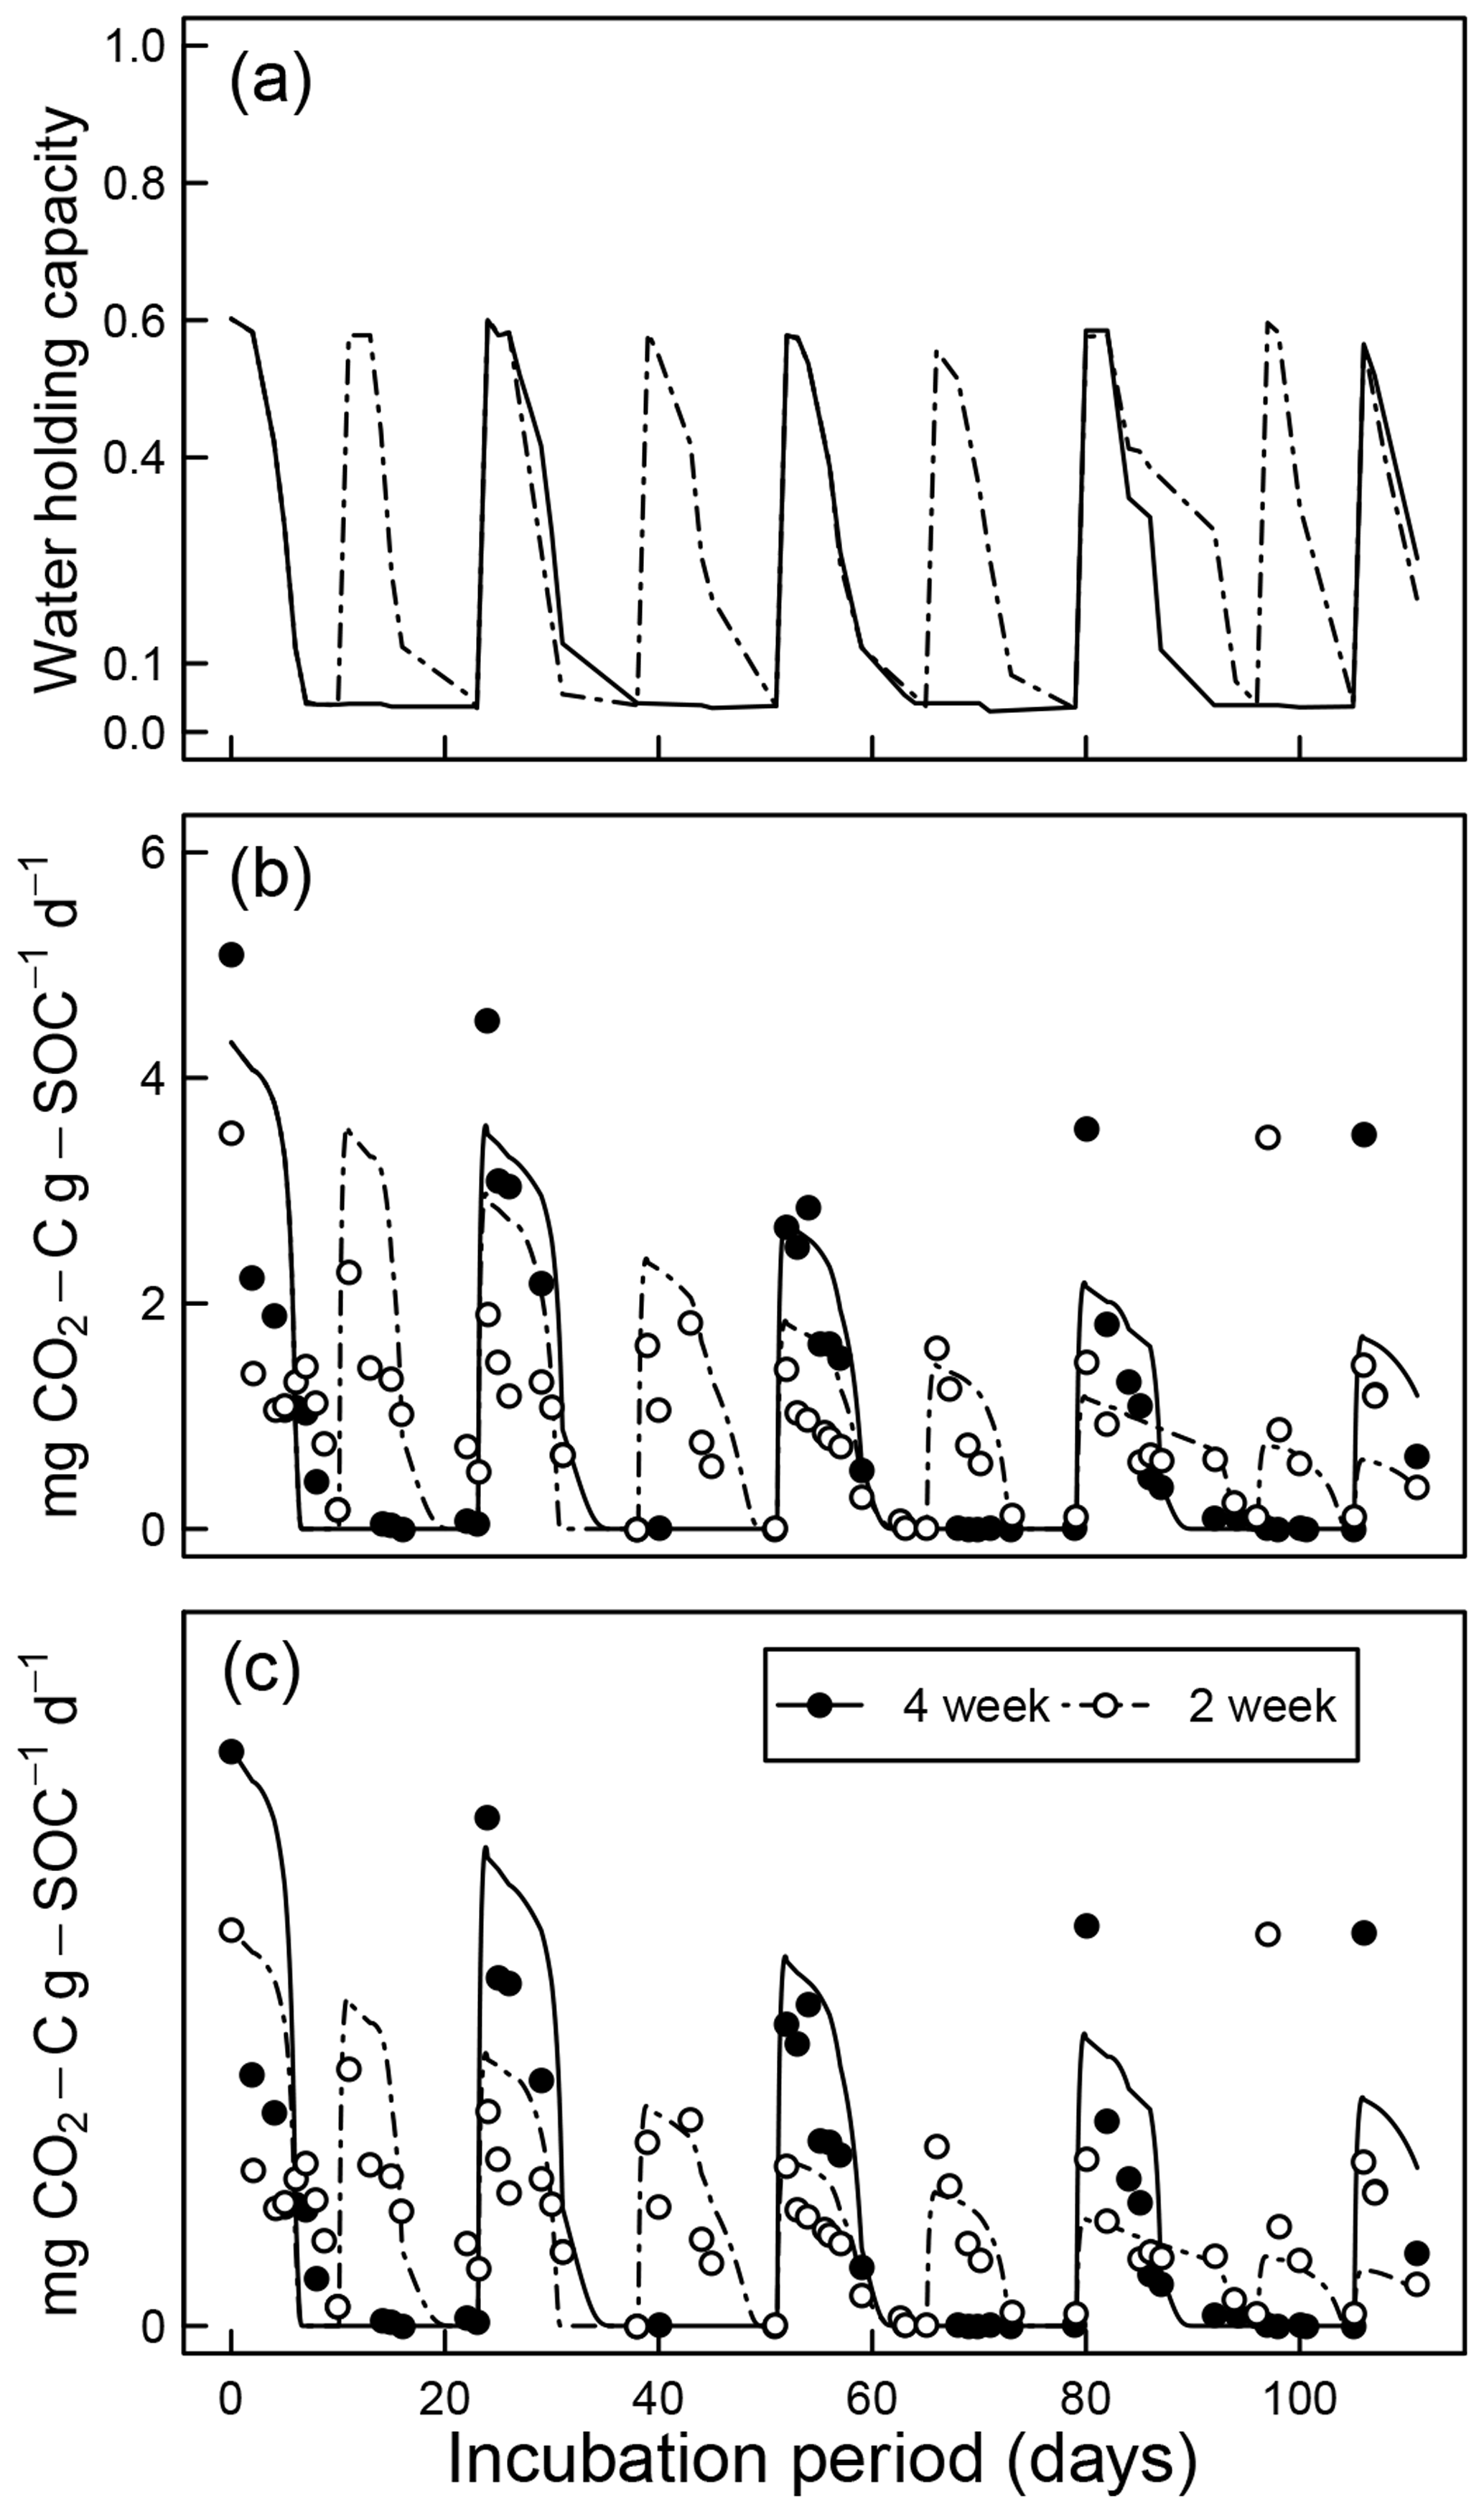
Figure 10Model evaluation by comparison with experiment of Miller et al. (2005) under drying and rapid-wetting conditions (2- and 4-week intervals): (a) observed dynamics of water holding capacity; (b) comparison of measured CO2 efflux with model prediction assuming identical optimal decomposition rate κo for both wetting intervals; and (c) same as above but with different κo parameters for the two wetting intervals.
In the remainder of the discussions, soil matric potential is considered the primary independent state variable, while water content and decomposition modifiers are all functions that depend on water potential. For all the soils investigated, the peak decomposition rate was approximately 60 % (Fig. 5) of the optimal rate that would occur if aqueous diffusion, gaseous diffusion, and water potential were not limiting. Thus, in soils where one or more of these factors are limiting across the spectrum of possible moisture range, SOM decomposition occurs under a suboptimal rate. The individual contributions of these limiting factors are shown in Fig. A1. The effect of water potential is assumed to be due to matric potential only. This assumption ignores an increase in solute concentration during drying and associated decrease in matric potential. The limiting effects of aqueous and gaseous diffusion directly depend on water content and porosity, therefore depending on SWC.
Soils with a broad range of pore-size distribution drain incrementally over a wide range of matric potential, thus maintaining a broad range of favorable moisture status. This is clearly demonstrated in the contrast between the moisture sensitivity of the meadow soils and the rest of the soils. Most of the meadow soils show peak decomposition between −1000 and −10 kPa, with a rapid drop in decomposition when approaching saturated conditions. Recall that the minimum effective rate for saturated soils varies with κa.min, which reflects distance from the soil surface (see Fig. 2a). The value of this parameter is likely to be lower in field conditions than for experimental cores. The rest of the mineral soils exhibit peak decomposition over a narrow range of matric potential. The peak for the latter generally occurs at a moisture level wetter than field capacity. Compression of the mineral soils studied by Franzluebbers (1999) lowered the matric potential at which peak rate occurs. This is to be expected as compression reduces the pore sizes, thereby decreasing the matric potential needed to drain the pores.
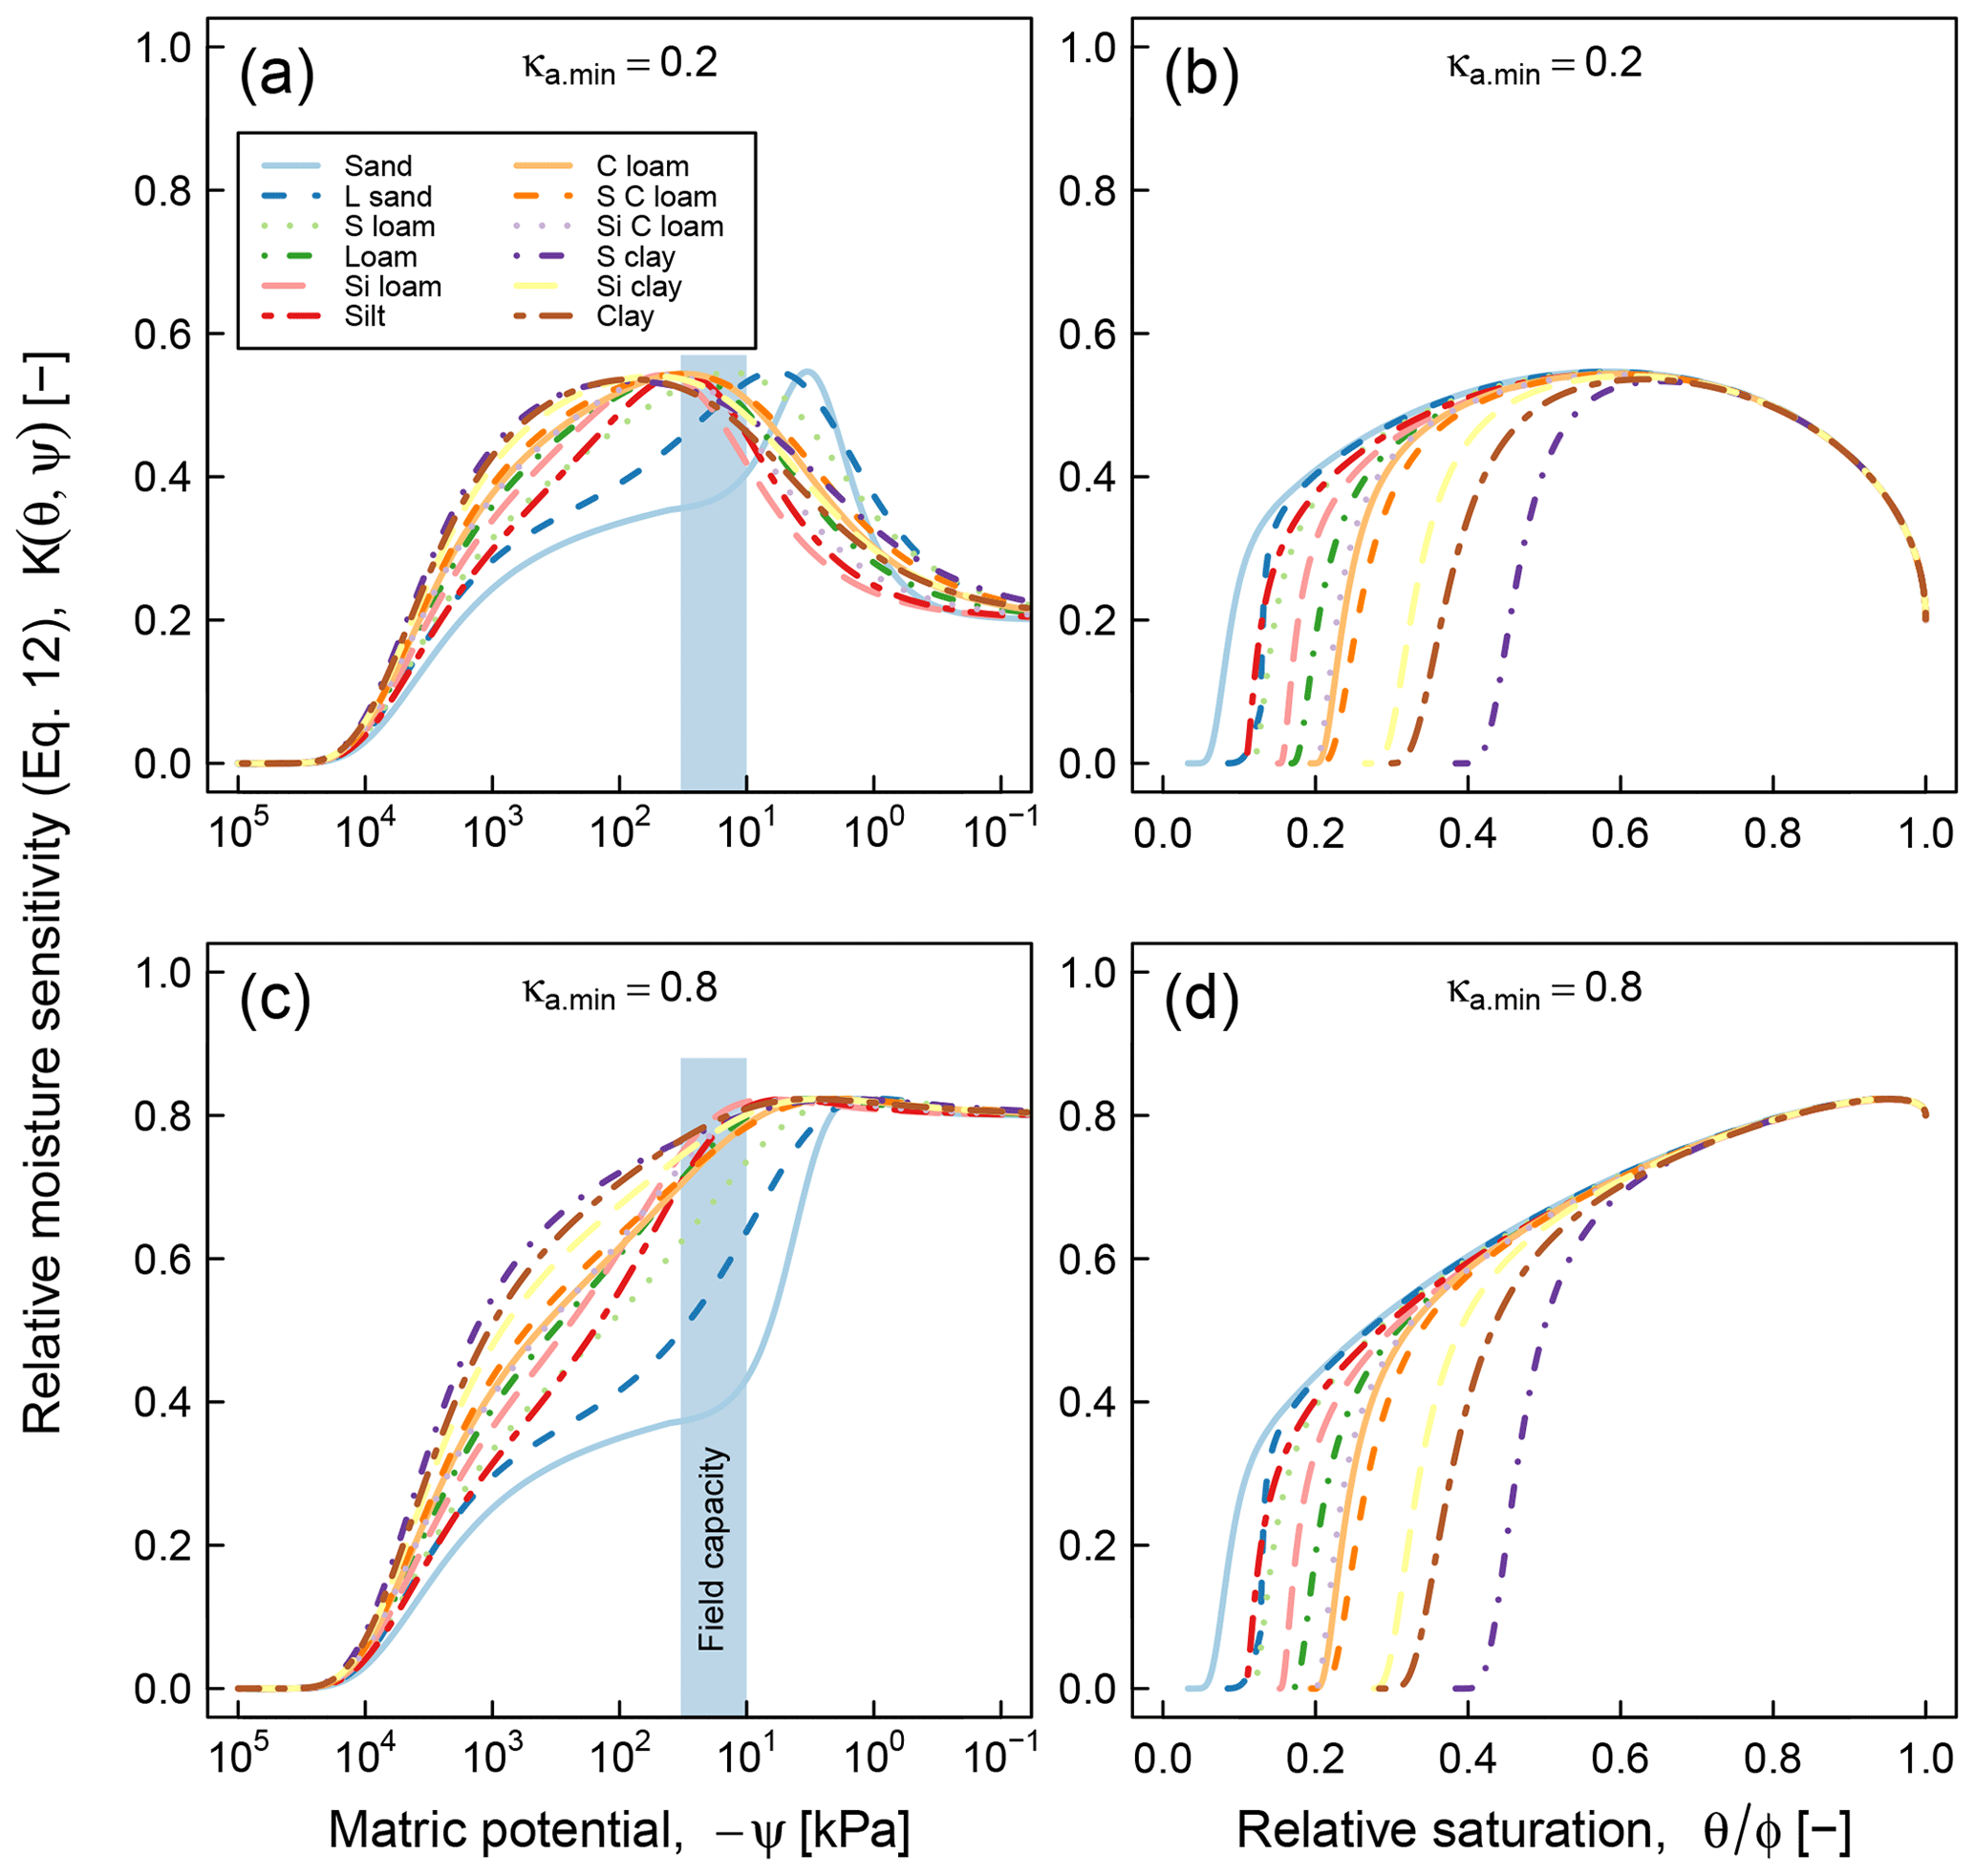
Application of the proposed model requires availability of water retention characteristic, which may pose a practical limitation in cases when water retention data cannot be readily acquired. Availability of only a handful of datasets that we could use for testing the proposed model, despite the fact that decomposition experiments at varying moisture statuses have been done numerous times, is clear evidence of this challenge. As a stopgap measure, it is possible to use pedotransfer functions to infer SWC parameters based on routinely measured soil characteristics such as texture, bulk density, and organic matter content (Vereecken et al., 1989; Schaap et al., 2011; Van Looy et al., 2017). The application of pedotransfer functions in predicting moisture sensitivity (Eq. 12) is illustrated in Fig. 11. The SWC parameters of each class were generated by the ROSETTA pedotransfer model, using class-average sand, silt, clay, and SOM content as well as bulk density in the model database (Schaap et al., 2011). As in Fig. 5, two values of the parameter κa.min (0.2, and 0.8) were tested and the results are reported as functions of matric potential and relative moisture saturation. These curves clearly show textural effects on SOC dynamics. The coarse-textured soils (sand and loamy sand) exhibit optimal respiration rates over a narrow range of matric potential that exceeds field capacity, whereas fine-textured soils (sandy clay, silt clay, and clay) exhibit a broader matric potential range of optimal respiration rate, which is on the order of −1000 to −100 kPa. In terms of effective saturation, the parameter κa.min plays the most significant role in determining the optimal saturation level. At , the value that was used for testing the model against respiration data, the optimal effective saturation is approximately equal to 0.6. Other factors related to soil texture and structure, including mineralogy, surface area, and aggregation, are not accounted for in these moisture sensitivity curves.
It is informative to compare the above results with data-driven (statistical) moisture sensitivity functions derived by Moyano et al. (2012; see their Fig. 3). In both models, the matric potential at peak relative respiration decreases (becomes more negative) with increasing clay content (degree of textural fineness). However, the models differ in their prediction of the range of matric potential at which respiration remains elevated. Our model shows a distinct peak of respiration over a very narrow range for the two coarsest textures (sand and loam sand), whereas the curves predicted by Moyano et al. (2012) have a similar overall pattern across the entire range of clay content analyzed. The most remarkable difference appears in the moisture sensitivity functions expressed as functions of relative saturation. The model of Moyano et al. (2012) predicts that respiration decreases nearly linearly until the soils are completely dry (saturation = 0). Whereas our model suggests that respiration ceases when the saturation drops to residual moisture content. The prediction is based on the fact that in very dry soils, the matric potential decreases very rapidly with very small decrease in water content. Therefore, the prediction of our model in the dry end appears sound. Another distinction between the two models is related to the role of SOM in moisture sensitivity. Although our model does not directly incorporate the effect of SOM in moisture sensitivity, the effect of SOM or SWC would also be reflected as a variation in moisture sensitivity with change in SOM. In contrast, the model of Moyano et al. (2012) predicts no effect of SOM moisture sensitivity function.
Knowledge of controls on soil C dynamics has improved in recent years and the focus has switched from predominantly molecular level controls on SOM decomposition/stability to a broader recognition that environmental and physical conditions are more important controls on persistence of SOM. While the influence of temperature on SOM decomposition has received considerable attention, water remains the primary variable that confounds our ability to predict how soils in all climate zones will respond to perturbations, both human-induced or naturally caused (Wieder et al., 2017). This model provides one approach to bridging that gap (Kleber, 2010; Schmidt et al., 2011). The model has been applied to a wide range of soil types highlighting the critical but underrepresented role that soil structure and water play. Results shown in Fig. 5 suggest that peat and organic soils (Arnold et al., 2015), once drained below a threshold, are prone to rapid loss of SOC over a wide range of water potential, as their bimodal pore-size distribution allows them to retain sufficient moisture to promote microbial activity. The effect of warming on increasing microbial activity and rapid C loss from cold high-altitude and high-latitude environments has received considerable attention in recent years (Wieder et al., 2017). SOM in these regions has been protected in part by anoxic conditions. The model proposed here suggests these soils are prone to accelerated loss of SOM due to the extended water potential range for peak decomposition afforded to them by virtue of their pore structure. This hypothesis has yet to be tested (Ise et al., 2008).
The above observations also show the importance of dynamics of the physical structure of soils (e.g., tillage or slaking) in regulating SOM dynamics. For example, this model suggests that disturbance of aggregated soils initially promotes rapid mineralization by widening the pore-size distribution. This mechanism is in addition to the oft-credited liberation of SOM protected inside soil aggregates. However, with repeated wetting–drying cycles, the soil structure is restored to its pre-tillage state by slaking of aggregates or reconsolidation by capillary forces (Ghezzehei and Or, 2000; Liu et al., 2014; Or et al., 2000). Therefore rapid loss of C in tilled soils is likely to be short-lived. If true, this self-limiting phenomenon is likely to have had a beneficial effect in pre-industrial agriculture, when crop nutrition was derived by recycling of SOM. High demand for nutrients during the early season is matched by rapid mineralization, while a slowdown later in the season protects SOM for subsequent seasons. To address these effects of soil structure dynamics, it is important to incorporate the effect of soil structure in SWC.
The assumptions underlying the proposed model need to be tested and evaluated for a wide range of soil environments. It is likely that sensitivity to water potential varies across soil types and the specific microbial communities. Therefore, variations in the slope of the water potential sensitivity curve λ across soil types and environments need to be evaluated. Contribution of salinity to total water potential is not accounted for here. Provided that total solute concentration remains constant, it is possible to estimate the dissolved fraction and its osmotic potential using sorption–desorption isotherms. However, in soils that regularly receive considerable salt inputs (e.g., saline irrigation water, fertilizers, atmospheric depositions), complete solute balance consideration is necessary.
In summary, the proposed model opens a new way of interrogating the effect of soil structure, structural dynamics, and hydrologic processes on SOM dynamics. It is a valuable tool that can support the formulation of testable and quantitative hypotheses. With proper calibration and testing, this model has the potential to fill the gap of the much needed coupling between biogeochemical cycling and soil hydrology over a wide range of temporal and spatial scales.
All of the datasets used in this study and the R codes used to analyze the data and produce the figures included in this paper are available at (https://doi.org/10.6084/m9.figshare.7749332.v1, Ghezzehei et al., 2019).
Table A1Best-fit water retention curve and SOM dynamics model parameters.
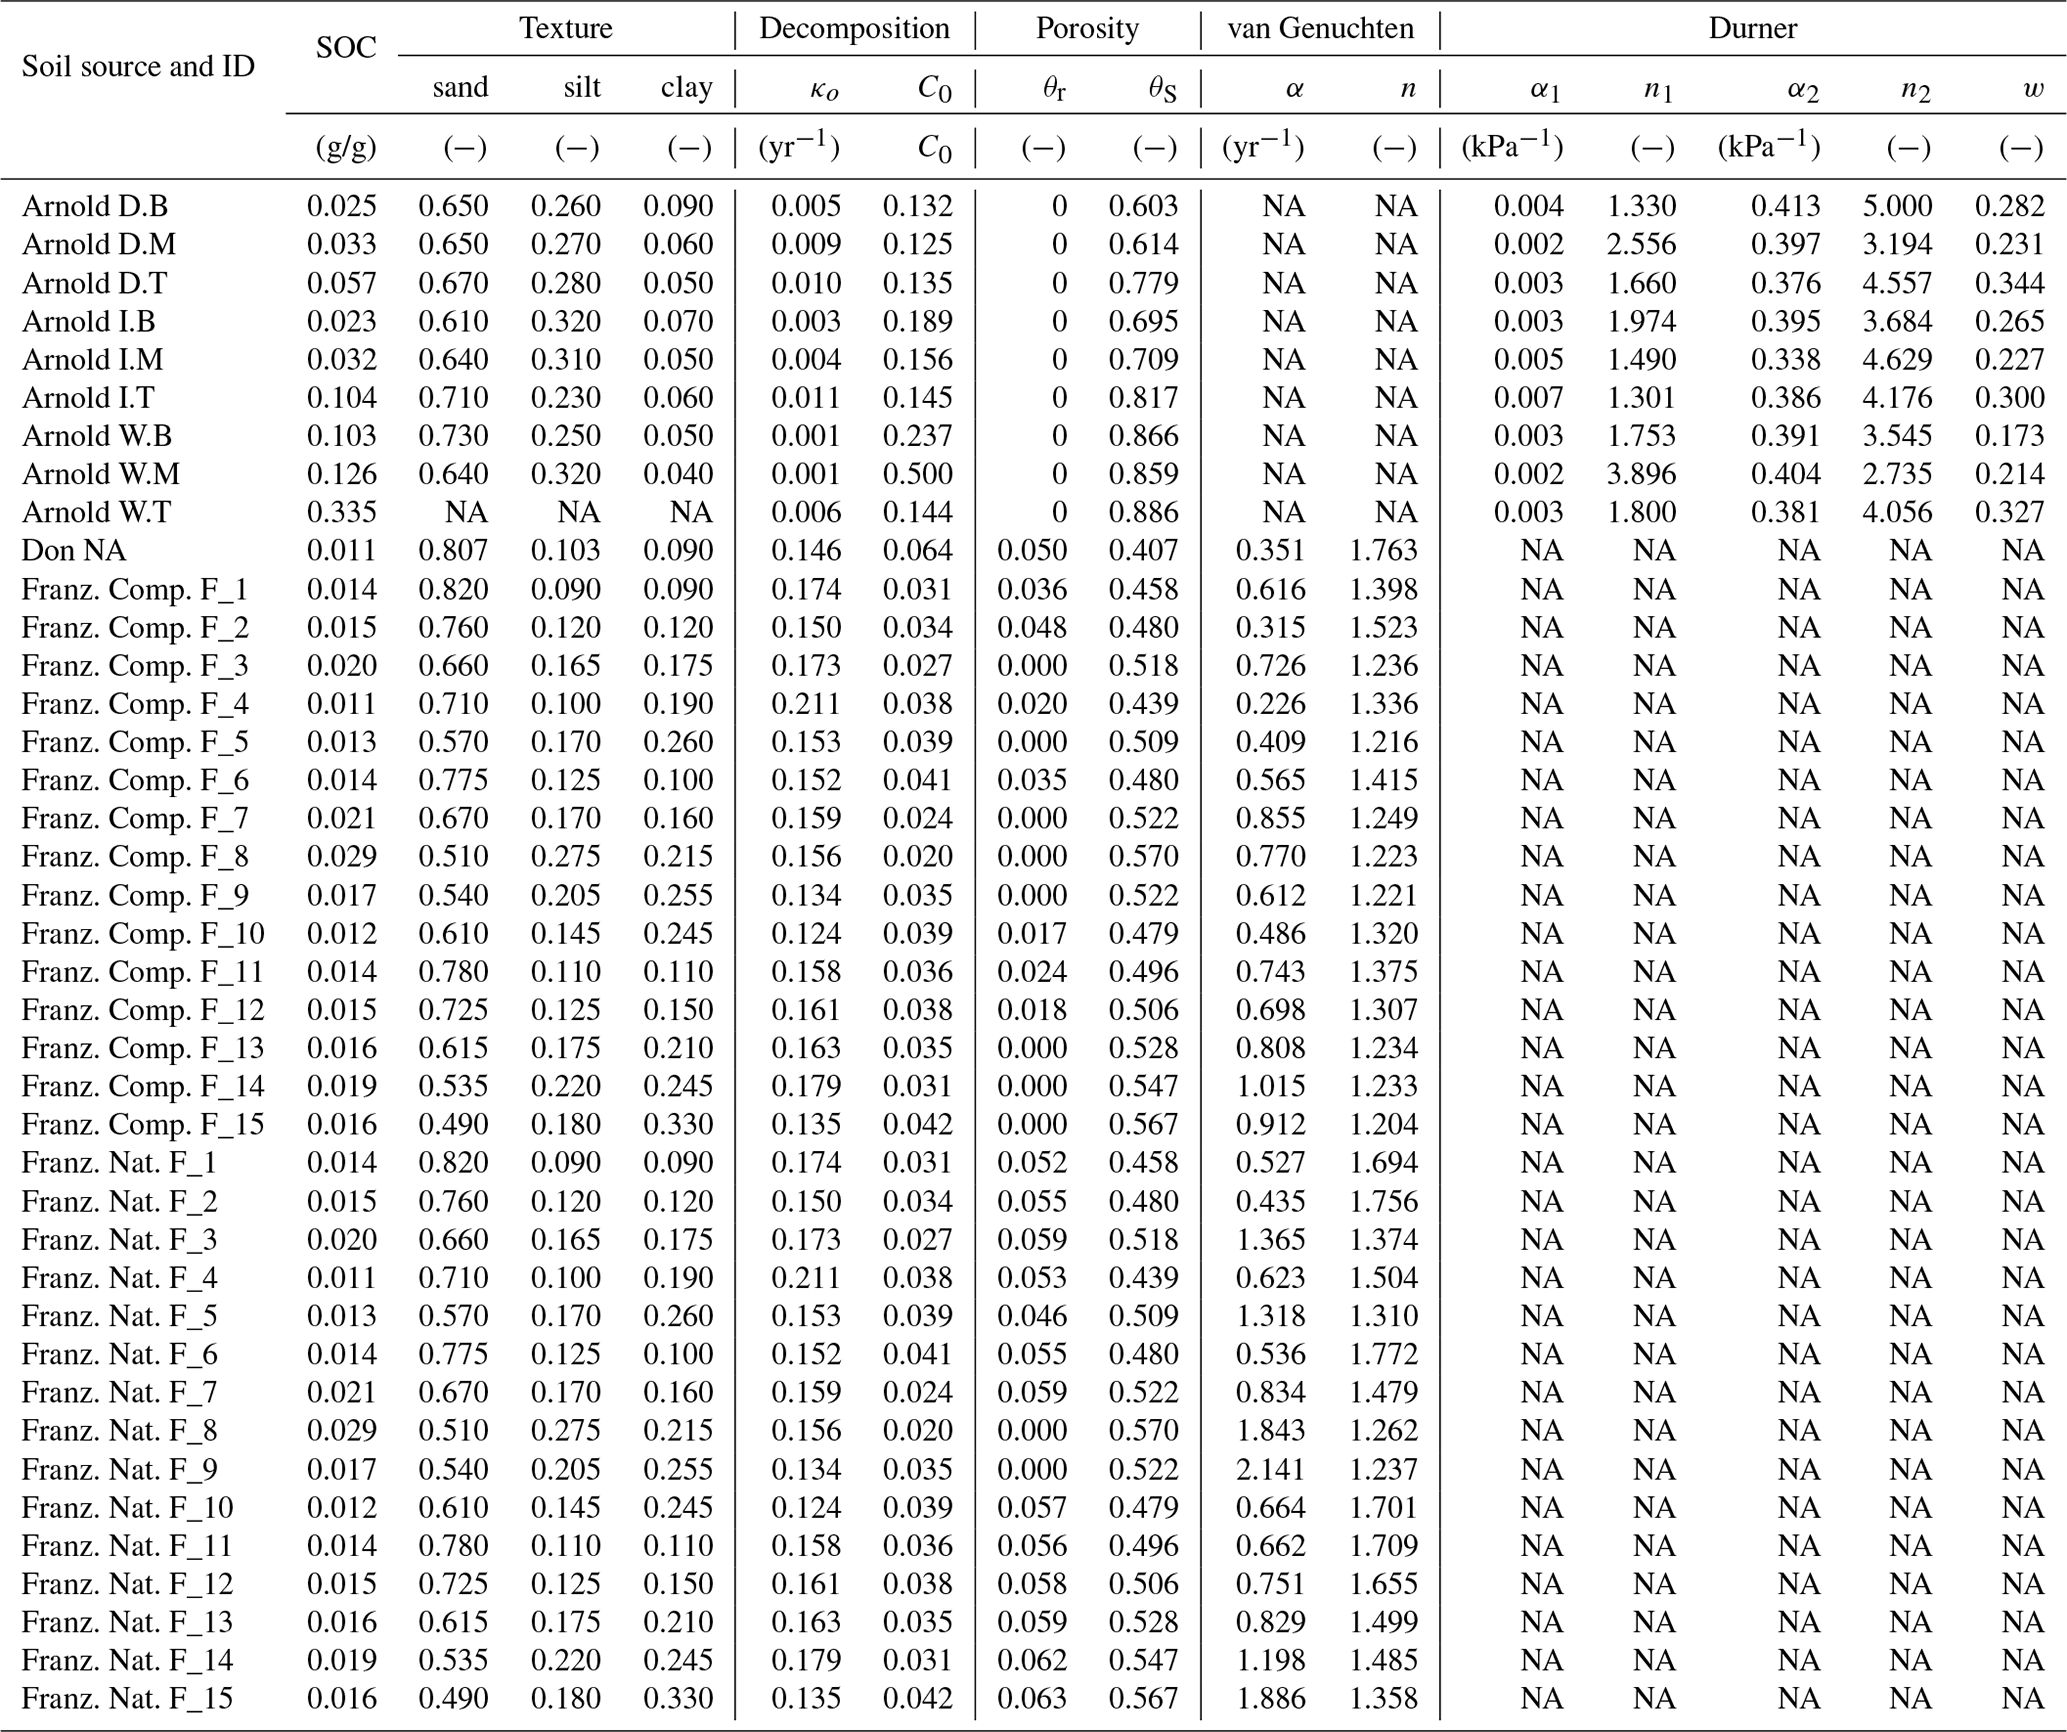

Figure A1Moisture-dependent relative (dimensionless) parameters of 51 different soils: (a) decay rate and (b) fraction of bioavailable SOC. Each of the curves is entirely dependent on the water retention characteristic of the respective soils. The dashed lines of the Franzluebbers soils denote compressed samples. PWP is permanent wilting point ( kPa) and FC is field capacity ( kPa).

Figure A2Decomposition experiments of Arnold et al. (2015) fitted CO2 evolution data from a 395-day incubation experiment: (a) wet meadow, (b) intermediate meadow, and (c) dry meadow.
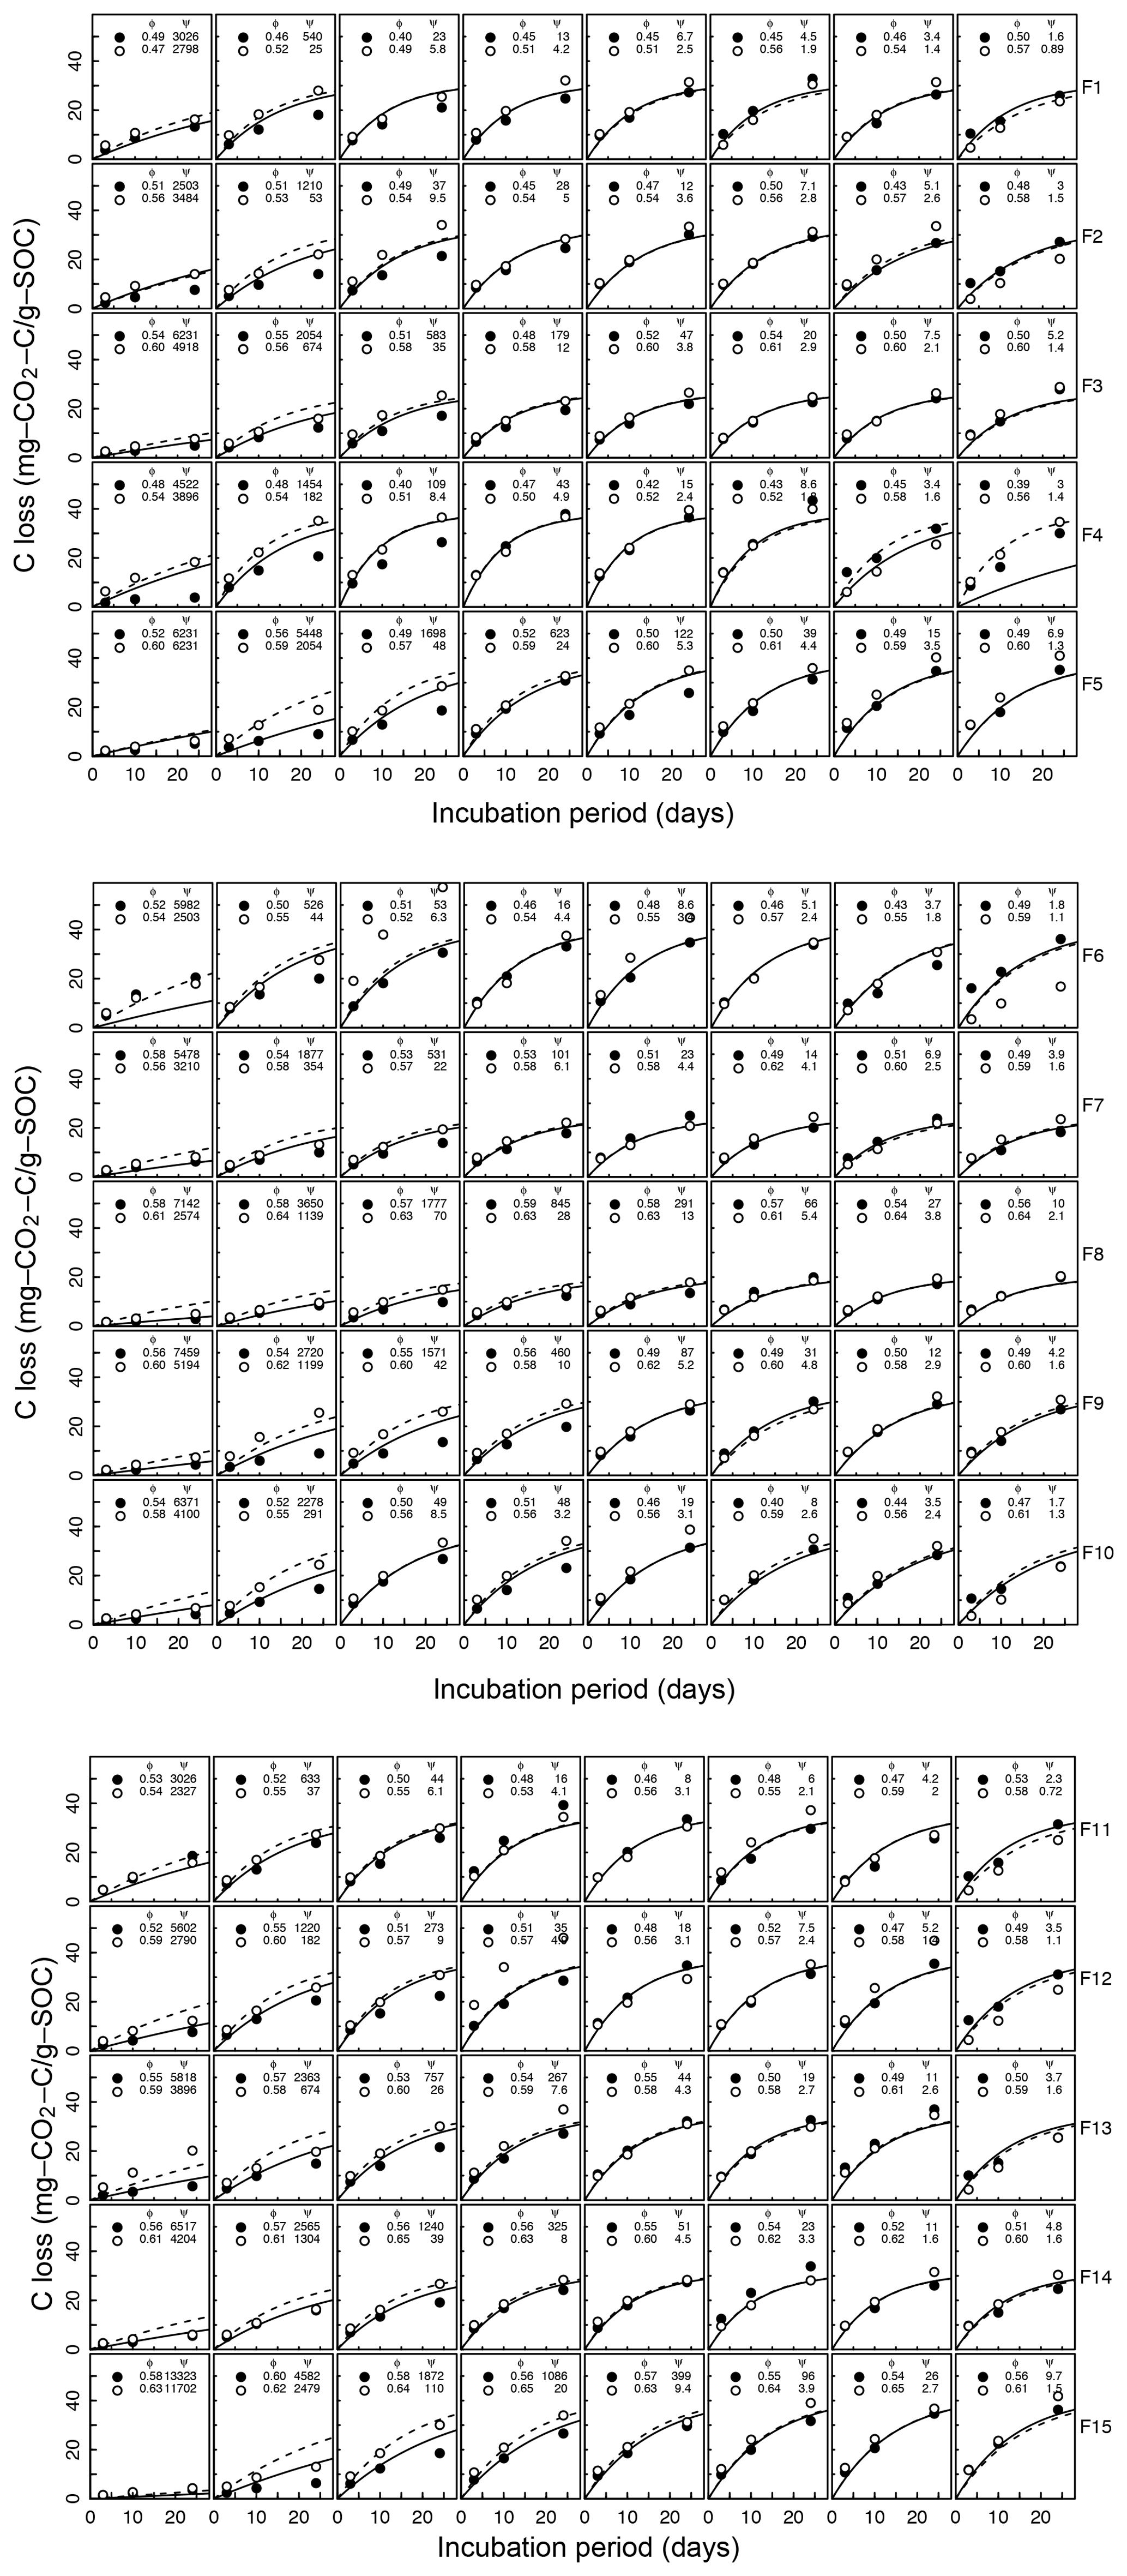
Figure A3Decomposition experiments of Franzluebbers et al. (1999), fitted CO2 evolution data. Fifteen different soils packed at two bulk density values incubated eight matric potential levels for 24 days. The porosity, water potential, and RMSE of each sample are shown inside.
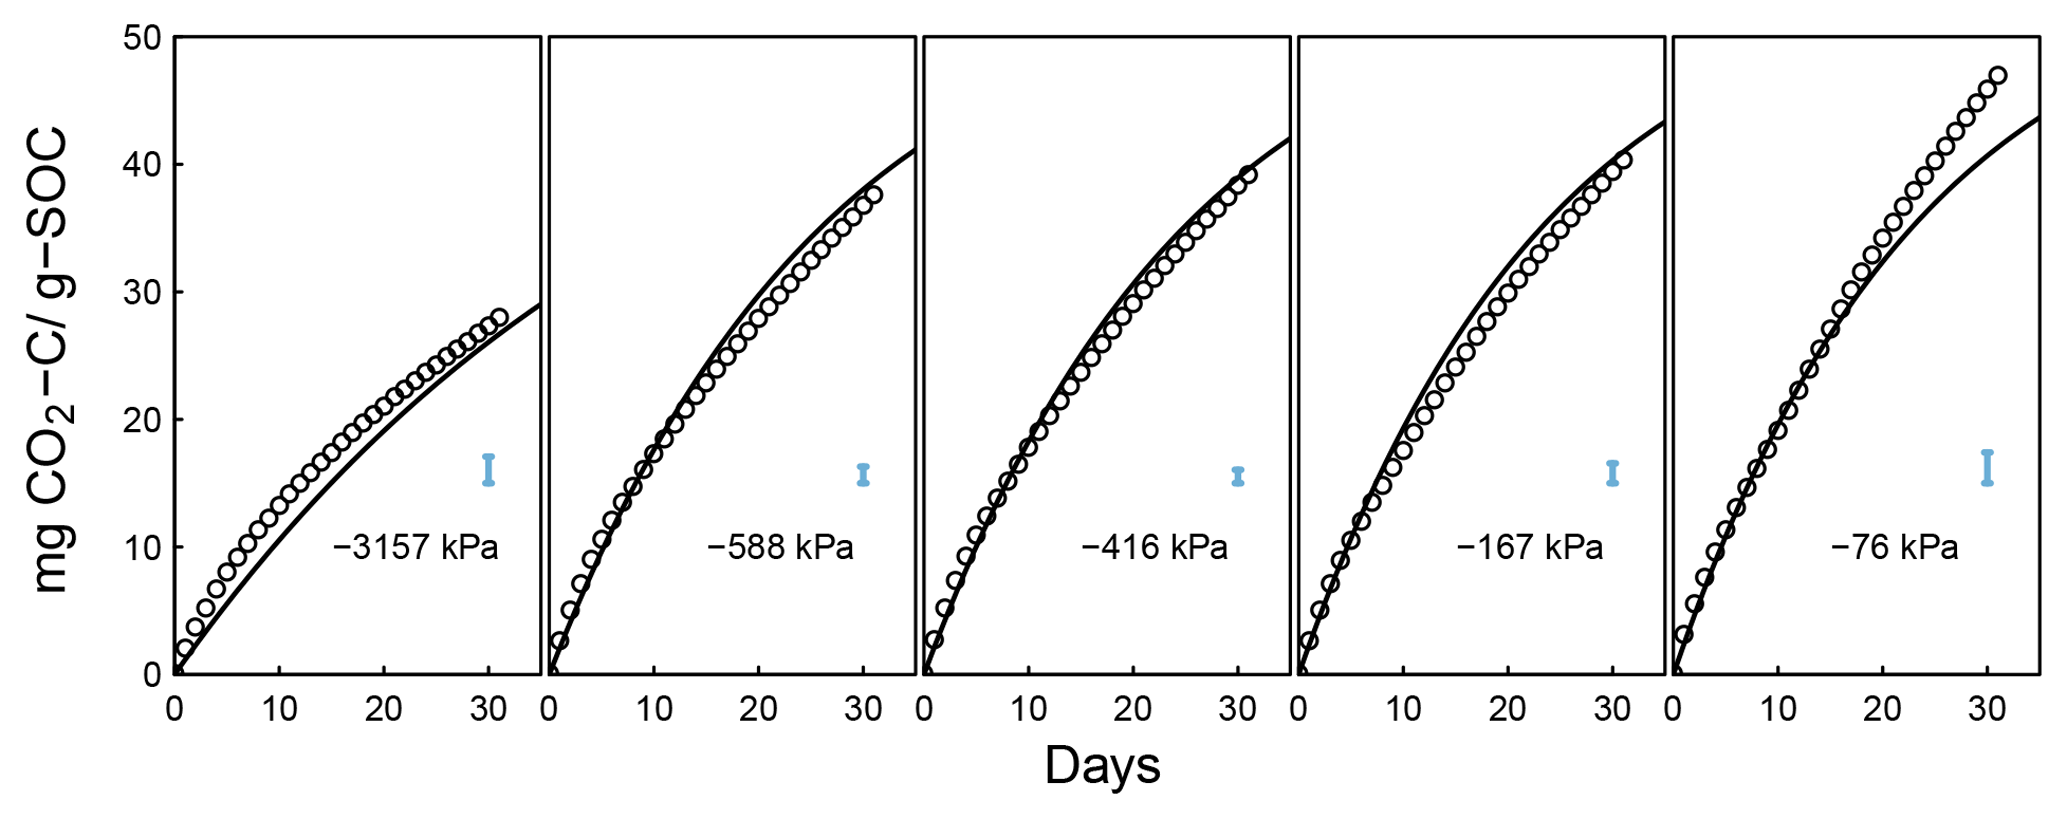
Figure A4Decomposition experiments of Don (data from Moyano, 2012), fitted CO2 evolution data. Error bars denote RMSE.
TAG led model development and writing; BS provided key insights and linkages with the current state of studies and models on this topic; CLA coordinated a portion of the experimental data; CLA, NAB, and AAB helped with creating the conceptual basis of the model.
The authors declare that they have no conflict of interest.
Two rounds of constructive criticisms and recommendations by Ali Ebrahimi, Fernando
Moyano, and three anonymous reviewers have
significantly improved the final quality of this paper. Partial funding by the US
National Science Foundation, Division of Earth Sciences, Geomorphology, and Land Use
Dynamics program (EAR-1324919) is gratefully acknowledged. Benjamin Sulman was supported
by the US Department of Energy, Office of Science, Office of
Biological and Environmental Research.
Edited by: Michael Weintraub
Reviewed by: Ali Ebrahimi, Fernando Moyano,
and three anonymous referees
Angert, A., Yakir, D., Rodeghiero, M., Preisler, Y., Davidson, E. A., and Weiner, T.: Using O2 to study the relationships between soil CO2 efflux and soil respiration, Biogeosciences, 12, 2089–2099, https://doi.org/10.5194/bg-12-2089-2015, 2015.
Aravena, J. E., Berli, M., Ruiz, S., Suárez, F., Ghezzehei, T. A., and Tyler, S. W.: Quantifying coupled deformation and water flow in the rhizosphere using X-ray microtomography and numerical simulations, Plant Soil, 376, 95–110, https://doi.org/10.1007/s11104-013-1946-z, 2013.
Arnold, C., Ghezzehei, T. A., and Berhe, A. A.: Decomposition of distinct organic matter pools is regulated by moisture status in structured wetland soils, Soil Biol. Biochem., 81, 28–37, https://doi.org/10.1016/j.soilbio.2014.10.029, 2015.
Birch, H. F.: The effect of soil drying on humus decomposition and nitrogen availability, Plant and Soil, 10, 9–31, 1958.
Carbone, M. S., Still, C. J., Ambrose, A. R., Dawson, T. E., Williams, A. P., Boot, C. M., Schaeffer, S. M., and Schimel, J. P.: Seasonal and episodic moisture controls on plant and microbial contributions to soil respiration, Oecologia, 167, 265–278, https://doi.org/10.1007/s00442-011-1975-3, 2011.
Chowdhury, N., Marschner, P., and Burns, R.: Response of microbial activity and community structure to decreasing soil osmotic and matric potential, Plant Soil, 344, 241–254, https://doi.org/10.1007/s11104-011-0743-9, 2011a.
Chowdhury, N., Marschner, P., and Burns, R. G.: Soil microbial activity and community composition: Impact of changes in matric and osmotic potential, Soil Biol. Biochem., 43, 1229–1236, https://doi.org/10.1016/j.soilbio.2011.02.012, 2011b.
Coleman, K. and Jenkinson, D. S.: RothC-26.3 – A Model for the turnover of carbon in soil, in: Evaluation of Soil Organic Matter Models, 237–246, Springer, Berlin, Heidelberg, 1996.
Csonka, L. N.: Physiological and genetic responses of bacteria to osmotic stress, Microbiol. Rev., 53, 121–147, 1989.
Davidson, E. A., Samanta, S., Caramori, S. S., and Savage, K.: The Dual Arrhenius and Michaelis–Menten kinetics model for decomposition of soil organic matter at hourly to seasonal time scales, Glob. Change Biol., 18, 371–384, https://doi.org/10.1111/j.1365-2486.2011.02546.x, 2012.
Durner, W.: Hydraulic Conductivity Estimation for Soils with Heterogeneous Pore Structure, Water Resour. Res., 30, 211–223, 1994.
Ebrahimi, A. and Or, D.: Microbial community dynamics in soil aggregates shape biogeochemical gas fluxes from soil profiles – upscaling an aggregate biophysical model., Glob. Change. Biol., 1–16, https://doi.org/10.1111/gcb.13345, 2016.
Elzhov, T. V., Mullen, K. M., Spiess, A.-N., and Bolker, B.: minpack.lm: R Interface to the Levenberg-Marquardt Nonlinear Least-Squares Algorithm Found in MINPACK, Plus Support for Bounds, R Foundation for Statistical Computing, available at: https://cran.r-project.org/web/packages/minpack.lm/index.html (1 March 2019), 2016.
Finsterle, S. and Persoff, P.: Determining permeability of tight rock samples using inverse modeling, Water Resour. Res., 33, 1803–1811, https://doi.org/10.1029/97WR01200, 1997.
Franzluebbers, A. J.: Microbial activity in response to water-filled pore space of variably eroded southern Piedmont soils, Appl. Soil. Ecol., 11, 91–101, 1999.
Ghezzehei, T. A. and Or, D.: Dynamics of soil aggregate coalescence governed by capillary and rheological processes, Water Resour. Res., 36, 367–379, https://doi.org/10.1029/1999WR900316, 2000.
Grajek, W. and Gervais, P.: Influence of water activity on the enzyme biosynthesis and enzyme activities produced by Trichoderma viride TS in solid-state fermentation, Enzyme Mircrob. Tech., 9, 658–662, https://doi.org/10.1016/0141-0229(87)90123-2, 1987.
Harris, R. F.: Effect of Water Potential on Microbial Growth and Activity, Water Potential Relations in Soil Microbiology, SSSA Spec. Publ., 9, 23–95, https://doi.org/10.2136/sssaspecpub9.c2, 1981.
Hillel, D.: Environmental soil physics, Academic Press, San Diego, 1998.
Iden, S. C. and Durner, W.: Comment on “Simple consistent models for water retention and hydraulic conductivity in the complete moisture range” by Peters, A., Water Resour. Res., 50, 7530–7534, 2014.
Ise, T., Dunn, A. L., Wofsy, S. C., and Moorcroft, P. R.: High sensitivity of peat decomposition to climate change through water-table feedback, Nat. Geosci., 1, 763–766, https://doi.org/10.1038/ngeo331, 2008.
Kleber, M.: Response to the Opinion paper by von Lützow, M. and Kögel-Knabner, I. on “What is recalcitrant soil organic matter?” by Kleber, M., Environ. Chem., 7, 336–337, 2010.
Kredics, L., Antal, Z., and Manczinger, L.: Influence of Water Potential on Growth, Enzyme Secretion and In Vitro Enzyme Activities of Trichoderma harzianumat Different Temperatures, Curr. Microbiol., 40, 310–314, https://doi.org/10.1007/s002849910062, 2000.
Linn, D. M. and Doran, J. W.: Effect of Water-Filled Pore Space on Carbon Dioxide and Nitrous Oxide Production in Tilled and Nontilled Soils 1, Soil Sci. Soc. Am. J., 48, 1267–1272, https://doi.org/10.2136/sssaj1984.03615995004800060013x, 1984.
Liu, X., Lu, S., Horton, R., and Ren, T.: In Situ Monitoring of Soil Bulk Density with a Thermo-TDR Sensor, Soil Sci. Soc. Am. J., 78, 400–407, https://doi.org/10.2136/sssaj2013.07.0278, 2014.
Manzoni, S. and Katul, G.: Invariant soil water potential at zero microbial respiration explained by hydrological discontinuity in dry soils, Geophys. Res. Lett., 41, 7151–7158, https://doi.org/10.1002/2014GL061467, 2014.
Manzoni, S., Moyano, F., Kätterer, T., and Schimel, J.: Modeling coupled enzymatic and solute transport controls on decomposition in drying soils, Soil Biol. Biochem., 95, 275–287, 2016.
Miller, A. E., Schimel, J. P., Meixner, T., Sickman, J. O., and Melack, J. M.: Episodic rewetting enhances carbon and nitrogen release from chaparral soils, Soil Biol. Biochem., 37, 2195–2204, https://doi.org/10.1016/j.soilbio.2005.03.021, 2005.
Moldrup, P., Olesen, T., Yoshikawa, S., Komatsu, T., and Rolston, D. E.: Three-Porosity Model for Predicting the Gas Diffusion Coefficient in Undisturbed Soil, Soil Sci. Soc. Am. J., 68, 750–759, https://doi.org/10.2136/sssaj2004.7500, 2004.
Monard, C., Mchergui, C., Nunan, N., Martin-Laurent, F., and Vieublé-Gonod, L.: Impact of soil matric potential on the fine-scale spatial distribution and activity of specific microbial degrader communities, Fems Microbiol. Ecol., 81, 673–683, https://doi.org/10.1111/j.1574-6941.2012.01398.x, 2012.
Moyano, F. E., Vasilyeva, N., Bouckaert, L., Cook, F., Craine, J., Curiel Yuste, J., Don, A., Epron, D., Formanek, P., Franzluebbers, A., Ilstedt, U., Kätterer, T., Orchard, V., Reichstein, M., Rey, A., Ruamps, L., Subke, J.-A., Thomsen, I. K., and Chenu, C.: The moisture response of soil heterotrophic respiration: interaction with soil properties, Biogeosciences, 9, 1173–1182, https://doi.org/10.5194/bg-9-1173-2012, 2012.
Moyano, F. E., Manzoni, S., and Chenu, C.: Responses of soil heterotrophic respiration to moisture availability: An exploration of processes and models, Soil Biol. Biochem., 59, 72–85, https://doi.org/10.1016/j.soilbio.2013.01.002, 2013.
Moyano, F. E., Vasilyeva, N., and Menichetti, L.: Diffusion limitations and Michaelis-Menten kinetics as drivers of combined temperature and moisture effects on carbon fluxes of mineral soils, Biogeosciences, 15, 5031–5045, https://doi.org/10.5194/bg-15-5031-2018, 2018.
Or, D. and Tuller, M.: Liquid retention and interfacial area in variably saturated porous media: Upscaling from single-pore to sample-scale model, Water Resour. Res., 35, 3591–3605, 1999.
Or, D., Leij, F. J., Snyder, V., and Ghezzehei, T. A.: Stochastic model for posttillage soil pore space evolution, Water Resour. Res., 36, 1641–1652, 2000.
Parton, W. J., Hartman, M., Ojima, D., and Schimel, D.: DAYCENT and its land surface submodel: description and testing, Global Planet. Change, 19, 35–48, https://doi.org/10.1016/S0921-8181(98)00040-X, 1998.
Pisani, L.: Simple Expression for the Tortuosity of Porous Media, Transport Porous Med., 88, 193–203, https://doi.org/10.1007/s11242-011-9734-9, 2011.
R Core Team: R: A Language and Environment for Statistical Computing, R Foundation for Statistical Computing, Vienna, Austria, 2017.
Ruiz, S., Or, D., and Schymanski, S. J.: Soil Penetration by Earthworms and Plant Roots – Mechanical Energetics of Bioturbation of Compacted Soils, edited by: Balestrini, R., PLOS One, 10, e0128914, https://doi.org/10.1371/journal.pone.0128914, 2015.
Schaap, M. G., Leij, F. J., and van Genuchten, M. T.: ROSETTA: A computer program for estimating soil hydraulic parameters with hierarchical pedotransfer functions, J. Hydrol., 251, 163–176, https://doi.org/10.1016/S0022-1694(01)00466-8, 2001.
Schindler, U., Durner, W., von Unold, G., Mueller, L., and Wieland, R.: The evaporation method: Extending the measurement range of soil hydraulic properties using the air-entry pressure of the ceramic cup, J. Plant Nutr. Soil Sc., 173, 563–572, https://doi.org/10.1002/jpln.200900201, 2010.
Schjønning, P., Thomsen, I. K., Moldrup, P., and Christensen, B. T.: Linking Soil Microbial Activity to Water- and Air-Phase Contents and Diffusivities, Soil Sci. Soc. Am. J., 67, 156–165, https://doi.org/10.2136/sssaj2003.1560, 2003.
Schjønning, P., Thomsen, I. K., Petersen, S. O., Kristensen, K., and Christensen, B. T.: Relating soil microbial activity to water content and tillage-induced differences in soil structure, Geoderma, 163, 256–264, https://doi.org/10.1016/j.geoderma.2011.04.022, 2011.
Schmidt, M. W. I., Torn, M. S., Abiven, S., Dittmar, T., Guggenberger, G., Janssens, I. A., Kleber, M., Kogel-Knabner, I., Lehmann, J., Manning, D. A. C., Nannipieri, P., Rasse, D. P., Weiner, S., and Trumbore, S. E.: Persistence of soil organic matter as an ecosystem property, Nature, 478, 49–56, https://doi.org/10.1038/nature10386, 2011.
Scott, N. A., Cole, C. V., Elliott, E. T., and Huffman, S. A.: Soil Textural Control on Decomposition and Soil Organic Matter Dynamics, Soil Sci. Soc. Am. J., 60, 1102–1109, https://doi.org/10.2136/sssaj1996.03615995006000040020x, 1996.
Sierra, C. A., Malghani, S., and Loescher, H. W.: Interactions among temperature, moisture, and oxygen concentrations in controlling decomposition rates in a boreal forest soil, Biogeosciences, 14, 703–710, https://doi.org/10.5194/bg-14-703-2017, 2017.
Skopp, J., Jawson, M. D., and Doran, J. W.: Steady-State Aerobic Microbial Activity as a Function of Soil Water Content, Soil Sci. Soc. Am. J., 54, 1619–1625, https://doi.org/10.2136/sssaj1990.03615995005400060018x, 1990.
Skujins, J. J. and McLaren, A. D.: Enzyme Reaction Rates at Limited Water Activities, Science, 158, 1569–1570, https://doi.org/10.1126/science.158.3808.1569, 1967.
Stark, J. M. and Firestone, M. K.: Mechanisms for soil moisture effects on activity of nitrifying bacteria, Appl. Environ. Microb., 61, 218–221, 1995.
Sulman, B. N., Desai, A. R., Schroeder, N. M., Ricciuto, D., Barr, A., Richardson, A. D., Flanagan, L. B., Lafleur, P. M., Tian, H., Chen, G., Grant, R. F., Poulter, B., Verbeeck, H., Ciais, P., Ringeval, B., Baker, I. T., Schaefer, K., Luo, Y., and Weng, E.: Impact of hydrological variations on modeling of peatland CO2 fluxes: Results from the North American Carbon Program site synthesis, J. Geophys. Res.-Biogeo., 117, G01031, https://doi.org/10.1029/2011JG001862, 2012.
Šimůnek, J., van Genuchten, M. T., and Šejna, M.: Recent Developments and Applications of the HYDRUS Computer Software Packages, Vadose Zone J., 15, https://doi.org/10.2136/vzj2016.04.0033, 2016.
Tang, J. Y. and Riley, W. J.: A total quasi-steady-state formulation of substrate uptake kinetics in complex networks and an example application to microbial litter decomposition, Biogeosciences, 10, 8329–8351, https://doi.org/10.5194/bg-10-8329-2013, 2013.
Tecon, R. and Or, D.: Biophysical processes supporting the diversity of microbial life in soil, FEMS Microbiol. Rev., 41, 599–623, https://doi.org/10.1093/femsre/fux039, 2017.
Thomsen, I. K., Schjønning, P., Jensen, B., Kristensen, K., and Christensen, B. T.: Turnover of organic matter in differently textured soils, Geoderma, 89, 199–218, https://doi.org/10.1016/S0016-7061(98)00084-6, 1999.
Tresner, H. D. and Hayes, J. A.: Sodium Chloride Tolerance of Terrestrial Fungi, Appl. Environ. Microb., 22, 210–213, 1971.
van Genuchten, M. T.: A Closed-form Equation for Predicting the Hydraulic Conductivity of Unsaturated Soils 1, Soil Sci. Soc. Am. J., 44, 892–898, https://doi.org/10.2136/sssaj1980.03615995004400050002x, 1980.
Van Looy, K., Bouma, J., Herbst, M., Koestel, J., Minasny, B., Mishra, U., and Vereecken, H.: Pedotransfer Functions in Earth System Science: Challenges and Perspectives, Rev. Geophys., 55, 1199–1256, https://doi.org/10.1002/2017RG000581, 2017.
Vereecken, H., Maes, J., Feyen, J., and Darius, P.: Estimating the Soil Moisture Retention Characteristic From Texture, Bulk Density, and Carbon Content, Soil Sci., 148, 389–403, 1989.
Watson, T. G.: Effects of Sodium Chloride on Steady-state Growth and Metabolism of Saccharomyces cerevisiae, Microbiology, 64, 91–99, https://doi.org/10.1099/00221287-64-1-91, 1970.
Wickland, K. P. and Neff, J. C.: Decomposition of soil organic matter from boreal black spruce forest: environmental and chemical controls, Biogeochemistry, 87, 29–47, https://doi.org/10.1007/s10533-007-9166-3, 2007.
Wieder, W. R., Hartman, M. D., Sulman, B. N., Wang, Y. P., Koven, C. D., and Bonan, G. B.: Carbon cycle confidence and uncertainty: Exploring variation among soil biogeochemical models, Glob. Change Biol., 24, 1563–1579, https://doi.org/10.1111/gcb.13979, 2017.
Wood, J. M.: Bacterial Osmoregulation: A Paradigm for the Study of Cellular Homeostasis, 65, 215–238, Annu. Rev. Microbiol., https://doi.org/10.1146/annurev-micro-090110-102815, 2011.
Yan, Z., Liu, C., Todd-Brown, K. E., Liu, Y., Bond-Lamberty, B., and Bailey, V. L.: Pore-scale investigation on the response of heterotrophic respiration to moisture conditions in heterogeneous soils, Biogeochemistry, 131, 121–134, 2016.
Yan, Z., Bond-Lamberty, B., Todd-Brown, K. E., Bailey, V. L., Li, S., Liu, C., and Liu, C.: A moisture function of soil heterotrophic respiration that incorporates microscale processes, Nat. Commun., 9, 2562, 2018.
Yuste, J. C., Baldocchi, D. D., Gershenson, A., Goldstein, A., Misson, L., and Wong, S.: Microbial soil respiration and its dependency on carbon inputs, soil temperature and moisture, Glob. Change Biol., 13, 2018–2035, https://doi.org/10.1111/j.1365-2486.2007.01415.x, 2007.
Zhang, Y. and Schaap, M. G.: Weighted recalibration of the Rosetta pedotransfer model with improved estimates of hydraulic parameter distributions and summary statistics (Rosetta3), J. Hydrol., 547, 39–53, https://doi.org/10.1016/j.jhydrol.2017.01.004, 2017.