the Creative Commons Attribution 4.0 License.
the Creative Commons Attribution 4.0 License.
 | 21 Jan 2019
Quantifying global N2O emissions from natural ecosystem soils using trait-based biogeochemistry models
Tong Yu
A group of soil microbes plays an important role in nitrogen cycling and N2O emissions from natural ecosystem soils. We developed a trait-based biogeochemical model based on an extant process-based biogeochemistry model, the Terrestrial Ecosystem Model (TEM), by incorporating the detailed microbial physiological processes of nitrification. The effect of ammonia-oxidizing Archaea (AOA), ammonia-oxidizing bacteria (AOB), and nitrite-oxidizing bacteria (NOB) was considered in modeling nitrification. Microbial traits, including microbial biomass and density, were explicitly considered. In addition, nitrogen cycling was coupled with carbon dynamics based on stoichiometry theory between carbon and nitrogen. The model was parameterized using observational data and then applied to quantifying global N2O emissions from global terrestrial ecosystem soils from 1990 to 2000. Our estimates of 8.7±1.6 Tg N yr−1 generally agreed with previous estimates during the study period. Tropical forests are a major emitter, accounting for 42 % of the global emissions. The model was more sensitive to temperature and precipitation and less sensitive to soil organic carbon and nitrogen contents. Compared to the model without considering the detailed microbial activities, the new model shows more variations in response to seasonal changes in climate. Our study suggests that further information on microbial diversity and ecophysiology features is needed. The more specific guilds and their traits shall be considered in future soil N2O emission quantifications.
- Article
(1300 KB) - Full-text XML
- BibTeX
- EndNote


Nitrogen (N) is the most abundant element in the atmosphere. It accounts for 78 % of the Earth's atmosphere. NOx (referring to NO and NO2) is a main pollutant in the air, especially in heavily populated areas. N2O, a potent greenhouse gas, is also an important oxidizer in chain reactions in the air. Additionally, N is also an important nutrient for almost all living things. For plants and most microbes, N is not only the structural element to build their body, but also a fundamental element for enzymes involved in almost all metabolic processes. Chemical compounds of nitrogen encompass many oxide states ranging from −3 (ammonia) to +5 (N2O5). The cycle of nitrogen can thus be characterized by the processes of oxidation and reduction, which is different from other element cycles such as sulfur (S) and phosphorous (P).
Microbial activity plays a crucial part in the Earth's biogeochemical cycles, affecting biological fluxes of H, C, N, O, and S (Falkowski et al., 2008). In the air and soils, the compounds of N exist in multiple oxidation states, but most of them are in oxidized states. When N is released from organism cells, it is oxidized into other forms rapidly. The processes of nitrification and denitrification play an important role in this flow path. These biochemical reactions are highly related to microorganisms. In the process of nitrification ( → → ), ammonia-oxidizing bacteria (AOB) and nitrite-oxidizing bacteria (NOB) are the main metabolic drivers (Prosser and Nicol, 2008). Nitrification in aerobic oxidation conditions was first discovered in 1890 (Winogradsky, 1890), and it is still a classical theory for microbial activities. Though in recent years anaerobic ammonia oxidation has been found in natural ecosystems (Francis et al., 2007), aerobic oxidation by microbes, especially by Archaea and bacteria, is still a dominant process in most circumstances. In the first step, ammonia (NH3) is changed into hydroxylamine (NH2OH) and is then dissociated to and water. This step requires aerobic conditions because O2 acts as the terminal electron acceptor and ammonia acts as the electron donor. This is the rate-limiting step of nitrification. Betaproteobacteria, gammaproteobacteria (Kowalchuk and Stephen, 2001), and Thaumarchaea (Brochier-Armanet et al., 2008) are responsible for this step. This reaction is catalyzed by chemolitho-autotrophic bacteria and Archaea. The second step is from to , which is conducted by nitrite-oxidizing bacteria (NOB) belonging to five genera (Nitrobacter, Nitrospira, Nitrococcus, Nitrospina, and Nitrotoga). Compared to the first step, it needs less energy. When is produced in the first step, it gets oxidized in the second step almost instantly. Thus, it is unlikely for to accumulate in the soil. There are three groups of autotrophic AOBs. Two of them are β (Nitrospira) and γ (Nitrococcus) subclasses of Proteobacteria, and the other is within the Planctomycetales (Kowalchuk and Stephen, 2001). In terrestrial environments, the population of AOBs is highly impacted by soil moisture, pH, nitrogen input, and vegetation. If the soil is polluted, the population will also be profoundly affected. The gene of the 16S rRNA sequence determines the ammonia oxidation for AOBs.
Archaea is critically important in the first step of nitrification, which is also one of the most widely distributed microorganisms on Earth. The total amount of this microbe has a magnitude of 1028 cells. The total number of cells in a human body is about 3.72×10¹³ (Bianconi et al., 2013), so 1028 is far more than the total cell number in all human beings on Earth. The dominant gene related to nitrification is ammonia monooxygenase (amoA) according to studies in the sea (Venter et al., 2004) and soils (Treusch et al., 2005). Compared to bacteria, which have only a small number of species related to nitrification, there are hundreds of amoA sequences involved in ammonia oxidation. Ammonia-oxidized Archaea (AOA) can be adapted to more habitats and environments, even including some suboxic zones (Francis et al., 2005). AOA is much more abundant than AOB (Leininger et al., 2006). These organisms are dominant ammonia oxidizers both in soils and the sea, and the activities of these Archaea are represented in N biogeochemistry models.
Denitrification is a major source of nitric and nitrous oxide emissions into the atmosphere. This process includes several reductive processes and each reaction is performed by a wide range of microorganisms. In denitrification, nitrate is used as the terminal electron acceptor instead of O2. For some bacteria, , N2O, and NO are the terminal electron acceptors. Compared to nitrification, there are more steps in denitrification ( → → NO → N2O → N2). The final products are N2, NO, and N2O as gases, which means they can escape during the process. If they are dissolved in soils, they will be utilized for the next reaction step. Primarily, denitrification is catalyzed by bacteria (Torregrosa-Crespo et al., 2016) and Archaea (Cabello et al., 2004), but some fungi (Fusarium oxysporum) can denitrify as well (Shoun et al., 2012). Denitrifying organisms also belong to bacteria and Archaea. Different species are responsible for certain steps of denitrification. Nitrite reductase (nirK and nirS genes) conducts the reaction from to NO (Priemé et al., 2002). Nitrous oxide reductase (nosZ gene) finishes the last step of denitrification (Kandeler et al., 2006). Generally, more steps and more microbes are involved in denitrification than in nitrification. This study presents a trait-based model to assess some of these microbial activities that determine the nitrifying processes, particularly the limitation of nutrient supplies. The model describes the metabolisms and reproduction of nitrifying microbes and their controls under environmental and soil conditions. Numerical simulations of N2O emissions from 1990 to 2000 were performed on both site and global levels. Using the model, our research goals are to examine (1) whether the detailed soil microbial traits would improve estimations of soil emissions of N2O and (2) the role of carbon and nitrogen stoichiometry in nitrification. By using N2O flux data from 80 observational sites, we first calibrate and verify the model. The model is then used to analyze the pattern and seasonal variation of global N2O emissions from natural ecosystem soils from tropical to polar areas.
2.1 Overview
We first revised the core carbon and nitrogen dynamics of the TEM (Zhuang et al., 2003) by including more detailed N cycling and microbial dynamics effects (Fig. 1). Second, the key parameters in the model were calibrated using site-level observational data for major global vegetation types. Third, the model was tested based on data from 80 observational sites. Finally, the regional and global N2O emissions were estimated with the model for the last decade of the 20th century. In addition, the model sensitivity to various climate and soil conditions was tested.
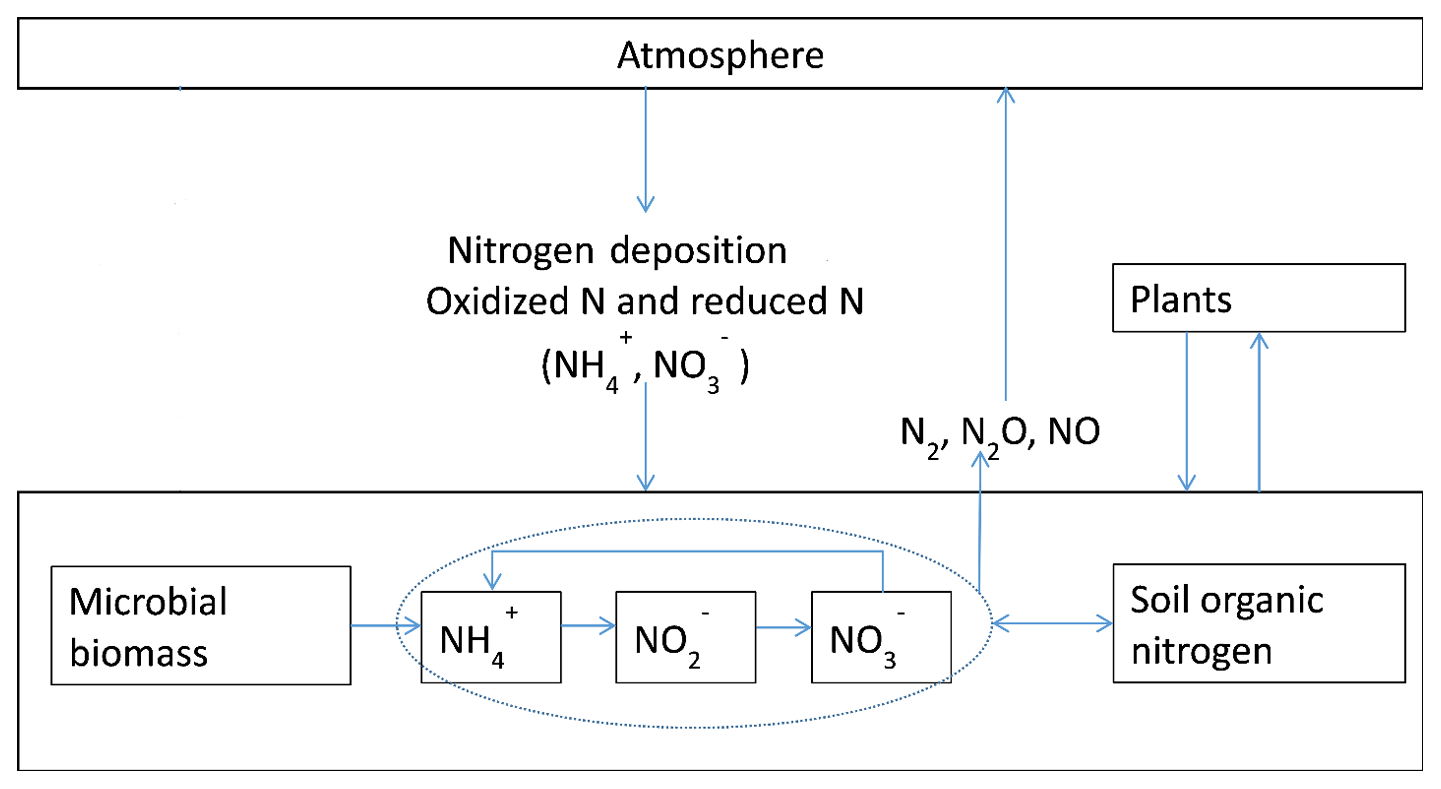
Figure 1Schematic diagram of N2O emissions and N cycling between plants, soils, and the atmosphere: the input of N from the atmosphere to soils through nitrogen deposition as nitrate and ammonia, as well as microbial biomass dynamics, were modeled. Nitrification is modeled as a function of microbial biomass, soil organic nitrogen, and physical conditions; for more details refer to Yu (2016). N uptake by plants is modeled in the original TEM (McGuire et al., 1992).
2.2 Model modification
We revised the Terrestrial Ecosystem Model (TEM; Zhuang et al., 2003) to improve the core carbon and nitrogen dynamic module by incorporating the detailed nitrification process at a daily time step. The major processes of the nitrogen dynamic module are inherited from Tong (2016), including the effect of physical conditions on both nitrification and denitrification and the principles of the stoichiometry of carbon and nitrogen dynamics in soils. Details and equations describing nitrification, denitrification, and N2O fluxes can be found in Tong (2016). The model in this study was further incorporated with the effects of the activity and biomass of nitrifier guilds on nitrification (Bouskill et al., 2012). In addition to losses from oxidation, the N uptake by microbial biomass and biomass breakdown by the detoxification process were also modeled. The dynamics of ammonia concentration in soils are simulated as
where [NH3] represents the concentration of soil ammonia, including NH3 and . is the rate of ammonia oxidized by nitrifiers calculated with the methods described in TEM (Tong, 2016). and are ammonia taken up by AOO and NOB, respectively, to support the metabolism and reproduction of microbes. The last term of Eq. (1) is the part consumed in the detoxification process, and the reactions are described in Eq. (8). The constant here represents the stoichiometry in detoxification reactions (Bouskill et al., 2012):
where [NO2] represents the concentration of NO2. is the oxidization rate by NOB, and is the loss in detoxification.
The consumption rate of NH3 by AOA and AOB is determined by the concentration of NH3 and O2 in the soil. For the simulation of ammonia oxidation by ammonia-oxidizing organisms, the cell biomass was considered in the Briggs–Haldane kinetics calculation (Koper et al., 2010):
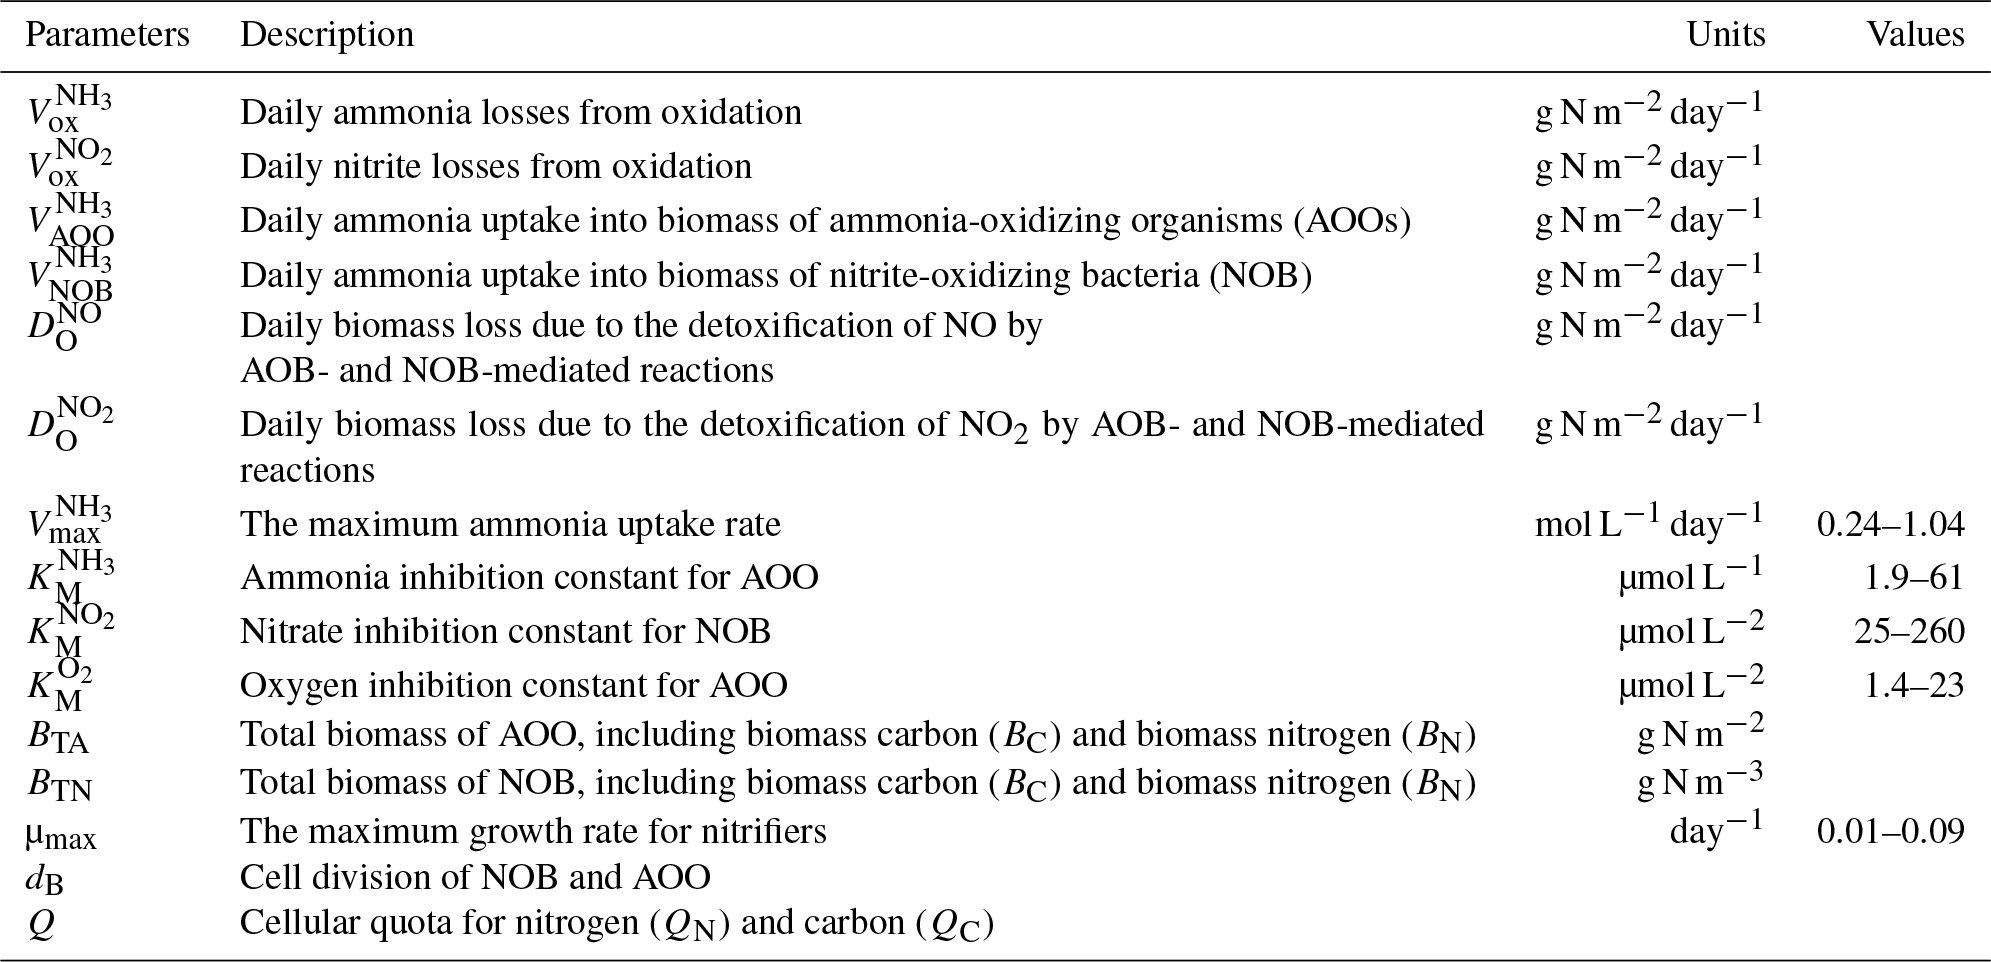
where is the maximum substrate uptake rate for ammonia (M day−1). This value varies between different guilds of microbes. The average value for AOB is about 0.5 and the average value for AOA is about 0.6. is the half-saturation constant for NH3 (µM) and is the Michaelis–Menten parameter for oxygen (µM) (Table 1). BTA is the total cell biomass for ammonia-oxidizing organisms (AOA + AOB).
Table 1Variables and model parameters used for microbial traits.
The consumption of is similar to Eq. (3):
where is the maximum substrate uptake rate for (M day−1). This value also depends on different guilds, and the value could be from 0.4 to 4 (Bouskill et al., 2012); here 2.0 was used. is the half-saturation constant for NH3 (µM) and is the Michaelis–Menten parameter for oxygen (µM). BTN represents the total cell biomass of NOB.
Considering the cell division of microbes, the growth of AOB biomass is (Bouskill et al., 2012)
The first term μmax min{di}BTA is the cell division rate. μmax (day−1) is the nitrifier maximum specific growth rate for ammonia-oxidizing organisms (AOOs). It is less than 0.1 for AOO, and here 0.05 is used. Min {di} represents the constraint of elements. It is defined as the cell division of AOO or NOB, which is governed by Droop kinetics (Droop, 1973).
Q is the cellular quota for nitrogen or carbon. It is defined as , which is the percentage of a certain element in the total biomass. For example, the cell division of N for a guild is
According to the C:N ratio for nitrifiers, the amount of carbon should be 6.6 to 13.2 times the amount of N (Bouskill et al., 2012). If the ratio of C:N is greater than 1 ∕ 13.2, the reproduction of microbes is limited by N. In contrast, the process is limited by C if C:N is smaller than 6.6.
The second term εBTA indicates the death rate. ε is the mortality rate. The last term refers to the biomass loss for converting NO2 to NO and NO to N2O.
Similarly, the growth of NOB biomass is (Bouskill et al., 2012)
The improved nitrogen dynamic module (NDM) explicitly simulates the effect of climate conditions on the nitrogen cycle, and the effects of detailed microbial activities were considered in the nitrification and detoxification processes. In addition, the processes of N deposition, mineralization, and denitrification were also modeled. The influence of climate conditions and soil textures on the geochemical reaction conditions (e.g., soil temperature, pH, and oxygen concentration) was also considered. The metabolism and reproduction of microbes, together with several substrates (organic N, ammonia), determine the reaction rate. The soil thermal module (STM) and hydrological module (HM) are inherited from the TEM by Zhuang et al. (2003). The NDM utilizes the soil temperature simulated in STM and the soil water content is estimated with HM.
The values of parameters vary among different biomes and guilds. Based on a literature review for the study of nitrifier guilds, the initial values for parameters are given in Table 1. Our study simulates AOO and NOB as individual guilds for each biome, and a uniform guild density is assumed across the biome.
2.3 Data
N2O observational data from 1980 to 2010 for typical vegetation types were acquired from the literature (Table 2). The observational sites are characterized by temperate coniferous forest, boreal forest, tundra, and succulent area. Annual site-level N2O emissions were collected covering more than 10 biomes, especially in temperate and tropical areas. The datasets were only from nonagricultural terrestrial ecosystems with experimental periods from several weeks to years. Four typical flux tower sites (presented in Fig. 2) including tropical forests (dark green circles), grasslands (light green circles), temperate forests (yellow circles), and others (red circles) were selected to verify the modeled seasonal variation.
Table 2Site information for the observational data used for model calibration and validation.

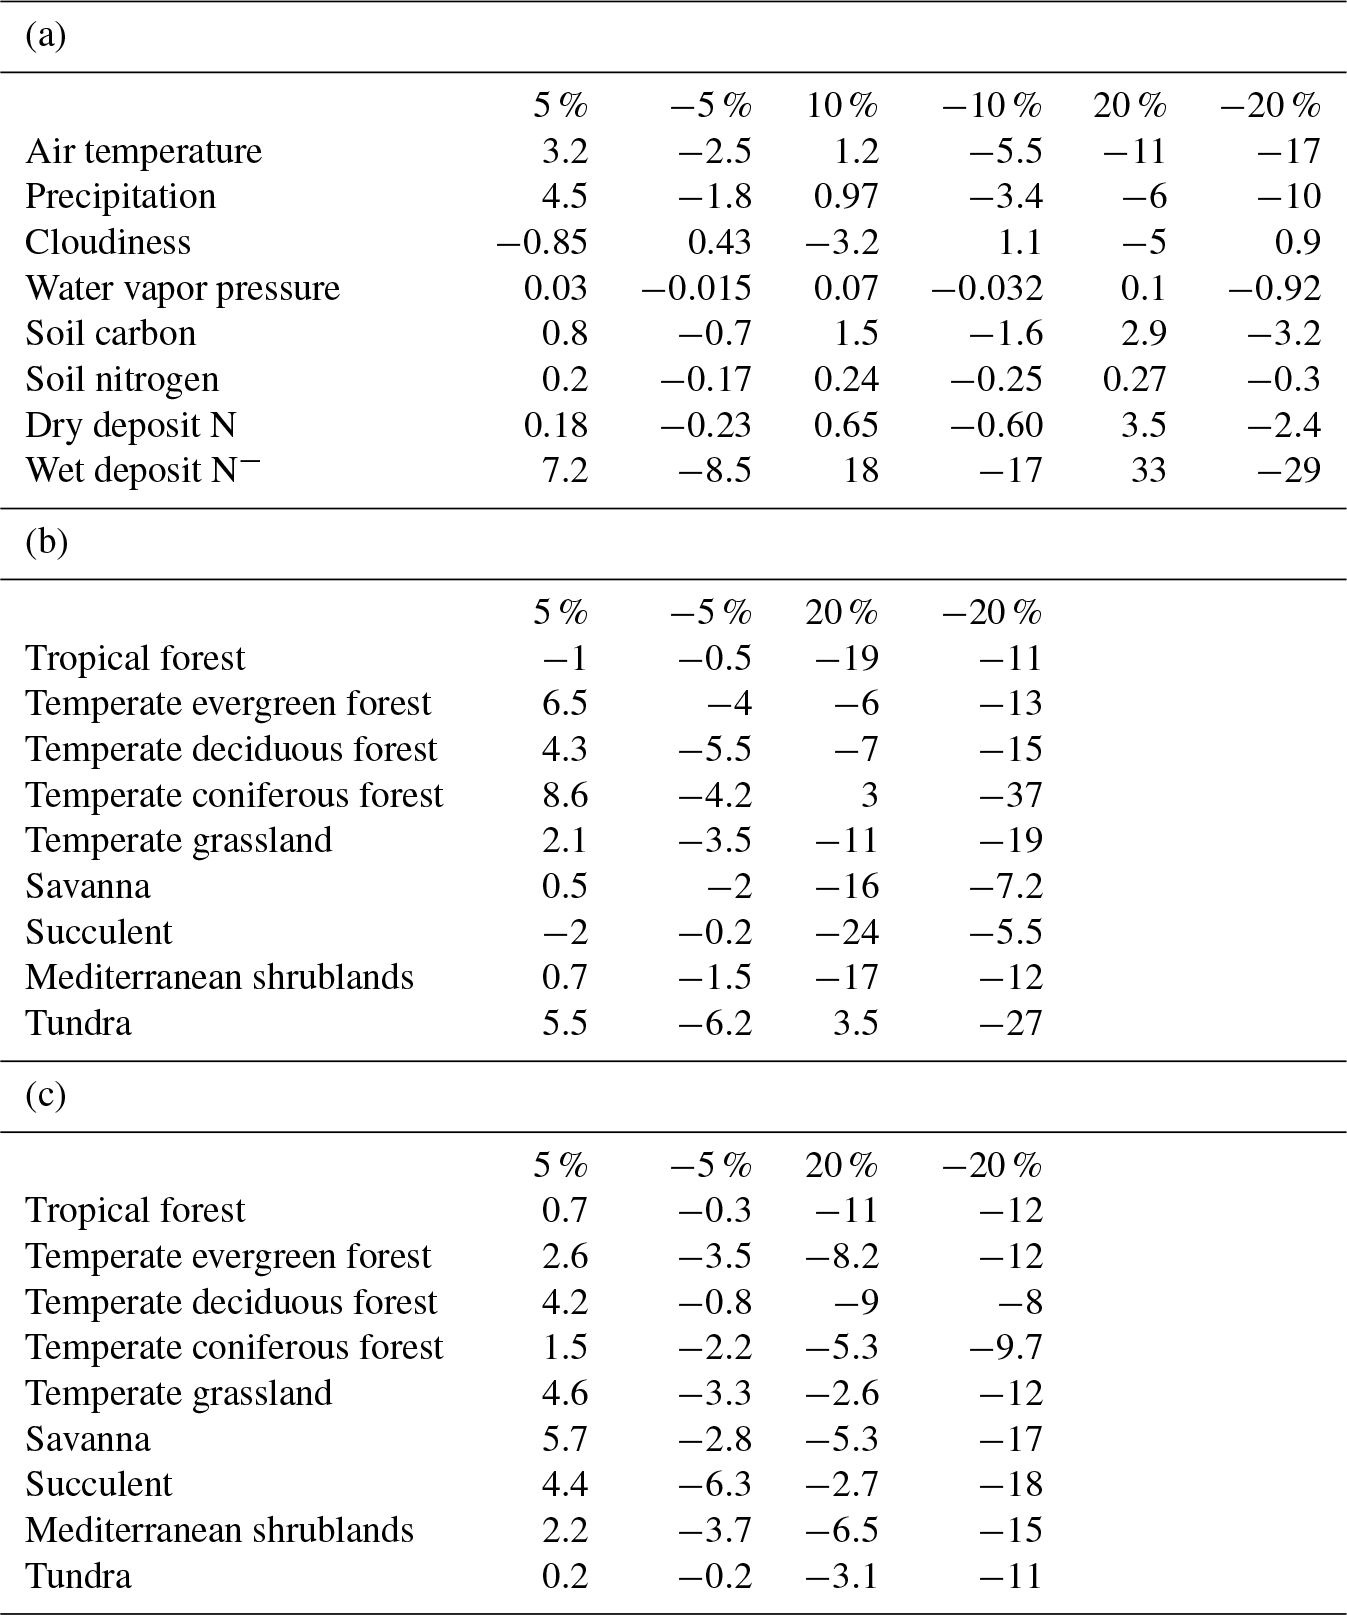
Table 3Sensitivity studies of N2O emissions (%) responding to changes in (a) climate and soil data at different levels, (b) temperature at 5 % and 20 % for different vegetation types, and (c) precipitation at 5 % and 20 % for different vegetation types.
Global simulations were driven with spatially explicit data on climate, soil conditions, vegetation types, and land cover at a spatial resolution of 0.5∘ × 0.5∘. Climate data including monthly cloudiness, precipitation, temperature, and water vapor pressure are from the Climate Research Unit (CRU). The soil conditions, vegetation types, and land cover types were assumed to be invariable over our study period and only to vary over from grid to grid spatially. Details for the global vegetation data and soil data are available in Zhuang et al. (2003) and McGuire et al. (2001). Model runs were carried out at a daily step for the time period 1990–2000. The explicit spatial data on soil water pH from the ORDL gridded soil properties product (https://daac.ornl.gov/cgi-bin/dsviewer.pl?ds_id=546, last access: March 2017) are based on the World Inventory of Soil Emission Potentials (WISE) database (Batjes, 2000). There were two parts for nitrogen deposition data, including ammonia and nitrate. Wet deposition was estimated with rainfall nitrogen concentrations from national trend networks by the National Atmospheric Deposition Program (NADP) monitors and precipitation data. Dry deposition data were collected from aggregate deposition data (1987–2016) by the EPA's Clean Air Status and Trends Network (CASTNET). The global average carbon dioxide concentration observed at NOAA's Mauna Loa Observatory by parts per million was used uniformly (there is no spatial variation) as driving data.
The initial values of soil microbial carbon and nitrogen, and the ratio of C:N at the global scale, were from a compilation of global soil microbial biomass carbon, nitrogen, and phosphorus data (http://dx.doi.org/10.3334/ORNLDAAC/1264, last access: May 2017), which were compiled from a comprehensive survey of 315 publications from 16 November 1977 to 1 June 2012 (Xu et al., 2014). The microbial biomass data were collected mainly from a depth of 0–30 cm (µmol kg−1) and compiled into two soil depths of 0–30 cm and 0–100 cm (g C m−2 or g N m−2), including carbon and nitrogen storage and the C:N ratio for soil microbial biomass. The spatial data were converted from the original 0.05∘ × 0.5∘ to a resolution of 0.5∘ × 0.5∘, covering 12 biomes across the globe, which were consistent with our model simulation grids. The one-time estimate of spatial data was resampled to the spatial resolution of the TEM. The 11 biomes in the dataset were boreal forest, temperate coniferous forest, temperate broadleaf forest, tropical–subtropical forest, mixed forest, grassland, shrub, tundra, desert, cropland, and pasture.

2.4 Model calibration and validation
The model parameters related to N dynamics were calibrated at the site level for major representative ecosystems. Parameter ranges and initial values were determined based on the literature review (Table 1). Direct N2O measurements for various terrestrial natural ecosystems, including forests, grasslands, shrublands and tundra, tropical, and temperate areas where more microbial species live, were organized (Table 2). All data were monthly average N2O emissions measured with chambers and eddy flux techniques. The observations were conducted under different climate and soil conditions. The measurement periods covered several days to several months and the time interval for measurement varied from seconds to days. If the time interval of emissions was less than 1 day, the emission values were calculated into a monthly average. The meteorological conditions at the observation sites were retrieved from the original studies. A quarter of the sites were used for calibration and the remaining were used for validation.
Parameterization was conducted only for natural terrestrial ecosystems. The parameters in Table 4 were adjusted individually, while other parameters of the model were kept as is. The parameters were optimized through altering parameters, iterating model simulations, and calculating the difference between observations and simulations. We apply site-level parameters for representative ecosystem types to grid cells at 0.5∘ × 0.5∘ resolution at the global scale. The ecosystem types are listed in Table 2 and their distributions are from Melillo et al. (1993).
The field observational sites selected for model calibration and validation were spread across major vegetation types and biomes (Fig. 2). A total of 81 sets of observational data were collected from 60 publications, covering a variety of climate zones from semidry savanna to rainforest and polar to tropical areas. A total of 26 sites were covered for tropical rainforests, 22 for temperate grassland and savanna, 21 for temperate forests, and the rest for 9 other vegetation types. The monthly or daily average temperature varied from −10.5 to 42 ∘C, with precipitation from 0.1 to 3962 mm, representing diverse climate conditions.
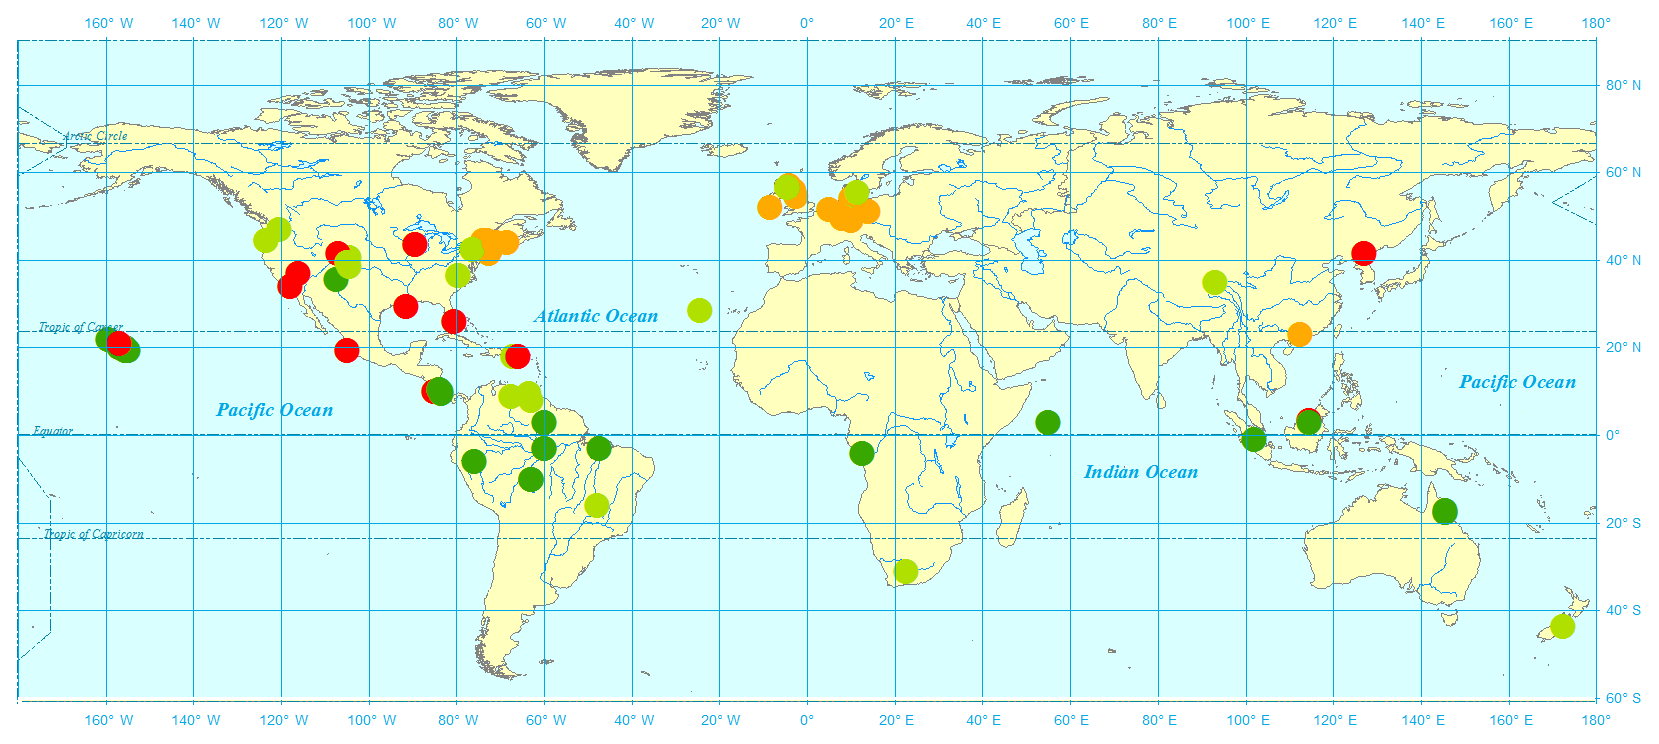
Figure 2N2O observational sites used in this study: tropical forest (dark green), grassland (light green), temperate forest (yellow), and others (red).
2.5 Model sensitivity
To test model sensitivity to forcing data, simulations at both site and regional levels were conducted. The monthly average air temperature (TAIR), precipitation (PREC), cloudiness (CLDS), and water vapor pressure (VPR) were changed by ±5 %, ±10 %, and ±25 % for each site and each grid at the global scale, respectively. The soil carbon (SC), soil nitrogen (SN), dry deposit nitrogen, and wet deposit nitrogen are changed by ±5 %, ±10 %, and ±25 %. When a variable changed at six levels, the rest were kept as the original value used for site and regional simulations. The sensitivity of the model was tested by comparing the annual emissions in sensitivity simulations with the original ones (Table 3).
2.6 Statistical analysis
To compare the observational and simulated data, a linear regression was conducted and the slope and coefficient of determination (R2) were computed. A slope less than 1 indicates the model overestimated the observation, while a slope greater than 1 means the model underestimated the observation. R2 indicates how well the model captures the variation in observations. Greater R2 indicates a better model performance. In addition, the root mean square error (RMSE) was calculated to assess the difference between model simulations and observations.
3.1 Site-level calibration and validation
The model slightly overestimates the observations. For all observational sites (N = 81), the average N2O flux is 0.7 kg N ha−1 yr−1 (1 kg N ha−1 yr g m−2 yr g m−2 day−1), with a minimum flux of 0.01 kg N ha−1 yr−1 (except for 0) in the dry season for African savanna and a maximum of 5.7 kg N ha−1 yr−1 in tropical peatlands. Observed emissions from natural ecosystems have high variations within the same biomes, or even within several days, because environmental conditions (e.g., sudden rainfall) have significant effects on N dynamics. A linear regression between simulations and observations presents a slope of 0.72 and R2 of 0.61 for all 81 sites. By removing all zero values from tropical rainforest and temperate forests in the observations, the slope decreases slightly by 0.01 with a better R2 of 0.63. The discrepancies between observations and simulations slightly decline with the RMSE changing from 0.71 to 0.608 kg N ha−1 yr−1 (Fig. 4). The reasons for these differences include the sudden change in weather conditions during observation, the high uncertainty of measurements, and the effect of denitrifiers, especially in soils with low oxygen content. In addition, because the climate data are on a monthly step, the model did not capture the sudden changes in N2O emissions induced by extreme weather conditions at a daily or sub-daily time step.
In our previous N2O emission model (Yu, 2016), the effects of climate and soil conditions were considered, but the activity of nitrifiers and its effects were not explicitly modeled. The previous model had a comparatively smaller R2 and slope in comparison with observations, but overestimated N2O emissions because the model ignored the N taken up by soil microbes.
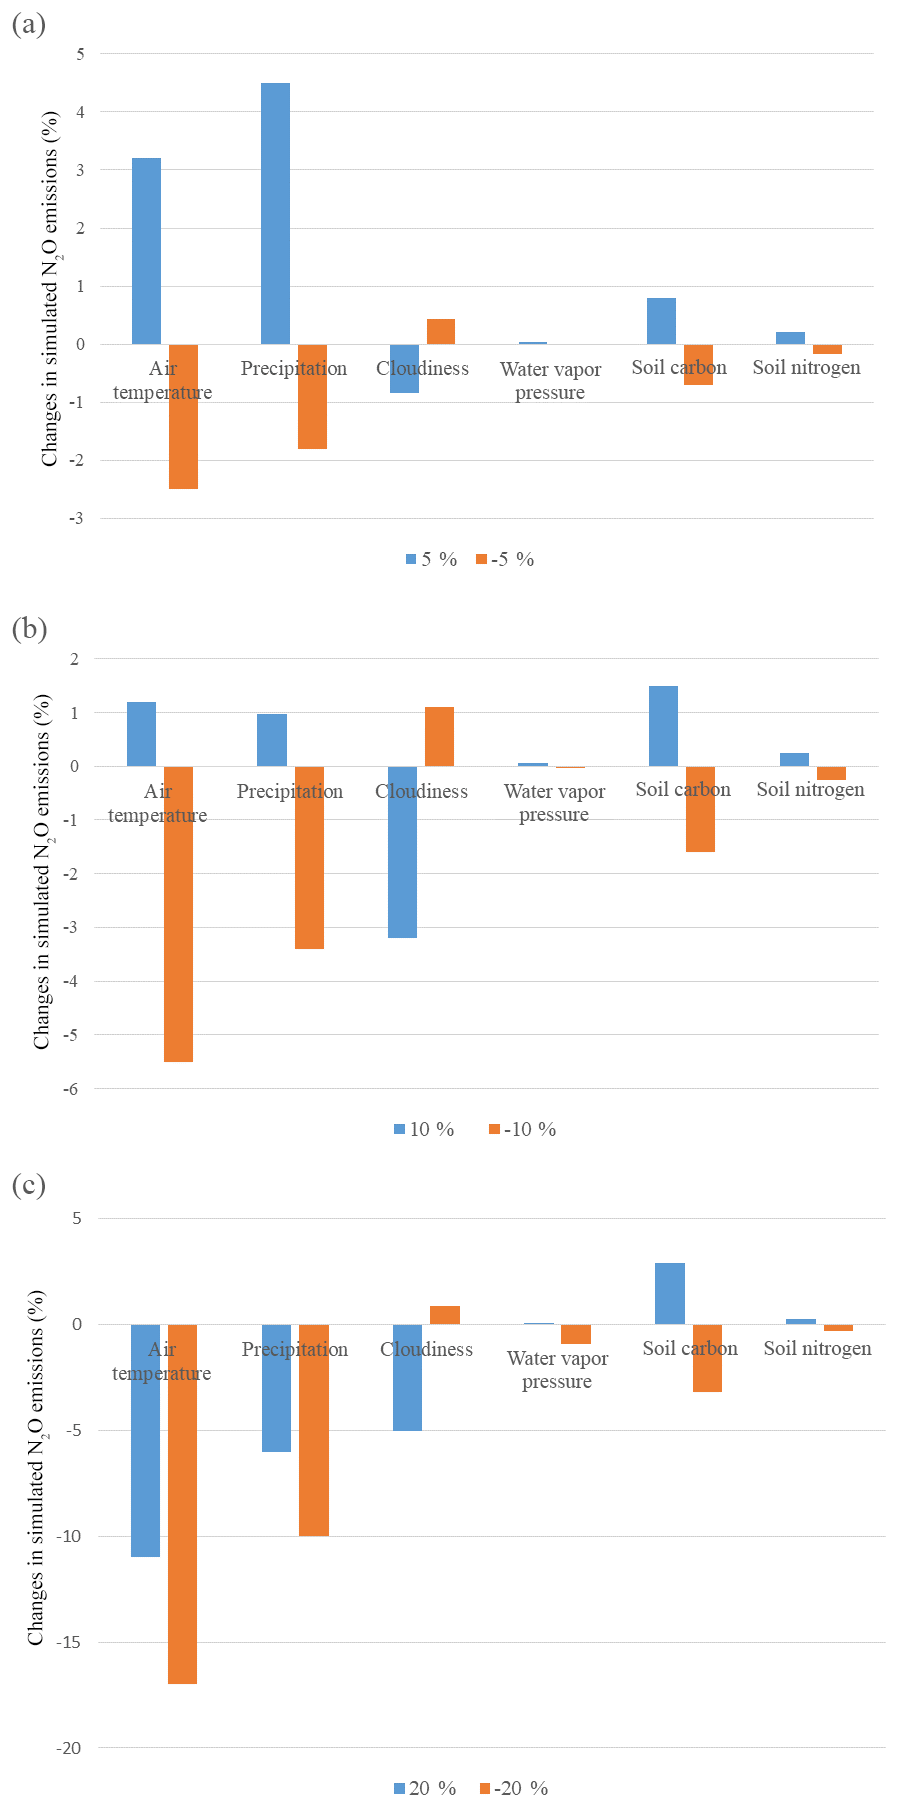
Figure 3The sensitivity study of N2O emissions in natural terrestrial ecosystems by changing different climate variables by (a) 5 %, (b) 10 %, and (c) 20 %.
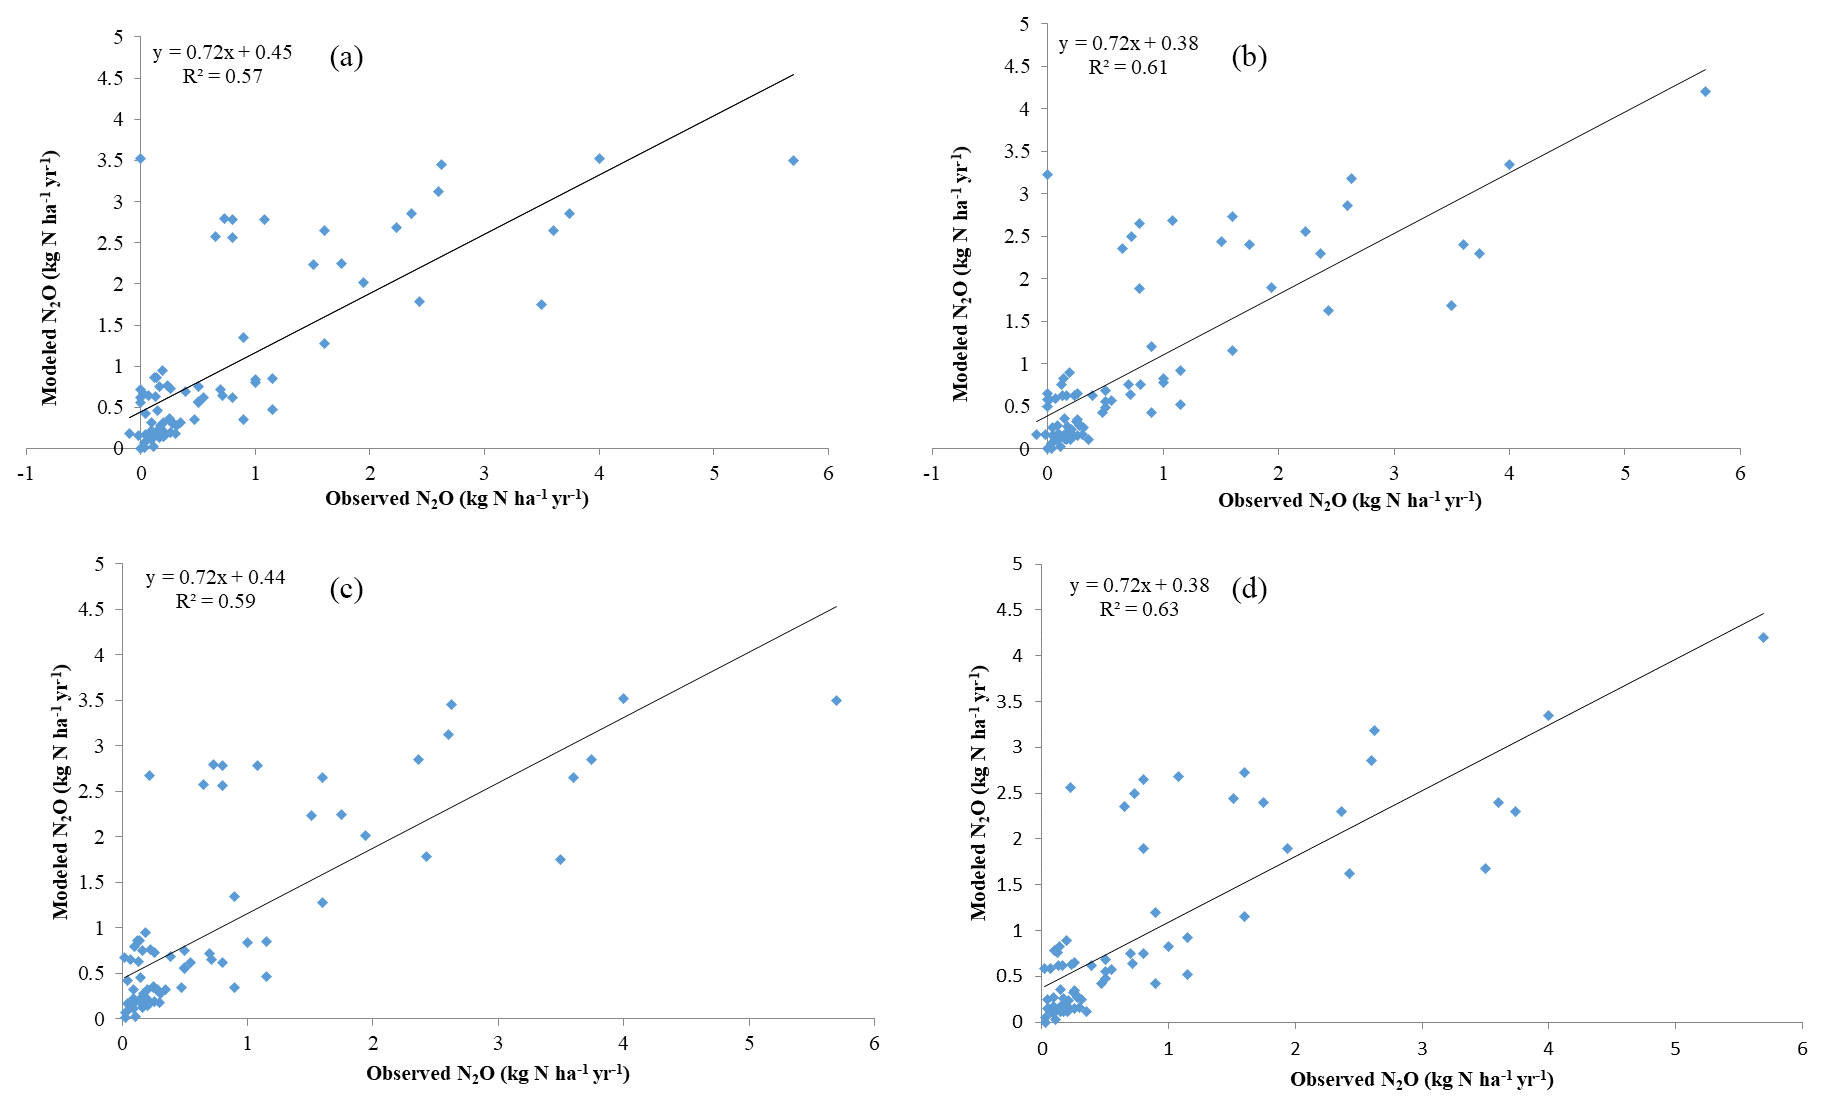
Figure 4Observational and model simulation of annual N2O emissions (a) with all observational data and the original process-based model TEM (Yu, 2016), (b) with all observational data and the microbial trait-based model, (c) without observational “0” and the original process-based model, and (d) without observational “0” and the microbial trait-based model.
Considering major biomes, the model performs best in temperate forests (R2=0.89, slope = 0.64), followed by grassland and savanna (R2=0.64, slope = 1.05), tropical forests (R2=0.52, slope = 0.61), and others (R2=0.57, slope = 0.51). Based on long-term experimental data (longer than 6 months), the microbial trait-based model shows a better performance, especially in rainforest, compared to an earlier process-based model (Fig. 5). The improvement in seasonal variation simulation can be partly explained by the highly active microbes in tropical areas. Compared with the tropical area with abundant precipitation, microbes contribute less to nitrogen dynamics, so the discrepancies are less significant. In other typical biomes, the trait-based model also better simulates the seasonal variations of N2O emissions. We recognize that the site data in Indonesia are from a cropland ecosystem converted from peatlands, which may be with higher N2O emissions than natural ecosystems in the region. This may result in relatively high emissions from this type of land ecosystem in the region.
Overall, the trait-based model better estimated total emissions and seasonal fluxes of N2O for major natural biomes (Fig. 4). The trait-based model works better when more information on microbial activities is available to distinguish microbial guilds within and among different biomes.
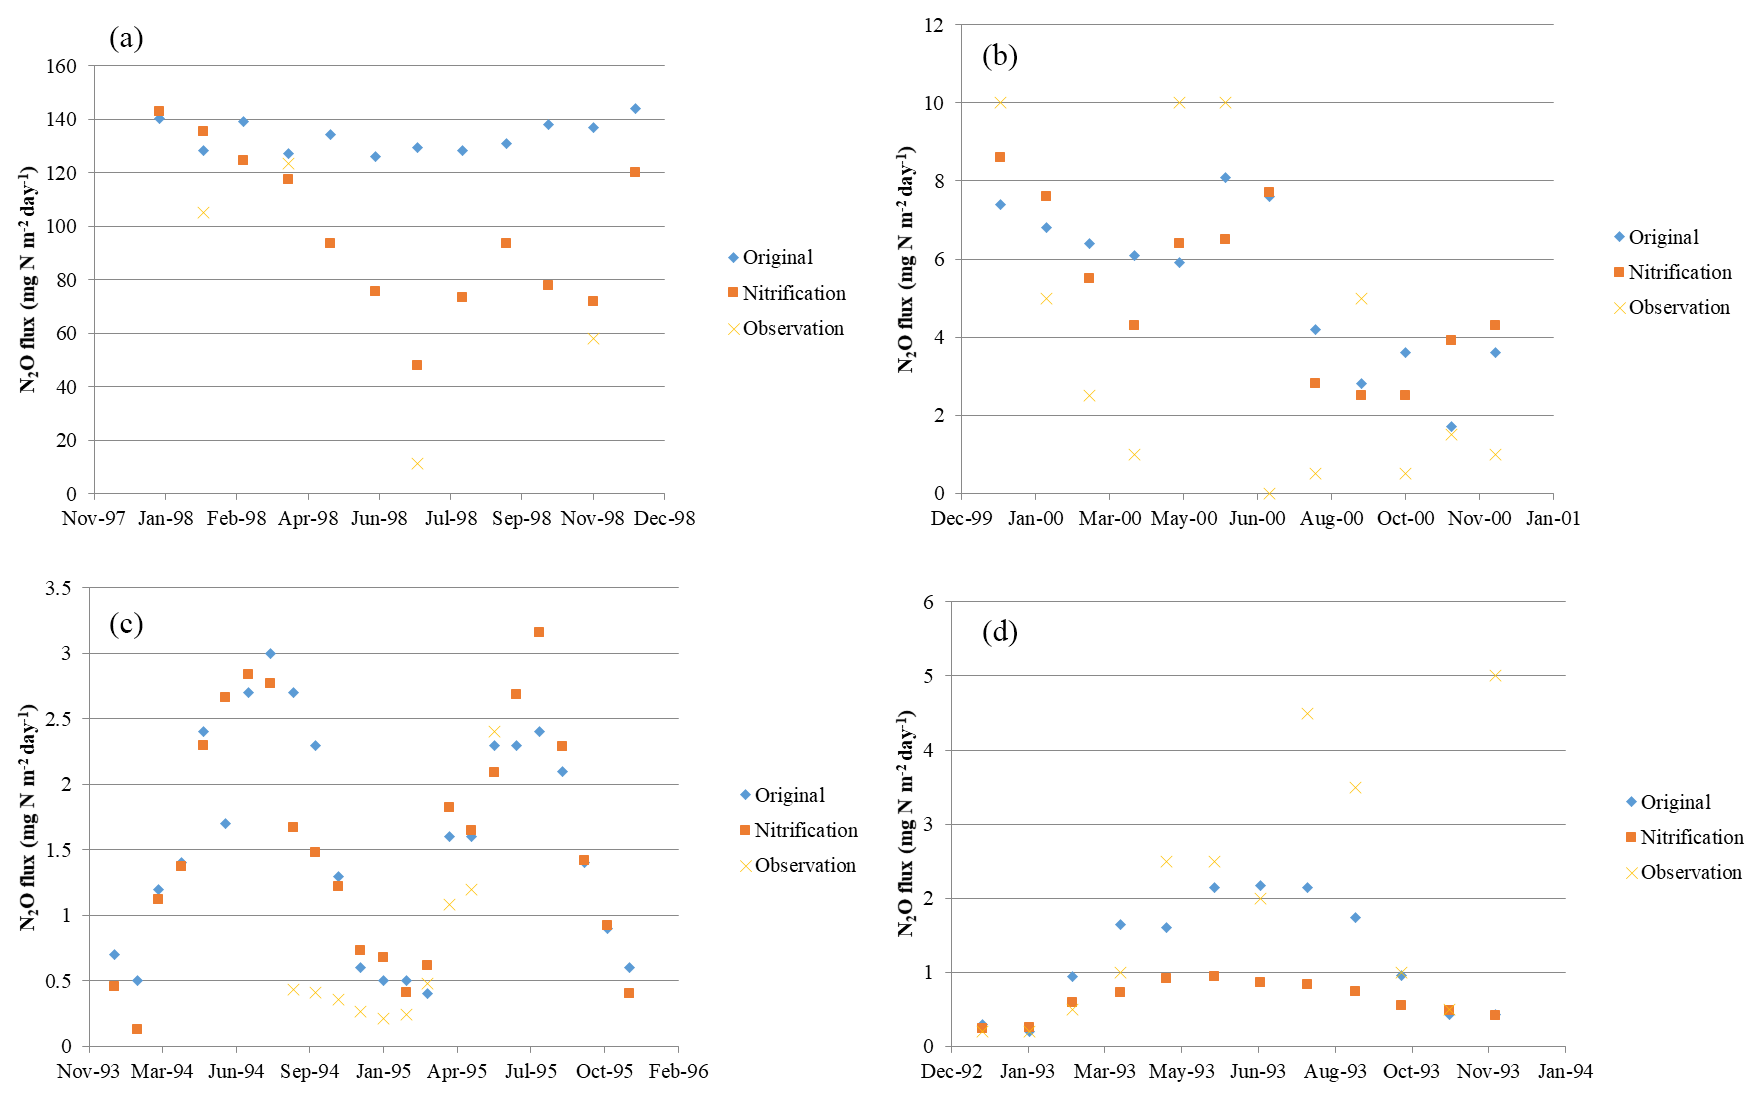
Figure 5Model validation at (a) rainforest (145.5∘ E, 17.5∘ S), (b) grassland (172.5∘ E, 43.5∘ S), (c) coniferous forest (14∘ E, 51∘ N), and (d) deciduous forest (10∘ E, 54∘ N).
3.2 Model sensitivity and uncertainty
3.2.1 Model sensitivity analysis
The sensitivity analysis of the model is conducted by changing climate data, soil data, and N input data on three different levels and quantifying the percentage changes on model output. In our sensitivity analysis, eight factors were changed with three levels for four separate locations, representing four typical biomes. Regional analyses for each biome type and the global scale were also conducted.
On the global scale, the model is most sensitive to air temperature, precipitation, and wet deposit nitrogen. Compared to the original model, the trait-based model has higher sensitivity to climatic change (Table 3a). The change in cloudiness and water vapor pressure had an indirect influence on the nitrogen cycle. In most cases, N2O emissions increase with increasing temperature at observational sites (Whitehead, 1995). In our study, the emissions varied positively with temperature. Increasing temperature by 10 % enhances N2O emissions globally, but when elevated by 25 % had a negative influence on emissions. On a global scale, the precipitation change has similar effects to the variation of temperature. Observations also indicated that the sudden precipitation change affected soil water conditions significantly, exerting a pronounced positive influence on N2O emissions (Li et al., 2000). Excessive rainfall showed a negative influence because soil oxygen supply is reduced by the reduction of soil pore space. Although an anaerobic soil environment favors denitrification, it reduces the respiration of oxidizing organisms significantly, which affects fixation and mineralization before nitrification and denitrification. The sensitivity to SC and SN is highly related to the available nutrients for microbial activities. Abundant carbon and nitrogen energizes nitrifiers and denitrifiers, stimulating nitrogen cycling in the soil. In general, N2O emissions positively respond to the increase in SN and SC levels. The model is less sensitive to soil nutrient contents than to climate changes. Overall, our analysis suggested that the trait-based model's sensitivity is similar to the earlier versions of the TEM (Zhuang et al., 2012; Qin et al., 2014) in simulating N2O emissions. The model is highly sensitive to wet N deposition because N deposition is an important source of soil inorganic nitrogen. In natural environments, N deposition with rainfall (wet deposit) is about 10 times as much as that deposited directly from the atmosphere (dry deposition) (http://www.epa.gov/castnet/, last access: October 2018).
At the global scale, the model is most sensitive to climatic changes. Different vegetation types have different sensitivities and vary greatly among climatic variables (Fig. 3). For all biomes, large changes with either increasing or decreasing air temperature and precipitation by 20 % have a negative effect on N2O emissions. With slight changes by 5 %, N2O emissions (increase by 8.6 %) in coniferous forests are positively related to air temperature. Tundra is most sensitive to changing air temperature with a decrease of 6.2 % N2O emissions due to a 5 % air temperature decrease. Biomes in tropical and dry areas are the least sensitive to temperature variations. Biomes with high precipitation are less sensitive. Tundra is the least sensitive biome among them, for which only 0.2 % of emissions are changed from a 5 % change in precipitation, whereas succulent areas and savanna show a comparatively high sensitivity to precipitation.
In general, model sensitivity analysis suggests that higher temperature within a certain range (15–35 ∘C) means a higher nitrification rate (Zhu and Chen, 2002) and denitrification rate (Stanford et al., 1975) because the growth rate of nitrifiers is strongly temperature dependent and denitrification obeys the first-order kinetic to temperature. The nitrification rate is influenced by the activity of ammonia-oxidizing communities. Although each guild has its own temperature optima, the ammonia oxidation rate reaches its peak around 25–30 ∘C (Erguder et al., 2009; Prosser, 2011). Biomes in temperate areas are the most sensitive to temperature change. In tropical zones, the increase in temperature negatively affects N2O emissions.
Excessive precipitation reduces the oxygen content in the soil, which directly and indirectly influences the metabolism and growth rate of nitrifiers. Biomes with high precipitation are less influenced by its variation compared with dry areas. This is because microbes in extreme dry conditions are more sensitive to the soil water content. Compared to air temperature and precipitation, cloudiness and water vapor pressure are less influential because they have no direct effect on N dynamics in the soil. Lower cloudiness implies more solar radiation, leading to more energy uptake by vegetation. The change in water vapor pressure is almost irrelevant to N2O emissions even when changed by 20 %.
Climate factors affect N dynamics by changing their reaction conditions and soil factors, including soil content and soil nitrogen content. The level of soil organic carbon and soil nitrogen shows less impact on N2O emissions (Table 3). On a global scale, SC and SN have positive effects on N dynamics. Abundant nutrients will maintain the activity and growth rate of microbes and consequently ensure the process of nitrification and denitrification. Overall, N2O emissions are positively related to SC and SN inputs. Less than 3 % N2O emission changes are due to 5 % to 20 % changes in SC, and less than 0.3 % N2O emission changes are due to 5 % to 20 % changes in SN.
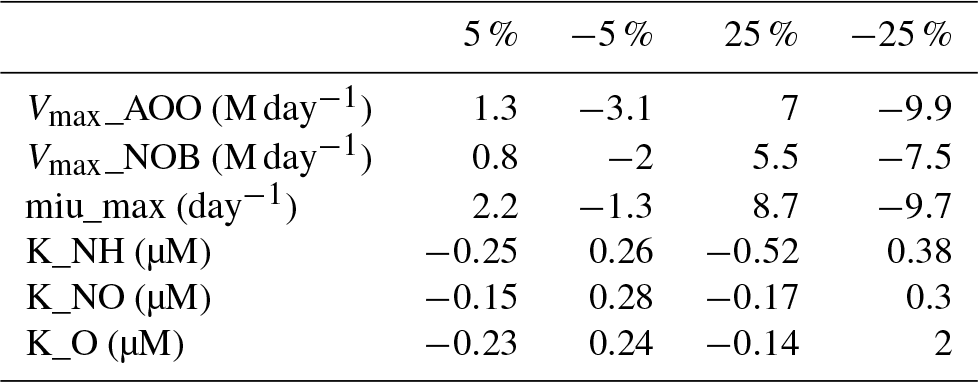
3.2.2 Key parameters and model uncertainty
The parameters related to microbial guilds or vegetation biomes are chosen to conduct uncertainty analysis (Table 4). Generally, microbes living in tropical rainforests have the highest value of Vmax, which can be partly explained by the biological activity rate (Biederbeck and Campbell, 1973) due to optimum temperature and moisture in the region. Lower values appear in cold zone and dry areas, indicating a lower level of microbial activities. For the parameters related to microbial reactions, such as the half-saturation constant for different elements, the values vary a little among different biomes. The highest K for ammonia and nitrate appear in tropical rainforests because they have the highest soil nitrogen content. In the Briggs–Haldane kinetics and Michaelis–Menten formulation, the uptake process needs a higher K to maintain the substrate value within a reasonable range.
The percentage change in annual total N2O emissions due to changing parameters shows that the most sensitive parameters are the half-saturation constants (K) associated with ammonia and nitrate uptake by microbes (Table 5). The parameter related to the growth rate of nitrifiers (µmax) shows the lowest sensitivity. The difference between the lowest and highest value is about 50 %.
3.3 Global extrapolation
During the last decade of the 20th century, the annual average emissions of N2O from soils were 8.7 Tg N yr−1, with a range from 7.1 to 10.3 Tg N yr−1. The uncertainty range of simulated N2O emissions is induced from the range of parameters shown in Table 1. The spatial pattern of the simulated global N2O emissions exhibits a large spatial variation (Fig. 6). Tropical ecosystems, especially rainforests, contribute the largest fraction of the total emissions. The hot spots of emissions occurred in western Africa, South and Southeast Asia, and the central Amazon Basin, which are almost the same regions of tropical rainforest. These hot spots have the optimum temperature and precipitation conditions, with rich soil organic carbon and nitrogen, stimulating the growth and metabolism of nitrifiers to increase N2O production. Except for those regions, some subtropical and temperate regions in the Northern Hemisphere contribute most of the rest, including Bangladesh, southern China, and the Central Plains of North America. Compared to tropical forests, climate and soil conditions have significant seasonal variations. With proper temperature and precipitation, the N2O fluxes are as large as those in rainforests. These regions are usually heavily influenced by agricultural activity, and the use of fertilizers further changes the pattern of N2O emissions. Some subpolar regions also have relatively high emissions, including southern Alaska, northeastern Canada, northern Scandinavia, and central Siberia. These regions are generally covered by boreal forests, having comparatively higher temperature and precipitation. The high content of organic matters provides sufficient nutrients for microbes. Regions with little precipitation and extremely low temperature have very low N2O emissions.
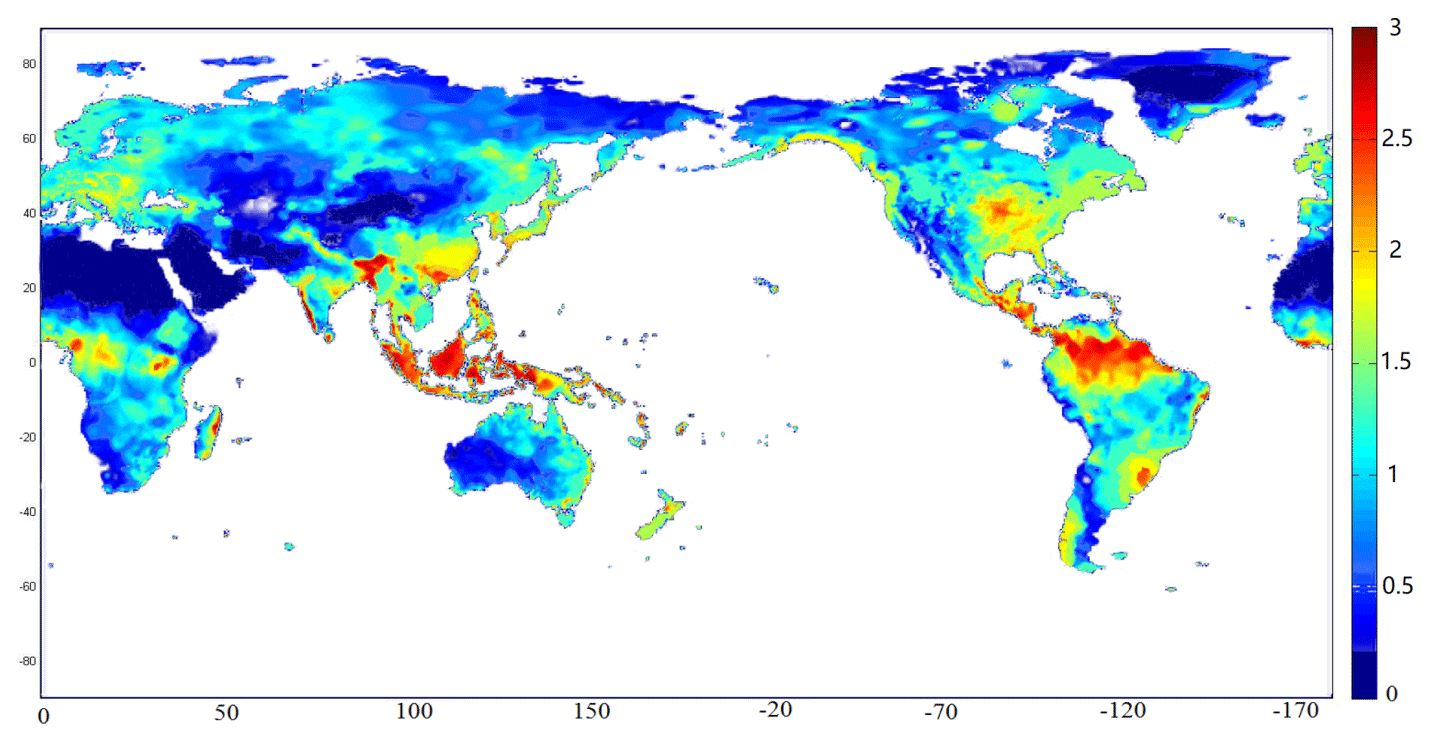
Figure 6Spatial patterns of N2O emissions (kg N ha−1 yr−1) from natural ecosystems (1990–2000).
4.1 Comparison with other estimates
Global soil N2O emissions have a large temporal variation (Fig. 7b), a seasonal crest in August, and a trough in January. The seasonal highest emissions (0.96 Tg N month−1) are in summer in the Northern Hemisphere, with the lowest emissions (0.56 Tg N month−1) in winter. The Northern Hemisphere and Southern Hemisphere have contrasting seasonal variations (Fig. 7a). The Northern Hemisphere contributes almost 80 % of global emissions from June to September, while emissions from the Southern Hemisphere are mainly from December to February. The global seasonal variations are similar to those in the Northern Hemisphere, suggesting that the Northern Hemisphere dominates global annual N2O emissions (57 %). Tropical regions are the most important sources from natural ecosystems, accounting for 71 % of total emissions. Temperate and polar regions (22 %) have more emissions than in the Southern Hemisphere (7 %), which is consistent with the findings of Stehfest and Bouwman (2006). Our simulations show that the emission ratios from the Northern to Southern Hemisphere are 1.5 to 1, and tropical regions (30∘ S–30∘ N) contribute 72 % of total emissions from the Southern Hemisphere.

Figure 7Seasonal variation of N2O emissions: (a) contribution of the Northern and Southern Hemisphere; (b) global average monthly emissions and their standard deviations for the period 1990–2000 (Tg N yr−1).
The variation in the spatial pattern is highly related to the soil and climate characteristics, as well as the vegetation types. In natural ecosystems, tropical and subtropical regions contribute the most emissions. Considering the N2O source from different biomes, it is also highly related to climate conditions and soil nutrients. Tropical forests and temperate forests are the most important sources of N2O, accounting for 42 % and 28 % of total global emissions, respectively. Grasslands and savannas contribute 17 % and 13 % from other biomes, respectively.
Our estimated annual global N2O emissions were consistent with previous estimates. Based on three process-based models, N2O emissions from global terrestrial ecosystems were around 8.5–9.5 Tg N yr−1 for 1990–2000 (Tian et al., 2018). Tian et al. (2015) utilized the Dynamic Land Ecosystem Model (DLEM) and estimated N2O emissions from global land ecosystems to be 12.52±0.74 Tg N yr−1 for 1981–2010. Huang and Gerber (2015) presented modeled global soil N2O emissions as 5.61–7.47 Tg N yr−1 for 1970–2005. Saikawa et al. (2013) used different datasets and estimated average soil N2O emissions from 7.42 to 10.6 Tg N yr−1 with a prognostic carbon–nitrogen–N2O (CLM-CN) model. Prentice et al. (2012) estimated that global emissions during the 20th century were 8.3–10.3 Tg N yr−1 using the DyN-IPJ dynamic global vegetation model. Using an artificial neural network approach, Zhuang et al. (2012) estimated global N2O emissions from natural ecosystem soils to be 3.37 Tg N yr−1 for 2000. Xu et al. (2008) estimated emissions for 1980–2000 using the relationship between N2O and CO2 to be 13.31 Tg N yr−1 with a range of 8.19–18.43 Tg N yr−1. According to the IPCC Fifth Assessment Report (AR5), global N2O emissions from soils under natural vegetation varied from 3.3 to 9.0 Tg N with an average of 6.6 Tg N (Ciais et al., 2014). The IPCC reported that the total emissions from anthropogenic and natural sources were 17.7 Tg N yr−1 for 1994 (Mosier et al., 1998; Kroeze et al., 1999), 9.6 Tg N yr−1 from natural ecosystems with a range of 4.6–15.9, and 8.1 Tg N yr−1 from anthropogenic sources with a range of 2.1–20.7 Tg N yr−1 (Mosier et al., 1998; Kroeze et al., 1999). Olivier et al. (1998) estimated emissions to be 10.8 Tg N yr−1 by inverse modeling, with a range of 6.4–16.8 Tg N yr−1. The natural emissions from the IPCC Second Assessment Report (SAR) are 9 Tg N yr−1. With a process-based model revised from DNDC (Li et al., 1992), Liu (1996) estimated the global N2O emissions as 11.33 Tg N yr−1. The Carnegie–Ames–Stanford approach gave a global estimation of 6.1 Tg N from the soil surface (Potter et al., 1996). Prinn et al. (1990) estimated the total emissions for 1978–1988 as 20.5±2.4 Tg N yr−1 using a nine-box model. Their estimates included natural and anthropogenic sources, so the total value was significantly larger. The slightly lower estimate of N2O in our study may be due to the consideration of the microbial consumption of nitrogen and ignoring N fixation from the symbiotic system (Rochette and Janzen, 2005; Zhong et al., 2009; Shah, 2014).
4.2 Major controls to soil N2O emissions
In our simulation, emissions were primarily controlled by soil temperature, soil moisture, soil nutrient content, and nitrogen deposition. The highest N2O emissions are usually due to high temperature and ample precipitation because increasing soil temperature stimulates microbial activities related to nitrification and denitrification.
Increased temperature within a threshold was generally assumed to enhance microbial activity (Biederbeck and Campbell, 1973), to increase the nitrification and denitrification rate, and generally to increase the N2O fluxes on annual scales. The response of microbial activity is greatly affected by temperature but the situation is complex because both the growth rate and respiration component are large. Generally, the respiration rate increases over temperature and the optimum temperature for bacterial growth is around 25–35 ∘C (Pietikäinen et al., 2005), although for some nitrifiers the optimum temperature is 42 ∘C (Painter, 1970). Studies on the nitrification rate have shown a similar trend as temperature. The optimum temperature ranges between 20 and 35 ∘C. Below 20 ∘C, the nitrification–denitrification rate drops sharply and there is an almost linear relationship between them. The situation is similar when temperature is above 35 ∘C and the decreasing rate is larger than the increasing rate below 20 ∘C. This is consistent with our sensitivity analysis for different biomes, which indicates that vegetation types in temperate regions were more sensitive to temperature changes than tropical regions. The original temperature in temperate regions is likely to be lower than the optimum temperature range, so a slight increase in temperature will thus increase N2O emissions. Lab experiments show that the increase in temperature has positive impacts on N2O emissions, although this is less significant than the prediction using the Arrhenius equation (BassiriRad, 2000; Zhu and Chen, 2002; Schindlbacher et al., 2004).
Precipitation is significantly correlated with soil moisture, which strongly influences microbial activity (Zhao et al., 2016; Castro et al., 2010) and affects the soil oxygen diffusion (Neira et al., 2015). Rainfall also determines the amount of wet N deposition (Vet et al., 2014) and consequently influences the N2O emissions. In our sensitivity analysis, increased precipitation and wet deposition were simulated to initially promote the nitrification and denitrification rate, as well as N2O emissions. Decreasing precipitation and wet deposition have a negative effect on a global scale. However, excessive precipitation inhibits nitrification because oxygen acts as the electron acceptor in this process. Lower water content may limit nitrifying bacterial activity by restricting substrate supplies and reducing the hydration and activity of enzymes (Stark and Firestone, 1995). When the soil becomes partially anaerobic with very high water content, nitrifiers will be highly inhibited and most emissions are due to the denitrification process. The influence of precipitation is similar to the effects of temperature (Klemedtsson et al., 1988). The highest N2O production appears within an optimum range of soil moisture levels. The rate increases below the optimum range and sharply decreases with extremely high precipitation. These findings are consistent with previous results (Li et al., 1992; Liu et al., 1996; Prentice et al., 2012; Saikawa et al., 2013). Biomes with dramatic seasonal precipitation changes show high sensitivity to the change in precipitation, including savanna and temperate grassland. This is consistent with the experimental study, suggesting that rewetting after extreme drought causes a rapid increase in N2O emissions, especially in the initial rewetting stage (Guo et al., 2014).
In our simulation, the change in soil nutrient content did not lead to a significant change in N2O emissions. Increasing or decreasing the soil carbon content by 10 % resulted in a 1.5 %–1.6 % change in emissions (Table 3a), which is not as sensitive as the climate conditions. The effect of soil nutrients is complex. Elevated soil carbon availability influences microbial activities. The soil microbial nitrogen uptake and growth rate are regulated by soil carbon content, especially in a carbon-limited state (Farrell et al., 2014). Carbon acts as a substrate in denitrification and elevated carbon is expected to enhance N2O emissions (Holmes et al., 2006). In the meantime, elevated soil carbon content will increase plant carbon productivity, which further increases the consumption of soil nitrogen. Plants and microorganisms compete for nitrogen in many processes. The increase in plant production may decrease the availability of nitrogen and consequently inhibit N2O emissions (Zhu et al., 2017).
4.3 Model limitations and implications for future studies
There are a number of limitations to this study. First, our simulation uncertainty is from model parameterization and uncertain structure due to an incomplete understanding of the processes (Janssen et al., 1994). The current parameter values for microbial guilds are mainly from semi-empirical experiment results, including measurements in experiments or observations. But these are limited by available observational data: one set of parameters was applied for all biome grids and ignored the microbial diversity in grids with the same biome. Our current trait-based model did not consider nitrogen input from symbiotic and nonsymbiotic N fixation, because some N2O emissions may be attributed to N fixation (Cosentino et al., 2015; Flynn et al., 2014; Shah, 2014; Zhong et al., 2009). At the global scale, N input through nitrogen fixation is comparable to the input through N deposition. However, there is a large variation among land use types led by the distribution of related bacteria and plants. The contribution of N fixation to total N2O emissions is not considered in this study. In addition, the model has not considered the microbial effect on denitrification, which is also an essential process not only under aerobic, but also under anaerobic conditions. The effect of denitrifying bacteria is a more complicated problem compared to nitrification. Introducing the effect of denitrifying bacteria will establish a more complete relation between carbon and nitrogen.
Uncertain forcing data, including climate, soil conditions, and microbial guild assumptions and observational data, could also bias our estimates. Significant uncertainty remains for input data, especially for several ecophysiological factors of soil microbes. Climate data and soil data were collected from different sources at 0.5∘ × 0.5∘ resolution, which may not be suitable for a certain site.
Some regions (e.g., North America and Europe) have rich observational data to parameterize the model. Compared to tropical rainforests and temperate forests, observational data from tundra and wet tundra are far fewer. Further effort to improve observational accuracy and enrich data, especially in polar zones, would improve the performance of future models.
Most existing process-based models of soil N2O emissions have not considered the effect of detailed microbial dynamics in a spatially and temporally explicit manner. This study developed and applied a trait-based biogeochemistry model to estimate global seasonal and spatial variations through the last decade of the 20th century. The major source of N2O was found to be tropical and temperate forests. The spatial and temporal variation was largely caused by the distribution of microbial traits, soil carbon, and nitrogen sizes, as well as different precipitation and temperature regimes. The global soil N2O emissions from global natural ecosystems were estimated to be 8.7 Tg N yr−1 on average. Our study suggests that more experimental data on microbial ecophysiology and N2O fluxes should be collected to improve the future quantification of N2O emissions from global natural ecosystem soils.
All data used in this study are available from the authors upon request. Climate data including monthly cloudiness, precipitation, temperature, and water vapor pressure are from the Climate Research Unit (CRU) http://www.cru.uea.ac.uk/data (last access: May 2017). Global vegetation data and soil data are available in Zhuang et al. (2003) and McGuire et al. (2001). The explicit spatial data on soil water pH from the ORDL gridded soil properties product (https://daac.ornl.gov/ cgi-bin/dsviewer.pl?ds_id=546, last access: March ,2017) are based on the World Inventory of Soil Emission Potentials (WISE) database (Batjes, 2000). The global average carbon dioxide concentration is observed at NOAA's Mauna Loa Observatory. N deposit data are from NADP monitor and CASTNET. The initial values of soil microbial carbon and nitrogen, and the ratio of C ∕ V ∕ N at the global scale, were from a compilation of global soil microbial biomass carbon, nitrogen, and phosphorus data (https://doi.org/10.3334/ORNLDAAC/1264, last access: May, 2017).
QZ and TY designed the research. TY performed model simulations and data analysis. Both authors contributed to the writing the paper.
The authors declare that they have no conflict of interest.
This study is supported through projects funded by the NASA Land Use and
Land Cover Change program (NASA-NNX09AI26G), the Department of Energy
(DE-FG02-08ER64599), and the NSF Division of Information & Intelligent
Systems (NSF-1028291). Thanks to the Rosen Center for Advanced Computing (RCAC)
at Purdue University for computing support.
Edited by: Trevor Keenan
Reviewed by: two anonymous referees
Anderson, B., Bartlett, K., Frolking, S., Hayhoe, K., Jenkins, J., and Salas, W.: Methane and Nitrous Oxide Emissions from Natural Sources, Office of Atmospheric Programs, US EPA, EPA 430-R-10-001, Washington DC, 2010.
Bassirirad, H.: Kinetics of nutrient uptake by roots: responses to global change, New Phytol., 147, 155–169, 2000.
Batjes, N. H.: Global data set of derived soil properties, 0.5-degree grid (ISRIC-WISE), ORNL DAAC, 2000.
Bianconi, E., Piovesan, A., Facchin, F., Beraudi, A., Casadei, R., Frabetti, F., and Perez-Amodio, S.: An estimation of the number of cells in the human body, Ann. Hum. Biol., 40, 463–471, 2013.
Biederbeck, V. O. and Campbell, C. A.: Soil microbial activity as influenced by temperature trends and fluctuations, Can. J. Soil Sci., 53, 363–376, 1973.
Bouskill, N., Tang, J., Riley, W. J., and Brodie, E. L.: Trait-based representation of biological nitrification: model development, testing, and predicted community composition, Front. Microbiol., 3, 364, 2012.
Bouwman, A. F., Fung, I., Matthews, E., and John, J.: Global analysis of the potential for N2O production in natural soils, Global. Biogeochem. Cy., 7, 557–597, 1993.
Brochier-Armanet, C., Boussau, B., Gribaldo, S., and Forterre, P.: Mesophilic Crenarchaeota: proposal for a third archaeal phylum, the Thaumarchaeota. Nat. Rev. Microbiol., 6, 245–252, 2008.
Cabello, P., Roldan, M. D., and Moreno-Vivian, C.: Nitrate reduction and the nitrogen cycle in archaea, Microbiology, 150, 3527–3546, 2004.
Castro, H. F., Classen, A. T., Austin, E. E., Norby, R. J., and Schadt, C. W.: Soil microbial community responses to multiple experimental climate change drivers, Appl. Environ. Microb., 76, 999–1007, 2010.
Ciais, P., Sabine, C., Bala, G., Bopp, L., Brovkin, V., Canadell, J., and Jones, C.: Carbon and other biogeochemical cycles, in: Climate change 2013: the physical science basis, Contribution of Working Group I to the Fifth Assessment Report of the Intergovernmental Panel on Climate Change, 465–570, Cambridge University Press, 2014.
Cosentino, V. R. N., Brutti, L. N., Civeira, G., and Taboada, M. Á.: Contribution of biological nitrogen fixation to N2O emission from soil under soybean, Ciencia del Suelo, 33, 313–321, 2015.
Davidson, E. A. and Kanter, D.: Inventories and scenarios of nitrous oxide emissions, Environ. Res. Lett., 9, 105012, 2014.
Droop, M. R.: Some thoughts on nutrient limitation in algae 1, J. Phycol., 9, 264–272, 1973.
Erguder, T. H., Boon, N., Wittebolle, L., Marzorati, M., and Verstraete, W.: Environmental factors shaping the ecological niches of ammonia-oxidizing archaea, FEMS Microbiol. Rev., 33, 855–869, 2009.
Estes, L. D., Bradley, B. A., Beukes, H., Hole, D. G., Lau, M., Oppenheimer, M. G., and Turner, W. R.: Comparing mechanistic and empirical model projections of crop suitability and productivity: implications for ecological forecasting, Global Ecol. Biogeogr., 22, 1007–1018, 2013.
Falkowski, P. G., Fenchel, T., and Delong, E. F.: The microbial engines that drive Earth's biogeochemical cycles, Science, 320, 1034–1039, 2008.
Farrell, M., Prendergast-Miller, M., Jones, D. L., Hill, P. W., and Condron, L. M.: Soil microbial organic nitrogen uptake is regulated by carbon availability, Soil Biol. Biochem., 77, 261–267, 2014.
Flynn, B., Graham, A., Scott, N., Layzell, D. B., and Dong, Z.: Nitrogen fixation, hydrogen production and N2O emissions, Can. J. Plant Sci., 94, 1037–1041, 2014.
Francis, C. A., Roberts, K. J., Beman, J. M., Santoro, A. E., and Oakley, B. B.: Ubiquity and diversity of ammonia-oxidizing archaea in water columns and sediments of the ocean, P. Natl. Acad Sci. USA, 102, 14683–14688, 2005.
Francis, C. A., Beman, J. M., and Kuypers, M. M.: New processes and players in the nitrogen cycle: the microbial ecology of anaerobic and archaeal ammonia oxidation, The ISME J., 1, 19–27, 2007.
Guo, L. and Vanrolleghem, P. A.: Calibration and validation of an activated sludge model for greenhouse gases no. 1 (ASMG1): prediction of temperature-dependent N2O emission dynamics,Bioproc. Biosyst. Eng., 37, 151–163, 2014.
Holmes, W. E., Zak, D. R., Pregitzer, K. S., and King, J. S.: Elevated CO2 and O3 alter soil nitrogen transformations beneath trembling aspen, paper birch, and sugar maple, Ecosystems, 9, 1354–1363, 2006.
Huang, Y. and Gerber, S.: Global soil nitrous oxide emissions in a dynamic carbon-nitrogen model, Biogeosciences, 12, 6405–6427, https://doi.org/10.5194/bg-12-6405-2015, 2015.
Janssen, P. H. M., Heuberger, P. S. C., and Sanders, R.: UNCSAM: a tool for automating sensitivity and uncertainty analysis, Environ. Softw., 9, 1–11, 1994.
Kandeler, E., Deiglmayr, K., Tscherko, D., Bru, D., and Philippot, L.: Abundance of narG, nirS, nirK, and nosZ genes of denitrifying bacteria during primary successions of a glacier foreland, Appl. Environ. Microb., 72, 5957–5962, 2006.
Klemedtsson, L., Svensson, B. H., and Rosswall, T.: Relationships between soil moisture content and nitrous oxide production during nitrification and denitrification, Biol. Fert. Soils, 6, 106–111, 1988.
Koper, T. E., Stark, J. M., Habteselassie, M. Y., and Norton, J. M.: Nitrification exhibits Haldane kinetics in an agricultural soil treated with ammonium sulfate or dairy-waste compost, FEMS Microbiol. Ecol., 74, 316–322, 2010.
Kowalchuk, G. A. and Stephen, J. R.: Ammonia-oxidizing bacteria: a model for molecular microbial ecology, Annu. Rev Microbiol., 55, 485–529, 2001.
Kreileman, G. J. J. and Bouwman, A. F.: Computing land use emissions of greenhouse gases, Water Air. Soil Pollut., 76, 231–258, 1994.
Kroeze, C., Mosier, A., and Bouwman, L.: Closing the global N2O budget: a retrospective analysis 1500–1994, Global Biogeochem. Cy., 13, 1–8, 1999.
Leininger, S., Urich, T., Schloter, M., Schwark, L., Qi, J., Nicol, G. W., and Schleper, C.: Archaea predominate among ammonia-oxidizing prokaryotes in soils, Nature, 442, 806–809, 2006.
Li, C., Frolking, S., and Frolking, T. A.: A model of nitrous oxide evolution from soil driven by rainfall events: 1. Model structure and sensitivity, J. Geophys. Res.-Atmos., 97, 9759–9776, 1992.
Li, C. S.: Modeling trace gas emissions from agricultural ecosystems, in: Methane Emissions from Major Rice Ecosystems in Asia, 259–276, Springer, Dordrecht, 2000.
Liu, Y.: Modeling the emissions of nitrous oxide (N2O) and methane (CH4) from the terrestrial biosphere to the atmosphere, Doctoral dissertation, Massachusetts Institute of Technology, 1996.
Mäkelä, A., Landsberg, J., Ek, A. R., Burk, T. E., Ter-Mikaelian, M., Ågren, G. I., and Puttonen, P.: Process-based models for forest ecosystem management: current state of the art and challenges for practical implementation, Tree Physiol., 20, 289–298, 2000.
McGuire, A. D., Melillo, J. M., Joyce, L. A., Kicklighter, D. W., Grace, A. L., Moore III, B., and Vorosmarty, C. J.: Interactions between carbon and nitrogen dynamics in estimating net primary productivity for potential vegetation in North America, Global Biogeochem. Cy., 6, 101–124, https://doi.org/10.1029/92GB00219, 1992.
McGuire, A. D., Sitch, S., Clein, J. S., Dargaville, R., Esser, G., Foley, J., and Meier, R. A.: Carbon balance of the terrestrial biosphere in the twentieth century: Analyses of CO2, climate and land use effects with four process-ecosystem models, Global Biogeochem. Cy., 15, 183–206, 2001.
Melillo, J. M., McGuire, A. D., Kicklighter, D. W., Moore III, B., Vorosmarty, C. J., and Schloss, A. L.: Global climate change and terrestrial net primary production, Nature, 363, 234–240, https://doi.org/10.1038/363234a0, 1993.
Mosier, A., Kroeze, C., Nevison, C., Oenema, O., Seitzinger, S., and Van Cleemput, O.: Closing the global N2O budget: nitrous oxide emissions through the agricultural nitrogen cycle, Nutr. Cycl. Agroecosys., 52, 225–248, 1998.
Neira, J., Ortiz, M., Morales, L., and Acevedo, E.: Oxygen diffusion in soils: Understanding the factors and processes needed for modeling, Chil. J Agr. Res., 75, 35–44, 2015.
Olivier, J. G. J., Bouwman, A. F., Van der Hoek, K. W., and Berdowski, J. J. M.: Global air emission inventories for anthropogenic sources of NOx, NH3 and N2O in 1990, in: Nitrogen, the Confer-Ns, 135–148, 1998.
Painter, H. A.: A review of literature on inorganic nitrogen metabolism in microorganisms, Water Res., 4, 393–450, 1970.
Pietikäinen, J., Pettersson, M., and Bååth, E.: Comparison of temperature effects on soil respiration and bacterial and fungal growth rates, FEMS Microbiol. Ecol., 52, 49–58, 2005.
Potter, C. S., Matson, P. A., Vitousek, P. M., and Davidson, E. A.: Process modeling of controls on nitrogen trace gas emissions from soils worldwide, J. Geophys. Res.-Atmos., 101, 1361–1377, 1996.
Prentice, I. C., Spahni, R., and Niu, H. S.: Modelling terrestrial nitrous oxide emissions and implications for climate feedback, New Phytol., 196, 472–488, 2012.
Priemé, A., Braker, G., and Tiedje, J. M.: Diversity of nitrite reductase (nirK and nirS) gene fragments in forested upland and wetland soils, Appl. Environ. Microb., 68, 1893–1900, 2002.
Prinn, R., Cunnold, D., Rasmussen, R., Simmonds, P., Alyea, F., Crawford, A., and Rosen, R.: Atmospheric emissions and trends of nitrous oxide deduced from 10 years of ALE-GAGE data, J. Geophys. Res.-Atmos., 95, 18369–18385, 1990.
Prosser, J. I. and Nicol, G. W.: Relative contributions of archaea and bacteria to aerobic ammonia oxidation in the environment, Environ. Microbiol., 10, 2931–2941, 2008.
Prosser, J. I.: Soil nitrifiers and nitrification, in: Nitrification, 347–383, American Society of Microbiology, 2011.
Qin, Z., Zhuang, Q., and Zhu, X.: Carbon and nitrogen dynamics in bioenergy ecosystems: 1. Model development, validation and sensitivity analysis, GCB bioenergy, 6, 740–755, 2014.
Rochette, P. and Janzen, H. H.: Towards a revised coefficient for estimating N2O emissions from legumes, Nutr. Cycl. Agroecosys., 73, 171–179, 2005.
Saikawa, E., Schlosser, C. A., and Prinn, R. G.: Global modeling of soil nitrous oxide emissions from natural processes, Global Biogeochem. Cy., 27, 972–989, 2013.
Schindlbacher, A., Zechmeister-Boltenstern, S., and Butterbach-Bahl, K.: Effects of soil moisture and temperature on NO, NO2, and N2O emissions from European forest soils, J. Geophys. Res.-Atmos., 109, D17302, https://doi.org/10.1029/2004JD004590, 2004.
Shah, A.: Determination of Biological Nitrogen Fixation Induced N2O Emission from Arable Soil by Using a Closed Chamber Technique, Appl. Environ. Soil Sci., 685168, https://doi.org/10.1155/2014/685168, 2014.
Shoun, H., Fushinobu, S., Jiang, L., Kim, S. W., and Wakagi, T.: Fungal denitrification and nitric oxide reductase cytochrome P450nor, Phil. Trans. R. Soc. B, 367, 1186–1194, 2012.
Stanford, G., Dzienia, S., and Vander Pol, R. A.: Effect of Temperature on Denitrification Rate in Soils 1, Soil Sci. Soc. Am. J., 39, 867–870, 1975.
Stark, J. M. and Firestone, M. K.: Mechanisms for soil moisture effects on activity of nitrifying bacteria, Appl. Environ. Microb., 61, 218–221, 1995.
Stehfest, E. and Bouwman, L.: N2O and NO emission from agricultural fields and soils under natural vegetation: summarizing available measurement data and modeling of global annual emissions, Nutr. Cycl. Agroecosys, 74, 207–228, 2006.
Tian, H., Chen, G., Lu, C., Xu, X., Ren, W., Zhang, B., and Zhang, C.: Global methane and nitrous oxide emissions from terrestrial ecosystems due to multiple environmental changes, Ecosyst. Health Sustain., 1, 1–20, 2015.
Tian, H., Yang, J., Lu, C., et al.: The global N2O Model Intercomparison Project, B. Am. Meteorol. Soc.,99, 1231–1251, 2018.
Tong, Y.: Quantifying the global N2O emissions from natural ecosystems using a mechanistically-based biogeochemistry model, MS thesis, available at: http://docs.lib.purdue.edu/dissertations/AAI10145857/ (last access: January 2019), 2016.
Torregrosa-Crespo, J., Martínez-Espinosa, R. M., Esclapez, J., Bautista, V., Pire, C., Camacho, M., and Bonete, M. J.: Anaerobic metabolism in Haloferax genus: Denitrification as case of study, in: Advances in microbial physiology, Vol. 68, 41–85, Academic Press, 2016.
Treusch, A. H., Leininger, S., Kletzin, A., Schuster, S. C., Klenk, H. P., and Schleper, C.: Novel genes for nitrite reductase and Amo-related proteins indicate a role of uncultivated mesophilic crenarchaeota in nitrogen cycling, Environ. Microbiol., 7, 1985–1995, 2005.
Venter, J. C., Remington, K., Heidelberg, J. F., Halpern, A. L., Rusch, D., Eisen, J. A., and Fouts, D. E.: Environmental genome shotgun sequencing of the Sargasso Sea, Science, 304, 66–74, 2004.
Vet, R., Artz, R. S., Carou, S., Shaw, M., Ro, C. U., Aas, W., and Hou, A.: A global assessment of precipitation chemistry and deposition of sulfur, nitrogen, sea salt, base cations, organic acids, acidity and pH, and phosphorus, Atmos. Environ., 93, 3–100, 2014.
Whitehead, D. C.: Grassland nitrogen, CAB international, Wallingford, UK, ISBN: 0851989152, 1995.
Winogradsky, S.: Recherches sur les organisms de la nitrification, Ann. Inst. Pasteur, 4, 213–231, 1890.
Xu, X., Tian, H., and Hui, D.: Convergence in the relationship of CO2 and N2O exchanges between soil and atmosphere within terrestrial ecosystems, Global Change Biol., 14, 1651–1660, 2008.
Xu, X., Thornton, P. E., and Potapov, P.: A Compilation of Global Soil Microbial Biomass Carbon, Nitrogen, and Phosphorus Data, ORNL DAAC, 2015.
Xu, X., Thornton, P. E., and Post, W. M.: A Compilation of Global Soil Microbial Biomass Carbon, Nitrogen, and Phosphorus Data, Data set from Oak Ridge National Laboratory Distributed Active Archive Center, Oak Ridge, Tennessee, USA, available at: http://daac.ornl.gov (last access: May, 2017), 2014.
Zhao, S., Li, K., Zhou, W., Qiu, S., Huang, S., and He, P.: Changes in soil microbial community, enzyme activities and organic matter fractions under long-term straw return in north-central China, Agr. Ecosyst. Environ., 216, 82–88, 2016.
Zhong, Z., Lemke, R. L., and Nelson, L. M.: Nitrous oxide emissions associated with nitrogen fixation by grain legumes, Soil Biol. Biochem., 41, 2283–2291, 2009.
Zhu, Q., Riley, W. J., and Tang, J.: A new theory of plant–microbe nutrient competition resolves inconsistencies between observations and model predictions, Ecol. Appl., 27, 875–886, 2017.
Zhu, S. and Chen, S.: The impact of temperature on nitrification rate in fixed film biofilters, Aquacult. Eng., 26, 221–237, 2002.
Zhuang, Q., McGuire, A. D., Melillo, J. M., Clein, J. S., Dargaville, R. J., Kicklighter, D. W., and Hobbie, J. E.: Carbon cycling in extratropical terrestrial ecosystems of the Northern Hemisphere during the 20th century: a modeling analysis of the influences of soil thermal dynamics, Tellus, 55, 751–776, 2003.
Zhuang, Q., McGuire, A. D., Melillo, J. M., Clein, J. S., Dargaville, R. J., Kicklighter, D. W., and Hobbie, J. E.: Carbon cycling in extratropical terrestrial ecosystems of the Northern Hemisphere during the 20th century: a modeling analysis of the influences of soil thermal dynamics, Tellus B, 55, 751–776, 2011.
Zhuang, Q., Lu, Y., and Chen, M.: An inventory of global N2O emissions from the soils of natural terrestrial ecosystems, Atmos. Environ., 47, 66–75, 2012.