the Creative Commons Attribution 4.0 License.
the Creative Commons Attribution 4.0 License.
 | 12 Jul 2019
Distribution, seasonality, and fluxes of dissolved organic matter in the Pearl River (Zhujiang) estuary, China
Yang Li
Guisheng Song
Philippe Massicotte
Fangming Yang
Ruihuan Li
Dissolved organic carbon (DOC) concentration in the Pearl River estuary (PRE) of China was measured in May, August, and October 2015 and January 2016. Chromophoric and fluorescent dissolved organic matter (CDOM and FDOM) in the latter three seasons were characterized by absorption and fluorescence spectroscopy. CDOM and FDOM exhibited negligible seasonal variations, while DOC displayed a significant seasonality, with the average concentration being highest in May (156 µmol L−1), lowest in November (87 µmol L−1), and comparable between January (118 µmol L−1) and August (112 µmol L−1). Although DOC, CDOM, and FDOM in surface water were generally higher than in bottom water, the difference between the two layers was statistically insignificant. DOC showed little cross-estuary variations in all seasons, while CDOM and FDOM in January were higher on the west side of the estuary than on the east side. All three variables showed rapid drawdowns in the head region of the estuary (salinity <5); their dynamics in the main estuary were primarily controlled by conservative mixing, leading to linearly declining or relatively constant (for DOC in May and November only) contents with increasing salinity. The decrease in FDOM with salinity was 5 %–35 % faster than that of CDOM, which in turn was 2–3 times quicker than that of DOC. Salinity and CDOM absorption coefficients could serve as indicators of DOC in August and January. Freshwater endmembers in all seasons mainly contained fresh, protein-rich DOM of microbial origin, a large part of it likely being pollution-derived. Protein-like materials were preferentially consumed in the head region but the dominance of the protein signature was maintained throughout the estuary. Exports of DOC and CDOM (in terms of the absorption coefficient at 330 nm) into the South China Sea were estimated as 195×109 g and 266×109 m2 for the PRE and 362×109 g and 493×109 m2 for the entire Pearl River Delta. The PRE presents the lowest concentrations and export fluxes of DOC and CDOM among the world's major estuaries. DOM delivered from the PRE is, however, protein-rich and thus may enhance heterotrophs in the adjacent coastal waters. Overall, the PRE manifests lower abundance and smaller spatiotemporal variability of DOM than expected for a sizable estuary with a marked seasonality of river runoff due supposedly to the poorly forested watershed of the Pearl River, the rapid degradation of the pollution-derived DOM in the upper reach, and the short residence time of freshwater.
- Article
(1764 KB) - Full-text XML
-
Supplement
(391 KB) - BibTeX
- EndNote


River runoff is an important contribution of dissolved organic matter (DOM) to the ocean (Raymond and Spencer, 2015). DOM in river water originates from soil leaching (terrigenous DOM) and in situ microbial production. Terrigenous DOM, abounding with lignin phenols (Opsahl and Benner, 1997), differs substantially from microbial-derived DOM, enriched with proteins (Martínez-Pérez et al., 2017; Brogi et al., 2018), in optical properties and biological and photochemical lability (Hansen et al., 2016; Sulzberger and Arey, 2016). The loads of terrigenous and microbial DOM and their proportions in river water rely on many factors, among which precipitation is a key player. High precipitation mobilize more terrigenous DOM from soil into rivers compared to drier conditions (Fichot et al., 2014; Li et al., 2015). Moreover, the residence time of river water during high-flow seasons is shorter, tending to decrease autochthonous DOM production (Taylor et al., 2003). During its transit through estuaries, riverine DOM may be subject to physical (e.g., flocculation and coagulation, Asmala et al., 2014), biological (e.g., microbial uptake, Benner and Kaiser, 2011), and photochemical (Del Vecchio and Blough, 2002) removals, thereby reducing its abundance and modifying its chemical and optical properties before reaching the ocean. Conversely, biological production in estuaries can add organic matter to the riverine DOM pool (Bianchi et al., 2004; Fellman et al., 2010; Benner and Kaiser, 2011; Deutsch et al., 2012). In highly populated areas, industrial and residential wastes can also cause a significant contribution of DOM to river systems (Baker, 2001; Guo et al., 2014). Pollution not only directly brings anthropogenic DOM but also carries nutrients that enhance biological DOM production.
The Pearl River estuary (PRE), located in the highly urbanized and industrialized Pearl River Delta, is a subtropical embayment receiving large freshwater discharge with marked seasonal fluctuations (Sect. 2.1) and an annual input of 5.8×10⁹ t of industrial and domestic sewage (Lu et al., 2009). A number of studies in the PRE have determined the concentrations of DOC ([DOC]) and/or the proxy of chromophoric abundance (〈CDOM〉) in terms of absorption coefficients and fluorescence intensities (e.g., Dai et al., 2000; Callahan et al., 2004; Chen et al., 2004; Hong et al., 2005; He, 2010; Lei et al., 2018; Ye et al., 2018). These studies show no consistent seasonality and estuarine mixing behavior of [DOC] and 〈CDOM〉 and no correlation between the two variables except one occasion for the mid-salinity (5–20) section of the estuary (Callahan et al., 2004).
The lack of seasonality and consistent estuarine mixing behavior of [DOC] and 〈CDOM〉 suggests complex processes controlling their transport, production, and loss in the PRE; it could, however, also result in part from the difference in spatiotemporal coverage of the stations sampled by different studies. As previous DOC and CDOM data were collected over a span of 18 and 15 years, respectively, the possibility of interannual variability cannot be ruled out. In addition, none of the past DOC studies save that of Ye et al. (2018) surveyed all four seasons and many of them chose two different months to represent the wet and dry seasons, though [DOC] and its mixing behavior may change on smaller timescales. The more limited number of CDOM absorption surveys only sampled a single season with no winter visits. Concerning the spatial coverage, studies often differ in the distribution of sampling stations (e.g., Hong et al., 2005 vs. Lei et al., 2018) and many did not cover the upper reach of the estuary (e.g., Chen et al., 2003, 2004; Wang et al., 2014; Lei et al., 2018).
Compared with the quantitative information on DOC and CDOM, much less is known about the seasonality and mixing behavior of their qualitative aspects. He et al. (2010) examined the DOC compositions (monosaccharides vs. polysaccharides and dissolved free amino acids vs. dissolved combined amino acids) along a longitudinal salinity-gradient transect in the PRE. Hong et al. (2005) determined the fluorescence excitation–emission matrices (EEMs) on samples collected in the dry season and suspected that fluorescent DOM (FDOM) in the PRE bears a microbial signature derived from sewage effluents. Spectral slope coefficient (Hong et al., 2005; Lei et al., 2018) and [DOC]-normalized fluorescence intensity (Callahan et al., 2004) have also been sporadically used to assess the quality of CDOM in the PRE. Besides, Ye et al. (2018) reported a shift of the DOC source from terrigenous material in the river to phytoplankton in the lower PRE based on stable carbon isotopes.
Finally, only a few studies have estimated the DOC export flux from the Pearl River to the South China Sea (Lin, 2007; Ni et al., 2008; He et al., 2010), often with limited seasonal coverage. The estimate made by Lin (2007) is almost two times that by Ni et al. (2008). No estimates of CDOM export have been made for the PRE.
Given the large volume and seasonality of the freshwater discharge of the Pearl River, we hypothesize that the quantity of DOM and the quality of CDOM in the PRE present substantial seasonal variability and that the PRE is an important source of DOM to the global ocean. To test this hypothesis, the present study sampled the same locations in different seasons within a 12-month period, with the objectives of (1) evaluating the seasonality and estuarine mixing behavior of DOC and CDOM in the PRE, (2) improving the estimate of DOC export to the South China Sea, and (3) providing a first assessment of seaward export of CDOM from the PRE. Results from this study further increase our understanding of DOM cycling in human-impacted estuarine waters and their contribution to the oceanic DOC and CDOM budgets.
2.1 Site description
Ranked the 13th largest river in the world in terms of freshwater volume discharge (Zhang et al., 2008), the Pearl River delivers 285×109 m3 of freshwater annually to the South China Sea, with 70 % to 80 % of this discharge occurring in the wet season (April–September) and only 20 %–30 % in the dry season (October–March) (Wei and Wu, 2014). The Pearl River is composed of three main tributaries, the West, North, and East Rivers (Fig. 1), with the West River contributing 73 % of the total freshwater discharge, the North River 14 %, and the East River 8 % (Wei and Wu, 2014). In the delta area, the three tributaries continuously bifurcate to form a complex water network that is connected to the South China Sea via three estuaries: Lingdingyang, Modaomen, and Huangmaohai. Lingdingyang, the principal estuary of the Pearl River, is commonly referred to as the Pearl River estuary (PRE hereafter) and is the study area of this work. The PRE receives 50 %–55 % of the Pearl River's total freshwater flow from four major water outlets, namely Humen, Jiaomen, Hongqimen, and Hengmen (Mikhailov et al., 2006), with Humen providing 35 % of the freshwater input, followed by Jiaomen (33 %), Hengmen (20 %), and Hongqimen (12 %) (Kot and Hu, 1995).
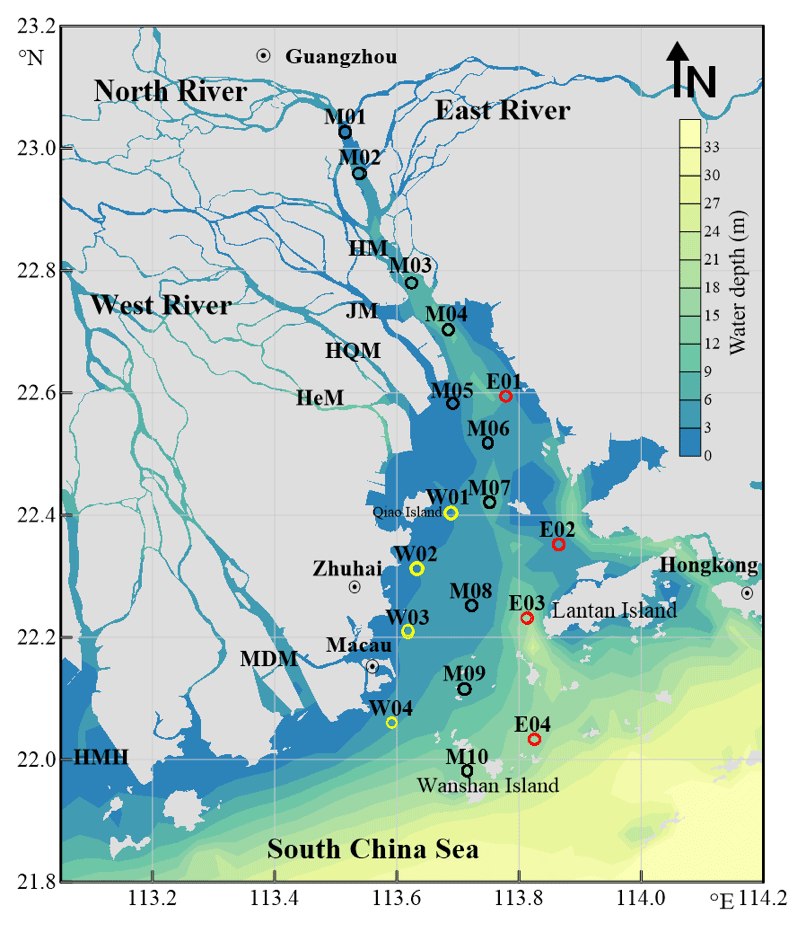
Figure 1Map of sampling stations in the Pearl River Estuary. Station names starting with letters M, W, and E designate the main, west, and east transects, respectively. See Table S1 for coordinates of the stations. HM: Humen; JM: Jiaomen; HQM: Hongqimen; HeM: Hengmen; MDM: Maodaomen; HMH: Huangmaohai.
The PRE covers an area of ∼2000 km2 and has an average depth of 4.8 m, with a topography featured with shoals of <2 m deep and channels of >5 m deep (Fig. 1) (Dong et al., 2004; Wai et al., 2004). Turbidity maxima may occur at different sections of the estuary, depending on hydrological conditions (Zhao, 1990; Wai et al., 2004). Tides in the PRE are irregular and semidiurnal, with a mean tidal range of 0.86–1.7 m (Zhao, 1990). Phytoplankton blooms develop only on local scales, usually in the mid-estuary during the dry season and in the lower part of the estuary during the wet season (Lu and Gan, 2015).
2.2 Sample collection
The sampling area covered the entire PRE, stretching from ∼30 km upstream of Humen to the outer limit of the estuary (Fig. 1). A total of 10 stations (M01–M10) were distributed across the main longitudinal axis of the estuary, together with two shorter along-estuary transects, each having four stations on the east (E01–E04) and west (W01–W04) sides. The coordinates of the stations alongside other sampling information are shown in Table S1 in the Supplement. Water samples were collected in duplicate from the surface (∼1 m) and near the bottom (1–2 m above the seabed) using a 5 L plexiglass sampler between 8–12 May, 7–11 August, and 16–19 November 2015 and 10–14 January 2016 for [DOC] measurement and in the last three seasons for CDOM analysis. The samples were filtered through 0.2 µm polyethersulfone (PES) filters (Pall Life Sciences) under low vacuum and the filtrates were transferred into 20 mL (DOC) and 100 mL (CDOM) clear-glass bottles with Teflon-lined screw caps. DOC samples were acidified to pH ∼2 with 2 N HCl (Reagent grade, Merck). All samples were stored in the dark at 4 ∘C until being analyzed in a land-based laboratory within two weeks after water collection. Prior to use, the glass filtration apparatus and the sample storage bottles were acid-cleaned and combusted at 450 ∘C for 4 h, and the PES filters were thoroughly rinsed with Milli-Q water and sample water. Water temperature and salinity were determined with a SBE-25 conductivity–temperature–depth (CTD) profiler.
2.3 DOM analysis
[DOC] for each subsample was determined in triplicate using a Shimadzu TOC-LCPH analyzer calibrated with potassium hydrogen phthalate, with the coefficient of variation <2 %. The performance of the analyzer was checked, at intervals of 10 consecutive sample analyses, against Hansell's low carbon ([DOC]: 1–2 µmol L−1) and deep Florida Strait ([DOC]: 41–44 µmol L−1) reference waters; the measured [DOC] values for the reference waters were 2.36±0.06 µmol L−1 and 43.6±1.5 µmol L−1.
CDOM absorbance spectra were scanned from 800 to 200 nm at 1 nm intervals with a Shimadzu UV-2550 dual beam spectrophotometer fitted with 10 cm quartz cells and referenced to Nanopure water. The samples were allowed to warm up to room temperature in darkness before analysis. A baseline correction was made by subtracting the mean absorbance value over 683–687 nm from all spectral values (Babin et al., 2003). The Napierian absorption coefficient, aCDOM (m−1), was calculated as 2.303 times the absorbance divided by the light pathlength of the cell in meters (0.1 m). The analytical uncertainty of aCDOM measurement was assessed by analyzing six replicates of the sample collected at station M01 from the August cruise, arriving at a standard deviation of 0.06 m−1 or 1.3 % at 330 nm, with the mean aCDOM at 330 nm (a330) being 4.37 m−1. In this study we choose a330 as an indicator of the CDOM abundance, given that this variable has been frequently used for this surrogate role (e.g., Osburn et al., 2009; Gareis et al., 2010; Mann et al., 2012; Song et al., 2017) and that the wavelength of 330 nm is where many aquatic CDOM photoreactions, including photobleaching, exhibit maximum rates in surface water under solar radiation (e.g., Vähätalo et al., 2000; Osburn et al., 2001; Zhang et al., 2006; White et al., 2010; Xie et al., 2012a). CDOM absorption coefficients at other commonly used wavelengths and the spectral slope coefficient between 300 and 500 nm are presented in Table S2.
Fluorescence EEMs were acquired using a Hitachi F-4600 fluorescence spectrophotometer fitted with a 1 cm quartz cuvette to characterize the FDOM composition (Coble, 1996; Boehme et al., 2004). Again, samples were warmed up to room temperature before analysis. Emission spectra were scanned from 230 to 600 nm at 2 nm intervals over excitation wavelengths between 200 and 450 nm at 5 nm increments. Raman scattering was removed by subtracting Nanopure water EEMs that were scanned on the same day as those for the samples. The spectral fluorescence intensities were normalized to Raman units (RU) following the Raman scatter peak correction reported by Lawaetz and Stedmon (2009). Potential inner-filtering effects were corrected using the obtained absorbance spectra (Ohno, 2002), even though self-shading should be insignificant since the absorption coefficient at 254 nm (a254) was less than 15 m−1 for all samples.
PARAFAC analysis was performed to decompose the EEMs into a set of underlying fluorescent components (Bro, 1997; Stedmon et al., 2003; Stedmon and Bro, 2008). The analysis was fed with 117 EEMs from all three seasons sampled for CDOM (Sect. 2.1). To reduce the dominance of high-fluorescence intensity signals, the EEMs were first scaled to a unit of variance within the sample mode to construct the calibration model (Bro, 1997). PARAFAC models from 2 to 7 components with constraints of non-negativity in all modes were successively conducted with MATLAB (version 2008b; MathWorks 2008) using the DOM Fluorescence Toolbox (DOM Fluor version 1.6) and validated using residual and split-half analyses as described by Stedmon and Bro (2008). The parameters obtained from the PARAFAC model were used to calculate an approximate abundance of each component, expressed as Fmax in Raman units, which corresponds to the maximum fluorescence intensity for a particular sample. Based on analysis of triplicate samples from stations M01, M08, and M10, the uncertainty of Fmax for each modeled component was <2 %.
PARAFAC modeling identified five distinct FDOM components (C1–C5, Fig. 2), which explained 99.75 % of the variance and thus adequately modeled the different FDOM profiles in the dataset. Based on a comparison with the OpenFluor database (https://openfluor.lablicate.com/, last access: 7 January 2019), particularly with the PARAFAC spectra published by several well-recognized groups (e.g., Stedmon et al., 2003; Cory and McKnight, 2005; Yamashita and Jaffé, 2008; Murphy et al., 2008; Santín et al., 2009; Massicotte and Frenette, 2011), components 1 (C1) and 5 (C5) were assigned as tyrosine-like and tryptophan-like fluorophores and components 2 (C2), 3 (C3), and 4 (C4) as humic-like DOM fractions, respectively. As C1 is highly correlated with C5 (r=0.997) and C2 with C3 (r=0.990) and C4, (r=0.993), the sum of the Fmax values of C1 and C5 (Cp hereafter) and of those of C2, C3, and C4 (Ch hereafter) will be used as proxies of the abundances of the protein-like and humic-like fractions, respectively.

Figure 2Excitation–emission contours of five components identified by PARAFAC modeling (left panels) and split-half validations of excitation and emission loadings (right panels). Excitation/emission maximum wavelengths are: C1: 275/320 nm; C2: <240(335)/426 nm; C3: 245/378 nm; C4: 255(370)/464 nm; C5: <240(290)/348 nm.
To characterize the quality of DOM, the E2∕E3 quotient, biological index (BIX), and humic index (HIX) were calculated from the measured absorbance and fluorescence spectra. E2∕E3, defined as the ratio of a250 to a365, serves as a proxy for the average molecular weight (MW) and aromaticity of CDOM, with lower values indicating higher MW and higher aromaticity (Peuravuori and Pihlaja, 1997; Lou and Xie, 2006; Li and Hur, 2017). E2∕E3 responds quantitatively to CDOM photobleaching (Lou and Xie, 2006) and its proxy function is similar to that of the later developed absorption spectral slope coefficient between 275 and 295 nm (Helms et al., 2008). BIX, the ratio of fluorescence intensity at 380 nm to that at 430 nm with excitation at 310 nm, indicates the relative contribution of fresh, autochthonous DOM (McKnight et al., 2001). HIX, the ratio of the fluorescence intensity integrated over 435–480 nm to that over 300–345 nm with excitation at 254 nm, is a surrogate of the extent of FDOM humification (Ohno, 2002). BIX values of >0.8 indicate fresh, microbially derived DOM, while values of <0.6 signify little autochthonous material (Huguet et al., 2009). Fresh DOM derived from plant biomass usually displays HIX values of <5, whereas soil-derived DOM has values between 10 and 30 (Birdwell and Engel, 2010; Sazawa et al., 2011). In addition, the percentages of Cp (%Cp hereafter) and Ch (%Ch hereafter) in the sum of C1–C5 will serve to represent the proportions of protein-like and humic-like components in the total FDOM pool.
2.4 Miscellaneous aspects
Analysis of statistical significance (α=0.05) was performed using a one-way ANOVA (analysis of variance) and Student's t test in Microsoft Excel 2010. For the benefit of conciseness, this statistic approach will not be re-described when presenting and discussing the results.
The monthly-averaged freshwater discharge rates of the Pearl River for the sampling months were obtained from the Ministry of Water Resources of the People's Republic of China (available online at http://www.mwr.gov.cn/sj/#tjgb, last access: 7 July 2019).
For brevity of presenting and discussing data, seasons for a property, where applicable, are added as a superscript to the symbol or abbreviation denoting that property. For example, [DOC]Aug stands for [DOC] in August. Names of the PARAFAC-modeled FDOM components signify their Fmax as well.
3.1 Hydrological settings
The discharge rates to the PRE were estimated as 8.9×10³ m3 s−1 in May, 5.7×10³ m3 s−1 in August, 6.7×10³ m3 s−1 in November, and 5.0×10³ m3 s−1 in January based on the fact that the PRE receives 54 % of the total discharge from the Pearl River (Mikhailov et al., 2006). The discharge was 15 % lower in August than in November due to an atypically dry weather in summer. Higher-than-normal discharge rates occurred in November and January due to above-average precipitation.
Surface water temperature ranged from 25.6 to 28.5 ∘C (mean: 27.2 ∘C) in May, 28.2 to 31.0 ∘C (mean: 30.0 ∘C) in August, 23.6 to 26.3 ∘C (mean: 25.2 ∘C) in November, and 17.2 to 19.7 ∘C (mean: 18.8 ∘C) in January. Temperature decreased seaward in August, whereas a reverse trend was seen in the other sampling seasons. Bottom temperature was lower than surface temperature on average by 1.6 % (range: 0 %–11.9 %), 3.7 % (range: 3 %–14 %), and 0.9 % (range: 0.08 %–2.5 %) in May, August, and November, respectively, with the difference generally increasing seaward. In January, there was essentially no difference between the surface and bottom (mean: 0.5 %, range: 0 %–1.5 %). Mean water temperature, with surface and bottom combined, was higher on the west transect than on the east one in May (27.7 ∘C vs. 27.0 ∘C) and August (30.1 ∘C vs. 28.7 ∘C) but the opposite was observed in November (25.6 ∘C vs. 26.0 ∘C) and January (18.4 ∘C vs. 19.1 ∘C).
Surface water salinity ranged from 0.2 to 30.3 (mean: 9.7) in May, 0.2 to 20.6 (mean: 8.0) in August, 0.2 to 26.9 (mean: 8.3) in November, and 0.2 to 32.6 (mean: 17.0) in January (Fig. 3a). Surface salinity increased seaward, with a mean gradient much lower in the upper estuary (stations M01 to M05; 0.01–0.15 km−1) than in the lower estuary (downstream of station M05; 0.17–0.28 km−1). Mean bottom salinity in the upper estuary was higher than surface salinity by 52.6 % in May, 100.4 % in August, 129.2 % in November, and 23.1 % in January, while in the lower estuary it was higher by 23.0 %, 69.0 %, 63.1 %, and 3.9 %, respectively. Salinity, both at the surface and the bottom, was consistently lower on the west side than on the east side (Fig. 4a), in line with the observation that freshwater in the PRE tends to flow along the west side while coastal saline water intrudes landward along the east channel (Dong et al., 2004). The mean west–east difference follows a seasonal trend of January (14.7 vs. 26.3) > August (8.6 vs. 16.5) > November (10.2 vs. 16.4) > May (11.8 vs. 15.6).
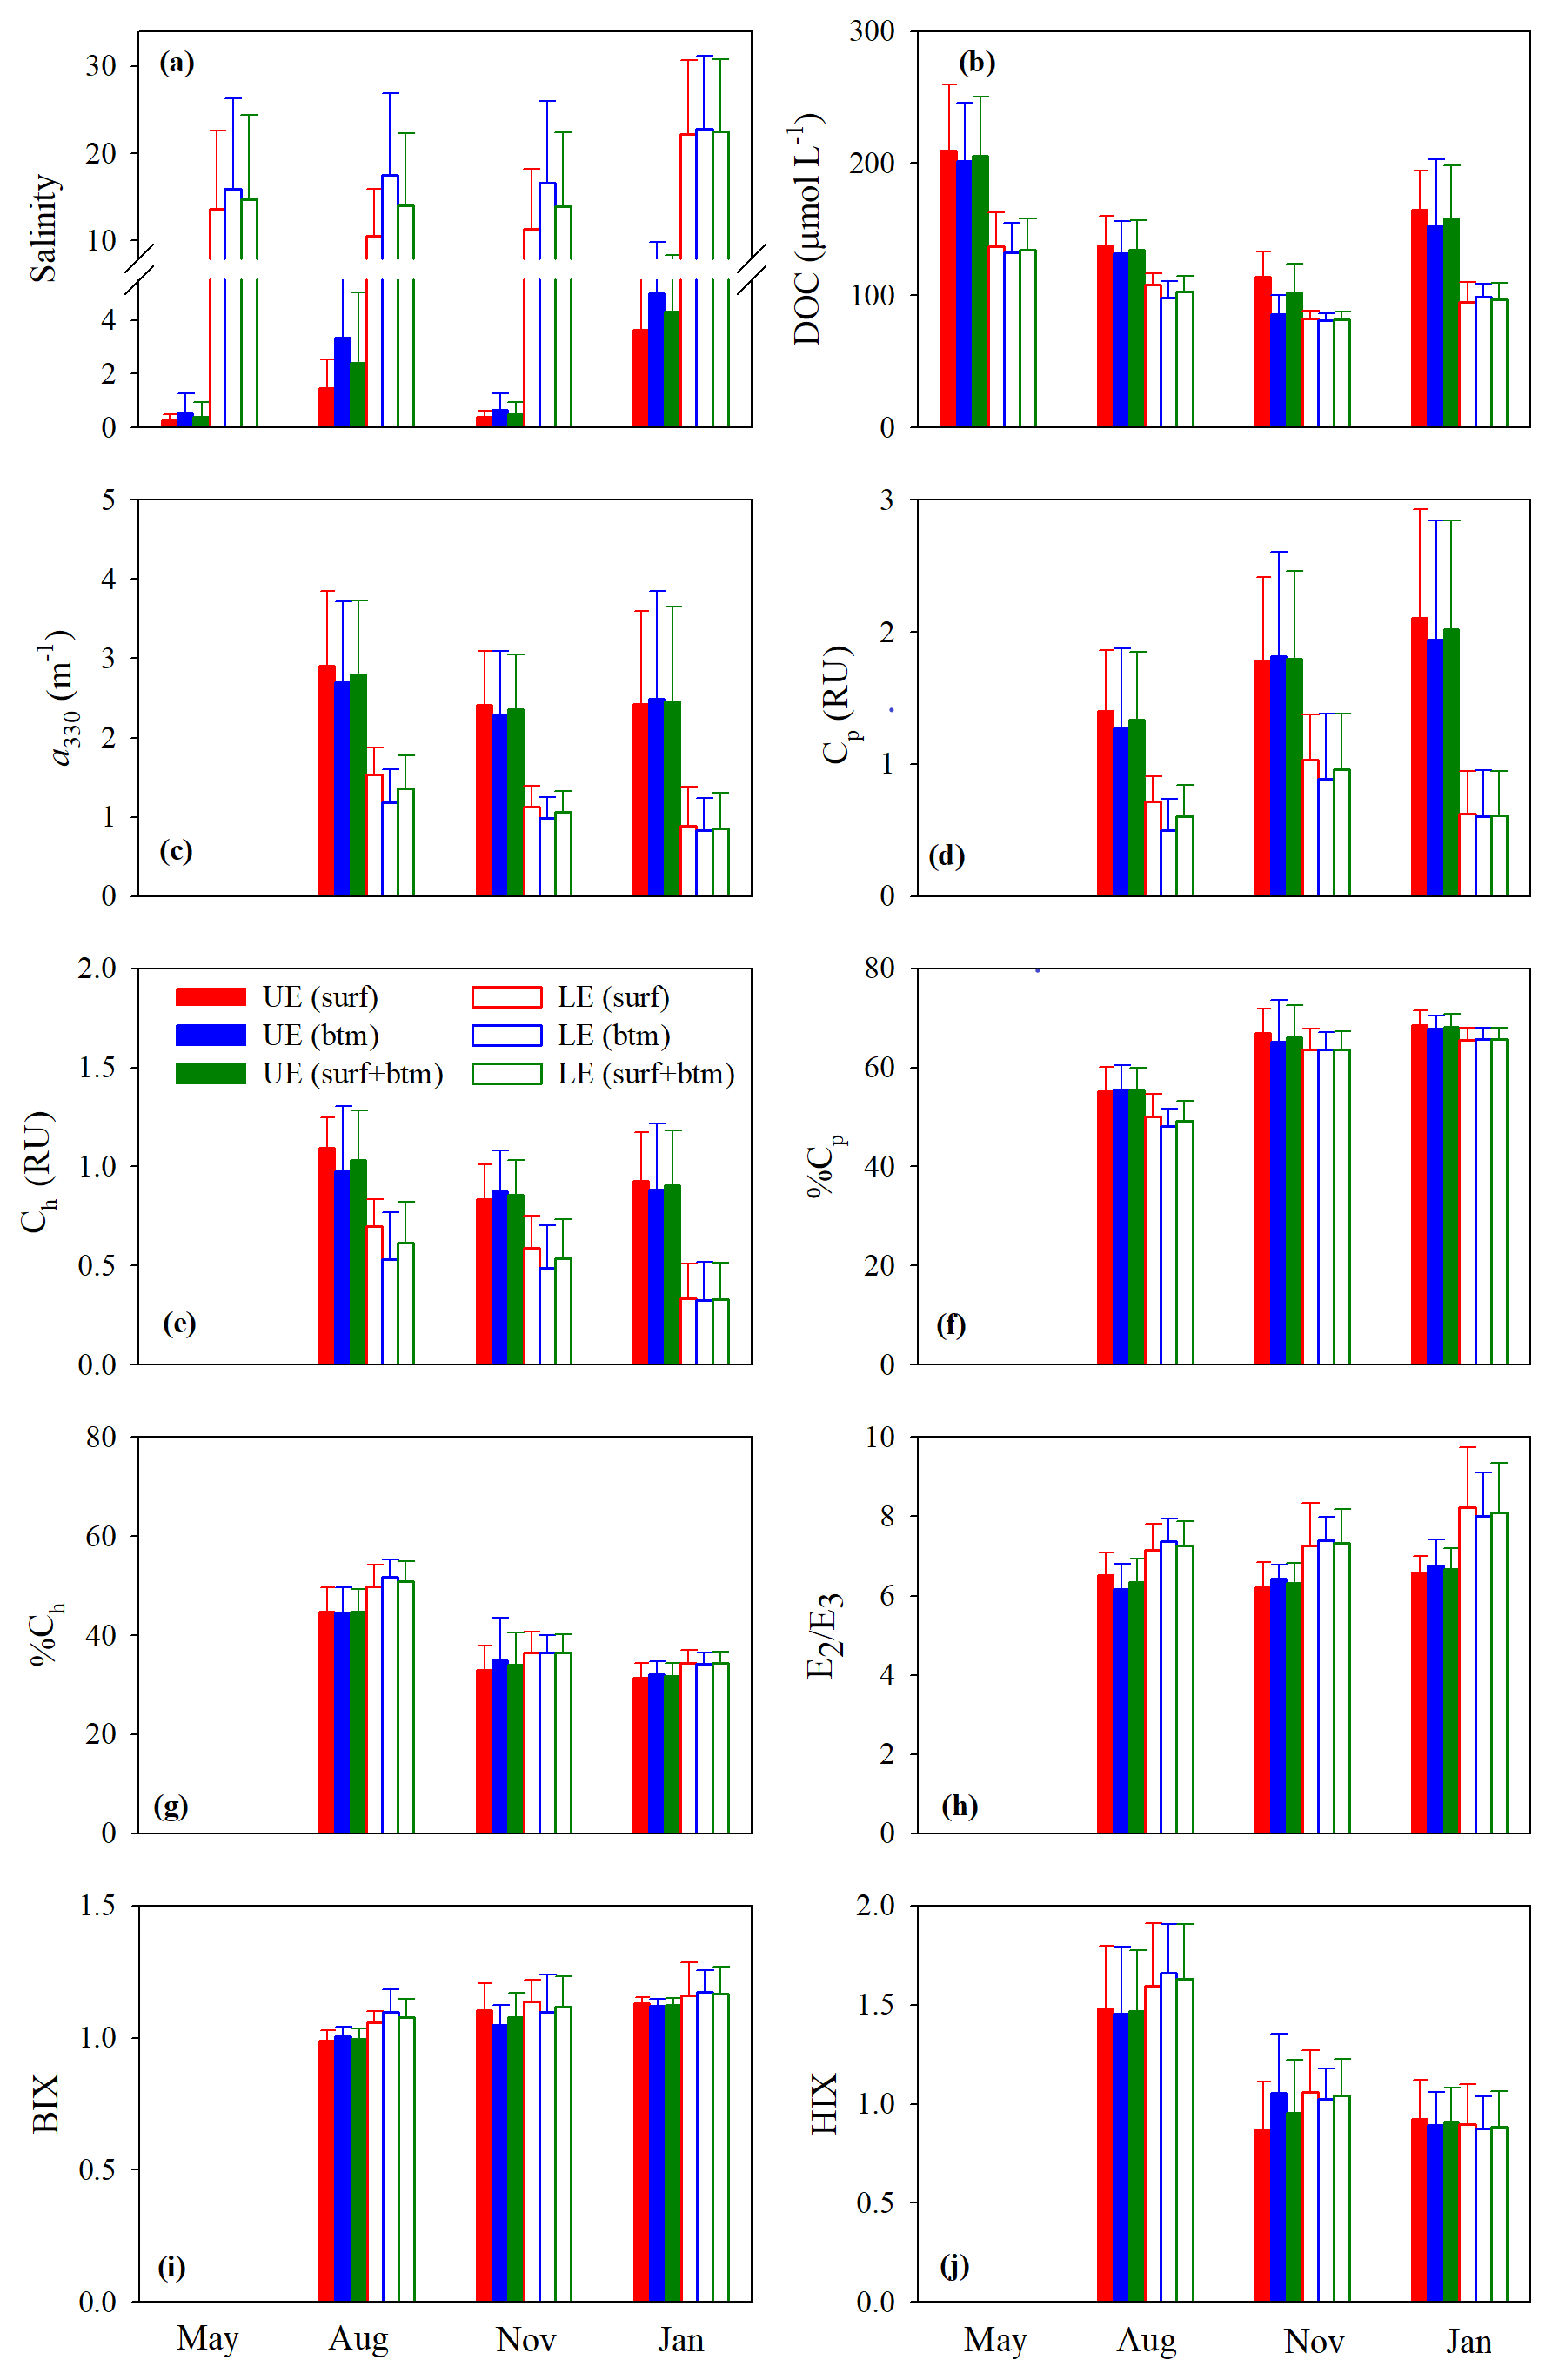
Figure 3Mean values of salinity (a), [DOC] (b), a330 (c), Cp (d), Ch (e), %Cp (f), %Ch (g), E2∕E3 (h), BIX (i), and HIX (j) in the upper (UE) and lower (LE) estuaries. UE and LE refer to areas upstream and downstream of station M05, respectively (Fig. 1). Surf and btm stand for surface and bottom respectively, and surf + btm denote surface combined with bottom. Error bars are 1 standard deviation.
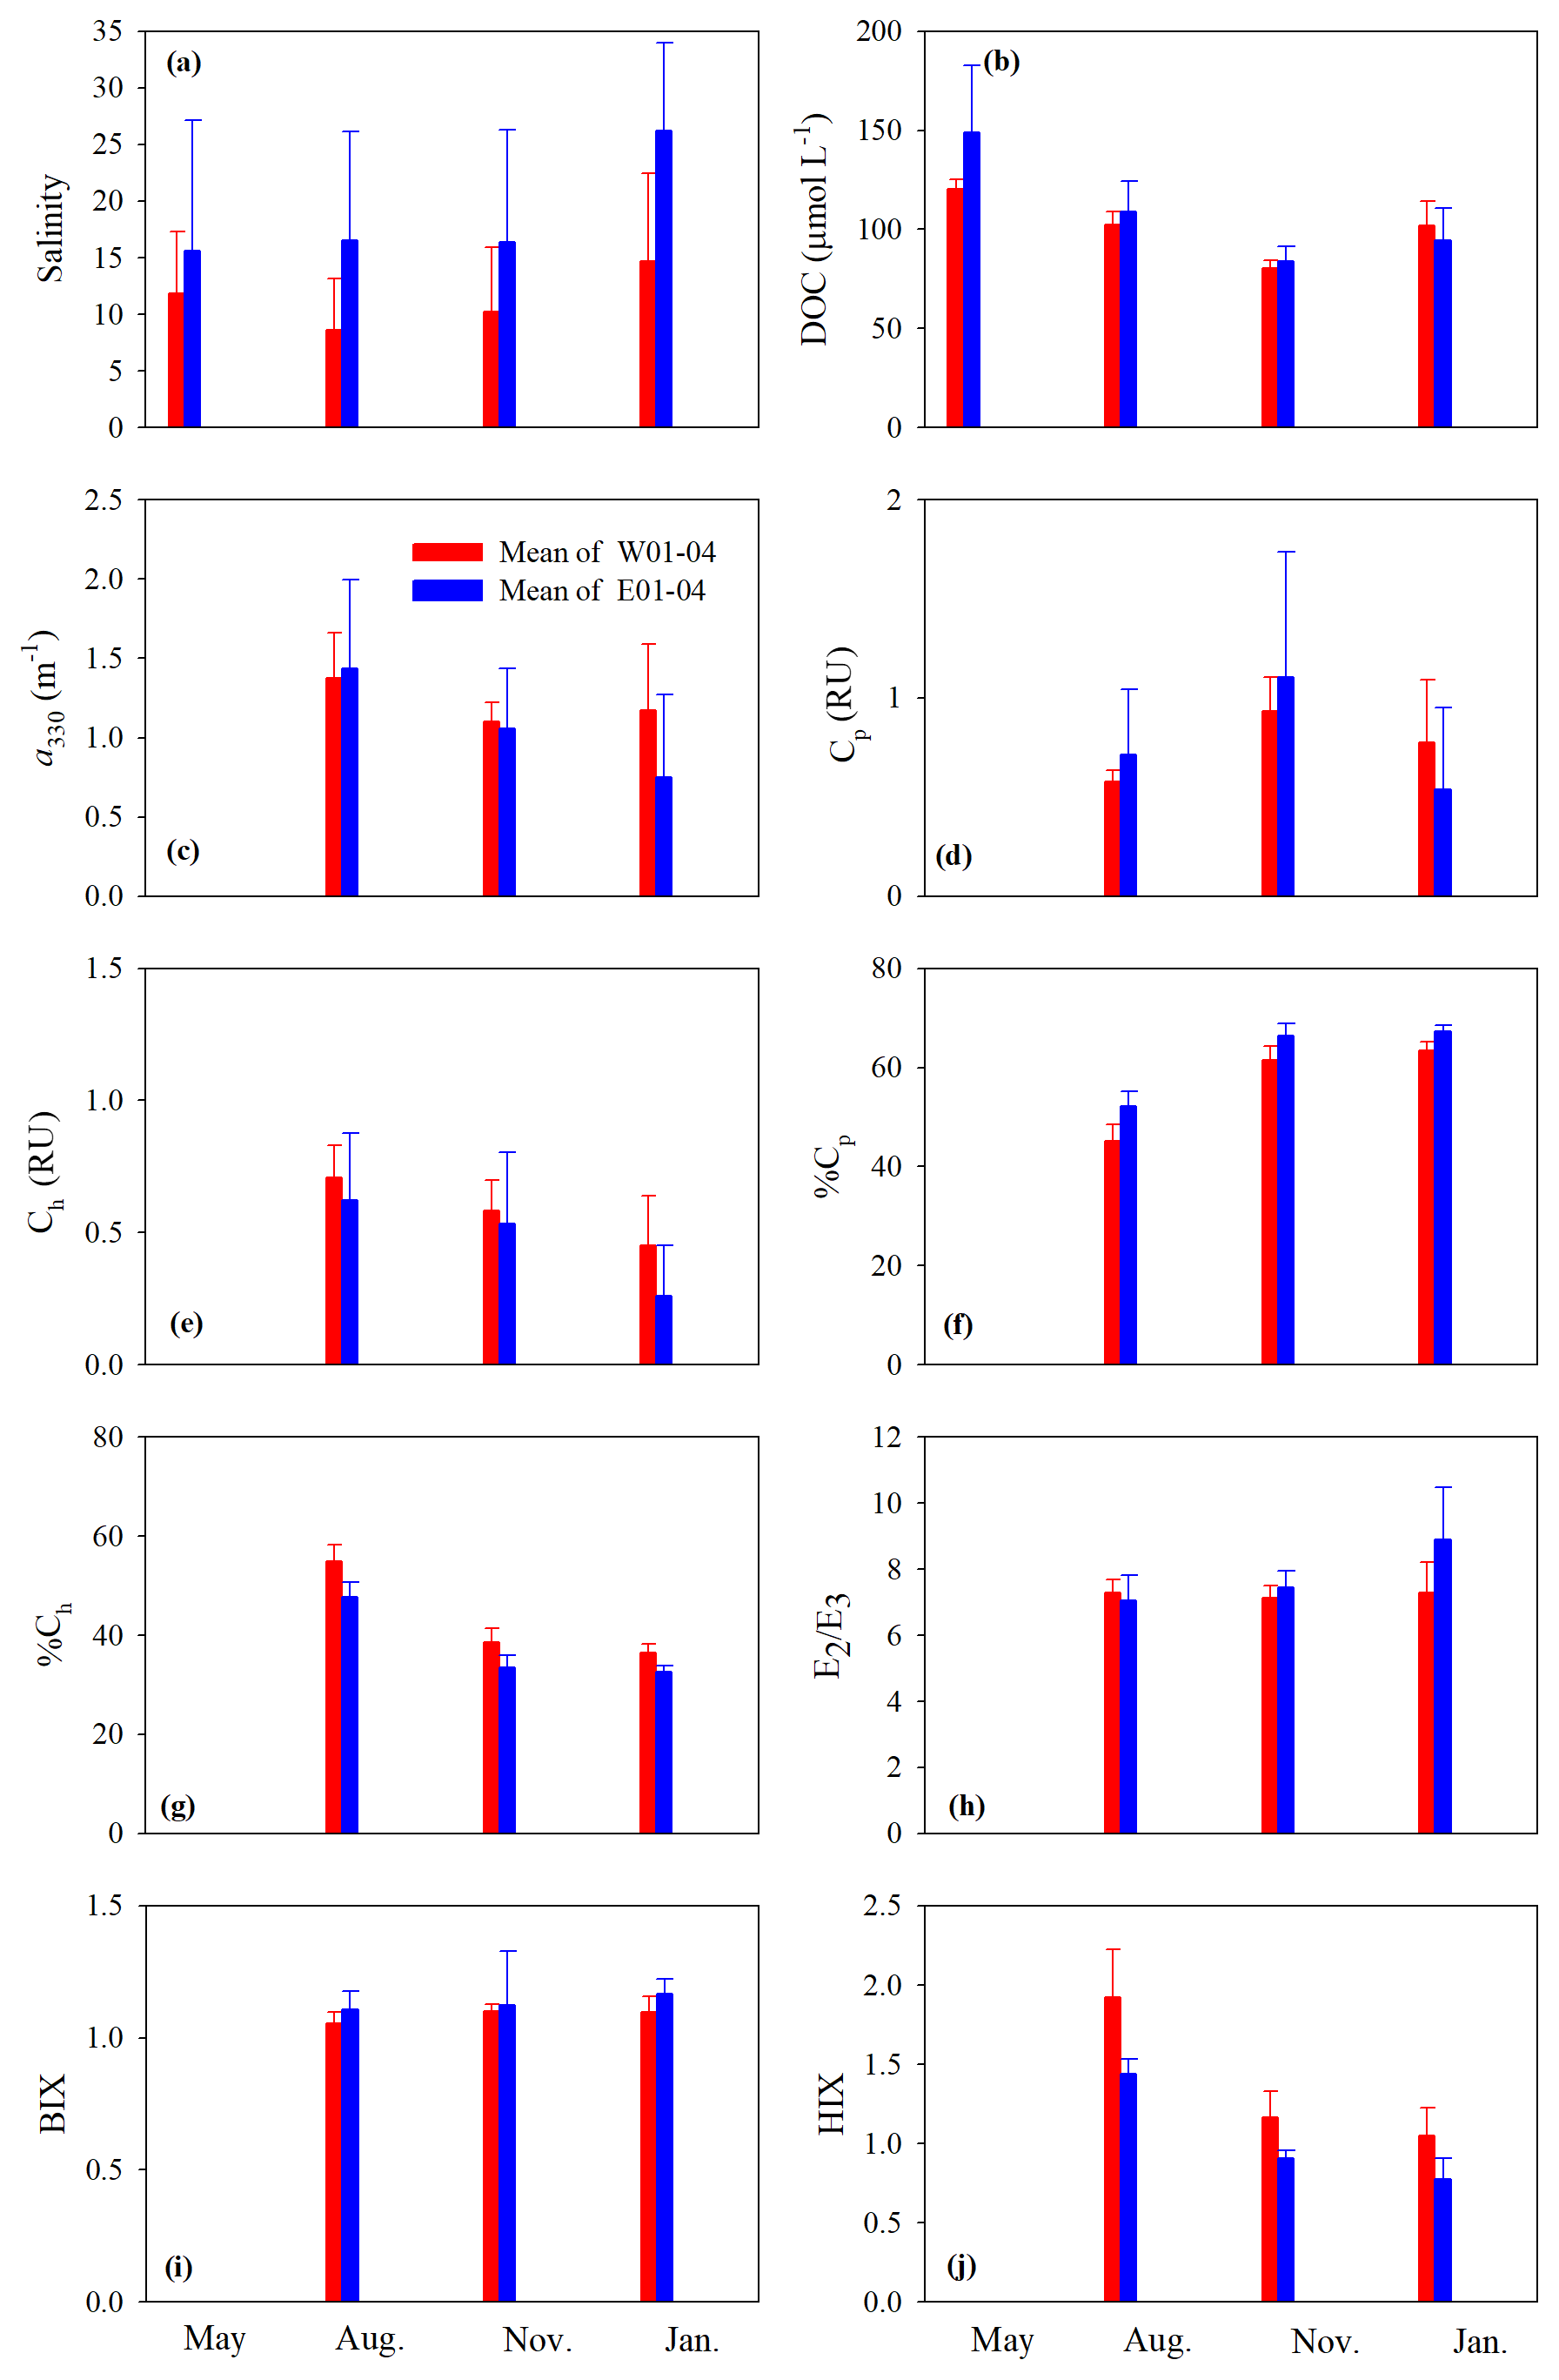
Figure 4Mean values of salinity (a), DOC (b), a330 (c), Cp (d), Ch (e), %Cp (f), %Ch (g), E2∕E3 (h), BIX (i), and HIX (j) on the west and east transects. Surf and btm stand for surface and bottom respectively, and surf+btm denote surface combined with bottom. Error bars are 1 standard deviation.
Based on the salinity distribution, the water column was stratified in the upper estuary during all four seasons and in the lower estuary in seasons other than winter when the water column was essentially well mixed. The stratification in the lower estuary was strongest in summer. Substantial cross-estuary salinity gradients persisted throughout the year.
3.2 Distribution of DOM
Figure 3b–j depicts the spatial (upper vs. lower estuary and surface vs. bottom) and seasonal distributions of the mean values of the measured DOM variables. The mean values of all quantitative variables ([DOC], a330, Cp, and Ch), with the surface and bottom data pooled together, were substantially higher in the upper estuary than in the lower estuary across all sampling seasons (Fig. 3b–e). The differences between the two areas were smaller for [DOC] (20 %–38 %) than those for a330 (51 %–65 %), Cp (47 %–70 %), and Ch (37 %–64 %). Neither the upper estuary nor the lower estuary and none of the sampling seasons exhibited significant surface–bottom differences in terms of the mean values of the quantitative variables, although the surface values at individual stations were often somewhat higher (1.2 %–26.5 %) than the bottom ones, particularly in seasons other than winter (Fig. 3b–e).
The estuary-wide mean [DOC], with surface and bottom combined, followed the seasonality of May (156±45 µmol L−1) > January (118±37 µmol L−1) > August (112±21 µmol L−1) > November (87±14 µmol L−1). The differences were significant among all seasons save for that between January and August. No significant seasonal variations were observed for the mean a330 (August: 1.76±0.88 m−1; November: 1.39±0.70 m−1; January: 1.33±1.02 m−1) and mean Cp (August: 0.81±0.46 RU; November: 1.16±0.60 RU; January: 1.00±0.81 RU). The mean Ch was significantly higher in August (0.73±0.29 RU) than in January (0.49±0.34 RU) but presented no significant differences between August and November (0.61±0.23 RU) and between November and January.
Compared with the quantitative variables, the qualitative metrics showed much smaller along-estuary (upper vs. lower estuary) differences that were statistically insignificant irrespective of seasons (Fig. 3f–i), except that E2∕E3 was marginally higher in the lower estuary than in the upper estuary (Fig. 3h). The mean values of the qualitative metrics for the surface were essentially identical to those for the bottom (Fig. 3f–j), excluding HIX for the upper estuary in November (Fig. 3j). HIX and %Ch were significantly higher in August than in November and January while %Cp displayed an opposite pattern; no significant seasonal variations were observed on all other occasions (Fig. 3f–j).
Cross-estuary differences in the quantitative variables were insignificant with the exception of [DOC] in May (24 % higher on the east transect) and a330, Cp, and Ch in January (56 %, 44 %, and 74 % higher on the west transect, respectively) (Fig. 4b–e). Among the qualitative metrics, HIX and %Ch were consistently higher on the west transect than on the east one, while BIX and %Cp manifested a reversed trend (Fig. 4f, g, i, j). Yet significant differences were only identified for HIX in all three seasons and E2∕E3 in January (Fig. 4h).
Across all sampling seasons and the entire estuary, %Cp was close to or >50 % (mean: 61.1 % ± 7.4 %), except the west transect in August (Fig. 4f). BIX was mostly >1 with a mean of 1.10±0.10, while HIX was <2.4 and averaged 1.13±0.32.
3.3 Relationships between DOM variables and salinity
Surface and bottom data for each variable in each season form a consistent property–salinity pattern (data not shown) and are thus treated as a single dataset. All quantitative variables displayed sharp decreases at salinity but remained rather constant ([DOC] in May and November) or declined linearly (all other cases) at higher salinities (Figs. 5 and 6). Hereafter, the upper part of the estuary showing fast changes of DOM properties is termed the head region, while the area downstream of it is referred to as the main estuary. The salinity demarcating these two regions was often ∼5 but could change to some extent with season and the DOM variable of interest (Figs. 5 and 6). Results of linear regressions for the main estuary are summarized in Table S3. At a 95 % confidence level, both the slopes and intercepts were statistically no different between August and January for [DOC] and a330 and between all three seasons for Ch, indicating that the multi-season data on each of these occasions can be combined into a single dataset. The slope for a330 in November was, however, ≥32 % lower than those in August and January. The slope for Cp presented significant seasonal variations, with the value in January being 23 % and 89 % higher than those in November and August, respectively.
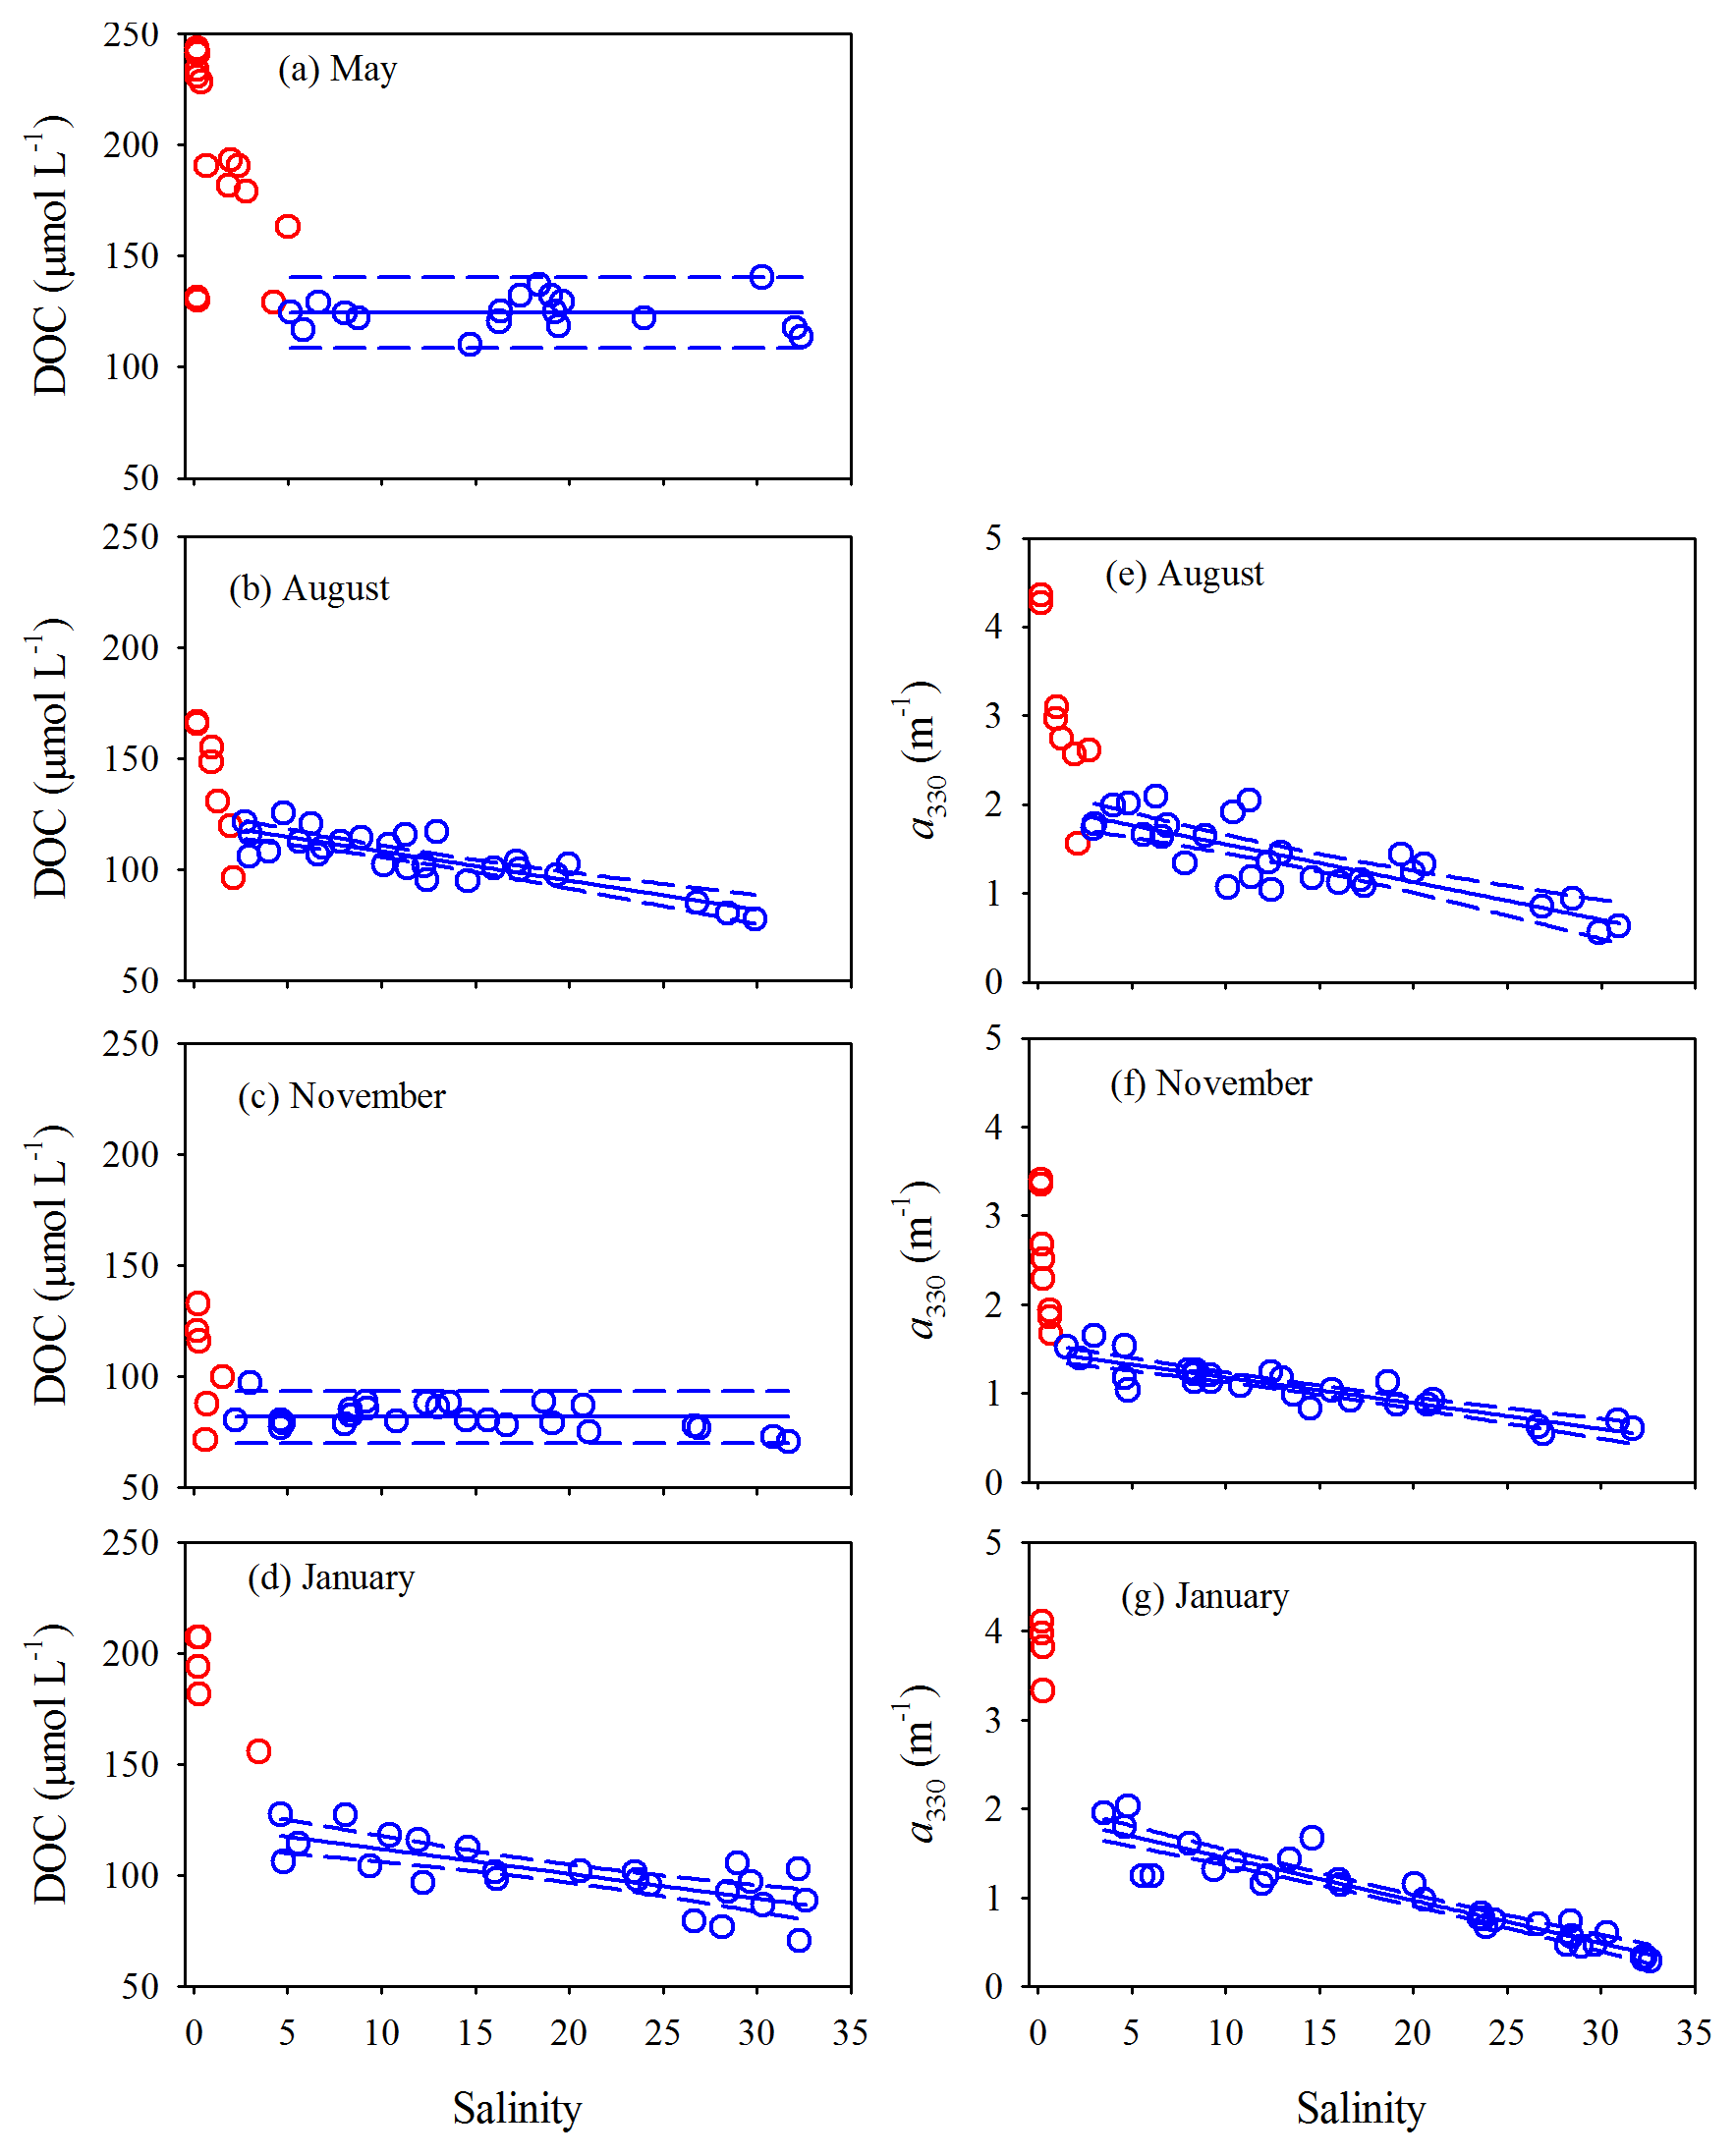
Figure 5DOC concentration and a330 versus salinity in the PRE. Red circles denote samples collected in the head region of the estuary where DOC and a330 showed rapid decreases or large variabilities with salinity. Blue circles denote the samples collected in the main estuary. Solid lines in panels a and c represent means of the blue circles. Solid lines in the other panels denote linear fits of the blue circles. Dashed lines signify the 95 % confidence intervals. See Table S3 for fitted equations and statistics.
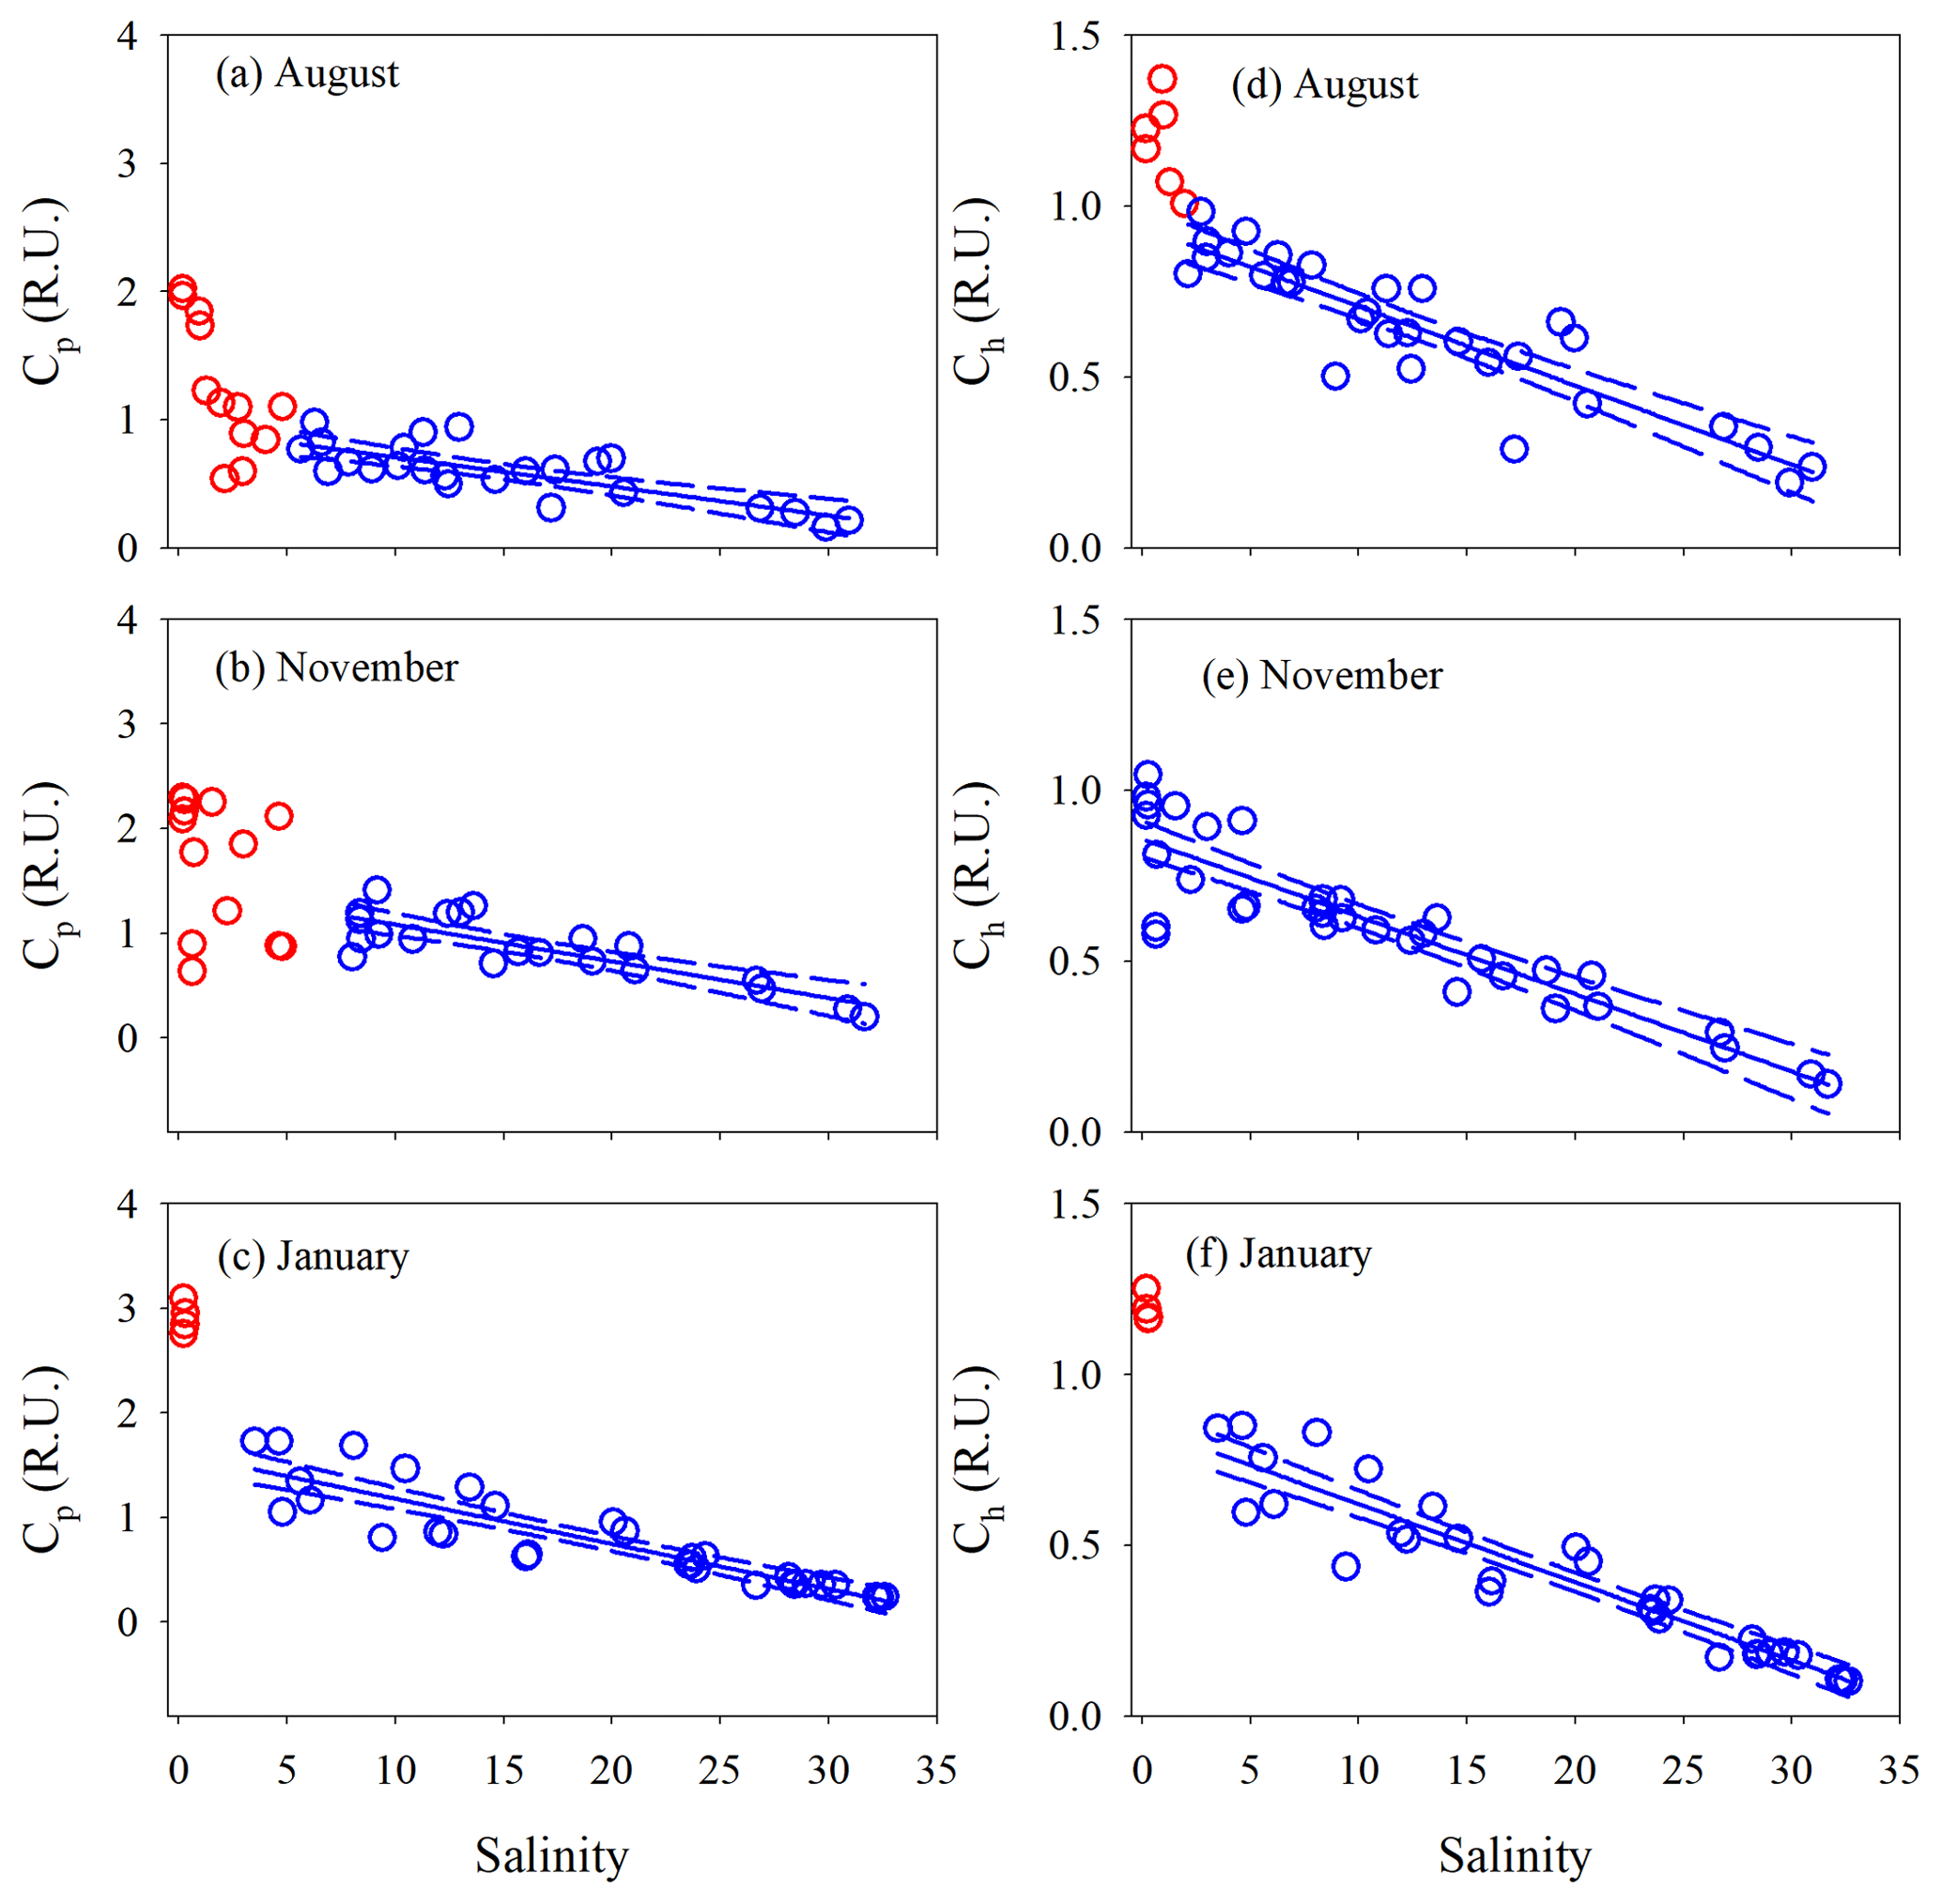
The percent decrease in each variable per unit increase in salinity across the main estuary was calculated using the known regression equations shown in Table S3. a330 decreased 2.1 and 2.7 times faster than [DOC] in August and January, respectively (Table S4). The proxy of FDOM abundance (〈FDOM〉), expressed by Cp and Ch, declined faster than 〈CDOM〉, with November showing the largest difference (25 %–35 %) followed by August (5 %–21 %) and January (<10 %) (Table S4).
E2∕E3 in August and November increased quickly (by ∼24 %) at salinity <1.3 and then slowly in the main estuary (Fig. 7a). In January, the surge of E2∕E3 at low salinities was less obvious. In the main estuary, all three seasons displayed similar E2∕E3 vs. salinity patterns, each of which roughly followed the respective theoretical mixing line defined by the maximum- and minimum-salinity E2∕E3 (Fig. 7a).
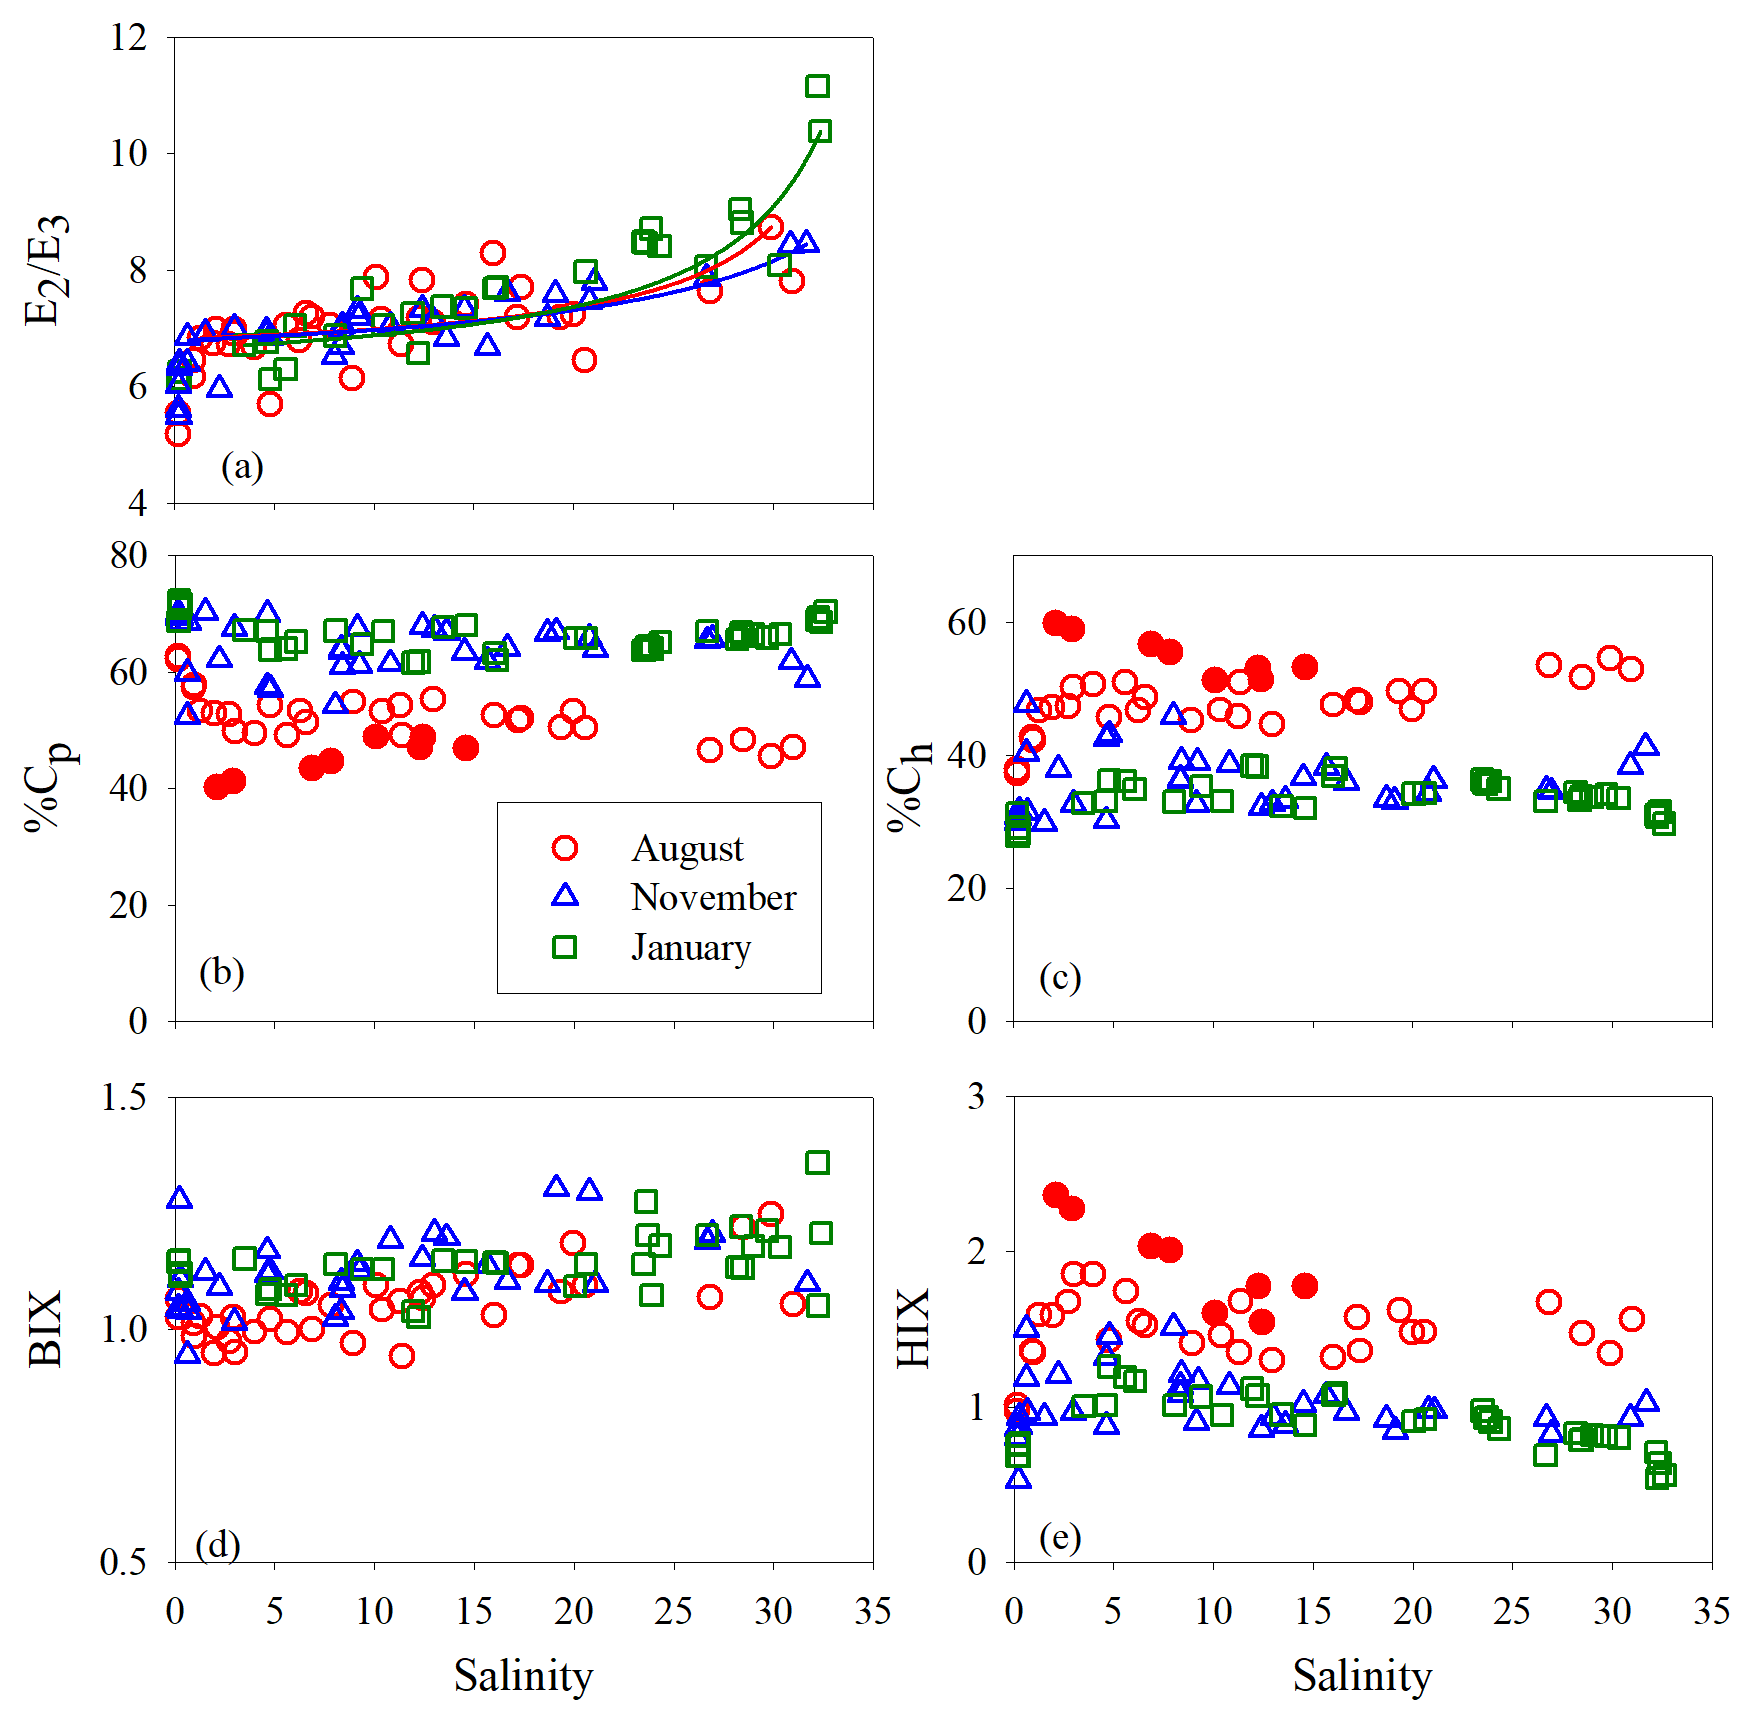
Figure 7E2∕E3 (a), %Cp (b), %Ch (c), BIX (d), and HIX (e) versus salinity for each cruise. Lines in panel a denote conservative mixing lines defined by the lowest- and highest-salinity points in the main estuary; red solid circles in panels (c) and (e) denote samples collected along the west transect (Fig. 1) in August.
Between salinity 0 and 1.27, % decreased by 14.2 % (Fig. 7b). At higher salinities, the west transect displayed an increasing %Cp with salinity but was constantly below the main and east transects which formed a coherent %Cp vs. salinity pattern featured by a small rebound from salinity 3 to 13 and a gradual decline at salinity >13. A sharp drop of 25.3 % occurred for % from salinity 0 to 0.63, which was followed by relatively constant values (mean: 64.0 % ± 4.0 %). A pan shape characterized the distribution of %, showing higher values at both the lowest and highest salinities and slightly lower values across a wide range of salinities in between (Fig. 7b). The distributions of %Ch mirrored those of %Cp (Fig. 7c).
The HIX vs. salinity patterns (Fig. 7e) approximately corresponded to those of %Ch, leading to a strong linear correlation between the two variables (r=0.94) (Fig. S1a in the Supplement). BIX displayed a distribution roughly inverse to that of HIX (Fig. 7d), as can be inferred from their definitions (Sect. 2.3). The correlation between BIX and %Cp (r=0.40) (Fig. S1b) was weaker compared with that between HIX and %Ch. Compared to the quantitative variables, a common feature for all qualitative metrics in the main estuary was their relatively small variations over the rather large salinity ranges encountered (Fig. 7).
3.4 Relationships between [DOC] and 〈CDOM〉 and 〈FDOM〉
[DOC] was linearly related to a330 for all three sampling seasons; the coefficient of determination was, however, lower in November (Fig. 8a, Table S5). The fitted slope was in descending order of January (32.0±2.0 m µmol L−1) > August (22.5±1.4 m µmol L−1) > November (18.8±2.2 m µmol L−1). Similarly, [DOC] showed a strong linear relationship with Cp in August and January and a relatively weaker one in November (Fig. 8b, Table S5). The fitted slopes in August and January were comparable but ∼2.8 times that in November (Table S5). [DOC] was also significantly related to Ch (Fig. 8c) but the coefficients of determination were considerably lower than those with Cp (Table S5).
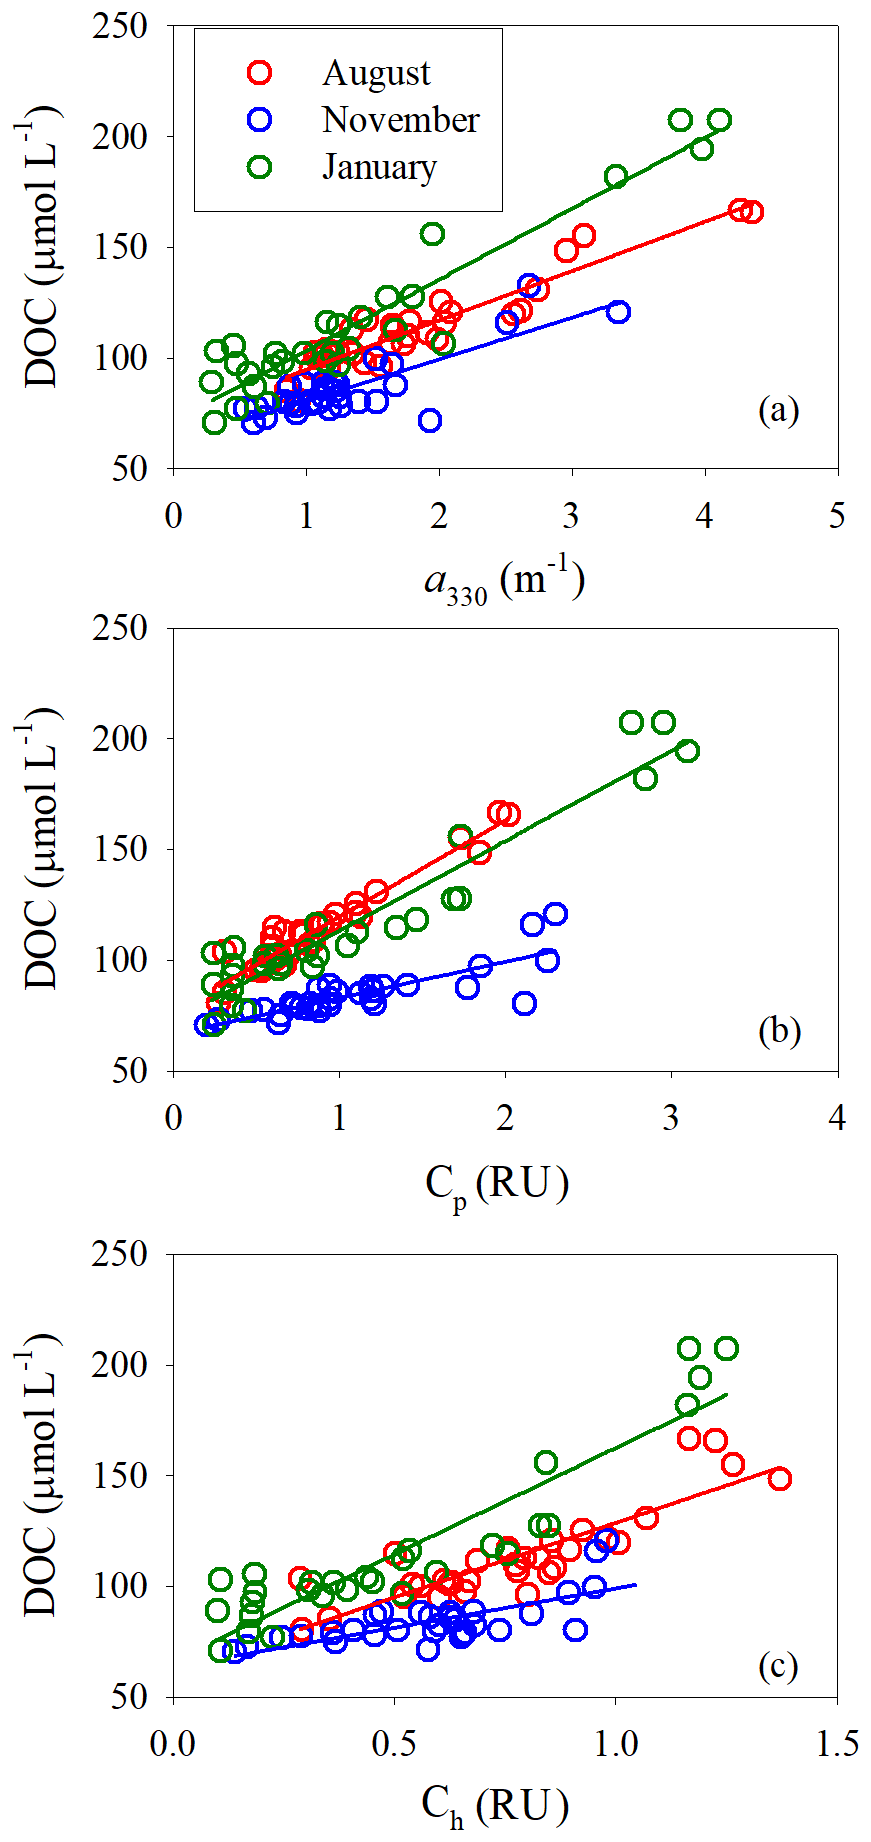
Figure 8DOC concentration versus a330 (a), Cp (b), Ch (c). Solid lines denote linear fits of data for each cruise. See Table S5 for fitted equations and statistics.
4.1 Sources of freshwater DOM endmembers
The present study confirms the large variations in the abundance of DOM in the head region of the PRE observed by previous studies (Callahan et al., 2004; Chen et al., 2004; Lin, 2007; He, 2010; Wang et al., 2014; Lei et al., 2018; Ye et al., 2018). This phenomenon is commonly ascribed to the presence of multiple freshwater endmembers delivered by various water channels and outlets of the Pearl River system (Cai et al., 2004; Callahan et al., 2004; He et al., 2010). Notably, the Humen channel takes most of the sewage discharge from Guangdong Province (Pang and Li, 2001), which carries the highest DOM load, while the other waterways on the west coast, less influenced by urbanization and industrialization, bear lower levels of DOM (Callahan et al., 2004; Ni et al., 2008). Although the existence of multiple “quantitative” endmembers in the PRE has been well recognized, it remains poorly understood if these endmembers differ qualitatively. Data published by Callahan et al. (2004) show that [DOC]-normalized fluorescences of the freshwater endmembers in Jiaomen, Hongqimen, and Hengmen differed little (coefficient of variation = 4 %) while the Humen endmember was 17 % higher than the mean of the other three endmembers in November 2002. Besides, fluorescence EEMs collected upstream of Humen reveal tryptophan-like fluorophores to be the dominant FDOM fraction in the Humen endmember which was considered to originate from sewage effluents (Hong et al., 2005). The present study has analyzed by far the largest number of qualitative metrics and thus offers a more robust means to assess the nature of the freshwater endmembers. In November, near-zero-salinity (<0.7) water was accessible down to station M05 off Hongqimen (Fig. 1), making this season suitable for comparing the endmembers from the different water outlets. at near-zero salinities fell in a rather small range from 5.5 to 6.8 that corresponded to a MW range from 0.83 to 1.18 kDa estimated from the MW vs. E2∕E3 relationship established by Lou and Xie (2006). The higher MW values were observed in the Humen channel, while the lower ones were observed in water from Jiaomen and Hongqimen, both being close to the borderline separating the high- and low-MW CDOM (i.e., 1 kDa). % varied from 70 % at station M01 in the Humen channel to 56 % off Hongqimen, consistent with a stronger anthropogenic DOC signature in the Humen channel (He et al., 2010). Yet % values for all endmembers were >50 %, demonstrating that protein-like components dominated all freshwater FDOM endmembers. BIXNov was higher (1.28 vs. 1.00) while HIXNov was lower (0.53 vs. 1.34) at station M01 than at station M05; all BIXNov and HIXNov were, however, well above 0.8 and below 5, respectively, implying the dominance of fresh, microbial-derived FDOM in all freshwater endmembers (Sect. 2.3). Taking into account all these qualitative metrics and the linear relationships between [DOC] and 〈FDOM〉 (Sect. 3.4), we can conclude that all three freshwater DOM endmembers in November mainly comprised fresh, low-MW (∼1 kDa) organic material of microbial origin, with the microbial signature in the Humen endmember somewhat stronger. The sewage influence could be depressed due to a rapid bacterial mineralization of the sewage-derived DOM between the point sources of pollution in the Guangzhou area and the sampling stations downstream (He et al., 2010). Note that the three endmembers also bore a perceptible terrigenous character, since the humic-like Ch, albeit generally lower in abundance than the protein-like Cp, was still a significant fraction of the total FDOM pool (Fig. 6). The values of the qualitative metrics at station M01 in August and January (E2∕E3: 5.18–6.13; %Cp: 62.2 %–72.2 %; %Ch: 27.8 %–37.8 %; BIX: 1.03–1.15; HIX: 0.68–1.01) were comparable to those in November, indicating that the Humen DOM endmembers in summer and winter were also of microbial origin.
Based on an estimate of the relative contributions of land-, sewage-, and phytoplankton-derived DOC, He (2010) and He et al. (2010) proposed that the land component is the dominant source of the total DOC pool in the lower reach of the Humen channel. In this estimation, the authors assigned the “natural background” [DOC] in the three major tributaries of the Pearl River (range: 114–125 µmol L−1; mean: 119 µmol L−1) as “land-derived”. Our result suggests that, apart from terrigenous DOC leached from soil, this “land-derived” DOC contains an ample amount of river-born DOC of microbial origin. This argument is supported by the poorly forested watershed of the Pearl River (Luo et al., 2002) and the low molar carbon-to-nitrogen (C∕N) ratios of suspended particulate organic matter (7.2–9.3) (Ni et al., 2008) and DOM (range: 1.8–12; mean ± SD: 4.6 ± 2.5; median: 3.6) (Supplement in Ye et al., 2018) in fresh or low-salinity (<5) waters of the PRE.
4.2 Estuarine mixing and transformation of DOM
Sharp decreases in [DOC], 〈CDOM〉, and 〈FDOM〉 in the head region of the PRE have been previously observed and postulated as a result of adsorption, flocculation, biodegradation, and/or incomplete mixing of multiple freshwater endmembers (Callahan et al., 2004; Chen et al., 2004; Lin, 2007; He et al., 2010; Ye et al., 2018). The present study confirmed the earlier observations and provided additional qualitative metrics that are instrumental for constraining the principal processes causing this quick drawdown of DOM abundance. The increases in %Ch and HIX and decreases in %Cp and BIX in the head region suggest a bacterial preferential uptake of protein-rich materials and hence a key role of biodegradation in controlling the loss of DOM. Our result corroborates the finding of He et al. (2010) showing higher fractions of biodegradable DOC and higher DOC bio-uptake rates in the head region than in the main estuary. The more scattering of the qualitative metrics data in November (Fig. 6) likely reflects an incomplete mixing of the multiple freshwater endmembers stated earlier. This partial-mixing effect may overshadow the biodegradation signal. Notably, the presence of large amounts of highly biolabile, sewage-derived DOM in the upper reach of the PRE could potentially enhance the biodegradation of the less reactive terrigenous DOM through a positive priming effect (Bianchi, 2011). However, the [DOC] values after the rapid removal of the labile fraction within the head region (110–130 µmol L−1, Fig. 3), except in November, were in the same range as that of the background [DOC] in the Pearl River upstream of the Pearl River Delta (114–137 µmol L−1, Shi et al., 2016). This fact, alongside the enriched humic character of the residual DOM, implies a negligible priming effect. In November, the possibility of a positive priming effect could not be excluded, given that the [DOC] exiting the head region (82 µmol L−1) was substantially lower than the riverine background concentrations.
In the main estuary, the linear decreases in [DOC] (see exceptions below), 〈CDOM〉, and 〈FDOM〉 with salinity point to the absence of net removal and input of these constituents and physical dilution being the principal mechanism dictating their estuarine mixing behaviors. The two extreme cases of near-constant [DOC] vs. salinity in May and November indicate that the loss of DOC in the head region reduced its content to the level comparable to the marine endmember and again that the removal of DOC in the main estuary, if any, was roughly balanced by the input. Potentially important DOM loss processes in the PRE are bacterial (He et al., 2010) and photochemical (Callahan et al., 2004) degradation. The significance of these processes relies on both their rates and the residence time of freshwater in the PRE. Using the volume of the estuary (9.6×10⁹ m3) and the freshwater discharge rate for each sampling season (Sect. 3.1), we estimated the residence time of freshwater in the top 1 m layer to be 3.1 d in May, 4.9 d in August, 4.1 d in November, and 5.6 d in January. The value for May is essentially identical to that previously reported for the wet season (Yin et al., 2000). Here the volume of the estuary was obtained from the published average depth (4.8 m) and total area (2×10⁹ m2) of the estuary (Sect. 2.1). The bacterial uptake rate of DOC in surface water of the main estuary has been reported to be 0.04 µmol L−1 h−1 in spring and 0.07 µmol L−1 h−1 in summer (He, 2010; He et al., 2010), giving a consumption of 3.0 and 8.2 µmol L−1, respectively, when multiplied by the corresponding residence time for May and August. Our unpublished data suggest that photodegradation in August could at most reduce [DOC] by 0.76 µmol L−1 and a330 by 0.11 m−1, after considering the attenuation of solar radiation and the competition for light absorption by particles in the water column (Wang et al., 2014). The combined photochemical and bacterial DOC degradation in summer was thus ∼9 µmol L−1, ∼8 % of the initial [DOC] in the main estuary. The parallel photobleaching loss of a330 was 7 %. Such small losses could be readily compensated for by DOM input from in situ primary production, sediment resuspension, and/or freshwater discharge farther downstream. Notably, chlorophyll a concentration maxima of up to 11.0 µg L−1 and turbidity maxima of up to 154 mg L−1 were spotted in the mid-estuary and lower estuary during our cruises (Li et al., 2017). Nonetheless, there existed no covariations of [DOC], 〈CDOM〉, and 〈FDOM〉 with chlorophyll a or suspended particulate matter (SPM) (data not shown). This observation, in conjunction with the linear DOM abundance vs. salinity relations, demonstrates that autochthonous production was unlikely a major source of DOM and that adsorption and flocculation were not a major sink of DOM in the main estuary. The short residence time of freshwater likely minimized the influences of these processes.
To reinforce the argument that the dynamics of DOM in the main estuary of the PRE was dominated by physical mixing, a principal component analysis (PCA) of the all-cruises dataset was performed in R 3.5.2 using the prcomp() function. The dataset includes variables in addition to salinity, such as water temperature, nutrients (nitrate, nitrite, silicate), chlorophyll a, SPM, and freshwater discharge rate. Variables used in the PCA were zero centered and scaled to the unit variance. The first two axes of the PCA explained ∼74 % of the variability in the dataset (Fig. 9). DOC and a330, along with nitrate and silicate, were strongly negatively related to salinity, a typical indication of a conservative mixing behavior. In contrast, DOC and a330 were not or only weakly linked to chlorophyll a, SPM, water temperature, and the freshwater discharge rate.
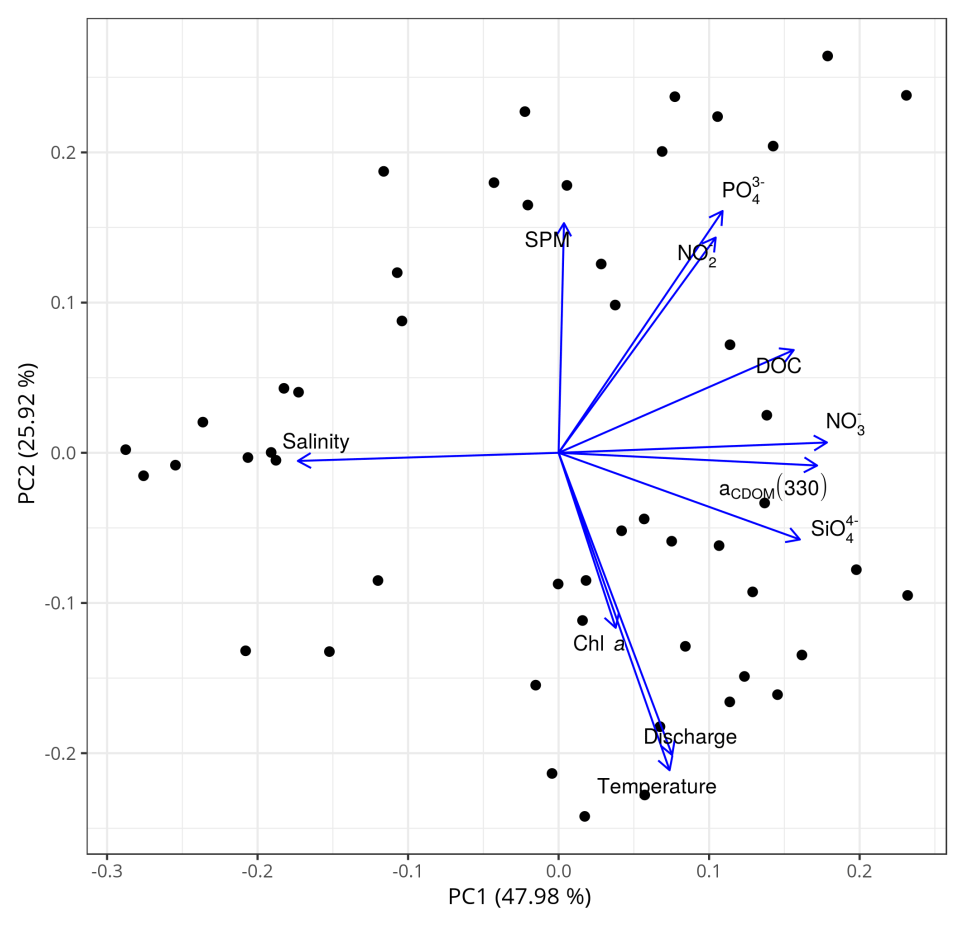
Figure 9Principal component analysis (PCA) based on the all-cruises dataset for the main estuary. SPM: suspended particulate matter; : phosphate; : nitrite; DOC: dissolved organic carbon; aCDOM(330): CDOM absorption coefficient at 330 nm; : nitrate; chl a: chlorophyll a; : silicate; discharge: freshwater discharge rate. The data of SPM, chl a, and nutrients were provided by Li et al. (2017).
The completely different behaviors of [DOC] and 〈CDOM〉 with respect to salinity in the main estuary in November (Fig. 3c, f) led to a decoupling of the two variables. This phenomenon has also been observed for summer by Chen et al. (2004). In fact, the decoupling of [DOC] and 〈CDOM〉 is an extreme case of the higher salinity-based 〈CDOM〉 gradient relative to that of [DOC] seen in August and January (Sect. 3.4). The difference in estuarine mixing behavior between [DOC] and 〈CDOM〉 arose mainly from two factors. First, the main component of the freshwater DOM endmember was non-colored or weakly colored, as implied by its abundant fresh microbial constituents. Second, the difference in 〈CDOM〉 between the freshwater and marine endmembers was substantially larger than that in [DOC].
4.3 Depressed seasonal and spatial variations
The overall small variations of the qualitative metrics across the main estuary (Sect. 3.3) suggest that the quality of DOM remained generally stable during estuarine mixing, consistent with the marginal photochemical and microbial breakdown of DOM elaborated above. As %Cp was mostly >50 %, BIX > 1, and HIX < 2.4 (Sect. 3.2), fresh, protein-enriched DOM of microbial origin dominated the DOM pool in the main estuary (Sect. 2.3), irrespective of seasons, locations, and depths. The dominance of protein-like over humic-like FDOM is in line with the low C∕N ratios of DOM (range: 1.0–15; mean ± SD: 4.5 ± 2.9; median: 3.4) across the entire PRE in all seasons (Supplement in Ye et al., 2018). The higher %Ch and HIX in August than in November and January (Fig. 7c, e) point to FDOM in summer containing a larger fraction of humic-like fluorophores. The divergence in August of the west transect from the main and east transects with respect to the distributions of the FDOM metrics vs. salinity (Fig. 7c, e) suggests a different freshwater mass on the west shoal that is somewhat enriched with humic-like FDOM and possibly originating from Hengmen (Fig. 1). Nonetheless, the relatively higher humic-like fractions in August, particularly on the west transect, do not change the dominant signature of fresh, microbial-derived DOM in this season.
The PRE is largely homogeneous not only from the perspective of its dominant DOM source but also in terms of the vertical distribution of the quantitative variables. The bottom–surface differences for the quantitative variables are on average insignificant, particularly true for [DOC] even in the presence of strong vertical stratification, such as in August (Sect. 3.2). This depressed vertical heterogeneity could be attributed to the reduced differences between the low-salinity and marine endmembers as elaborated above.
4.4 Indicators of aCDOM and [DOC] in the main estuary
Salinity is a useful proxy of aCDOM in light of their linear relationships in the main estuary for all three sampling seasons (Fig. 3). Furthermore, a common equation (, p<0.0001) can serve as a predictive tool of a330 in August and January, given essentially the same statistics for each of these two months (Table S3). For [DOC], salinity can be used as an indicator in August and January but not in May and November (Fig. 3). Similar to the aCDOM–salinity case, the August and January [DOC] data can be combined to formulate a single [DOC]–aCDOM relationship (; p<0.0001). Hence, [DOC] in summer and winter can in principle be retrieved from remote sensing-based aCDOM data (Siegel et al., 2002; Johannessen et al., 2003; Mannino et al., 2008). Cp is also a good indicator of [DOC] in August and January (Fig. 8).
Caution should be exercised when applying the [DOC] and aCDOM predictive tools established here, since interannual variability and other factors may limit their applicability on broader time and space scales. For example, Hong et al. (2005) arrived at an aCDOM–salinity relationship of for November 2002, which is different from ours in the main estuary (). The data reported by Ye et al. (2018) show a significant removal of DOC in May 2014 between salinity 5 and 22. Concurrent measurements of [DOC] and aCDOM in the PRE are rare but Chen et al. (2004) reported no significant correlation between the two variables in July 1999.
4.5 Fluxes of DOC and CDOM
The fluxes of DOC and CDOM exported from the PRE to the South China Sea were estimated as follows (Cai et al., 2004; Lin, 2007; He et al., 2010):
where F denotes the flux of DOC or CDOM, Q denotes the freshwater discharge rate, and C∗ denotes the effective [DOC] ([DOC]∗) or a330 (). C∗ is the y-axis intercept of the regression line of [DOC] or a330 vs. salinity in the main estuary (Table S3). For May and November when [DOC] remained roughly constant across the main estuary, C∗ signifies the average [DOC] over this region. Monthly fluxes were computed using freshwater discharge rates for the sampling year and those averaged over 2006–2016 (http://www.mwr.gov.cn/sj/#tjgb, last access: 7 July 2019), under the assumption that the [DOC] or a330 obtained for May, August, November, and January represents the entire spring (March, April, May), summer (June, July, August), autumn (September, October, November), and winter (December, January, February), respectively. As no CDOM data were collected in May, the for spring (1.99±0.19 m−1) was derived from the mean of the [DOC]∗-normalized in January (1.31 L mg−1 m−1) and August (1.36 L mg−1 m−1) multiplied by the [DOC]∗ in May (124.5 µmol L−1). This treatment, with unknown uncertainties, was based on the relatively small variations of the [DOC]∗-normalized among the three CDOM sampling seasons (range: 1.31–1.50 L mg−1 m−1).
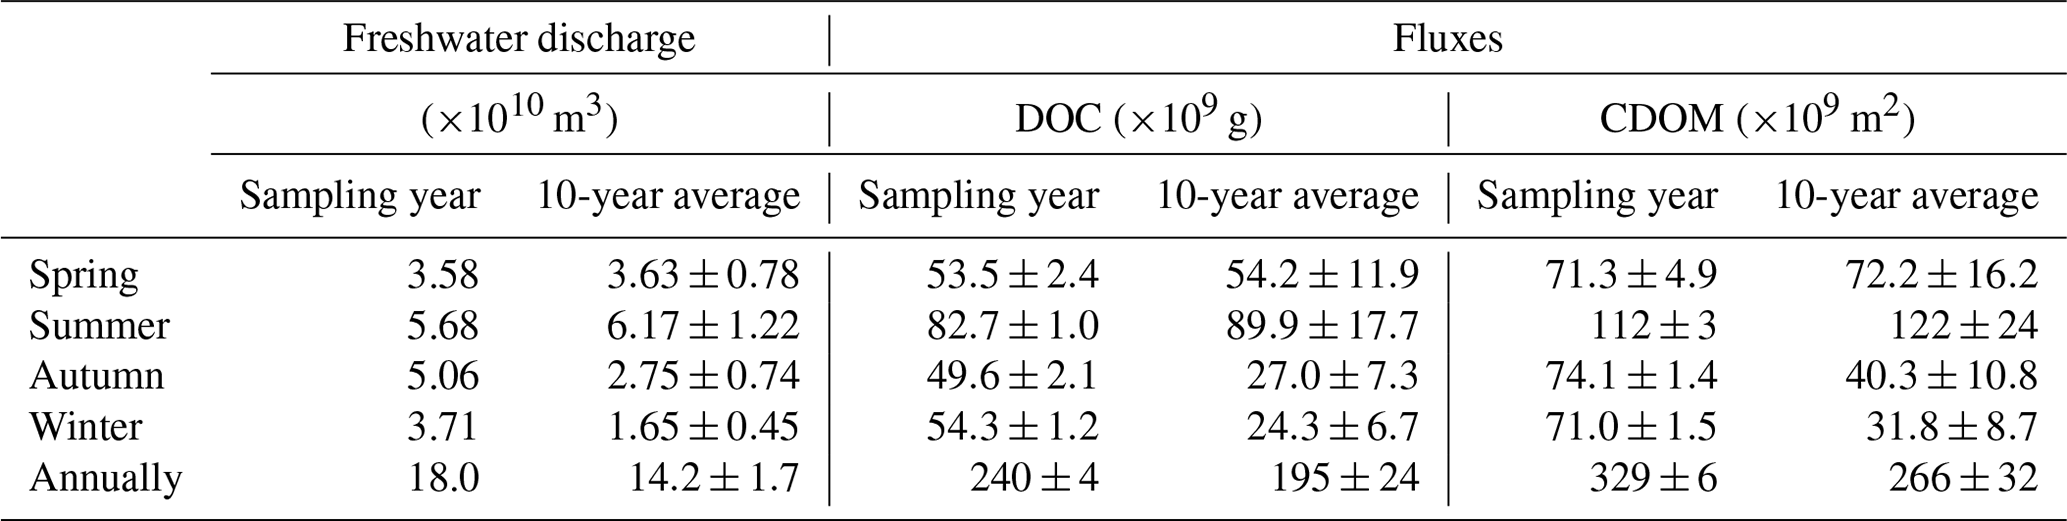
Flux estimates for the sampling year are comparable to those for the 10-year period for spring and summer, whereas the former is approximately twice the latter for autumn and winter due to above-average freshwater discharge rates during the low-flow season of the sampling year (Table 1). Aggregation of the fluxes for all four individual seasons arrives at an annual export of 240×109 g C (sampling year) or 195×109 g C (10-year period) for DOC and of 329×109 m2 (sampling year) or 266×109 m2 (10-year period) for CDOM in terms of a330. As the PRE receives ∼54 % of the total Pearl River freshwater discharge to the South China Sea (Mikhailov et al., 2006), including the remaining 46 %, gives a grand annual export of 362×109 g C of DOC and 493×109 m2 CDOM, respectively, assuming that the fluxes from the PRE are applicable to the entire Pearl River Delta.
Table 1Estimates for DOC and CDOM (a330-based) export from the Pearl River to the South China Sea based on monthly freshwater discharge rates for the sampling year and those averaged over a 10-year period from 2006 to 2016. Standard errors of the fluxes for the sampling year were derived from the standard errors of the effective [DOC] and a330 (Table S3), while those for the 10-year period also include the interannual variability of the freshwater discharge rate.
4.6 Comparison with previous studies and other major estuaries
[DOC] values obtained by this study in all four seasons are within the ranges previously reported for the PRE (Table 2). DOC stock in the PRE thus has not undergone large changes since the mid-1990s, suggesting that the gross inputs and losses of DOM remained stable during this period. Compared to [DOC], previous aCDOM measurements are far fewer and none of them was made during wintertime. The summer and autumn a330 from this study are, however, comparable to those published (Table 2). Our DOC flux estimate for spring 2015 (5.8×10⁸ g C d−1) is close to that reported by He et al. (2010) for spring 2007 (5.3×10⁸ g C d−1). The summer 2015 value (9.0×10⁸ g C d−1) is, however, only 60 % of the summer 2007 value (He, 2010) due to a much lower river runoff in 2015 (7174 m3 s−1 vs. 25 060 m3 s−1). The DOC flux for the entire Pearl River Delta estimated by this study (362×109 g C yr−1) is comparable to that (380×109 g C yr−1) reported by Ni et al. (2008) but 44 % lower than that (650×109 g C yr−1) obtained by Lin (2007). The estimate by Ni et al. (2008) was based on monthly [DOC] measurements at eight major runoff outlets of the Pearl River Delta from March 2005 to February 2006. Lin (2007) derived the estimate from data collected during three cruises carried out in winter (February 2004), early spring (March 2006), and summer (August 2005). Part of the difference between our study and Lin's could result from the different temporal coverage. The main difference, however, stems from the much greater [DOC]∗ obtained by Lin (2007) (147 µmol L−1 for the wet season and 254 µmol L−1 for the dry season).
Table 2DOC concentrations and a330 in surface water of the Pearl River estuary reported in the literature and this study.
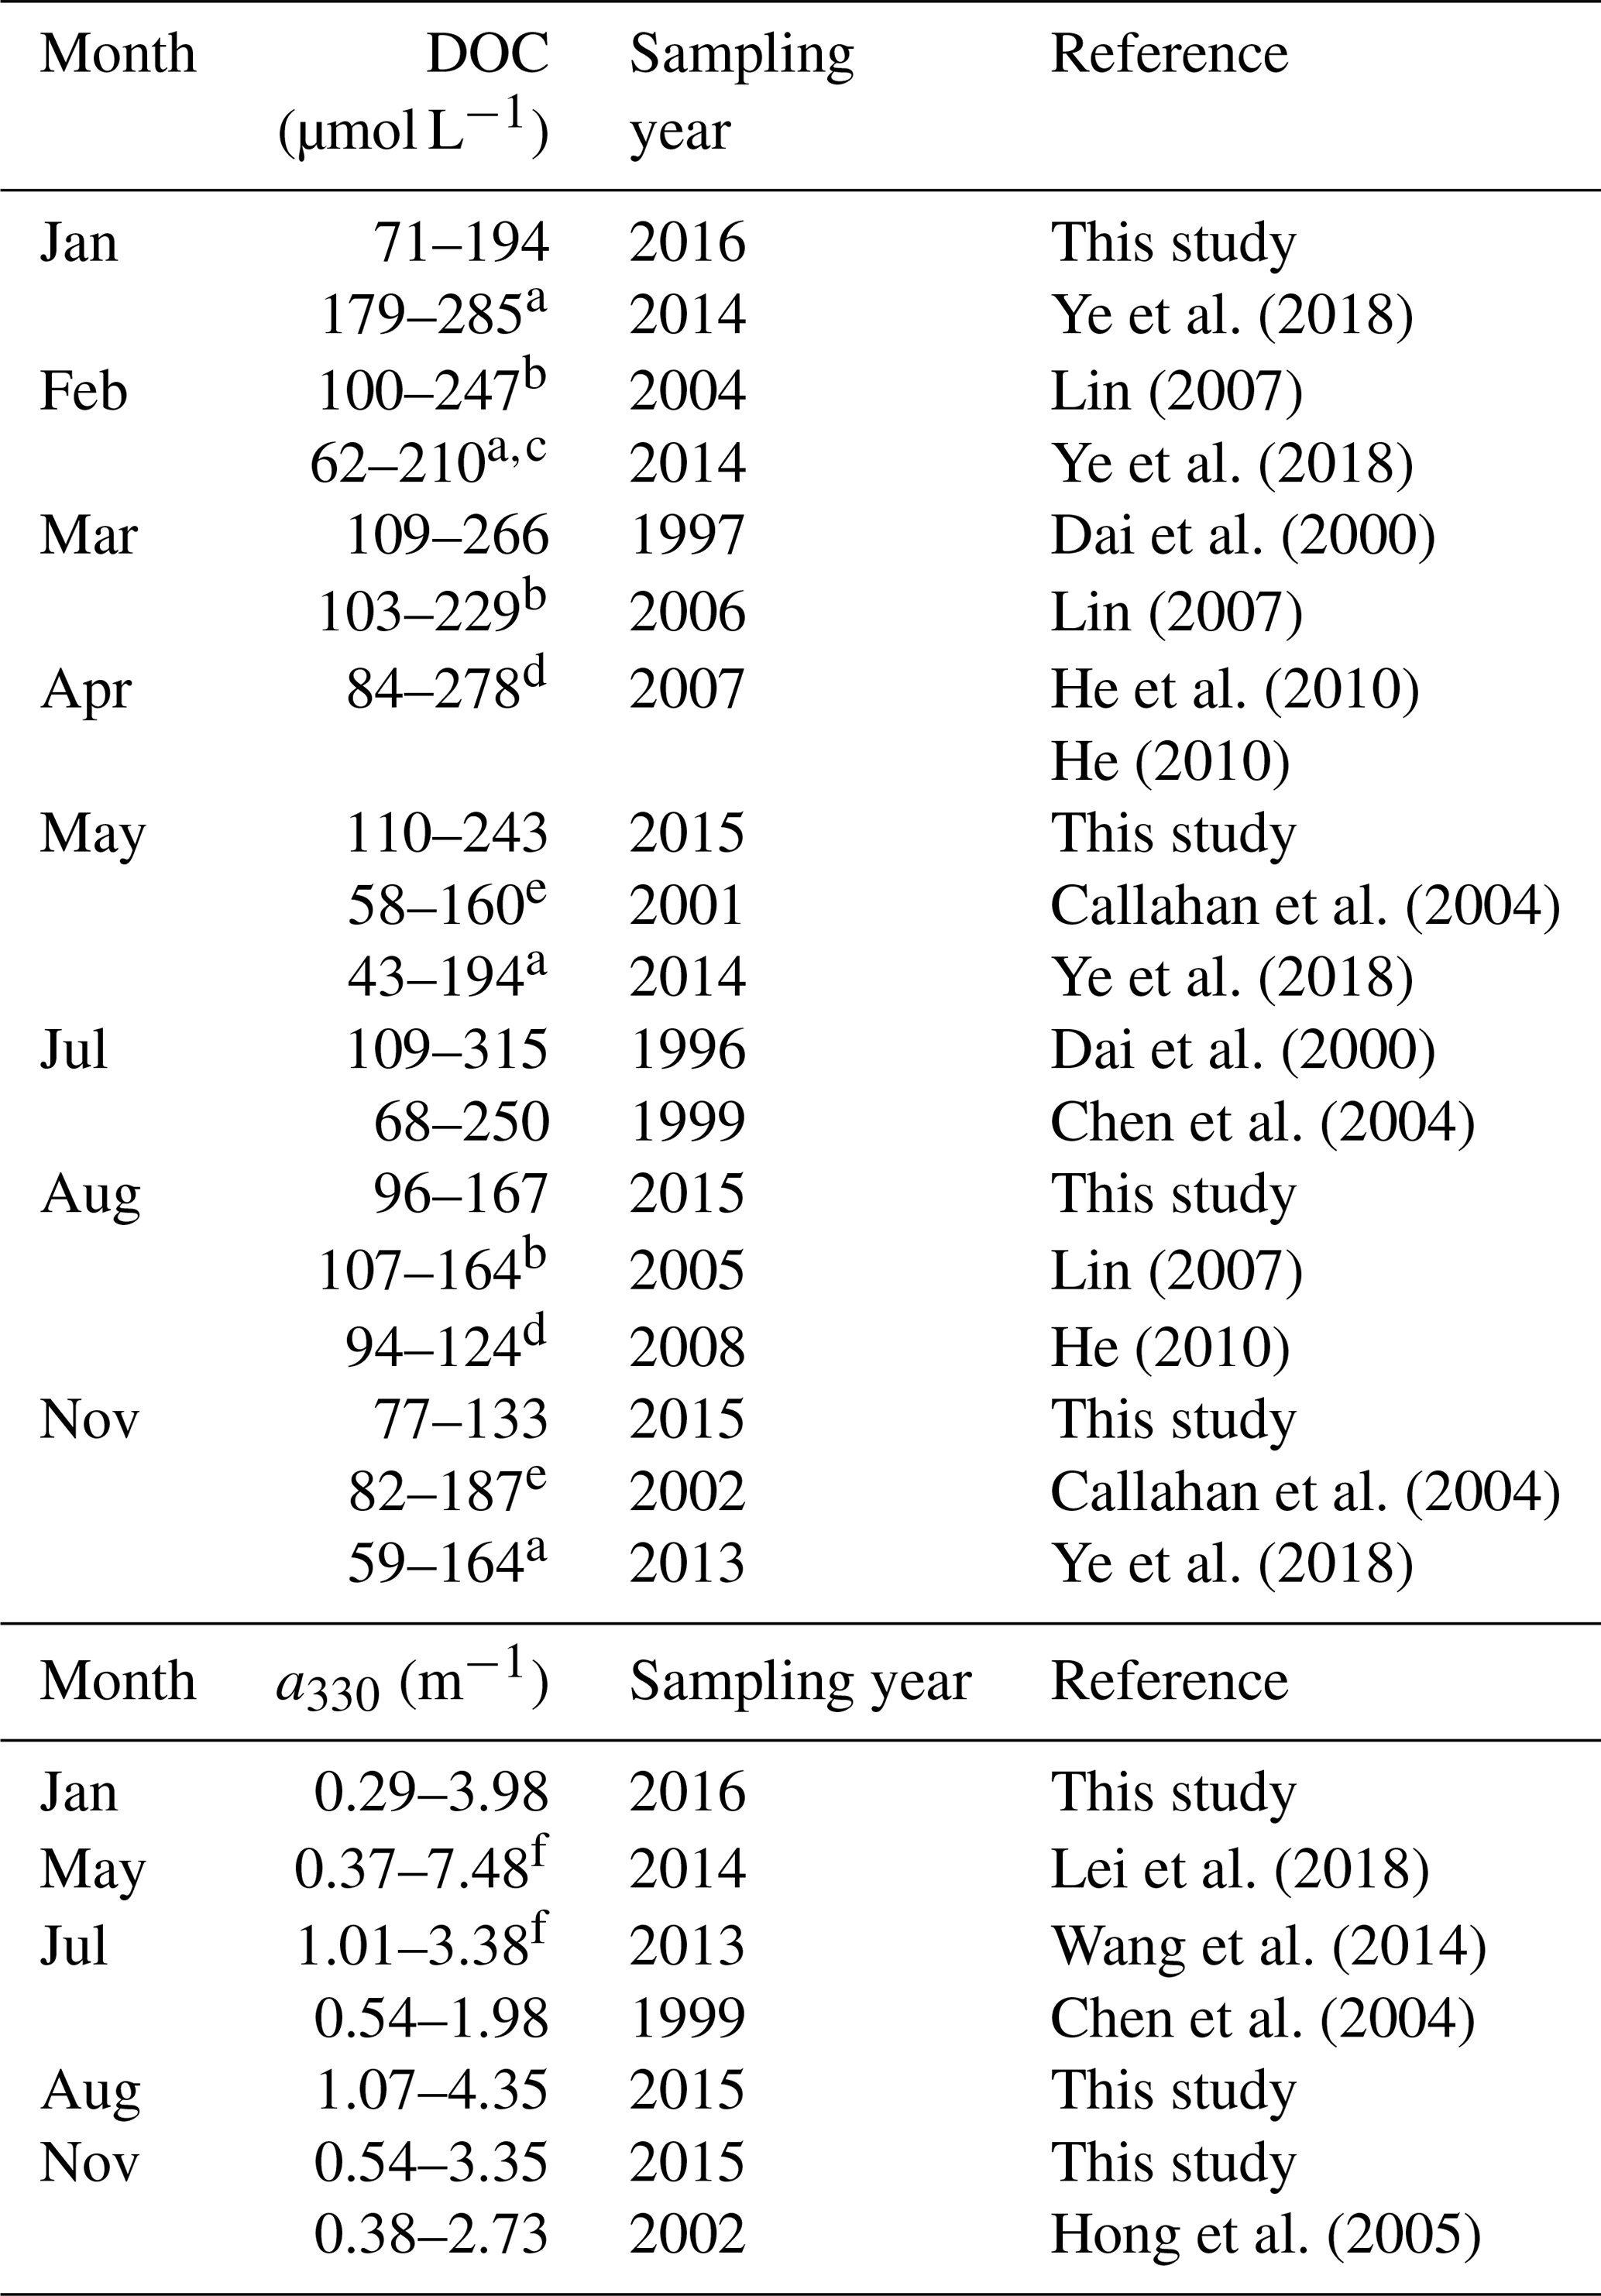
a Data were obtained from the Supplement of Ye et al. (2018). b Ranges were estimated using the fitted [DOC]–salinity equations in Lin (2007) over salinity 0–30. c Data for the Guangzhou Channel were excluded. d DOC concentrations upstream of station M01 in the present study are excluded. e Values were retrieved from Figs. 5a and 8b in Callahan et al. (2004). f Ranges were estimated using exponential decay equations established from data in Table 1 in Lei et al. (2018).
[DOC] and 〈CDOM〉 in the PRE are the lowest among the major world rivers (Table 3). The low DOM load in the PRE could be associated with a deficiency of organic matter in the soil of the Pearl River watershed, which has almost no forest (Luo et al., 2002). Moreover, although sewage effluents may bring in large amounts of DOM, a large portion of it can be rapidly biodegraded before reaching the head of the estuary (He et al., 2010). The lack of correspondence between [DOC]∗ and and the freshwater discharge rate (Fig. S2) suggests that the abundance of DOM in the PRE is controlled by both river runoff and pollution input. In contrast, DOM in the majority of large rivers is predominantly terrigenous (Bianchi, 2011; Raymond and Spencer, 2015) and the abundance of DOM in many rivers increases with the river flow rate (Cooper et al., 2005; Holmes et al., 2013). Note that the absence of a link between [DOC] and the freshwater discharge rate in the PRE observed by this study differs from the anti-variation of the two variables reported by Lin (2007) and Ni et al. (2008). Based on this anti-variation, Lin (2007) proposed that the PRE is a typical point-source-regulated system in terms of DOC concentration and distribution. It remains to be confirmed if our results imply a fundamental change in the relative importance of sewage discharge (anthropogenic DOM) and river runoff (soil-derived and river-born DOM) in controlling the PRE's DOC freshwater endmember.
Table 3DOC concentrations and CDOM abundances (a330) in major world rivers.
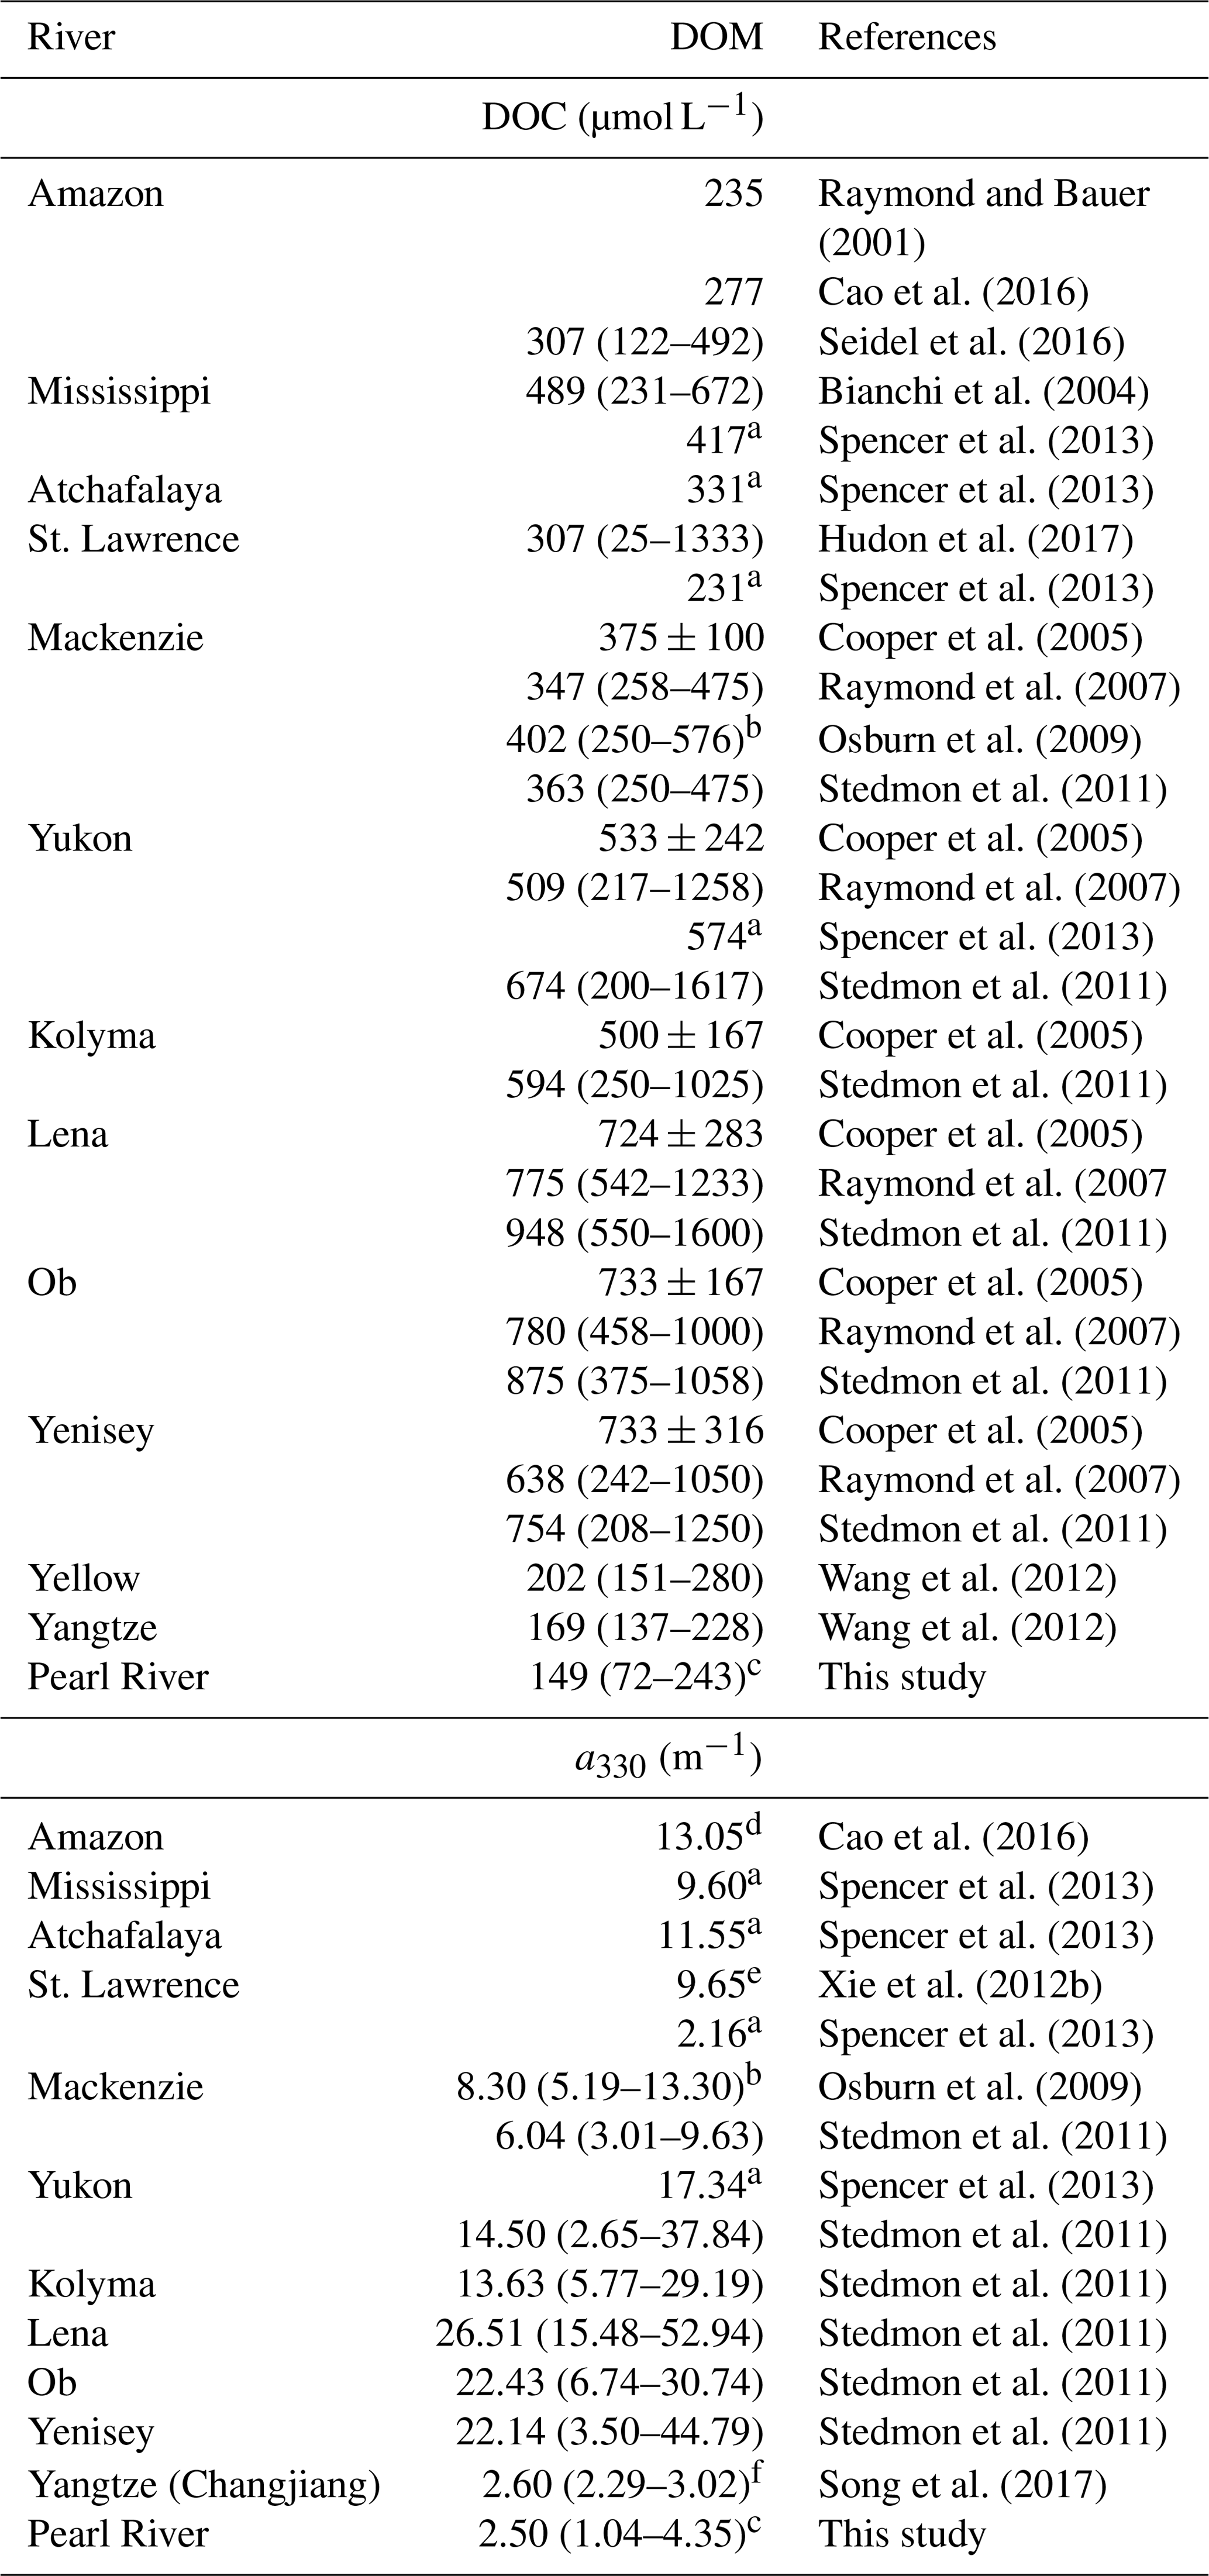
a Retrieved from DOC and CDOM fluxes and freshwater discharge rates in Spencer
et al. (2013).
b From data at salinities <5.
c From data at salinities <5.
d Retrieved
from the spectral slope and a350 at station 10 in Cao et al. (2016).
e Average value at
station SL1 and SL2 in Xie et al. (2012b).
f Average value at salinities <5.
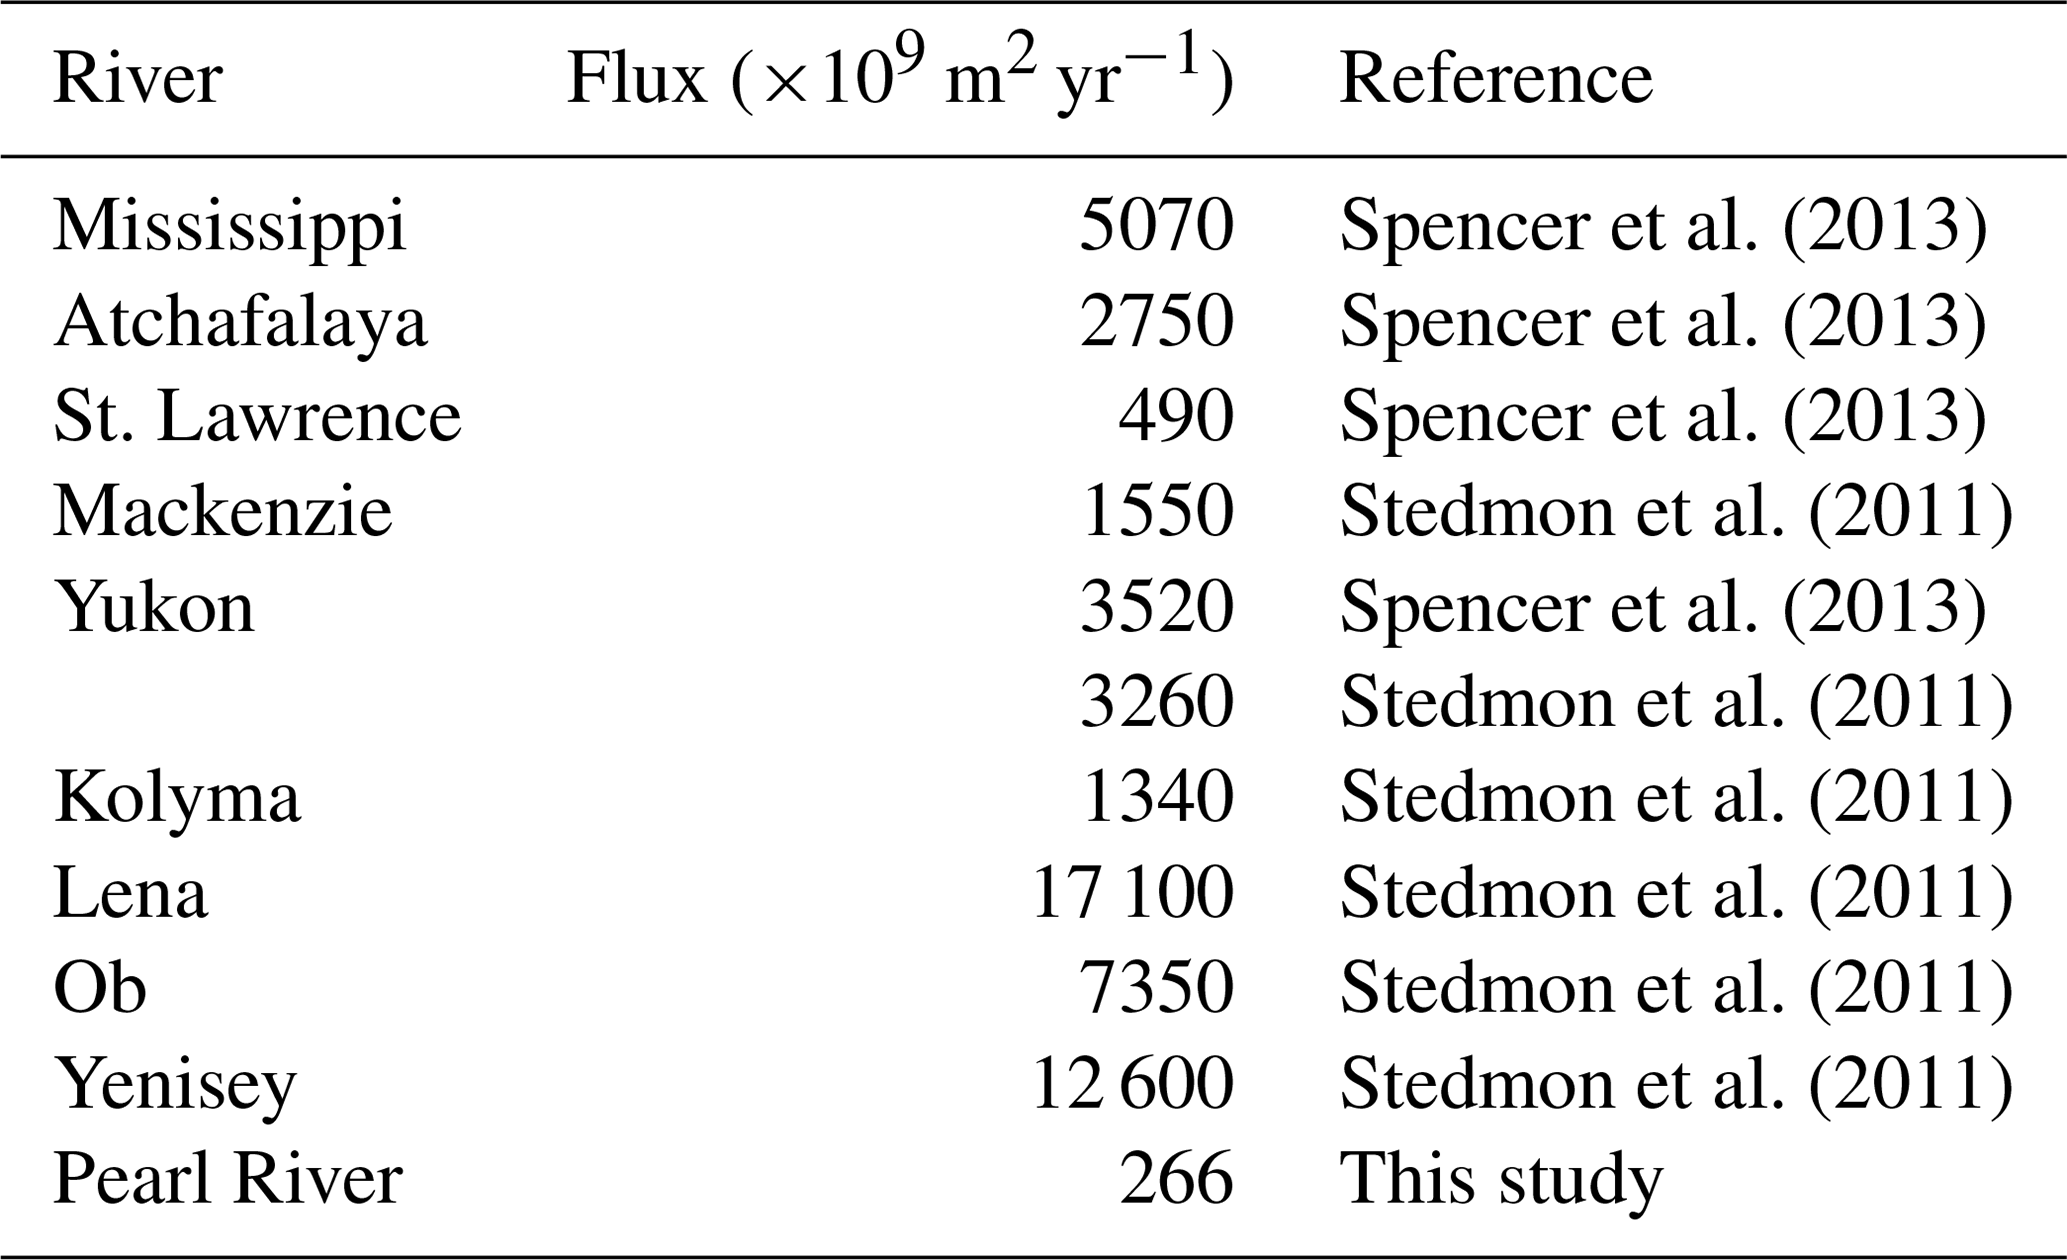
Owing mainly to the very low [DOC], our DOC export estimate for the Pearl River is the lowest among the 30 largest rivers worldwide (Raymond and Spencer, 2015), though the Pearl River is ranked the 13th largest river by discharge volume. The Pearl River value of 362×109 g C yr−1 only accounts for 0.14 % of the global riverine DOC flux estimate of 250×1012 g C yr−1 (Raymond and Spencer, 2015). The estimate for CDOM export from the Pearl River is also the lowest among the limited number of estimates available for the major world rivers (Table 4). Despite its small contribution on global scales, DOM delivered by the Pearl River is rich in proteinaceous constituents that can be utilized by microbes, thereby exerting a potentially important impact on the local coastal ecosystem.
Table 4CDOM fluxes (a330-based) from major world rivers to the ocean reported in the literature. The flux estimated for the Pearl River by this study is also included for comparison.
The main estuary of the PRE manifests smaller seasonal and spatial variations in DOM than expected for a sizable estuary with a marked seasonality of hydrography. Several factors functioning in concert lead to this phenomenon. First, a combination of the poorly forested watershed, rapid degradation of pollution-derived DOM in the upper reach and a short residence time of freshwater diminishes the DOM abundance and the seasonal variations in both DOM quantity and quality. Second, the small difference between the low-salinity and marine DOM endmembers tends to lessen the vertical and lateral gradients in DOM again both qualitatively and quantitatively, despite the larger vertical and cross-estuary salinity gradients. Both the concentrations and seaward exports of DOC and CDOM in and from the PRE are the lowest among the major world rivers. However, as DOM undergoes marginal processing during its transit through the estuary, the Pearl River delivers protein-rich, labile organic matter to the continental shelf of the South China Sea where it may fuel heterotrophy.
The authors declare that all the data obtained in this work are available in the main text and the Supplement of this article and from the corresponding authors upon request.
The supplement related to this article is available online at: https://doi.org/10.5194/bg-16-2751-2019-supplement.
GS and HX designed the study. HX and GS interpreted the results and prepared the paper with input from PM. YL performed sample analysis and data processing. YL, GS, FY, and RL participated in field sampling. PM carried out PARAFAC modeling, PCA, and OpenFluor database search. FY conducted ANOVA.
The authors declare that they have no conflict of interest.
We are grateful to the captain and crews of the cruises for their corporation and to Zhen Shi, Mianrun Chen, Qingyang Sun, and Liuyu Han for their help during sampling. Comments from reviewers and the editor improved the paper. Huixiang Xie was holding an adjunct professorship at Tianjin University of Science & Technology during this work.
This research has been supported by the National Natural Science Foundation of China (grant nos. 41606098 and 41376081) and the Tianjin Natural Science Foundation (grant no. 16JCQNJC08000).
This paper was edited by Silvio Pantoja and reviewed by Ding He and two anonymous referees.
Asmala, E., Bowers, D. G., Autio, R., Kaartokallio, H., and Thomas, D. N.: Qualitative changes of riverine dissolved organic matter at low salinities due to flocculation, J. Geophys. Res.-Biogeo., 119, 1919–1933, https://doi.org/10.1002/2014JG002722, 2014.
Babin, M., Stramski, D., Ferrari, G. M., Claustre, H., Bricaud, A., Obolensky, G., and Hoepffner, N.: Variations in the light absorption coefficients of phytoplankton, nonalgal particles, and dissolved organic matter in coastal waters around Europe, J. Geophys. Res., 108, 3211, https://doi.org/10.1029/2001JC000882, 2003.
Baker, A.: Fluorescence excitation-emission matrix characterization of some sewage-impacted rivers, Environ. Sci. Technol., 35, 948–953, 2001.
Benner, R. and Kaiser, K.: Biological and photochemical transformations of amino acids and lignin phenols in riverine dissolved organic matter, Biogeochem., 102, 209–222, 2011.
Bianchi, T. S.: The role of terrestrially derived organic carbon in the coastal ocean: A changing paradigm and the priming effect, P. Natl. Acad. Sci. USA, 108, 19473–19481, 2011.
Bianchi, T. S., Filley, T., Dria, K., and Hatcher, P. G.: Temporal variability in sources of dissolved organic carbon in the lower Mississippi River, Geochim. Cosmochim. Ac., 68, 959–967, 2004.
Birdwell, J. E. and Engel, A. S.: Characterization of dissolved organic matter in cave and spring waters using UV-Vis absorbance and fluorescence spectroscopy, Org. Geochem., 41, 270–280, 2010.
Boehme, J., Coble, P., Conmy, R., and Stovall-Leonard, A.: Examining CDOM fluorescence variability using principal component analysis: seasonal and regional modeling of three-dimensional fluorescence in the Gulf of Mexico, Mar. Chem., 89, 3–14, 2004.
Bro, R.: PARAFAC. Tutorial and applications, Chemometr. Intell. Lab., 38, 149–171, 1997.
Brogi, S. R., Ha, S.-Y., Kim, K., Derrien, M., Lee, Y. K., and Hur, J.: Optical and molecular characterization of dissolved organic matter (DOM) in the Arctic ice core and the underlying seawater (Cambridge Bay, Canada): Implication for increased autochthonous DOM during ice melting, Sci. Total Environ., 627, 802–811, 2018.
Cai, W., Dai, M., Wang, Y., Zhai, W., Huang, T., Chen, S., Zhang, F., Chen, Z., and Wang, Z.: The biogeochemistry of inorganic carbon and nutrients in the Pearl River estuary and the adjacent Northern South China Sea, Cont. Shelf Res., 24, 1301–1319, 2004.
Callahan, J., Dai, M., Chen, R., Li, X., Lu, Z., and Huang, W.: Distribution of dissolved organic matter in the pearl river estuary, China, Mar. Chem., 89, 211–224, 2004.
Cao, F., Medeiros, P. M., and Miller, W. L.: Optical characterization of dissolved organic matter in the Amazon River plume and the adjacent ocean: examining the relative role of mixing, photochemistry, and microbial alterations, Mar. Chem., 186, 178–188, 2016.
Chen, C., Shi, P., Yin, K., Pan, Z., Zhan, H., and Hu, C.: Absorption coefficient of yellow substance in the Pearl River estuary, Proc. of SPIE, 4892, 215–221, 2003.
Chen, Z., Li, Y., and Pan, J.: Distributions of colored dissolved organic matter and dissolved organic carbon in the Pearl River estuary, China, Cont. Shelf Res., 24, 1845–1856, 2004.
Coble, P. G.: Characterization of marine and terrestrial DOM in seawater using excitation-emission matrix spectroscopy, Mar. Chem., 51, 325–346, 1996.
Cooper, L. W., Benner, R., McClelland, J. W., Peterson, B. J., Holmes, R. M., Raymond, P. A., Hansell, D. A., Grebmeier, J. M., and Codispoti, L. A.: Linkages among runoff, dissolved organic carbon and the stable oxygen isotope composition of seawater and other water mass indicators in the Arctic Ocean, J. Geophys. Res., 110, G02023, https://doi.org/10.1029/2005JG000031, 2005.
Cory, R. M. and McKnight, D. M.: Fluorescence spectroscopy reveals ubiquitous presence of oxidized and reduced quinones in dissolved organic matter, Environ. Sci. Technol., 39, 8142–8149, 2005.
Dai, M., Jean-Marie, M., Hong, H., and Zhang, Z.: Preliminary study on the dissolved and colloidal organic carbon in the Zhujiang river estuary, Chin. J. Oceanol. Limn., 18, 265–273, 2000.
Del Vecchio, R. D. and Blough, N. V.: Photobleaching of chromophoric dissolved organic matter in natural waters: kinetics and modeling, Mar. Chem., 78, 231–253, 2002.
Deutsch, B., Alling, V., Humborg, C., Korth, F., and Mörth, C. M.: Tracing inputs of terrestrial high molecular weight dissolved organic matter within the Baltic Sea ecosystem, Biogeosciences, 9, 4465–4475, https://doi.org/10.5194/bg-9-4465-2012, 2012.
Dong, L., Su, J., Wong, L., Cao, Z., and Chen, J.: Seasonal variation and dynamics of the Pearl River plume, Cont. Shelf Res., 24, 1761–1777, 2004.
Fellman, J. B., Hood, E., and Spencer, R. G. M.: Fluorescence spectroscopy opens new windows into dissolved organic matter dynamics in freshwater ecosystems: a review, Limnol. Oceanogr., 55, 2452–2462, 2010.
Fichot, C. G., Lohrenz, S. E., and Benner, R.: Pulsed, cross-shelf export of terrigenous dissolved organic carbon to the Gulf of Mexico, J. Geophys. Res.-Oceans, 119, 1176–1194, https://doi.org/10.1002/2013JC009424, 2014.
Gareis, J. A. L., Lesack, L. F. W., and Bothwell, M. L.: Attenuation of in situ UV radiation in Mackenzie Deltalakes with varying dissolved organic matter compositions, Water Resour. Res., 46, W09516, https://doi.org/10.1029/2009WR008747, 2010.
Guo, W., Yang, L., Zhai, W., Chen, W., Osburn, C. L., Huang, X., and Li, Y.: Runoff-mediated seasonal oscillation in the dynamics of dissolved organic matter in different branches of a large bifurcated estuary-the Changjiang estuary, J. Geophys. Res.-Biogeo., 119, 776–793, 2014.
Hansen, A. M., Kraus, T. E. C., Pellerin, B. A., Fleck, J. A., Downing, B. D., and Bergamaschi, B. A.: Optical properties of dissolved organic matter (DOM): Effects of biological and photolytic degradation, Limnol. Oceanogr., 61, 1015–1032, 2016.
He, B.: Organic Matter in the Pearl River Estuary: its Composition, Source, Distribution, Bioactivity and their Linkage to Oxygen Depletion, PhD Dissertation, Xiamen university, 2010 (in Chinese).
He, B., Dai, M., Zhai, W., Wang, L., Wang, K., Chen, J., Lin, J., Hua, A., and Xu, Y.: Distribution, degradation and dynamics of dissolved organic carbon and its major compound classes in the pearl river estuary, China, Mar. Chem., 119, 52–64, 2010.
Helms, J. R., Stubbins, A., Ritchie, J. D., Minor, E. C., Kieber, D. J., and Mopper, K.: Absorption spectral slopes and slope ratios as indicators of molecular weight, source, and photobleaching of chromophoric dissolved organic matter, Limnol. Oceanogr., 53, 955–969, 2008.
Holmes, R. M., Coe, M. T., Fiske, G. J., Gurtovaya, T., McClelland, J. W., Shiklomanov, A. I., Spencer, R. G. M., Tank, S. E., and Zhulidov, A. V.: Climate change impacts on the hydrology and biogeochemistry of Arctic Rivers, in: Climatic Change and Global Warming of Inland Waters: Impacts and Mitigation for Ecosystems and Societies, edited by: Goldman, C. R., Kumagai, M., and Robarts, R. D., Wiley-Blackwell: Hoboken, NJ, 3–26, 2013
Hong, H., Wu, J., Shang, S., and Hu, C.: Absorption and fluorescence of chromophoric dissolved organic matter in the Pearl River Estuary, South China, Mar. Chem., 97, 78–89, 2005.
Hudon, C., Gagnon, P., Rondeau, M., Hébert, S., Gilbert, D., Hill, B., Patoine, M., and Starr, M.: Hydrological and biological processes modulate carbon, nitrogen and phosphorus flux from the St. Lawrence River to its estuary (Quebec, Canada), Biogeochemistry, 135, 251–276, 2017.
Huguet, A., Vacher, L., Relexans, S., Saubusse, S., Froidefond, J. M., and Parlanti, E.: Properties of fluorescent dissolved organic matter in the Gironde Estuary, Org. Geochem., 40, 706–719, 2009.
Johannessen, S. C., Miller, W. L., and Cullen J. J.: Calculation of UV attenuation and colored dissolved organic mater absorption spectra from measurements of ocean color, J. Geophys. Res., 108, 3301, https://doi.org/10.1029/2000JC000514, 2003.
Kot, S. C. and Hu, S. L.: Water flows and sediment transport in Pearl River Estuary and wave in South China Sea near Hong Kong, coastal infrastructure development in Hong Kong-a review, Hong Kong Government, Hong Kong, 1995.
Lawaetz, A. J. and Stedmon, C. A.: Fluorescence Intensity Calibration Using the Raman Scatter Peak of Water, Appl. Spectrosc., 63, 936–940, 2009.
Lei, X., Pan, J., and Devlin, A. T.: Mixing behavior of chromophoric dissolved organic matter in the Pearl River estuary in spring, Cont. Shelf Res., 154, 46–54, 2018.
Li, P. and Hur, J.: Utilization of UV-Vis spectroscopy and related data analyses for dissolved organic matter (DOM) studies: A review, Crit. Rev. Environ. Sci. Technol., 47, 131–154, 2017.
Li, P., Chen, L., Zhang, W., and Huang, Q.: Spatiotemporal distribution, sources, and photobleaching imprint of dissolved organic matter in the Yangtze estuary and its adjacent sea using fluorescence and parallel factor analysis, PLoS ONE, 10, e0130852, https://doi.org/10.1371/journal.pone.0130852, 2015.
Li, R., Xu, J., Li, X., and Harrison, P. J.: Spatiotemporal Variability in Phosphorus Species in the Pearl River Estuary: Influence of the River Discharge, Sci. Rep.-UK, 7, 13649, https://doi.org/10.1038/s41598-017-13924-w, 2017.
Lin, J.: On the behavior and flux of Dissolved Organic Carbon in two large Chinese estuaries-Changjiang and Zhujiang (Master Dissertation), Xiamen university, 2007 (in Chinese).
Lou, T. and Xie, H.: Photochemical alteration of the molecular weight of dissolved organic matter, Chemosphere, 65, 2333–2342, 2006.
Lu, F., Ni, H., Liu, F., and Zeng, E.: Occurrence of nutrients in riverine runoff of the Pearl River Delta, South China, J. Hydrol., 376, 107–115, 2009.
Lu, Z. and Gan, J.: Controls of seasonal variability of phytoplankton blooms in the pearl river estuary, Deep-Sea Res. Pt. II, 117, 86–96, 2015.
Luo, X. L., Yang, Q. S., and Jia, L. W.: River-bed evolution of the Pearl River Delta network, Sun Yat-sen University Press, Guangzhou, China, p. 213, 2002 (in Chinese).
Mann, P. J., Davydova, A., Zimov, N., Spencer, R. G. M., Davydov, S., Bulygina, E., Zimov, S., and Holmes, R. M.: Controls on the composition and lability of dissolved organic matter in Siberia's Kolyma River basin, J. Geophys. Res., 117, G01028, https://doi.org/10.1029/2011JG001798, 2012.
Mannino, A., Russ, M. E., and Hooker, S. B.: Algorithm development and validation for satellite-derived distributions of DOC and CDOM in the U.S. Middle Atlantic Bight, J. Geophys. Res., 113, C07051, https://doi.org/10.1029/2007JC004493, 2008.
Martínez-Pérez, A. M., Osterholz, H., Nieto-Cid, M., Álvarez, M., Dittmar, T., and Álvarez-Salgado, X. A.: Molecular composition of dissolved organic matter in the Mediterranean Sea, Limnol. Oceanogr., 62, 2699–2712, 2017.
Massicotte, P. and Frenette, J.-J.: Spatial connectivity in a large river system: resolving the sources and fate of dissolved organic matter, Ecol. Appl., 21, 2600–2617, 2011.
McKnight, D. M., Boyer, E. W., Westerhoff, P. K., Doran, P. T., Kulbe, T., and Andersen, D. T.: Spectrofluorometric characterization of dissolved organic matter for indication of precursor organic material and aromaticity, Limnol. Oceanogr., 46, 38–48, 2001.
Mikhailov, V. N., Mikhailova, M. V., and Korotaev, V. N.: Hydrological and morphological processes at the Zhujiang River mouth area, China, Water Resour., 33, 237–248, 2006.
Murphy, K. R., Stedmon, C. A., Waite, T. D., and Ruiz, G. M.: Distinguishing between terrestrial and autochthonous organic matter sources in marine environments using fluorescence spectroscopy, Mar. Chem., 108, 40–58, 2008.
Ni, H., Lu, F., Luo, X., Tian, H., and Zeng, E.: Riverine inputs of total organic carbon and suspended particulate matter from the Pearl River Delta to the coastal ocean off South China, Mar. Pollut. Bull., 56, 1150–1157, 2008.
Ohno, T.: Fluorescence inner-filtering correction for determining the humification index of dissolved organic matter, Environ. Sci. Technol., 36, 742–746, 2002.
Opsahl S. and Benner R.: Distribution and cycling of terrigenous dissolved organic matter in the ocean, Nature, 386, 480–482, 1997.
Osburn, C. L., Zagarese, H. E., Morris, D. P., Hargreaves, B. R., and Cravero, W. E.: Calculation of spectral weighting functions for the solar photobleaching of chromophoric dissolved organic matter in temperate lakes, Limnol. Oceanogr., 46, 1455–1467, 2001.
Osburn, C. L., Retamal, L., and Vincent, W. F.: Photoreactivity of chromophoric dissolved organic matter transported by the Mackenzie River to the Beaufort Sea, Mar. Chem., 115, 10–20, 2009.
Pang, Y., and Li, Y. S.: Effects of discharged pollutants from Pearl River delta on east outlets, J. Hohai Univ., 29, 50–55, 2001.
Peuravuori, J. and Pihlaja, K.: Molecular size distribution and spectroscopic properties of aquatic humic substances, Anal. Chim. Acta, 337, 133–149, 1997.
Raymond, P. A. and Bauer, J. E.: Riverine export of aged terrestrial organic matter to the North Atlantic Ocean, Nature, 409, 497–410, 2001.
Raymond, P. A. and Spencer, R. G. M.: Riverine DOM, in: Biogeochemistry of marine dissolved organic matter, second edition, edited by: Hansell, D. A. and Carlson, C. A., Academic Press, San Diego, USA, 509–533, 2015.
Raymond, P. A., McClelland, J. W., Holmes, R. M., Zhulidov, A. V., Mull, K., Peterson, B. J., Striegl, R. G., Aiken, G. R., and Gurtovaya, T. Y.: Flux and age of dissolved organic carbon exported to the Arctic Ocean: A carbon isotopic study of the five largest arctic rivers, Global Biogeochem. Cy., 21, GB4011, https://doi.org/10.1029/2007GB002934, 2007.
Santín, C., Yamashita, Y., Otero, X. L., Álvarez, M. Á, and Jaffé, R.: Characterizing humic substances from estuarine soils and sediments by excitation-emission matrix spectroscopy and parallel factor analysis, Biogeochemistry, 96, 131–147, 2009.
Sazawa, K., Tachi, M., Wakimoto, T., Kawakami, T., Hata, N., Taguchi, S., and Kuramitz, H.: The evaluation for alterations of DOM components from upstream to downstream flow of rivers in Toyama (Japan) using three-dimensional excitation-emission matrix fluorescence spectroscopy, Int. J. Environ. Res. Pu., 8, 1655–1670, 2011.
Seidel, M., Dittmar, T., Ward, N. D., Krusche, A. V., Richey, J. E., Yager, P. L., and Medeiros, P. M.: Seasonal and spatial variability of dissolved organic matter composition in the lower Amazon River, Biogeochemistry, 131, 281–302, https://doi.org/10.1007/s10533-016-0279-4, 2016.
Shi., G., Peng., C., Wang, M., Shi, S., Yang, Y., Chu, J., Zhang, J., Lin, G., Shen, Y., and Zhu, Q.: The spatial and temporal distribution of dissolved organic carbon exported from three Chinese rivers to the China sea, PLoS ONE, 11, e0165039, https://doi.org/10.1371/journal.pone.0165039, 2016.
Siegel, D. A., Maritorena, S., Nelson, N. B., Hansell, D. A., and Lorenzi-Kayser, M.: Global distribution and dynamics of colored dissolved and detrital organic materials, J. Geophys. Res., 107, 32–28, 2002.
Song, G., Li, Y., Hu, S., Li, G., Zhao, R., Sun, X., and Xie, H.: Photobleaching of chromophoric dissolved organic matter (CDOM) in the Yangtze River estuary: kinetics and effects of temperature, pH, and salinity, Environ. Sci.: Processes Impacts, 19, 861–873, 2017.
Spencer, R. G. M., Aiken, G. R., Dornblaser, M. M., Butler, K. D., Holmes, R. M., Fiske, G., Mann, P. J., and Stubbins, A.: Chromophoric dissolved organic matter export from U.S. rivers, Geophys. Res. Lett., 40, 1575–1579, https://doi.org/10.1002/grl.50357, 2013.
Stedmon, C. A. and Bro, R.: Characterizing dissolved organic matter fluorescence with parallel factor analysis: a tutorial, Limnol. Oceanogr. Methods, 6, 1–6, 2008.
Stedmon, C. A., Markager, S., and Bro, R.: Tracing dissolved organic matter in aquatic environments using a new approach to fluorescence spectroscopy, Mar. Chem., 82, 239–254, 2003.
Stedmon, C. A., Amon, R. M. W., Rinehart, A. J., and Walker, S. A.: The supply and characteristics of colored dissolved organic matter (CDOM) in the Arctic Ocean: Pan Arctic trends and differences, Mar. Chem., 124, 108–118, 2011.
Sulzberger, B. and Arey, J. S.: Impacts of polar changes on the UV-induced mineralization of terrigenous dissolved organic matter, Environ. Sci. Technol., 50, 6621–6631, 2016.
Taylor, G. T., Way, J., and Scranton, M. I.: Planktonic carbon cycling and transport in surface waters of the highly urbanized Hudson River estuary, Limnol. Oceanogr., 48, 1779–1795, 2003.
Vähätalo, A. V., Salkinoja-Salonen, M., Taalas, P., and Salonen, K.: Spectrum of the quantum yield for photochemical mineralization of dissolved organic carbon in a humic lake, Limnol. Oceanogr., 45, 664–676, 2000.
Wai, O., Wang, C., Li, Y., and Li, X.: The formation mechanisms of turbidity maximum in the Pearl River estuary, China, Mar. Pollut. Bull., 48, 441–448, 2004.
Wang, S., Wang, Y., Fu, Q., Yin, B., and Li, Y.: Spectral absorption properties of the water constituents in the estuary of Zhujiang River, Environ. Sci., 35, 4511–4521, 2014 (in Chinese).
Wang, X., Ma, H., Li, R., Song, Z., and Wu, J.: Seasonal fluxes and source variation of organic carbon transported by two major Chinese rivers: the Yellow River and Changjiang (Yangtze) River, Global Biogeochem. Cy., 26, GB2025, https://doi.org/10.1029/2011GB004130, 2012.
Wei, X. and Wu, C.: Long-term process-based morphodynamic modeling of the Pearl River Delta, Ocean Dynam., 64, 1753–1765, 2014.
White, E. M., Kieber, D. J., Sherrard, J., Miller, W. L., and Mopper, K.: Carbon dioxide and carbon monoxide photoproduction quantum yields in the Delaware Estuary, Mar. Chem., 118, 11–21, 2010.
Xie, H., Bélanger, S., Song, G., Benner, R., Taalba, A., Blais, M., Tremblay, J.-É., and Babin, M.: Photoproduction of ammonium in the southeastern Beaufort Sea and its biogeochemical implications, Biogeosciences, 9, 3047–3061, https://doi.org/10.5194/bg-9-3047-2012, 2012a.
Xie, H., Aubry, C., Bélanger, S., and Song, G.: The dynamics of absorption coefficients of CDOM and particles in the St. Lawrence estuarine system: Biogeochemical and physical implications, Mar. Chem., 128–129, 44–56, 2012b.
Yamashita, Y., and Jaffé, R.: Characterizing the interactions between trace metals and dissolved organic matter using excitation-emission matrix and parallel factor analysis, Environ. Sci. Technol., 42, 7374–7379, 2008.
Ye, F., Guo, W., Wei, G., and Jia, G.: The sources and transformations of dissolved organic matter in the Pearl River Estuary, China, as revealed by stable isotopes, J. Geophys. Res.-Oceans, 123, 6893–6908, 2018.
Yin, K., Qian, P., Chen, J., Hsieh, D. P. H., and Harrison, P. J.: Dynamics of nutrients and phytoplankton biomass in the Pearl River estuary and adjacent waters of Hong Kong during summer: preliminary evidence for phosphorus and silicon limitation, Mar. Ecol.-Prog. Ser., 194, 295–305, 2000.
Zhang, S., Lu, X., Higgitt, D. L., Chen, C.-T. A., Han, J., and Sun, H.: Recent changes of water discharge and sediment load in the Zhujiang (Pearl River) Basin, China, Global Planet. Change, 60, 365–380, 2008.
Zhang, Y., Xie, H., and Chen, G.: Factors affecting the efficiency of carbon monoxide photoproduction in the St. Lawrence estuarine system (Canada), Environ. Sci. Technol., 40, 7771–7777, 2006.
Zhao, H.: The Evolution of the Pearl River Estuary, Ocean Press, Beijing, China, 1990 (in Chinese).