the Creative Commons Attribution 4.0 License.
the Creative Commons Attribution 4.0 License.
 | 19 Sep 2019
Particulate organic matter controls benthic microbial N retention and N removal in contrasting estuaries of the Baltic Sea
Ines Bartl
Dana Hellemann
Christophe Rabouille
Kirstin Schulz
Petra Tallberg
Susanna Hietanen
Maren Voss
Estuaries worldwide act as “filters” of land-derived nitrogen (N) loads, yet differences in coastal environmental settings can affect the N filter function. We investigated microbial N retention (nitrification, ammonium assimilation) and N removal (denitrification, anammox) processes in the aphotic benthic system (bottom boundary layer (BBL) and sediment) of two Baltic Sea estuaries differing in riverine N loads, trophic state, geomorphology, and sediment type. In the BBL, rates of nitrification (5–227 nmol N L−1 d−1) and ammonium assimilation (9–704 nmol N L−1 d−1) were not enhanced in the eutrophied Vistula Estuary compared to the oligotrophic Öre Estuary. No anammox was detected in the sediment of either estuary, while denitrification rates were twice as high in the eutrophied (352±123 µmol N m−2 d−1) as in the oligotrophic estuary. Particulate organic matter (POM) was mainly of phytoplankton origin in the benthic systems of both estuaries. It seemed to control heterotrophic denitrification and ammonium assimilation as well as autotrophic nitrification by functioning as a substrate source of N and organic carbon. Our data suggest that in stratified estuaries, POM is an essential link between riverine N loads and benthic N turnover and may furthermore function as a temporary N reservoir. During long particle residence times or alongshore transport pathways, increased time is available for the recycling of N until its eventual removal, allowing effective coastal filtering even at low process rates. Understanding the key controls and microbial N processes in the coastal N filter therefore requires to also consider the effects of geomorphological and hydrological features.
- Article
(6191 KB) - Full-text XML
-
Supplement
(983 KB) - BibTeX
- EndNote


Human nitrogen (N) utilisation, especially in agriculture (Galloway and Cowling, 2002; Rabalais, 2002), has strongly increased riverine N inputs to coastal zones (Howarth et al., 1996) and thus coastal eutrophication (Howarth and Marino, 2006; Nixon, 1995). The coastal zone of the semi-enclosed Baltic Sea receives ∼680 kt annually of waterborne total N (TN; HELCOM, 2019) from its catchment area, which is inhabited by > 85 million people (Sweitzer et al., 1996). The Baltic coastal zone is thus particularly prone to eutrophication resulting in oxygen deficiency and a loss of biodiversity (Conley et al., 2011; Diaz and Rosenberg, 2008; Rabalais, 2002; Richardson and Jørgensen, 2013).
Estuaries are the primary recipients of the riverine N load, and intense biogeochemical cycling establishes them as “filters” of land-derived N on its way to the open sea (Nedwell et al., 1999; Soetaert et al., 2006). The N filter function consists of retention and removal, with N retention defined as the cycling of bioavailable N within a system for longer than its mean fresh water residence time, and N removal as the permanent removal of N from a system via burial and the production of gaseous forms (Asmala et al., 2017). Microbial processes that contribute to N retention include uptake into biomass, ammonification, nitrification, and dissimilatory nitrate reduction to ammonia (DNRA), while denitrification and anaerobic ammonium oxidation (anammox) lead to N removal. Nitrification, the aerobic oxidation of ammonium () via nitrite () to nitrate (), and denitrification, the stepwise anaerobic reduction of to nitrous oxide (N2O) and di-nitrogen (N2), are two key microbial processes in the coastal N cycle. Nitrification provides substrates not only for other N retention processes such as primary production and DNRA but also for N removal via denitrification and anammox. While mainly regulated by oxygen and availability (Ward, 2008), particulate organic matter (POM) is an additional important factor controlling nitrification in coastal systems (Bartl et al., 2018; Damashek et al., 2016; Hsiao et al., 2014). There, nitrifiers are often found attached to particles (Dang and Chen, 2017), where they utilise the generated through degradation of the organic particle (Klawonn et al., 2015a; Marzocchi et al., 2018). Denitrification is the dominant N removal process in many coastal sediments (Dalsgaard et al., 2005) with anammox often contributing only up to 17 % to total N2 production (Dale et al., 2009; Trimmer et al., 2003). Denitrification is mainly controlled by the concentrations of the substrates and dissolved organic carbon (Piña-Ochoa and Álvarez-Cobelas, 2006), but the quantity of labile POM as the source of substrates is equally important (Bonaglia et al., 2017; Eyre et al., 2013; Hietanen and Kuparinen, 2008). The coupling of microbial N retention and removal processes such as nitrification and denitrification is especially intense in the benthic system, which comprises oxic and anoxic portions of the sediment, and the overlying turbulent bottom boundary layer (BBL; Richards, 1990). The processes in these three compartments are closely linked via the exchange and diagenesis of solutes and particles (Boudreau and Jørgensen, 2001), thus making the benthic system a key component of the coastal N filter.
Baltic Sea estuaries are highly variable in terms of their riverine N load, stratification, water residence time, and sediment type (Asmala et al., 2017; Conley et al., 2011; Stepanauskas et al., 2002). All these environmental settings can impact the estuarine filter function. For instance, high riverine N loads are known to increase rates of microbial N processes (Seitzinger et al., 2006), whereas stratification of the water column may slow benthic N turnover as it limits the direct supply of riverine substrates from the surface water (Hellemann et al., 2017). A long water residence time, facilitated by geomorphological boundaries, increases the proportion of N removed in the sediment relative to the riverine N load (Finlay et al., 2013; Nixon et al., 1996; Seitzinger et al., 2006). Similarly, it may also increase the proportion of N retained via nitrification or DNRA, yet thorough investigations are still lacking. The sediment type influences the transport of substrates into, through, and out of the sediment, and thus the microbial N processes therein. In cohesive sediments, diffusive and fauna-induced fluxes govern solute exchange, while in sandy, permeable sediments advective pore-water flow is usually the dominant transport process (Huettel et al., 2003; Thibodeaux and Boyle, 1987). Pore-water flow leads to an increased supply of oxygen, oxidised solutes, and particles into the sediment, as well as to the build-up of a complex redox zonation (Huettel et al., 1998, 2003, 2014). In sum this results in increased microbial turnover of organic matter (Boudreau et al., 2001) and potentially enhances nitrification and denitrification rates. The efficiency of microbial processes retaining or removing N is strongly influenced by the various combinations of the above-described environmental settings, yet detailed comparisons of contrasting estuaries are scarce.
Based on a compilation of denitrification rates across different coastal types in the Baltic Sea, Asmala et al. (2017) estimated that the entire Baltic coastal zone removes ∼16 % of annual land-derived TN loads via denitrification, while the remaining 84 % is probably retained within the coastal zone or exported to the open sea. Model results indicate, however, that the export of riverine N to the open Baltic Sea accounts for only a minor share of the TN load (Radtke et al., 2012), suggesting that most N remains within the coastal zone. So far, however, actual rate measurements of N retention processes in coastal benthic systems of the Baltic Sea are scarce (e.g. Bonaglia et al., 2014; Jäntti et al., 2011). Therefore, in this study, we examined microbial N removal (denitrification, anammox) and N retention (nitrification, ammonium assimilation) processes in the aphotic benthic systems of two Baltic estuaries with contrasting environmental settings. The small, northern Öre Estuary receives low riverine N loads (430 t TN yr−1, Table 1) from a catchment area mainly consisting of forests and bogs (Wikner and Andersson, 2012). Its oligotrophic state is reflected in its low concentrations of nutrients and total organic carbon as well as low rates of primary production (Ask et al., 2016; Wikner and Andersson, 2012). By contrast, the 12-fold larger southern Vistula Estuary receives high riverine N loads (97 000 t TN yr−1, Table 1) from a catchment area of intensively cultivated cropland, which has led to high concentrations of nutrients and organic matter (Pastuszak et al., 2012), high primary production rates (Wielgat-Rychert et al., 2013; Witek et al., 1999), and thus to the eutrophied state. The estuaries further differ in their geomorphology and sediment type but share a similarity in peak riverine N loads in spring. In previous studies we showed that POM is an important factor controlling denitrification in the sediment of the Öre Estuary (Hellemann et al., 2017) and nitrification in the BBL of the Vistula Estuary (Bartl et al., 2018). In the present work, we combined new environmental data and process rates with the published data from the Öre Estuary (Hellemann et al., 2017) and the Vistula Estuary (Bartl et al., 2018; Thoms et al., 2018; Supplement Table S1) to identify the impact of contrasting environmental conditions on microbial N turnover and to estimate the role of POM in the coastal N filter function.
Table 1Sampling details of the field campaigns, as well as river discharge and N loads during the sampling months, and the annual average.
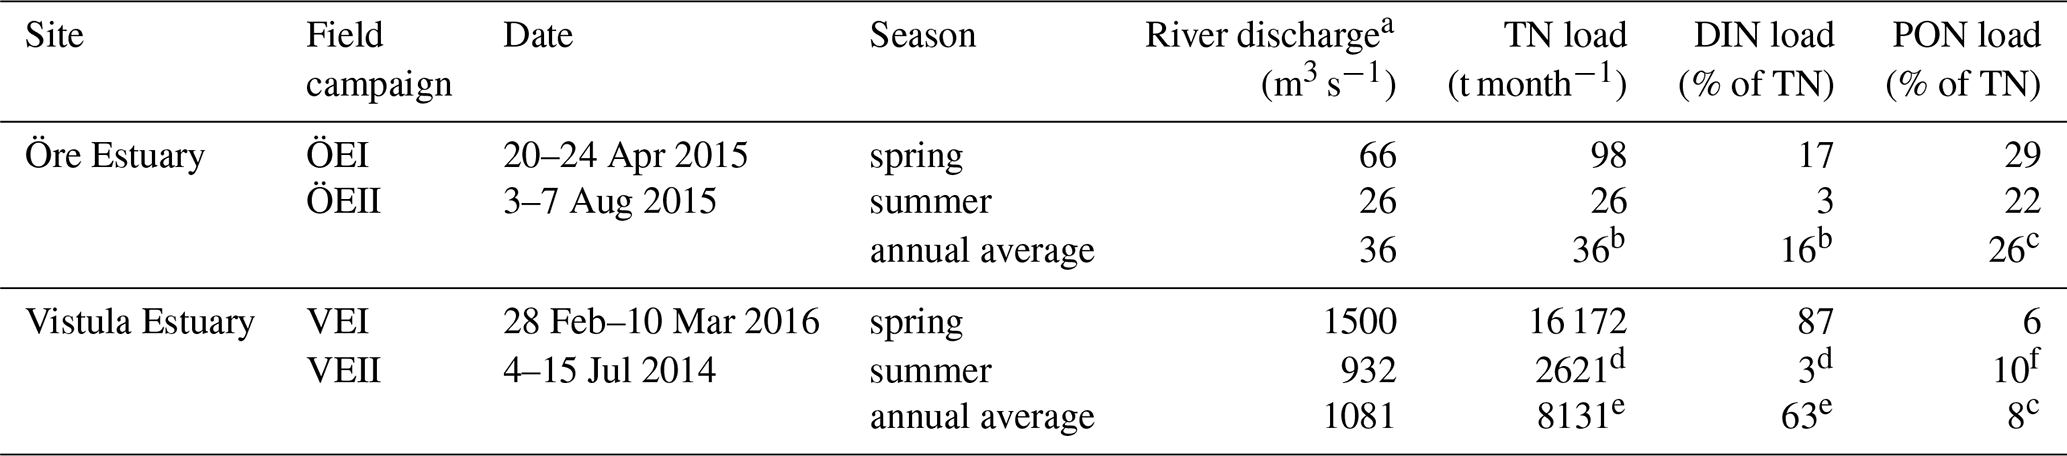
a Öre River: http://vattenwebb.smhi.se/station/, last access: 19 June 2017 (annual average: 2004–2014); Vistula River: annual average discharge (1951–1990; Pastuszak and Witek, 2012); discharge of VEI and VEII from Polish national monitoring by the Institute of Meteorology and the Water Management National Research Institute. b http://miljodata.slu.se/mvm/, last access: 19 June 2017 (1967–2014, without 1975). c Average of spring and summer. d Polish national monitoring by the Institute of Meteorology and the Water Management National Research Institute. e Helcom PLC database (http://nest.su.se/helcom_plc/, last access: 1 April 2018). f Stepanauskas et al. (2002).
2.1 Study areas and sampling
The Öre Estuary (ÖE) is located on the Swedish coast of the Quark Strait, northern Baltic Sea (Fig. 1). It covers an area of ∼71 km2 and has a volume of ∼1 km3 (SMHI, 2003). Inputs to the estuary originate from the Öre River, whose mean discharge of 36 m3 s−1 can create a river plume of 2–3 m vertical and up to 10 km horizontal extent (Forsgren and Jansson, 1992). The estuary is framed by an archipelago to the east and by land to the west and has a basin-like bottom topography (Brydsten, 1992, Fig. 1). The southern outlet of the Öre Estuary is relatively wide at its surface but narrows at water depths > 20 m (Brydsten, 1992; Malmgren and Brydsten, 1992). A small elevation at 25–30 m water depth separates the estuarine bottom waters from the open sea (Brydsten, 1992, Fig. 1). The water column of the estuary is oxic throughout the year, with concentrations ranging from ∼250 µmol L−1 in summer to ∼450 µmol L−1 in spring (DBotnia, 2016; SMHI, 2003). The estuarine soft sediments (21 km2) consist of silts as well as non-permeable very fine and fine sands (Hellemann et al., 2017).
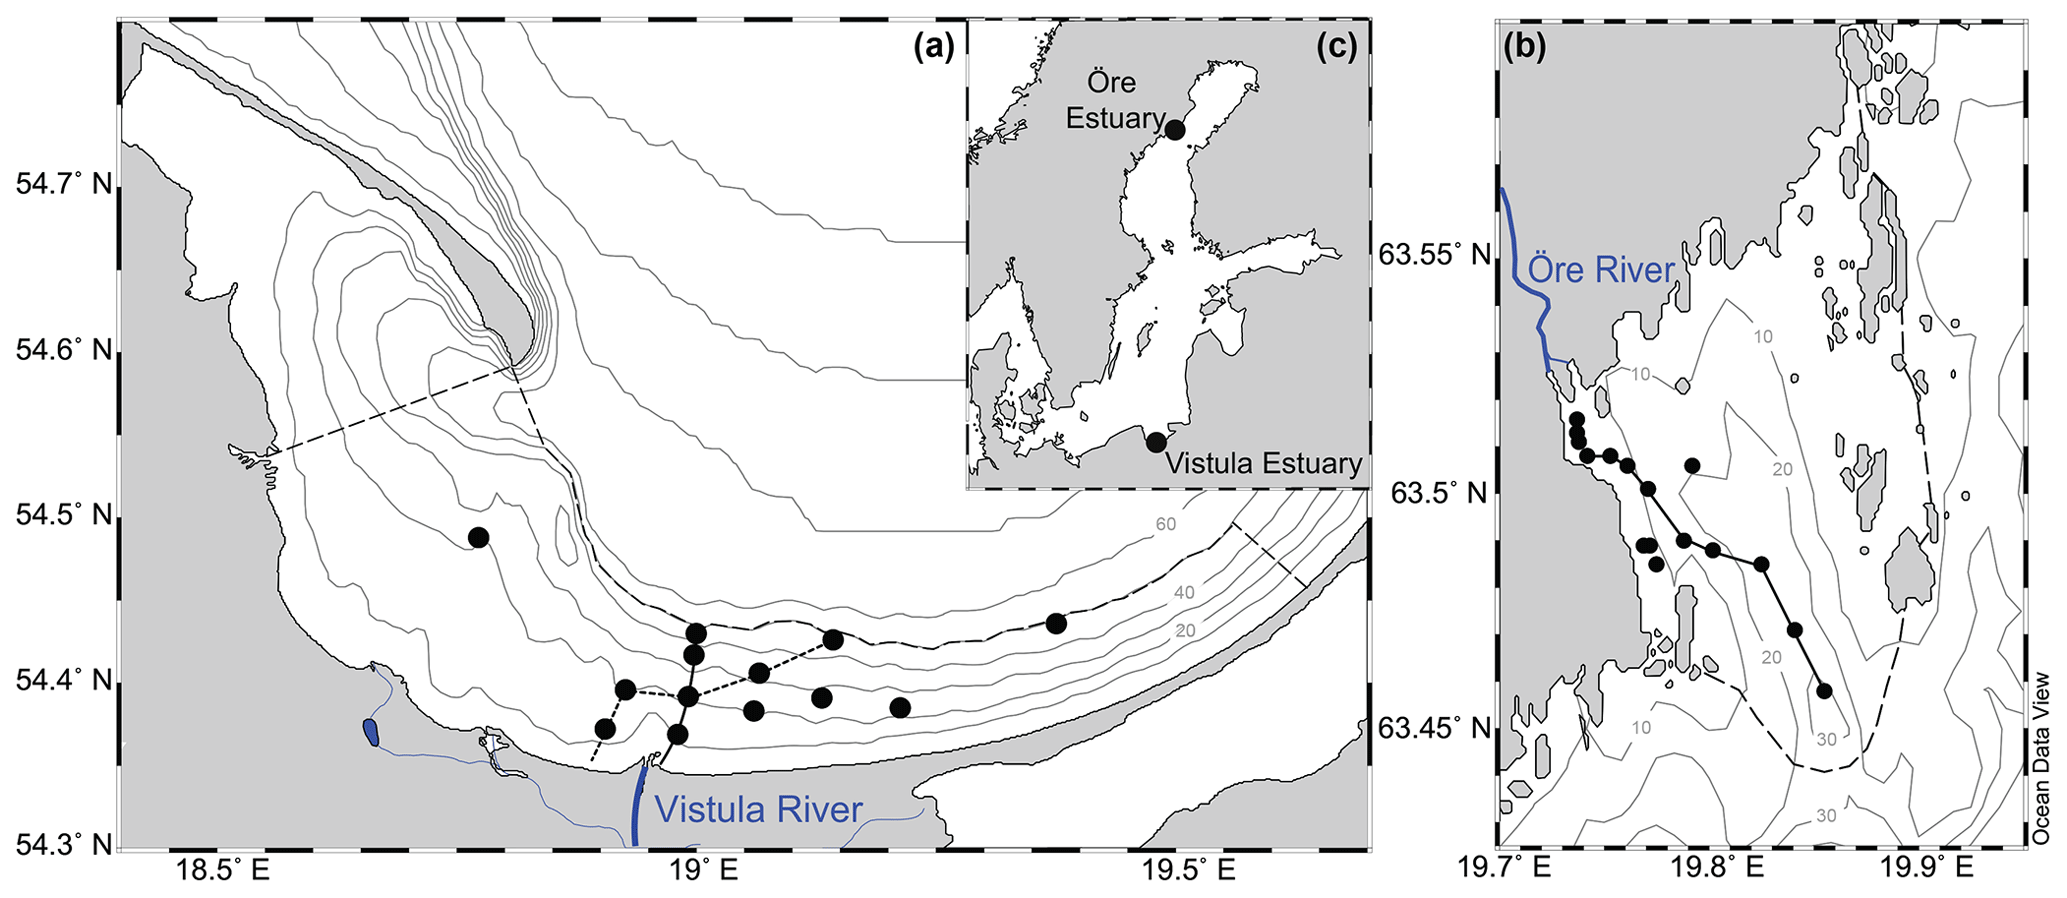
Figure 1Map showing the locations of the Vistula Estuary (a) and Öre Estuary (b) in the Baltic Sea (c). The boundaries of the estuaries are indicated by the dashed lines (see Sect. 2.1 for details). Lines along the station points represent the transects shown in Figs. 2 and 3. Vistula Estuary: VEI (solid line); VEII (dotted line).
The Vistula Estuary (VE), part of the Bay of Gdánsk in the southern Baltic Sea (Fig. 1), covers an area of ∼825 km2, and has a volume of ∼20 km3. It receives inputs from the Vistula River, whose mean discharge of 1081 m3 s−1 can result in a river plume of 0.5–12 m vertical and 4–30 km horizontal extent (Cyberska and Krzyminski, 1988). Due to the absence of topographical restrictions, the Vistula Estuary merges freely with the adjacent coastal and offshore waters of the Bay of Gdánsk (Fig. 1). It can nevertheless be distinguished from adjacent offshore waters at ∼50 m water depth, where the sediment changes from sand to silt and the isotopic signature of N in the sediment changes from anthropogenic to marine sources (Thoms et al., 2018; Fig. 1). The water column of the Vistula Estuary is oxic throughout the year albeit with small seasonal differences (∼380 µmol L−1 in spring and ∼240 µmol L−1 in summer; Bartl et al., 2018). Under specific conditions, such as floods or high respiration rates during stagnant stratification, coastal hypoxia may develop (Conley et al., 2011; Hansson et al., 2011). This did not happen during the cruises of this study.
Water and sediment samples from both estuaries were taken in spring and summer during four campaigns in 2014–2016 with the RV Lotty (ÖEI, ÖEII) and RV Elisabeth Mann Borgese (VEI, VEII; Table 1). Water samples were obtained at three to six depths, from the surface (0–2.5 m) to the bottom, using either a rosette water sampler (5 L) connected to a conductivity–temperature–depth probe (CTD; VE) or Niskin bottles (5 L or 10 L; ÖE) after the CTD cast. From the river plumes, surface water was occasionally sampled with a bucket (0 m). Water samples from immediately above the sediment (20–40 cm) were taken from the overlying water of intact sediment cores. To assign bottom water and core water samples to the BBL, the vertical BBL extent was identified based on the change in the potential density over the change in depth (Supplement Fig. S1). Since turbulent boundary layer flow leads to a constant potential density within the BBL (Turnewitsch and Graf, 2003), the vertical extent of the BBL is defined as the uppermost point in the water column (viewed from the sediment surface) where the variation in potential density exceeds a threshold of 0.01 kg m−3 (Holtermann and Umlauf, 2012). In the Vistula Estuary, the vertical BBL extent was 3.2±1.1 m in spring and 3.4±1.4 m in summer (Bartl et al., 2018), and in the Öre Estuary, it was 2.9±0.6 m and 1.9±0.6 m, respectively (Supplement Table S2). Sediment samples were collected using a Gemini twin corer (core inner diameter 8 cm, length 80 cm; silt, ÖE), a multi-corer (core inner diameter 10 cm, length 60 cm; silt and fine sand, VE), and a HAPS bottom corer (core inner diameter 14 cm, length 30 cm; sand, all campaigns) with a vibration unit (KC Denmark; vibration time 10–15 s). Surface sediment slices (0–2 cm) were taken for basic sediment characteristics. Subsamples for N2 production measurements (n=12 per station, except VEI: n=20) and pore-water oxygen profiles (n=3 per station) were collected in acrylic cores (inner diameter 2.3 cm, length 15 or 20 cm). The cores were pushed gently into the sediment so that 30 % (silt) to 50 % (sand) of their volume was filled with sediment, the remaining volume consisting of overlying water, and they were closed without a gas headspace.
2.2 Environmental data
2.2.1 Water column
Water column measurements were carried out with CTD probes (VE: SBE911plus; ÖEI: SBE19plus; ÖEII: SBE19plus V2; all Seabird Scientific), equipped with either an additional sensor for dissolved oxygen (SBE43, Seabird-Scientific, VE) or a separate oxygen optode (4330, Aanderaa) attached to a second CTD probe (Seaguard Aanderaa, ÖE). Dissolved oxygen in the overlying core water was determined via Winkler titration (Grasshoff et al., 1999). Concentrations of dissolved inorganic N species (, , , µmol L−1, with the sum defined as DIN) were measured colorimetrically using a continuous segmented flow analyser (QuAAtro, Seal Analytical; ÖE) following Grasshoff et al. (1999) and HELCOM guidelines (2014) or as described in Bartl et al. (2018; VE). Background subtraction of the colorimetric signals in Öre Estuary samples was used to account for the high dissolved organic matter content colouring the water. Concentrations of chlorophyll a (Chl a, µg L−1) were measured using an optical sensor (Cyclops 7, Turner Designs) attached to a CTD probe (Seaguard, Aandeera; ÖE) and by high-performance liquid chromatography (Lumi Haraguchi, unpublished data; ÖE) or according to the fluorometric method (Edler, 1979; Wasmund et al., 2006, VE). Particulate organic nitrogen and carbon concentrations (PON, POC; µmol L−1) and the natural isotopic composition of POC (δ13C-POC; ‰) were measured using a continuous-flow isotope ratio mass spectrometer (IRMS; Delta V Advantage, Thermo Fisher Scientific) as described in Hellemann et al. (2017; ÖE) and Bartl et al. (2018; VE). The contribution of different POM sources to the total estuarine POM pool was estimated using a two-component mixing model (Goñi et al., 2003; Jilbert et al., 2018) with terrestrial POM (C:N of 20) and phytoplankton-derived POM (C:N of 8) as end members (Hellemann et al., 2017). Since high C:N ratios can also indicate degraded POM due to the preferential utilisation of PON over POC (Savoye et al., 2003), δ13C-POC values were used to distinguish between terrestrial (δ13C-POC < −28 ‰ in Baltic rivers; Maksymowska et al., 2000; Rolff and Elmgren, 2000) and degraded POM. The degradation state of POM was analysed based on the mass ratio of POC:Chl a (µg µg−1) and the molar ratio of particulate C:N (µmol µmol−1), both of which increase simultaneously during degradation (Savoye et al., 2003). POC:Chl a ratios < 200 indicate newly produced phytoplankton POM, and those > 200 indicate degraded POM (Cifuentes et al., 1988).
2.2.2 Sediment
Sediments were characterised by grain size distribution, porosity, and loss on ignition (LOI), using standard methods as described in Hellemann et al. (2017; ÖE) and Thoms et al. (2018; VE). Permeability (Km) of the sandy sediments was analysed according to the constant head method as described in Hellemann et al. (2017). Sediments with Km ≥ 2.5 × 10⁻¹² m2 were considered sufficiently permeable to enable advective pore-water flow with significant effects on sediment biogeochemistry in the Baltic Sea, while in sediments with m2 these effects were shown to be negligible and the sediments were hence defined as non-permeable (Forster et al., 2003). Oxygen pore-water concentration profiles were obtained at in situ temperature using Clark-type microelectrodes (ÖE, VEI: 200 to 250 µm vertical resolution, OX-100; VEII: 500 µm vertical resolution, OX-250; all Unisense) as described in Hellemann et al. (2017). The oxygen penetration depth (OPD) in the sediment was determined from each profile with the sediment surface identified by a characteristic break in the profile curve and by additional visual estimates. Profiles affected by fauna were discarded (max. 12 %–16 %). Samples for the determination of pore-water concentrations were taken from intact sediment cores, either by core slicing (resolution: 1 cm) under N2 atmosphere followed by centrifugation and filtration (fine silts ÖE) or according to Thoms et al. (2018) using Rhizons™ (Rhizosphere Research Products; resolution: 1 cm at 1 to 5 cm depth, 2 cm at 5 to 11 cm depth; coarse silts and fine sands ÖE). Pore-water samples were immediately frozen and kept at −20 ∘C until colorimetric measurement (Grasshoff et al., 1999), either manually, using a spectrophotometer (UV-Vis 1201 LAMBDA2, Shimadzu, accuracy 5 %; fine silts ÖE), or automated, using a continuous segmented flow analyser (QuAAtro, Seal Analytical, accuracy 5 %–10 %; coarse silts and fine sands ÖE). Pore-water concentrations from the Vistula Estuary are reported in Thoms et al. (2018). The concentrations were vertically integrated for the surface (0–2 cm) and subsurface (2–10 cm) sediment layers to yield total pools of pore-water (µmol m−2; Table 3).
2.3 Quantification of N-transformation processes
2.3.1 Nitrification and ammonium assimilation rates in the BBL
Nitrification and ammonium assimilation were determined in 15N- tracer incubations (Damashek et al., 2016; Ward, 2011). Water samples were collected from the bottom water and the sediment overlying core water and processed as described by Bartl et al. (2018). Briefly, six polycarbonate bottles were filled with water (core water: 170 mL, except VEII 100 mL; bottom water: 625 mL) and sealed gas-tight. The samples were amended with 15N−NH4Cl (98 atom % 15N, Sigma Aldrich) to yield a sample enrichment of 0.05 µmol L−1 (ÖE, VEI) or 0.20 µmol L−1 (VEII). Three samples were filtered immediately through pre-combusted glass-fibre filters (GF/F Whatman, 3 h at 450 ∘C), while the remaining triplicates were incubated for 5–7 h (ÖE, VEI) or 3 h (VEII) in the dark at in situ temperature. The short incubation time minimised isotope dilution via ammonification during the incubation (Ward, 2011). The incubation was terminated by filtration, and both the filtrates and the filters were stored at −20 ∘C. The 15N content of in the filtrate was measured according to the denitrifier method (Casciotti et al., 2002; Sigman et al., 2001), using a continuous-flow IRMS (Delta V Advantage, Thermo Fisher Scientific) connected to a Finnigan GasBench II (calibration against the standards IAEA-N3 and USGS-34; accuracy: ±0.14 ‰). Nitrification rates were calculated according to Veuger et al. (2013). Since the 15N content of both and is measured simultaneously, the calculated nitrification rate is a bulk rate that includes oxidation and oxidation. The concentration and 15N content of PON was measured from the filters as described by Bartl et al. (2018) using the same continuous-flow IRMS. Ammonium assimilation rates were calculated according to Dugdale and Wilkerson (1986).
2.3.2 Gaseous N production in the sediment
Benthic N2 and N2O production was measured using the revised isotope pairing technique (r-IPT; Risgaard-Petersen et al., 2003), which accounts for the contributions of denitrification and anammox to total N2 production. All non-permeable sediment samples from the two estuaries were incubated using a diffusive set-up (Fig. S2), in which the overlying water in the acrylic cores was enriched with K15NO3 (98 % 15N, Cambridge Isotope Laboratories) to final concentrations of 40, 80, and 120 µmol L−1 (n=4 per concentration, except n=12 for 120 µmol L−1 VEI; isotope enrichment in the water [Fn]: 84 %–100 %; ÖE, VEI) or 30, 60, 90, and 120 µmol L−1 (n=3 per concentration; Fn: 86 %–100 %; VEII). Subsequently, the samples were incubated in the dark for 3–5 h at in situ temperatures under gentle water mixing by magnetic stirrers. The permeable sediment samples of VEII were also incubated this way, since advective pore-water flow was most likely negligible during sampling (see Sect. 4.1.3). The permeable sediment samples of VEI were incubated with an advective set-up, in which bottom water, enriched with K15NO3 (98 % 15N, Cambridge Isotope Laboratories) to final concentrations of 40, 80, and 120 µmol L−1 (n=5–7 per concentration; Fn: 98 %–100 %), was pumped through the advective sediment layer. This layer was determined from previously measured oxygen profiles and used as an approximation of the sediment depth affected by advective pore-water flow (Gihring et al., 2010; Fig. S2). The pumping rate (0.25 mL min−1; IPC high-precision tubing pump, ISMATEC) at site-specific porosities led to pore-water velocities of ∼7.6 cm h−1. The 15N--enriched water was pumped from the top into the acrylic cores and drawn out of the cores through pre-drilled holes at two opposing core sides (vertical resolution 5 mm). This outflow was adjusted in each core to ∼5 mm above the approximated oxic–anoxic interface in the sediment to ensure that the flow reached the interface where denitrification occurred but did not affect deeper layers. In- and outflow ports were sealed with rubber plugs through which Tygon® tubing (ST R-3603/R-3607; inner diameter 2.3 mm) was inserted; all connecting interfaces were tightened with Teflon® tape. During a pre-incubation (2.5–3 h), all resident pore water in contact with the estimated advective sediment layer was exchanged with 15N--enriched water. Subsequently, one core per concentration was sampled to obtain the start values, while the tubing of the remaining cores was connected to a closed circulation for each core and incubated for ∼5 h (Fig. S2). Incubations were stopped by gently mixing the sediment with the overlying water. After brief sediment settling, 12 mL subsamples were placed into gastight glass vials (Exetainer, Labco Scientific) with 0.5 mL of ZnCl2 (100 % w∕v, Merck). A 5 mL helium headspace was created and the isotopic compositions of N2 and N2O were analysed using a continuous-flow IRMS (IsoPrime 100, Isoprime; standard gas: N2, > 99.999 % purity, AGA) interfaced with a gas pre-concentrator system (TraceGas, Isoprime) and an automated liquid handler (GX-271, Gilson) at the Department of Environmental Sciences, University of Jyväskylä, Finland (ÖE, VEI) or with a continuous-flow IRMS (Delta V Plus, Thermo Scientific; standard gas: Oztech N2, i.e. δ15N vs. air = −0.61; Oztech Trading Co.) interfaced with a gas bench and a pre-concentrator system (Precon, Thermo Scientific) at the Stable Isotope Facility, University of California, Davies, USA (VEII).
According to the r-IPT, a contribution of anammox to the measured N2 production is indicated when the production rate of 14N-N2 (D14, calculated according to Nielsen, 1992) correlates positively with the added 15N- concentrations. In this case, the calculation of N2 production needs to distinguish between denitrification and anammox rates and follows Risgaard-Petersen et al. (2003). If D14 does not correlate positively with the added 15N- concentrations, denitrification is assumed to be the only process producing N2 and the calculations follow Nielsen (1992). Valid application of the method further requires a linear dependency between the production rate of 15N-N2 (D15) and increasing concentrations. All dependencies were tested with a regression analysis (significance level: p<0.05). Denitrification of from the bottom water (Dw) and from nitrification within the sediment (Dn; coupled nitrification–denitrification) was calculated from D14 and the ratio of 15N- to 14N- in the water phase (Nielsen, 1992; Risgaard-Petersen et al., 2003).
2.4 Statistical analyses
The significance of the differences between the factors “site” (Öre Estuary, Vistula Estuary), “season” (spring, summer), and “sediment type” (permeable, non-permeable) was tested using the non-parametric Mann–Whitney U test (two factors, n≥3) or the non-parametric Kruskal–Wallis (KW) test (> two factors, n≥3) combined with Dunn's post hoc test (all SigmaPlot, version 13.0). Multivariate correlation analyses (Kendall's τ, n≥5) were done between environmental variables and rates of nitrification (ÖEII), ammonium assimilation (ÖEII, VE), and denitrification (ÖEII, VE) using SAS (version 9.4). The ÖEI data could not be analysed in correlation analyses because the sample size was too small (n≤4). In all analyses, the significance level was p < 0.05.
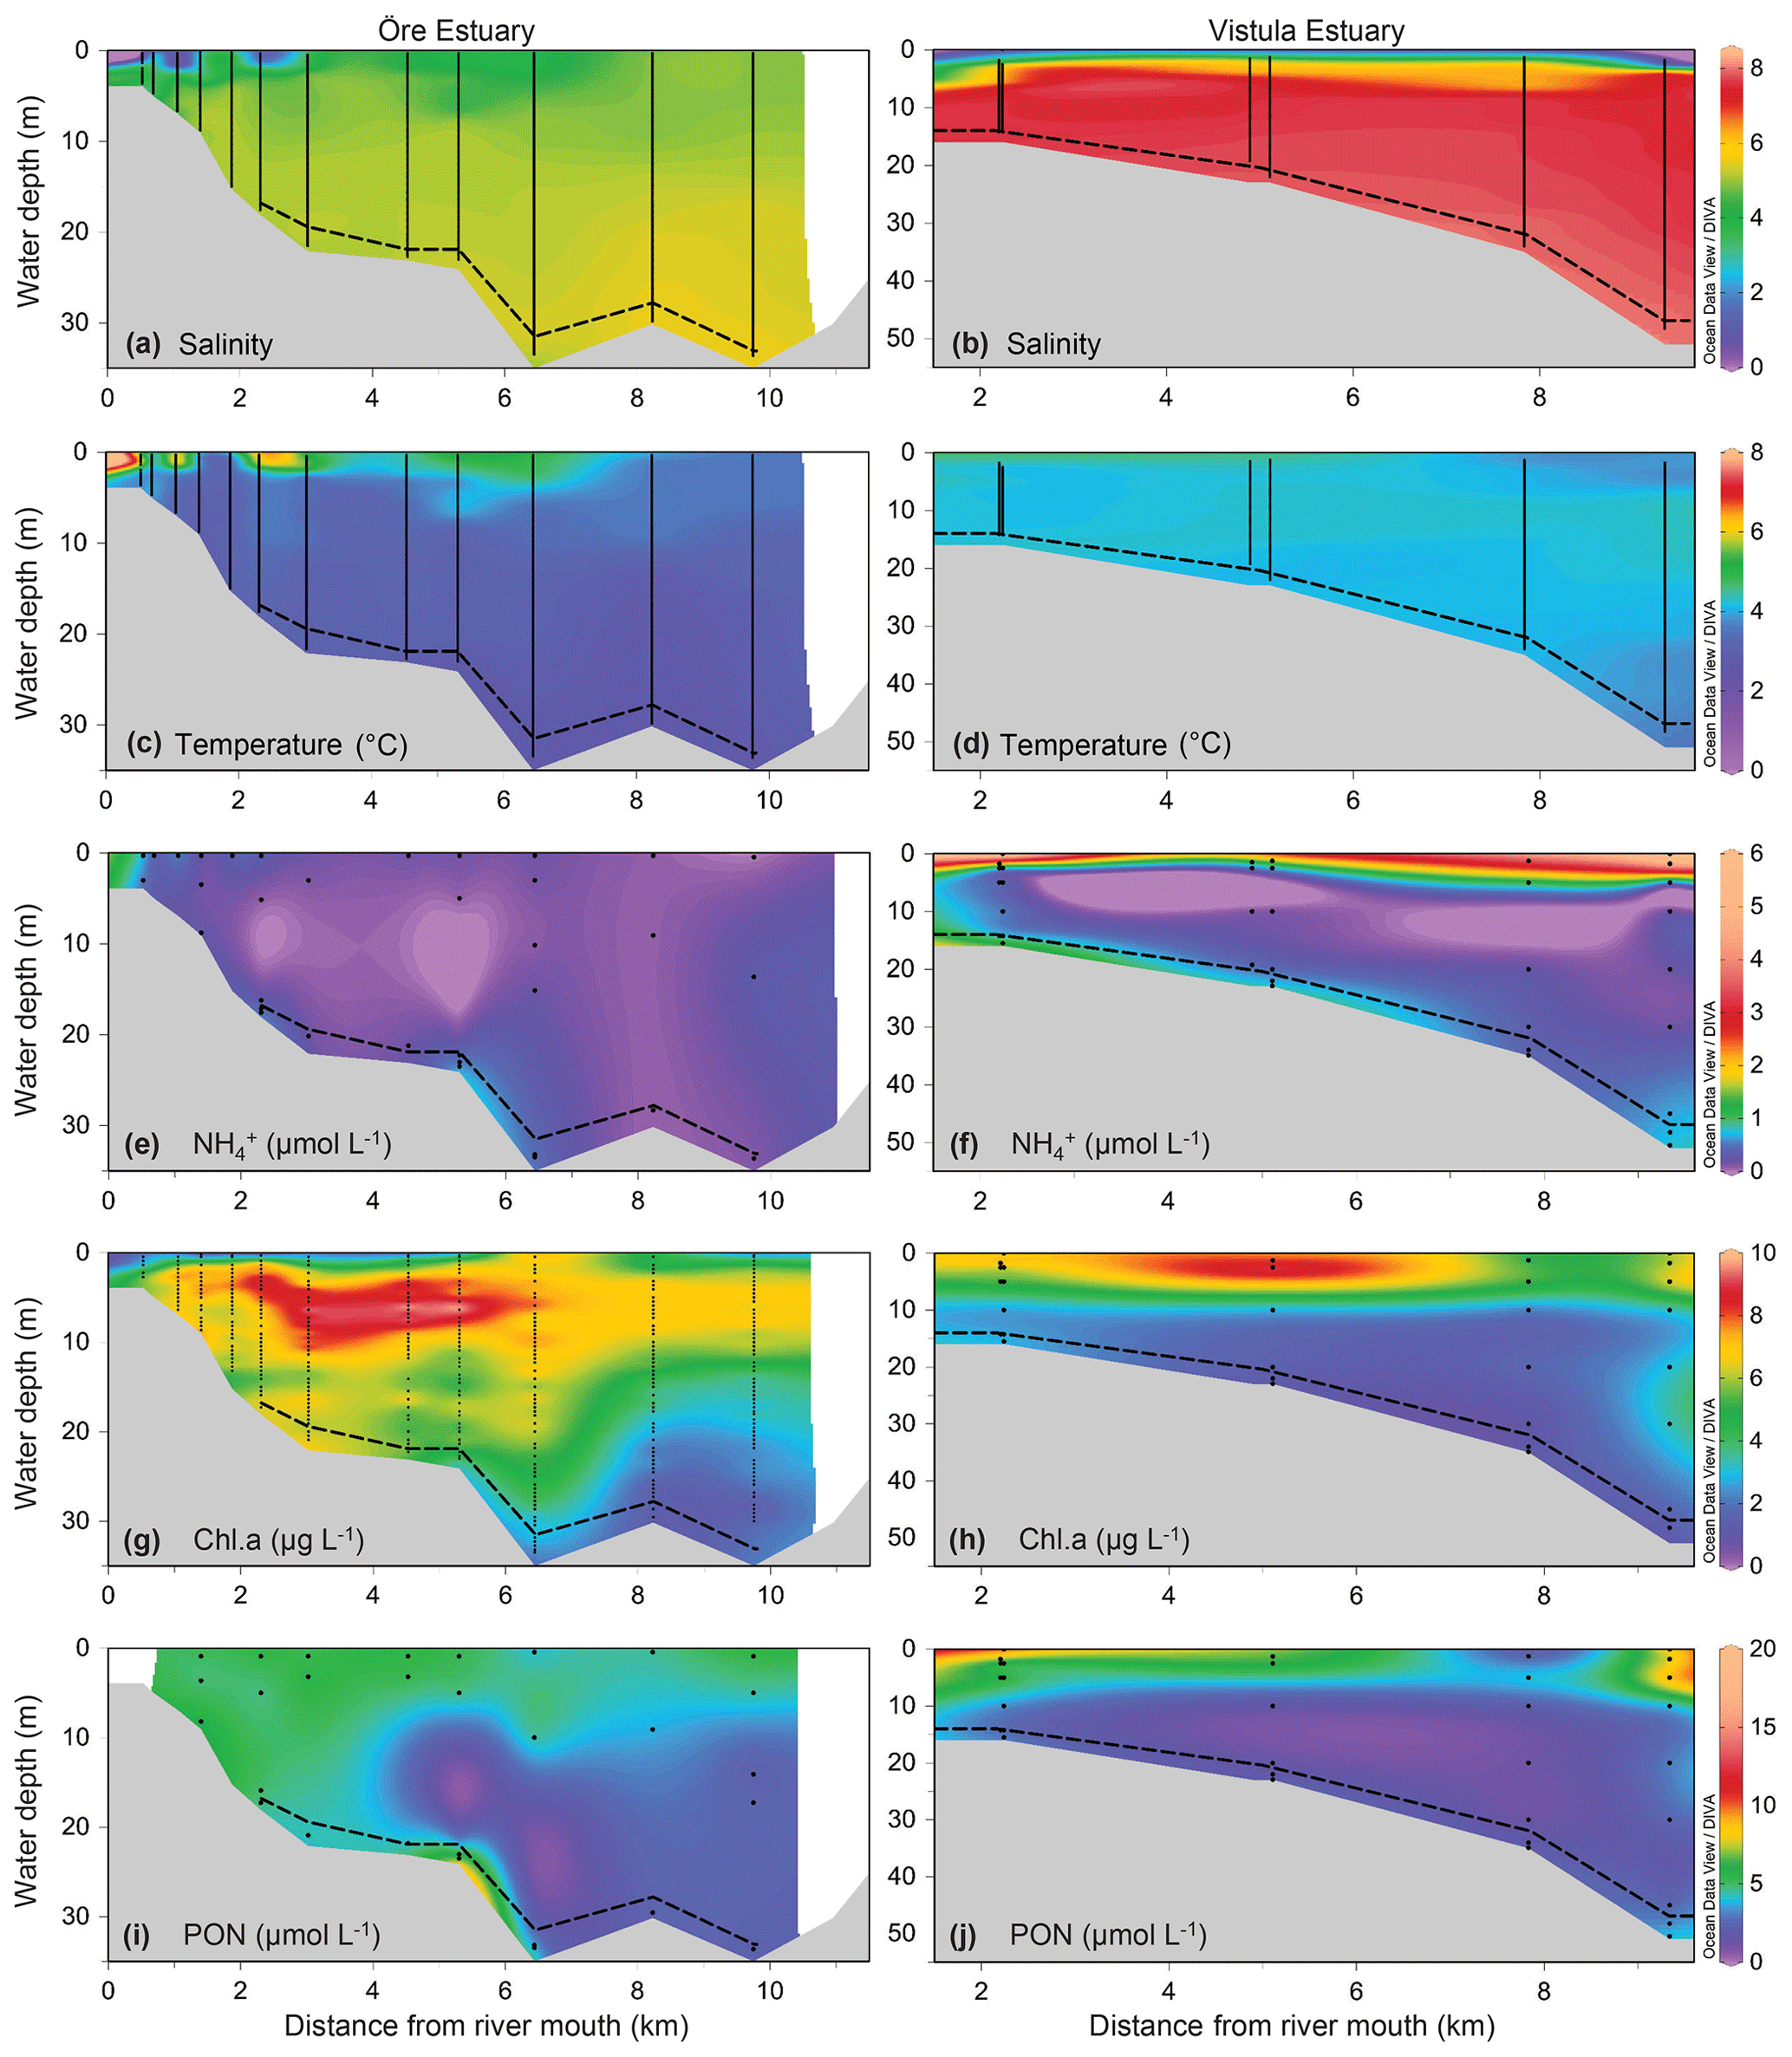
Figure 2Environmental variables of the water column along a sampling transect (vertical points) from the river mouth to the outlets of the Öre (left) and Vistula (right) estuaries in spring. Note that, due to different optical properties of the water and different measurement methods, the Chl a concentrations are not directly comparable between the two estuaries; rather, the figures provide qualitative information on the presence or absence of phytoplankton. Bottom topography was estimated from the water depths of the stations. The dashed line represents the vertical extent of the BBL (see Sect. 2.1.1). The plots were derived from 12 (Öre Estuary) and 6 (Vistula Estuary) profiles using DIVA-gridding in Ocean Data view (Schlitzer, 2015). Plots of salinity, temperature, and PON in the Öre Estuary are reproduced from Hellemann et al. (2017).

3.1 Environmental variables
3.1.1 Water column
The plumes of the Öre and Vistula rivers, extended vertically to ∼2 m (ÖE) and ∼5 m (VE) in spring and to ∼6 m (ÖE) and ∼1 m (VE) in summer (Figs. 2, 3). Horizontally, the river plumes covered up to 50 % of the respective estuarine area (not shown). The water column below the river plumes was well-mixed in spring (Fig. 2) and characterised by a thermohaline stratification in summer (Fig. 3). In both estuaries, oxygen conditions differed seasonally but all water layers were oxic with > 230 µmol L−1 (Table S2). In spring, DIN concentrations were more than 30 times higher in the Vistula than in the Öre River plume and estuarine surface waters, while concentrations in the BBL differed by a factor of 2 (Fig. 2; Table S2). In summer, DIN concentrations were < 2.0 µmol L−1 in the river plumes and surface waters and increased with depth in both estuaries (Fig. 3; Table S2). In the BBL of the Öre Estuary, summer concentrations were 2–3 times lower (U test, p<0.001; Fig. 3) and the concentrations 2 times higher (U test, p<0.001; Table S2) than in the Vistula Estuary. The concentrations of POC and PON were similar in both estuaries in spring, but summer concentrations in the surface water were twice as high in the Vistula Estuary compared to the Öre Estuary (U test, p=0.002). In the BBL, POC and PON concentrations were significantly higher in summer than in spring (ÖE: U test, p=0.037; VE: Bartl et al., 2017; Table 2), whereby summer concentrations were more than 2-fold higher in the Öre than in the Vistula Estuary (POC: U test, p=0.040; PON: U test, p=0.048; Fig. 3; Table 2).
Table 2Characteristics of particulate organic matter in the Öre and Vistula estuaries in spring and summer. The contribution of POM sources (terrestrial and phytoplankton) was estimated based on a two-component mixing model following Jilbert et al. (2018), using end members from Goñi et al. (2003). Values are average and standard deviation of each water layer. The number of replicates is shown in parentheses; NA – not available.
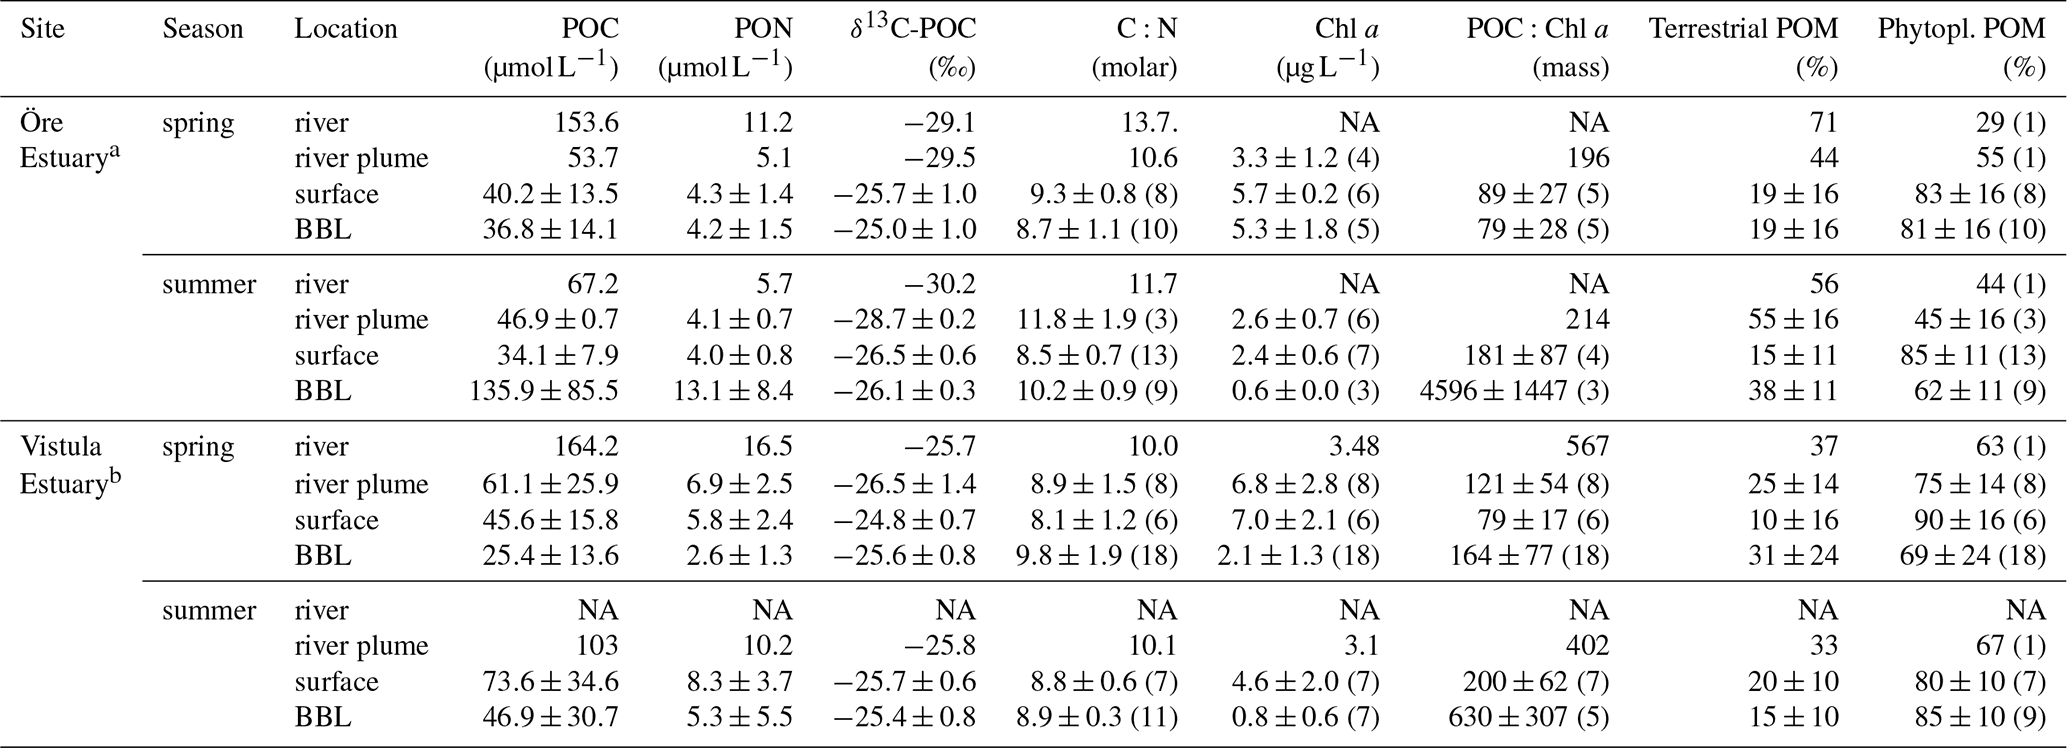
a POC, PON, δ13C-POC, C:N, terrestrial POM, and phytoplankton POM from Hellemann et al. (2017). b POC, PON, and C:N from Bartl et al. (2018).
Table 3Sediment characteristics in the Öre and Vistula estuaries in spring and summer. Permeability (Km), porosity (ϕ), and loss on ignition (LOI) are determined from the pooled surface sediment (0–2 cm); pools are derived from vertically integrated pore-water concentrations over the surface (0–2 cm) and the subsurface (2–10 cm) sediment layer; oxygen penetration depth (OPD) is derived from oxygen profiles. All data are given as average and standard deviation (except for bottom depth), with the number of replicates in parentheses.
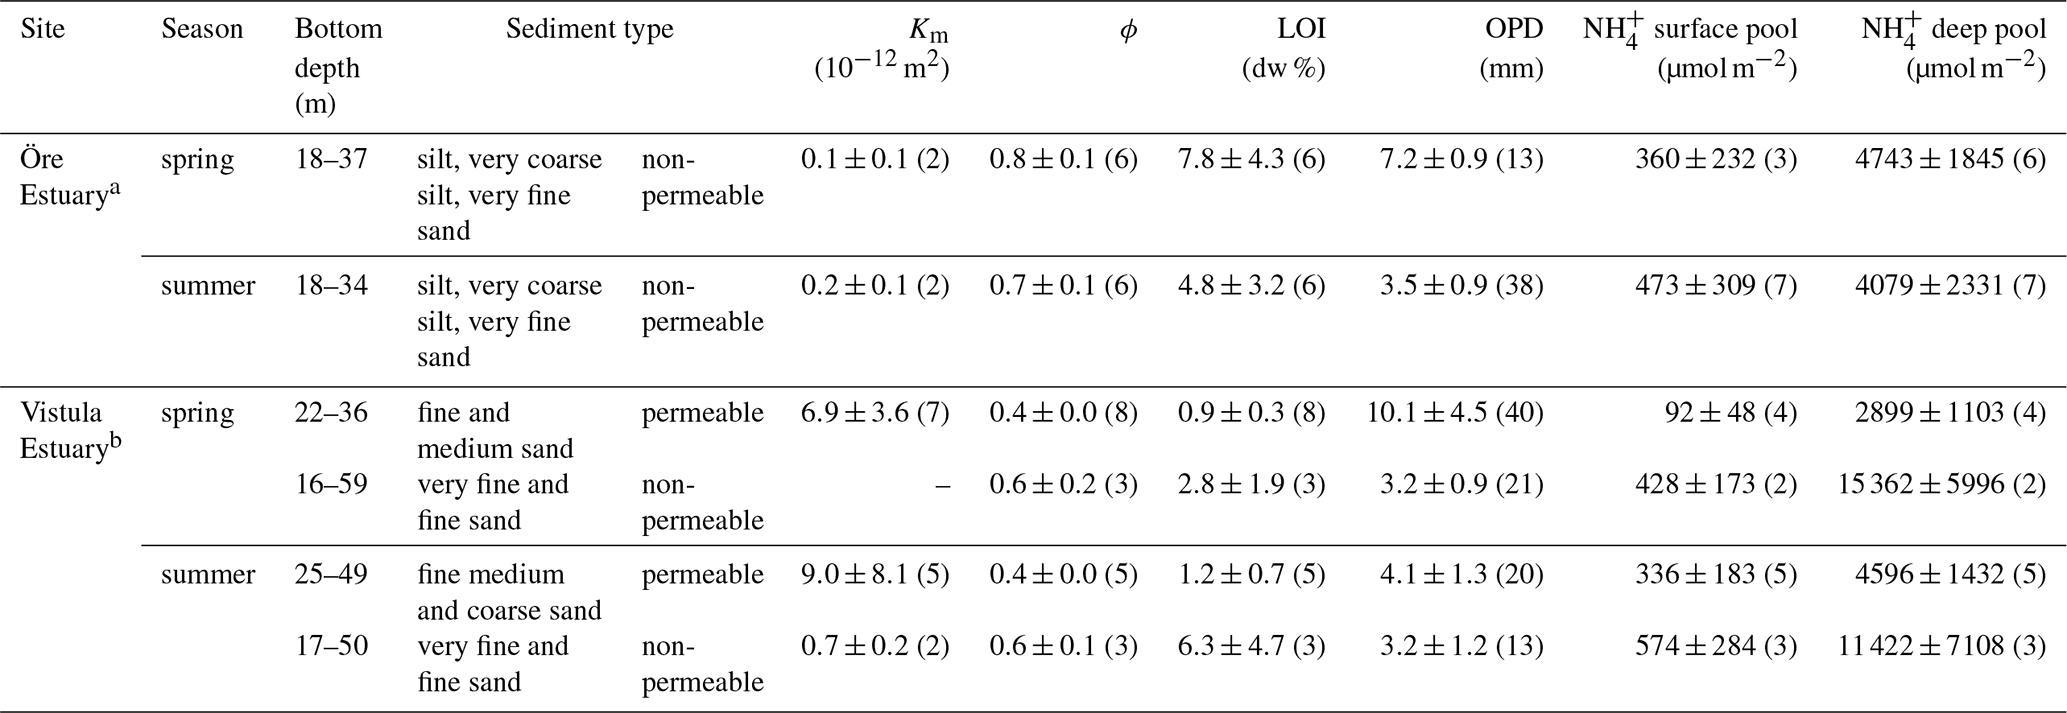
a Data from Hellemann et al. (2017), except pools. b Sediment type, porosity, and LOI from Thoms et al. (2018).
The POM of the Öre River and its plume contained a large share of terrestrial organic matter in both seasons, as reflected by the high C:N ratios and depleted δ13C-POC values (Table 2). By contrast, in the Vistula River and its plume, POM was mainly phytoplankton-derived (Table 2). In the estuarine water column (river and river plume excluded) phytoplankton-derived POM dominated in both estuaries and in both seasons (Table 2), which was also reflected in the elevated Chl a concentrations measured in the entire water column in spring and in the surface water in summer (Table 2; Fig S. 2 and 3). The particulate C:N ratio in the surface water did not differ between estuaries or seasons but was significantly higher in the BBL of the Öre than the Vistula Estuary in summer (U test, p=0.005; Fig. 4, Table 2). In both estuaries, POC:Chl a ratios were < 200 throughout the water column in spring and > 200 in the BBL in summer, whereby the summer ratio in the Öre Estuary was 7 times larger than in the Vistula Estuary (Fig. 4, Table 2).
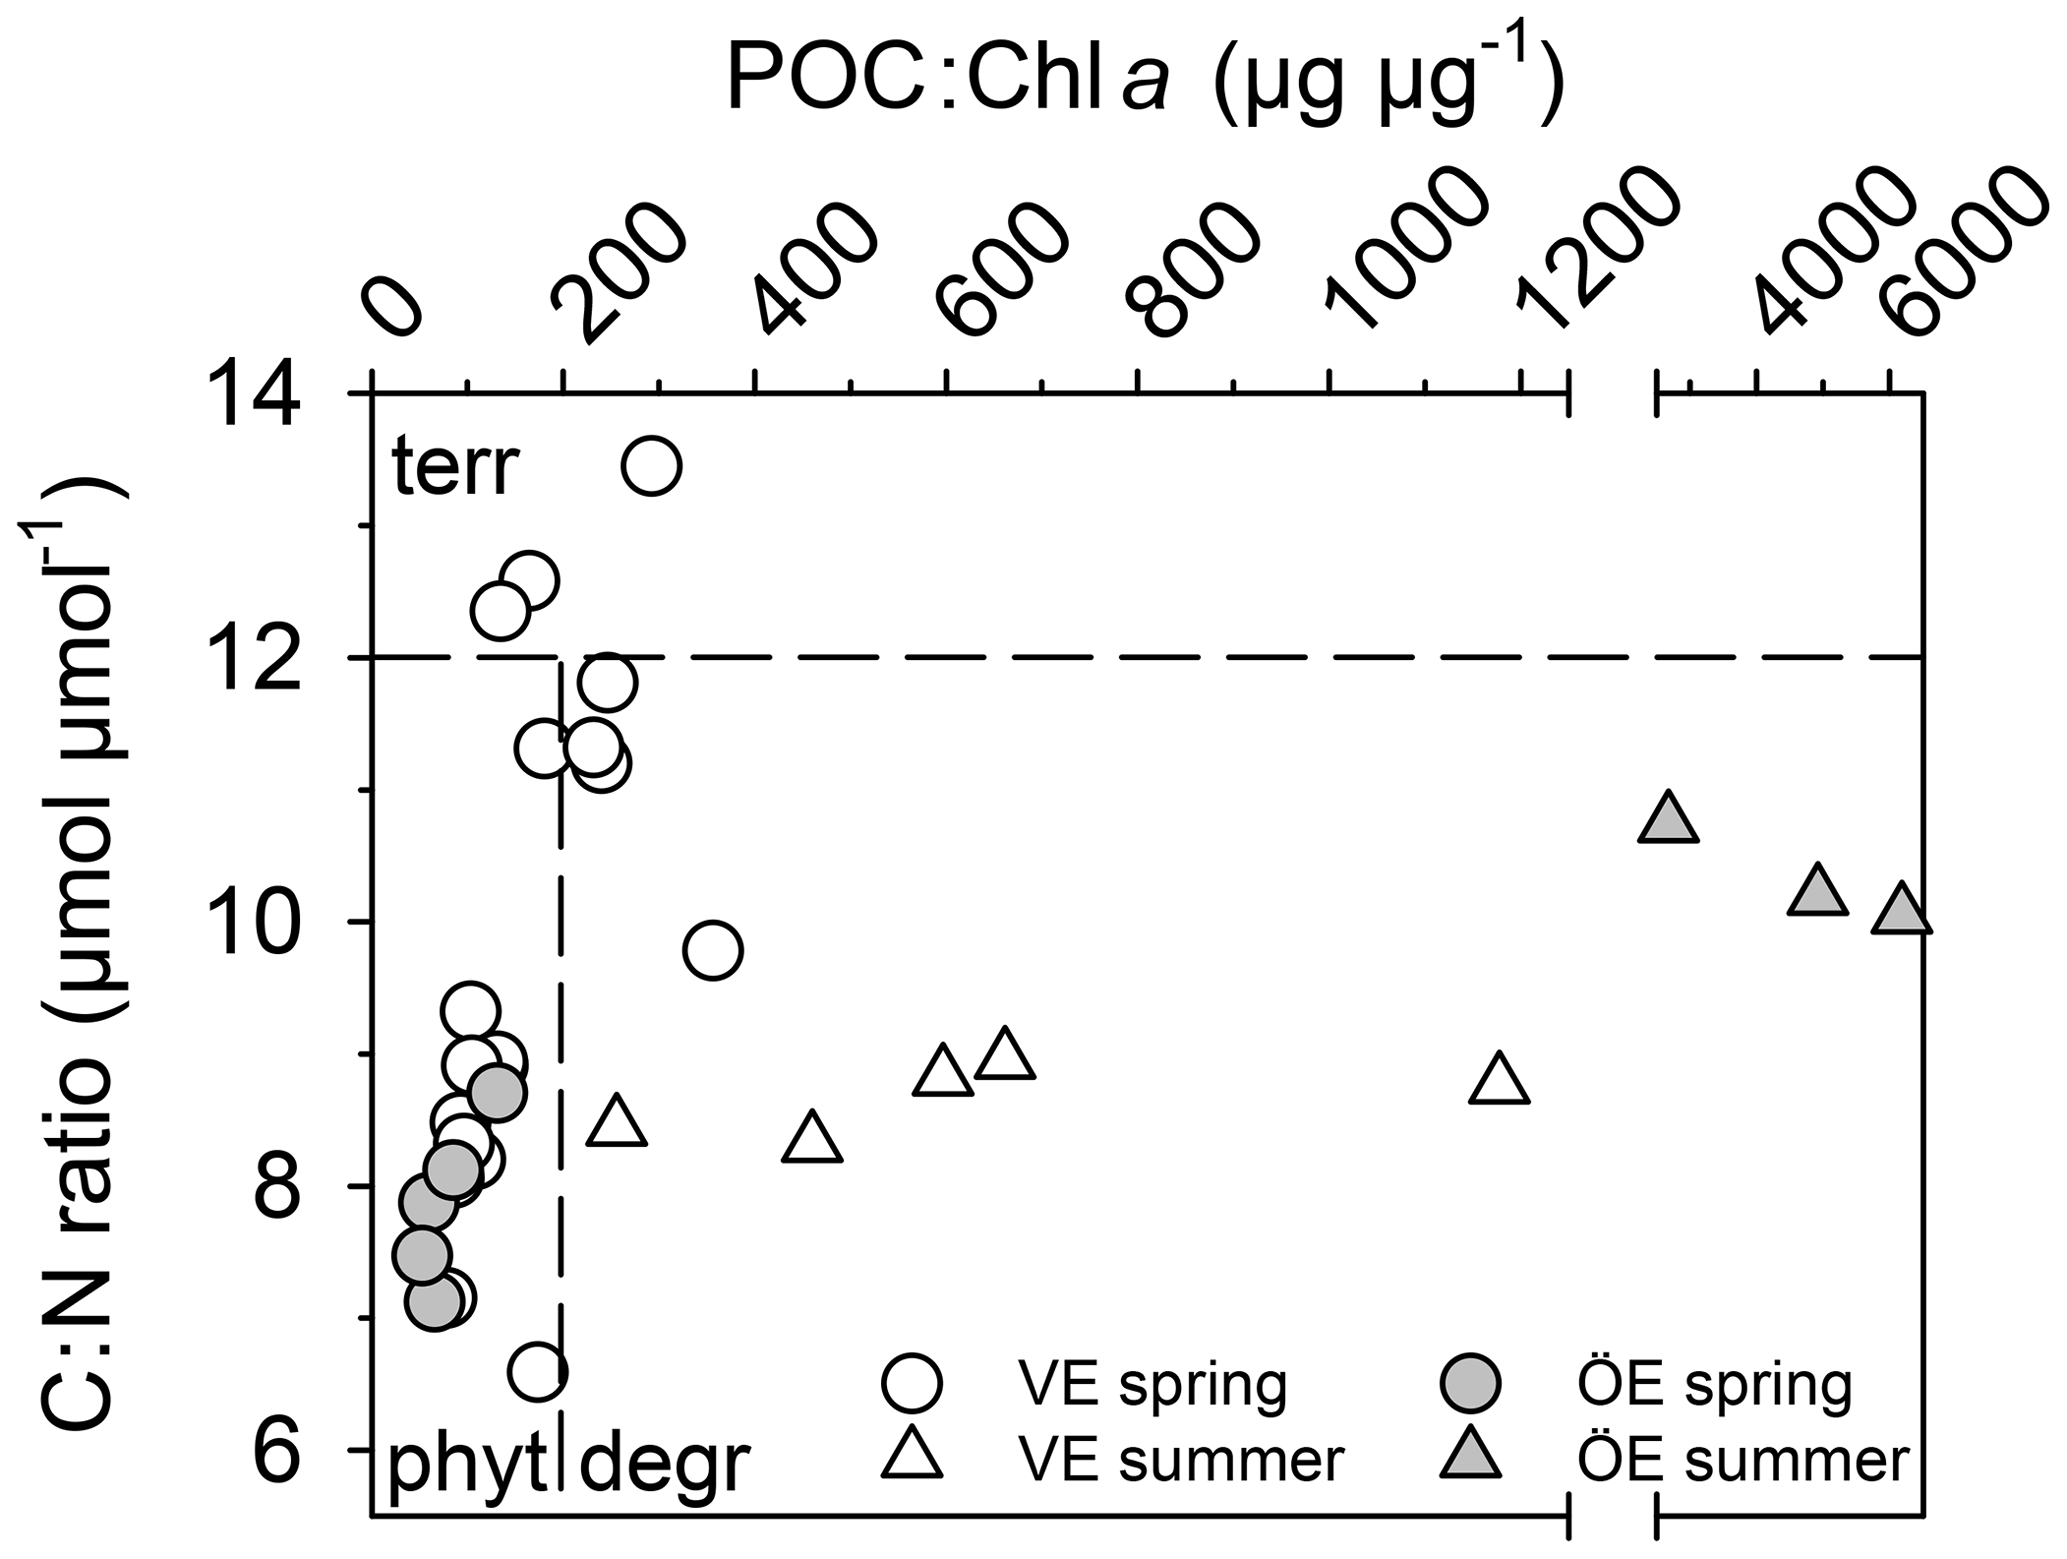
Figure 4Ratio of particulate C:N ratio plotted against the ratio of POC:Chl a in the BBL of the Vistula (VE) and Öre (ÖE) estuaries in spring and summer. According to Savoye et al. (2003), a C:N ratio of > 12 is assigned as terrestrial (terr) particulate organic matter (POM); according to Cifuentes et al. (1988), a POC:Chl a ratio < 200 indicates newly produced phytoplankton POM (phyt), and a ratio of > 200 degraded phytoplankton POM (degr).
3.1.2 Sediment
Permeable sediments were estimated to cover ∼56 % of the Vistula Estuary (Fig. S3), whereas the sediments in the Öre Estuary were non-permeable (Hellemann et al., 2017). LOI differed significantly between permeable and non-permeable sediments (U test, p<0.001) but was similar both between the non-permeable sediments of the two estuaries and between spring and summer (Table 3). The oxygen profiles in the permeable sediments of the Vistula Estuary in spring were sigmoidal, with nearly constant oxygen concentrations in the top millimetres of the sediment, and nearly parabolic in summer, similar to the profiles of the non-permeable sediments in both seasons (Fig. 5). Thus, the mean OPD in the permeable sediments in summer was 60 % lower than in spring (U test, p=0.003) and similar to the summer OPD in the non-permeable sediments (Table 3). In addition, pore-water pools differed seasonally in the permeable surface sediments of the Vistula Estuary, with ∼73 % more in summer than in spring (U test, p=0.016). The deep pool of the non-permeable sediments was significantly higher in the Vistula than in the Öre Estuary (U test, p=0.008) but similar between seasons (Table 3).
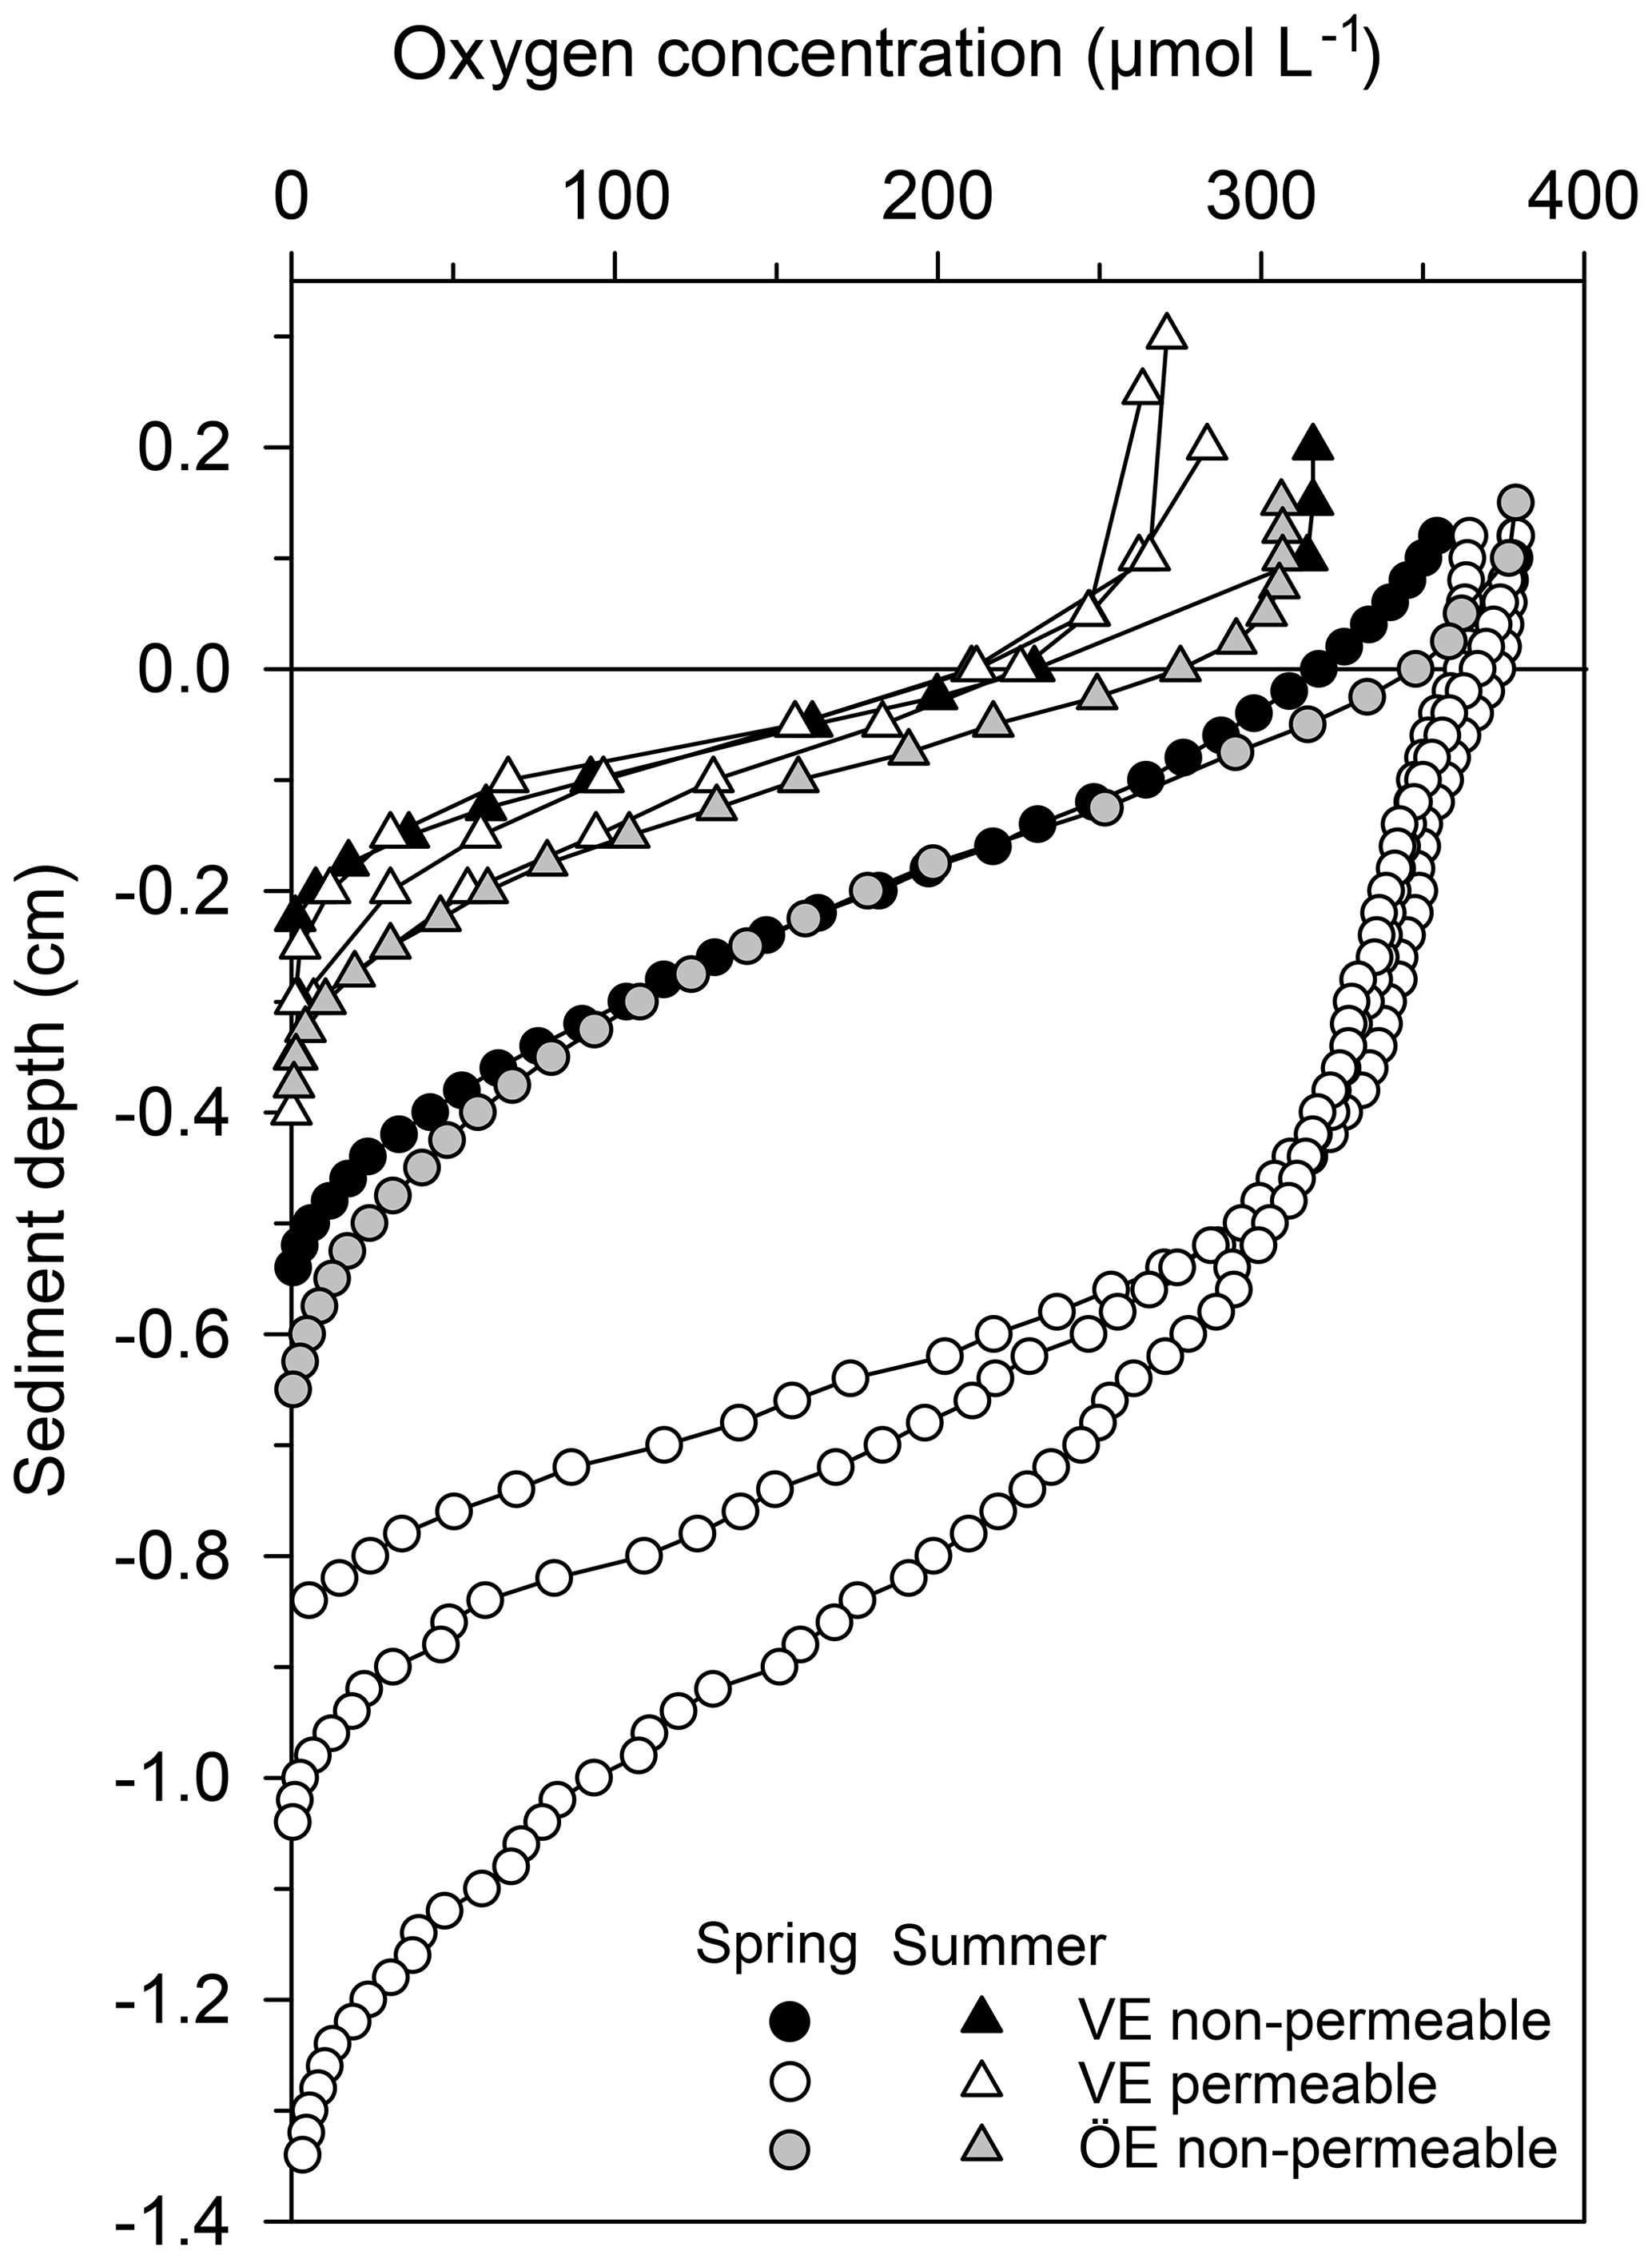
Figure 5Pore-water oxygen concentration profiles in the permeable (n=3) and non-permeable (n=1) sediments of representative stations of the Vistula Estuary (VE) and in the sediments of the Öre Estuary (ÖE, n=1) in spring and summer. Profiles of the Öre Estuary are reproduced from Hellemann et al. (2017); please note that no permeable sediment exists in the Öre Estuary. The zero line indicates the sediment surface.
3.2 Nitrogen transformation processes
3.2.1 Nitrification and ammonium assimilation in the BBL
Nitrification rates did not significantly differ between estuaries or seasons (KW test, p=0.478; Table 4). In both estuaries, the summer nitrification rates correlated positively with the PON and POC concentrations (VE: Kendall's τ: 0.81, p=0.01, n=7 (Bartl et al., 2018); ÖE: Kendall's τ: 0.71, p=0.02, n=7; Fig. 6a). Additionally, a negative trend with the particulate C:N ratio was found for summer nitrification rates in the Öre Estuary (Kendall's τ: −0.53, p=0.10, n=7; Fig. 6b). Ammonium assimilation rates differed seasonally in the Vistula Estuary (spring<summer; U test, p=0.006) but not in the Öre Estuary (Table 4). In spring, these rates were 3 times higher in the Öre than in the Vistula Estuary (U test, p=0.044), while rates from the summer season were similar (Table 4). Ammonium assimilation correlated positively with the PON and POC concentrations in both estuaries (VE: Kendall's τ: 0.61, p=0.02, n=9; ÖE: Kendall's τ: 0.71, p=0.02, n=7; Fig. 6c) and negatively with the particulate C:N ratio in the Öre Estuary in summer (Kendall's τ: −0.71, p=0.02, n=7; Fig. 6d).
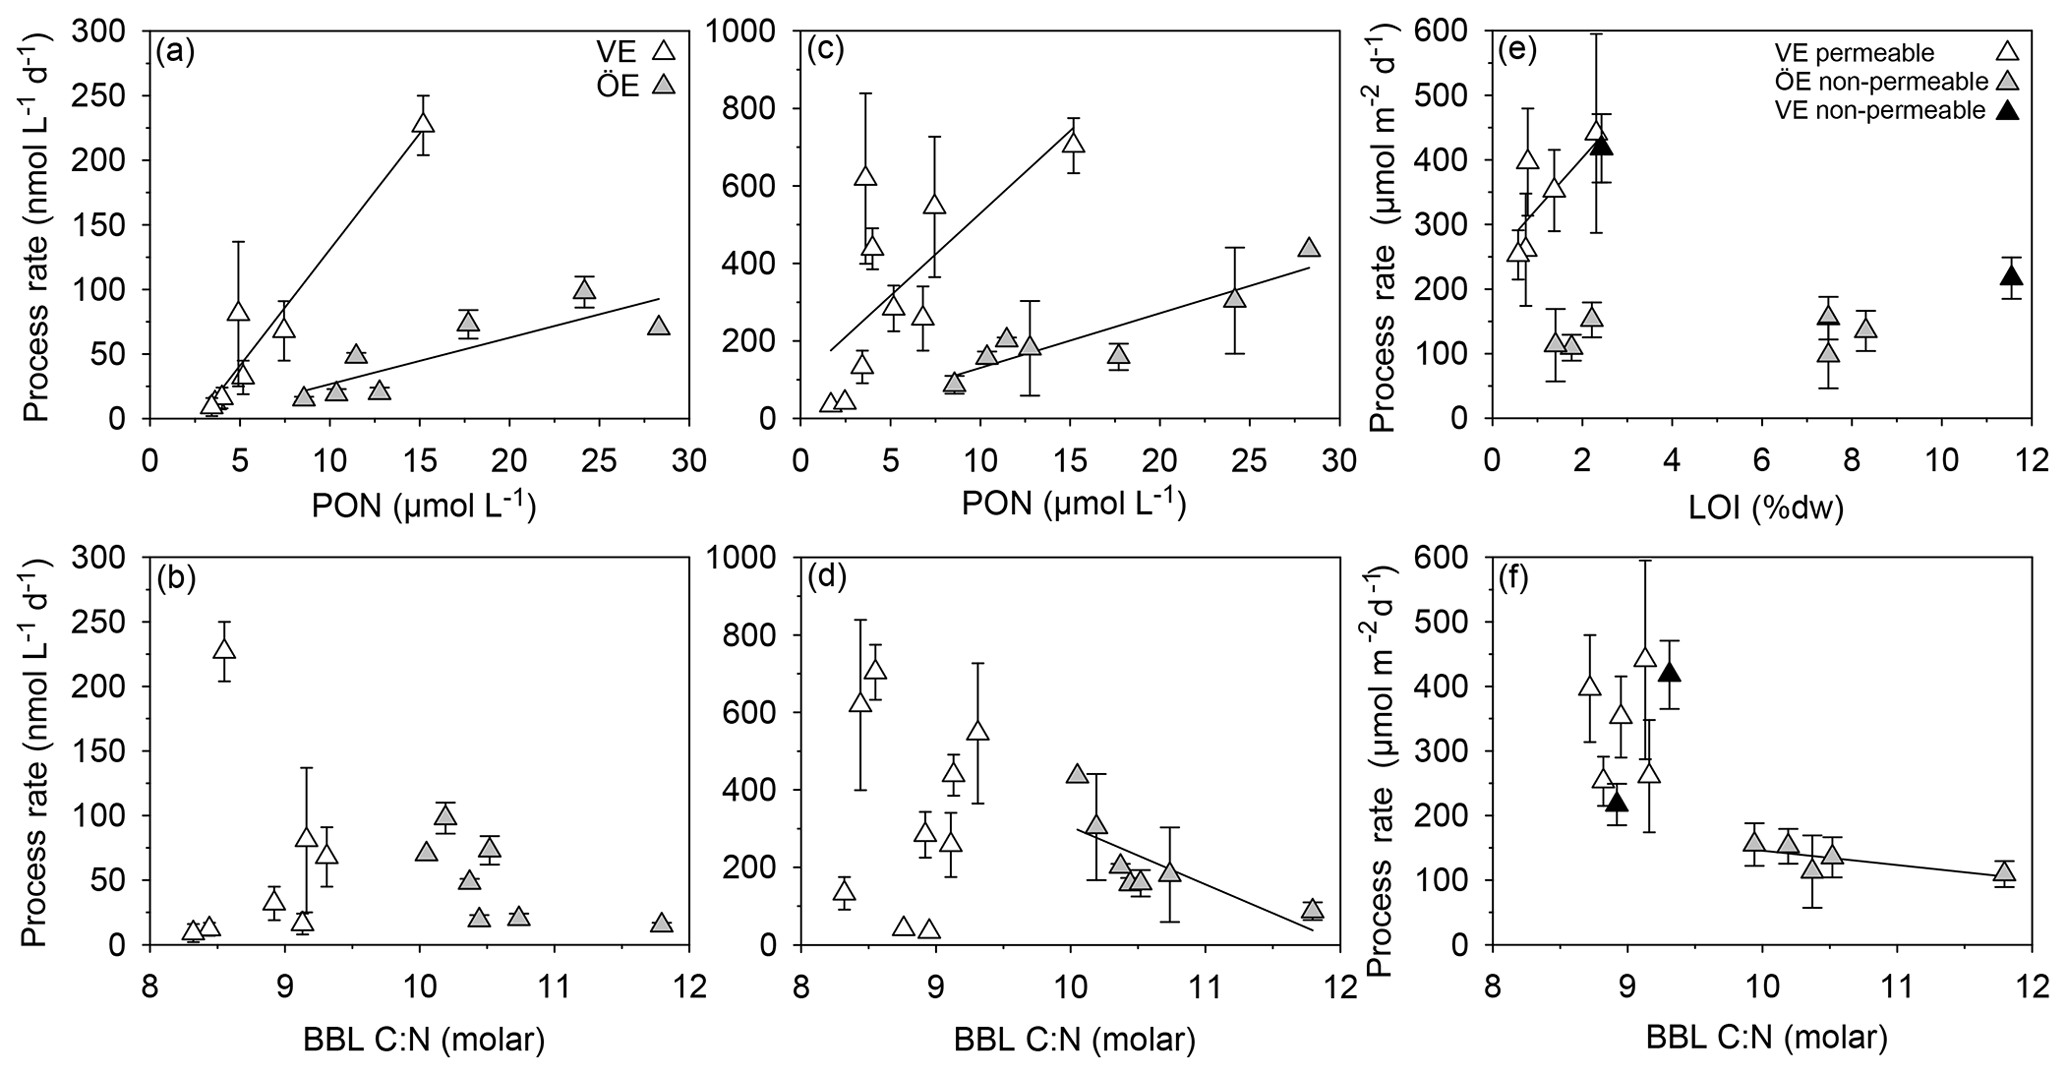
Figure 6Correlations of nitrification rates with the PON concentration (a) and particulate C:N ratio (b) and of ammonium assimilation rates with the PON concentration (c) and particulate C:N ratio (d) in the BBL; coupled nitrification–denitrification rates with LOI (e) and the particulate C:N ratio (f) in the sediment of Vistula (VE) and Öre (ÖE) estuaries. Solid lines indicate significant correlations.
Table 4Rates of ammonium assimilation and nitrification in the BBL and of denitrification in the sediments of the Öre and Vistula estuaries in spring and summer. Öre Estuary sediments are non-permeable; thus no rates are available in the permeable sediments (NA). Denitrification in the Öre Estuary in spring was not detectable (ND). All rates are given as average and standard deviation, with the number of replicates in parentheses; the maximum rate is shown below. %Dn gives the share of coupled nitrification–denitrification in total denitrification.
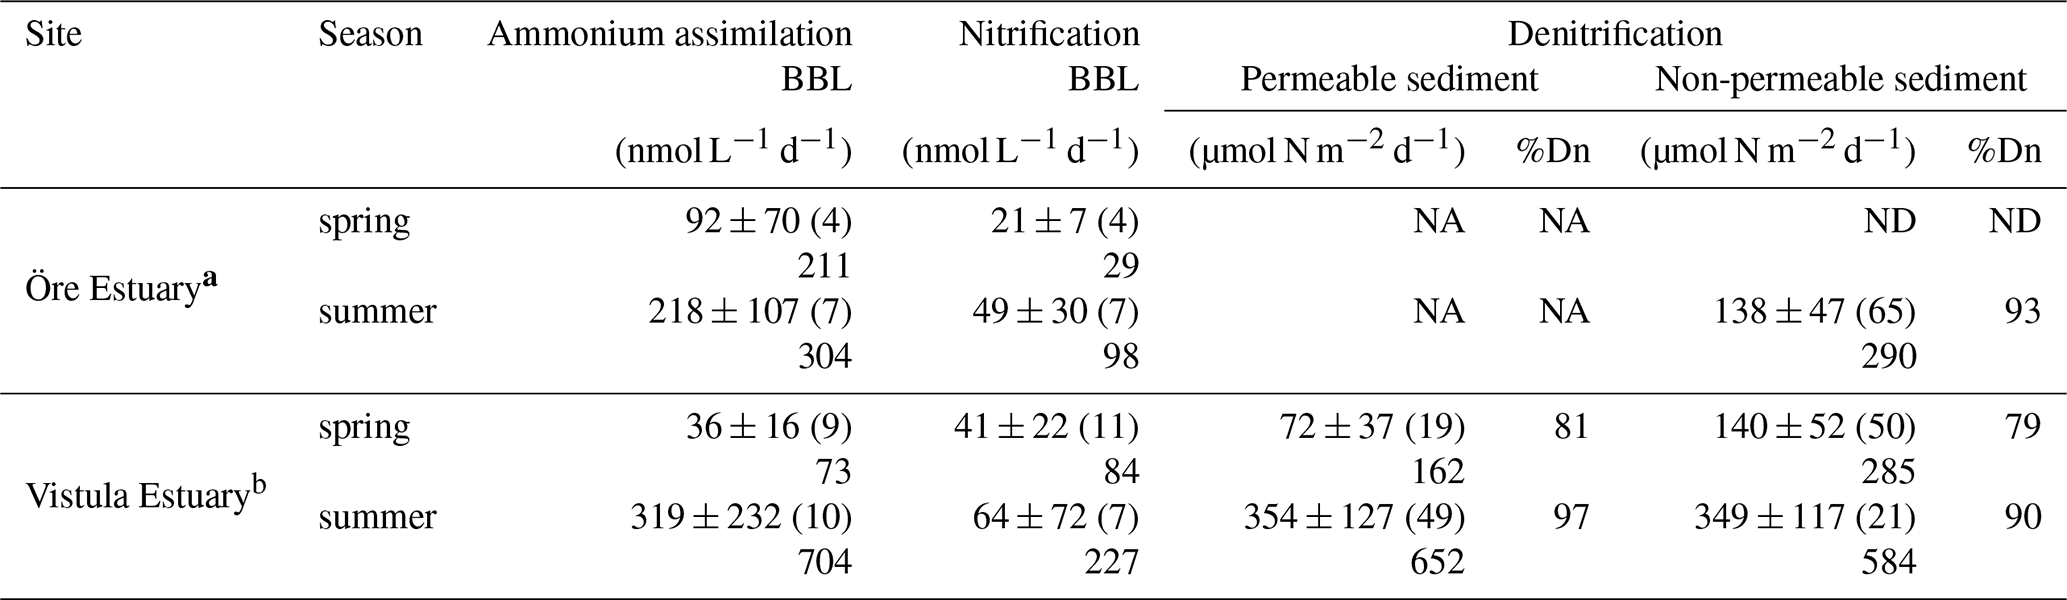
a Denitrification rates from Hellemann et al. (2017). b Nitrification and ammonium assimilation rates from Bartl et al. (2018).
3.2.2 Denitrification and anammox in the sediment
Anammox was not detected at any of the sites, indicating that N2 production in both estuaries originated entirely from denitrification. N2O production during denitrification was ≤1.8 % of total N2 production in all samples, and denitrification rates are presented as the sum of N2 and N2O. Denitrification rates in the Öre Estuary were not detectable in spring, and summer rates were ≥60 % lower than in the Vistula Estuary (U test, p<0.001). In the Vistula Estuary, spring denitrification rates were 50 % lower in the permeable than in the non-permeable sediment, but no difference was found in summer (Table 4). In both estuaries, denitrification was primarily coupled to nitrification in the sediment (spring: ∼80 %; summer: ≥90 %). Dn correlated positively with LOI in the surface sediments of the Vistula Estuary in summer (Kendall's τ: 0.73, p=0.04, n=6, one non-permeable site excluded) but not in spring (spring: Kendall's τ: 0.40, p=0.33, n=5) nor in the Öre Estuary (Kendall's τ: 0.14, p=0.70, n=6; Fig. 6e). Dn correlated negatively with the particulate C:N ratio in the Öre Estuary (Kendall's τ: −0.80, p=0.05, n=5; Fig. 6f) but not in the Vistula Estuary (spring: Kendall's τ: 0.20, p=0.63, n=5; summer: Kendall's τ: 0.24, p=0.45, n=7).
4.1 Environmental settings of the Vistula and Öre estuaries
4.1.1 Site-specific and seasonal environmental settings
The main difference between the estuaries is their trophic state (eutrophied vs. oligotrophic) due to the 2-magnitude-higher nutrient load of the Vistula River (Table 1). The corresponding high nutrient availability in the photic zone of the Vistula Estuary supports an annual primary production rate that is ∼6 times higher (225 g m−2 yr−1; Witek et al., 1999) than in the nutrient-limited Öre Estuary (39 g m−2 yr−1; Ask et al., 2016). This difference was well reflected by the higher concentrations of Chl a and POM in the surface water of the Vistula Estuary in summer (Table 2). While the POM concentrations in the rivers were surprisingly similar, their sources differed significantly. POM from the Vistula River and its plume is mainly phytoplankton-derived (Table 2; Maksymowska et al., 2000) and thus easily degradable, whereas the large share of terrestrial POM in the Öre River and its plume is likely refractory, was observed to settle right at the river mouth (Forsgren and Jansson, 1992), and is thus not likely an important substrate source for benthic N turnover. Interestingly, despite the different primary production rates and riverine POM sources, more than 60 % of the benthic POM is phytoplankton-derived in both estuaries, though degraded to different degrees. In the Vistula Estuary, the continuous input of labile POM likely results in the less degraded state of benthic summer POM, as determined from lower C:N and POC:Chl a ratios than in the Öre Estuary (Fig. 4c). Its remineralisation presumably accounted for the higher concentration of not only in the BBL in summer (Fig. 3) but also on a long-term scale as reflected by the large pools in the non-permeable sediment (Table 3). In the Öre Estuary, by contrast, low river loads and primary production rates result in comparatively small inputs of phytoplankton-derived POM to the benthic system, where it seems to be effectively sequestered over the course of 1 year (Hellemann et al., 2017) resulting in a more degraded state of benthic summer POM compared to the Vistula Estuary (Fig. 4c).
In contrast to the quality, the different trophic states of the two estuaries were not reflected in the quantity of benthic POM, which was surprisingly higher in the BBL of the Öre Estuary in summer. This points to the influence of estuarine geomorphology, which determines particle and water residence times (Seitzinger et al., 2006; Statham, 2012). The basin-like topography of the Öre Estuary and the restricted water exchange across the elevation of the estuary's outlet (Figs. 1, 2) result in a particle residence time of up to 1 year (Brydsten and Jansson, 1989) likely allowing enhanced accumulation of settled POM during the productive seasons. Conversely, the open shape of the Vistula Estuary may limit a long-term accumulation of benthic POM as unrestricted lateral transport could lead to its export, likely resulting in the lower summertime POM concentrations compared to the Öre Estuary. In addition, the large area of permeable sandy sediments that can experience advective pore-water flow likely contribute to an efficient degradation of POM in the sediment of the Vistula Estuary (Boudreau et al., 2001; Huettel and Rusch, 2000).
Besides the trophic and geomorphological contrasts, the two estuaries share similar features related to the seasonal water column stratification and the corresponding distributions of DIN and POM. In spring, when the riverine nutrient loads are highest, haline stratification prevents the direct contact of river plume DIN with the aphotic benthic system. Instead, DIN remains in the photic surface layer where it is either exported or taken up by primary producers during the spring bloom. Elevated Chl a concentrations in the BBL during the spring samplings compared to the summer (Table 2) or the winter season (< 1 µg L−1; Bartl et al., 2018; DBotnia, 2016) and the dominance of phytoplankton-derived POM in the BBL (Table 2) suggest that newly produced POM rapidly sediments to the aphotic benthic system. In summer, reduced vertical mixing, thermohaline stratification, and increased bottom water temperature allow enhanced benthic remineralisation of POM and thus N turnover, thereby slightly lowering the oxygen concentrations and increasing the concentrations in the BBL of both estuaries (Table S2). Consequently, riverine DIN is supplied to the benthic system indirectly, via POM build-up and sedimentation which uncouples the peak river N load in spring from enhanced N turnover in the benthic system in summer (Hellemann et al., 2017; Jäntti et al., 2011).
4.1.2 Permeable sediments of the Vistula Estuary
Permeable sediments are known to experience advective pore-water flow, which significantly influences nutrient and organic matter turnover (Huettel et al., 2014). In the permeable sediments of the Vistula Estuary, advective pore-water flow was indicated in spring by the sigmoidal shape of the oxygen profiles (Revsbech et al., 1980) and the low pore-water pools, similar to the subtidal permeable sediments in the North Sea (Ehrenhauss et al., 2004; Lohse et al., 1996). The low pore-water pools likely result from enhanced nitrification in the large oxic sediment layer and/or enhanced release through advection (Huettel et al., 1998). However, the strikingly higher pools, the nearly parabolic shape of the oxygen profiles, and the shallow OPDs in summer (Table 3) rather suggest accumulation and the dominance of diffusive transport despite the permeable character of the sandy sediments in that season. Similar seasonally differing oxygen profiles have also been found in the permeable sediments of the German Bight, North Sea, where the parabolic profile shape in summer is attributed to the “absence of a turbulent water column” (Lohse et al., 1996). The authors of that study also observed that oxygen consumption in the sediment can distort the shape of originally advective (sigmoidal) oxygen profiles within 30–60 min at a diffusive oxygen uptake (DOU) rate of 6.7 mmol m−2 d−1. In our study, oxygen profiles were measured within ∼30 min of the first sampling and had a much lower summer DOU (0.6±0.3 mmol m−2 d−1; n=21). It is therefore unlikely that the observed parabolic profile shape resulted from strong oxygen utilisation occurring prior to the measurements. Instead, we assume that the pressure gradients at the sediment surface in summer were too low to induce advective pore-water flow. Such pressure gradients mainly originate from waves or from the interaction of near-bottom flow and the bottom topography (Santos et al., 2012). To examine whether the interaction of near-bottom flow with a topographic object could, at least theoretically, create pressure gradients sufficient to drive advection, we used modelled near-bottom flow velocity data of our sampling period and estimated pressure gradients and the Peclet number (Bear, 1972; see Supplement). The modelled near-bottom flow velocity was very low (< 2.5 cm s−1) and resulted only in minor pressure gradients (< 0.15 Pa) at a 3 cm high mound (Table S3). The calculated Peclet number was below the threshold for pore-water advection within the sediment (≥5; Bear, 1972; Table S3). We therefore suggest that, at the time of the summer cruise, the pressure gradients at the sediment surface of the Vistula Estuary were too low to induce an advective pore-water flow able to significantly affect sediment biogeochemistry, leaving diffusion and fauna-induced fluxes as the main transport processes during that time. Presumably, this temporary switch between transport regimes is more likely to occur in low-energy environments, such as the non-tidal Baltic Sea. Further research is needed to evaluate the frequency of such changes and their impact on biogeochemical processes.
4.2 Effects of contrasting environmental settings on benthic microbial N turnover
4.2.1 Nitrification and ammonium assimilation in the BBL
Nitrification rates are often higher in eutrophied than in oligotrophic estuaries, due to the increased availability of the substrate and higher concentrations of POM (Bianchi et al., 1999; Dai et al., 2008; Damashek et al., 2016). Yet, rates of coastal nitrification cover an extremely large range (0.2–14 400 nmol L−1 d−1; Brion et al., 2008; Bristow et al., 2015; Damashek et al., 2016; Heiss and Fulweiler, 2016; Hsiao et al., 2014) due to the heterogeneity of coastal systems. While the nitrification rates determined in this study are in the lower spectrum of globally acquired rates, they are similar to previously reported nitrification rates in the Baltic Proper (0–84 nmol L−1 d−1 at a water depth of 80–117 m; Hietanen et al., 2012). The similarity of the nitrification rates in the two estuaries is unexpected, given the difference in their trophic states. However, this might be explained by a recent study that found similar gene and transcript abundances as well as similar community compositions of ammonium-oxidising archaea and bacteria in the BBL of the Vistula and Öre estuaries (Happel et al., 2018). The positive correlations between the nitrification rates and the concentrations of PON and POC at both sites indicate a regulation of nitrification by particle-attached nitrifiers (Karl et al., 1984; Phillips et al., 1999), which profit from the direct supply during PON degradation (Bartl et al., 2018; Hsiao et al., 2014; Klawonn et al., 2015). Furthermore, recent studies found nitrifying species capable of degrading organic nitrogen compounds to obtain directly (Kuypers et al., 2018; Yager et al., 2012). Such organisms may also contribute to the positive correlation between nitrification rates and PON in our study.
The only difference between the two estuaries that seems to influence nitrification was the quality of benthic POM, as defined by its C:N ratio. This was also shown to be the case for nitrification in soils (Bengtsson et al., 2003) and may apply to coastal systems as well. With increasing PON concentration, the increase in nitrification was stronger in the Vistula than in the Öre Estuary (Fig. 6), likely due to the less degraded state of the POM in the former (Fig. 4). By contrast, the more degraded POM in the Öre Estuary limits nitrification due to the limited availability of organic N as a potential source, which is reflected by the negative correlation between nitrification rates and the C:N ratio (Fig. 6). Hence, a combination of the concentrations of POC and PON and their ratio, i.e. the POM quality, likely influenced nitrification in the Öre Estuary. In addition to PON, a second source of might have been sedimentary release. Corresponding total fluxes measured by Thoms et al. (2018) in the Vistula Estuary in spring 2016 (same cruise) did not correlate with the nitrification rates presented here (not shown). These total fluxes were measured with in situ chamber incubations, which, however, neglect advective pore-water flow (Thoms et al., 2018). Hence additional rate and flux data are needed to thoroughly determine the contribution of sedimentary release as a substrate source for nitrification in the BBL.
The ammonium assimilation rates measured in this study represent typical coastal rates, similar to rates determined in the surface water of the Delaware Estuary (13–930 nmol L−1 d−1; Hoch and Kirchman, 1995) and in the bottom water of the Washington coast (500 nmol L−1 d−1; Ward et al., 1984). Ammonium assimilation is both a substrate- and a temperature-dependent heterotrophic process (Baer et al., 2014; Hoch and Kirchman, 1995) which suggests increased rates in the eutrophied Vistula Estuary and in summer, respectively. However, the eutrophied state of the Vistula Estuary did not result in higher rates, while the warmer temperature in the BBL in summer clearly enhanced ammonium assimilation in both estuaries. Interestingly, ammonium assimilation showed the same correlation patterns with PON, POC, and C:N as found for the nitrification rates (Fig. 6), indicating that labile POM also plays an important role as a substrate source for -assimilating microbes.
4.2.2 Denitrification in the sediment
Denitrification rates are commonly enhanced in eutrophied ecosystems due to the greater availability of organic C and (Seitzinger et al., 2006). This was also the case for the Vistula Estuary, where denitrification rates were more than 2-fold higher than in the Öre Estuary (Table 4) and similar to rates from other eutrophied Baltic estuaries (320–360 µmol N m−2 d−1, Bonaglia et al., 2014; 90–910 µmol N m−2 d−1, Silvennoinen et al., 2007; 290–350 µmol N m−2 d−1, Nielsen and Glud, 1996). The higher availability of labile POM in the benthic system supplied organic C and N, with the latter serving as source for ammonification subsequently driving coupled nitrification–denitrification (Dn). As a result denitrification in the Vistula Estuary increased significantly with increasing organic matter concentrations as also reported for other coastal systems (Finlay et al., 2013; Jäntti et al., 2011; Seitzinger and Nixon, 1985). By contrast, the more degraded state of the POM in the Öre Estuary reduced the availability of organic N and C substrates, which is likely the reason for the negative correlation between denitrification and the particulate C:N ratio (Fig. 6f). The results from both estuaries are consistent with previous findings of a dependency of denitrification on the quality of organic matter (Eyre et al., 2013; Hietanen and Kuparinen, 2008).
The limited denitrification rates in the colder spring season can be attributed to the low availability of labile organic C (Bradley et al., 1992; Hellemann et al., 2017) as denitrification uses organic C and NO in a 1:1 ratio (Taylor and Townsend, 2010). While newly produced POM was present in both benthic systems during the spring samplings (Fig. 4), low bottom water temperatures (Fig. 2) likely slowed its degradation to dissolved C components suitable for denitrification. Such limitation has been found previously also in other coastal sediments of the Baltic Sea in the same season (Hietanen and Kuparinen, 2008; Jäntti et al., 2011).
In both estuaries and both seasons, denitrification mainly used from nitrification in the sediment and not from the BBL, which is common in coastal sediments with sufficiently deep oxygen penetration and low concentrations in the water overlying the sediment (Rysgaard et al., 1994). This was also true for the permeable sediments under advective pore-water flow in the Vistula Estuary and is in agreement with the results of Rao et al. (2008) and Marchant et al. (2016). Advective pore-water flow can favour Dn over Dw by enhancing nitrification through an increase in the oxic sediment volume (Gihring et al., 2010; Huettel et al., 1998; Marchant et al., 2016) and by increasing the areal extent of the oxic–anoxic interface across which and are exchanged (Cook et al., 2006; Precht et al., 2004). However, because advective pore-water flow affects sediment biogeochemistry in complex ways, there is no consistent pattern regarding a general domination of Dn or Dw in permeable sediments (Kessler et al., 2013; Gihring et al., 2010; Marchant et al., 2016; Rao et al., 2007).
4.2.3 Measurement of denitrification rates in the permeable Vistula sediment
The permeable sediments along the southern coast of the Baltic Sea are assumed to account for substantial N removal as a result of high N turnover related to pore-water flow (Korth et al., 2013; Voss et al., 2005a), similar to permeable sediments in the North Sea and Atlantic Bight (Gao et al., 2012; Rao et al., 2007). In this study, the permeable sediments of the Vistula Estuary in spring experienced advective pore-water flow, and denitrification rates were correspondingly measured using an advective incubation design. The determined rates were lower than those of the non-permeable sediments during the same season, presumably due to the limitations of our incubation design in representing advective pore-water flow. During the incubation, pore-water flow velocities were within the range of those in sediments underlying high-energy waters (Huettel et al., 1996; Precht et al., 2004) and therefore probably too high to realistically represent Baltic Sea conditions. Over the course of the incubation, the flow increased the initial OPD in most of the investigated sediment cores (data not shown), leading to the oxygenation of formerly anoxic sediment layers and a downwards shift of the oxic–anoxic interface. The delay until the microbial community adapted to the new conditions might explain the measured low rates of denitrification. Yet, at the time of the spring cruise, denitrification was limited by the low availability of labile dissolved organic C. It is therefore unlikely that in situ denitrification rates in the permeable sediment would have been significantly higher than those measured in the non-permeable sediment, even with a better simulation of advective pore-water flow.
4.3 Key drivers of the coastal N filter in the Öre and Vistula estuaries
In the two estuaries studied here, POM was found to be an essential link between land-derived DIN in the surface waters and the spatially and temporally separated benthic processes such as nitrification, ammonium assimilation, and denitrification. Through benthic–pelagic coupling, POM likely functions as a carrier and temporary reservoir of organic N and C that controls the process rates of benthic N retention and removal (Hellemann et al., 2017).
To better understand this coupling, we estimated the amount of riverine DIN potentially taken up by primary production. In the Öre Estuary, N uptake in April 2015 was calculated using a primary production rate of 0.39 g C m−2 d−1 (DBotnia, 2016), the Redfield C:N ratio of 6.6, and the estuarine area of 71 km2. The resulting areal N uptake rate of 4.9 t d−1 was 1 order of magnitude higher than the riverine DIN load during the same period (0.53 t d−1). Thus, it is likely that all riverine DIN and also riverine DON (dissolved organic nitrogen) (Stepanauskas et al., 2002) were readily consumed by phytoplankton. Due to the shallow depth, a considerable amount of this easily degradable POM sinks to the bottom and may remain in the benthic system for over 1 year (Brydsten and Jansson, 1989). During that time period N could undergo cycles of retention via ammonification, nitrification, reassimilation to PON, and DNRA before it is removed via sedimentary denitrification (Hellemann et al., 2017). Thus, even at low process rates, the estuary may be an effective coastal N filter of the low riverine TN loads, mainly accomplished through its geomorphology that allows long particle residence times (Fig. 7).
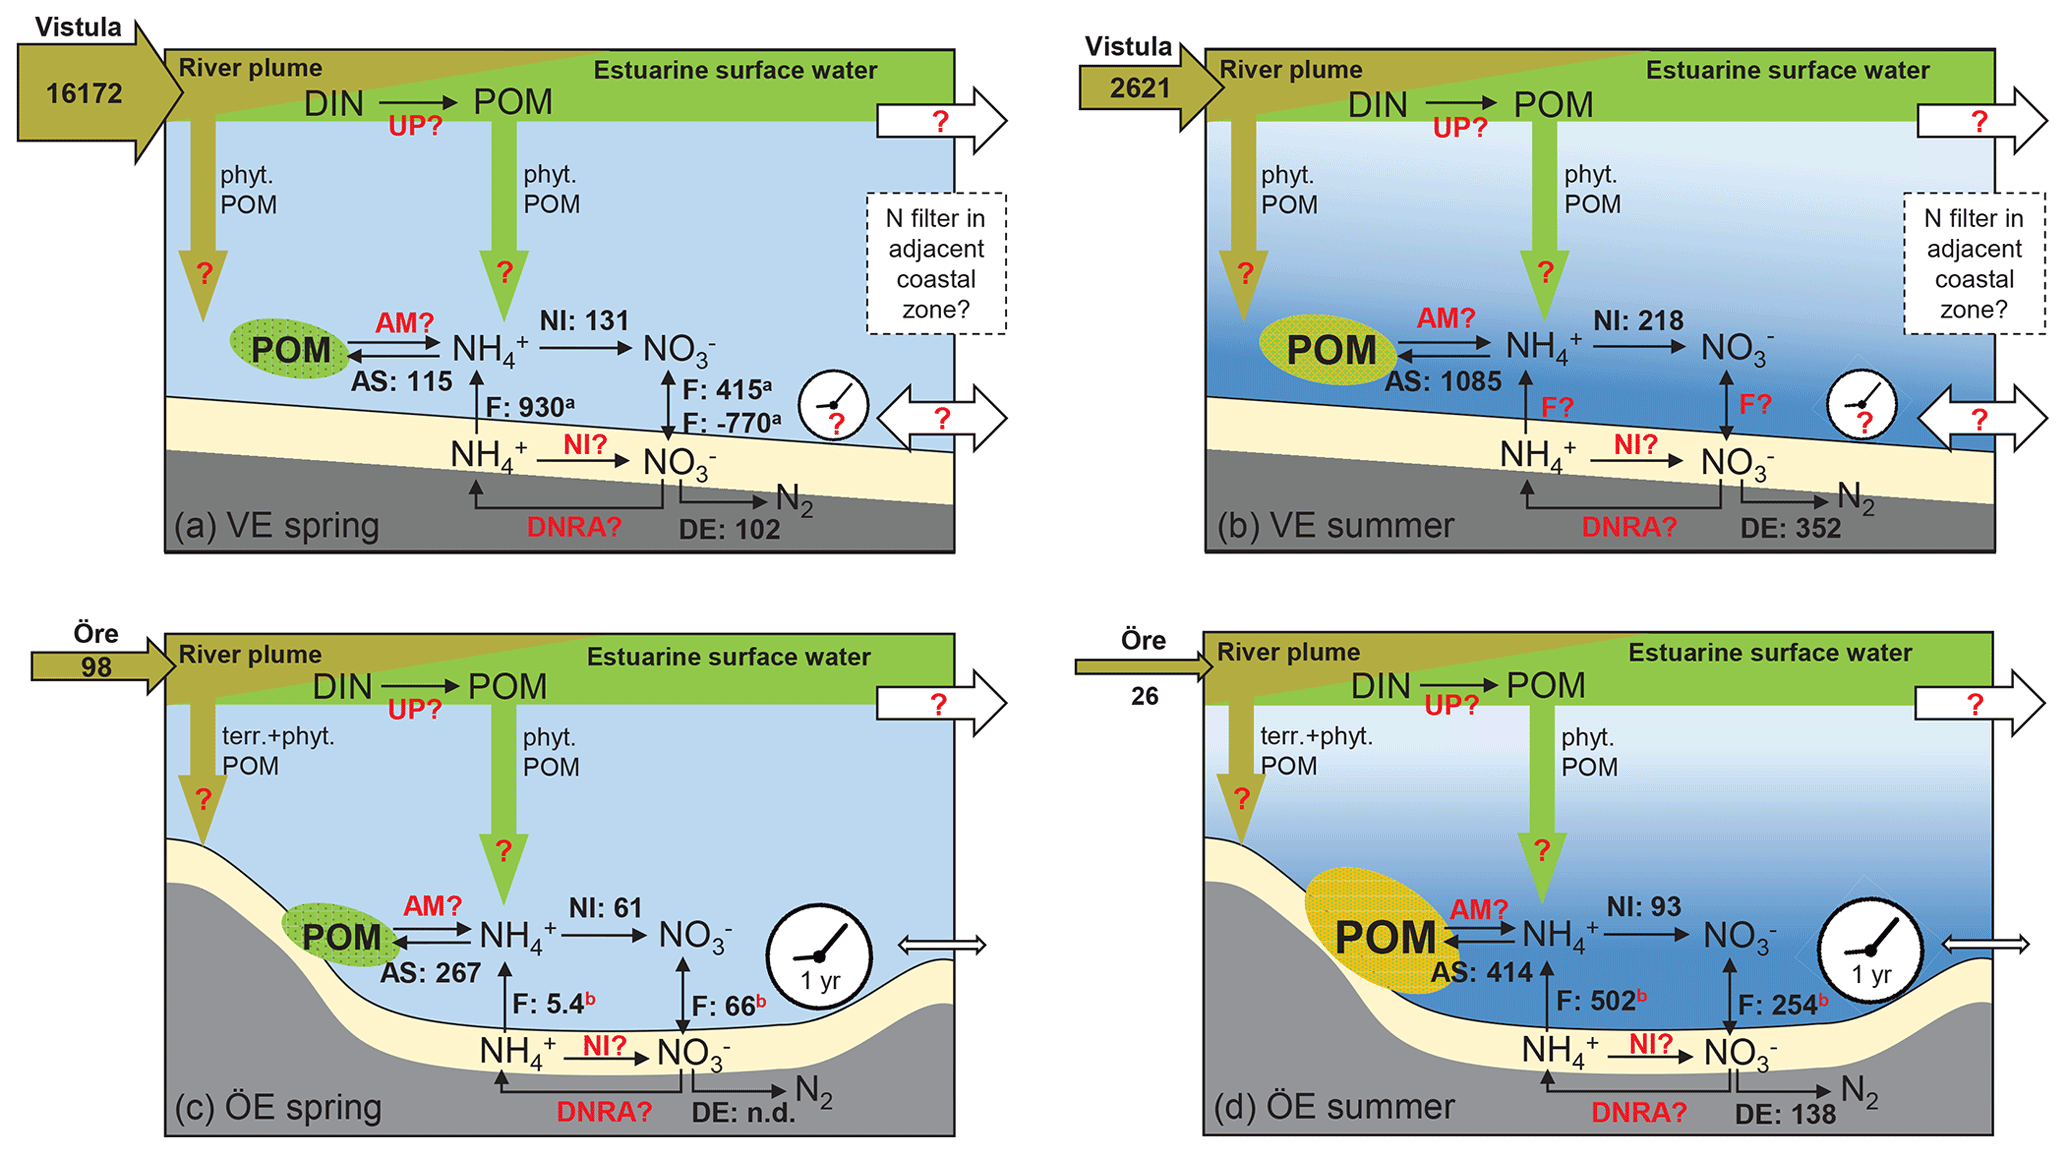
Figure 7Schematic of the N filter and its driving factors in the Vistula Estuary (a, b) and Öre Estuary (c, d) in spring and summer. The riverine total N loads are given in tonnes per month in the horizontal brown arrows. The process rates of nitrification (NI), ammonium assimilation (AS), and denitrification (DE), determined in this study, are given in micromoles per square metre per day (volumetric nitrification and ammonium assimilation rates were integrated over the vertical BBL extent to derive areal rates). Benthic POM is fresh but low in concentration in both estuaries in spring (green ellipse), while it is higher in concentration in summer and more degraded in the Öre Estuary (yellow ellipse). Fluxes of and (F) in the Vistula Estuary are from Thoms et al. (2018; in situ incubations, a), and those in the Öre Estuary are from Nedwell et al. (1983; core incubations, not in situ, b). Other microbial N retention process rates such as N uptake in the surface (UP), benthic ammonification (AM), nitrification (NI), and dissimilatory reduction to ammonia (DNRA) in the sediment are still unknown (marked in red). Fluxes from the Öre Estuary are also marked red, since these fluxes were not measured under in situ conditions; newly measured in situ fluxes are needed for a better evaluation. Also, sedimentation rates of terrestrial and phytoplankton-derived POM from the river (brown arrow) or from the estuarine surface water (green arrow) as well as transport rates (white arrows) and the particle (VE) and nutrient (VE, ÖE) residence time (white clock) are unknown for these two estuaries (red question mark). The conceptual idea of the N filter in the two estuaries is that riverine DIN is supplied to the benthic system indirectly, via POM build-up and sedimentation, which uncouples the peak river N load in spring from enhanced N turnover in the benthic system in summer. In the Öre Estuary, the limited bottom water exchange and hence the long particle residence time results in a high efficiency of the estuarine N filter (see Sect. 4.3). In the Vistula Estuary, the unrestricted bottom topography may lead to transport of DIN and POM with the prevailing alongshore currents and thus to a potential extension of the coastal filter function over a larger area and a longer timescale (see Sect. 4.3). Please note that this figure is not intended to present a closed N budget for these coastal zones.
In the Vistula Estuary, primary production rates, estimated from the riverine DIN load in March 2016 (453 t d−1), would need to be as high as 3.1 g C m−2 d−1 to result in the complete consumption of riverine DIN. However, known primary production rates are lower with 0.3–2.8 g C m−2 d−1 (March–May, Voss et al., 2005b; Witek et al., 1999) and would consume 10 %–90 % of the Vistula DIN input of March 2016. Due to the open shape of the estuary, unrestricted water exchange may reduce the residence time of both DIN and newly produced POM allowing their export out of the Vistula Estuary (Fig. 7). Residence times and transport in the surface water of the Vistula Estuary strongly depend on wind direction and wind speed (Matciak and Nowacki, 1995; Voss et al., 2005b). Short-term eddy formations during southerly and south-easterly winds have been observed to transport small amounts of riverine DIN out into the open Baltic Sea (Voss et al., 2005b), whereas the predominant south-westerly and westerly winds lead to alongshore eastward coastal currents, so that DIN and POM could largely remain within the coastal rim of the southern Baltic zone (Radtke et al., 2012; Siegel et al., 1996; Voss et al., 2005a, b). We assume that the predominant alongshore transport of DIN and POM extends the N filter of the Vistula Estuary to the adjacent coastal zones where further DIN uptake, POM sedimentation, and benthic microbial N retention and removal facilitate a coastal filter function over a larger area and a longer timescale. However, to thoroughly understand the N filter function and its efficiency in the Vistula Estuary and adjacent coastal zones, the effects of wind conditions on current dynamics and residence time not only in the surface water but also in intermediate and bottom water layers need to be resolved.
Furthermore, the microbial N processes studied here are not sufficient to elucidate the role and magnitude of N retention in the Öre and Vistula estuaries since actual rate measurements of DIN uptake by primary producers, ammonification as well as nitrification and DNRA in the sediment, and in situ fluxes across the sediment water interface are lacking (Fig. 7). Nitrification and DNRA in the sediment have been the particular focus of a few recent studies of Baltic coastal systems where the rates varied extremely between ∼20 and 700 µmol m−2 d−1 in nitrification (Bonaglia et al., 2014; Jäntti et al., 2011) and 1 and 487 µmol m−2 d−1 in DNRA (Bonaglia et al., 2014, 2017; Jäntti and Hietanen, 2012; Jäntti et al., 2011). These rates cover the same range as denitrification rates and, together with the release of and from the sediment (Thoms et al., 2018), emphasise their significant role in retaining N in coastal ecosystems.
4.4 Revisiting coastal filter efficiency
The efficiency of the coastal N filter is often evaluated by estimating the N removal efficiency (e.g. Asmala et al., 2017; Deek et al., 2013; Khalil et al., 2013), which is an extrapolation of the denitrification rates to a specific area, divided by the riverine TN load. To determine the N removal efficiency of the Vistula and Öre estuaries, we extrapolated the denitrification rates (Table 4) to the respective estuarine sediment areas (ÖE: 21 km2; VE: 462 km2 permeable sediment; 363 km2 non-permeable sediment, Fig. S3) and sampling months (31 d) and divided them by the riverine TN load of the same month (converted to mol month−1; Table 1). Despite their significantly different denitrification rates, the two estuaries each removed only ∼5 % of the riverine TN loads in the respective summer months and even less in spring (0.2 %, Vistula Estuary only). These values are at the lower end of N removal efficiencies estimated for temperate estuaries (3 %–26 %; Deek et al., 2013; Fear et al., 2005; Jäntti et al., 2011; Seitzinger and Nixon, 1985; Silvennoinen et al., 2007). Asmala et al. (2017) calculated that ∼16 % of the riverine TN load entering the Baltic coastal zone is removed by denitrification and concluded that the Baltic coast is a less efficient N filter than the open Baltic Sea. The authors' compilation of denitrification rates across different coastal types, however, lacks denitrification measurements from sandy, permeable sediments, which cover large areas of the southern Baltic coastal zone coinciding with the region of highest riverine N loads (HELCOM, 2018). Thus, the question remains whether the removal efficiency could be underestimated, and additional denitrification measurements from sediments experiencing advective pore-water flow are needed for future estimations.
Based on our results, we emphasise the fact that the N removal efficiency alone is not a sufficient indicator of the N filter efficiency in coastal zones. The time delay of the riverine N load in the surface and its removal in the sediment make the direct relation of N input to N removal only sensible for longer, i.e. annual and decadal, timescales (Edman et al., 2018). On shorter, i.e. seasonal, timescales the N filter efficiency would rather depend on the transport and residence time of N, which provide time for N storage in POM and for retention processes to recycle N several times until it eventually enters the removal pathway. Hence, to better quantify the coastal N filter efficiency, an additional measure of a N recycling efficiency is needed that not only considers the role and magnitude of microbial N retention processes but also quantifies transport and residence times of nutrients and POM, as all of these factors may facilitate N preservation in the coastal system.
Contrary to our expectations, the different trophic states of the Vistula and Öre estuaries only influence the denitrification rates in the sediment but not the rates of ammonium assimilation and nitrification in the BBL. In both estuaries, all three processes depend on the availability of easily degradable, phytoplankton-derived POM as a substrate source. In stratified estuaries such as those of the Vistula and Öre rivers, POM build-up through primary production and subsequent sedimentation marks it as the essential link between riverine DIN loads and the spatially and temporally separated benthic microbial N processing. In addition, POM can function as a temporary N reservoir through long particle residence times (Öre Estuary) or alongshore transport (Vistula Estuary), which are both governed by the geomorphological and hydrological features of coastal zones. Consequently, the efficiency of a coastal N filter depends not only on the rates of microbial N removal (removal efficiency) but also on the transport and residence time of nutrients and POM as well as on the rates of microbial N retention (recycling efficiency). Especially in the southern Baltic coastal zone, where riverine TN loads are consistently high and water residence times or benthic N process rates are largely unknown, we still lack knowledge of whether the coastal filter works efficiently. Our findings highlight the need for holistic approaches combining microbial N process quantifications with investigations on current dynamics and transport and residence times, which would then give crucial information for the application of appropriate agricultural and coastal management measures.
Data can be accessed upon request to the corresponding author.
The supplement related to this article is available online at: https://doi.org/10.5194/bg-16-3543-2019-supplement.
IB and DH conducted the study conceptualisation, investigations, formal analysis, and data visualisation. Both first authors wrote the original draft of the paper and also conducted its revision and editing. CR, KS, and PT supported the investigations, the writing, reviewing, and editing of the paper. SH and MV supported the study's conceptualisation, the investigations, and the writing, reviewing, and editing of the paper. They also conducted the funding acquisition and provided resources.
The authors declare that they have no conflict of interest.
We thank the participants of the field campaigns EMB077, EMB123, Öre I and II (especially the captain and crew of the R/V Elisabeth Mann Borgese), and Daniel Conley for facilitating the sampling campaigns in the Öre Estuary. The Umeå Marine Sciences Center provided valuable marine infrastructure, environmental monitoring data, and laboratory support. Thanks to Iris Liskow, Christian Burmeister, Aisha Degen-Smyrek, Sanni Aalto, Samu Elovaara, Anni Jylhä-Vuorio, Natalia Kozak, Bruno Bombled, Laetitia Leroy, Niels van Helmond, and Wytze Lenstra for their dedicated support in the field and in the lab. Lastly, we thank the reviewers for their valuable feedback and suggestions, which significantly improved the paper.
This research has been supported by the BONUS COCOA project, funded jointly by the European Union, the Academy of Finland (grant no. 2112932-1), and the Bundesministerium für Bildung und Forschung (grant no. 03F0683A). Further financial support was given by Chancellor's Travel Grant of the University of Helsinki, the Onni-Talas Foundation, and the Academy of Finland (projects 272964, 303774, and 267112). Funding for Kirstin Schulz was provided by the Dutch STW project “Sediment for the salt marshes: physical and ecological aspects of a mud motor” (grant number 13888).
This paper was edited by Aninda Mazumdar and reviewed by two anonymous referees.
Ask, J., Rowe, O., Brugel, S., Strömgren, M., Byström, P., and Andersson, A.: Importance of coastal primary production in the northern Baltic Sea, Ambio, 45, 635–648, https://doi.org/10.1007/s13280-016-0778-5, 2016.
Asmala, E., Carstensen, J., Conley, D. J., Slomp, C. P., Stadmark, J., and Voss, M.: Efficiency of the coastal filter: Nitrogen and phosphorus removal in the Baltic Sea, Limnol. Oceanogr., 62, S222–S238, https://doi.org/10.1002/lno.10644, 2017.
Baer, S. E., Connelly, T. L., Sipler, R. E., Yager, P. L., and Bronk, D. A.: Effect of temperature on rates of ammonium uptake and nitrification in the western coastal Arctic during winter, spring, and summer, Global Biogeochem. Cy., 28, 1455–1466, https://doi.org/10.1002/2013GB004765, 2014.
Bartl, I., Liskow, I., Schulz, K., Voss, M., and Umlauf, L.: River plume and bottom boundary layer – Hotspots for nitrification in a coastal bay?, Estuar. Coast. Shelf Sci., 208, 70–82, https://doi.org/10.1016/j.ecss.2018.04.023, 2018.
Bear, J.: Dynamics of fluids in porous media, American Elsevier Pub. Co, New York, NY, 1972.
Bengtsson, G., Bengtson, P., and Månsson, K. F.: Gross nitrogen mineralization-, immobilization-, and nitrification rates as a function of soil C∕N ratio and microbial activity, Soil Biol. Biochem., 35, 143–154, https://doi.org/10.1016/S0038-0717(02)00248-1, 2003.
Bianchi, M., Feliatra, F., and Lefevre, D.: Regulation of nitrification in the land-ocean contact area of the Rhone River plume (NW Mediterranean), Aquat. Microb. Ecol., 18, 301–312, https://doi.org/10.3354/ame018301, 1999.
Bonaglia, S., Deutsch, B., Bartoli, M., Marchant, H. K., and Brüchert, V.: Seasonal oxygen, nitrogen and phosphorus benthic cycling along an impacted Baltic Sea estuary: regulation and spatial patterns, Biogeochemistry, 119, 139–160, https://doi.org/10.1007/s10533-014-9953-6, 2014.
Bonaglia, S., Hylén, A., Rattray, J. E., Kononets, M. Y., Ekeroth, N., Roos, P., Thamdrup, B., Brüchert, V., and Hall, P. O. J.: The fate of fixed nitrogen in marine sediments with low organic loading: an in situ study, Biogeosciences, 14, 285–300, https://doi.org/10.5194/bg-14-285-2017, 2017.
Boudreau, B. P. and Jørgensen, B. B.: The benthic boundary layer: transport processes and biogeochemistry, Oxford University Press, Oxford, 2001.
Boudreau, B. P., Huettel, M., Forster, S., Jahnke, R. A., McLachlan, A., Middelburg, J. J., Nielsen, P., Sansone, F., Taghon, G., Van Raaphorst, W., Webster, I., Weslawski, J. M., Wiberg, P., and Sundby, B.: Permeable marine sediments: Overturning an old paradigm, Eos (Washington DC), 82, 133–136, 2001.
Bradley, P. M., Fernandez, M., and Chapelle, F. H.: Carbon Limitation of Denitrification Rates in an Anaerobic Groundwater System, Environ. Sci. Technol., 26, 2377–2381, https://doi.org/10.1021/es00036a007, 1992.
Brion, N., Andersson, M. G. I., and Elskens, M.: Nitrogen cycling, retention and export in a eutrophic temperate macrotidal estuary, Mar. Ecol. Prog. Ser., 357, 87–99, https://doi.org/10.3354/meps07249, 2008.
Bristow, L. A., Sarode, N., Cartee, J., Caro-Quintero, A., Thamdrup, B., and Stewart, F. J.: Biogeochemical and metagenomic analysis of nitrite accumulation in the Gulf of Mexico hypoxic zone, Limnol. Oceanogr., 60, 1733–1750, https://doi.org/10.1002/lno.10130, 2015.
Brydsten, L.: Wave-induced sediment resuspension in the Öre Estuary, northern Sweden, Hydrobiologia, 235, 71–83, https://doi.org/10.1007/bf00026201, 1992.
Brydsten, L. and Jansson, M.: Studies of estuarine sediment dynamics using 137Cs from the Tjernobyl accident as a tracer, Estuar. Coast. Shelf Sci., 28, 249–259, https://doi.org/10.1016/0272-7714(89)90016-4, 1989.
Casciotti, K. L., Sigman, D. M., Hastings, M. G., Böhlke, J. K., and Hilkert, A.: Measurement of the Oxygen Isotopic Composition of Nitrate in Seawater and Freshwater Using the Denitrifier Method, Anal. Chem., 74, 4905–4912, https://doi.org/10.1021/ac020113w, 2002.
Cifuentes, L. A., Sharp, J. H., and Fogel, M. L.: Stable carbon and nitrogen isotope biogeochemistry in the Delaware estuary, Limnol. Oceanogr., 33, 1102–1115, https://doi.org/10.4319/lo.1988.33.5.1102, 1988.
Conley, D. J., Carstensen, J., Aigars, J., Axe, P., Bonsdorff, E., Eremina, T., Haahti, B.-M., Humborg, C., Jonsson, P., Kotta, J., Lännegren, C., Larsson, U., Maximov, A., Medina, M. R., Lysiak-Pastuszak, E., Remeikaité-Nikiené, N., Walve, J., Wilhelms, S., and Zillén, L.: Hypoxia is increasing in the coastal zone of the Baltic Sea, Environ. Sci. Technol., 45, 6777–83, https://doi.org/10.1021/es201212r, 2011.
Cook, P. L. M., Wenzhoefer, F., Rysgaard, S., Galaktionov, O. S., Meysman, F. J. R., Eyre, B. D., Cornwell, J., Huettel, M., and Glud, R. N.: Quantification of denitrification in permeable sediments: Insights from a two-dimensional simulation analysis and experimental data, Limnol. Oceanogr., 4, 294–307, 2006.
Cyberska, B. and Krzyminski, W.: Extension of the Vistula River water in the Gulf of Gdansk, in Proceedings of the 16th Conference of the Baltic Oceanographers,Institute of Marine Research Kiel, Kiel, 290–304, 1988.
Dai, M., Wang, L., Guo, X., Zhai, W., Li, Q., He, B., and Kao, S.-J.: Nitrification and inorganic nitrogen distribution in a large perturbed river/estuarine system: the Pearl River Estuary, China, Biogeosciences, 5, 1227–1244, https://doi.org/10.5194/bg-5-1227-2008, 2008.
Dale, O. R., Tobias, C. R., and Song, B.: Biogeographical distribution of diverse anaerobic ammonium oxidizing (anammox) bacteria in Cape Fear River Estuary, Environ. Microbiol., 11, 1194–1207, https://doi.org/10.1111/j.1462-2920.2008.01850.x, 2009.
Dalsgaard, T., Thamdrup, B., and Canfield, D. E.: Anaerobic ammonium oxidation (anammox) in the marine environment, Res. Microbiol., 156, 457–464, https://doi.org/10.1016/j.resmic.2005.01.011, 2005.
Damashek, J., Casciotti, K. L., and Francis, C. A.: Variable Nitrification Rates Across Environmental Gradients in Turbid, Nutrient-Rich Estuary Waters of San Francisco Bay, Estuar. Coast., 39, 1050–1071, https://doi.org/10.1007/s12237-016-0071-7, 2016.
Dang, H. and Chen, C. T. A.: Ecological energetic perspectives on responses of nitrogen-transforming chemolithoautotrophic microbiota to changes in the marine environment, Front. Microbiol., 8, 1246, https://doi.org/10.3389/fmicb.2017.01246, 2017.
DBotnia: dBotnia database, Umeå Marine Sciences Centre. Swedish environmental monitoring, available at: http://www.umf.umu.se/miljoanalys/databasen-dbotnia/ (last access: 10 July 2018), 2016.
Deek, A., Dähnke, K., Van Beusekom, J., Meyer, S., Voss, M., and Emeis, K.: N2 fluxes in sediments of the Elbe Estuary and adjacent coastal zones, Mar. Ecol. Prog. Ser., 493, 9–21, https://doi.org/10.3354/meps10514, 2013.
Diaz, R. J. and Rosenberg, R.: Spreading dead zones and consequences for marine ecosystems, Science, 321, 926–929, https://doi.org/10.1126/science.1156401, 2008.
Dugdale, R. C. and Wilkerson, F. P.: The use of 15N to measure nitrogen uptake in eutrophic oceans; experimental considerations, Limnol. Oceanogr., 31, 673–689, https://doi.org/10.4319/lo.1986.31.4.0673, 1986.
Edler, L. (Ed.): Recommendations on methods for marine biological studies in the Baltic Sea. Phytoplankton and chlorophyll, Publ.-Balt. Mar. Biol. BMB, 5, 1–38, 1979.
Edman, M., Wåhlström, I., Almroth-Rosell, E., Eilola, K., Meier, H. E. M., and Arneborg, L.: Nutrient Retention in the Swedish Coastal Zone, Front. Mar. Sci., 5, 1–22, https://doi.org/10.3389/fmars.2018.00415, 2018.
Ehrenhauss, S., Witte, U., Janssen, F., and Huettel, M.: Decomposition of diatoms and nutrient dynamics in permeable North Sea sediments, Cont. Shelf Res., 24, 721–737, https://doi.org/10.1016/j.csr.2004.01.002, 2004.
Eyre, B. D., Maher, D. T., and Squire, P.: Quantity and quality of organic matter (detritus) drives N2 effluxes (net denitrification) across seasons, benthic habitats, and estuaries, Global Biogeochem. Cy., 27, 1083–1095, https://doi.org/10.1002/2013GB004631, 2013.
Fear, J. M., Thompson, S. P., Gallo, T. E., and Paerl, H. W.: Denitrification rates measured along a salinity gradient in the eutrophic Neuse River estuary, North Carolina, USA, Estuaries, 28, 608–619, https://doi.org/10.1007/BF02696071, 2005.
Finlay, J. C., Small, G. E., and Sterner, R. W.: Human influences on nitrogen removal in lakes, Science,, 342, 247–250, https://doi.org/10.1126/science.1242575, 2013.
Forsgren, G. and Jansson, M.: The turnover of river-transported iron, phosphorus and organic carbon in the Öre estuary, northern Sweden, Hydrobiologia, 235/236 585–596, https://doi.org/10.1007/BF00026246, 1992.
Forster, S., Bobertz, B., and Bohling, B.: Permeability of Sands in the Coastal Areas of the Southern Baltic Sea: Mapping a Grain-size Related Sediment Property, Aquat. Geochem., 9, 171–190, https://doi.org/10.1023/B:AQUA.0000022953.52275.8b, 2003.
Galloway, J. N. and Cowling, E. B.: Reactive Nitrogen and The World: 200 Years of Change, Ambio, 31, 64–71, https://doi.org/10.1579/0044-7447-31.2.64, 2002.
Gao, H., Matyka, M., Liu, B., Khalili, A., Kostka, J. E., Collins, G., Jansen, S., Holtappels, M., Jensen, M. M., Badewien, T. H., Beck, M., Grunwal, M., de Beer, D., Lavik, G., and Kuypers, M. M. M.: Intensive and extensive nitrogen loss from intertidal permeable sediments of the Wadden Sea, Limnol. Oceanogr., 57, 185–198, https://doi.org/10.4319/lo.2012.57.1.0185, 2012.
Gihring, T. M., Canion, A., Riggs, A., Huettel, M., and Kostka, J. E.: Denitrification in shallow, sublittoral Gulf of Mexico permeable sediments, Limnol. Oceanogr., 55, 43–54, https://doi.org/10.4319/lo.2010.55.1.0043, 2010.
Goñi, M. A., Teixeira, M. J., and Perkeya, D. W.: Sources and distribution of organic matter in a river-dominated estuary (Winyah Bay, SC, USA), Estuar. Coast. Shelf Sci., 57, 1023–1048, https://doi.org/10.1016/S0272-7714(03)00008-8, 2003.
Grasshoff, K., Kremling, K., and Ehrhardt, M.: Methods of Seawater Analysis, 3rd Edn., Wiley-VCH, Weinheim, 1999.
Hansson, M., Andersson, L., and Axe, P.: Areal Extent and Volume of Anoxia and Hypoxia in the Baltic Sea, 1960–2011, Rep. Oceanogr., 42, 1–63, 2011.
Happel, E., Bartl, I., Voss, M., and Riemann, L.: Extensive nitrification and active ammonia oxidizers in two contrasting coastal systems of the Baltic Sea, Environ. Microbiol., 20, 2913–2926, https://doi.org/10.1111/1462-2920.14293, 2018.
Heiss, E. M. and Fulweiler, R. W.: Coastal water column ammonium and nitrite oxidation are decoupled in summer, Estuar. Coast. Shelf Sci., 178, 110–119, https://doi.org/10.1016/j.ecss.2016.06.002, 2016.
HELCOM: Manual for Marine Monitoring in the COMBINE Programme of HELCOM, Helsinki Commision, 1–414, 2014.
HELCOM: Sources and pathways of nutrients to the Baltic Sea, Baltic Sea Environment Proceedings No. 153, Helsinki Commision, 1–48, 2018.
HELCOM: Nutrient inputs 1995–2016, available at: http://www.helcom.fi/baltic-sea-action-plan/nutrient-reduction-scheme/progress-towards-maximum-allowable-inputs/ (last access: 15 April 2019), 2019.
Hellemann, D., Tallberg, P., Bartl, I., Voss, M., and Hietanen, S.: Denitrification in an oligotrophic estuary: A delayed sink for riverine nitrate, Mar. Ecol. Prog. Ser., 583, 63–80, https://doi.org/10.3354/meps12359, 2017.
Hietanen, S. and Kuparinen, J.: Seasonal and short-term variation in denitrification and anammox at a coastal station on the Gulf of Finland, Baltic Sea, Hydrobiologia, 596, 67–77, https://doi.org/10.1007/s10750-007-9058-5, 2008.
Hietanen, S., Jantti, H., Buizert, C., Jurgens, K., Labrenz, M., Voss, M., and Kuparinen, J.: Hypoxia and nitrogen processing in the Baltic Sea water column, Limnol. Oceanogr., 57, 325–337, https://doi.org/10.4319/lo.2012.57.1.0325, 2012.
Hoch, M. P. and Kirchman, D. L.: Ammonium uptake by heterotrophic bacteria in the Delaware estuary and adjacent coastal waters, Limnol. Oceanogr., 40, 886–897, https://doi.org/10.4319/lo.1995.40.5.0886, 1995.
Holtermann, P. L. and Umlauf, L.: The Baltic Sea Tracer Release Experiment: 2. Mixing processes, J. Geophys. Res.-Ocean., 117, 1–17, https://doi.org/10.1029/2011JC007445, 2012.
Howarth, R. W. and Marino, R.: Nitrogen as the limiting nutrient for eutrophication in coastal marine ecosystems: Evolving views over three decades, Limnol. Oceanogr., 51, 364–376, 2006.
Howarth, R. W., Billen, G., Swaney, D., Townsend, A., Jaworski, N., Lajtha, K., Downing, J. A., Elmgren, R., Caraco, N., Jordan, T., Berendse, F., Freney, J., Kudeyarov, V., Murdoch, P., and Zhu, Z. L.: Regional nitrogen budgets and riverine N&P fluxes for the drainages to the North Atlantic Ocean: Natural and human influences, Biogeochemistry, 35, 75–139, https://doi.org/10.1007/BF02179825, 1996.
Hsiao, S. S.-Y., Hsu, T.-C., Liu, J.-w., Xie, X., Zhang, Y., Lin, J., Wang, H., Yang, J.-Y. T., Hsu, S.-C., Dai, M., and Kao, S.-J.: Nitrification and its oxygen consumption along the turbid Chang Jiang River plume, Biogeosciences, 11, 2083–2098, https://doi.org/10.5194/bg-11-2083-2014, 2014.
Huettel, M. and Rusch, A.: Transport and degradation of phytoplankton in permeable sediment, Limnol. Oceanogr., 45, 534–549, 2000.
Huettel, M., Ziebis, W., and Forster, S.: Flow-induced uptake of particulate matter in permeable sediments, Limnol. Oceanogr., 41, 309–322, 1996.
Huettel, M., Ziebis, W., Forster, S., and Luther, G. W.: Advective transport affecting metal and nutrient distributions and interfacial fluxes in permeable sediments, Geochim. Cosmochim. Ac., 62, 613–631, https://doi.org/10.1016/s0016-7037(97)00371-2, 1998.
Huettel, M., Røy, H., Precht, E., and Ehrenhauss, S.: Hydrodynamical impact on biogeochemical processes in aquatic sediments, Hydrobiologia, 494, 231–236, 2003.
Huettel, M., Berg, P., and Kostka, J. E.: Benthic Exchange and Biogeochemical Cycling in Permeable Sediments, Ann. Rev. Mar. Sci., 6, 23–51, https://doi.org/10.1146/annurev-marine-051413-012706, 2014.
Jäntti, H. and Hietanen, S.: The Effects of Hypoxia on Sediment Nitrogen Cycling in the Baltic Sea, AMBIO A. J. Hum. Environ., 41, 161–169, 2012.
Jäntti, H., Stange, F., Leskinen, E., and Hietanen, S.: Seasonal variation in nitrification and nitrate-reduction pathways in coastal sediments in the Gulf of Finland, Baltic Sea, Aquat. Microb. Ecol., 63, 171–181, https://doi.org/10.3354/ame01492, 2011.
Jilbert, T., Asmala, E., Schröder, C., Tiihonen, R., Myllykangas, J.-P., Virtasalo, J. J., Kotilainen, A., Peltola, P., Ekholm, P., and Hietanen, S.: Impacts of flocculation on the distribution and diagenesis of iron in boreal estuarine sediments, Biogeosciences, 15, 1243–1271, https://doi.org/10.5194/bg-15-1243-2018, 2018.
Karl, D. M., Knauer, G. A., Martin, J. H., and Ward, B. B.: Bacterial chemolithotrophy in the ocean is associated with sinking particles, Nature, 309, 54–56, https://doi.org/10.1038/309054a0, 1984.
Kessler, A. J., Glud, R. N., Cardenas, M. B., and Cook, P. L. M.: Transport zonation limits coupled nitrification-denitrification in permeable sediments, Environ. Sci. Technol., 47, 13404–11, https://doi.org/10.1021/es403318x, 2013.
Khalil, K., Raimonet, M., Laverman, A. M., Yan, C., Andrieux-Loyer, F., Viollier, E., Deflandre, B., Ragueneau, O., and Rabouille, C.: Spatial and Temporal Variability of Sediment Organic Matter Recycling in Two Temperate Eutrophicated Estuaries, Aquat. Geochem., 19, 517–542, https://doi.org/10.1007/s10498-013-9213-8, 2013.
Klawonn, I., Bonaglia, S., Brüchert, V., and Ploug, H.: Aerobic and anaerobic nitrogen transformation processes in N2-fixing cyanobacterial aggregates, ISME J., 9, 1456–1466, https://doi.org/10.1038/ismej.2014.232, 2015a.
Klawonn, I., Bonaglia, S., Brüchert, V., and Ploug, H.: Aerobic and anaerobic nitrogen transformation processes in N2-fixing cyanobacterial aggregates, ISME J., 9, 1456–1466, https://doi.org/10.1038/ismej.2014.232, 2015b.
Korth, F., Fry, B., Liskow, I., and Voss, M.: Nitrogen turnover during the spring outflows of the nitrate-rich Curonian and Szczecin lagoons using dual nitrate isotopes, Mar. Chem., 154, 1–11, https://doi.org/10.1016/j.marchem.2013.04.012, 2013.
Kuypers, M. M. M., Marchant, H. K., and Kartal, B.: The microbial nitrogen-cycling network, Nat. Rev. Microbiol., 16, 263–276, https://doi.org/10.1038/nrmicro.2018.9, 2018.
Lohse, L., Epping, E. H. G., Helder, W., and VanRaaphorst, W.: Oxygen pore water profiles in continental shelf sediments of the North Sea: Turbulent versus molecular diffusion, Mar. Ecol. Prog. Ser., 145, 63–75, https://doi.org/10.3354/meps145063, 1996.
Maksymowska, D., Richard, P., Piekarek-Jankowska, H., and Riera, P.: Chemical and Isotopic Composition of the Organic Matter Sources in the Gulf of Gdansk (Southern Baltic Sea), Estuar. Coast. Shelf Sci., 51, 585–598, https://doi.org/10.1006/ECSS.2000.0701, 2000.
Malmgren, L. and Brydsten, L.: Sedimentation of river-transported particles in the Öre estuary, northern Sweden, Hydrobiologia, 235/236, 59–69, https://doi.org/10.1007/BF00026200, 1992.
Marchant, H. K., Ahmerkamp, S., Kuypers, M. M. M., Winter, C., Lavik, G., and Holtappels, M.: Coupled nitrification-denitrification leads to extensive N loss in subtidal permeable sediments, Limnol. Oceanogr., 61, 1033–1048, https://doi.org/10.1002/lno.10271, 2016.
Marzocchi, U., Thamdrup, B., Stief, P., and Glud, R. N.: Effect of settled diatom-aggregates on benthic nitrogen cycling, Limnol. Oceanogr., 63, 431–444, https://doi.org/10.1002/lno.10641, 2018.
Matciak, M. and Nowacki, J.: The Vistula river discharge front – surface observations, Oceanologica, 37, 75–88, 1995.
Nedwell, D. B., Hall, S.-E., Andersson, A., Hagström, Å. F., and Lindström, E. B.: Seasonal changes in the distribution and exchange of inorganic nitrogen between sediment and water in the Northern Baltic (Gulf of Bothnia), Estuar. Coast. Shelf Sci., 17, 169–179, https://doi.org/10.1016/0272-7714(83)90061-6, 1983.
Nedwell, D. B., Jickells, T. D., Trimmer, M., and Sanders, R.: Nutrients in Estuaries, in: Estuaries, Vol. 29, edited by: Nedwell, D. B. and Raffaeli, D. G., Academic Press, London, UK, 43–92, 1999.
Nielsen, L. P.: Denitrification in sediment determined from nitrogen isotope pairing, FEMS Microbiol. Lett., 86, 357–362, https://doi.org/10.1111/j.1574-6968.1992.tb04828.x, 1992.
Nielsen, L. P. and Glud, R. N.: Denitrification in a coastal sediment measured in situ by the nitrogen isotope pairing technique applied to a benthic flux chamber, Mar. Ecol. Prog. Ser., 137, 181–186, https://doi.org/10.3354/meps137181, 1996.
Nixon, S. W.: Coastal marine eutrophication: A definition, social causes, and future concerns, Ophelia, 41, 199–219, https://doi.org/10.1080/00785236.1995.10422044, 1995.
Nixon, S. W., Ammerman, J. W., Atkinson, L. P., Berounsky, V. M., Billen, G., Boicourt, W. C., Boynton, W. R., Church, T. M., Ditoro, D. M., Elmgren, R., Garber, J. H., Giblin, A. E., Jahnke, R. A., Owens, N. J. P., Pilson, M. E. Q., and Seitzinger, S. P.: The fate of nitrogen and phosphorus at the land-sea margin of the North Atlantic Ocean, Biogeochemistry, 35, 141–180, https://doi.org/10.1007/BF02179826, 1996.
Pastuszak, M. and Witek, Z.: Discharges of water and nutrients by the Vistula and Oder rivers draining Polish territory, in: Temporal and spatial differences in emission of nitrogen and phosphorus from Polish territory to the Baltic Sea, edited by: Pastuszak, M. and Igras, J., National Marine Fisheries Research Institute, Institute of Soil Science and Plant Cultivation, Fertilizer Research Institute, Gdynia, 309–346, 2012.
Pastuszak, M., Stålnacke, P., Pawlikowski, K., and Witek, Z.: Response of Polish rivers (Vistula, Oder) to reduced pressure from point sources and agriculture during the transition period (1988–2008), J. Mar. Syst., 94, 157–173, https://doi.org/10.1016/j.jmarsys.2011.11.017, 2012.
Phillips, C. J., Smith, Z., Embley, T. M., and Prosser, J. I.: Phylogenetic differences between particle-associated and planktonic ammonia-oxidizing bacteria of the beta subdivision of the class Proteobacteria in the Northwestern Mediterranean Sea, Appl. Environ. Microbiol., 65, 779–86, 1999.
Piña-Ochoa, E. and Álvarez-Cobelas, M.: Denitrification in aquatic environments: A cross-system analysis, Biogeochemistry, 81, 111–130, https://doi.org/10.1007/s10533-006-9033-7, 2006.
Precht, E., Franke, U., Polerecky, L., and Huettel, M.: Oxygen dynamics in permeable sediments with wave-driven pore water exchange, Limnol. Oceanogr., 49, 693–705, https://doi.org/10.4319/lo.2004.49.3.0693, 2004.
Rabalais, N. N.: Nitrogen in Aquatic Ecosystems, AMBIO A J. Hum. Environ., 31, 102–112, https://doi.org/10.1579/0044-7447-31.2.102, 2002.
Radtke, H., Neumann, T., Voss, M., and Fennel, W.: Modeling pathways of riverine nitrogen and phosphorus in the Baltic Sea, J. Geophys. Res.-Ocean., 117, 1–15, https://doi.org/10.1029/2012JC008119, 2012.
Rao, A. M. F., McCarthy, M. J., Gardner, W. S., and Jahnke, R. A.: Respiration and denitrification in permeable continental shelf deposits on the South Atlantic Bight: Rates of carbon and nitrogen cycling from sediment column experiments, Cont. Shelf Res., 27, 1801–1819, https://doi.org/10.1016/j.csr.2007.03.001, 2007.
Rao, A. M. F., McCarthy, M. J., Gardner, W. S., and Jahnke, R. A.: Respiration and denitrification in permeable continental shelf deposits on the South Atlantic Bight: N2:Ar and isotope pairing measurements in sediment column experiments, Cont. Shelf Res., 28, 602–613, https://doi.org/10.1016/j.csr.2007.11.007, 2008.
Revsbech, N. P., Jorgensen, B. B., and Blackburn, T. H.: Oxygen in the Sea Bottom Measured with a Microelectrode, Science, 207, 1355–1356, https://doi.org/10.1126/science.207.4437.1355, 1980.
Richards, K. J.: Physical Processes in the Benthic Boundary Layer, Philos. Trans. R. Soc. A, 331, 3–13, https://doi.org/10.1098/rsta.1990.0052, 1990.
Richardson, K. and Jørgensen, B. B.: Eutrophication: Definition, History and Effects, in: Eutrophication in Coastal Marine Ecosystems, American Geophysical Union, 1–19, 2013.
Risgaard-Petersen, N., Nielsen, L. P., Rysgaard, S., Dalsgaard, T., and Meyer, R. L.: Application of the isotope pairing technique in sediments where nanammox and denitrification coexist, Limnol. Ocean. Method., 1, 63–73, https://doi.org/10.4319/lom.2003.1.63, 2003.
Rolff, C. and Elmgren, R.: Use of riverine organic matter in plankton food webs of the Baltic Sea, Mar. Ecol. Prog. Ser., 197, 81–101, https://doi.org/10.3354/meps197081, 2000.
Rysgaard, S., Risgaard-Petersen, N., Sloth, N. P., Jensen, K., and Nielsen, L. P.: Oxygen regulation of nitrification and denitrification in sediments, Limnol. Oceanogr., 39, 1643–1652, https://doi.org/10.4319/lo.1994.39.7.1643, 1994.
Santos, I. R., Eyre, B. D., and Huettel, M.: The driving forces of porewater and groundwater flow in permeable coastal sediments: A review, Estuar. Coast. Shelf Sci., 98, 1–15, https://doi.org/10.1016/j.ecss.2011.10.024, 2012.
Savoye, N., Aminot, A., Tréguer, P., Fontugne, M., Naulet, N., and Kérouel, R.: Dynamics of particulate organic matter δ15N and δ13C during spring phytoplankton blooms in a macrotidal ecosystem (Bay of Seine, France), Mar. Ecol. Prog. Ser., 255, 27–41, https://doi.org/10.3354/meps255027, 2003.
Schlitzer, H. D.: Ocean data view, Alfred Wegener Inst. Polar Mar. Res. Bremerhaven, 2015.
Seitzinger, S., Harrison, J. A., Böhlke, J. K., Bouwman, A. F., Lowrance, R., Peterson, B., Tobias, C., and Van Drecht, G.: Denitrification across landscapes and waterscapes: A synthesis, Ecol. Appl., 16, 2064–2090, 2006.
Seitzinger, S. P. and Nixon, S. W.: Eutrophication and the rate of denitrification and N20 production in coastal marine sediments, Limnol. Oceanogr., 30, 1332–1339, https://doi.org/10.4319/lo.1985.30.6.1332, 1985.
Siegel, H., Gerth, M., and Schmidt, T.: Water exchange in the Pomeranian Bight investigated by satellite data and shipborne measurements, Cont. Shelf Res., 16, 1793–1801, https://doi.org/10.1016/0278-4343(96)00012-X, 1996.
Sigman, D. M., Casciotti, K. L., Andreani, M., Barford, C., Galanter, M., and Böhlke, J. K.: A Bacterial Method for the Nitrogen Isotopic Analysis of Nitrate in Seawater and Freshwater, Anal. Chem., 73, 4145–4153, https://doi.org/10.1021/ac010088e, 2001.
Silvennoinen, H., Hietanen, S., Liikanen, A., Stange, C. F., Russow, R., and Martikainen, P. J.: Denitrification in the River Estuaries of the Northern Baltic Sea, Ambio, 36, 134–140, https://doi.org/10.1579/0044-7447(2007)36[134:DITREO]2.0.CO;2, 2007.
SMHI: Djupdata för havsområden 2003, Norrköping, SMHI, 1–69, 2003.
Soetaert, K., Middelburg, J. J., Heip, C., Meire, P., Van Damme, S., and Maris, T.: Long-term change in dissolved inorganic nutrients in the heterotrophic Scheldt estuary (Belgium, The Netherlands), Limnol. Oceanogr., 51, 409–423, 2006.
Statham, P. J.: Nutrients in estuaries–an overview and the potential impacts of climate change, Sci. Total Environ., 434, 213–27, https://doi.org/10.1016/j.scitotenv.2011.09.088, 2012.
Stepanauskas, R., Jørgensen, N. O. G., Eigaard, O. R., Žvikas, A., Tranvik, L. J., and Leonardson, L.: Summer inputs of riverine nutrients to the Batlic Sea: Bioavailability and eutrophication relevance, Ecol. Monogr., 72, 579–597, https://doi.org/10.1890/0012-9615(2002)072[0579:SIORNT]2.0.CO;2, 2002.
Sweitzer, J., Langaas, S., and Folke, C.: Land use and population density in the Baltic Sea drainage basin: A GIS database, Ambio, 25, 191–198, 1996.
Taylor, P. G. and Townsend, A. R.: Stoichiometric control of organic carbon–nitrate relationships from soils to the sea, Nature, 464, 1178–1181, https://doi.org/10.1038/nature08985, 2010.
Thibodeaux, L. J. and Boyle, J. D.: Bedform-Generated convective transport in Bottom sediment, Nature, 325, 341–343, https://doi.org/10.1038/325341a0, 1987.
Thoms, F., Burmeister, C., Dippner, J. W., Gogina, M., Janas, U., Kendzierska, H., Liskow, I., and Voss, M.: Impact of macrofaunal communities on the coastal filter function in the Bay of Gdansk, Baltic Sea, Front. Mar. Sci., 5, 1–19, https://doi.org/10.3389/fmars.2018.00201, 2018.
Trimmer, M., Nicholls, J. C., and Deflandre, B.: Anaerobic Ammonium Oxidation Measured in Sediments along the Thames Estuary, United Kingdom, Appl. Environ. Microbiol., 69, 6447–6454, https://doi.org/10.1128/AEM.69.11.6447-6454.2003, 2003.
Turnewitsch, R. and Graf, G.: Variability of particulate seawater properties related to bottom mixed layer-associated internal waves in shallow water on a time scale of hours, Limnol. Oceanogr., 48, 1254–1264, https://doi.org/10.4319/lo.2003.48.3.1254, 2003.
Veuger, B., Pitcher, A., Schouten, S., Sinninghe Damsté, J. S., and Middelburg, J. J.: Nitrification and growth of autotrophic nitrifying bacteria and Thaumarchaeota in the coastal North Sea, Biogeosciences, 10, 1775–1785, https://doi.org/10.5194/bg-10-1775-2013, 2013.
Voss, M., Emeis, K.-C., Hille, S., Neumann, T., and Dippner, J. W.: Nitrogen cycle of the Baltic Sea from an isotopic perspective, Global Biogeochem. Cy., 19, GB3001, https://doi.org/10.1029/2004GB002338, 2005a.
Voss, M., Liskow, I., Pastuszak, M., Rüβ, D., Schulte, U., and Dippner, J. W.: Riverine discharge into a coastal bay: A stable isotope study in the Gulf of Gdańsk, Baltic Sea, J. Mar. Syst., 57, 127–145, https://doi.org/10.1016/j.jmarsys.2005.04.002, 2005b.
Ward, B. B.: Nitrification in Marine Systems, in: Nitrogen in the Marine Environment, edited by: Capone, D. G., Bronk, D. A., Mulholland, M. R., and Carpenter, E. J., Elsevier, 199–261, 2008.
Ward, B. B.: Measurement and Distribution of Nitrification Rates in the Oceans, in: Methods in enzymology, Vol. 486, 307–323, 2011.
Ward, B. B., Talbot, M. C., and Perry, M. J.: Contributions of phytoplankton and nitrifying bacteria to ammonium and nitrite dynamics in coastal waters, Cont. Shelf Res., 3, 383–398, https://doi.org/10.1016/0278-4343(84)90018-9, 1984.
Wasmund, N., Topp, I., and Schories, D.: Optimising the storage and extraction of chlorophyll samples Chlorophyll Methodology Extraction Storage Freezing, Oceanologia, 48, 125–144, 2006.
Wielgat-Rychert, M., Ameryk, A., Jarosiewicz, A., Kownacka, J., Rychert, K., Szymanek, L., Zalewski, M., Agatova, A., Lapina, N., and Torgunova, N.: Impact of the inflow of Vistula river waters on the pelagic zone in the Gulf of Gdańsk, Oceanologia, 55, 859–886, https://doi.org/10.5697/oc.55-4.859, 2013.
Wikner, J. and Andersson, A.: Increased freshwater discharge shifts the trophic balance in the coastal zone of the northern Baltic Sea, Glob. Change Biol., 18, 2509–2519, https://doi.org/10.1111/j.1365-2486.2012.02718.x, 2012.
Witek, Z., Ochocki, S., Nakonieczny, J., Podgórska, B., and Drgas, A.: Primary production and decomposition of organic matter in the epipelagic zone of the Gulf of Gdansk, an estuary of the Vistula, ICES J. Mar. Sci., 56, 3–14, 1999.
Yager, P. L., Potvin, M., Farnelid, H., Waller, A. S., Heinrich, F., Mende, D. R., Estrada, M., Bork, P., Tremblay, J.-É., Bertilsson, S., Alonso-Saez, L., Lovejoy, C., Riemann, L., Pedros-Alio, C., and Bakker, K.: Role for urea in nitrification by polar marine Archaea, P. Natl. Acad. Sci. USA, 109, 17989–17994, https://doi.org/10.1073/pnas.1201914109, 2012.