the Creative Commons Attribution 4.0 License.
the Creative Commons Attribution 4.0 License.
 | 09 Oct 2019
Response of simulated burned area to historical changes in environmental and anthropogenic factors: a comparison of seven fire models
Lina Teckentrup
Sandy P. Harrison
Stijn Hantson
Angelika Heil
Joe R. Melton
Matthew Forrest
Chao Yue
Almut Arneth
Thomas Hickler
Stephen Sitch
Gitta Lasslop
Understanding how fire regimes change over time is of major importance for understanding their future impact on the Earth system, including society. Large differences in simulated burned area between fire models show that there is substantial uncertainty associated with modelling global change impacts on fire regimes. We draw here on sensitivity simulations made by seven global dynamic vegetation models participating in the Fire Model Intercomparison Project (FireMIP) to understand how differences in models translate into differences in fire regime projections. The sensitivity experiments isolate the impact of the individual drivers on simulated burned area, which are prescribed in the simulations. Specifically these drivers are atmospheric CO2 concentration, population density, land-use change, lightning and climate.
The seven models capture spatial patterns in burned area. However, they show considerable differences in the burned area trends since 1921. We analyse the trajectories of differences between the sensitivity and reference simulation to improve our understanding of what drives the global trends in burned area. Where it is possible, we link the inter-model differences to model assumptions.
Overall, these analyses reveal that the largest uncertainties in simulating global historical burned area are related to the representation of anthropogenic ignitions and suppression and effects of land use on vegetation and fire. In line with previous studies this highlights the need to improve our understanding and model representation of the relationship between human activities and fire to improve our abilities to model fire within Earth system model applications. Only two models show a strong response to atmospheric CO2 concentration. The effects of changes in atmospheric CO2 concentration on fire are complex and quantitative information of how fuel loads and how flammability changes due to this factor is missing. The response to lightning on global scale is low. The response of burned area to climate is spatially heterogeneous and has a strong inter-annual variation. Climate is therefore likely more important than the other factors for short-term variations and extremes in burned area. This study provides a basis to understand the uncertainties in global fire modelling. Both improvements in process understanding and observational constraints reduce uncertainties in modelling burned area trends.
- Article
(3778 KB) - Full-text XML
- BibTeX
- EndNote


Wildfires are an important driver of vegetation distribution and regulate ecosystem functioning, biodiversity and carbon storage over large parts of the world (Bond et al., 2005; Hantson et al., 2016a). Fire has strong impacts on climate through changing land surface properties, through atmospheric chemistry and hence radiative forcing and through biogeochemical cycling (Bowman et al., 2009; Randerson et al., 2012; Ward et al., 2012; Yue et al., 2016; Li and Lawrence, 2017; Li et al., 2017; Lasslop et al., 2019). Estimates of the net effect of fire on the Earth system vary. Analyses based on observations of the pre-industrial period suggest that the contribution of fire to the overall climate–carbon–cycle feedback is substantial with 5.6 ± 3.2 ppm K−1 CO2 (Harrison et al., 2018) while the strength of the global land climate–carbon–cycle feedback estimated from Earth system simulations (Arora et al., 2013) is 17.5 ppm K−1 (Harrison et al., 2018). However, comparing potential fire-induced losses from terrestrial carbon pools and stocks of solid pyrogenic carbon in soils and ocean, fire may also be a net sink of carbon, and Earth system simulations show a negative effect of fire on radiative forcing (Lasslop et al., 2019). In addition to these consequences for the Earth system, wildfires directly impact society and economy (Gauthier et al., 2015), and human health can be seriously impaired (Johnston et al., 2012; Finlay et al., 2012).
Given the various impacts of fire on natural and human systems, and the large uncertainties, it is important to improve the understanding of what controls the occurrence of wildfires and to know how fire regimes might change in the future.
Based on current process understanding, the following drivers influenced burned area over the last decades to centuries. Increasing atmospheric CO2 concentration leads to increases in net primary production (Hickler et al., 2008), and decreased stomatal conductance reduces the plant transpiration and enhances water conservation in plants (Morison, 1985). It can lead to an increase in the abundance of woody plants (“woody thickening”; Wigley et al., 2010; Bond and Midgley, 2012; Buitenwerf et al., 2012) because C3 plants are generally more competitive than C4 plants under higher atmospheric CO2 concentration (e.g. Ehleringer and Björkman, 1977; Ehleringer et al., 1997; Wand et al., 2001; Sage and Kubien, 2007). The impact of these various changes on burned area is complex. Increased productivity can lead to increased fuel availability, which can lead to increased burned area in water- and fuel-limited regions (Kelley and Harrison, 2014). On the other hand, decreased stomatal conductance and lower transpiration can lead to enhanced water conservation in plants. This increases the moisture content of soil, as well as vegetation moisture content, and consequently increases live and dead fuel moisture contents, which decreases flammability and reduces burned area. Woody thickening can lead to a reduction in burned area through changing the nature of fuel loads (Kelley and Harrison, 2014).
There is still controversy about whether humans increase or decrease fire overall. Although there is broad agreement that humans suppress fires in regions with high population density, observational studies are less clear about what happens in areas of low population density and show both increases or decreases due to human activities (see for instance Marlon et al., 2008; Bowman et al., 2011; Marlon et al., 2013; Vannière et al., 2016; Andela et al., 2017; Balch et al., 2017). Studies of the covariation between population density and number of fires have shown that increasing population density leads to an increase in the number of ignitions or in the number of individual fires until peaking at intermediate population densities and then subsequently dropping (Syphard et al., 2009; Archibald et al., 2010). Burned area can be expressed as the number of fires multiplied by their fire size. The increase in burned area due to changes in ignitions is expected to differ between regions with varying population density as the largest fires occur in unpopulated areas (Hantson et al., 2015a). Global analyses find that the net effect of population density is a decrease in burned area (Bistinas et al., 2014; Knorr et al., 2014), with high uncertainties for low population density if the method allows for non-monotonic relationships (Knorr et al., 2014). Regional analyses tend to confirm this, but positive relationships between burned area and population density have been shown, for instance, for the least disturbed areas in the USA (Parisien et al., 2016).
Fire was used to manage croplands in pre-industrial times (e.g. Dumond, 1961; Otto and Anderson, 1982; Johnston, 2003) and is still common practice mainly in non-industrialized areas (i.e. sub-Saharan Africa, parts of Southeast Asia, Indonesia and Latin America; e.g. Conklin, 1961; Rasul and Thapa, 2003). However fires in agricultural areas are common all over the world (Korontzi et al., 2006). Global analyses indicate a decrease in burned area (Bistinas et al., 2014; Andela and van der Werf, 2014) and fire size (Hantson et al., 2015b) with increases in cropland fraction. Fires on pasturelands have been estimated to contribute over 40 % of the global burned area (Rabin et al., 2015). Analyses of global datasets have found an increase in burned area with increases in grazing land cover (Bistinas et al., 2014) but found reduced burned area on intensely grazed areas (Andela et al., 2017). Despite these analyses, the severe data gaps limit our level of understanding on how humans use fire in land management (Erb et al., 2017).
Lightning is the main source of natural ignitions (Scott et al., 2014). It is connected to convective activity and is therefore expected to change with global warming (Krause et al., 2014). Most of the burned area in boreal regions results from a few large fires (Stocks et al., 2002); these large fires are frequently ignited by lightning (Peterson et al., 2010). Veraverbeke et al. (2017) have shown that lightning ignitions drive the inter-annual variability as well as the long-term trends of ignitions in boreal regions.
Climate influences burned area through weather conditions and through its influence on vegetation (Bistinas et al., 2014; Forkel et al., 2017). Weather conditions (precedent precipitation, temperature and wind speed) influence fuel drying, and wind speed additionally affects the rate of fire spread (Harrison et al., 2010; Scott et al., 2014). Vegetation type and fuel load are driven by climate, and both strongly influence fire occurrence (Chuvieco et al., 2008; Pettinari and Chuvieco, 2016). Fires are limited under dry conditions due to low vegetation productivity and therefore insufficient fuel, and are limited under wet conditions because the fuel is too wet to burn. The highest burned areas are therefore found in areas with intermediate moisture conditions (Krawchuk and Moritz, 2011). There is no obvious disagreement in literature about how specific climatic factors influence fire. However, the relative importance of each factor, e.g. weather vs. vegetation, is still uncertain and varies spatially (Forkel et al., 2017). Fire models are sensitive to meteorological forcing, and different forcing datasets already lead to large differences in simulated burned area (Rabin et al., 2017a; Lasslop et al., 2014). The importance of factors also varies between small and large scales. Wind speed is an obvious driver of fire spread on the local scale, but it is difficult to extract this influence on the spatial resolution of global models (Lasslop et al., 2015).
Fire-enabled vegetation models simulate fire regimes in response to the combination of individual forcings, including atmospheric CO2 concentration, population density, land-use change, lightning and climate. Individual fire-enabled vegetation models have been shown to simulate observed global patterns of burned area and fire emissions reasonably well (Kloster et al., 2010; Prentice et al., 2011; Li et al., 2012; Lasslop et al., 2014; Yue et al., 2014), but there are large differences between models in terms of regional patterns, fire seasonality and inter-annual variability, historical trends (Kelley et al., 2013; Andela et al., 2017) and responses to individual factors (Kloster et al., 2010; Knorr et al., 2014, 2016; Lasslop and Kloster, 2017, 2015). The Fire Model Intercomparison Project (FireMIP, Hantson et al., 2016a; Rabin et al., 2017a) provides a systematic framework to consistently analyse and understand the causes of these differences and to relate them to differences in the treatment of key drivers of fire in individual models. FireMIP provides simulations for a systematic comparison of fire model behaviour based on outputs of a large range of models with identical forcing inputs. In addition to a reference historical simulation, sensitivity simulations were conducted for individual forcings, specifically atmospheric CO2 concentration, population density, land-use change, lightning and climate. A recent evaluation of the FireMIP models indicates that the relationship with climatic parameters is captured well by models, the response to human factors is captured by some models and the response to vegetation productivity or the allocation of carbon to fuels needs refinement for most models (Forkel et al., 2019a). Comparisons of the FireMIP historical simulations found differences in transient model behaviour in the 20th century (Andela et al., 2017; van Marle et al., 2017). The causes of the differences and the reasons why different models show different responses are not yet understood.
In this multi-model study we use the historical simulation to show the overall modelled response of burned area to changes in environmental and human factors. We then compare the sensitivity experiments of the five most commonly used driving factors to document how simulated burned area responds to the individual forcing factors and relate inter-model differences of the burned area response to differences in model assumptions or parametrization. We finally suggest implications of our results for model development and application.
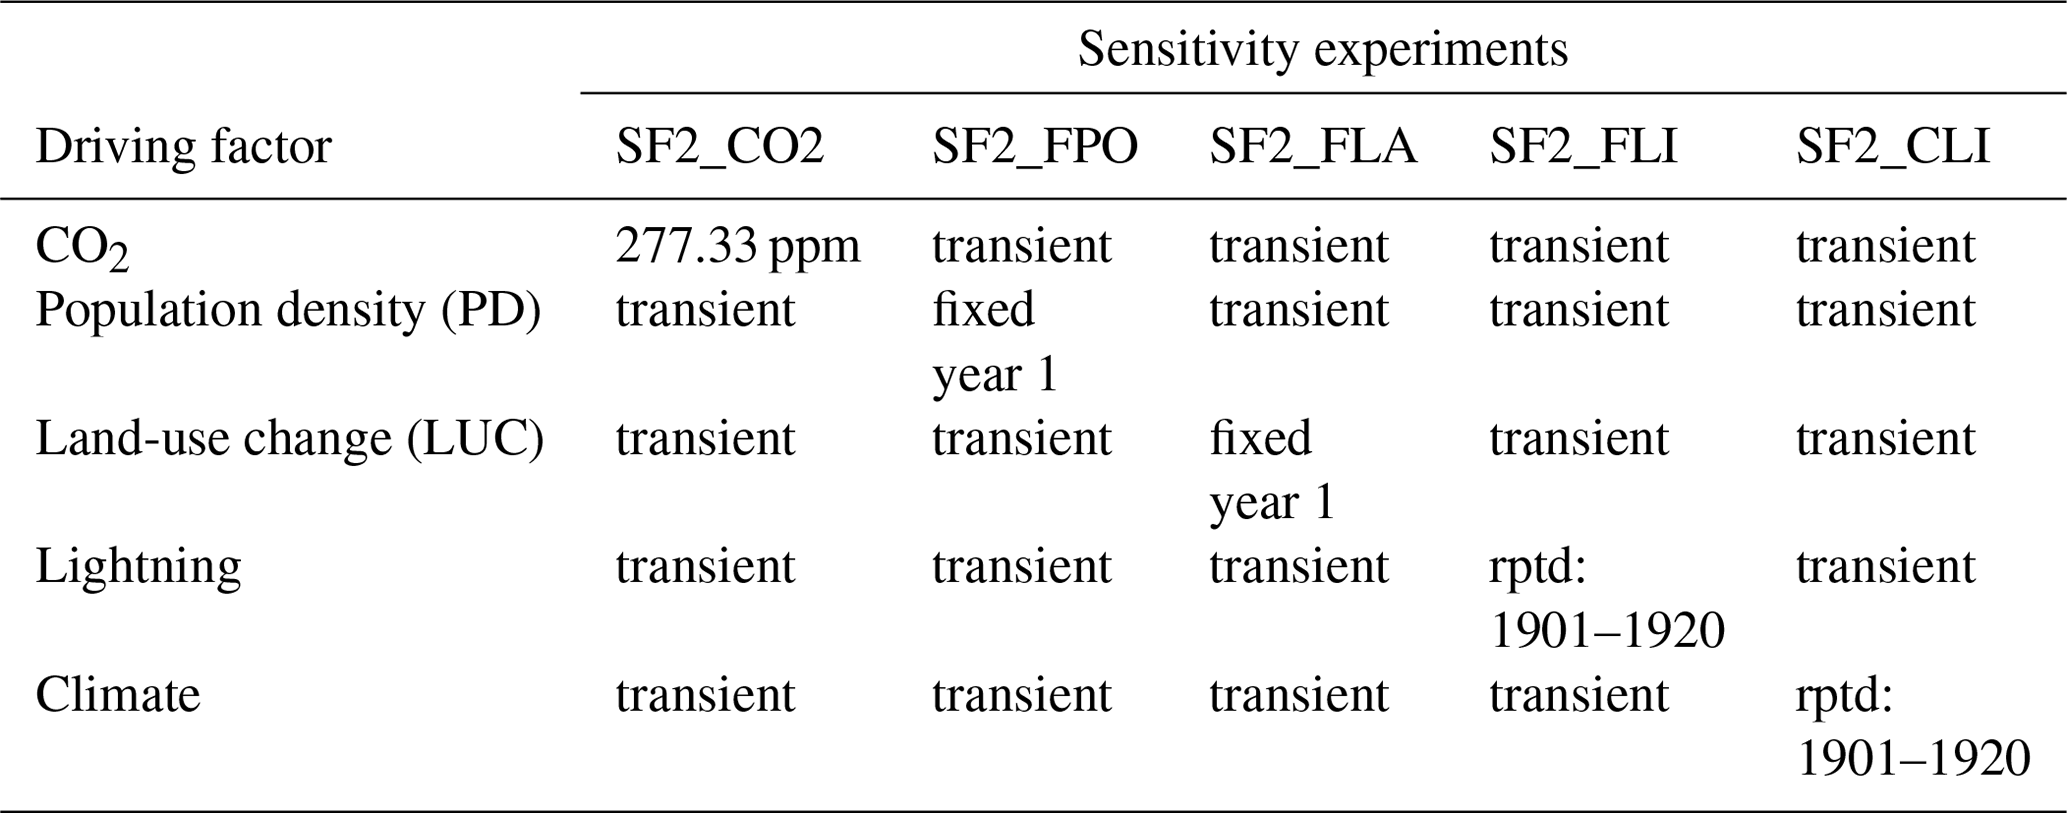
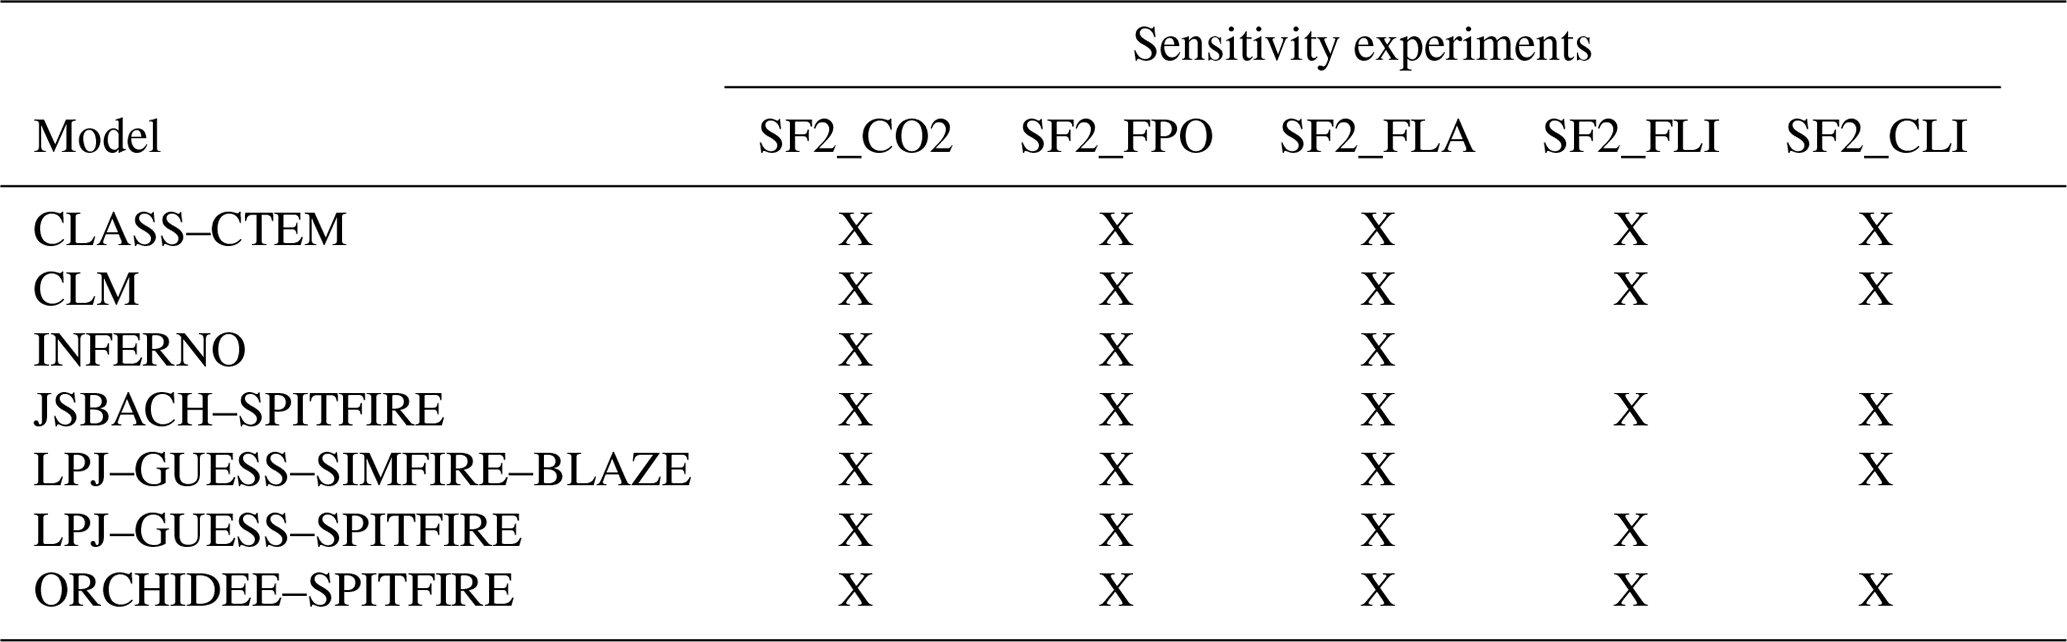
The baseline FireMIP experiment (SF1) is a transient simulation from 1700 to 2013, in which atmospheric CO2 concentration, population density, land use, lightning and climate change through time according to prescribed datasets. The baseline and sensitivity simulations start from the end of a spin-up simulation with equilibrated carbon pools (see Rabin et al., 2017a, for details of the experimental protocol). The five sensitivity experiments (SF2) are designed to isolate differences in model behaviour associated with individual forcing factors. The model inputs and setup are the same as in SF1, but one of the forcings is kept constant at the value used in the spin-up throughout the experiment (see Table 1). Thus, for example in SF2_CO2, population density, land use, lightning and climate inputs change each year, but atmospheric CO2 concentration is held constant at 277.33 ppm for the whole of the simulation. The resulting difference in burned area between the simulations is then a combination of the changes in the forcing and the sensitivity of the model to that forcing factor. Not all models performed every sensitivity experiment due to limitations in model structure (see Table 2). Detailed model descriptions can be found in the corresponding literature listed in Table A1. Two of the models (CLASS–CTEM and CLM) started the simulations later than the others (1861 and 1850, respectively), and due to limitations in data availability the reference year of the forcings used in the spin-up varies (see Table 1). We account for these differences in starting years between models and in the forcing factors by limiting our analysis to the period where all factors are different from the ones used in the spin-up (after 1921). These differences still influence the absolute differences, and we therefore quantify the strength of the impact through the slope of a regression line and do not interpret the offset.
Table 1Overview over the sensitivity experiments conducted by FireMIP models (Rabin et al., 2017a). Rptd indicates the forcing was repeated over the given years. SF2_CO2 stands for fixed atmospheric CO2 concentration, SF2_FPO for fixed population density, SF2_FLA for fixed land use, SF2_FLI for fixed lightning and SF2_CLI for fixed climate.
2.1 Data processing and analysis of simulation results
Our analyses of the SF1 and SF2 simulations focus on the simulation of burned area but are complemented by effects on vegetation carbon pools for the SF2_CO2 simulation. We focus on the time series of global burned area over the historical simulation and the spatial patterns of differences in burned area between 1921 and 2013, as in this period all forcings are transient and different from the values used in the spin-up. Annual global values are an area weighted average using the grid cell area. We quantify the response of the models to each driving factor using the absolute difference in burned area between the baseline and the respective sensitivity experiment (SF1-SF2_i, with i in CO2, FPO, FLA, FLI, and CLI; see Table 1 for details). Positive differences mean that the transient change of the factor leads to an increase in burned area. We use the Climate Data Operators (CDO version 2018: Climate Data Operators; available at: http://www.mpimet.mpg.de/cdo, last access: 30 January 2019) to process and remap the simulated outputs. We test the difference time series for trends over the period from 1921 to 2013 using the Mann–Kendall test, implemented in the R package Kendall (McLeod, 2011). We quantify the global trend as the slope of a linear regression and summarize the spatial distribution of trends by quantifying the area with significant positive trends and the area with significant negative trends.
Due to a postprocessing error, INFERNO lacks 2 years in SF2_CO2 (2001 and 2002).
2.2 Model–data comparison
To evaluate the simulations of burned area, we compare the simulated burned area with remote sensing data products. Global burned area observations from satellites still suffer from substantial uncertainty, as reflected by the considerable differences in spatial and temporal patterns between different data products (Humber et al., 2018; Hantson et al., 2016a; Chuvieco et al., 2018; van der Werf et al., 2017). Using multiple satellite products in model benchmarking is one approach which takes into account these observational uncertainties (Rabin et al., 2017a). In this study, we use three satellite products: GFED4 (Giglio et al., 2013), GFED4s (van der Werf et al., 2017) and FireCCI50 (Chuvieco et al., 2018). GFED4 is a gridded version of the MODIS Collection 5.1 MCD64 burned area product. It is known that this product strongly underestimates small fires, including cropland fires (e.g. Hall et al., 2016). In GFED4s, burned area due to small fires is estimated based on MODIS active fire (AF) detections and added to GFED4 burned area. However, this methodology may introduce significant errors related to erroneous AF detections (Zhang et al., 2018). As a complementary product, FireCCI50 was developed using MODIS spectral bands with higher spatial resolution than MCD64. A higher resolution enhances the ability to detect smaller fires; however, this improvement is partially offset by suboptimal spectral properties of the bands. Both GFED4s and FireCCI50 have a larger burned area than GFED4. Since all three products are based on MODIS data, the inter-product differences probably underestimate uncertainties associated with these products. A recent mapping of burned area for Africa using higher-resolution Sentinel-2 observations indicates that all three products substantially underestimate burned area (Roteta et al., 2019). For the model evaluation we use temporally averaged burned area fraction for the years 2001–2013, which is the interval common to all three satellite products and the model simulations. We resample the model outputs to the lowest model resolution (CLASS-CTEM: ) with first-order conservative remapping. We quantify the agreement between models and observations by providing the global burned area and the Pearson correlation coefficient for the between grid cell variation (see Table 3). We choose the Pearson correlation as it quantifies the covariation of the spatial patterns and is less sensitive to the highly uncertain absolute burned area values. Burned area has a strongly skewed distribution, with few high values and many small values close to, or equal to, zero. These few high values have a much higher contribution to the overall correlation (see Fig. A9 in Appendix), and therefore the metric is strongly determined by the performance of the model in areas with high burning. Square root or logarithmic transformation leads to more normally distributed values that reduce this bias (see Fig. A9). As the logarithm transformation excludes grid cells with zero burned area, we adopt the square root transformation.
In spite of major advances in mapping burned area based on satellite data, these data products include major uncertainties. GFED4 and FireCCI50 provide uncertainty estimates for the burned area. Applying Gaussian error propagation, which assumes that errors are independent and normally distributed, yields uncertainty estimates of 0.01 % (GFED4) and 0.2 % (FireCCI50) of the global burned area, which is certainly an underestimation. The assumptions of normal distribution and independence are likely violated. The spread between global burned area datasets is probably a more realistic estimate. Since all the products rely on the MODIS sensor, this approach will not capture the full uncertainty. Nevertheless, to investigate the effect of data quality in the observations on the model–data comparison we use the burned area product uncertainty estimates (aggregated to model resolution assuming independence) to group the observations into points with low, medium and high uncertainty (low: within the 0–33rd percentile, medium: within the 33rd–66th percentile and high: within the 66th–99th percentile of the relative uncertainty; estimates = uncertainty ∕ burned area). We then compute the correlations for datapoints with low, medium and high uncertainty separately.
3.1 Simulated historical burned area
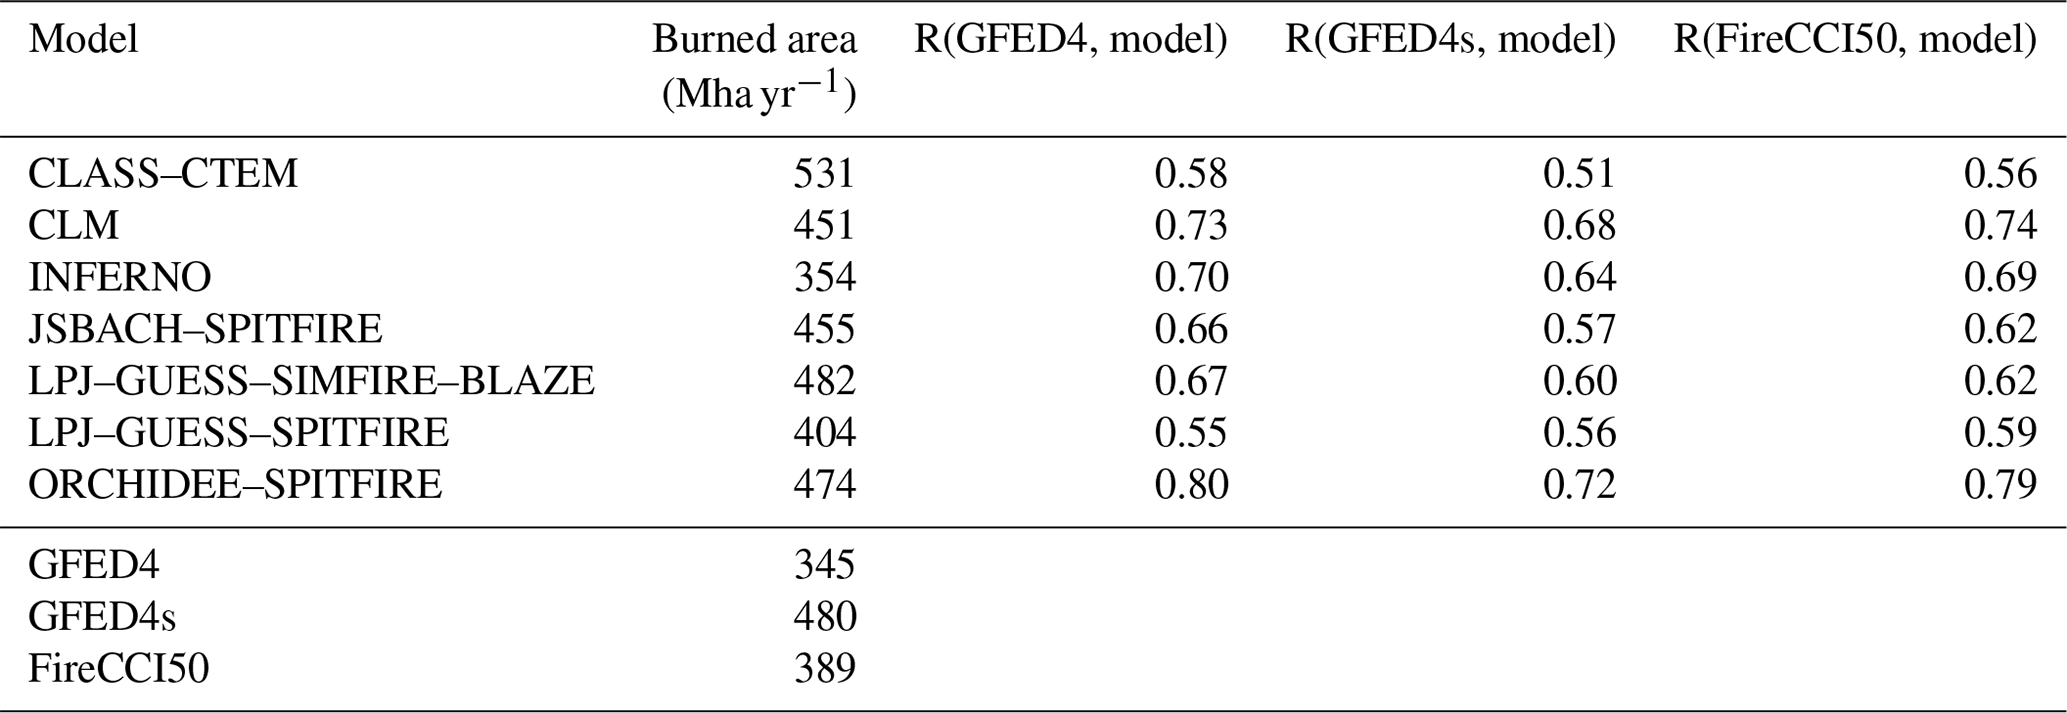
The models show magnitudes of annual global burned area between 354 and 531 Mha yr−1 for present day. This is comparable to the estimates obtained from the satellite products, which range from 345 to 480 Mha yr−1 (see Fig. 1, Table 3). The correlation coefficients between all of the simulations and the satellite observations are reasonable, with values ranging from 0.51 (CLASS–CTEM and GFED4s) to 0.8 (ORCHIDEE–SPITFIRE and GFED4; see Table 3). In general, the correlations with GFED4 are highest and with GFED4s being the lowest for almost all models – which may reflect the fact that most models do not explicitly simulate agricultural fires or may indicate inaccuracies in the mapping of agricultural fires in the GFED4s dataset. The correlation coefficients strongly decrease with increasing observational relative uncertainty (see Table A2 in Appendix). This shows that part of the mismatch in the spatial patterns between simulations and observations is a consequence of uncertainties in the satellite products themselves. The FireMIP models simulate the broad-scale patterns in burned area reasonably well (see Fig. A1), with maxima in the major fire-affected regions of the Sahel, southern Africa, northern Australia and the western USA. All of the models tend to overestimate the burned area in South America and also in the temperate regions of the USA. For a more detailed evaluation of the burned area see Forkel et al. (2019a).
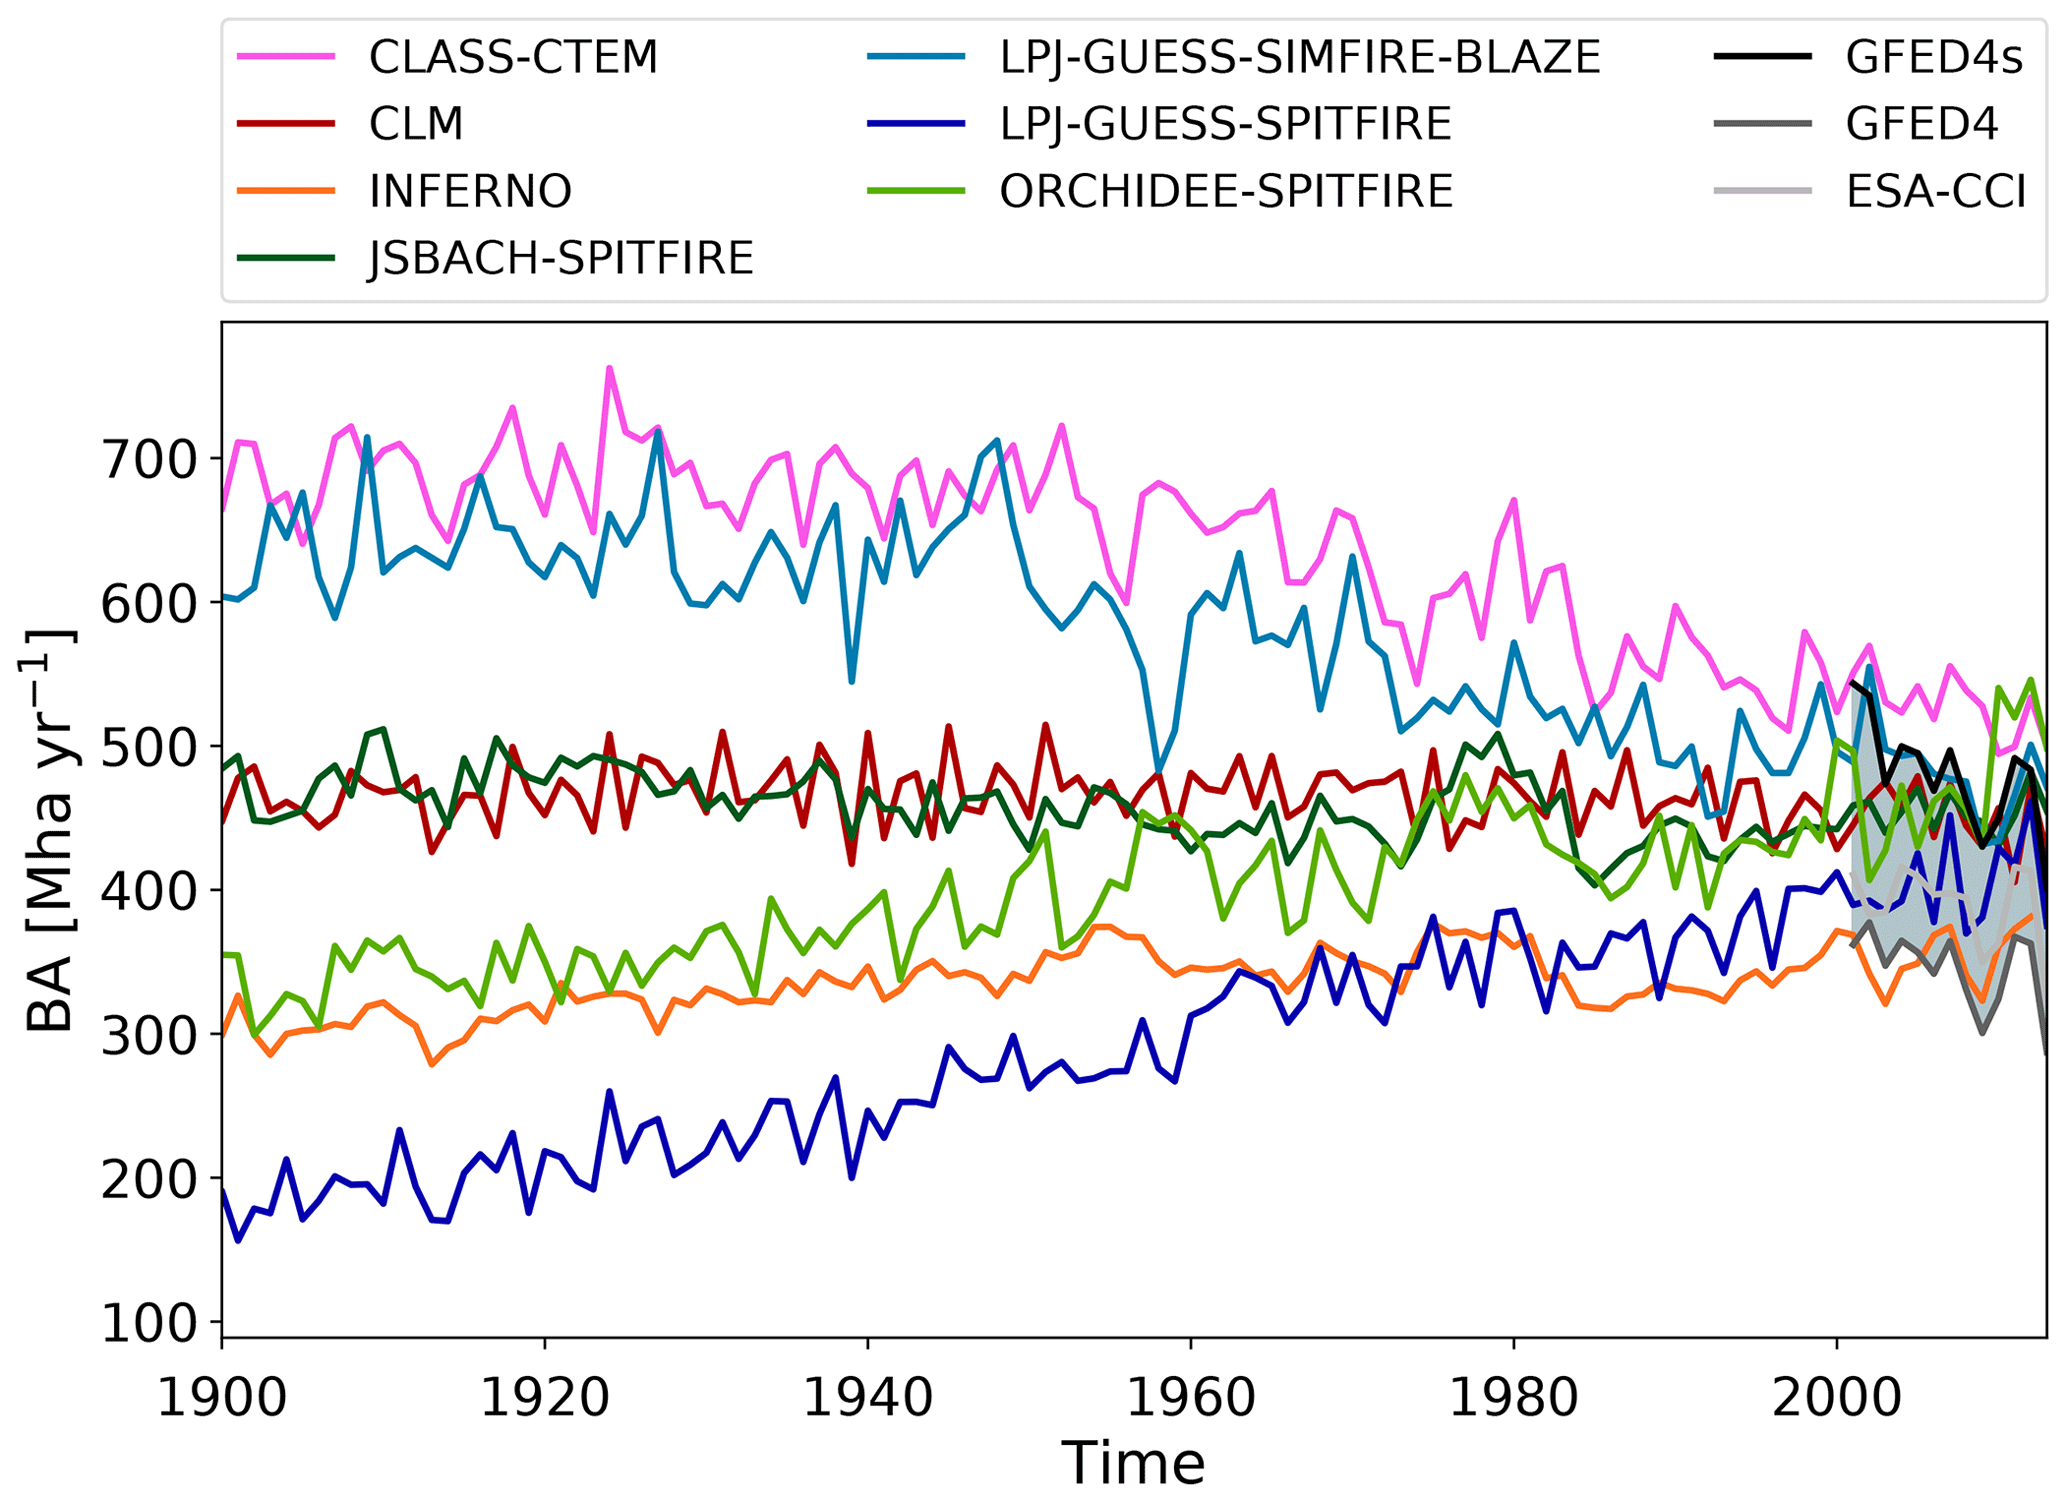
Figure 1Annual global burned area (BA) in megahectare per year (Mha yr−1) for all FireMIP models for 1921–2013 for the baseline experiment SF1. The shaded area indicates the range of annual global burned area values for the observations.
Table 3Global burned area averaged over 2001–2013 in megahectare per year (Mha yr−1) and the Pearson correlation coefficients between the baseline experiment SF1 for all FireMIP models and the respective observation data. We use a square root transformation on both model and observations. All correlation coefficients are significant (p value < 0.05).
The simulated trend in burned area in the historical simulation differs between the models (see Fig. 1). All models show a significant trend over the time series from 1921 to 2013 (see Table 4). Models that have a relatively high total burned area initially (LPJ–GUESS-SIMFIRE–BLAZE and CLASS–CTEM) show a decline in burned area over the 20th century. Most models that have a low burned area (INFERNO, ORCHIDEE–SPITFIRE and LPJ-GUESS-SPITFIRE) show an increasing trend. JSBACH–SPITFIRE and CLM have intermediate levels in burned area and show a weak decreasing trend over the 20th century.
Satellite records show a decline in global burned area since 1996 (Andela et al., 2017). However, as Forkel et al. (2019b) have shown, the significance of the observed global decline is strongly affected by the length of the sampled interval because of the high inter-annual variability in burned area and trends between products show only a low correlation (Forkel et al., 2019b).
No observations document the longer-term trends in burned area. Charcoal records (Marlon et al., 2008, 2016) and carbon monoxide data from ice-core records (Wang et al., 2010) are a proxy for biomass burning and show a global decrease in biomass burning over most of the 20th century. However, the charcoal records show an increase in burning since 2000 CE, but this discrepancy might reflect regional undersampling (for instance in Africa) or taphonomic issues of the charcoal record. A recent fire emission dataset (van Marle et al., 2017) merges information from satellites, charcoal records, airport visibility records and if no other information was available uses simulation results of the FireMIP models. This dataset is not included to evaluate the models here as it is partly based on the simulations of the FireMIP models and as it provides only estimates for emissions not burned area.
The understanding of the drivers on simulated trends that we give below provides insights on what causes the simulated trends and which assumptions control the trend. These insights will help to understand which observational constraints and process understanding is required to improve global fire models.
Table 4Trends (slope and standard error of a linear regression, megahectare per year, Mha yr−1) in annual global burned area for the years 1921–2013 for the baseline experiment SF1 and absolute difference time series of annual burned area. The trends for the forcing datasets are based on the relative difference between the transient forcing and year 1920 values for SF2_CO2, SF2_FPO and SF2_FLA and are based on the relative difference between the transient and the recycled forcing for SF2_FLI and SF2_FCL for the years 1921–2013 (%) (see Table 1). Bold values indicate significance based on a Mann–Kendall test (p value < 0.05). Experiments that are not available for specific models are indicated with NA.

3.2 Response of simulated burned area to individual drivers
The response of burned area to the individual factors is determined by the changes in the driving factors and the sensitivity of the model to these changes. The population density forcing dataset has the strongest trend in the relative differences between the transient forcing and the year 1920 value followed by the land-use and land-cover change dataset. The trend in atmospheric CO2 concentration is higher than the trend in the lightning dataset, which is more than twice as strong as in the air temperature. Wind speed shows the lowest trend of all investigated driving factors (see Table 4). Population density (SF2_FPO) and land-use change (SF2_FLA) cause the largest divergence between models in trends of burned area (slope between −1.05 and 1.345 Mha yr−1 and between −1.485 and 1.845 Mha yr−1, respectively). All models have a statistically significant trend in burned area for SF2_FPO as well as for SF2_FLA, except for CLM for SF2_FLA (see Table 4, Fig. 2b and c). For SF2_CO2 all models have a significant trend, however, the magnitude of the trend is much smaller compared to the trend due to anthropogenic factors. LPJ–GUESS–SPITFIRE and JSBACH–SPITFIRE have strong trends (>0.5 Mha yr−1), for all other models the slope is close to zero (<0.15 Mha yr−1; see Table 4, Fig. 2a). The differences between models are increasing over the 20th century for these first three experiments. The response to changes in lightning and climate generally shows much smaller trends but high inter-annual variability: none of the models has a significant trend for climate. Three models show significant (but inconsistent 0.014, 0.334 and −0.074 Mha yr−1) trends for lightning (see Table 4). The inter-annual variability is stronger for climate. The mean standard deviation of the absolute differences averaged over all models is 30 Mha for climate and 7 Mha for lightning (only 3 Mha if the model with the strongest response is excluded; see Fig. 2d and e).
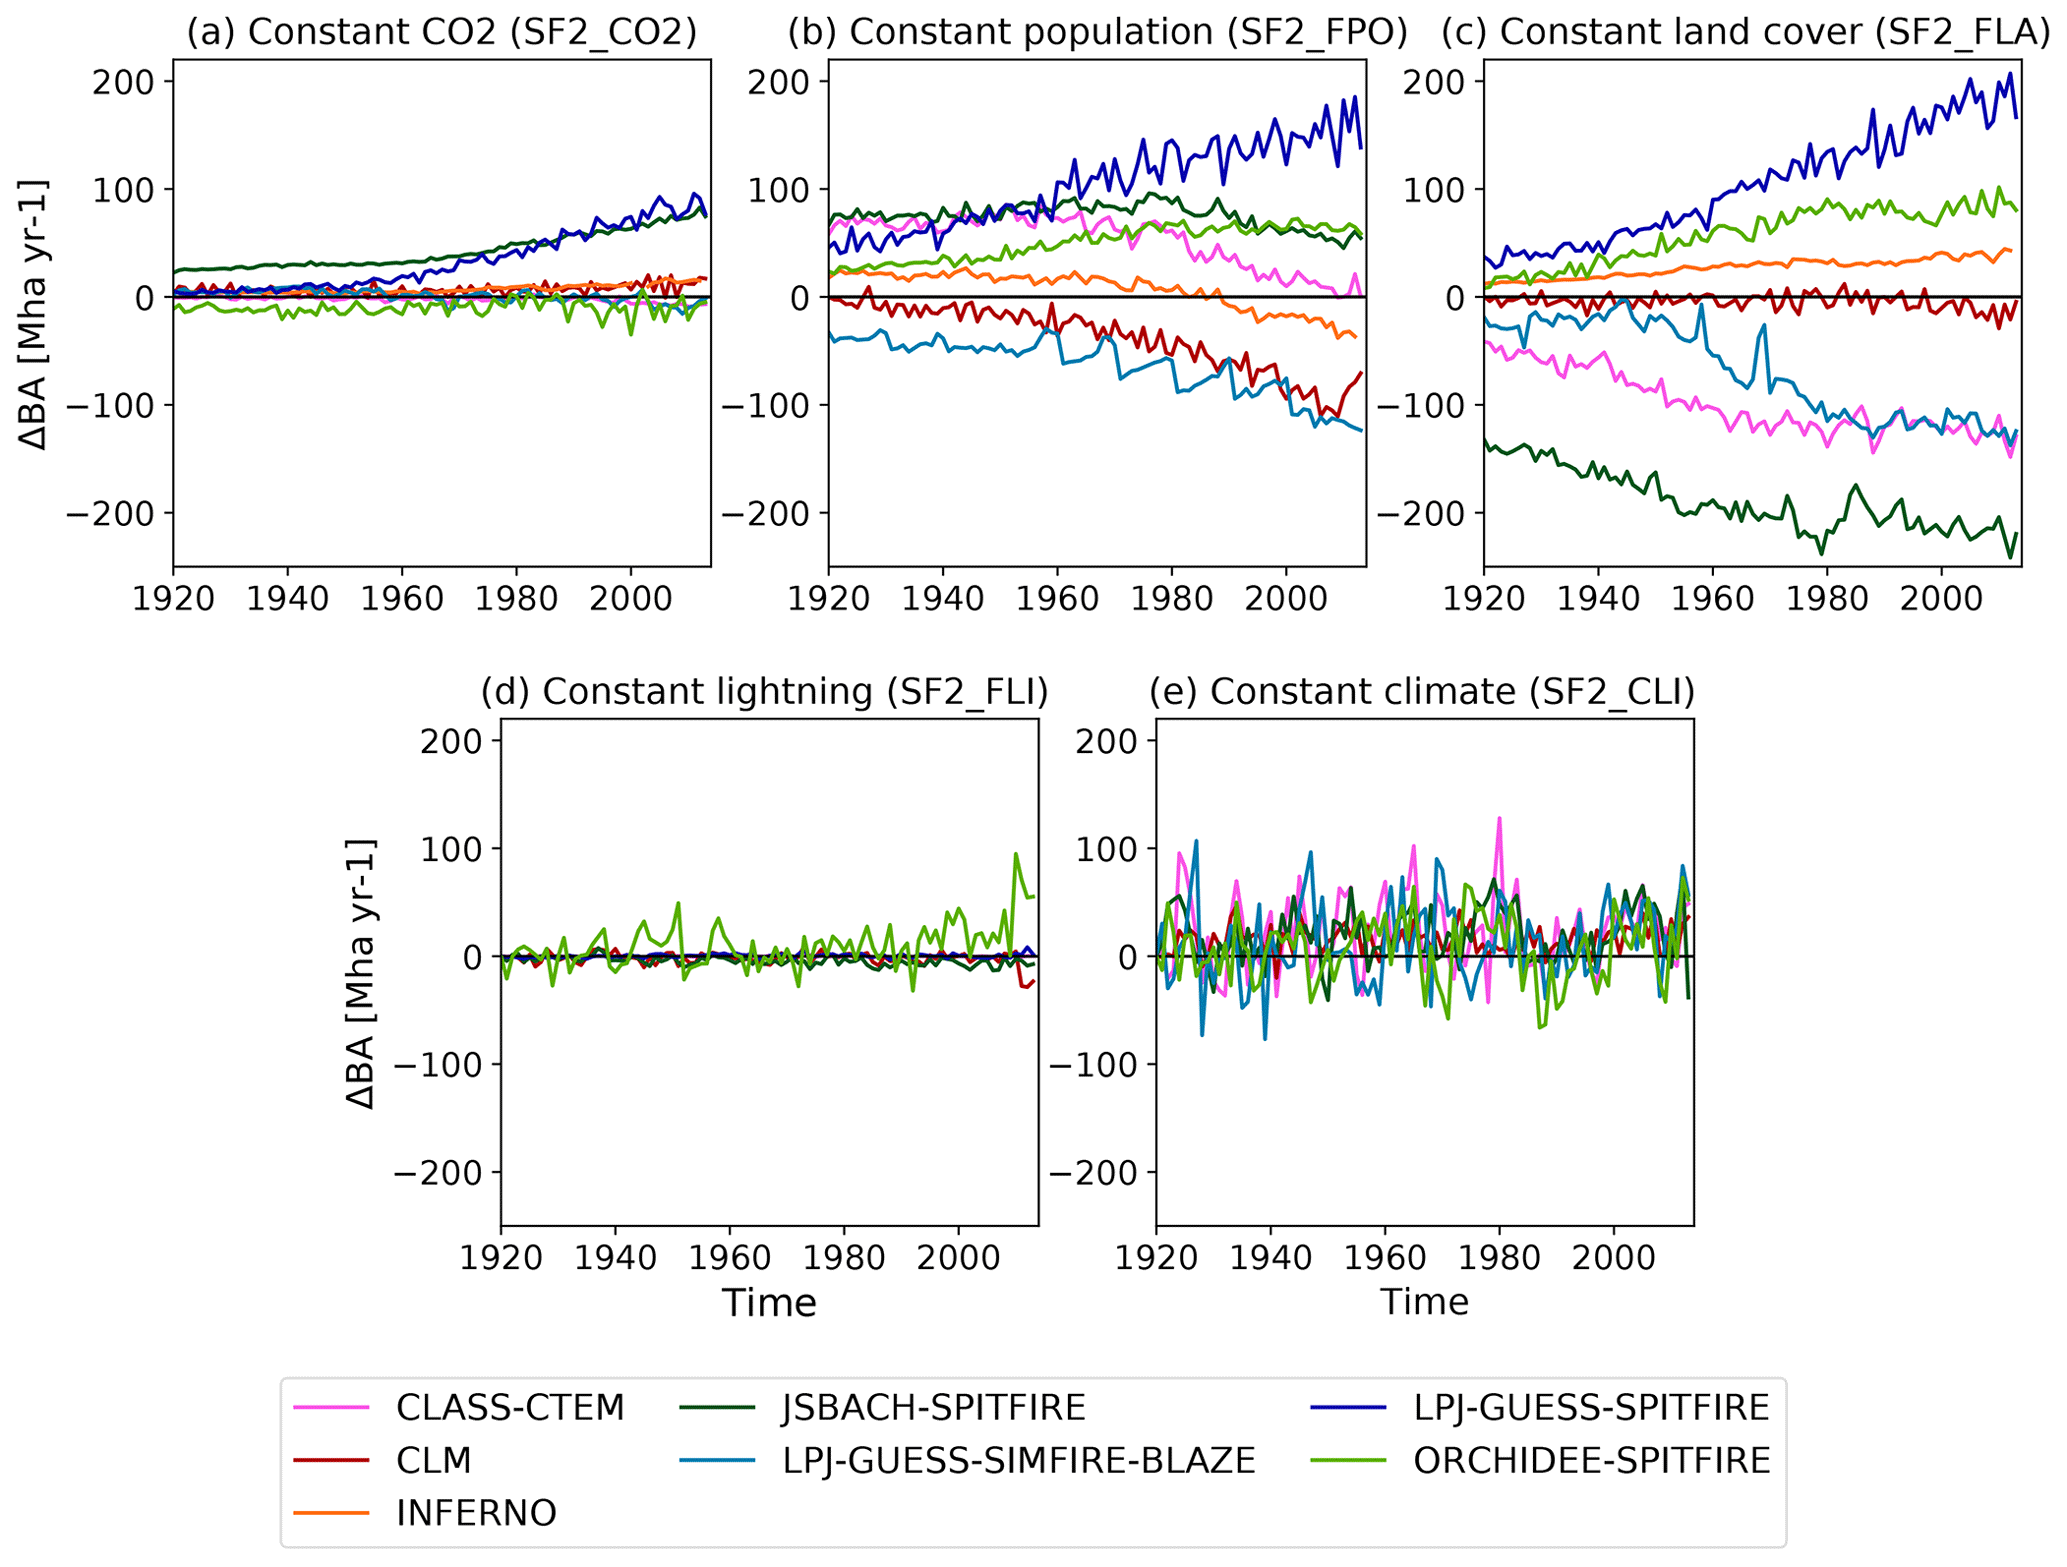
Figure 2Absolute difference in annual global burned area (ΔBA) in megahectare (Mha) from 1921 to 2013 between the baseline experiment SF1 and the sensitivity experiments SF2_CO2 (a), SF2_FPO (b), SF2_FLA (c), SF2_FLI (d) and (e) SF2_CLI, in which the specific forcing factors were set to the values used during the spin-up simulation (see Table 1).
The spatial patterns of trends in burned area are mostly heterogeneous (see Figs. A3–A7). The global trend can be dominated by changes in limited areas of the world, while the lack of a global trend can reflect opposing trends in different regions. A detailed regional analysis is beyond the scope of this study, but we provide an alternative global view by quantifying the area affected by positive or negative trends (see Fig. 3). This comparison shows that for most models larger areas show significant positive trends for the reference simulation (5 models), increasing atmospheric CO2 concentration (5 models) and varying climate (5 models and 1 equal areas). There is no clear signal of either positive or negative trends across the models for the other simulations. For climate and lightning smaller areas have significant trends (see Fig. 3). For ORCHIDEE–SPITFIRE and LPJ–GUESS–SPITFIRE all factors but climate cause a significant positive trend globally (see Table 4), and larger areas have positive trends for all factors, with the exception of lightning for LPJ–GUESS–SPITFIRE (see Fig. 3). On the other end of the model range, LPJ–GUESS–SIMFIRE–BLAZE only shows a positive global trend for climate and shows positive trends induced by atmospheric CO2 concentration in larger areas (see Fig. 3).
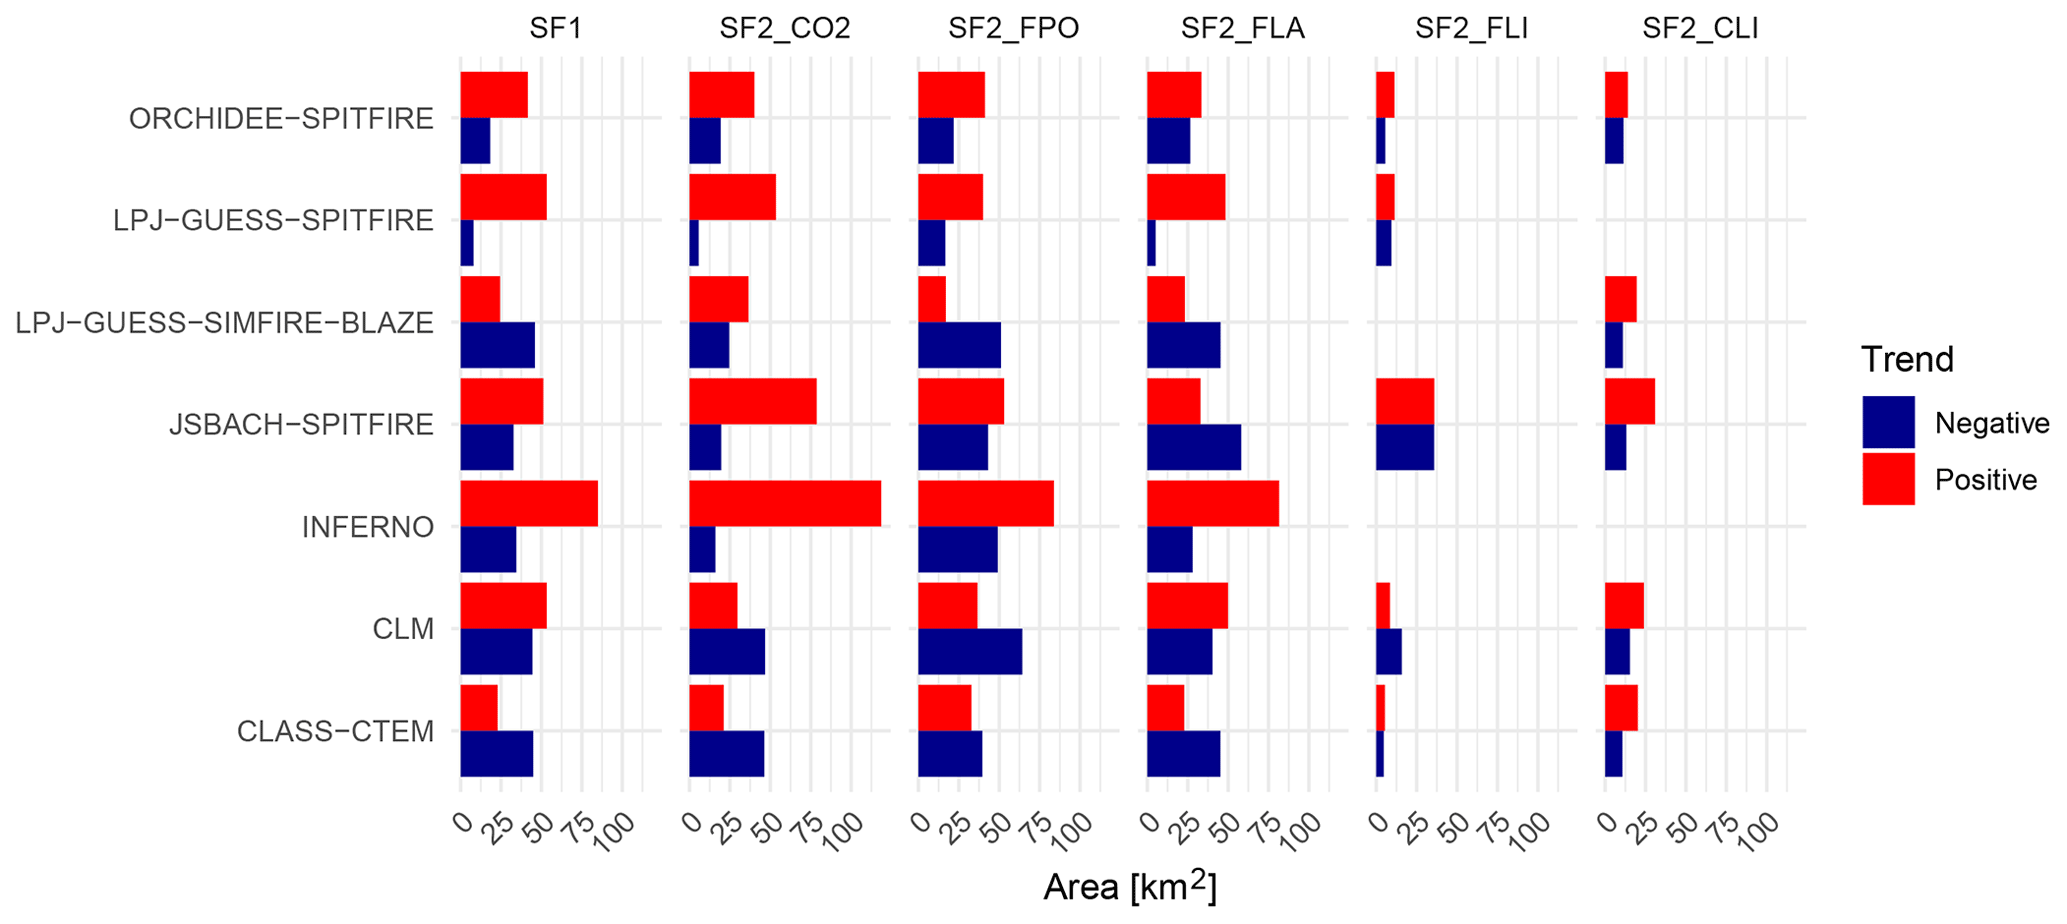
Figure 3Area with a significant positive trend (red bar) or with a significant (Mann–Kendall test p<0.05) negative trend (blue bar) in burned area fraction averaged over the years 1921–2013 for the baseline experiment SF1 and for the absolute differences in burned area fraction between the sensitivity experiments SF2 and SF1 (see Table 1). See Figs. A2–A7 for comparison.
In the following paragraphs we detail the inter-model differences and their causes for each sensitivity experiment.
3.2.1 Response of simulated burned area to atmospheric CO2 concentration
The overall changes in burned area in individual simulations as a result of atmospheric CO2 concentration changes are a complex response to multiple changes in vegetation, changes in land cover, fuel load, fuel characteristics and fuel moisture. Burned area can either increase due to higher availability of fuel loads or decrease due to changes in flammability caused by different fuel properties. The FireMIP models react to increasing atmospheric CO2 concentration in different ways: some models (JSBACH–SPITFIRE and LPJ–GUESS–SPITFIRE) show a strong increase in burned area, some (CLM and INFERNO) show a moderate increase, CLASS–CTEM shows a slight decrease, and LPJ–GUESS–SIMFIRE–BLAZE and ORCHIDEE–SPITFIRE show a non-monotonic response (see Fig. 2a). For all models, the trends over the 20th century are significant (see Table 4).
We use changes in vegetation carbon to understand changes in fuel load and composition because information on the amount of fuel used within the fire models was not available for individual plant functional types (PFTs). All models show an increase in total vegetation biomass (“total” is indicated by solid lines; see Fig. 4) as expected because of higher productivity (Farquhar et al., 1980; Hickler et al., 2008) and increased water use efficiency (De Kauwe et al., 2013). The response of specific types of vegetation carbon to increasing atmospheric CO2 concentration varies between the vegetation models. The biomass of C3 vegetation (trees and C3 grasses) increases in all of the models. The biomass of C4 grasses increases in CLASS–CTEM, INFERNO and JSBACH–SPITFIRE, but it does not change in ORCHIDEE–SPITFIRE. Since ORCHIDEE–SPITFIRE was run with fixed vegetation distribution, changes in the extent of different PFTs can be ruled out as a cause of changes in vegetation carbon. There is a decrease in burned area in regions with abundant C4 grasses (Sahel and north Australia) in this model, suggesting that changes in fuel type (increased C3 tree biomass) result in changes in flammability in these regions. The carbon stored in C4 grasses is reduced in response to increasing atmospheric CO2 concentration in CLM and LPJ–GUESS–SIMFIRE–BLAZE and is fairly constant in LPJ–GUESS–SPITFIRE. This can be a result of a decrease in C4 grass cover in LPJ–GUESS–SIMFIRE-BLAZE and LPJ–GUESS–SPITFIRE. However, since CLM was run with prescribed vegetation cover, the reduction in C4 carbon must reflect the fact that any increase in C4 grass biomass due to higher atmospheric CO2 concentration is offset by greater losses through burning due to the increased total fuel load.
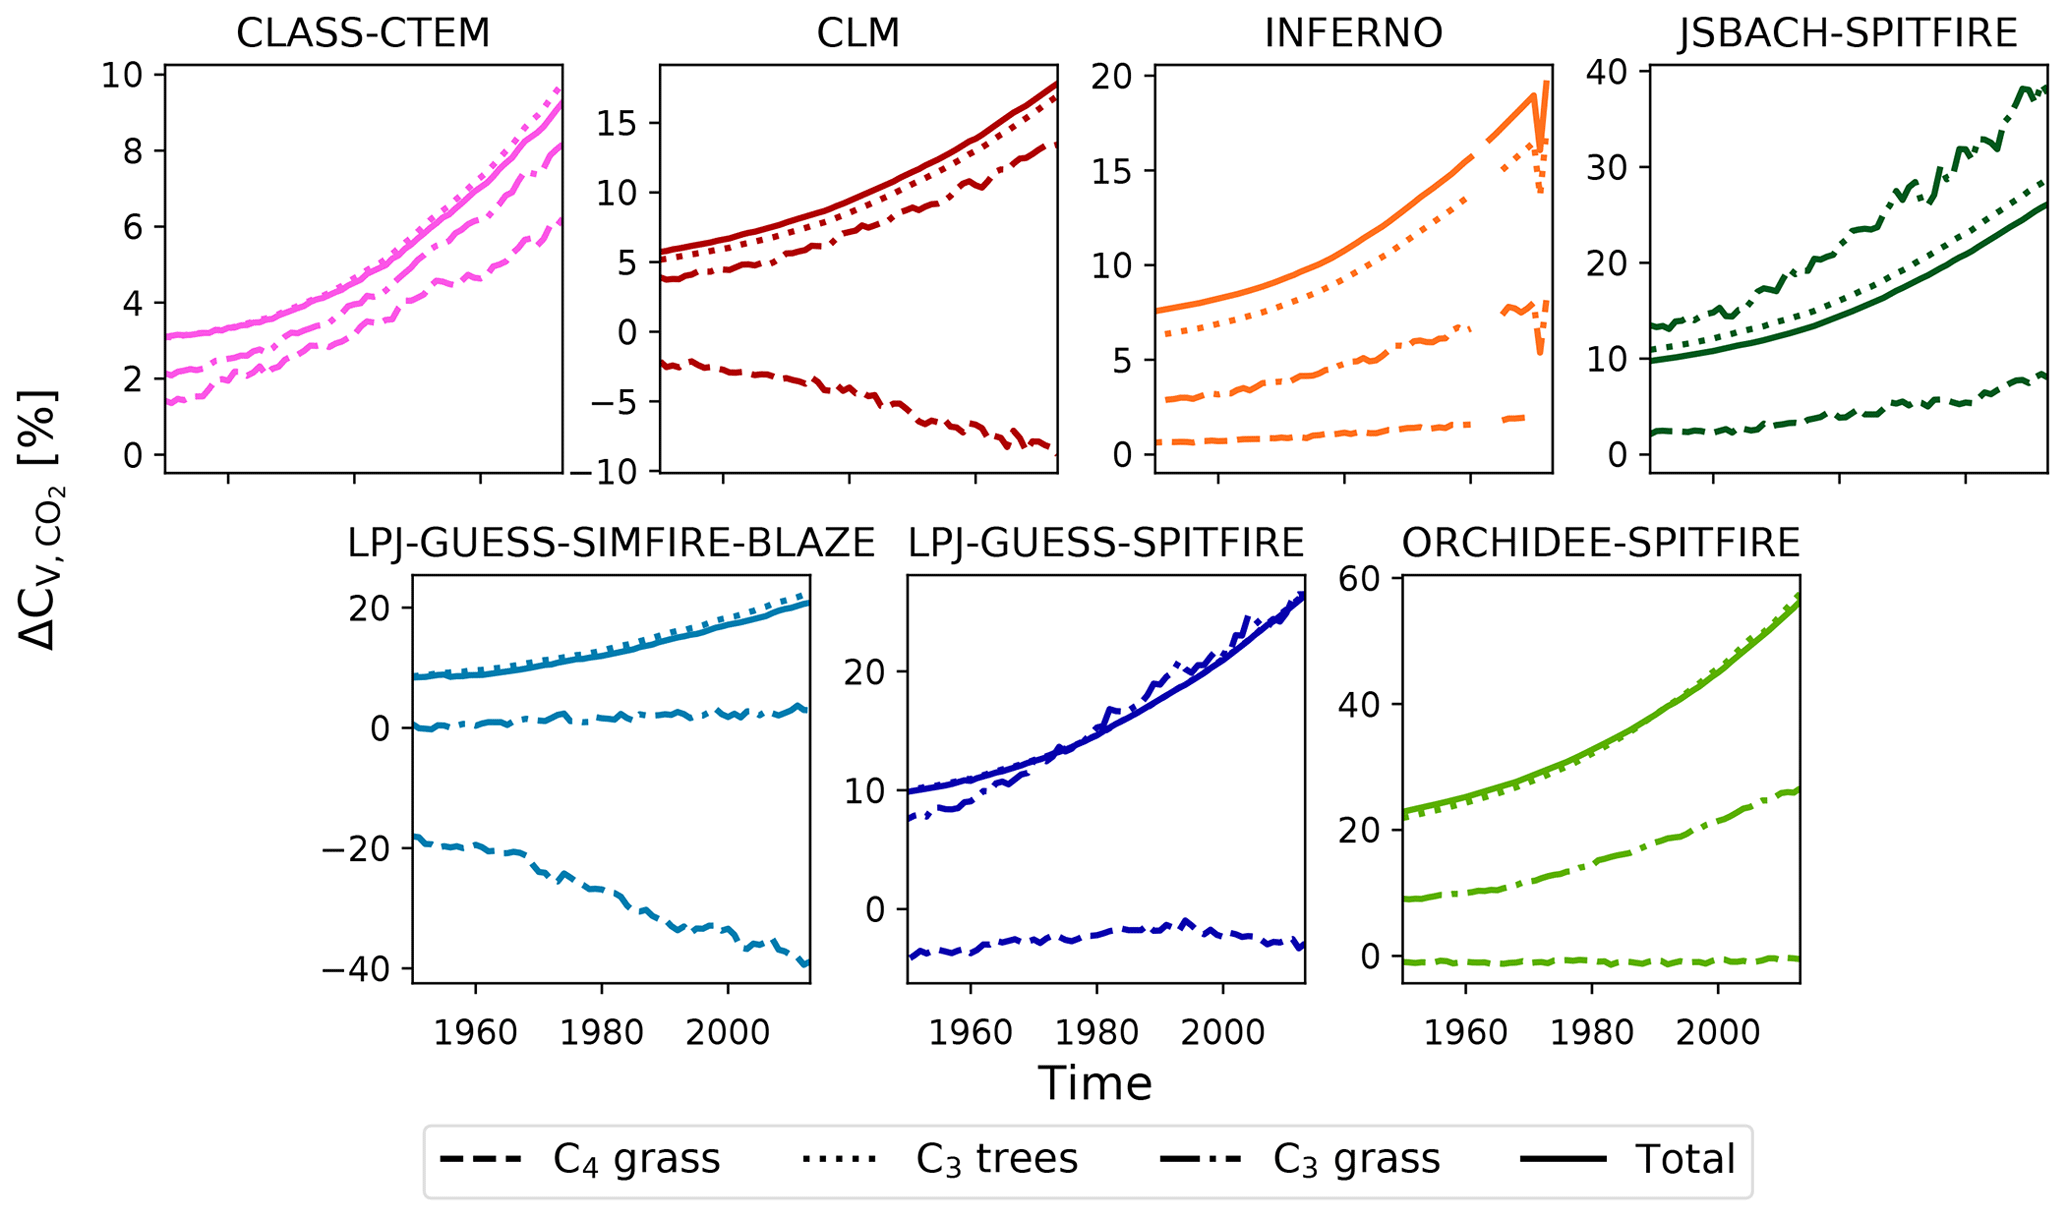
Figure 4Relative difference in global carbon stored in C4 grasses (dashed lines), in C3 trees (dotted lines), in C3 grasses (dash-dotted lines) and in total global carbon stored in vegetation (solid lines) between the baseline experiment SF1 and the sensitivity experiment SF2_CO2 (see Table 1; C) for 1950–2013 in percent (annual averages). C4 and C3 grasses, as well as C3 trees, only include natural PFTs (pastures and croplands excluded). Note that the y axis limits differ between the panels. Due to a postprocessing error, INFERNO lacks 2 years (2001 and 2002).
CLM and LPJ–GUESS–SIMFIRE–BLAZE include an interactive nitrogen cycle, and CLASS–CTEM includes a non-interactive nitrogen downregulation. Effects of atmospheric CO2 concentration on vegetation biomass for these three models are therefore at the lower end of the model ensemble. The strength of atmospheric CO2 concentration effects on productivity is still uncertain and quantitative information about effects on fuel loads is not available. Comparisons with experimental data suggest that models that do not include the nitrogen cycle overestimate the effect on productivity (Hickler et al., 2015). However, an analysis using an observation-based emergent constraint on the long-term sensitivity of land carbon storage shows that models from the Coupled Climate Model Intercomparison Project (CMIP5) ensemble, which includes an interactive nitrogen cycle, underestimate the impact of atmospheric CO2 concentration on productivity (Wenzel et al., 2016).
Soil moisture is used by several models to compute fuel moisture (see Fig. 5). Soil moisture can be influenced by different atmospheric CO2 concentrations as reductions in stomatal conductance can lead to increases in soil moisture, whereas increases in the leaf area index (LAI), caused by increased biomass of increased tree cover, lead to higher transpiration and therefore lower soil moisture. Soil moisture increases slightly in four models (INFERNO, CLASS–CTEM and CLM, JSBACH–SPITFIRE) and decreases slightly in ORCHIDEE–SPITFIRE. Only LPJ–GUESS–SPITFIRE shows a strong decrease (5 % in global average) in soil moisture (see Fig. 6).
Models which include fuel load and moisture effects through threshold functions (see Fig. 5; CLASS–CTEM, INFERNO and CLM) tend to show muted responses. Decreases in burned area appear to be largely caused by increases in soil moisture or tree cover. Increases associated with increasing fuel load are limited to regions with low biomass. The balance between these effects differs between the models. CLASS-CTEM shows a small decrease in burned area globally, and the spatial pattern is dominated by areas with negative trends in burned area, but there are positive trends in dry regions (see Fig. A3). The small global increase in burned area in INFERNO is likely related to increased fuel loads, while negative trends in burned area only occur in the tropical regions (see Fig. A3). INFERNO uses a constant burned area per PFT that is set to 0.6, 1.4 and 1.2 km2 for trees, grass and shrubs, respectively. CLM shows increased global burned area, but increases are located in dry areas while the boreal regions show decreases. JSBACH–SPITFIRE and LPJ-GUESS–SPITFIRE respond to elevated atmospheric CO2 concentrations with a strong increase in burned area, likely driven by increases in fuel load. LPJ–GUESS–SPITFIRE additionally shows a strong decrease in soil moisture, which might explain why this model shows the strongest increase in burned area. ORCHIDEE–SPITFIRE shows lower burned area in response to elevated atmospheric CO2 concentrations but the decreases are mainly localized in the regions with very high burned area (Sahel and northern Australia; see Fig. A3) and are likely driven by the increase in C3 woody biomass (see Fig. 4) as SPITFIRE is very sensitive to this type of fuel (Lasslop et al., 2014). LPJ–GUESS–SIMFIRE–BLAZE shows an initial increase and then a decrease in burned area at the end of the simulation. The spatial pattern is mixed, and the decrease in C4 grass biomass indicates that woody thickening, either due to changes in land-cover fraction or fuel composition is the reason for this reduction in burned area. An increase in woody plants with higher atmospheric CO2 concentration is expected (Wigley et al., 2010; Buitenwerf et al., 2012; Bond and Midgley, 2012). Their coarser and less flammable fuel can lead to reduced burned area. A recent study using an optimized empirical model indicates that increases in biomass lead to decreases in burned area in regions with high fuel loads, which is likely due to increases in coarser fuels and to increases in burned area in fuel-limited regions (Forkel et al., 2019b).
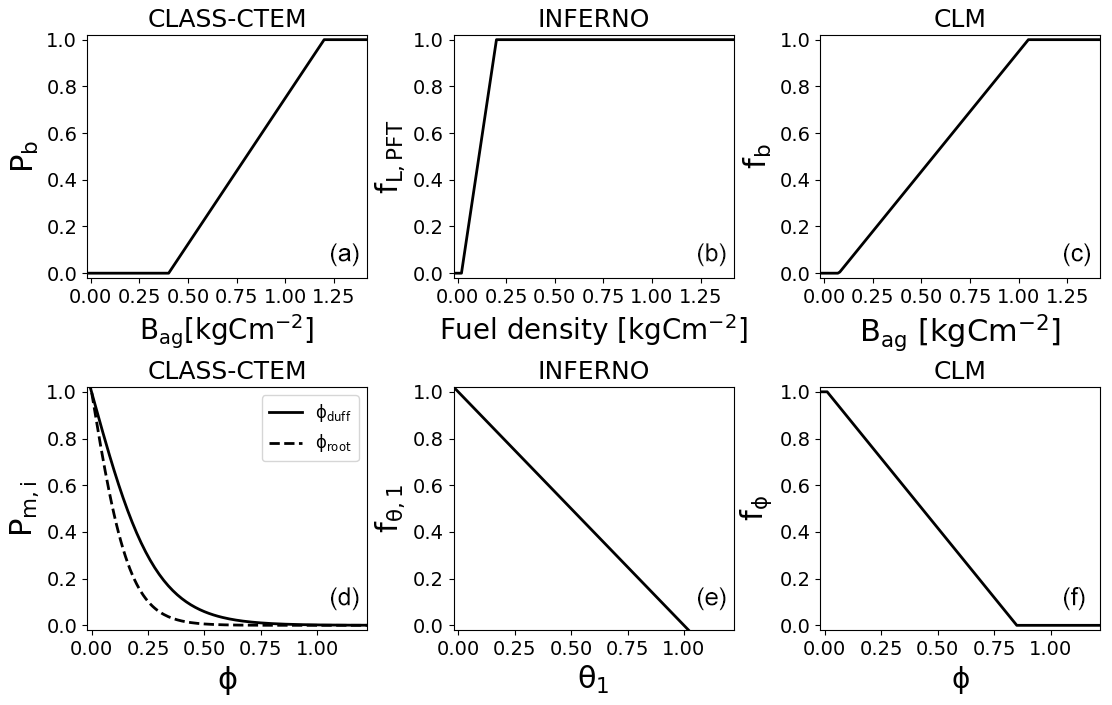
Figure 5Impact of fuel load on fire for CLASS-CTEM, INFERNO and CLM. Impact of fuel load on the probability of fire (Pb) for CLASS-CTEM, on the fuel load index (fL,PFT) for INFERNO and on fuel availability (fb) for CLM (a, b, c). Impact of soil moisture content and soil wetness on fire for CLASS-CTEM, CLM and INFERNO (d, e, f). In order to facilitate comparability, the soil moisture function for CLM is scaled to the value range (0,1).
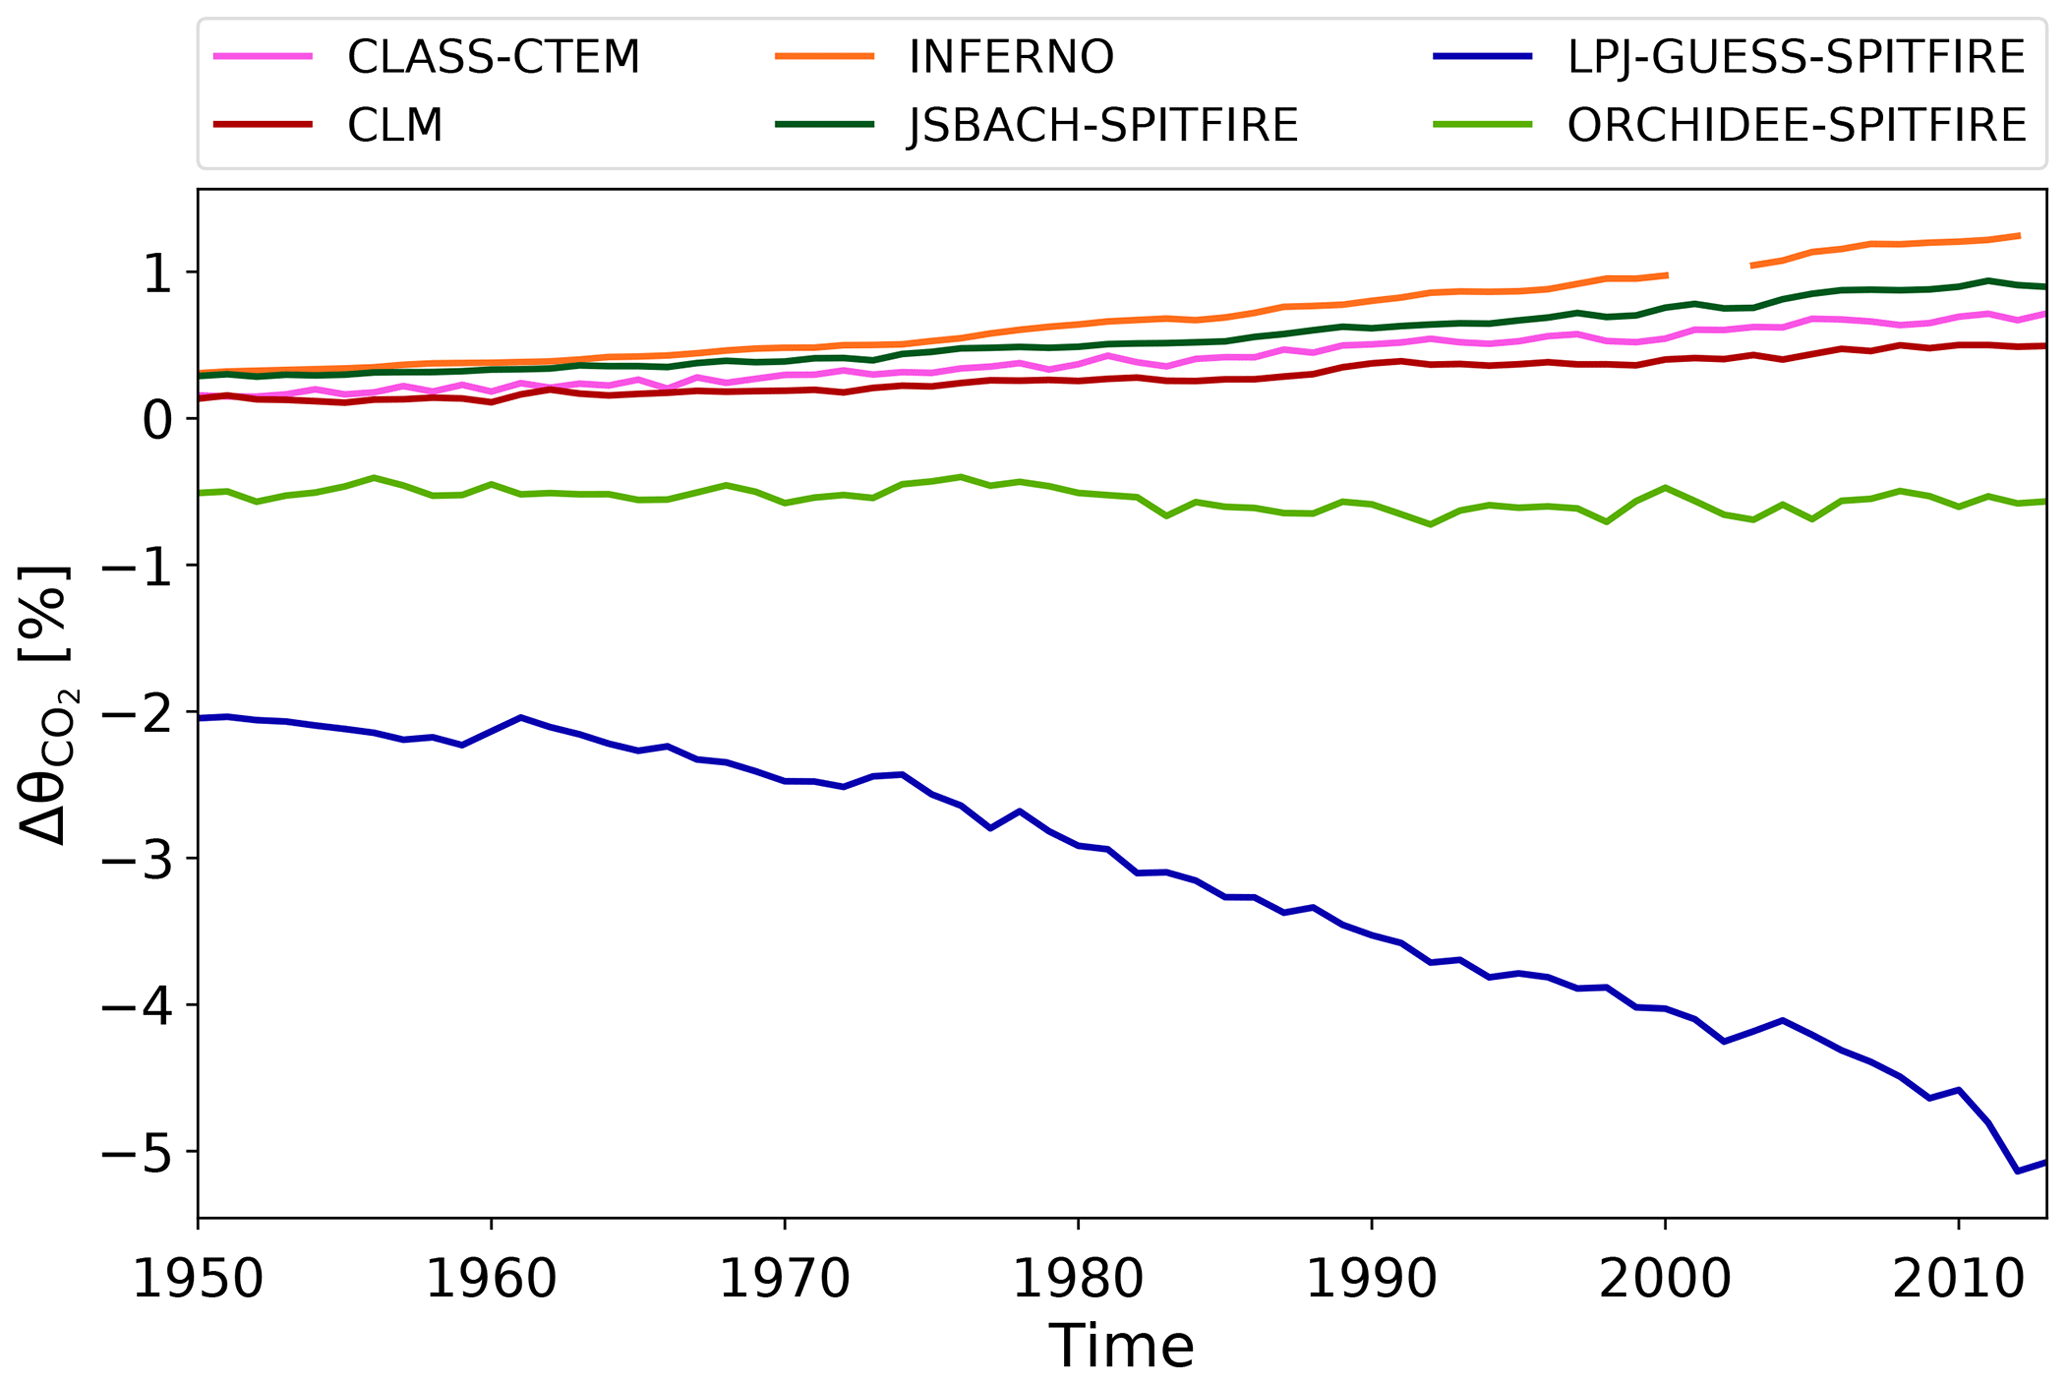
Figure 6Annual average of the relative difference in volumetric soil moisture (CLM) and total soil moisture content (remaining models) between the baseline experiment SF1 and the sensitivity experiment SF2_CO2 (see Table 1; ) for 1950–2013 in percent. Due to a postprocessing error, INFERNO lacks 2 years (2001 and 2002).
3.2.2 Response of simulated burned area to population density
The population density forcing used for FireMIP increases in every region of the globe over time as well as in annual global values (Goldewijk et al., 2010). This increasing population density is associated with a monotonic increase in global burned area for LPJ–GUESS–SPITFIRE, and monotonic decreases for LPJ–GUESS–SIMFIRE–BLAZE and CLM. The remaining models show a peak in the impact of population density on burned area around 1950 and a subsequent decline (see Fig. 2b). Models, however, largely agree on a decreasing trend due to the impact of population density since 1921 (see Table 4), and the ones that show a positive trend did not reproduce the relationship between population density and burned area in a multivariate model evaluation (Forkel et al., 2019a). Changes in population density therefore, very likely, contributed to a decrease in global burned area since 1921.
All the models, except LPJ–GUESS-SIMFIRE–BLAZE, include the number of anthropogenic ignitions (IA) or the probability of fire due to anthropogenic ignitions (Pi,h in CLASS–CTEM) in the calculation of burned area. Most of the models represent the number of anthropogenic ignitions with an increase up to a certain threshold number and then a decline, implicitly assuming that for high population densities humans suppress fires (SPITFIRE–models, INFERNO and CLM; see Fig. 7). CLASS–CTEM, JSBACH–SPITFIRE and CLM include explicit terms to account for the effects of suppression not only on ignitions but also on fire size, or duration or both (see Fig. 8). The combination of the ignition and suppression terms in CLASS–CTEM leads to a maximum impact of humans on burned area at intermediate population density. The combination of ignition and suppression mechanisms dependant on population thresholds explains why most of the models have non-monotonic changes in burned area as population increases during the 20th century. LPJ–GUESS–SPITFIRE is the only model that shows a monotonic increase in burned area in response to increasing population density; other models that include the SPITFIRE fire module (JSBACH and ORCHIDEE) show the non-monotonic trajectory that results from the shift from the dominance of ignitions to that of suppression on burned area. ORCHIDEE–SPITFIRE has a much lower contribution from anthropogenic ignitions than LPJ–GUESS–SPITFIRE and therefore different spatial patterns of burned area (see Fig. A1); JSBACH–SPITFIRE has an additional suppression term based on fire size data (Hantson et al., 2015a). The inclusion of additional suppression mechanisms may also explain the behaviour of CLM, which shows a monotonic decrease in burned area over the 20th century.
LPJ–GUESS–SIMFIRE–BLAZE does not include anthropogenic ignitions explicitly but rather treats the net effect of changes in population density, which was optimized using burned area satellite data (Knorr et al., 2014). This optimized net effect is a monotonic decrease in burned area with increases in population density. This explains why this model shows a monotonic decrease overall (see Fig. A4).
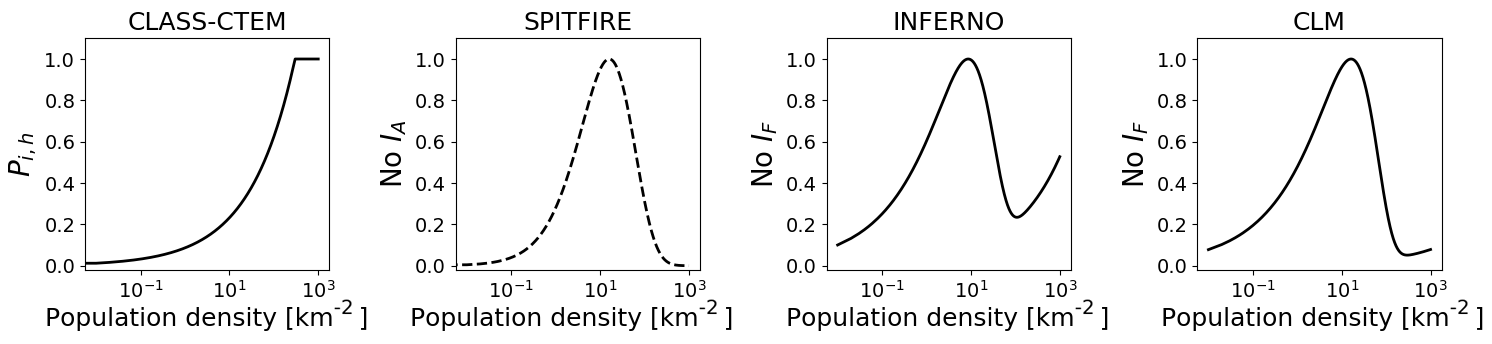
Figure 7Variation in probability of fire due to human ignitions (Pi,h), anthropogenic ignitions (No IA) or number of fires (No IF) for changes in population density. Since all models use different units, the values are scaled to the value range (0,1).
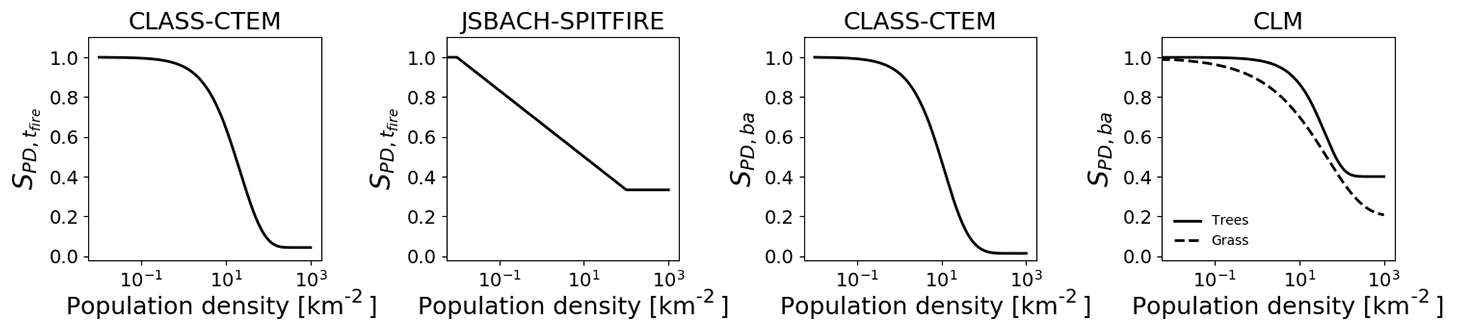
Figure 8Suppression effects of population density on fire duration () for CLASS-CTEM and JSBACH SPITFIRE and suppression effects on fire size (SPD,ba) for CLASS-CTEM and CLM. All models are scaled to the value range (0,1).
The models all agree that at high population density fire is suppressed. This leads to similarities in the spatial patterns of the effect of population changes (see Fig. A4), but they differ in their assumptions for low population density, for the threshold where humans start to suppress fire and whether explicit suppression is included. The net or emerging effect of humans on burned area in models, however, also depends on the presence of lightning ignitions. The presence of lightning ignitions reduces the limiting effect of a lack of human ignitions on burned area. For the CLASS-CTEM model as soon as lightning ignitions are present, the net effect of humans is to suppress fires, even though the underlying relationship assumes an increase in ignitions with population density (Arora and Melton, 2018, Supplement). This may explain why global models assuming an increase in ignitions with increases in population density are able to capture the burned area variation along population density gradients (Lasslop and Kloster, 2017; Arora and Melton, 2018) and why global statistical analyses find a net human suppression also for low population density (Bistinas et al., 2014).
3.2.3 Response of simulated burned area to land-use change
The land-use change imposed in SF2_FLA is characterized by a strong decrease in forested areas and an increase in pastures and croplands (Hurtt et al., 2011). The FireMIP models do not show a uniform response of burned area to land-use change. LPJ–GUESS–SPITFIRE shows the strongest reaction with a monotonic increase in burned area with land-use change. INFERNO and ORCHIDEE–SPITFIRE also show an increasing trend but of lower magnitude. CLASS–CTEM, JSBACH–SPITFIRE and LPJ–GUESS–SIMFIRE–BLAZE show a decreased burned area due to increased land use. CLM also shows a decrease in burned area, but this change is not significant (see Fig. 2c).
The FireMIP models handle land-cover dynamics, the expansion of agricultural areas and fire in agricultural areas differently. Some of the models (CLASS–CTEM, CLM, JSBACH–SPITFIRE and ORCHIDEE–SPITFIRE) prescribe the vegetation distribution so that the land-cover fraction for all PFTs does not change through time in SF2_FLA, while in the SF1 simulation the cover fractions of natural PFTs are reduced according to the expansion of agricultural areas. The other models simulate the distribution of the natural vegetation dynamically but prescribe the agricultural areas. All models decrease the tree cover to represent the expansion of croplands over time. Land conversion due to the expansion of pasture is not represented in CLASS–CTEM. Only CLM includes cropland fires, INFERNO treats croplands as natural grasslands, and all the other models exclude croplands from burning (see Table 5). Therefore for all models, except CLM and INFERNO, increases in cropland area lead to a reduction in burned area, and the reasons for the divergence between the other models must be caused by the treatment of pastures.
Table 5Treatment of agricultural fires (Rabin et al., 2017b). “None” indicates the vegetation type does not burn or that deforestation fires are not represented in the model. The models treating pasture fire the same as grassland do not treat pasture as a specific PFT. The indication “no pasture” means that there is no land-cover change due to pastures.
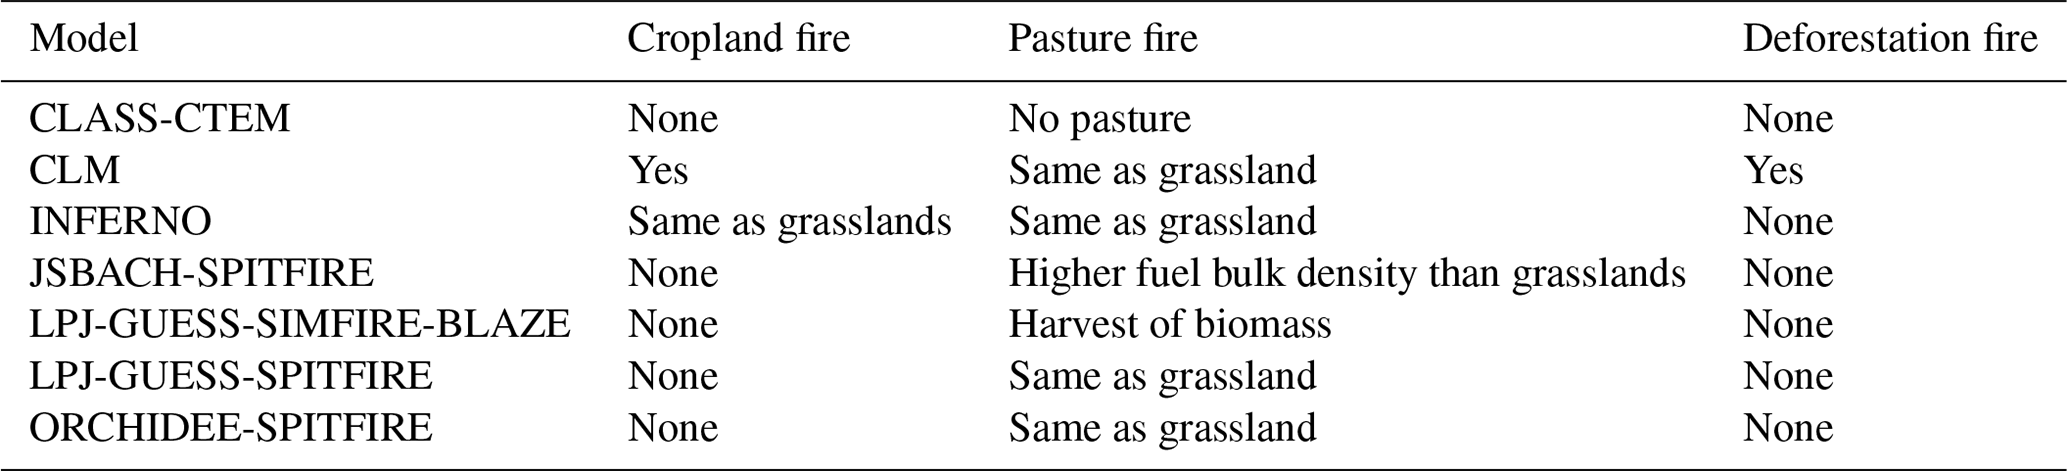
In LPJ–GUESS–SIMFIRE–BLAZE pastures are harvested; this reduction in biomass leads to a decrease in burned area in addition to the decrease caused by exclusion of fire in croplands. In JSBACH–SPITFIRE, the expansion of pastures occurs preferentially at the expense of natural grassland and does not affect tree cover until all the natural grassland has been replaced (Reick et al., 2013). This assumption decreases the effect of land-cover conversion on tree cover. Additionally, in JSBACH–SPITFIRE the fuel bulk density of pastures is higher than that of natural grass by a factor of 2, which decreases fire spread and thus burned area (Rabin et al., 2017b). This difference reduces burned area in pastures compared to natural grassland. In CLASS–CTEM, which also shows a decline, pastures are not included, and the only land conversion is due to the expansion of croplands.
LPJ–GUESS–SPITFIRE and ORCHIDEE–SPITFIRE react with an increase in burned area to the expansion of land use since they treat pastures as natural grasslands. The SPITFIRE fire module is very sensitive to the vegetation type with very high burned area for natural grasslands due to higher flammability compared to woody PFTs (Lasslop et al., 2014, 2016). Fuel bulk density is an important parameter, but additionally grass fuels dry out faster leading to an increase in flammability. Therefore an increase in burned area is observed if forested areas are converted to grasslands. LPJ–GUESS–SPITFIRE computes the vegetation cover dynamically, so that an increase in burned area reduces the cover fraction of woody types, which might explain the stronger response compared to that of ORCHIDEE–SPITFIRE. In CLM, pastures are represented by increased grass cover. The biomass scaling function does not distinguish fuel types (see Fig. 5); therefore the lower fuel amount of grasslands could lead to a decrease in fire probability, while the maximum fire spread rate depends on the vegetation type and is higher for grasslands (Rabin et al., 2017b). The inclusion of cropland and deforestation fires dampen the effect of land-cover change on global burned area. In INFERNO, agricultural regions are not defined explicitly. Instead, woody PFT types are excluded from the agricultural area (Clark et al., 2011). INFERNO includes an average burned area for each PFT in the calculation of the burned area per PFT, which leads directly to increasing grass cover and results in higher burned area (Mangeon et al., 2016; Rabin et al., 2017b).
Land use was already identified as a main reason for inter-model spread in the CMIP5 ensemble (Kloster and Lasslop, 2017). We show that this largely reflects the way pastures are treated, as most models used here (except CLM and INFERNO) simply exclude croplands from burning.
3.2.4 Response of simulated burned area to lightning
Most of the models show a low response of burned area to lightning (see Fig. 2), although lightning rates increase by 20 % over the simulation period – an increase that is much larger than the 3.3 % change, between pre-industrial times and the present, estimated from a recent modelling study (Krause et al., 2014). ORCHIDEE–SPITFIRE shows an increase in burned area between 1940 and 1960 and towards the end of the simulation. In comparison to the other SPITFIRE-models the differences seem to be related to two points. Firstly, ORCHIDEE–SPITFIRE uses a 12-times higher factor to convert lightning strikes to actual ignitions and anthropogenic ignitions that are 100-times lower than for the other models (see Rabin et al., 2017b). Secondly, although a partitioning factor (SGFED) varies regionally, the per capita ignition frequency is constant; in JSBACH–SPITFIRE and LPJ–GUESS–SPITFIRE, the per capita ignition frequency varies regionally. This results in strong differences in the spatial patterns of burned area (see Fig. A1). Consequently, the strength of regions contributing to the global burned area varies between the models; ORCHIDEE–SPITFIRE shows much more burning in the tropical and far less burning in the temperate region. Whether a lightning turns into a fire depends on the local conditions at the time of the lightning strike. Differences in the spatial distribution and timing of fires can therefore lead to different responses between models even if lightning is used in the same way within the model. Our results show that even a substantial increase (20 %) in lightning has little influence on simulated global burned area. This is consistent with Krause et al. (2014), who found that the pre-industrial-to-present increase in lightning, although this increase is much smaller, had little impact on burned area.
3.2.5 Response of simulated burned area to climate
Simulated burned area in FireMIP responds to changes in climate with strong inter-annual variability but only weak trends in burned area (see Fig. 2e). Only three models show a statistically significant trend in the global burned area according to a Mann–Kendall test (CLM, LPJ–GUESS–SIMFIRE–BLAZE and ORCHIDEE–SPITFIRE; see Table 4). However, in all models the area showing an increased burned area in response to climate is higher than the area with decreased burned area (see Fig. 3). Agreement in spatial patterns of trends between the models is however low (see Fig. A7).
The influence of climate on burned area is complex: it influences burned area through the meteorological conditions and through effects on vegetation conditions that influence fuel load and fuel characteristics (Scott et al., 2014). We therefore correlated for each grid cell changes in physical parameters (precipitation, temperature, wind speed and soil moisture) and vegetation parameters (litter, vegetation carbon and grass biomass) with changes in burned area. We find that the correlation between the individual parameters and burned area is low (see Fig. A8). The absolute rank correlations are lower at the monthly scale than at the annual scale. However, at the monthly scale the number of grid cells showing significant correlations with physical parameters is higher than the number showing significant correlations with vegetation parameters, indicating that changes in physical parameters have more influence at shorter timescales than changes in vegetation parameters. This difference disappears with the aggregation to annual timescale. On the annual timescale, however, the mean absolute rank correlation is slightly higher for the vegetation parameters. Soil moisture which is also influenced by vegetation has a slightly higher correlation compared to precipitation, temperature and wind speed. This indicates that vegetation parameters are more influential on the longer annual time step and physical parameters on the monthly time step. The relationship between precipitation or soil moisture and burned area is expected to be negative, while the impact of temperature is expected to be positive. This is clearly reflected in the percentage of positively significant correlations at the annual scale but is less clear at the monthly time step. This might reflect that the seasonality of temperature, precipitation and vegetation parameters is often synchronized, and therefore the effects of the parameters cannot be separated. The low correlation between individual parameters and burned area reflects the complex interactions between the climatic drivers, vegetation conditions and fire weather.
The impact of climate on the inter-annual variability, however, is strongly expressed in the simulated burned area. This is consistent with the finding that recent precipitation changes influence inter-annual variability in fire but have little impact on recent longer-term trends (Andela et al., 2017). To fully understand the impact of the changes in climate, a number of simulations would be necessary, in which only individual climate parameters change while the others are kept constant. In addition, simulations in which combinations of variables change might give further insights into the synergies between the variables. An alternative approach, given the complex interactions between climate and vegetation parameters, might be to disentangle the model signals using multivariate analysis (see e.g. Forkel et al., 2019a; Lasslop et al., 2018).
3.3 Implications for model development and applications
Global vegetation models are an important tool for examining the impacts of climate change and are used in policy-relevant contexts (IPCC, 2014; Schellnhuber et al., 2014; IPBES, 2016). Given the various influences of fire on the ecosystems (Bond et al., 2005), the carbon cycle and climate (Lasslop et al., 2019) improvements of global fire models are particularly important.
The main concern for model applications is the large spread of the historical simulated burned area. It remains difficult to evaluate and optimize the transient burned area simulations as the period observed by satellites is still short, and the trends are not robust (Forkel et al., 2019b). Fire proxies (charcoal and ice cores) give information on biomass burning over longer timescales. They do not confirm the recent decrease in burned area detected by satellites but also only contain very few datapoints for that period (Marlon et al., 2016). For a valid comparison with the long-term fire proxies, the inclusion of estimates of deforestation fires in the models will be crucial as land-use change fire emissions will likely have a strong contribution to the signal (Marlon et al., 2008). An improved understanding of uncertainties in observed trends of fire regimes is therefore necessary. Only robust information should be included in models.
Our analysis shows which parts of the models are particularly important to simulate changes in burned area and need additional observational constraints or improved process understanding. In line with previous research (Bistinas et al., 2014; Hantson et al., 2016a, b; Andela et al., 2017), the large divergence in the response to human activities between the FireMIP models shows that the human impact on fires is still insufficiently understood and therefore not constrained in current models.
We identify land-use change as the major cause of inter-model spread. Only one model explicitly includes fires associated with land-use and land-cover change (cropland and deforestation fires), and all the other models only include such effects through changes in vegetation parameters and structure. The inclusion of cropland fires is certainly important to understand and project changes in emissions, air pollution and the carbon cycle (Li et al., 2018; Arora and Melton, 2018). Cropland fires are, due to their small extent and low intensity, still a major uncertainty in our current understanding of global burned area (Randerson et al., 2012). Biases in the spatial patterns of burned area and the relationship between cropland fraction and burned area can therefore be expected. High-resolution remote sensing may help to improve the detection (Hall et al., 2016). Moreover, understanding why and when humans burn croplands on a regional scale may help to find an adequate representation of cropland fires within models and help avoid overfitting to observational datasets. As croplands are simply excluded from burning in most models (except two), the spread of the other models is likely related to the treatment of pastures. Fires on pasturelands have been estimated to contribute to over 40 % of the global burned area (Rabin et al., 2015). Pasture fires are not treated explicitly in any of the models, although some models slightly modify the vegetation on pastures by harvesting or changing the fuel bulk density (see Table 5). Expansion of pastures is mostly implemented by simply increasing the area of grasslands. Information on how fuel properties differ between pastures and natural grasslands could therefore help to improve model parameterizations. Prescribing fires on anthropogenic land covers can be a solution for certain applications of fire models (Rabin et al., 2018). Grazing intensity was found to be related to decreases in burned area (Andela et al., 2017). Models so far represent the area that is converted due to land-cover change but not the intensity of land use. This was partly due to the lack of global data regarding land-use intensity, which is now becoming available and provides new opportunities for fire model development (e.g. the LUH2 dataset; Hurtt et al., 2017). In the sensitivity simulations shown here, even models that decrease burned area due to land-use and land-cover change do not show a further decrease over the last decade. This indicates that model input datasets, explicit in time and space, for land-use intensity and grazing intensity are necessary for fire projections. The level of socioeconomic development also modifies the relationship between humans and burned area (Andela et al., 2017; Forkel et al., 2017). Regional analysis of remote sensing data could be highly useful, as a global relationship between burned area and individual human factors, as assumed in many models and also statistical analyses, is not likely. Assumptions on how different human groups (hunter-gatherers, pastoralists and farmers) use fire have been included in a paleofire model (Pfeiffer et al., 2013). The development of such an approach for modern times would be highly valuable for fire models that aim to model the recent decades and future decades. Deforestation fires are only included in one model (CLM). As deforestation fires are likely a strong source of biomass burning over the longer timescales, accounting for deforestation fires will be crucial for a model comparison with the charcoal record.
We also find inter-model agreement for certain aspects. For instance, burned area is suppressed at high population densities, which leads to a similar spatial response to population density (see Fig. A4). Moreover, most models show a reduction of the global burned area due to changes in population density. The response functions of burned area to population density of the two models that increase burned area is less in line with response functions derived from global datasets (Forkel et al., 2019a). As a strong human suppressive effect is well supported by satellite observations (Andela et al., 2017; Hantson et al., 2015b), a reparametrization of these responses would be reasonable.
We show that, although all models show an overall increase in biomass as a consequence of increasing atmospheric CO2 concentration, models disagree about whether this results in an increase or decrease in burned area. The disagreement reflects the complex ways in which changes in atmospheric CO2 concentration influence vegetation properties, which results in different responses in different ecosystems. For LPJ-GUESS-SPITFIRE and JSBACH-SPITFIRE, the CO2 fertilization effect considerably contributed to an increase in burned area. Such an effect is so far only supported for fuel-limited areas (Forkel et al., 2019b). Limiting the effect of increasing fuel load on burned area in regions with high fuel load as used in other models could help to reduce the increase in burned area simulated by JSBACH- and LPJ-GUESS-SPITFIRE.
Climate and lightning have a much lower effect on the trends than the other factors. While this study focuses on the trends, research on the short-term variability and extreme events will be highly useful to investigate fire risks. The influence of climate and lightning on fire are therefore important research topics even if we find a comparably low influence on the long-term trends. Moreover the trends in climate parameters may increase for the future, and therefore the influence on burned area might increase.
In contrast to many model simulations that use a lightning climatology based on satellite observations, the FireMIP experiments were driven by a transient dataset of lightning activity created by scaling a mean monthly climatology of lightning activity using convective available potential energy (CAPE) anomalies of a global numerical weather prediction model. Since climate changes can be expected to cause changes in lightning, it will be important to develop transient lightning datasets for climate change studies on fire. The use of present-day lightning patterns, for example, will certainly lead to an overestimation of lightning strikes in regions with drier climate projected in the future. But not only spatial patterns of lightning are important, the covariation with climate, as well as the temporal resolution of the input dataset, determines the influence on burned area (Felsberg et al., 2018). Although we do not detect large signals in global burned area due to changes in lightning, lightning is known to be an important cause of ignitions regionally and is potentially involved in more complex interactions between fire, vegetation and climate, which can speed up the northward expansion of trees to the north in boreal regions (Veraverbeke et al., 2017). Thus, although our results suggest that the influence of increasing lightning is negligible at a global scale, it is a potentially important factor for process-based models that aim to model interactions between fire, vegetation and climate.
Recent advances in remote sensing products have high potential to support model development. However, remotely sensed burned area datasets alone are not a sufficient basis to evaluate fire models as many model structures can lead to reasonable burned area patterns. The emergence of longer records of burned area and the increasing availability of information on other aspects of the fire regime considerably improve opportunities to evaluate and improve our models. The FRY database (Laurent et al., 2018) and the global fire atlas (Andela et al., 2019), for example, provide information on fire size, numbers of fire, rate of spread and the characteristics of fire patches. These datasets will be useful to, for instance, separate effects of ignition and suppression. Rate of spread equations in global fire models are at present either very simple empirical representations tuned to improve burned area or based on laboratory experiments (Hantson et al., 2016a). The mentioned datasets now offer the opportunity to derive parameters for rate of spread equations at the spatial scales these models operate on. Fire size and rate of spread are important target variables besides burned area that can determine the impacts of fire. The effects on vegetation (combustion of biomass and tree mortality; Williams et al., 1999; Wooster et al., 2005) and on the atmosphere (Veira et al., 2016) are a function of fire intensity, which is also included in the FRY database (Laurent et al., 2018). A better evaluation of such parameters can enhance the usability of fire model simulations.
The specific model application has a strong influence on judging the validity of a model. Our analyses of the controls on the variability of fire suggest that human activities drive the long-term (decadal to centennial) trajectories, while considering climate variability may be sufficient for short-term projections. Changes in the trends of the driving factors may change this balance. For instance, stronger changes in climate into the future may increase the relative importance of climate for long-term fire projections in the future.
This comprehensive analysis of the influences of climate, lightning, atmospheric CO2 concentration, population density and land-use and land-cover change provides improved understanding of the relation between simulated historical trends in burned area and process representations in the models. It shows in detail which model responses of burned area to environmental factors can be understood, how these are related to the model equations, and how these translate into trends of burned area for the historical period.
The analysis of the sensitivity experiments shows that the increase in atmospheric CO2 concentration over the 20th century leads to increased burned area in regions where fuel loads increase, but it leads to decreased burned area in regions where tree density or coarse fuels with lower flammability increase, or in regions where elevations in soil moisture decrease flammability. Although models agree that the amount of available fuel increases, the type of fuel and vegetation composition are critical for understanding the influence of atmospheric CO2 concentration on simulated burned area.
Most models agree on a decrease in burned area due to increases in population density. Most models link the number of ignitions to population in a way that ignitions increase initially at low population densities. In densely populated regions, all models assume that the effect of anthropogenic ignitions is outweighed by fire suppression and the increased fragmentation of the landscape by anthropogenic land use. It would be useful to develop an approach that represents local human–fire relationships, but this will likely remain a long-term challenge and requires the synthesis of knowledge from various research fields.
The simulated response of burned area to land-use and land-cover change depends on how fires in cropland and pastureland are treated in each model. Most models simply exclude croplands from the burnable area; therefore the treatment of pastures causes the largest part of the model spread. Models that do not allow fire in croplands, and either harvest biomass in pastures or assume specific vegetation parameters, show a reduction in burned area. Models that treat pastures as natural grasslands and distinguish different fuel types or strongly increase burned area for grasslands show an increase in burned area. Improved knowledge on the effects of land-use intensity on burned area and the development of appropriate forcing datasets could strongly support model development.
The models are comparatively insensitive to changes in lightning, likely because lightning ignitions are not a limiting factor in many regions with very high burning activity. Previous studies however show the importance of lightning and changes in lightning for burned area in the boreal region. Therefore especially regional studies should pay attention to this factor.
None of the models shows a strong trend due to changing climate but all of them show a strong influence of climate on the inter-annual variability. Climatic and ecosystem parameters are only able to explain a rather small part of this variation, with stronger correlations for the ecosystem parameters on the longer annual timescale and a stronger relationship with climatic parameters on the monthly timescale.
Different drivers of burned area affect different timescales: the anthropogenic factors influence long-term variability, while climate and lightning affect short-term variability. Understanding the influence of climate and lightning is especially important for inter-annual variability and extreme events. On the other hand, understanding the impact of anthropogenic drivers is likely more important for the longer-term changes of fire, which is for instance needed in Earth system models. Changes in the trends of the forcing parameters might however affect the balance between them.
The uncertainties in global fire models need to be taken into account in model applications, for instance if model simulations are to be used to support climate adaptation strategies. Model ensemble simulations can give indications of such uncertainties. Therefore the results of this study provide a basis to interpret uncertainties in global fire modelling studies. The information content on the spatial variability of burned area has been well exploited in previous studies, and models reproduce the spatial patterns in a reasonable way. The temporal information of the satellite data is increasing with the increasing length of the record and has a higher potential to contain new information to support the improvement and evaluation of global fire models. Here we provide a summary of which model assumptions need additional constraints to efficiently reduce the uncertainty in temporal trends.
Processed data and processing scripts are available upon request to publications@mpimet.mpg.de.
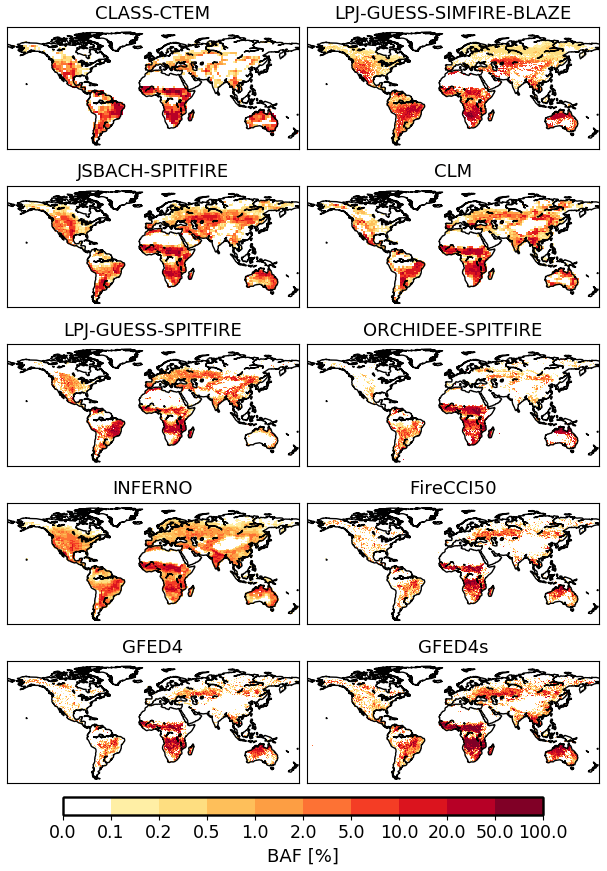
Figure A1Spatial distribution of annual burned area fraction (BAF) in percent for the baseline experiment SF1 and observation data, averaged over 2001–2013.
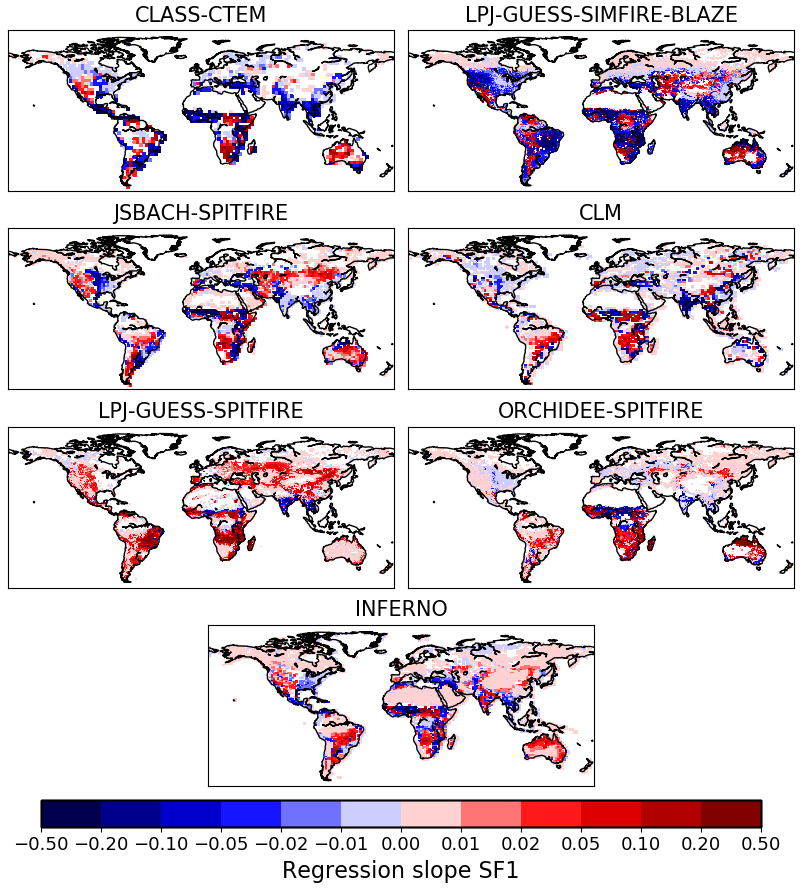
Figure A2Spatial distribution of regression slopes for the baseline experiment SF1 over 1921–2013.

Figure A3Spatial distribution of regression slopes for the difference between the baseline experiment SF1 and the sensitivity experiment SF2_CO2 (SF1–SF2_CO2; see Table 1) over 1921–2013.
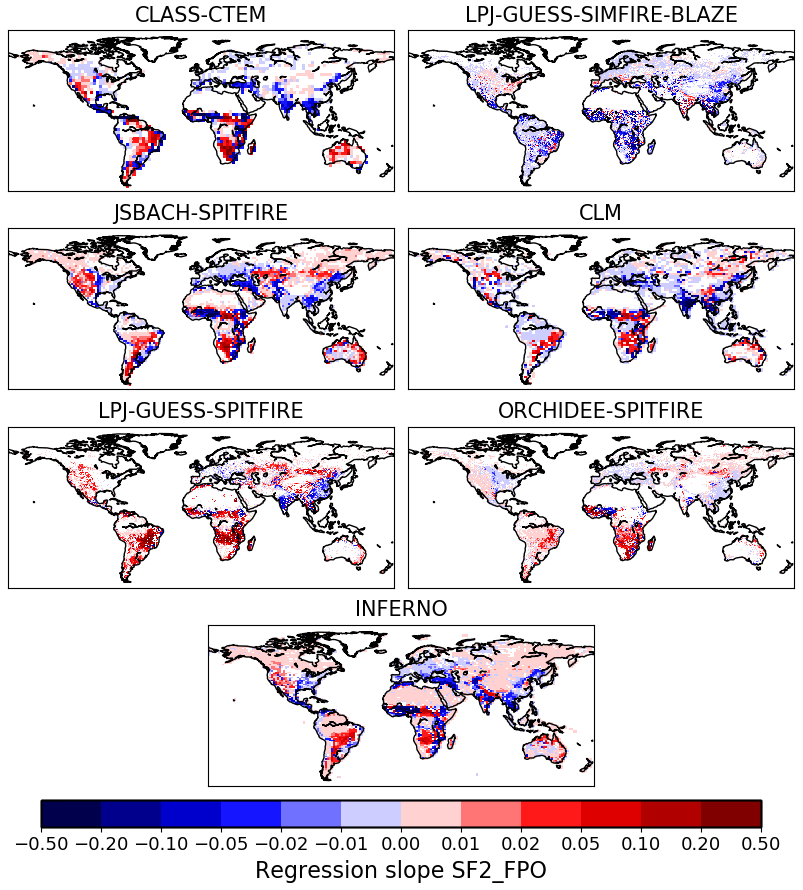
Figure A4Spatial distribution of regression slopes for the difference between the baseline experiment SF1 and the sensitivity experiment SF2_FPO (SF1–SF2_FPO; see Table 1) over 1921–2013.
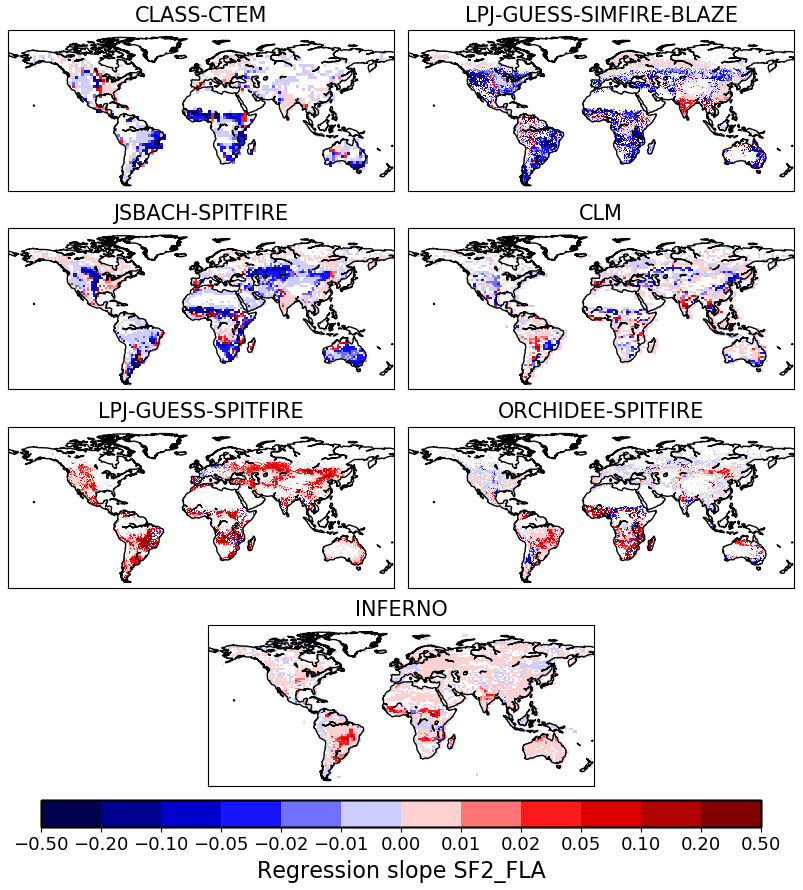
Figure A5Spatial distribution of regression slopes for the difference between the baseline experiment SF1 and the sensitivity experiment SF2_FLA (SF1–SF2_FLA; see Table 1) over 1921–2013.

Figure A6Spatial distribution or regression slopes for the difference between the baseline experiment SF1 and the sensitivity experiment SF2_FLI (SF1–SF2_FLI; see Table 1) over 1921–2013.
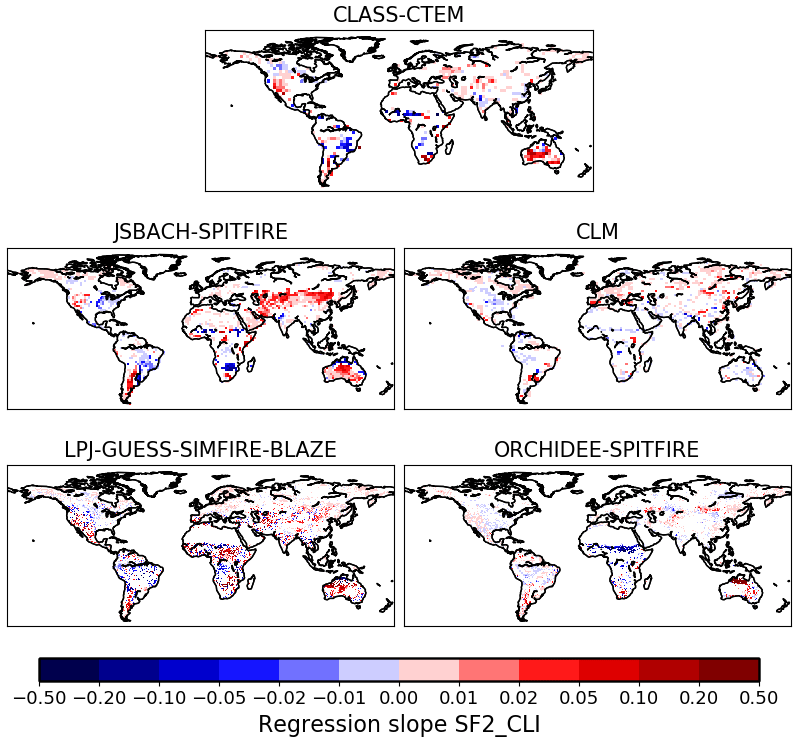
Figure A7Spatial distribution of regression slopes for the difference between the baseline experiment SF1 and the sensitivity experiment SF2_CLI (SF1–SF2_CLI; see Table 1) over 1921–2013.
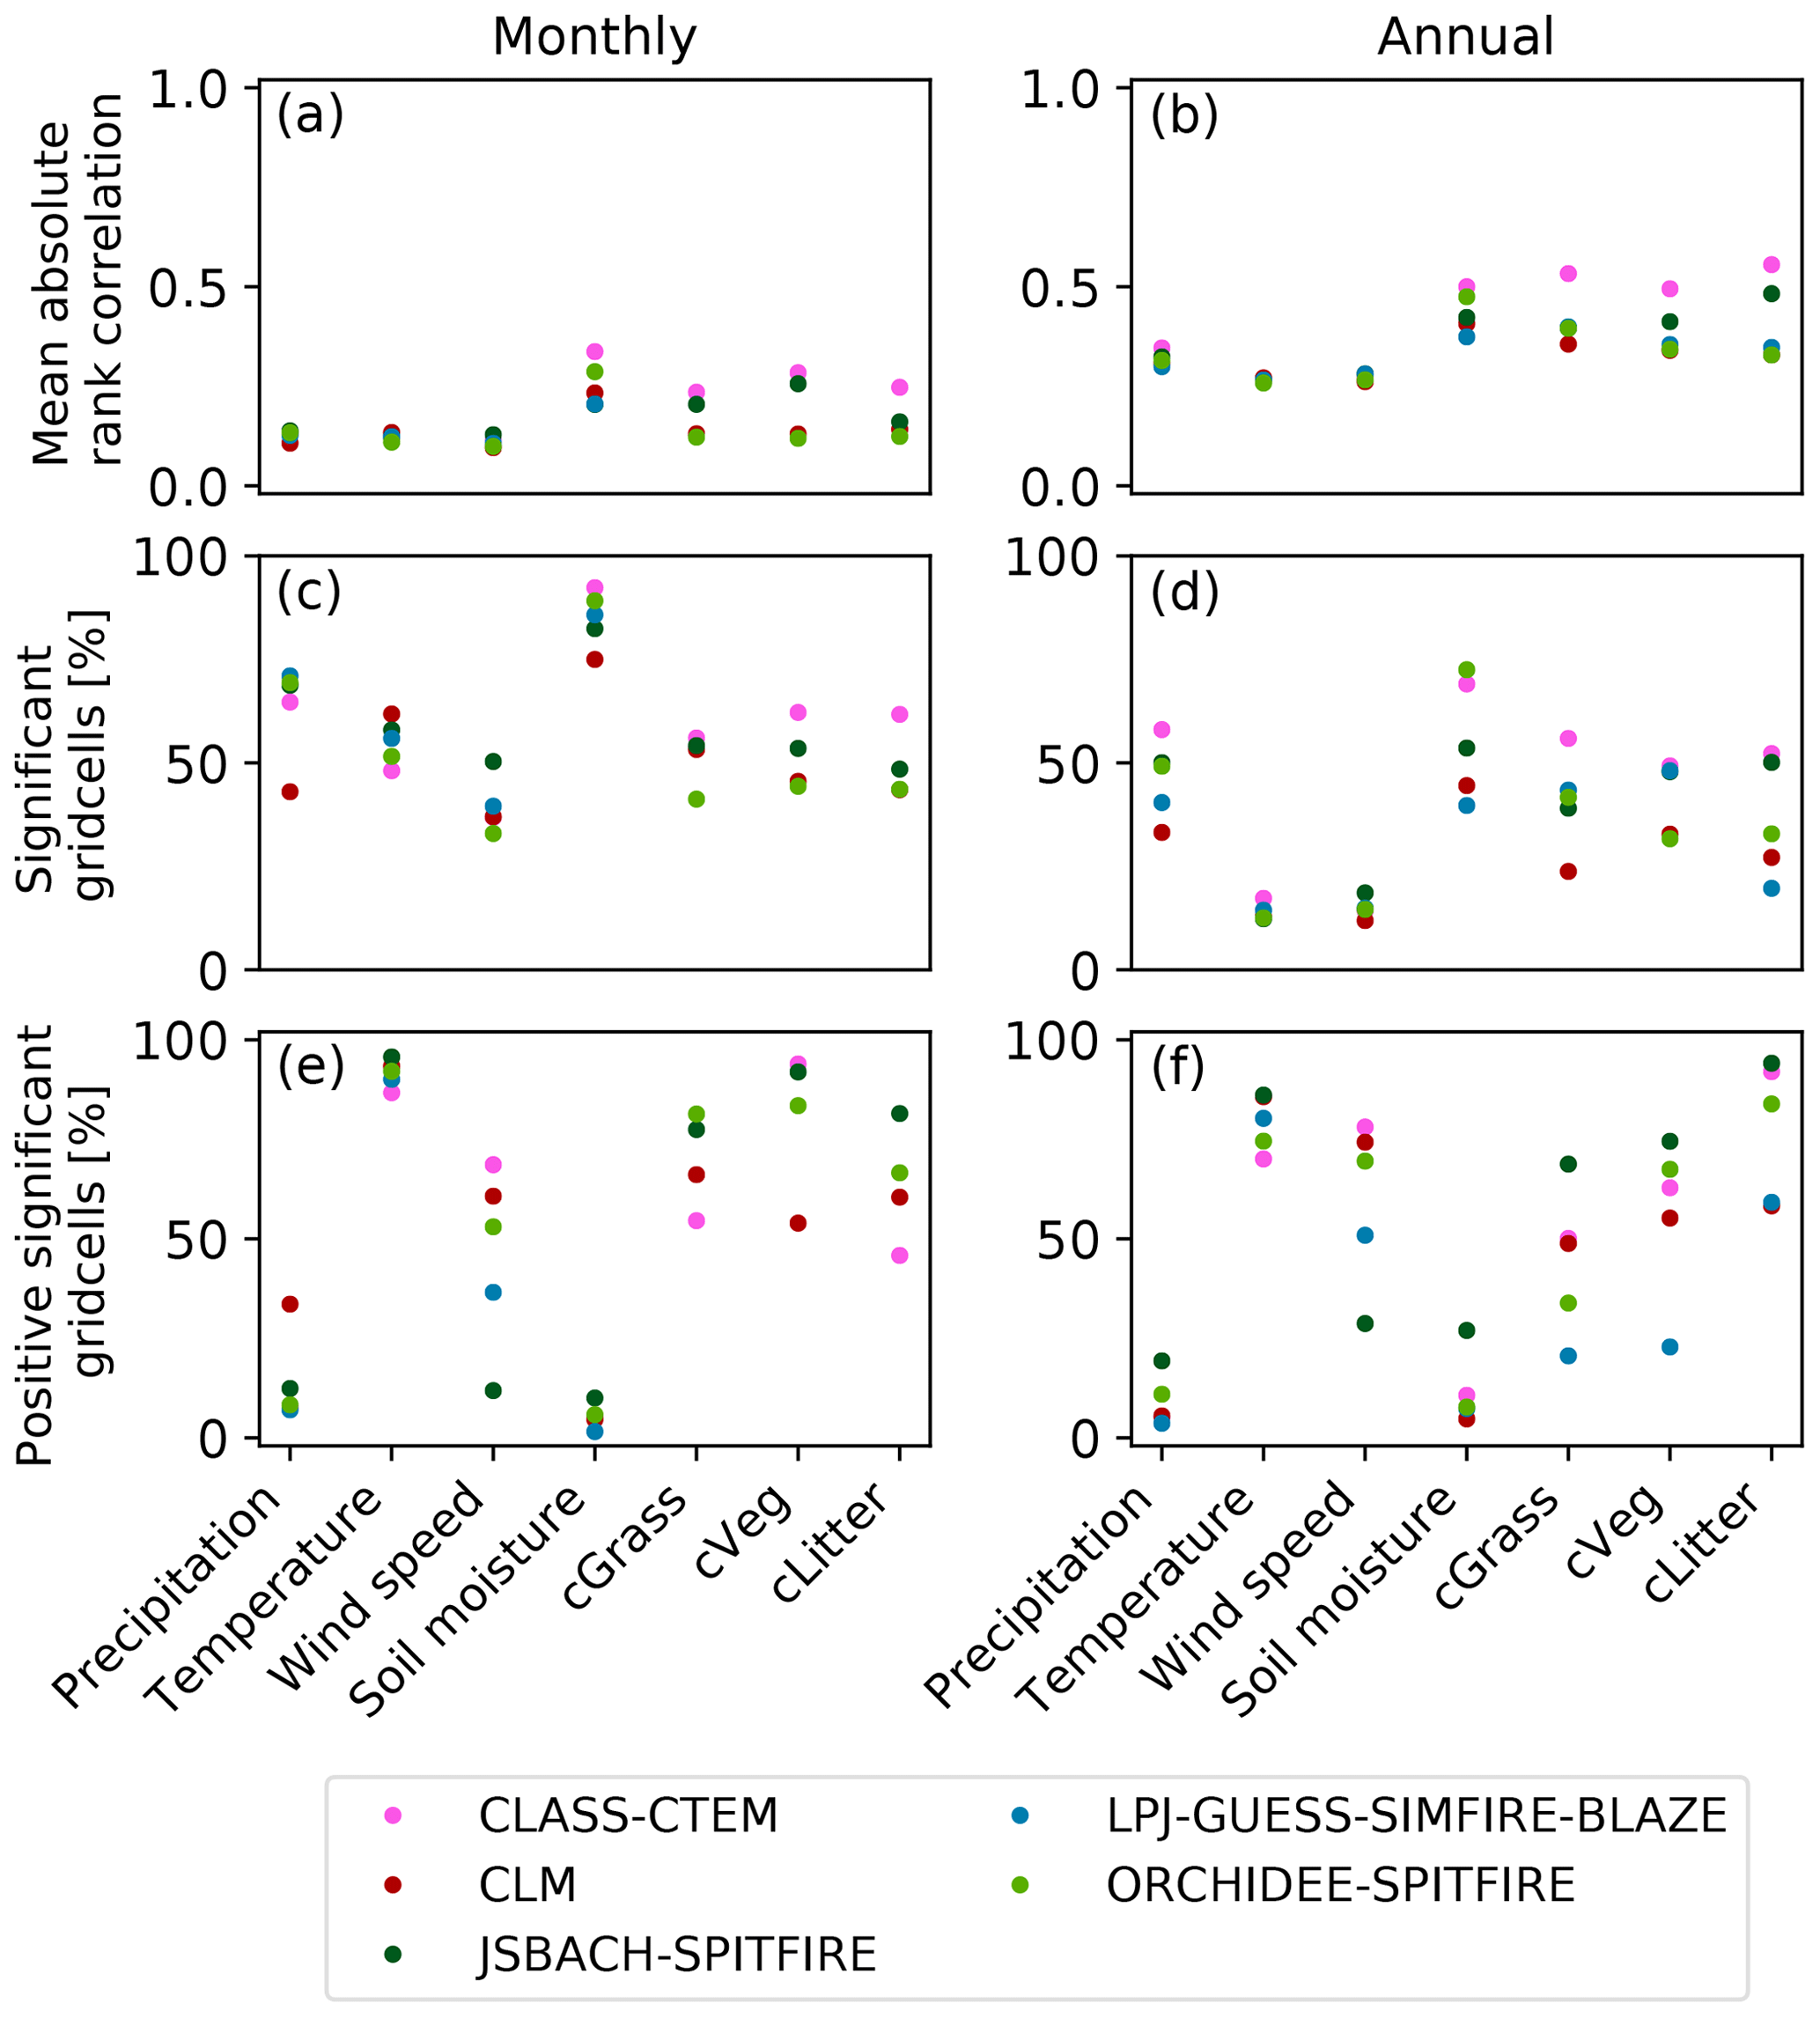
Figure A8Spearman rank-order correlation coefficient for each grid cell over 1921–2013 for the difference between the baseline experiment SF1 and the sensitivity experiment SF2_CLI (see Table 1) for annual burned area fraction, precipitation, temperature, wind speed, carbon stored in litter, carbon stored in vegetation, carbon stored in grass and in soil moisture, respectively. Panels (a) and (b) show the mean absolute rank correlation, i.e. the spatial average over the absolute and significant (p value < 0.05) Spearman rank-order correlation coefficients, in which the relative difference in burned area fraction is >0.1. Panels (c) and (d) show the proportion of grid cells with a significant correlation. Panels (e) and (f) indicate the percentage of significant grid cells with a positive correlation.
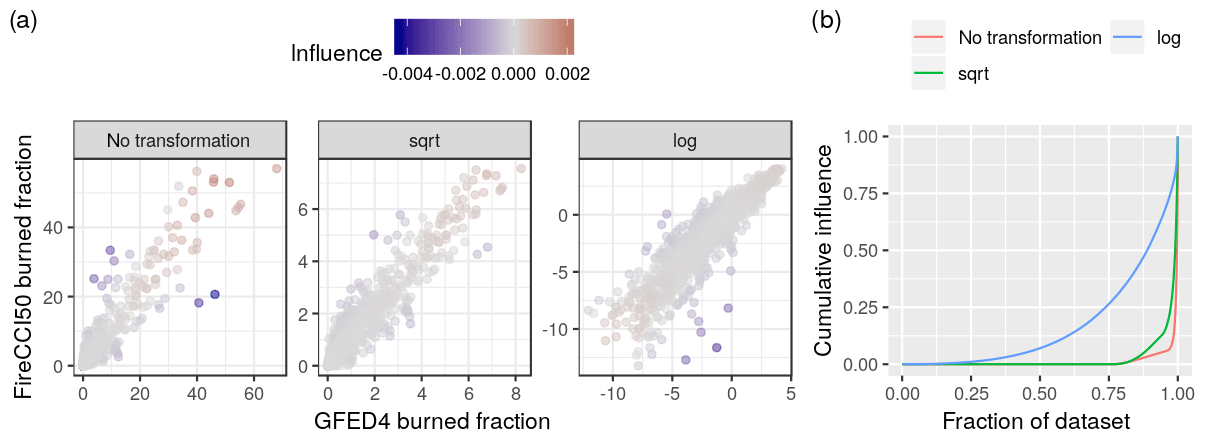
Figure A9Scatter plots for the GFED4 and FireCCI50 dataset without transformation, square root transformation and log transformation (a). The colour indicates the influence of individual datapoints on the correlation (computed as the difference in the correlation with and without that datapoint). Cumulative influence of datapoints in the dataset on the correlation (b). Without transformation a very small fraction has a strong influence on the correlation; these are grid cells with high burned area fraction (as can be seen in a).
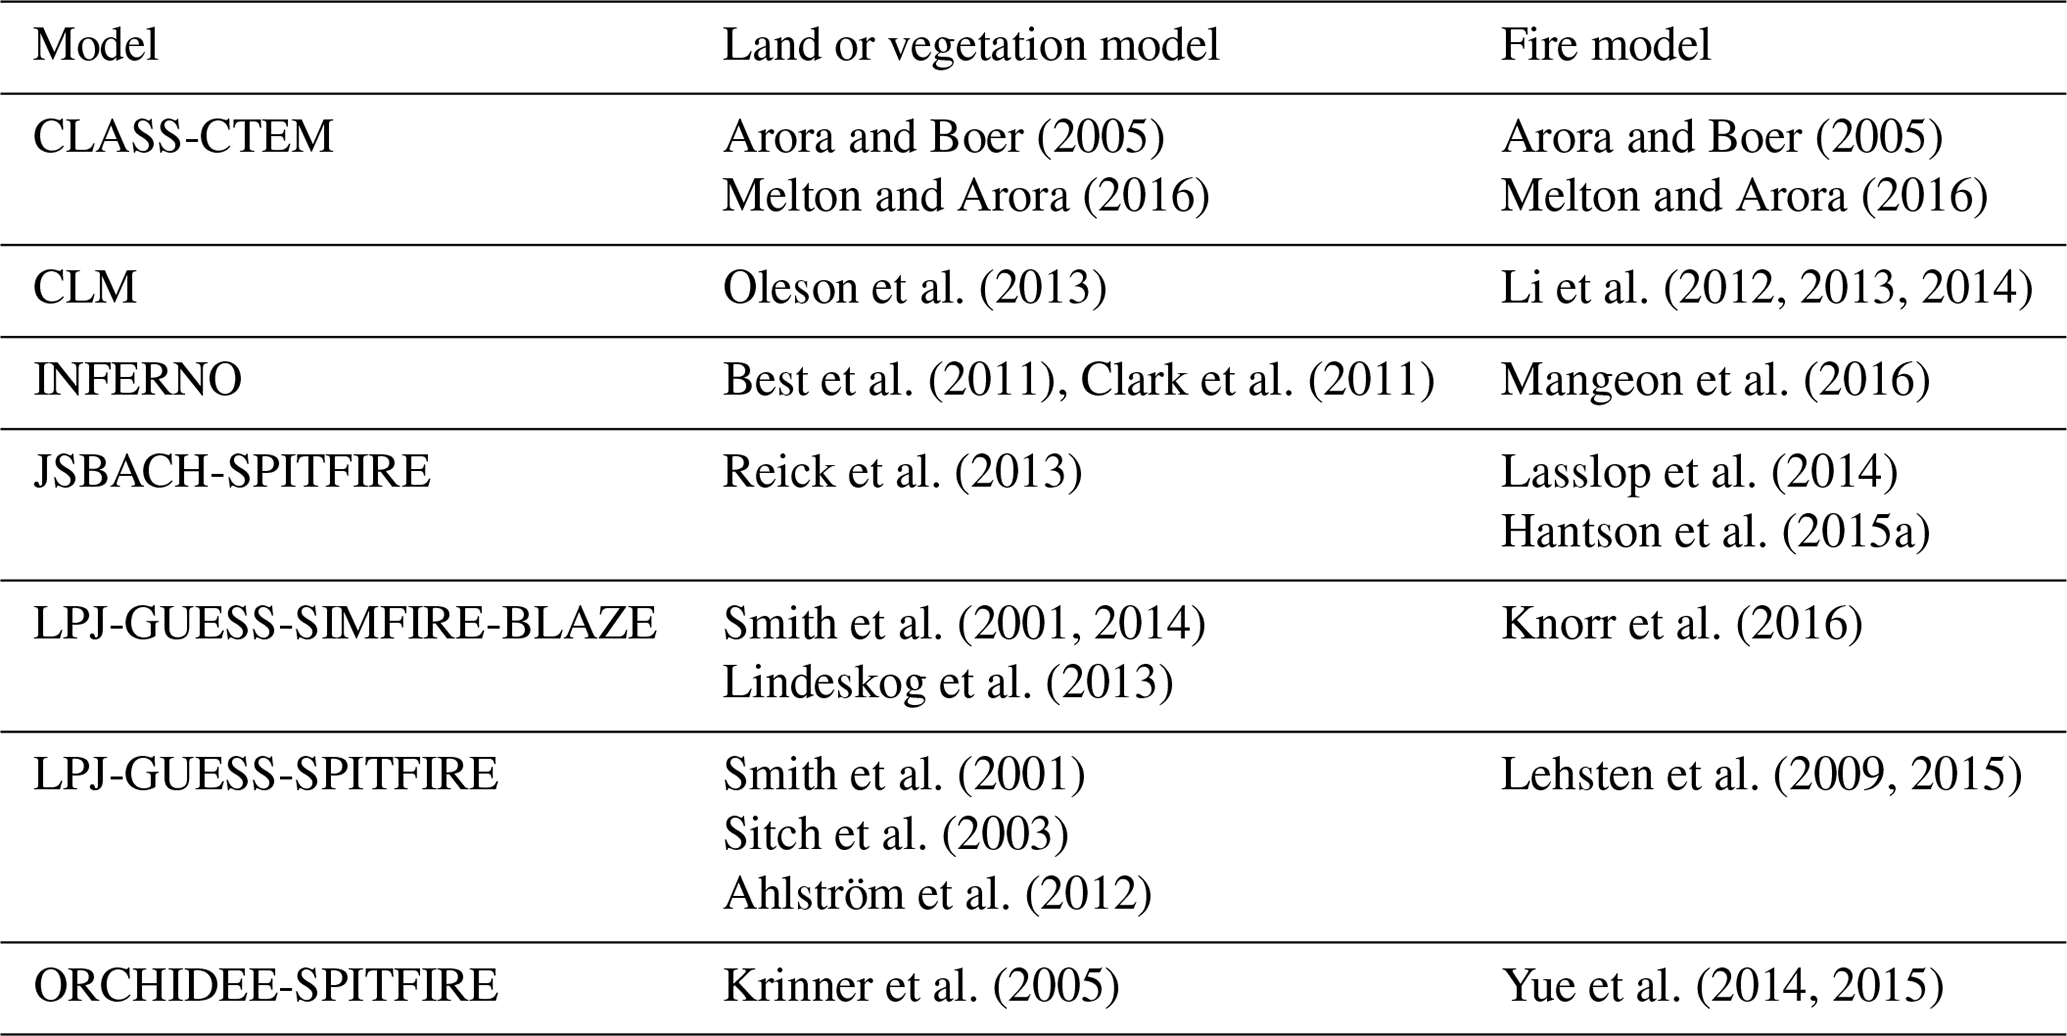
Table A2Correlation coefficients between burned area simulated by the FireMIP models within the baseline experiment SF1 and the respective observation data. Due to the very skewed distribution of burned area, we use a square root transformation on both the models and the observations. Numbers in brackets show the Pearson correlation coefficients for not-transformed data. Only GFED4 and FireCCI50 provide uncertainty estimates; therefore GFED4s is not included. Correlation coefficients for 33 % show the correlation between all grid points that lie within the 0 % and 33 % percentile of the relative standard error. Values for 66 % lie within the 33 %–66 % percentile of the relative standard error, and values for 99 % lie within the 66 %–99 % percentile. Bold numbers indicate correlation coefficients that are significant (p value <0.05).

LT and GL designed the study and performed the analysis with input from SPH, AH and SH. CY, GL, JRM, FL, MF and SH provided simulations. LT, GL and SPH wrote the paper with contributions from all authors.
The authors declare that they have no conflict of interest.
The authors are grateful for the support and guidance of Silvia Kloster, who initiated this work. We would like to thank Stephane Mangeon, who performed the simulations with INFERNO. Gitta Lasslop was funded by the Deutsche Forschungsgemeinschaft (DFG, German Research Foundation) – 338130981 and acknowledges the excellent computing support of DKRZ.
The article processing charges for this open-access publication were covered by the Max Planck Society.
This paper was edited by Akihiko Ito and reviewed by two anonymous referees.
Ahlström, A., Schurgers, G., Arneth, A., and Smith, B.: Robustness and uncertainty in terrestrial ecosystem carbon response to CMIP5 climate change projections, Environ. Res. Lett., 7, 044008, https://doi.org/10.1088/1748-9326/7/4/044008, 2012. a
Andela, N. and van der Werf, G. R.: Recent trends in African fires driven by cropland expansion and El Niño to La Niña transition, Nat. Clim. Change, 4, 791, https://doi.org/10.1038/nclimate2313, 2014. a
Andela, N., Morton, D. C., Giglio, L., Chen, Y., van der Werf, G. R., Kasibhatla, P. S., DeFries, R. S., Collatz, G. J., Hantson, S., Kloster, S., Bachelet, D., Forrest, M., Lasslop, G., Li, F., Mangeon, S., Melton, J. R., Yue, C., and Randerson, J. T.: A human-driven decline in global burned area, Science, 356, 1356–1362, https://doi.org/10.1126/science.aal4108, 2017. a, b, c, d, e, f, g, h, i, j
Andela, N., Morton, D. C., Giglio, L., Paugam, R., Chen, Y., Hantson, S., van der Werf, G. R., and Randerson, J. T.: The Global Fire Atlas of individual fire size, duration, speed and direction, Earth Syst. Sci. Data, 11, 529–552, https://doi.org/10.5194/essd-11-529-2019, 2019. a
Archibald, S., Scholes, R. J., Roy, D. P., Roberts, G., and Boschetti, L.: Southern African fire regimes as revealed by remote sensing, Int. J. Wildland Fire, 19, 861–878, https://doi.org/10.1071/WF10008, 2010. a
Arora, V. K. and Boer, G. J.: Fire as an interactive component of dynamic vegetation models, J. Geophys. Res.- Biogeo., 110, https://doi.org/10.1029/2005JG000042, 2005. a, b
Arora, V. K. and Melton, J. R.: Reduction in global area burned and wildfire emissions since 1930s enhances carbon uptake by land, Nat. Commun., 9, 1326, https://doi.org/10.1038/s41467-018-03838-0, 2018. a, b, c
Arora, V. K., Boer, G. J., Friedlingstein, P., Eby, M., Jones, C. D., Christian, J. R., Bonan, G., Bopp, L., Brovkin, V., Cadule, P., Hajima, T., Ilyina, T., Lindsay, K., Tjiputra, J. F., and Wu, T.: Carbon-Concentration and Carbon-Climate Feedbacks in CMIP5 Earth System Models, J. Clim., 26, 5289–5314, https://doi.org/10.1175/JCLI-D-12-00494.1, 2013. a
Balch, J. K., Bradley, B. A., Abatzoglou, J. T., Nagy, R. C., Fusco, E. J., and Mahood, A. L.: Human-started wildfires expand the fire niche across the United States, P. Natl. Acad. Sci. USA, 114, 2946–2951, https://doi.org/10.1073/pnas.1617394114, 2017. a
Best, M. J., Pryor, M., Clark, D. B., Rooney, G. G., Essery, R. L. H., Menard, C. B., Edwards, J. M., Hendry, M. A., Porson, A., Gedney, N., Mercado, L. M., Sitch, S., Blyth, E., Boucher, O., Cox, P. M., Grimmond, C. S. B., and Harding, R. J.: The Joint UK Land Environment Simulator (JULES), model description – Part 1: Energy and water fluxes, Geosci. Model Dev., 4, 677–699, https://doi.org/10.5194/gmd-4-677-2011, 2011. a
Bistinas, I., Harrison, S. P., Prentice, I. C., and Pereira, J. M. C.: Causal relationships versus emergent patterns in the global controls of fire frequency, Biogeosciences, 11, 5087–5101, https://doi.org/10.5194/bg-11-5087-2014, 2014. a, b, c, d, e, f
Bond, W. J. and Midgley, G. F.: Carbon dioxide and the uneasy interactions of trees and savannah grasses, Philos. T. R. Soc. B, 367, 601–612, 2012. a, b
Bond, W. J., Woodward, F. I., and Midgley, G. F.: The global distribution of ecosystems in a world without fire, New Phytol., 165, 525–538, https://doi.org/10.1111/j.1469-8137.2004.01252.x, 2005. a, b
Bowman, D. M. J. S., Balch, J. K., Artaxo, P., Bond, W. J., Carlson, J. M., Cochrane, M. A., D'Antonio, C. M., DeFries, R. S., Doyle, J. C., Harrison, S. P., Johnston, F. H., Keeley, J. E., Krawchuk, M. A., Kull, C. A., Marston, J. B., Moritz, M. A., Prentice, I. C., Roos, C. I., Scott, A. C., Swetnam, T. W., van der Werf, G. R., and Pyne, S. J.: Fire in the Earth System, Science, 324, 481–484, https://doi.org/10.1126/science.1163886, 2009. a
Bowman, D. M. J. S., Balch, J., Artaxo, P., Bond, W. J., Cochrane, M. A., D’Antonio, C. M., DeFries, R., Johnston, F. H., Keeley, J. E., Krawchuk, M. A., Kull, C. A., Mack, M., Moritz, M. A., Pyne, S., Roos, C. I., Scott, A. C., Sodhi, N. S., and Swetnam, T. W.: The human dimension of fire regimes on Earth, J. Biogeogr., 38, 2223–2236, https://doi.org/10.1111/j.1365-2699.2011.02595.x, 2011. a
Buitenwerf, R., Bond, W. J., Stevens, N., and Trollope, W. S. W.: Increased tree densities in South African savannas: >50 years of data suggests CO2 as a driver, Glob. Change Biol., 18, 675–684, https://doi.org/10.1111/j.1365-2486.2011.02561.x, 2012. a, b
Chuvieco, E., Giglio, L., and Justice, C.: Global characterization of fire activity: Toward defining fire regimes from Earth observation data, Glob. Change Biol., 14, 1488–1502, 2008. a
Chuvieco, E., Lizundia-Loiola, J., Pettinari, M. L., Ramo, R., Padilla, M., Tansey, K., Mouillot, F., Laurent, P., Storm, T., Heil, A., and Plummer, S.: Generation and analysis of a new global burned area product based on MODIS 250 m reflectance bands and thermal anomalies, Earth Syst. Sci. Data, 10, 2015–2031, https://doi.org/10.5194/essd-10-2015-2018, 2018. a, b
Clark, D. B., Mercado, L. M., Sitch, S., Jones, C. D., Gedney, N., Best, M. J., Pryor, M., Rooney, G. G., Essery, R. L. H., Blyth, E., Boucher, O., Harding, R. J., Huntingford, C., and Cox, P. M.: The Joint UK Land Environment Simulator (JULES), model description – Part 2: Carbon fluxes and vegetation dynamics, Geosci. Model Dev., 4, 701–722, https://doi.org/10.5194/gmd-4-701-2011, 2011. a, b
Conklin, H. C.: The Study of Shifting Cultivation, Curr. Anthropol., 2, 27–61, 1961. a
De Kauwe, M. G., Medlyn, B. E., Zaehle, S., Walker, A. P., Dietze, M. C., Hickler, T., Jain, A. K., Luo, Y., Parton, W. J., Prentice, I. C., Smith, B., Thornton, P. E., Wang, S., Wang, Y.-P., Wårlind, D., Weng, E., Crous, K. Y., Ellsworth, D. S., Hanson, P. J., Seok Kim, H., Warren, J. M., Oren, R., and Norby, R. J.: Forest water use and water use efficiency at elevated CO2: a model-data intercomparison at two contrasting temperate forest FACE sites, Glob. Change Biol., 19, 1759–1779, https://doi.org/10.1111/gcb.12164, 2013. a
Dumond, D. E.: Swidden Agriculture and the Rise of Maya Civilization, Southwestern J. Anthrop., 17, 301–316, https://doi.org/10.1086/soutjanth.17.4.3628942, 1961. a
Ehleringer, J. and Björkman, O.: Quantum Yields for CO2 Uptake in C3 and C4 Plants, Plant Physiol., 59, 86–90, https://doi.org/10.1104/pp.59.1.86, 1977. a
Ehleringer, J. R., Cerling, T. E., and Helliker, B. R.: C4 photosynthesis, atmospheric CO2, and climate, Oecologia, 112, 285–299, https://doi.org/10.1007/s004420050311, 1997. a
Erb, K.-H., Luyssaert, S., Meyfroidt, P., Pongratz, J., Don, A., Kloster, S., Kuemmerle, T., Fetzel, T., Fuchs, R., Herold, M., Haberl, H., Jones, C. D., Marín-Spiotta, E., McCallum, I., Robertson, E., Seufert, V., Fritz, S., Valade, A., Wiltshire, A., and Dolman, A. J.: Land management: data availability and process understanding for global change studies, Glob. Change Biol., 23, 512–533, https://doi.org/10.1111/gcb.13443, 2017. a
Farquhar, G. D., von Caemmerer, S., and Berry, J. A.: A biochemical model of photosynthetic CO2 assimilation in leaves of C3 species, Planta, 149, 78–90, https://doi.org/10.1007/BF00386231, 1980. a
Felsberg, A., Kloster, S., Wilkenskjeld, S., Krause, A., and Lasslop, G.: Lightning Forcing in Global Fire Models: The Importance of Temporal Resolution, J. Geophys. Res.-Biogeo., 123, 168–177, https://doi.org/10.1002/2017JG004080, 2018. a
Finlay, S. E., Moffat, A., Gazzard, R., Baker, D., and Murray, V.: Health Impacts of Wildfires, PLoS, 4, e4f959, https://doi.org/10.1371/4f959951cce2c, 2012. a
Forkel, M., Dorigo, W., Lasslop, G., Teubner, I., Chuvieco, E., and Thonicke, K.: A data-driven approach to identify controls on global fire activity from satellite and climate observations (SOFIA V1), Geosci. Model Dev., 10, 4443–4476, https://doi.org/10.5194/gmd-10-4443-2017, 2017. a, b, c
Forkel, M., Andela, N., Harrison, S. P., Lasslop, G., van Marle, M., Chuvieco, E., Dorigo, W., Forrest, M., Hantson, S., Heil, A., Li, F., Melton, J., Sitch, S., Yue, C., and Arneth, A.: Emergent relationships with respect to burned area in global satellite observations and fire-enabled vegetation models, Biogeosciences, 16, 57–76, https://doi.org/10.5194/bg-16-57-2019, 2019a. a, b, c, d, e
Forkel, M., Dorigo, W., Lasslop, G., Chuvieco, E., Hantson, S., Heil, A., Teubner, I., Thonicke, K., and Harrison, S. P.: Recent global and regional trends in burned area and their compensating environmental controls, Environ. Res. Commun., 1, 051005, https://doi.org/10.1088/2515-7620/ab25d2, 2019b. a, b, c, d, e
Gauthier, S., Bernier, P., Boulanger, Y., Guo, J., Guindon, L., Beaudoin, A., and Boucher, D.: Vulnerability of timber supply to projected changes in fire regime in Canada's managed forests, Can. J. Forest Res., 45, 1439–1447, https://doi.org/10.1139/cjfr-2015-0079, 2015. a
Giglio, L., Randerson, J. T., and van der Werf, G. R.: Analysis of daily, monthly, and annual burned area using the fourth-generation global fire emissions database (GFED4), J. Geophys. Res.-Biogeo., 118, 317–328, https://doi.org/10.1002/jgrg.20042, 2013. a
Goldewijk, K. K., Beusen, A., and Janssen, P.: Long-term dynamic modeling of global population and built-up area in a spatially explicit way: HYDE 3.1, The Holocene, 20, 565–573, https://doi.org/10.1177/0959683609356587, 2010. a
Hall, J. V., Loboda, T. V., Giglio, L., and McCarty, G. W.: A MODIS-based burned area assessment for Russian croplands: Mapping requirements and challenges, Remote Sens. Environ., 184, 506–521, https://doi.org/10.1016/j.rse.2016.07.022, 2016. a, b
Hantson, S., Lasslop, G., Kloster, S., and Chuvieco, E.: Anthropogenic effects on global mean fire size, Int. J. Wildland Fire, 24, 589–596, 2015a. a, b, c
Hantson, S., Pueyo, S., and Chuvieco, E.: Global fire size distribution is driven by human impact and climate, Global Ecol. Biogeogr., 24, 77–86, https://doi.org/10.1111/geb.12246, 2015b. a, b
Hantson, S., Arneth, A., Harrison, S. P., Kelley, D. I., Prentice, I. C., Rabin, S. S., Archibald, S., Mouillot, F., Arnold, S. R., Artaxo, P., Bachelet, D., Ciais, P., Forrest, M., Friedlingstein, P., Hickler, T., Kaplan, J. O., Kloster, S., Knorr, W., Lasslop, G., Li, F., Mangeon, S., Melton, J. R., Meyn, A., Sitch, S., Spessa, A., van der Werf, G. R., Voulgarakis, A., and Yue, C.: The status and challenge of global fire modelling, Biogeosciences, 13, 3359–3375, https://doi.org/10.5194/bg-13-3359-2016, 2016a. a, b, c, d, e
Hantson, S., Kloster, S., Coughlan, M., Daniau, A.-L., Vannière, B., Brücher, T., Kehrwald, N., and Magi, B. I.: Fire in the Earth System: Bridging Data and Modeling Research, B. Am. Meteorol. Soc., 97, 1069–1072, https://doi.org/10.1175/BAMS-D-15-00319.1, 2016b. a
Harrison, S., Marlon, J., and Bartlein, P.: Fire in the Earth System, Springer Netherlands, Dordrecht, 21–48, https://doi.org/10.1007/978-90-481-8716-4_3, 2010. a
Harrison, S. P., Bartlein, P. J., Brovkin, V., Houweling, S., Kloster, S., and Prentice, I. C.: The biomass burning contribution to climate–carbon-cycle feedback, Earth Syst. Dynam., 9, 663–677, https://doi.org/10.5194/esd-9-663-2018, 2018. a, b
Hickler, T., Smith, B., Prentice, I. C., Mjöfors, K., Miller, P., Arneth, A., and Sykes, M. T.: CO2 fertilization in temperate FACE experiments not representative of boreal and tropical forests, Glob. Change Biol., 14, 1531–1542, https://doi.org/10.1111/j.1365-2486.2008.01598.x, 2008. a, b
Hickler, T., Rammig, A., and Werner, C.: Modelling CO2 Impacts on Forest Productivity, Curr. For. Report., 1, 69–80, https://doi.org/10.1007/s40725-015-0014-8, 2015. a
Humber, M. L., Boschetti, L., Giglio, L., and Justice, C. O.: Spatial and temporal intercomparison of four global burned area products, Int. J. Digit. Earth, 12, 1–25, https://doi.org/10.1080/17538947.2018.1433727, 2018. a
Hurtt, G., Chini, L., Sahajpal, R., Frolking, S., Bodirsky, B. L., Calvin, K., Doelman, J., Fisk, J., Fujimori, S., Goldewijk, K. K., Hasegawa, T., Havlik, P., Heinimann, A., Humpenöder, F., Jungclaus, J., Kaplan, J., Krisztin, T., Lawrence, D., Lawrence, P., Mertz, O., Pongratz, J., Popp, A., Riahi, K., Shevliakova, E., Stehfest, E., Thornton, P., van Vuuren, D., and Zhang, X.: Harmonization of global land use scenarios (LUH2): SSP585 v2.1f 2015–2100, https://doi.org/10.22033/ESGF/input4MIPs.1662, 2017. a
Hurtt, G. C., Chini, L. P., Frolking, S., Betts, R. A., Feddema, J., Fischer, G., Fisk, J. P., Hibbard, K., Houghton, R. A., Janetos, A., Jones, C. D., Kindermann, G., Kinoshita, T., Klein Goldewijk, K., Riahi, K., Shevliakova, E., Smith, S., Stehfest, E., Thomson, A., Thornton, P., Vuuren, D. P., and Wang, Y. P.: Harmonization of land-use scenarios for the period 1500–2100: 600 years of global gridded annual land-use transitions, wood harvest, and resulting secondary lands, Climatic Change, 109, 117–161, https://doi.org/10.1007/s10584-011-0153-2, 2011. a
IPBES: Summary for policymakers of the methodological assessment of scenarios and models of biodiversity and ecosystem services of the Intergovernmental Science-Policy Platform on Biodiversity and Ecosystem Services, Secretariat of the Intergovernmental Science-Policy Platform on Biodiversity and Ecosystem Services, Bonn, 2016. a
IPCC: Climate Change 2014: Impacts, Adaptation, and Vulnerability, Part A: Global and Sectoral Aspects, Contribution of Working Group II to the Fifth Assessment Report of the Intergovernmental Panel on Climate Change, edited by: Field, C. B., Barros, V. R., Dokken, D. J., Mach, K. J., Mastrandrea, M. D., Bilir, T. E., Chatterjee, M., Ebi, K. L., Estrada, Y. O., Genova, R. C., Girma, B., Kissel, E. S., Levy, A. N., MacCracken, S., Mastrandrea, P. R., and White, L. L., Cambridge University Press, Cambridge, United Kingdom and New York, NY, USA, 2014. a
Johnston, F., Henderson, S., Chen, Y., T Randerson, J., Marlier, M., Defries, R., Kinney, P., Bowman, D., and Brauer, M.: Estimated Global Mortality Attributable to Smoke from Landscape Fires, Environ. Health Perspect., 120, 695–701, 2012. a
Johnston, K. J.: The intensification of pre-industrial cereal agriculture in the tropics: Boserup, cultivation lengthening, and the Classic Maya, J. Anthropol. Archaeol., 22, 126–161, https://doi.org/10.1016/S0278-4165(03)00013-8, 2003. a
Kelley, D. I. and Harrison, S. P.: Enhanced Australian carbon sink despite increased wildfire during the 21st century, Environ. Res. Lett., 9, 104015, https://doi.org/10.1088/1748-9326/9/10/104015, 2014. a, b
Kelley, D. I., Prentice, I. C., Harrison, S. P., Wang, H., Simard, M., Fisher, J., and Willis, K. O.: A comprehensive benchmarking system for evaluating global vegetation models, Biogeosciences, 10, 3313–3340, https://doi.org/10.5194/bg-10-3313-2013, 2013. a
Kloster, S. and Lasslop, G.: Historical and future fire occurrence (1850 to 2100) simulated in CMIP5 Earth System Models, Glob. Planet. Change, 150, 58–69, https://doi.org/10.1016/j.gloplacha.2016.12.017, 2017. a
Kloster, S., Mahowald, N. M., Randerson, J. T., Thornton, P. E., Hoffman, F. M., Levis, S., Lawrence, P. J., Feddema, J. J., Oleson, K. W., and Lawrence, D. M.: Fire dynamics during the 20th century simulated by the Community Land Model, Biogeosciences, 7, 1877–1902, https://doi.org/10.5194/bg-7-1877-2010, 2010. a, b
Knorr, W., Kaminski, T., Arneth, A., and Weber, U.: Impact of human population density on fire frequency at the global scale, Biogeosciences, 11, 1085–1102, https://doi.org/10.5194/bg-11-1085-2014, 2014. a, b, c, d
Knorr, W., Jiang, L., and Arneth, A.: Climate, CO2 and human population impacts on global wildfire emissions, Biogeosciences, 13, 267–282, https://doi.org/10.5194/bg-13-267-2016, 2016. a, b
Korontzi, S., McCarty, J., Loboda, T., Kumar, S., and Justice, C.: Global distribution of agricultural fires in croplands from 3 years of Moderate Resolution Imaging Spectroradiometer (MODIS) data, Global Biogeochem. Cy., 20, https://doi.org/10.1029/2005GB002529, 2006. a
Krause, A., Kloster, S., Wilkenskjeld, S., and Paeth, H.: The sensitivity of global wildfires to simulated past, present, and future lightning frequency, J. Geophys. Res.-Biogeo., 119, 312–322, https://doi.org/10.1002/2013JG002502, 2014. a, b
Krawchuk, M. a. and Moritz, M. A.: Constraints on global fire activity vary across a resource gradient, Ecology, 92, 121–132, 2011. a
Krinner, G., Viovy, N., de Noblet-Ducoudré, N., Ogée, J., Polcher, J., Friedlingstein, P., Ciais, P., Sitch, S., and Prentice, I. C.: A dynamic global vegetation model for studies of the coupled atmosphere-biosphere system, Global Biogeochem. Cy., 19, https://doi.org/10.1029/2003GB002199, 2005. a
Lasslop, G. and Kloster, S.: Impact of fuel variability on wildfire emission estimates, Atmos. Environ., 121, 93–102, https://doi.org/10.1016/j.atmosenv.2015.05.040, 2015. a
Lasslop, G. and Kloster, S.: Human impact on wildfires varies between regions and with vegetation productivity, Environ. Res. Lett., 12, 115011, https://doi.org/10.1088/1748-9326/aa8c82, 2017. a, b
Lasslop, G., Thonicke, K., and Kloster, S.: SPITFIRE within the MPI Earth system model: Model development and evaluation, J. Adv. Model. Earth Sy., 6, 740–755, 2014. a, b, c, d, e
Lasslop, G., Hantson, S., and Kloster, S.: Influence of wind speed on the global variability of burned fraction: A global fire model's perspective, Int. J. Wildland Fire, 24, 989–1000, https://doi.org/10.1071/WF15052, 2015. a
Lasslop, G., Brovkin, V., Reick, C., Bathiany, S., and Kloster, S.: Multiple stable states of tree cover in a global land surface model due to a fire-vegetation feedback, Geophys. Res. Lett., 43, 6324–6331, https://doi.org/10.1002/2016GL069365, 2016. a
Lasslop, G., Moeller, T., D'Onofrio, D., Hantson, S., and Kloster, S.: Tropical climate-vegetation-fire relationships: multivariate evaluation of the land surface model JSBACH, Biogeosciences, 15, 5969–5989, https://doi.org/10.5194/bg-15-5969-2018, 2018. a
Lasslop, G., Coppola, A. I., Voulgarakis, A., Yue, C., and Veraverbeke, S.: Influence of Fire on the Carbon Cycle and Climate, Curr. Clim. Change Report., 5, 112–123, https://doi.org/10.1007/s40641-019-00128-9, 2019. a, b, c
Laurent, P., Mouillot, F., Yue, C., Ciais, P., Moreno, M. V., and Nogueira, J. M. P.: FRY, a global database of fire patch functional traits derived from space-borne burned area products, Sci. Data, 5, 180132, https://doi.org/10.1038/sdata.2018.132, 2018. a, b
Lehsten, V., Tansey, K., Balzter, H., Thonicke, K., Spessa, A., Weber, U., Smith, B., and Arneth, A.: Estimating carbon emissions from African wildfires, Biogeosciences, 6, 349–360, https://doi.org/10.5194/bg-6-349-2009, 2009. a
Lehsten, V., Arneth, A., Spessa, A., Thonicke, K., and Moustakas, A.: The effect of fire on tree-grass coexistence in savannas: A simulation study, Int. J. Wildland Fire, 25, 137–146, https://doi.org/10.1071/WF14205, 2015. a
Li, F. and Lawrence, D. M.: Role of Fire in the Global Land Water Budget during the Twentieth Century due to Changing Ecosystems, J. Clim., 30, 1893–1908, https://doi.org/10.1175/JCLI-D-16-0460.1, 2017. a
Li, F., Zeng, X. D., and Levis, S.: A process-based fire parameterization of intermediate complexity in a Dynamic Global Vegetation Model, Biogeosciences, 9, 2761–2780, https://doi.org/10.5194/bg-9-2761-2012, 2012. a, b
Li, F., Levis, S., and Ward, D. S.: Quantifying the role of fire in the Earth system – Part 1: Improved global fire modeling in the Community Earth System Model (CESM1), Biogeosciences, 10, 2293–2314, https://doi.org/10.5194/bg-10-2293-2013, 2013. a
Li, F., Bond-Lamberty, B., and Levis, S.: Quantifying the role of fire in the Earth system – Part 2: Impact on the net carbon balance of global terrestrial ecosystems for the 20th century, Biogeosciences, 11, 1345–1360, https://doi.org/10.5194/bg-11-1345-2014, 2014. a
Li, F., Lawrence, D. M., and Bond-Lamberty, B.: Impact of fire on global land surface air temperature and energy budget for the 20th century due to changes within ecosystems, Environ. Res. Lett., 12, 044014, https://doi.org/10.1088/1748-9326/aa6685, 2017. a
Li, F., Lawrence, D. M., and Bond-Lamberty, B.: Human impacts on 20th century fire dynamics and implications for global carbon and water trajectories, Glob. Planet. Change, 162, 18–27, https://doi.org/10.1016/j.gloplacha.2018.01.002, 2018. a
Lindeskog, M., Arneth, A., Bondeau, A., Waha, K., Seaquist, J., Olin, S., and Smith, B.: Implications of accounting for land use in simulations of ecosystem carbon cycling in Africa, Earth Syst. Dynam., 4, 385–407, https://doi.org/10.5194/esd-4-385-2013, 2013. a
Mangeon, S., Voulgarakis, A., Gilham, R., Harper, A., Sitch, S., and Folberth, G.: INFERNO: a fire and emissions scheme for the UK Met Office's Unified Model, Geosci. Model Dev., 9, 2685–2700, https://doi.org/10.5194/gmd-9-2685-2016, 2016. a, b
Marlon, J. R., Bartlein, P. J., Carcaillet, C., Gavin, D. G., Harrison, S. P., Higuera, P. E., Joos, F., Power, M. J., and Prentice, I. C.: Climate and human influences on global biomass burning over the past two millennia, Nat. Geosci., 1, 697–702, https://doi.org/10.1038/ngeo313, 2008. a, b, c
Marlon, J. R., Bartlein, P. J., Daniau, A.-L., Harrison, S. P., Maezumi, S. Y., Power, M. J., Tinner, W., and Vanniére, B.: Global biomass burning: a synthesis and review of Holocene paleofire records and their controls, Quaternary Sci. Rev., 65, 5–25, https://doi.org/10.1016/j.quascirev.2012.11.029, 2013. a
Marlon, J. R., Kelly, R., Daniau, A.-L., Vannière, B., Power, M. J., Bartlein, P., Higuera, P., Blarquez, O., Brewer, S., Brücher, T., Feurdean, A., Romera, G. G., Iglesias, V., Maezumi, S. Y., Magi, B., Courtney Mustaphi, C. J., and Zhihai, T.: Reconstructions of biomass burning from sediment-charcoal records to improve data-model comparisons, Biogeosciences, 13, 3225–3244, https://doi.org/10.5194/bg-13-3225-2016, 2016. a, b
McLeod, A.: Kendall: Kendall rank correlation and Mann-Kendall trend test, available at: https://CRAN.R-project.org/package=Kendall (last access: 27 September 2019), R package version 2.2, 2011. a
Melton, J. R. and Arora, V. K.: Competition between plant functional types in the Canadian Terrestrial Ecosystem Model (CTEM) v. 2.0, Geosci. Model Dev., 9, 323–361, https://doi.org/10.5194/gmd-9-323-2016, 2016. a, b
Morison, J. I. L.: Sensitivity of stomata and water use efficiency to high CO2, Plant, Cell Environ., 8, 467–474, https://doi.org/10.1111/j.1365-3040.1985.tb01682.x, 1985. a
Oleson, K., Lawrence, D., B. Bonan, G., Drewniak, B., Huang, M., Koven, C., Levis, S., Li, F., Riley, W., M. Subin, Z., C. Swenson, S., E. Thornton, P., Bozbiyik, A., Fisher, R., Heald, C., Kluzek, E., Lamarque, J.-F., Lawrence, P., Leung, L., and Yang, Z.-L.: Technical description of version 4.5 of the Community Land Model (CLM), 2013. a
Otto, J. S. and Anderson, N. E.: Slash-And-Burn Cultivation in the Highlands South: A Problem in Comparative Agricultural History, Comp. Stud. Soc. Hist., 24, 131–147, 1982. a
Parisien, M.-A., Miller, C., Parks, S. A., DeLancey, E. R., Robinne, F.-N., and Flannigan, M. D.: The spatially varying influence of humans on fire probability in North America, Environ. Res. Lett., 11, 075005, https://doi.org/10.1088/1748-9326/11/7/075005, 2016. a
Peterson, D., Wang, J., Ichoku, C., and Remer, L. A.: Effects of lightning and other meteorological factors on fire activity in the North American boreal forest: implications for fire weather forecasting, Atmos. Chem. Phys., 10, 6873–6888, https://doi.org/10.5194/acp-10-6873-2010, 2010. a
Pettinari, M. L. and Chuvieco, E.: Generation of a global fuel data set using the Fuel Characteristic Classification System, Biogeosciences, 13, 2061–2076, https://doi.org/10.5194/bg-13-2061-2016, 2016. a
Pfeiffer, M., Spessa, A., and Kaplan, J. O.: A model for global biomass burning in preindustrial time: LPJ-LMfire (v1.0), Geosci. Model Dev., 6, 643–685, https://doi.org/10.5194/gmd-6-643-2013, 2013. a
Prentice, I. C., Kelley, D. I., Foster, P. N., Friedlingstein, P., Harrison, S. P., and Bartlein, P. J.: Modeling fire and the terrestrial carbon balance, Global Biogeochem. Cy., 25, https://doi.org/10.1029/2010GB003906, 2011. a
Rabin, S. S., Magi, B. I., Shevliakova, E., and Pacala, S. W.: Quantifying regional, time-varying effects of cropland and pasture on vegetation fire, Biogeosciences, 12, 6591–6604, https://doi.org/10.5194/bg-12-6591-2015, 2015. a, b
Rabin, S. S., Melton, J. R., Lasslop, G., Bachelet, D., Forrest, M., Hantson, S., Kaplan, J. O., Li, F., Mangeon, S., Ward, D. S., Yue, C., Arora, V. K., Hickler, T., Kloster, S., Knorr, W., Nieradzik, L., Spessa, A., Folberth, G. A., Sheehan, T., Voulgarakis, A., Kelley, D. I., Prentice, I. C., Sitch, S., Harrison, S., and Arneth, A.: The Fire Modeling Intercomparison Project (FireMIP), phase 1: experimental and analytical protocols with detailed model descriptions, Geosci. Model Dev., 10, 1175–1197, https://doi.org/10.5194/gmd-10-1175-2017, 2017a. a, b, c, d, e
Rabin, S. S., Melton, J. R., Lasslop, G., Bachelet, D., Forrest, M., Hantson, S., Kaplan, J. O., Li, F., Mangeon, S., Ward, D. S., Yue, C., Arora, V. K., Hickler, T., Kloster, S., Knorr, W., Nieradzik, L., Spessa, A., Folberth, G. A., Sheehan, T., Voulgarakis, A., Kelley, D. I., Prentice, I. C., Sitch, S., Harrison, S., and Arneth, A.: The Fire Modeling Intercomparison Project (FireMIP), phase 1: experimental and analytical protocols with detailed model descriptions, Geosci. Model Dev., 10, 1175–1197, https://doi.org/10.5194/gmd-10-1175-2017, 2017b. a, b, c, d, e
Rabin, S. S., Ward, D. S., Malyshev, S. L., Magi, B. I., Shevliakova, E., and Pacala, S. W.: A fire model with distinct crop, pasture, and non-agricultural burning: use of new data and a model-fitting algorithm for FINAL.1, Geosci. Model Dev., 11, 815–842, https://doi.org/10.5194/gmd-11-815-2018, 2018. a
Randerson, J. T., Chen, Y., van der Werf, G. R., Rogers, B. M., and Morton, D. C.: Global burned area and biomass burning emissions from small fires, J. Geophys. Res.-Biogeo., 117, G04012, https://doi.org/10.1029/2012JG002128, 2012. a, b
Rasul, G. and Thapa, G. B.: Shifting cultivation in the mountains of South and Southeast Asia: regional patterns and factors influencing the change, Land Degrad. Dev., 14, 495–508, https://doi.org/10.1002/ldr.570, 2003. a
Reick, C. H., Raddatz, T., Brovkin, V., and Gayler, V.: Representation of natural and anthropogenic land cover change in MPI-ESM, J. Adv. Model. Earth Sy., 5, 459–482, https://doi.org/10.1002/jame.20022, 2013. a, b
Roteta, E., Bastarrika, A., Padilla, M., Storm, T., and Chuvieco, E.: Development of a Sentinel-2 burned area algorithm: Generation of a small fire database for sub-Saharan Africa, Remote Sens. Environ., 222, 1–17, https://doi.org/10.1016/j.rse.2018.12.011, 2019. a
Sage, R. F. and Kubien, D. S.: The temperature response of C3 and C4 photosynthesis, Plant Cell Environ., 30, 1086–1106, https://doi.org/10.1111/j.1365-3040.2007.01682.x, 2007. a
Schellnhuber, H. J., Frieler, K., and Kabat, P.: The elephant, the blind, and the intersectoral intercomparison of climate impacts: Fig. 1, P. Natl. Acad. Sci. USA, 111, 3225–3227, https://doi.org/10.1073/pnas.1321791111, 2014. a
Scott, A. C., Bowman, D. M. J. S., Bond, W. J., Pyne, S. J., and Alexander, M. E.: Fire on Earth: An Introduction, Wiley-Blackwell, Hoboken, New Jersey, USA, 2014. a, b, c
Sitch, S., Smith, B., Prentice, I. C., Arneth, A., Bondeau, A., Cramer, W., Kaplan, J. O., Levis, S., Lucht, W., Sykes, M. T., Thonicke, K., and Venevsky, S.: Evaluation of ecosystem dynamics, plant geography and terrestrial carbon cycling in the LPJ dynamic global vegetation model, Glob. Change Biol., 9, 161–185, https://doi.org/10.1046/j.1365-2486.2003.00569.x, 2003. a
Smith, B., Prentice, I. C., and Sykes, M. T.: Representation of vegetation dynamics in the modelling of terrestrial ecosystems: comparing two contrasting approaches within European climate space, Glob. Ecol. Biogeogr., 10, 621–637, https://doi.org/10.1046/j.1466-822X.2001.t01-1-00256.x, 2001. a, b
Smith, B., Wårlind, D., Arneth, A., Hickler, T., Leadley, P., Siltberg, J., and Zaehle, S.: Implications of incorporating N cycling and N limitations on primary production in an individual-based dynamic vegetation model, Biogeosciences, 11, 2027–2054, https://doi.org/10.5194/bg-11-2027-2014, 2014. a
Stocks, B. J., Mason, J. A., Todd, J. B., Bosch, E. M., Wotton, B. M., Amiro, B. D., Flannigan, M. D., Hirsch, K. G., Logan, K. A., Martell, D. L., and Skinner, W. R.: Large forest fires in Canada, 1959–1997, J. Geophys. Res.-Atmos., 107, https://doi.org/10.1029/2001JD000484, 2002. a
Syphard, A. D., Radeloff, V. C., Hawbaker, T. J., and Stewart, S. I.: Conservation Threats Due to Human-Caused Increases in Fire Frequency in Mediterranean-Climate Ecosystems, Conserv. Biol., 23, 758–769, https://doi.org/10.1111/j.1523-1739.2009.01223.x, 2009. a
van der Werf, G. R., Randerson, J. T., Giglio, L., van Leeuwen, T. T., Chen, Y., Rogers, B. M., Mu, M., van Marle, M. J. E., Morton, D. C., Collatz, G. J., Yokelson, R. J., and Kasibhatla, P. S.: Global fire emissions estimates during 1997–2016, Earth Syst. Sci. Data, 9, 697–720, https://doi.org/10.5194/essd-9-697-2017, 2017. a, b
van Marle, M. J. E., Kloster, S., Magi, B. I., Marlon, J. R., Daniau, A.-L., Field, R. D., Arneth, A., Forrest, M., Hantson, S., Kehrwald, N. M., Knorr, W., Lasslop, G., Li, F., Mangeon, S., Yue, C., Kaiser, J. W., and van der Werf, G. R.: Historic global biomass burning emissions for CMIP6 (BB4CMIP) based on merging satellite observations with proxies and fire models (1750–2015), Geosci. Model Dev., 10, 3329–3357, https://doi.org/10.5194/gmd-10-3329-2017, 2017. a, b
Vannière, B., Blarquez, O., Rius, D., Doyen, E., Brücher, T., Colombaroli, D., Connor, S., Feurdean, A., Hickler, T., Kaltenrieder, P., Lemmen, C., Leys, B., Massa, C., and Olofsson, J.: 7000-year human legacy of elevation-dependent European fire regimes, Quaternary Sci. Rev., 132, 206–212, https://doi.org/10.1016/j.quascirev.2015.11.012, 2016. a
Veira, A., Lasslop, G., and Kloster, S.: Wildfires in a warmer climate: Emission fluxes, emission heights, and black carbon concentrations in 2090–2099, J. Geophys. Res.-Atmos., 121, 3195–3223, https://doi.org/10.1002/2015JD024142, 2016. a
Veraverbeke, S., Rogers, B., Goulden, M., Jandt, R., Miller, C., Wiggins, E., and Randerson, J.: Lightning as a major driver of recent large fire years in North American boreal forests, Nat. Clim. Change, 7, 529–534, 2017. a, b
Wand, S. J. E., Midgley, G. F., Jones, M. H., and Curtis, P. S.: Responses of wild C4 and C3 grass (Poaceae) species to elevated atmospheric CO2 concentration: a meta-analytic test of current theories and perceptions, Glob. Change Biol., 5, 723–741, https://doi.org/10.1046/j.1365-2486.1999.00265.x, 2001. a
Wang, Z., Chappellaz, J., Park, K., and Mak, J. E.: Large Variations in Southern Hemisphere Biomass Burning During the Last 650 Years, Science, 330, 1663–1666, https://doi.org/10.1126/science.1197257, 2010. a
Ward, D. S., Kloster, S., Mahowald, N. M., Rogers, B. M., Randerson, J. T., and Hess, P. G.: The changing radiative forcing of fires: global model estimates for past, present and future, Atmos. Chem. Phys., 12, 10857–10886, https://doi.org/10.5194/acp-12-10857-2012, 2012. a
Wenzel, S., Cox, P. M., Eyring, V., and Friedlingstein, P.: Projected land photosynthesis constrained by changes in the seasonal cycle of atmospheric CO2, Nature, 538, 499–501, https://doi.org/10.1038/nature19772, 2016. a
Wigley, B. J., Bond, W. J., and Hoffman, M. T.: Thicket expansion in a South African savanna under divergent land use: local vs. global drivers?, Glob. Change Biol., 16, 964–976, https://doi.org/10.1111/j.1365-2486.2009.02030.x, 2010. a, b
Williams, R. J., Cook, G. D., Gill, A. M., and Moore, P. H. R.: Fire regime, fire intensity and tree survival in a tropical savanna in northern Australia, Austral. Ecol., 24, 50–59, https://doi.org/10.1046/j.1442-9993.1999.00946.x, 1999. a
Wooster, M. J., Roberts, G., Perry, G. L. W., and Kaufman, Y. J.: Retrieval of biomass combustion rates and totals from fire radiative power observations: FRP derivation and calibration relationships between biomass consumption and fire radiative energy release, J. Geophys. Res., 110, D24311, https://doi.org/10.1029/2005JD006318, 2005. a
Yue, C., Ciais, P., Cadule, P., Thonicke, K., Archibald, S., Poulter, B., Hao, W. M., Hantson, S., Mouillot, F., Friedlingstein, P., Maignan, F., and Viovy, N.: Modelling the role of fires in the terrestrial carbon balance by incorporating SPITFIRE into the global vegetation model ORCHIDEE – Part 1: simulating historical global burned area and fire regimes, Geosci. Model Dev., 7, 2747–2767, https://doi.org/10.5194/gmd-7-2747-2014, 2014. a, b
Yue, C., Ciais, P., Cadule, P., Thonicke, K., and van Leeuwen, T. T.: Modelling the role of fires in the terrestrial carbon balance by incorporating SPITFIRE into the global vegetation model ORCHIDEE – Part 2: Carbon emissions and the role of fires in the global carbon balance, Geosci. Model Dev., 8, 1321–1338, https://doi.org/10.5194/gmd-8-1321-2015, 2015. a
Yue, C., Ciais, P., Zhu, D., Wang, T., Peng, S. S., and Piao, S. L.: How have past fire disturbances contributed to the current carbon balance of boreal ecosystems?, Biogeosciences, 13, 675–690, https://doi.org/10.5194/bg-13-675-2016, 2016. a
Zhang, T., Wooster, M., de Jong, M., and Xu, W.: How Well Does the “Small Fire Boost” Methodology Used within the GFED4.1s Fire Emissions Database Represent the Timing, Location and Magnitude of Agricultural Burning?, Remote Sens., 10, 823, https://doi.org/10.3390/rs10060823, 2018. a