the Creative Commons Attribution 4.0 License.
the Creative Commons Attribution 4.0 License.
 | 17 Oct 2019
Modelling long-term blanket peatland development in eastern Scotland
Nils Broothaerts
Gert Verstraeten
Blanket peatlands constitute a rare ecosystem on a global scale, but blanket peatland is the most important peatland type on the British Isles. Most long-term peatland development models have focussed on peat bogs and high-latitude regions. Here, we present a process-based 2-D hillslope model to simulate long-term blanket peatland development along complex hillslope topographies. To calibrate the model, the peatland architecture was assessed along 56 hillslope transects in the headwaters of the river Dee (633 km2) in eastern Scotland, resulting in a dataset of 866 soil profile descriptions. The application of the calibrated model using local pollen-based land cover and regional climate reconstructions (mean annual temperature and mean monthly precipitation) over the last 12 000 years shows that the Early Holocene peatland development was largely driven by a temperature increase. An increase in woodland cover only has a slight positive effect on the peat growth potential contradicting the hypothesis that blanket peatland developed as a response to deforestation. Both the hillslope measurements and the model simulations demonstrate that the blanket peatland cover in the study area is highly variable both in extent and peat thickness stressing the need for spatially distributed peatland modelling. At the landscape scale, blanket peatlands were an important atmospheric carbon sink during the period 9.5–6 kyr BP. However, during the last 6000 years, the blanket peatlands were in a state of dynamic equilibrium with minor changes in the carbon balance.
- Article
(5408 KB) - Full-text XML
- BibTeX
- EndNote


Peatlands occur across the globe and contain up to one third of the global soil carbon stock, despite covering approximately less than 3 % of the Earth's surface (Gorham, 1991; Xu et al., 2018). Especially at higher latitudes, peatlands are an important ecosystem type, and their dynamics have profoundly influenced the terrestrial carbon cycle throughout the Holocene (Yu et al., 2011). Unfortunately, little is known about long-term peatland dynamics and their response to climatic and land cover changes (Wu, 2012).
Blanket peatlands are spreads of peat of varying thickness, covering the underlying topography, thus “blanketing” the landscape (Lindsay, 1995). This peatland type occurs in hyperoceanic climates with cool and moist conditions throughout the year, and it is mostly confined to the maritime edges of the continents (Gallego-Sala and Prentice, 2013). Due to its location in the landscape, blanket peatland formation is more controlled by topography, compared to other peatland types (Parry et al., 2012). Although rare on a global scale, up to 6 % of the area of the United Kingdom is covered by blanket peatland (Jones et al., 2003). The large area of the Scottish blanket peatlands, covering 23 % of the country, compared to the international rarity of these environments, makes the Scottish peatlands a high-value target for conservation efforts (Fyfe et al., 2013; Tipping, 2008).
During the Holocene, large areas of blanket peatland have developed throughout the Scottish Highlands, and this shift from mineral to waterlogged and nutrient-poor organic soils is one of the most important Holocene landscape changes in Scotland. Different hypotheses have been raised regarding the cause of this peatland development (Tipping, 2008). The original hypothesis, as proposed by Moore, linked the blanket peatland initiation to human impact, where anthropogenic land use change and increased grazing during the Neolithic period led to a shift in the hillslope hydrology resulting in the paludification of the upland soils (Moore, 1973). While this hypothesis has been supported by local studies throughout the British Isles, other authors have suggested that, at least for Scotland, the initiation of blanket peatlands resulted from climatic changes during the Atlantic period (Ellis and Tallis, 2000; Huang, 2002; Simmons and Innes, 1988; Tipping, 2008). A recent study based on a database of basal radiocarbon dates shows regional differences in the timing of the blanket peatland development with an earlier timing for central and southern Scotland, compared to the other regions of the British Isles (Gallego-Sala et al., 2016). Most of the case studies studying the blanket peatland initiation are based on field data such as pollen cores and radiocarbon dating, but studying causalities based on timing alone is difficult (Gallego-Sala et al., 2016). Process-based modelling of this landscape transformation could prove to be a useful technique, complementary to the field data, to provide insight into the underlying processes and mechanisms.
In recent decades, several peatland models have been developed, varying in spatial and temporal scale and in model complexity (Frolking et al., 2010). A good overview of the models developed for simulating long-term peatland behaviour is given by Baird et al. (2012). Currently, several long-term peatland models such as DigiBog and the Holocene Peatland Model (HPM) allow for simulations of peatland processes and the feedbacks between ecology, hydrology and peat properties over Holocene timescales (Baird et al., 2012; Frolking et al., 2010). These models have been applied successfully within the context of peat bogs, but they are difficult to transfer to blanket peatlands for two reasons. Firstly, these models are developed as cohort models, where each year a new peat layer is added to the soil profile and included in the calculations for the remaining part of the simulations. As a result, these allow for the simulation of temporal changes in peat properties such as hydraulic conductivity within the peat profile, but as the simulated time period increases, these models become computationally expensive, especially when a spatial dimension is added. Secondly, these models have been developed for peat bogs, which have a different peatland architecture compared to blanket peatlands, and they are therefore not always adapted to simulating peatland processes along complex hillslope topographies. These issues have been partially resolved by the MILLENNIA model, which has been designed specifically for blanket peatlands (Heinemeyer et al., 2010). This model is also a cohort model but incorporates additional processes which are specific to blanket peat such as runoff-driven peat erosion. However, the high degree of detail in the model domain and the representation of the processes make it difficult to apply cohort models at the landscape scale.
In this study, a process-based peatland model is presented which is able to simulate the hillslope hydrology and peatland dynamics along topographically complex hillslopes on Holocene timescales. Additionally, the representation of the model domain is relatively simple using a diplotelmic peat profile, making it computationally feasible to study peatland development on a landscape scale by simulating a large number of hillslope cross sections. The model is applied to the Upper Dee area in the Cairngorms National Park in eastern Scotland. The goal of this study is twofold: firstly, to apply a relatively simple process-based peatland model to study the long-term blanket peatland development in the Scottish Highlands on a landscape scale and secondly, to identify the relative importance of climatic and land cover changes for long-term blanket peatland development.
2.1 Study area
The study area consists of the headwaters of the river Dee in eastern Scotland, with an elevation ranging from 322 to 1309 m a.s.l. The area lies in the centre of the Cairngorms National Park and is managed by the Mar Lodge, Invercauld and Mar estates (Fig. 1). The geology of the Dee catchment is characterized by metamorphic and igneous rocks, with schists and granulites in the southern part of the study area and granite batholith intrusions in the north (Maizels, 1985). The entire area was glaciated by the Scottish ice sheet during the last ice age, which retreated between approximately 16 kyr and 13.6 kyr BP. In contrast to the western Highlands, the Cairngorms massif was not subjected to widespread glacial expansion during the Younger Dryas (Loch Lomond Stadial). During this period, the glacial activity remained largely restricted to the cirques (Everest and Kubik, 2006). The development of the current landscape and soils in the Upper Dee area has been influenced by the deglaciation, forming a wide variety of glacial and fluvioglacial landforms (Ballantyne, 2008). In many parts of the study area, the bedrock is covered by glacial till of varying thicknesses (Maizels, 1985). The summits and ridges mostly carry skeletal soils and bedrock outcrops, while the slopes are covered by blanket peat and alpine podzols (Smith, 1985). The peat deposits are found both lying directly on bedrock and overlying a layer of mineral sediment. This mineral substrate consists of gravel-rich silt loam and sandy loam in the southern part of the study area and sandy loam to loamy sand in the northern part.
Currently, the area is dominated by semi-natural land cover, including alpine and montane heath vegetation on the highest summits, heather moorland, and small pockets of natural forest (Tetzlaff and Soulsby, 2008). The total annual precipitation ranges from 800 mm in the eastern part of the study area to almost 2000 mm on the mountain tops, with a significant proportion of the precipitation falling as snow during the winter months (Dunn et al., 2001). The temperature regimes can vary considerably within the study area. The town of Braemar (339 m a.s.l.) has a mean annual temperature of 6.8 ∘C, ranging from 1.6 ∘C as a mean winter temperature (December–January–February; DJF) to 12.8 ∘C as a mean summer temperature (June–July–August; JJA). In contrast, the summit of Cairn Gorm (1245 m a.s.l.) has a mean annual temperature of 0.6 ∘C and ranges from a mean winter temperature (DJF) of −2.6 ∘C to a mean summer temperature (JJA) of 5.3 ∘C.
Early Holocene traces of human presence have been found within the study area, with archaeological evidence indicating the presence of Mesolithic hunter–gatherer structures as early as 8.2 cal kyr BP in the western part of the study area (Warren et al., 2018). The first traces of permanent settlement in the Upper Dee are from the village of Braemar around 1000 CE (Paterson, 2011). In contrast to the western part of Scotland, the study area shows no traces of large scale peat extraction, which is probably due to the relatively thin peat profiles and difficult access to the area (Maurer, 2015).
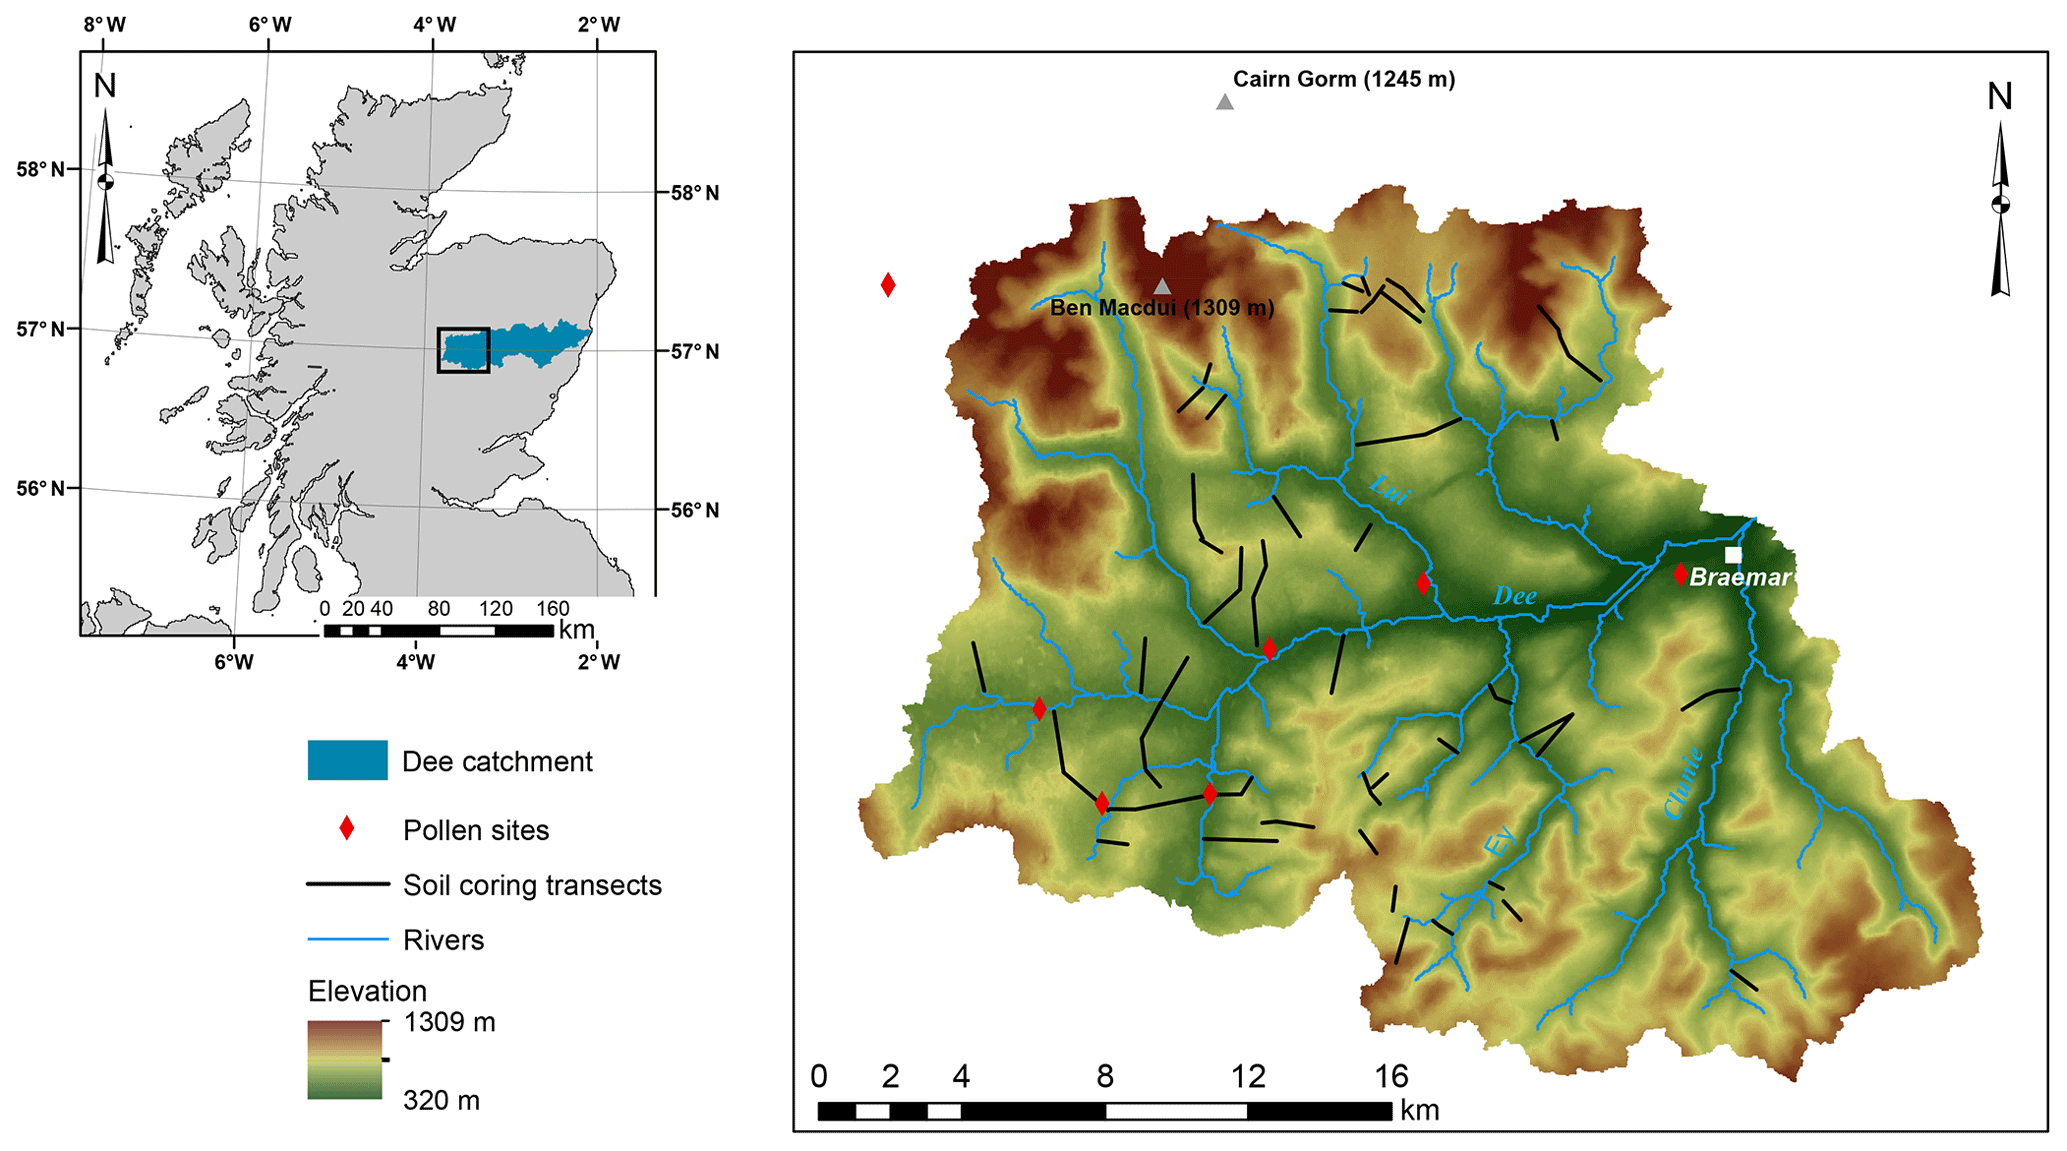
Figure 1Location of the Upper Dee area, with an indication of the hillslope transects and the pollen sites used for the land cover reconstruction.
2.2 Field data
For the study area, the blanket peatland architecture was assessed along 56 hillslope transects across the study area during field campaigns in 2015 and 2017 using soil corings, laboratory analysis of peat samples and pollen cores (Fig. 1). The soil corings were taken along the hillslope transects with a spacing of approximately 50 m using a gauge auger. The hillslope topography was measured using post-processing real-time kinematic (RTK) GPS measurements. The transect locations were selected in order to include a wide variety of lithologies, elevation zones and topographic parameters such as aspect, slope and curvature. Additionally, the carbon content, dry bulk density and water content of the peat deposits were derived from 35 field samples, collected as core sections with a length of 5 cm. These samples were collected at random coring locations and at depths ranging from 5 to 165 cm below the surface. The regional vegetation evolution over the past 12 000 years was reconstructed based on seven pollen cores located within the study area (Fig. 1). These cores provide vegetation information from different elevation zones with varying distances to the low-lying valleys of the Dee and the Spey (Birks, 1969; Hunter, 2016; Huntley, 1994; Paterson, 2011). Using the REVEALS (Regional Estimates of Vegetation Abundance from Large Sites) model (Sugita, 2007), the pollen percentages were converted to regional vegetation fractions. REVEALS was developed to reconstruct regional vegetation composition using pollen data from large lakes, but previous studies has shown that a group of sites can also be used to estimate regional vegetation cover (Fyfe et al., 2013; Mazier et al., 2012; Trondman et al., 2016). Pollen type parameters (pollen productivity and fall speed) were based on the standardized set of Mazier et al. (2012). The regional vegetation fractions were grouped in five classes (coniferous trees, deciduous trees, shrubs, heather, grasses and herbs) and used as land cover input in the hillslope model. As the land cover reconstruction for Scotland based on REVEALS by Fyfe et al. does not include pollen data from high-elevation sites, a new land cover reconstruction was made by Hunter for this study using local pollen data (Fyfe et al., 2013; Hunter, 2016).
At all coring locations, the soil profiles were described based on visual inspection, analysing the colour, texture and possible presence of macroscopic remains (charcoal, wood, etc.). Based on the coring descriptions, the peat thickness could be derived. In this study, peat is defined as a dark organic-rich layer of at least 10 cm thick without or with a minimal presence of mineral material based on visual inspection. Organic-rich horizons with a clear presence of mineral material were not classified as peat.
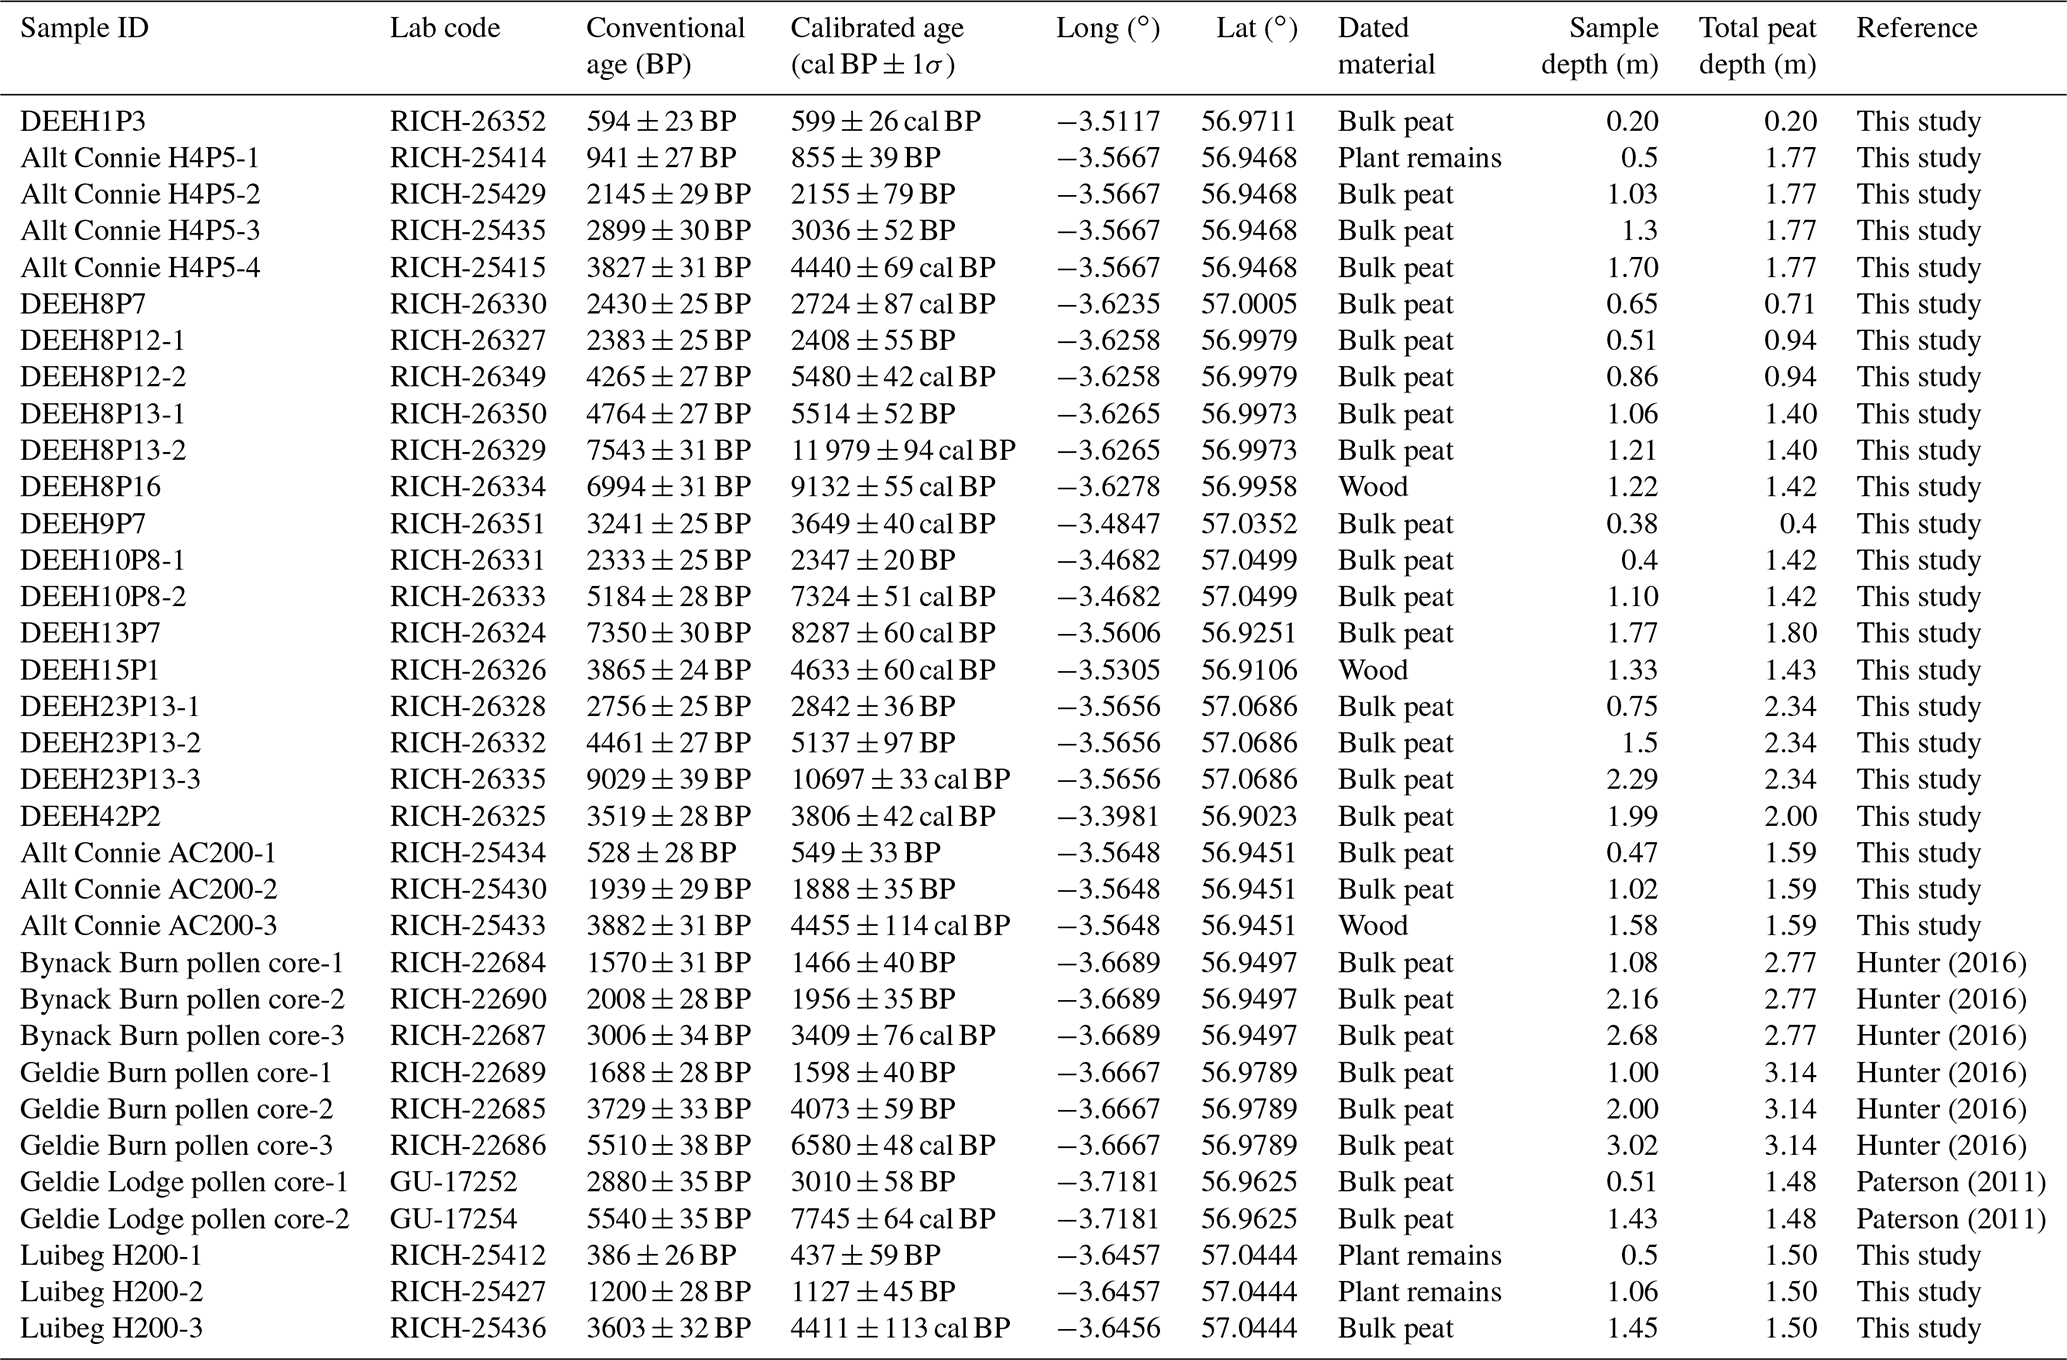
In total, 34 peat samples were radiocarbon dated at 17 locations throughout the study area, encompassing a range of topographic situations and peat thicknesses (see Appendix A2 for dating details). All radiocarbon dates were performed by the Belgian Royal Institute for Cultural Heritage and calibrated using the software OxCal 4.3 and the IntCal13 calibration curve (Bronk Ramsey, 2009; Reimer et al., 2013).
2.3 Model outline
The model presented here is based on the concept of impeded drainage, where environmental conditions such as bedrock topography can cause waterlogging and peat formation (Alexandrov et al., 2016; Clymo, 1984; Ingram, 1982). The basic structure of the hillslope peatland model consists of a hydrology module simulating the water table behaviour along the hillslope, which is coupled to a peat growth module simulating biomass production and decomposition (Fig. 2). The model domain consists of a two-dimensional hillslope cross section, which is discretized in a series of model grid points. The stratigraphy consists of impermeable bedrock, overlain by a layer of glacial till, which is assumed to be porous. Over time, a peat profile can develop on top of this till substrate when the right environmental conditions are met. The hillslope topography is based on the detailed GPS measurements for each coring location.
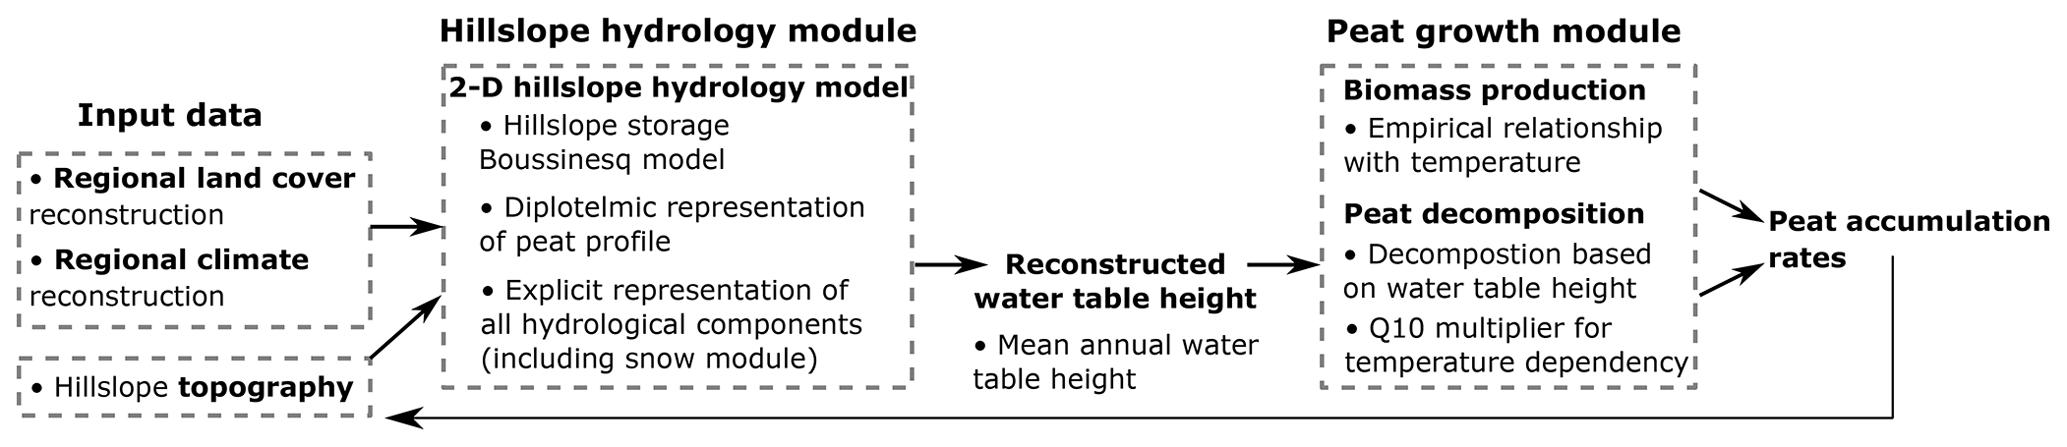
Figure 2General model workflow. For a more detailed description of the model structure, the reader is referred to the text.
2.3.1 Hillslope hydrology module
The water table dynamics are modelled using a variant of the Boussinesq equation for a non-constant slope (Hilberts et al., 2004):
with , x as the distance to the hillslope bottom (m), ε as the soil porosity (m m−1), S as the actual water storage (m), k as the hydraulic conductivity (m s−1), i as the bedrock slope (m m−1), and N as the rainfall recharge or infiltration (m) (Hilberts et al., 2004). The Boussinesq equation is a simplified form of the full Richards equation for unsaturated soils by excluding a representation of the unsaturated zone. This simplification can be justified for peat soils given the often shallow position of the water table in peatlands (Ballard et al., 2011; Paniconi et al., 2003). As a result, the Boussinesq equation assumes an instantaneous exchange of water (e.g. infiltration and evapotranspiration) between the surface and the saturated zone of the soil profile. This simplified representation leads to a significant reduction of the computational time (Ballard et al., 2011). To enable the use of the Boussinesq equation for the simulation of the hillslope hydrology, local topographic depressions are filtered out. In this study, the Boussinesq equation is discretized using a forward-time central-space finite-difference scheme for the diffusion component and a 1st-order upwind finite-difference scheme for the advection component (Campforts and Govers, 2015).
The diplotelmic nature of the model is represented by the depth-integrated saturated hydraulic conductivity. Each stratigraphic unit (mineral substrate, catotelm and acrotelm) has a specific saturated hydraulic conductivity value. The bedrock is excluded from the water table depth calculations as it is assumed to be impermeable.
A simple snow module is included in the hydrological model, with precipitation falling as snow during periods with sub-zero temperatures. The amount of melt is based on a degree day factor model. Snow sublimation is not explicitly represented in the model. For each time step, infiltration and saturation excess overland flow is calculated. The produced runoff is assumed to leave the hillslope before the next time step. For open peatland vegetation types, all rainfall is assumed to be able to infiltrate for intensities below 2 mm h−1. For higher intensities, the infiltration rate increases with higher precipitation rates.
with “ir” as the infiltration rate (mm h−1) and p as the precipitation rate (mm h−1) (Holden and Burt, 2002). For woodland peatlands, infiltration rates of up to 30 mm h−1 are reported (Cairns et al., 1978). In the model, this maximal infiltration rate of 30 mm h−1 is used for a fully forested peatland. The final infiltration rate at a certain location is determined based on linear interpolation between the infiltration rates of open and forested peatland based on the percentage of woodland cover at each model grid point.
The potential plant transpiration and soil evaporation (mm d−1) are calculated separately based on the leaf area index (LAI), which enables differentiation based on the vegetation cover (Eq. 3) (Williams et al., 1983).
with Esoil as the soil evaporation rate (mm d−1), Eplant as the plant transpiration rate (mm d−1) and Epot as the potential evapotranspiration rate (mm d−1), which is calculated using the Thornthwaite equation based on the mean monthly temperature.
The actual evapotranspiration rate (AET) (mm d−1) is calculated as a function of the water table depth (Eq. 4). If a grid point consists of glacial till without a peat cover, the AET is at the potential rate when the water table is at the surface (z1=0) and decreases linearly until depth z2. If peat is present, the actual evapotranspiration is assumed to be at the potential rate if the water table is located in the upper horizon (z1 is the acrotelm thickness) and decreases linearly until depth z2 (m) (Frolking et al., 2010; Lafleur et al., 2005). In this study, z2 is set to 1 m for both the glacial till and peat soils. In contrast to more detailed peatland models such as the MILLENNIA model, the relationship of the AET to the water table depth is not influenced by changes in vegetation groups and their root properties, resulting in constant values for z1 and z2 throughout the simulations (Carroll et al., 2015).
Since detailed local climate reconstructions are scarce, several peatland modelling studies have used continental or at best regional climate reconstructions (mostly pollen-based) which were fine-tuned using local climate information (Frolking et al., 2010; Heinemeyer et al., 2010; Morris et al., 2015). Here, a similar approach is used. Input data for temperature and precipitation values are based on a European gridded dataset of mean annual temperature and mean monthly precipitation anomalies for the last 12 000 years derived from pollen data with a spatial resolution of and a temporal resolution of 500 years (Fig. 3) (Mauri et al., 2015). As total annual precipitation amounts and mean annual temperatures vary considerably throughout the study area, the precipitation and temperature data were corrected for orographic effects. Data from eight meteorological stations in the vicinity of the study area were used to construct linear regression models, correcting the mean daily precipitation amount and mean annual temperature for each location based on the elevation (Eqs. 5–6) (see Appendix A1 for the weather station details).
and
with P as the mean daily precipitation amount (mm), E as the elevation (m a.s.l.) and MAT as the mean annual temperature (∘C). Additional local climate information was added to the climate reconstruction data by incorporating random variability to the reconstructed temperature and precipitation data, based on the variability as observed in the weather station of Braemar for the period 1853–2010. The relatively low spatial and temporal resolution of the continental-scale climate reconstruction will probably lead to the underrepresentation of short-lived events and local climate variability. However, by incorporating the orographic corrections and random variability, local climate information is used to fine-tune the records and increase both the spatial and temporal variability. The time series used as model inputs are based on daily temperature and hourly precipitation data from the weather station of Braemar, which are rescaled using both the regression equations for elevation effects and the long-term anomalies for temperature and precipitation (Fig. 3). As a result, precipitation and temperature series with a high temporal resolution are used throughout the entire studied period. The model is run with a spatial resolution of 50 m, similar to the average coring distance. The time resolution is set to 400 s for the hillslope hydrology module and 1 year for the peat growth module to ensure model stability.
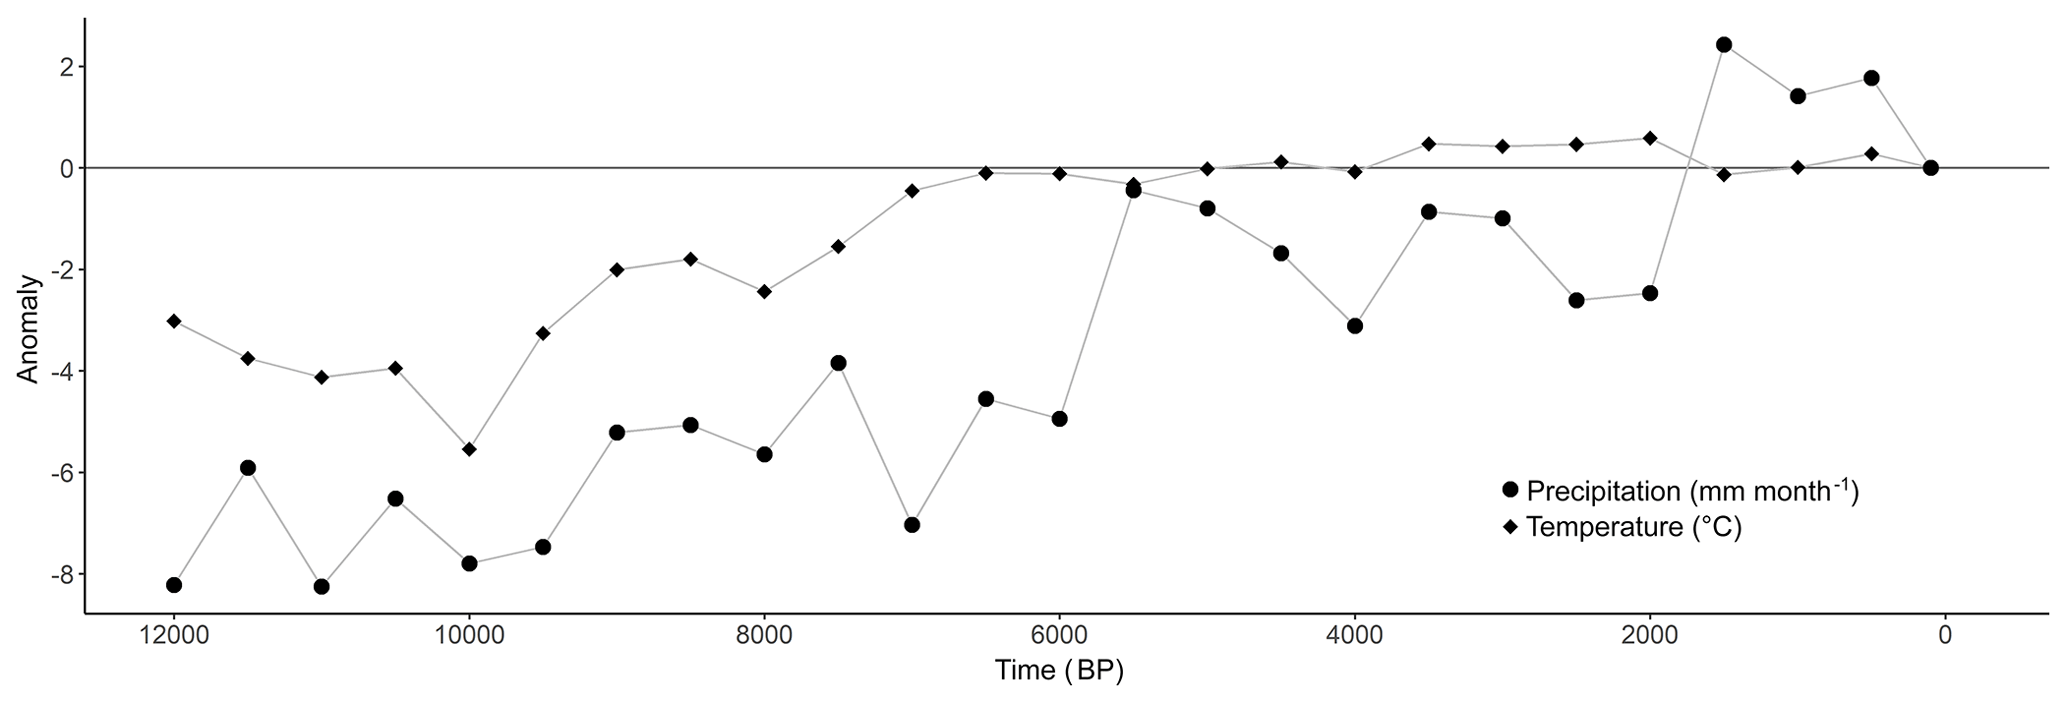
Figure 3Reconstructed mean annual temperature (∘C) and mean monthly precipitation (mm month−1) anomalies for the period 12 kyr–100 BP with a 500-year interval for the location of Braemar. Values extracted from a gridded European dataset with a spatial resolution of (Mauri et al., 2015).
2.3.2 Peat growth module
The peat accumulation at each grid point is calculated as the balance between biomass production and decomposition. In the literature, several relatively simple equations can be found to calculate the net primary production (NPP) based on climatic data (mean annual temperature, total annual rainfall or potential evapotranspiration) such as the Miami model or the Thornthwaite memorial model of which some have been implemented in peatland models (Heinemeyer et al., 2010; Lieth, 1973; Lieth and Box, 1972). In some cases, such as the Miami model, the NPP is calculated based on multiple climatic variables (rainfall and temperature), using the minimum value of both equations as the final NPP value. However, given the climatic conditions of the Scottish Highlands, precipitation is not a limiting factor for biomass production. As a consequence, the biomass production is simulated as a function of the mean annual temperature using a power function regression equation based on field data for the Moor House–Upper Teesdale National Nature Reserve in northern England (Garnett, 1998), corrected for the woodland cover. A possible disadvantage of this simple approach is the dependence of the biomass production calculations on the quality of the climate and land cover reconstructions.
with NPP as the net primary production (g m−2 a−1), MAT as the mean annual temperature at the grid point location (∘C), wct as the woodland fraction, wcmax as the woodland percentage of a fully forested peatland, and wi as the percentage increase in NPP between an open and wooded peatland. In general, the NPP is higher for wooded peatland compared to open peatland vegetation, with reported values of a 12 % increase for bogs and 17 % for fens (Beilman and Yu, 2001; Szumigalski and Bayley, 1997). In this study, wi is set to 15 % and wcmax to 40 %.
The peat column at each grid point is divided in an oxic and anoxic zone based on the calculated mean annual water table height. The total decomposition can thus be written as
with D as the total decomposition (m a−1), k1 and k2 as the rates of decomposition under anoxic and oxic conditions (yr−1), h as the thickness of the soil profile above the bedrock (m), and wt as the height of the water table above the bedrock (m) (Hilbert et al., 2000). The decomposition rates are dependent on the mean annual air temperature using a Q10 temperature multiplier, which is the ratio by which the biomass respiration rate increases under a 10 ∘C temperature increase. The range in Q10 values mentioned in the literature is large, but Chapman and Thurlow demonstrated that Q10 values are generally higher for temperatures between 0 and 5 ∘C (Chapman and Thurlow, 1998). This effect can be attributed to the fact that as temperatures rise above the freezing point, more microbial groups will become active, leading to relatively large changes in respiration rates for small changes in temperature. As a result, two Q10 values are used in this study. A Q10 value of 2.2 is used for temperatures above 5 ∘C, and 3.7 is used for temperatures between −4 and 5 ∘C. Below −4 ∘C, the decomposition is assumed to cease completely (Chapman and Thurlow, 1998; Rosswall, 1973 as cited by Clymo, 1984; Wieder and Yavitt, 1994; Wu, 2012). The biological module runs on an annual timescale. Based on the calculated peat accumulation rate, the hillslope topography is updated annually.
2.3.3 Peatland initiation
Simulations start with a hillslope consisting of an impermeable bedrock covered by glacial till. As the thickness of the till is not known at each location, it is assumed to have a constant thickness of 50 cm. Over time, the organic matter accumulates within the upper 30 cm of the mineral soil forming an organic-rich horizon based on the balance between biomass production and decomposition. When a threshold is exceeded, additional organic matter which is produced starts to accumulate as peat at that location, with the properties of an acrotelm. In this study, the threshold is set at an amount of organic matter equivalent to a peat layer with a thickness of 10 cm using the median dry bulk density and organic-carbon percentage of the 35 peat samples collected in the field. This ensures that a similar definition for peat is used both for the hillslope corings as for the model simulations. Once the peat thickness exceeds the thickness of the acrotelm layer, the peat layer becomes diplotelmic, with the peat below the acrotelm having the properties of the catotelm. Once the biomass within the simulated peat profile decreases below the biomass threshold, the grid point is no longer considered to be covered by a peat layer and only mineral soil properties are taken into account.
2.3.4 Boundary conditions
The impermeable bedrock below the glacial till is used as a zero-flux boundary condition at the bottom of the model domain. At several locations throughout the study area, rivers have eroded the stream bank, exposing the peat. At the lower end of the hillslope, the water storage is thus set to a fixed value, representing the depth of the river. For the grid point at the top of the hillslope transect, a lateral zero-flux boundary is assumed.
2.4 Model calibration and validation
Model calibration is based on the measured mean peat thickness per topographic class. In total, nine topographic classes were defined by dividing both the measured slope and curvature at each coring location into three classes, resulting in nine possible combinations. The calibration procedure resulted in topographic class limits of 0.098 and 0.135 m m−1 for the slope and m−1 and m−1 for the curvature. For all 56 hillslope transects, the modelled mean peat thickness per topographic class after 12 000 years of simulation is compared to the mean peat thickness measured in the field. In total, three model parameters were calibrated: the decomposition rates under oxic and anoxic conditions and the acrotelm thickness. The goodness of fit of each parameter combination was evaluated based on the minimization of the root mean square error (RMSE) between the mean modelled and measured peat thickness per topographic class. Out of the 866 hillslope corings, 433 were selected randomly to be used as calibration points and the others as validation points. Since the spacing between the soil corings is slightly variable, the model results were resampled to the locations of the soil corings using linear interpolation.
As an additional validation of the model behaviour, the simulated peat growth initiation dates for all model grid points can be evaluated against a dataset of basal radiocarbon dates for blanket peat deposits in the upland regions of Scotland with an elevation above 300 m a.s.l. (n=30) (Gallego-Sala et al., 2016). The dataset was expanded by incorporating 17 additional basal radiocarbon dates on peat deposits from within the study area (see Appendix A2 for dating details). For each of the 17 locations within the study area for which radiocarbon dates were available, the basal age was estimated using the clam (Classical Age–Depth Modelling of Cores from Deposits) 2.2 software package to construct age–depth models and extrapolate to the bottom of the peat layer (Blaauw, 2010). As the available initiation dates based on radiocarbon dating were not necessarily taken at the modelled transect locations, the comparison between modelled and observed peat growth initiation is based on the probability density curves using a bin width of 500 years. Depending on the amount of available radiocarbon dates at each location, some estimates of the peat growth initiation date were based on the extrapolation of the age–depth model over large sections of the peat profile. To analyse the effect of the age–depth model extrapolation on the resultant probability density curve, an additional probability density curve was constructed containing only those radiocarbon dated samples which were directly measured at the bottom of a peat layer (n=20).
3.1 Field measurements
In total, soil coring descriptions were made at 866 locations throughout the study area (detailed descriptions and location data can be found in the data availability section, Swinnen, 2019a, b). Based on the definition of peat used in this study, 57 % of the coring locations contained a surface peat layer, with a mean measured peat thickness over all coring locations of 36 cm and a maximal value of 3 m. The mean measured peat thickness per hillslope transect varies between 0 and 96 cm (Fig. 4). Overall, the transects with a high mean peat thickness can be found in the upstream parts of tributaries of the river Dee. Strong spatial variability occurs, even at small distances, making the peat cover throughout the area highly variable in both occurrence and mean thickness. The mean measured peat thickness per topographic class ranges from 23.6±31.9 cm for the class with a moderate slope and a convex curvature to 54.1±65.3 cm for the topographic class with a low slope and a straight curvature. Based on 35 randomly selected soil samples, which were identified in the field as peat, the median organic-carbon percentage was calculated to be 51.9±7.3 % and the dry bulk density was calculated to be 0.128±0.063 g cm−3.
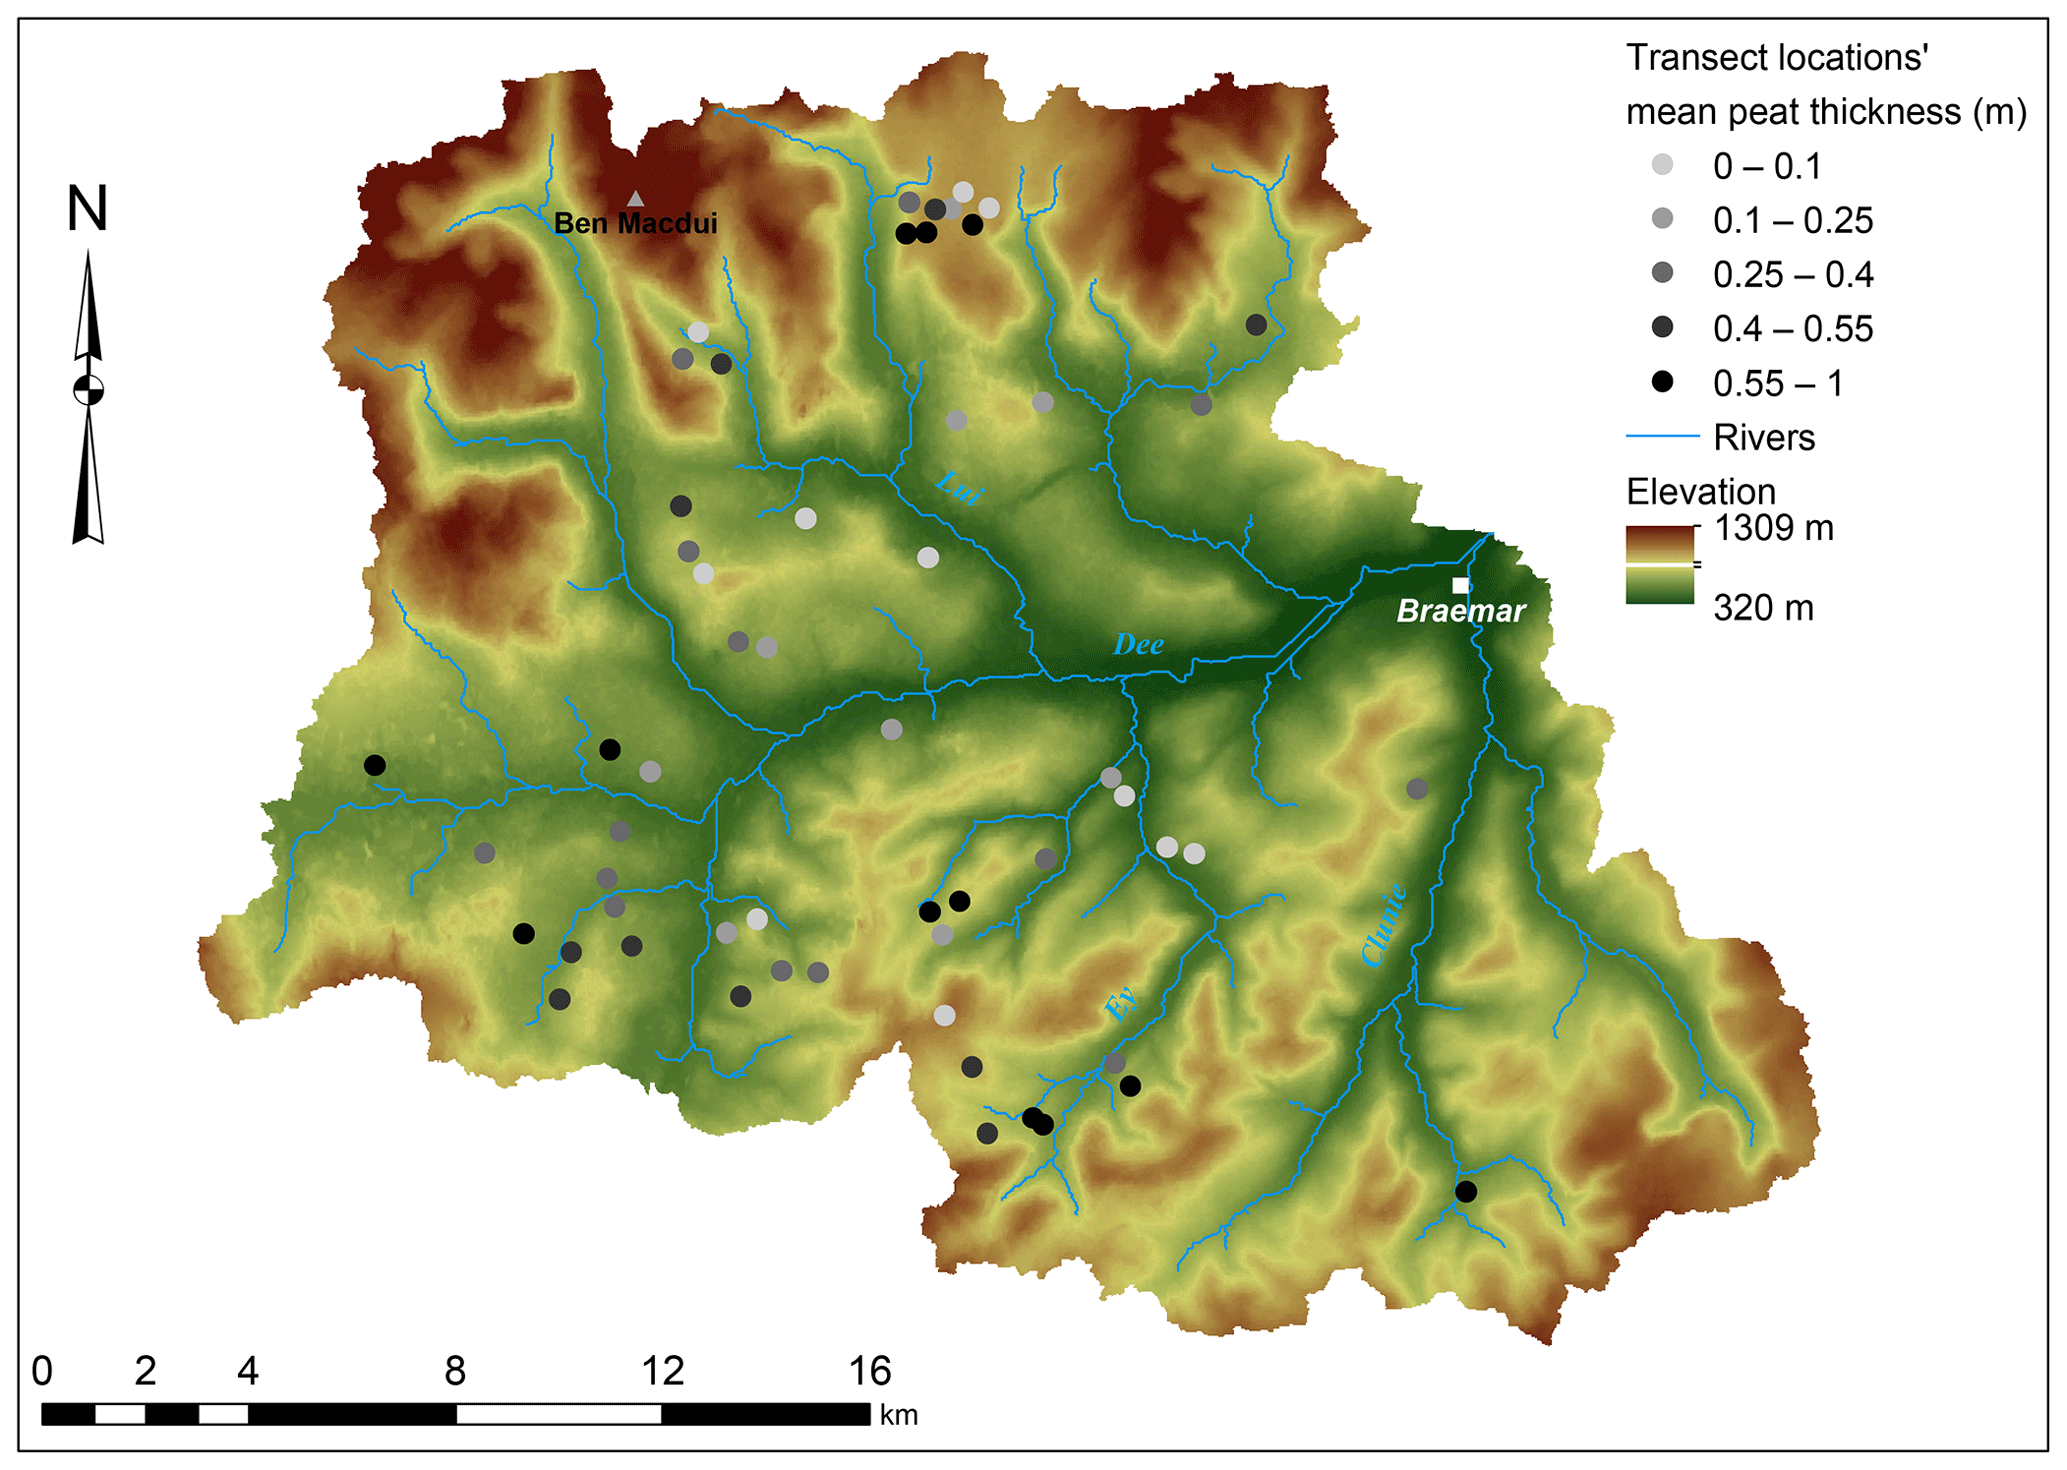
Figure 4Mean measured peat thickness at the hillslope transects (n=56).
As the model is based on the principle of impeded drainage, there is an assumed relationship between the bedrock slope and the peat thickness at a certain location. The peat thickness data indicate that this relationship is present, showing a clear decrease in the maximum thickness with an increasing bedrock slope. However, the variability, especially at lower slope angles, indicates that shallow peat layers or even the absence of peat is observed for every slope value (Fig. 5a). In the Boussinesq equation, the bedrock slope is used instead of the surface slope. One could argue that the bedrock slope might not relate directly to the surface slope in, for example, local depressions filled with peat. However, the comparison of the bedrock slope and surface slope for all coring locations indicate a clear and strong relationship between both, with the observed range in slope values strongly exceeding the differences between the bedrock and surface slope at a single location (Fig. 5b). As a result, the use of the bedrock slope is thus unlikely to introduce a bias in the modelled peat thickness values.
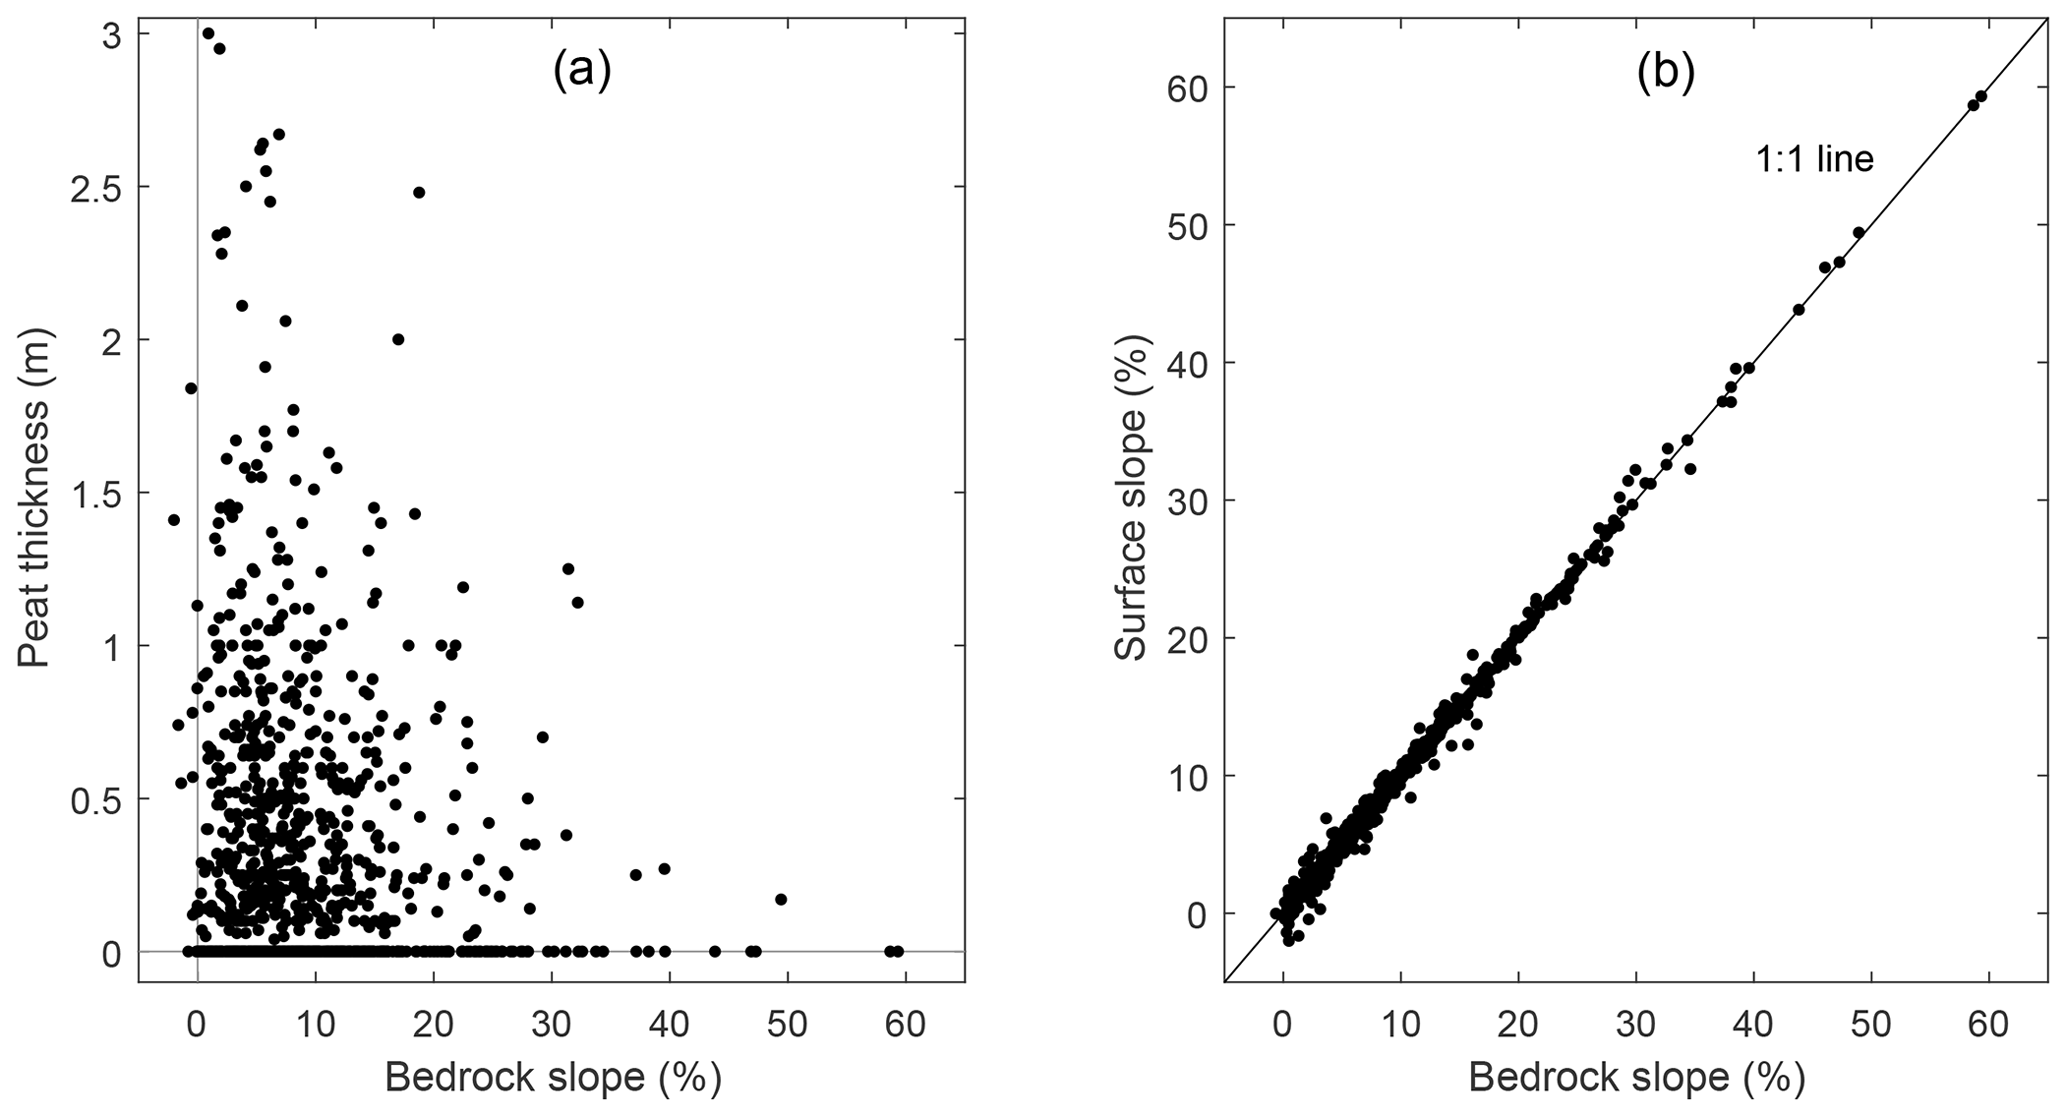
Figure 5(a) Scatterplot of the measured peat thickness (m) as a function of the bedrock slope (%) and (b) scatterplot of the surface slope (%) as a function of the bedrock slope (%) for all coring locations (n=866). The slope calculations are based on the measured coordinates of the coring locations.
The pollen-based reconstructed land cover shows an Early Holocene woodland increase until the period 8.4–7.2 cal kyr BP (Fig. 6). This period is followed by a general woodland decline, with the woodland cover dropping below 5 % from 3.6 cal kyr BP onwards. The reconstructions for the individual pollen cores show an important east–west gradient in terms of maximal forest cover, with higher woodland percentages for the eastern and lower-lying part of the study area (Paterson, 2011). The woodland is a mixed type containing both coniferous species (Scots pine) and deciduous species (birch, rowan and aspen). A study by Fyfe et al. reconstructed the Holocene vegetation over Scotland using the REVEALS model for seven sites across the Scottish mainland, resulting in a maximal forest extent by 6.7 cal kyr BP (Fyfe et al., 2013). The data presented here show an earlier woodland cover decline around 7.2 cal kyr BP and a larger proportion of coniferous species in the forest composition. In comparison to the sites of Fyfe et al., the woodland cover appears to be relatively low, with an open heather landscape prevailing during the period under study, which can be attributed to the relatively high elevation of the study area.
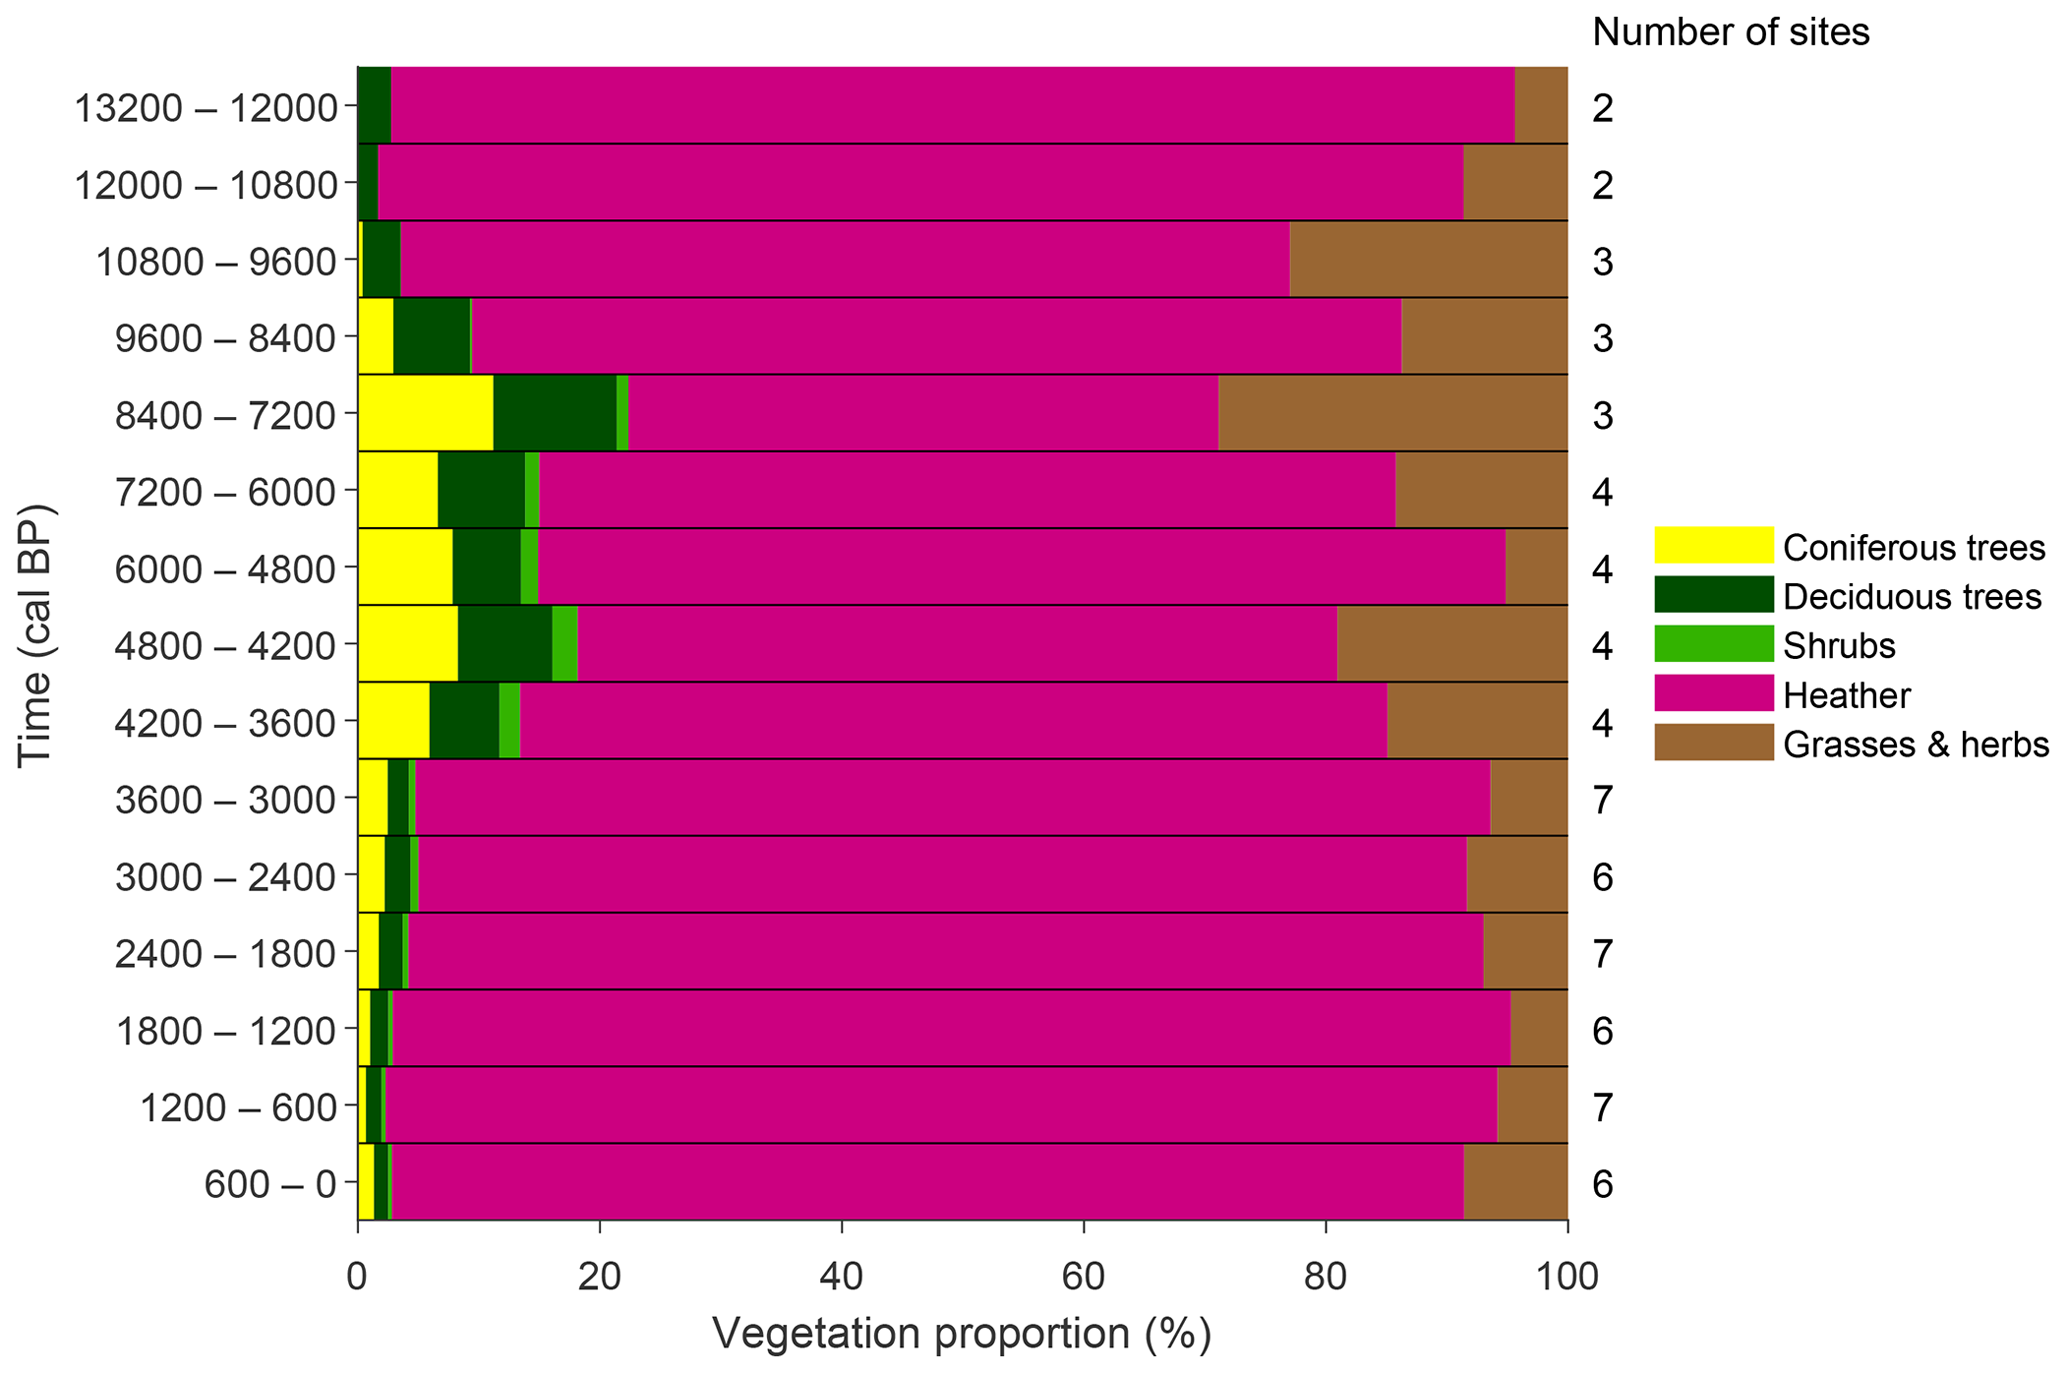
Figure 6Reconstructed vegetation proportions for the study area using the REVEALS model, based on seven pollen cores.
3.2 Model calibration
Point-by-point calibration resulted in poor correspondence between the modelled and observed peat thickness. As a consequence, the model parameters were calibrated based on the mean peat thickness per topographic class. In total, nine topographic classes were constructed by classifying all coring locations based on the slope and the hillslope curvature. The best fitting parameter combination results in an acrotelm thickness of 10 cm, an oxic decomposition rate at 10 ∘C of 2.15 % yr−1 and an anoxic decomposition rate at 10 ∘C of 0.24 % yr−1, which corresponds to an oxic/anoxic decomposition ratio of 9. These values correspond largely to those reported in the literature (Ballard et al., 2011; Clymo, 1984; Wu, 2012; Yu et al., 2001). The RMSE on the mean peat thickness for the best fitting parameter combination is 9.53 cm (Fig. 7).
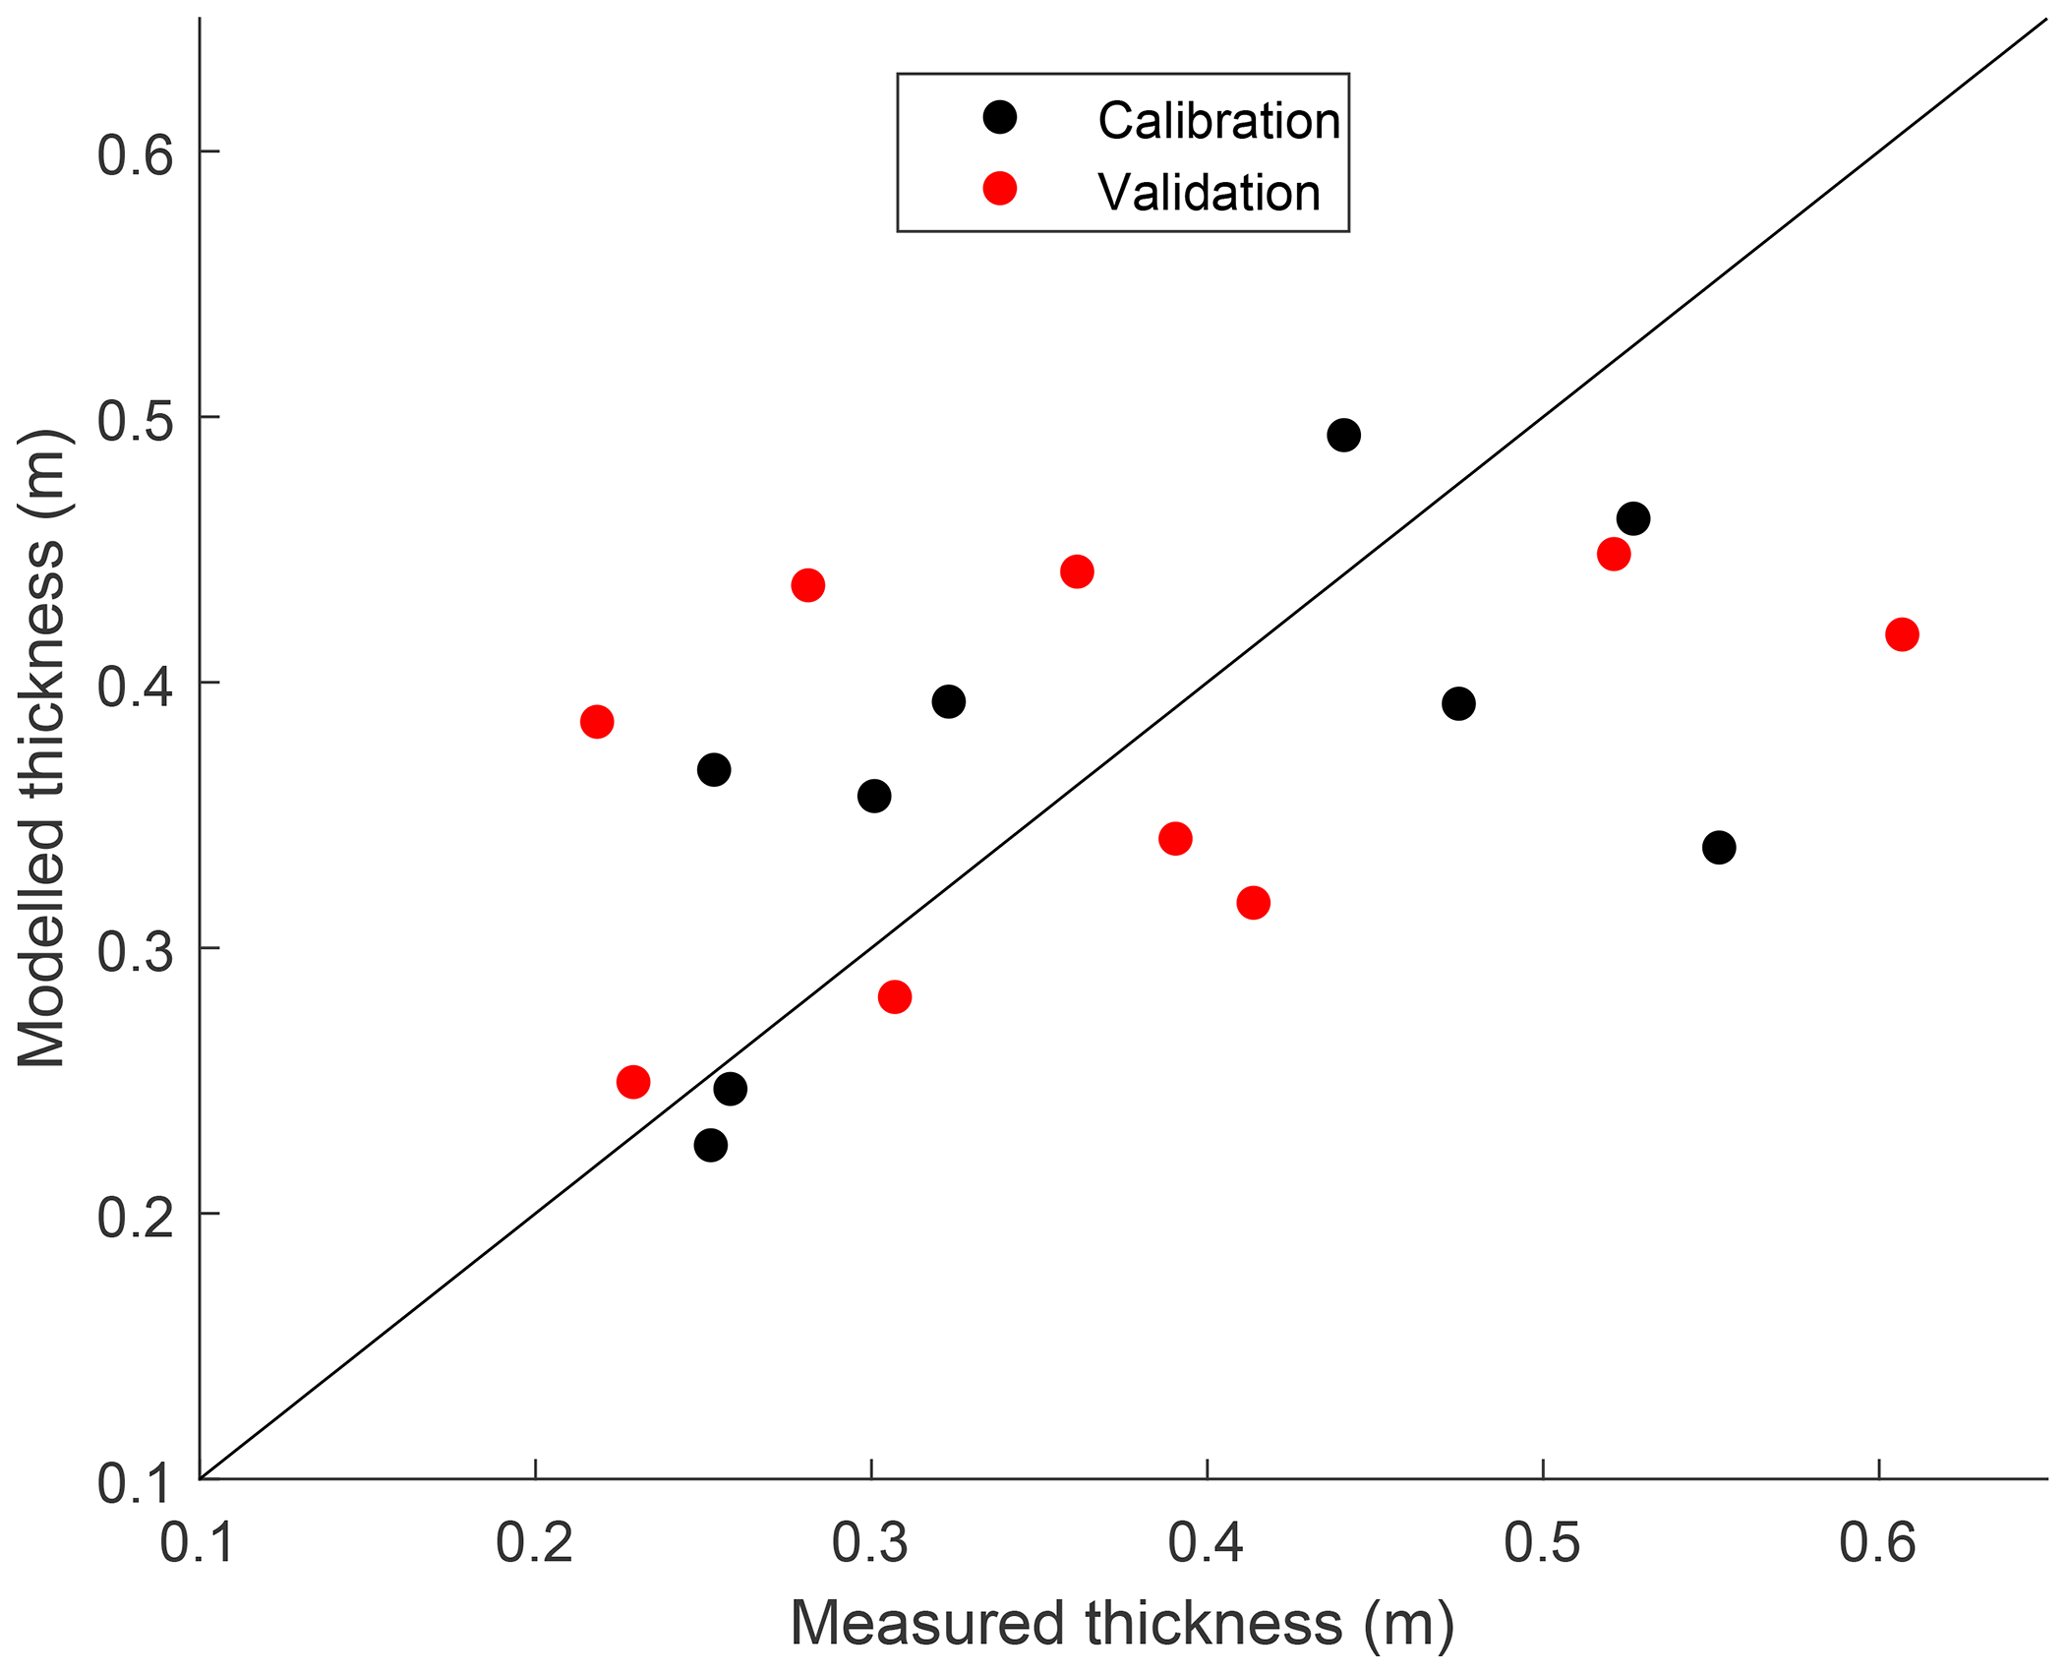
Figure 7Modelled and measured mean peat thickness per topographic class for both the calibration and validation transects.
3.3 Blanket peatland development
The calibrated model was run to simulate the long-term blanket peatland development since 12 kyr BP for the 56 hillslope transects using the calibrated parameter values. The reconstructed land cover history (Fig. 6) is used for vegetation evolution throughout the simulations. Overall, the model simulations indicate that mean peat accumulation rates were low until 9.5 kyr BP, with small variations between the different grid points (Fig. 8). Later, the accumulation rates increased and were high during two phases in the Early Holocene: 9.5–8.5 and 8–6.5 kyr BP. From 6 to 2 kyr BP, the rates were relatively stable and slightly positive on average. A long-term decrease in accumulation rates occurred between 2 and 1 kyr BP, which increased again to positive values around 0.5 kyr BP. The mean peat and carbon accumulation rate over all grid points and for the entire studied period is m yr−1 and 1.79 g C m−2 yr−1. The maximal mean peat and carbon accumulation rate over the entire studied period is m yr−1 and 11.95 g C m−2 yr−1 and occurs at 7050 BP.
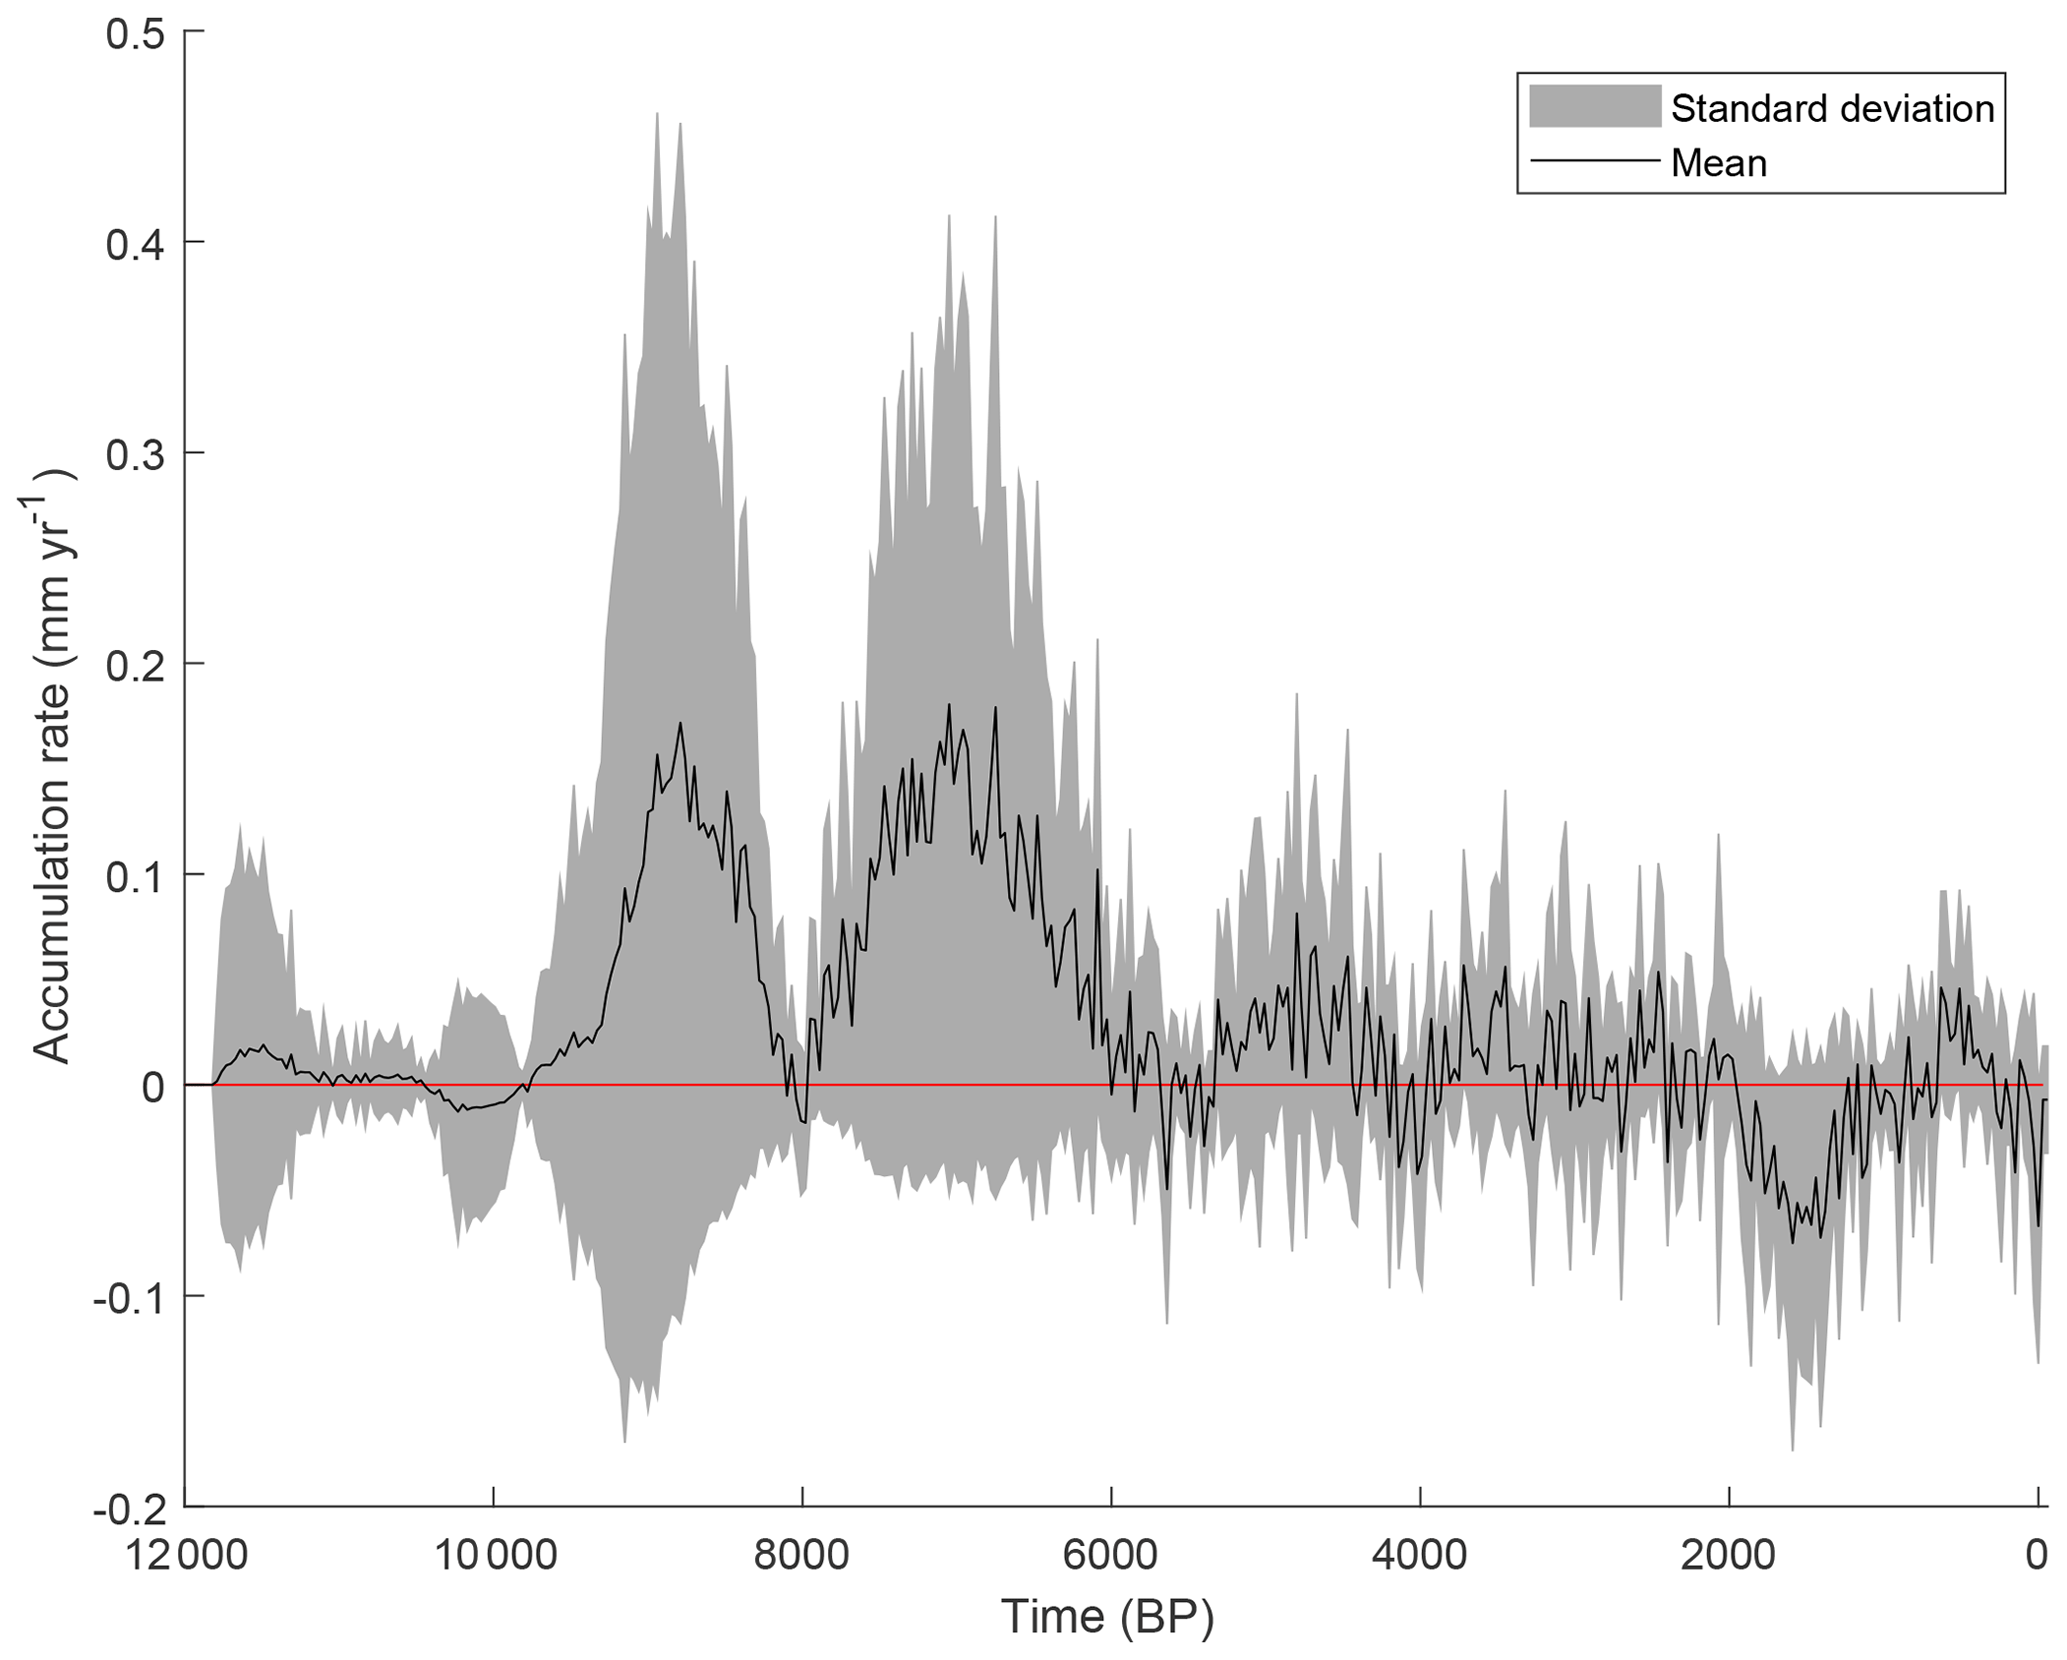
Figure 9 indicates the evolution of the mean peat thickness and corresponding organic-carbon mass over all hillslope transects. The mean peat thickness reaches a maximal value of 0.36 m around 2 kyr BP and declines slightly afterwards to the current value of 0.33 m or 22.04 kg C m−2. Overall, the peatland development occurs mostly before 6 kyr BP and shows limited variations afterwards, with a slight decline in mean peat thickness between 2 and 1 kyr BP. When only the model grid points with peat cover are considered, the maximal value for the modelled mean thickness is 0.66 m, declining to 0.61 m nowadays or 40.25 kg C m−2. In total, the model simulates a peat cover of 61 % at the coring locations, which is comparable to the coring data, which result in 57 % peat cover.
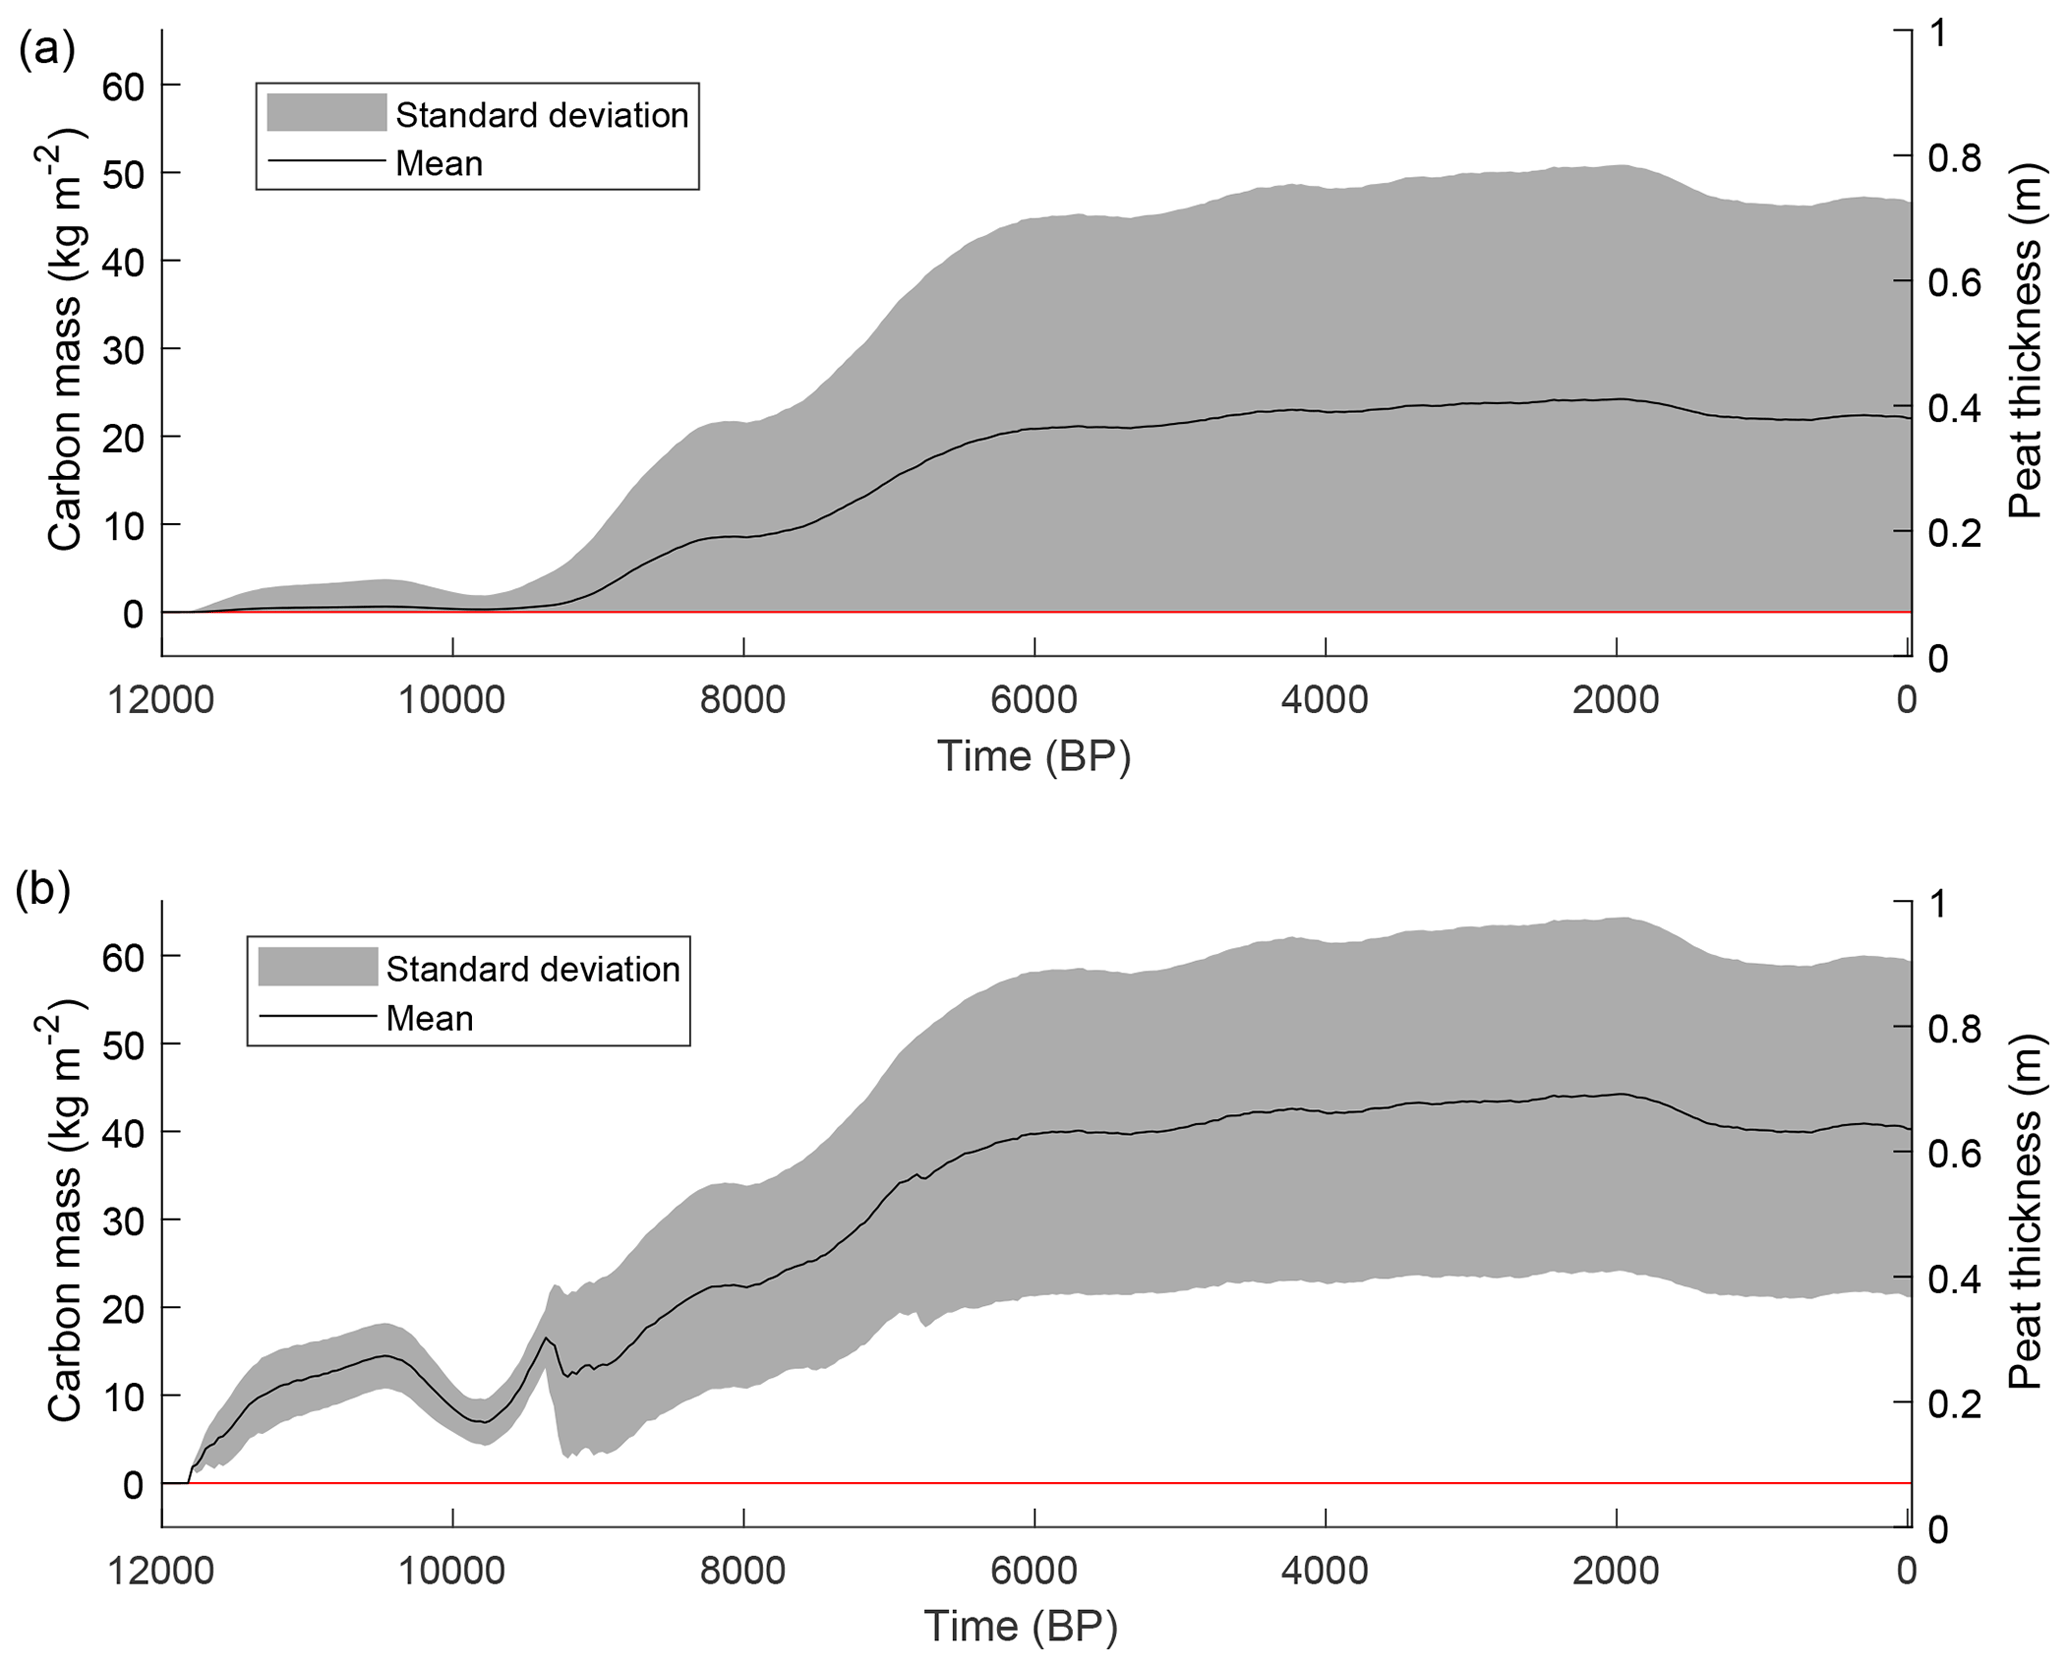
Figure 9Simulated mean peat thickness/carbon mass and standard deviation for all grid points (a) and for the grid points with a peat cover (b).
Although the model calibration is solely based on the current peat thickness, the timing of peatland development can be evaluated based on the radiocarbon dating of peat profiles. Overall, the model simulations indicate that peat growth initiated at most locations between 9.75 and 6.75 kyr BP. The basal radiocarbon dates (n=47) show a more diffuse pattern for the Scottish upland areas (Fig. 10a). When only considering those dates for which the radiocarbon sample was taken at the bottom of the peat column (n=20), excluding the sites for which the initiation date was estimated by the extrapolation of an age–depth model to the bottom of the peat core, the probability density function shifts to older initiation ages and corresponds much better with the simulated dates (Fig. 10b).
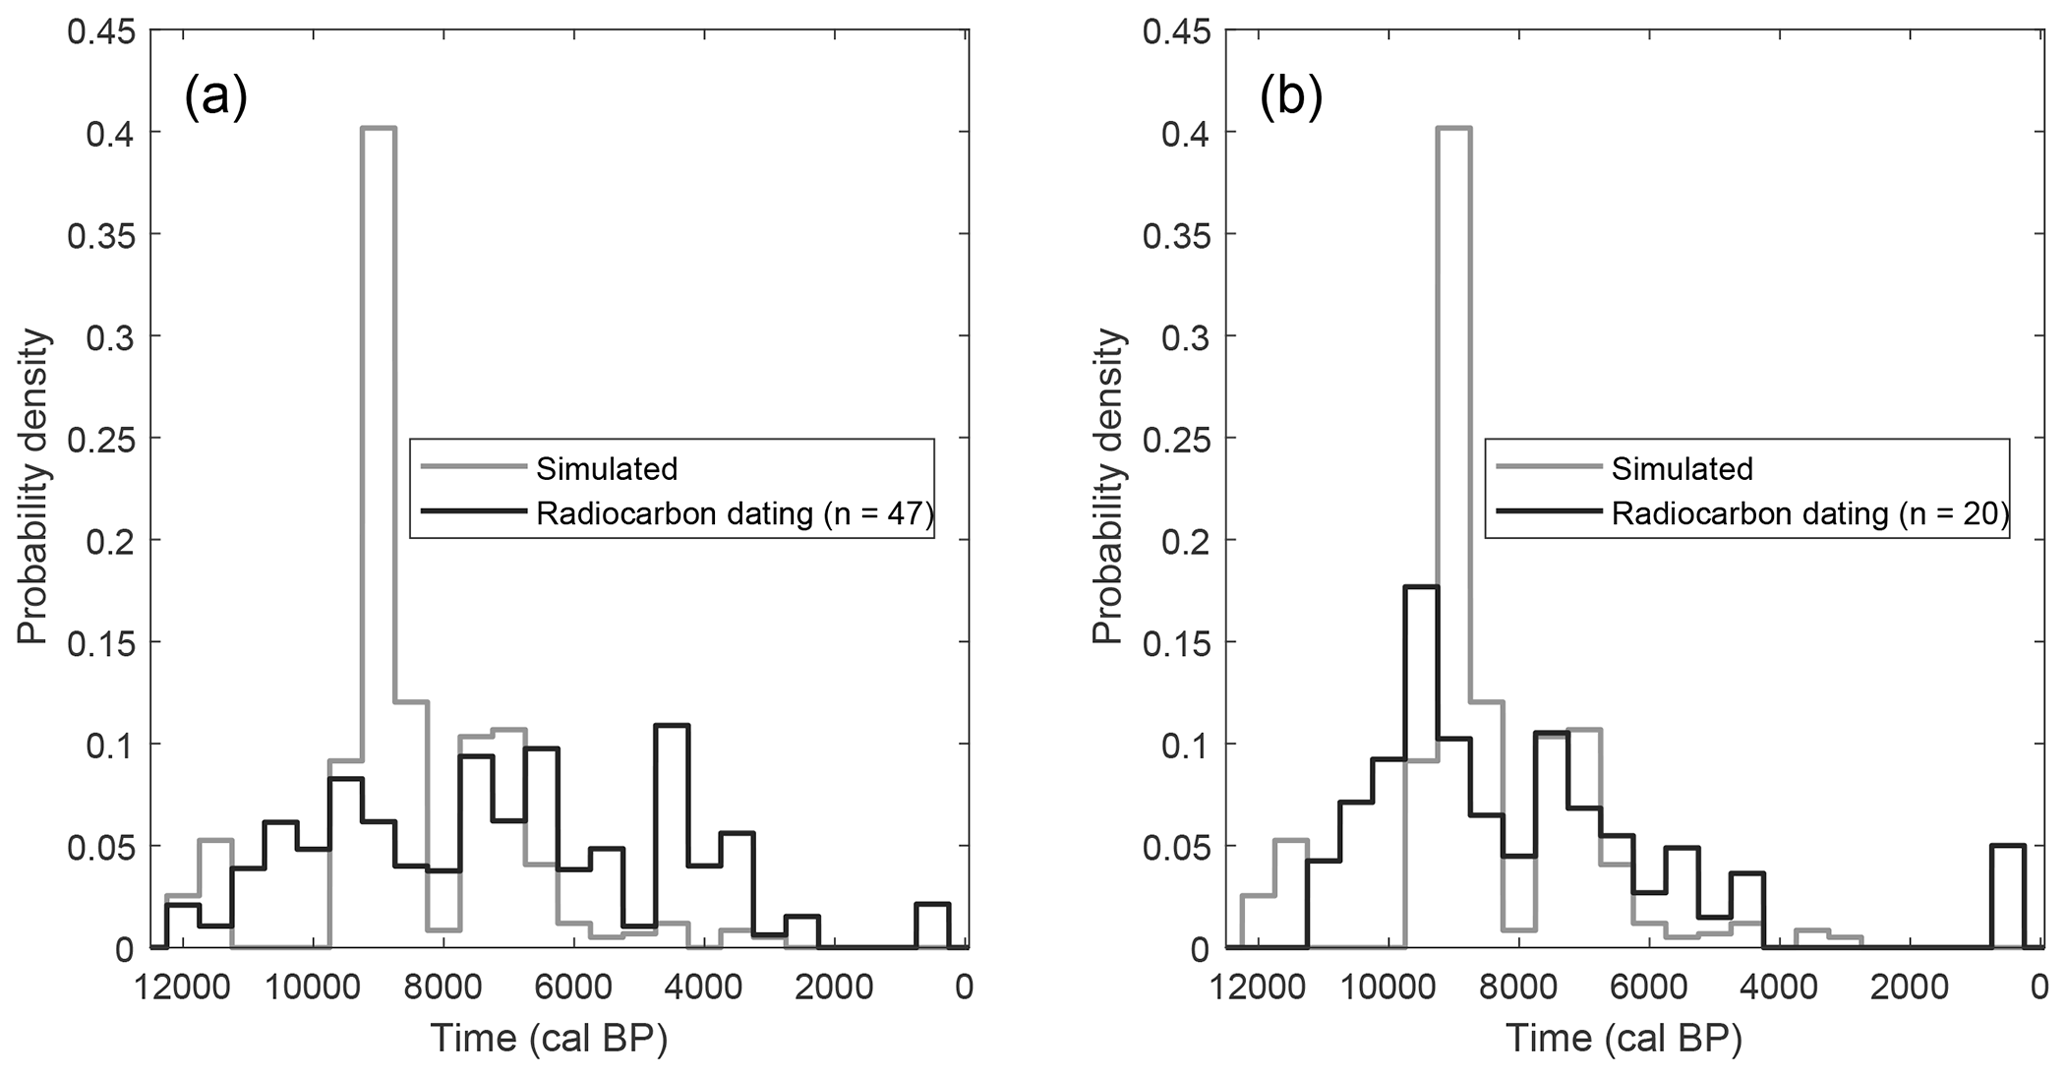
Figure 10Probability density function of the peat growth initiation dates based on the model simulation and the radiocarbon dating database for Scottish upland areas (above 300 m a.s.l., see Appendix A2) using a bin width of 500 years. (a) All dates. (b) All dates, excluding those for which a date was obtained by extrapolating an age–depth model to the bottom of the peat column.
3.4 Sensitivity analysis
To study the model sensitivity to variations in parameter values, a sensitivity analysis is carried out. In total, seven parameters are varied over the range as mentioned in the literature. The parameters broadly cluster in two groups: peat properties and environmental parameters (Table 1). Each parameter is varied stepwise, while all other parameters are kept at the standard value. The sensitivity is evaluated as the current mean peat thickness over all grid points after a simulation over a 12 000-year period using the pollen-based climate and land cover variations as environmental boundary conditions (Fig. 11). Overall, the model appears to be most sensitive to the peat decomposition rate, mean annual temperature and woodland cover. The peat thickness shows no sensitivity towards changes in catotelm conductivity. This is probably because the low conductivity values of the catotelm result in slow drainage compared to other components of the hillslope hydrology and thus in quasi-permanent water saturation of the catotelm. The acrotelm conductivity shows the same behaviour except for the lowest value. The acrotelm is under oxic conditions for most of the simulated values. Only for the lowest conductivity value does the water table rise above the catotelm–acrotelm boundary, resulting in lower decomposition rates and a higher mean peat thickness.
Table 1Overview of the parameters used in the parameter sensitivity test, listing the standard value and the range over which the parameter is changed.
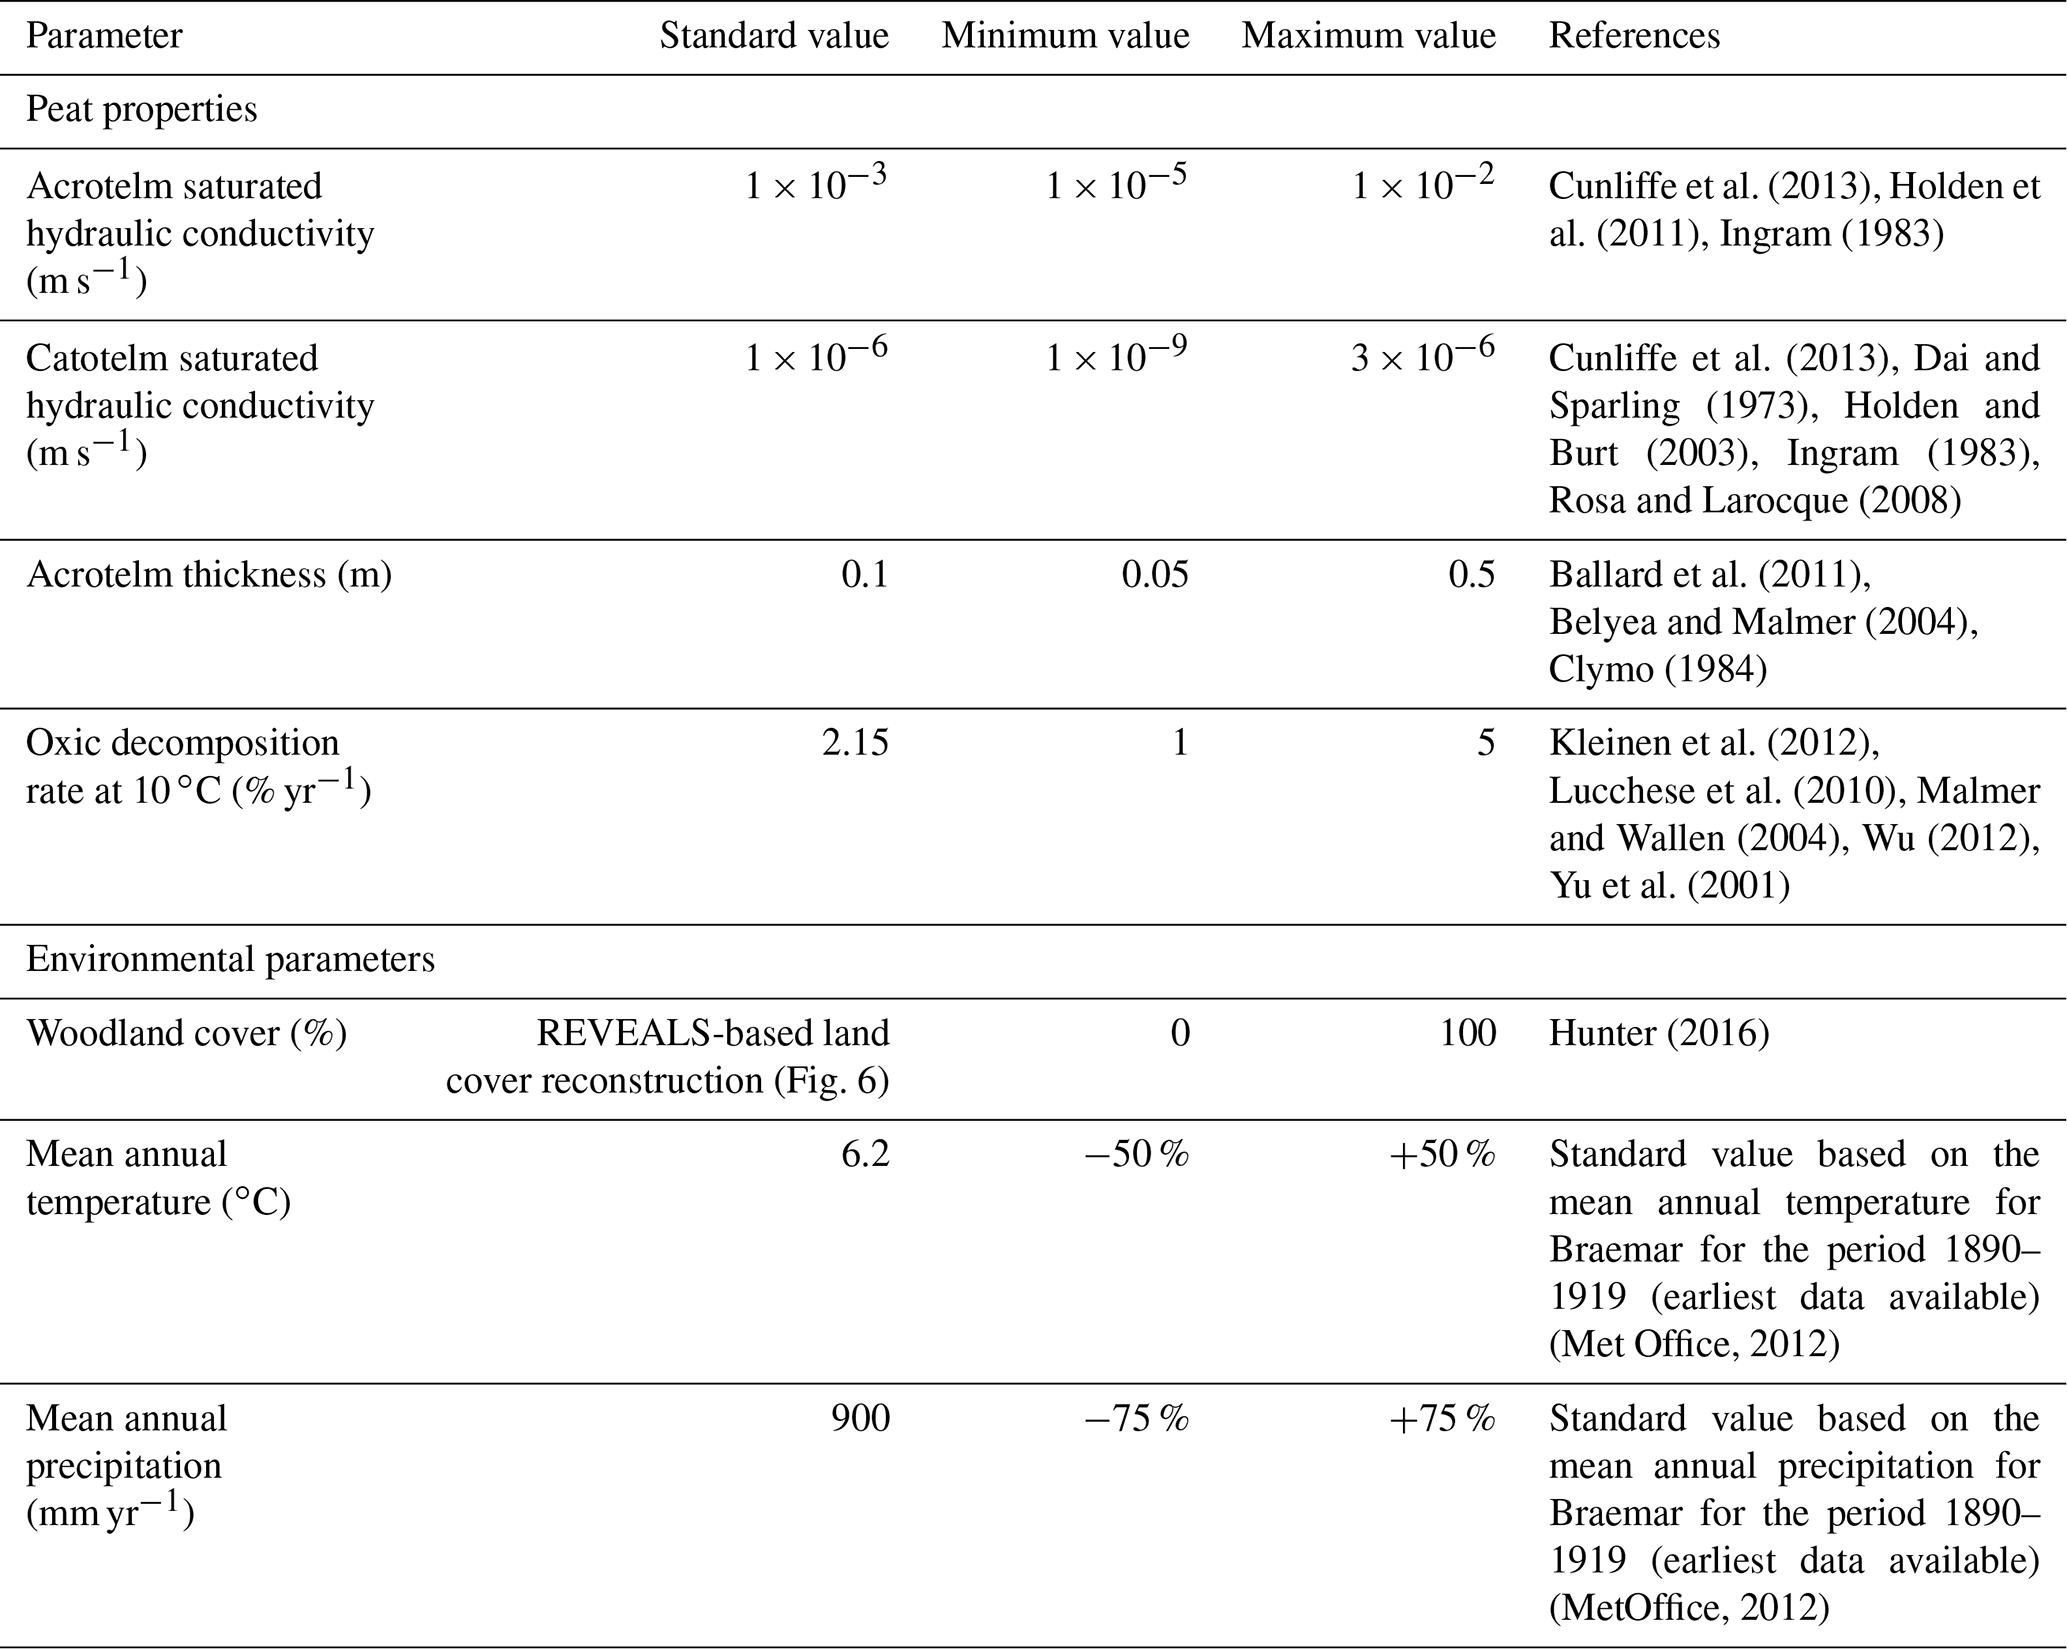
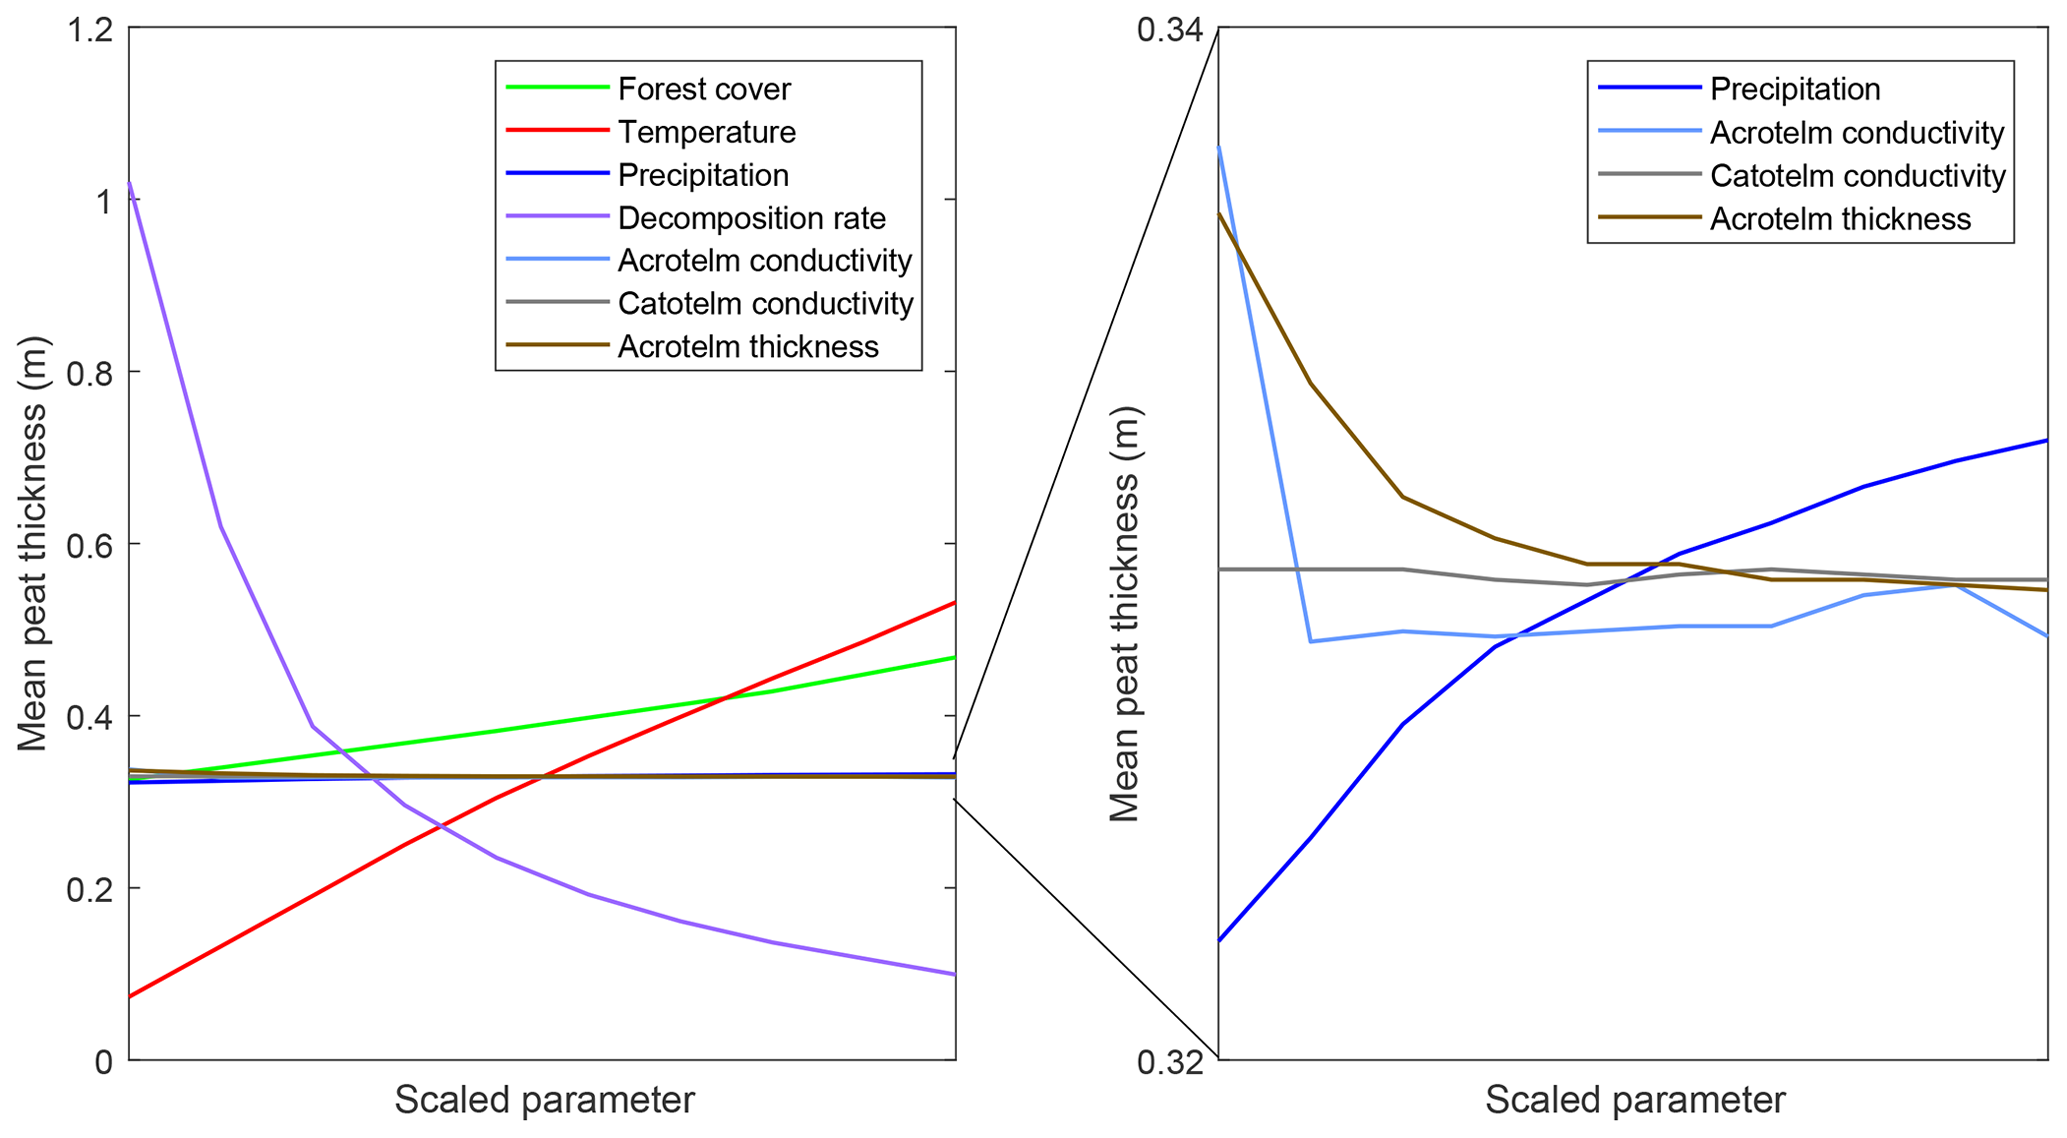
Figure 11Mean simulated peat thickness for all variables used in the parameter sensitivity test.
The climate sensitivity of a model grid point appears to be dependent on the presence of a peat layer. Overall, the percentage of model grid points covered by peat appears to be more sensitive to precipitation changes than the mean peat thickness (Figs. 12, 13). This might be a result of the diplotelmic representation of the peat profile. The strong difference in saturated hydraulic conductivity for the two peat horizons results in minimal water table changes when the precipitation amount is varied. In other words, the use of a diplotelmic model results in a water table which fluctuates only slightly around the acrotelm–catotelm boundary. As a result, the peat accumulation rates and resulting peat thickness are not very sensitive to precipitation changes. However, this does not mean that the water table is located at the same depth for all grid points. Depending on the local hillslope topography, some locations will be fully saturated for most of the time, while at other locations, the water table will be located much lower in the peat profile. For the substrate, only a single saturated hydraulic conductivity value is used, which results in a more sensitive response to precipitation changes for the grid points which do not have a peat cover. Overall, the highest peat thickness and percentage peat cover can be found for the scenarios with a high temperature and precipitation amount.

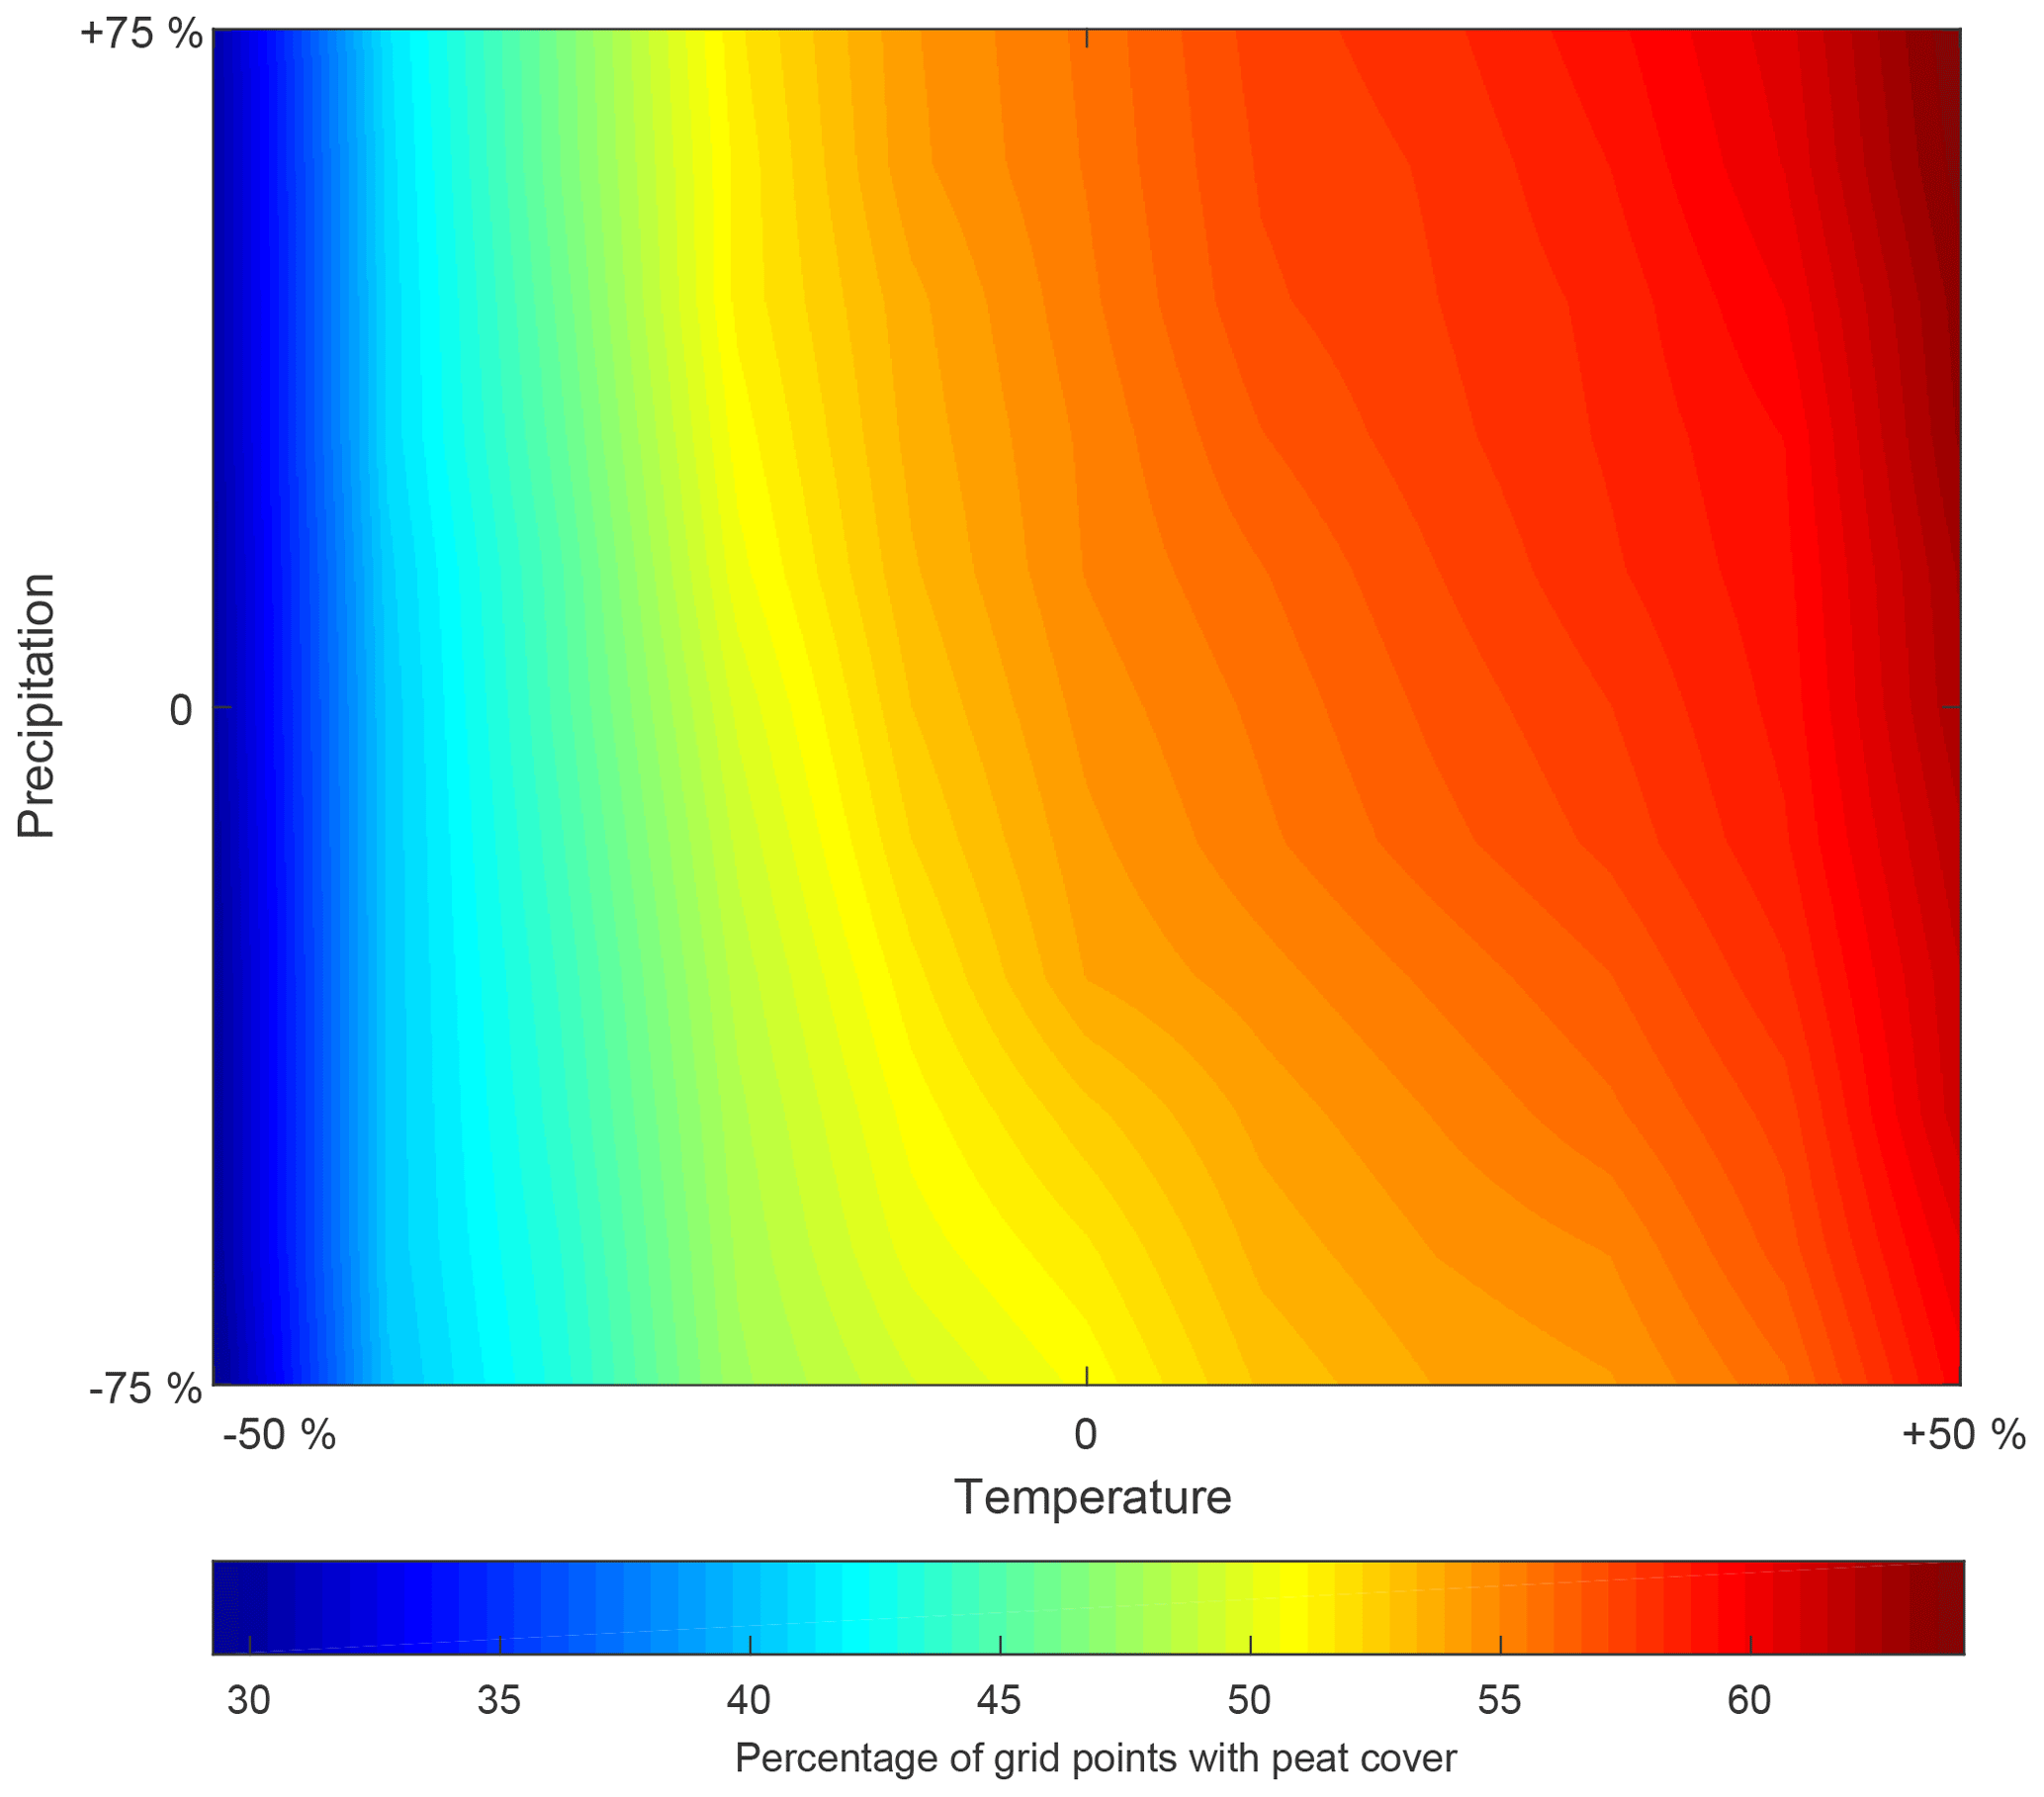
Figure 13Percentage of all model grid points with a peat cover of at least 10 cm for all combinations of precipitation and temperature variations.
Point-by-point calibration of the hillslope model resulted in a poor correspondence between modelled and observed peat thickness. Using the mean peat thickness per topographic class, however allowed for a calibration of the model with an RMSE below 10 cm (Fig. 7). This indicates that a spatial peatland model with a simplified representation of the peat profile is unable to capture the local variability, but it can replicate the general peatland evolution on the landscape scale. Similar model behaviour has been found in sediment erosion modelling, where point-by-point comparison yields poor correspondence but where the mean value per topographic class performs sufficiently well (Peeters et al., 2006). The calibrated acrotelm thickness of 10 cm fits well within the range of 5–50 cm mentioned in the literature (Ballard et al., 2011; Belyea and Clymo, 2001; Clymo, 1984). The same holds true for the calibrated oxic decomposition rate of 2.15 % yr−1 at 10 ∘C, where values between 0.25 % and 7 % yr−1 can be found in the literature (Kleinen et al., 2012; Lucchese et al., 2010; Malmer and Wallen, 2004; Wu, 2012; Yu et al., 2001). In contrast, the calibrated anoxic decomposition rate of 0.239 % yr−1 at 10 ∘C is relatively high and exceeds values from other studies which find rates between and % yr−1. The high calibrated decomposition rates can be attributed to the fact that these rates within the model do not only encompass peat decomposition within the soil profile, but they also include other processes which lead to a decrease in peat thickness in the field such as particulate organic-carbon export through gully development and shallow mass movements. These processes are not represented in the model, but they affect the peat thickness as it is measured in the field, leading to higher decomposition rates in the model calibration. The MILLENNIA peatland model contains a peat erosion module, which calculates the total organic-carbon (TOC) export based on the local water table depth and hillslope runoff depth (Heinemeyer et al., 2010). However, this approach is not able to discriminate between the different erosion processes observed in the field and would require a high amount of additional data. As studies on soil erosion have demonstrated that a model complexity reduction is necessary to reduce the model uncertainty when applied at the landscape scale, peat erosion is not included in the model (Jetten et al., 2003; Van Rompaey and Govers, 2002). As a consequence, the calibrated decomposition rates must be regarded as a model parameter encompassing a range of processes removing peat mass from a certain location rather than simply the decomposition of organic matter within the peat profile itself.
Overall, the peatland model is not able to simulate the high peat thickness values (larger than 1.5 m), observed at some locations in the landscape. This can be partially attributed to the relatively high calibrated decomposition rates (Fig. 14). A second reason might the fact that local depressions within the hillslope topography were filtered out to enable the use of the Boussinesq equation for the simulation of the subsurface flow. Since local depressions showed to contain thick peat deposits in the field, the filtering procedure on the hillslope topography reduces the potential of modelling high peat thickness values at these locations.
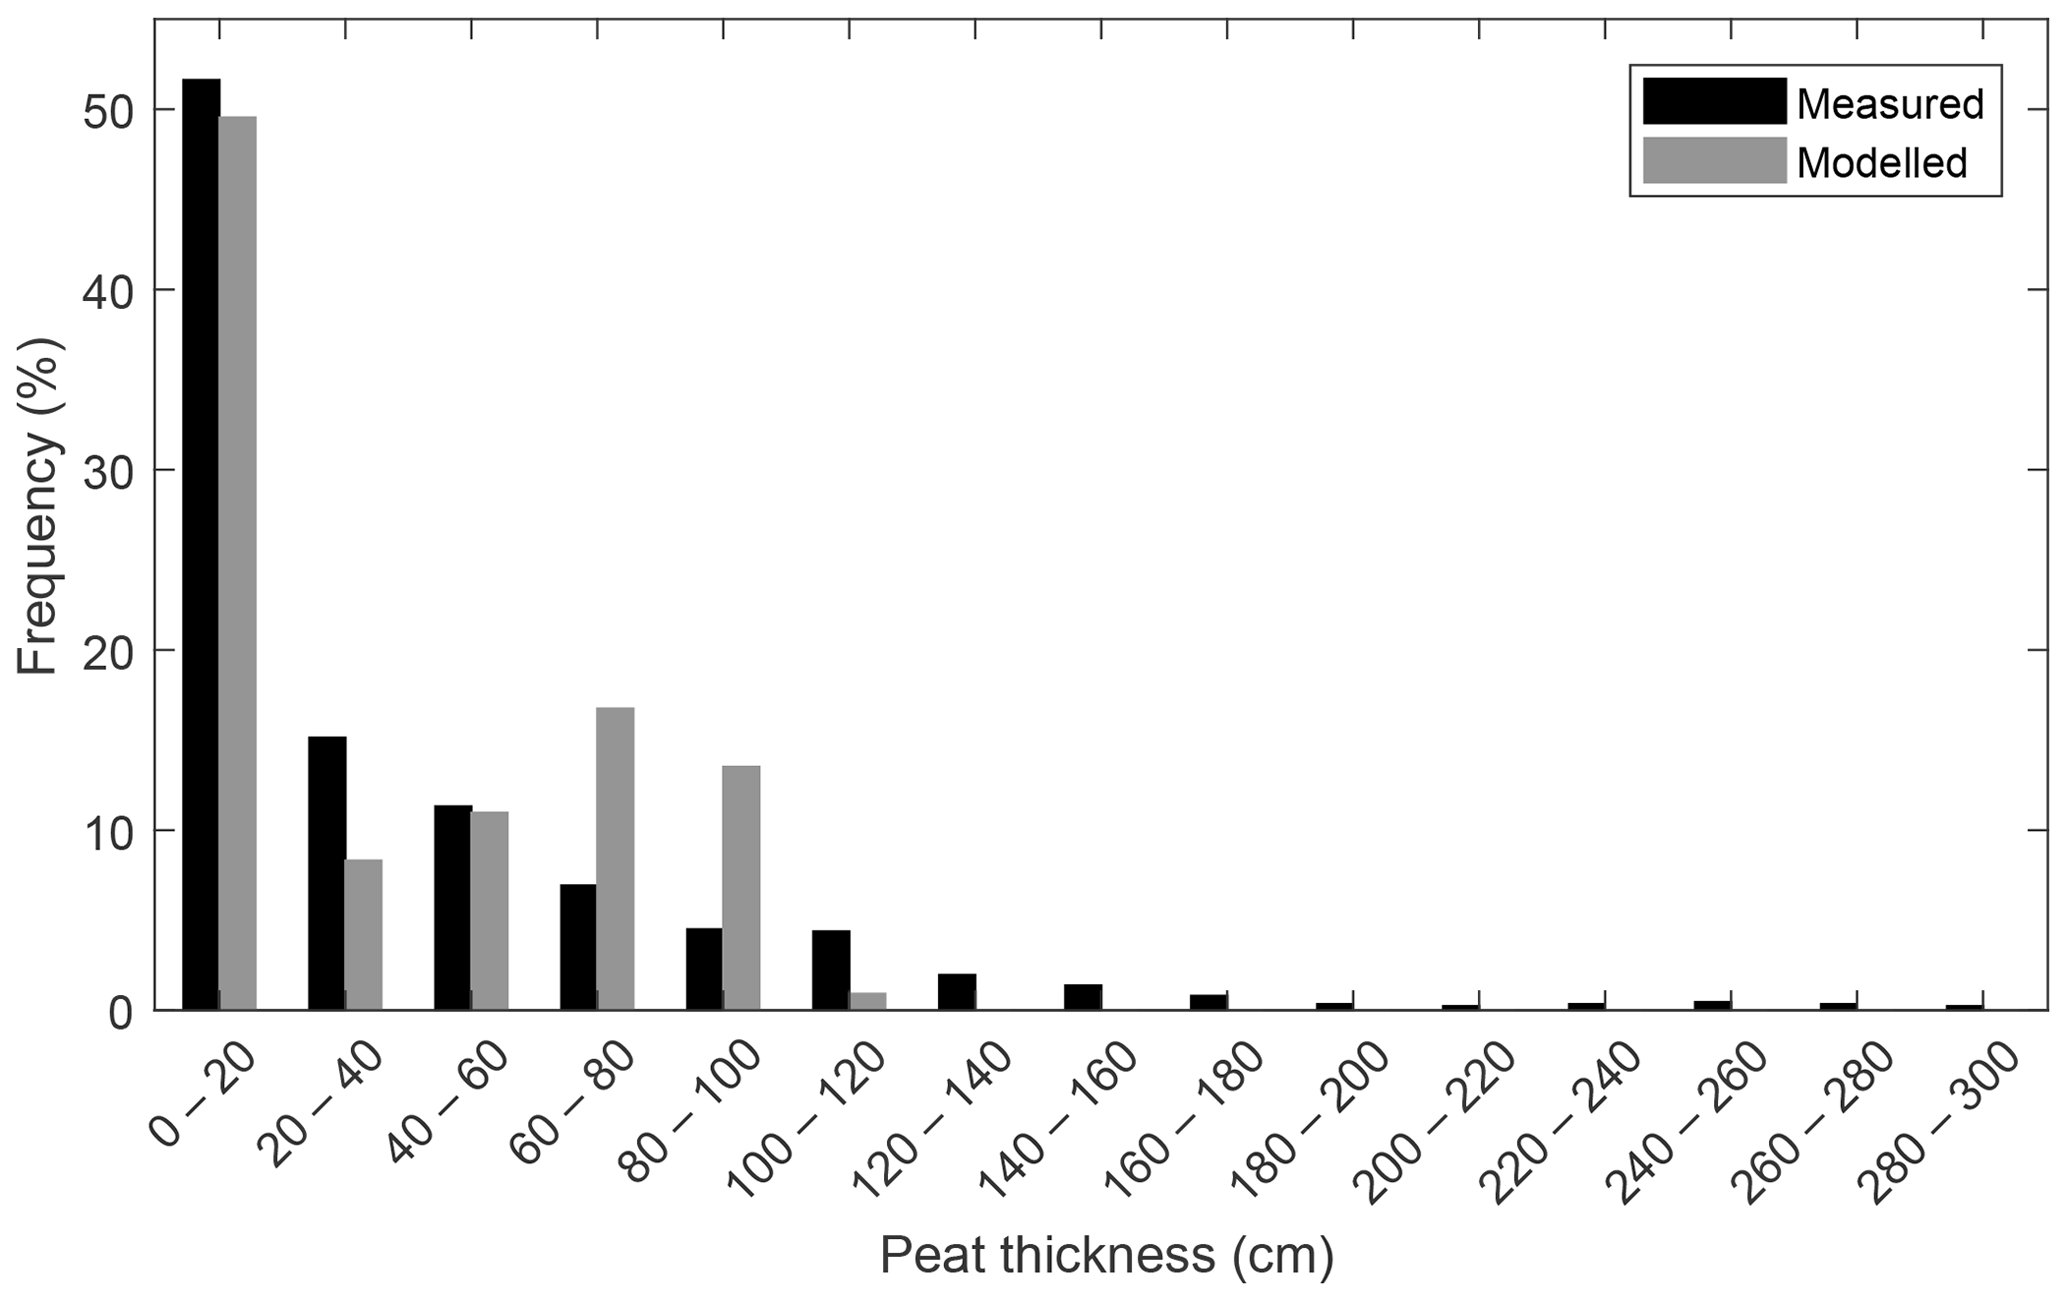
Figure 14Frequency distribution of the measured and modelled peat thickness for all grid points.
The range of simulated peat accumulation rates appears to be realistic, with periods of high mean accumulation rates coinciding with periods of temperature increase (Figs. 3, 8). More specifically, the mean peat accumulation rates were high during the periods 10–8.5 kyr BP, where the mean annual temperature increased 3.74 ∘C. This resulted in a mean peat accumulation rate over all modelled locations for the entire period of m yr−1 or 4.24 g C m−2 yr−1 and 8 –6.5 kyr BP, with a temperature increase of 2.34 ∘C and a mean peat accumulation rate of m yr−1 or 6.88 g C m−2 yr−1. It appears to be the temperature increase, rather than the temperature itself, which drives peat growth. The increased biomass production due to the temperature increase outweighs the lowering in water table height caused by higher evapotranspiration rates and creates an imbalance between production and decomposition, leading to positive accumulation rates and a peat thickness increase.
In contrast to existing cohort models, which have shown to be capable of capturing local variations in dynamics within the peat profile, the relatively simple diplotelmic model presented here cannot reproduce the local dynamics with the same degree of detail (Frolking et al., 2010; Heinemeyer et al., 2010; Morris et al., 2012). However, the simple representation of the model domain leads to a decrease in computation time which allows for the application of the model over large spatial and temporal domains. In combination with the pollen-based climate and land cover reconstructions, it allows for studying peatland development on the landscape scale, rather than at the scale of a single peat bog or peat profile as is often the case for the cohort models, making it possible to answer different research questions.
Peat growth initiation
Based on the model simulations, the peat growth initiation dates cluster mostly within the period 9.75–6.25 kyr BP (Fig. 10), which corresponds largely to the Atlantic period, which is mentioned by other studies based on field data (Ellis and Tallis, 2000; Tipping, 2008). The database of basal radiocarbon dates shows a wider spread of initiation dates for upland Scotland between 12.25 and 3.25 kyr BP. However, the majority of the available basal dates within the dataset are based on a radiocarbon dating result higher in the peat profile, which is extrapolated to the bottom of the core using an age–depth model. One could question whether this extrapolation is justified. The deeper parts of the peat profile are older, and, as a result, a smaller fraction of the originally deposited biomass will remain. This leads to lower reconstructed accumulation rates further back in time. The reconstructed rates based on the available radiocarbon dates for the study area show a clear decreasing trend when going further back in time (Fig. 15, see Appendix A2 for dating details). When extrapolating to the bottom of a peat profile in order to obtain an initiation age, the accumulation rate of the above-lying part of the peat profile is used to extrapolate over the lowest part of the profile, which is older and has a lower fraction of remaining peat mass. As a result, these extrapolated ages will be biased towards younger basal ages. This effect increases with an increasing distance between the bottom of the peat profile and the deepest radiocarbon date. When excluding the extrapolated basal ages from the analysis, the probability density function shifts towards older ages, clustering between 11.25 and 4.25 kyr BP and corresponding much better with the probability density function of the model simulations (Fig. 10). Here, both the radiocarbon dates as well as the model simulations show peaks in peat growth initiation in the periods 10.25–8.25 and 7.75–6.25 kyr BP, which coincide with the periods of temperature increase. Overall, the simulations broadly show the same pattern as the radiocarbon dates, but there is a more pronounced difference between periods. The spikes in the simulated initiation dates might be attributed to the use of a single set of parameter values for the entire study area resulting in a relatively similar response of many model grid points to the changing environmental conditions during the Early Holocene. The more diffuse probability density function for the radiocarbon dates might thus, at least partially, be ascribed to local heterogeneity. Additionally, as the available basal radiocarbon dates come from areas all over Scotland, the probability density curve is likely to include regional differences in peatland initiation ages as well.
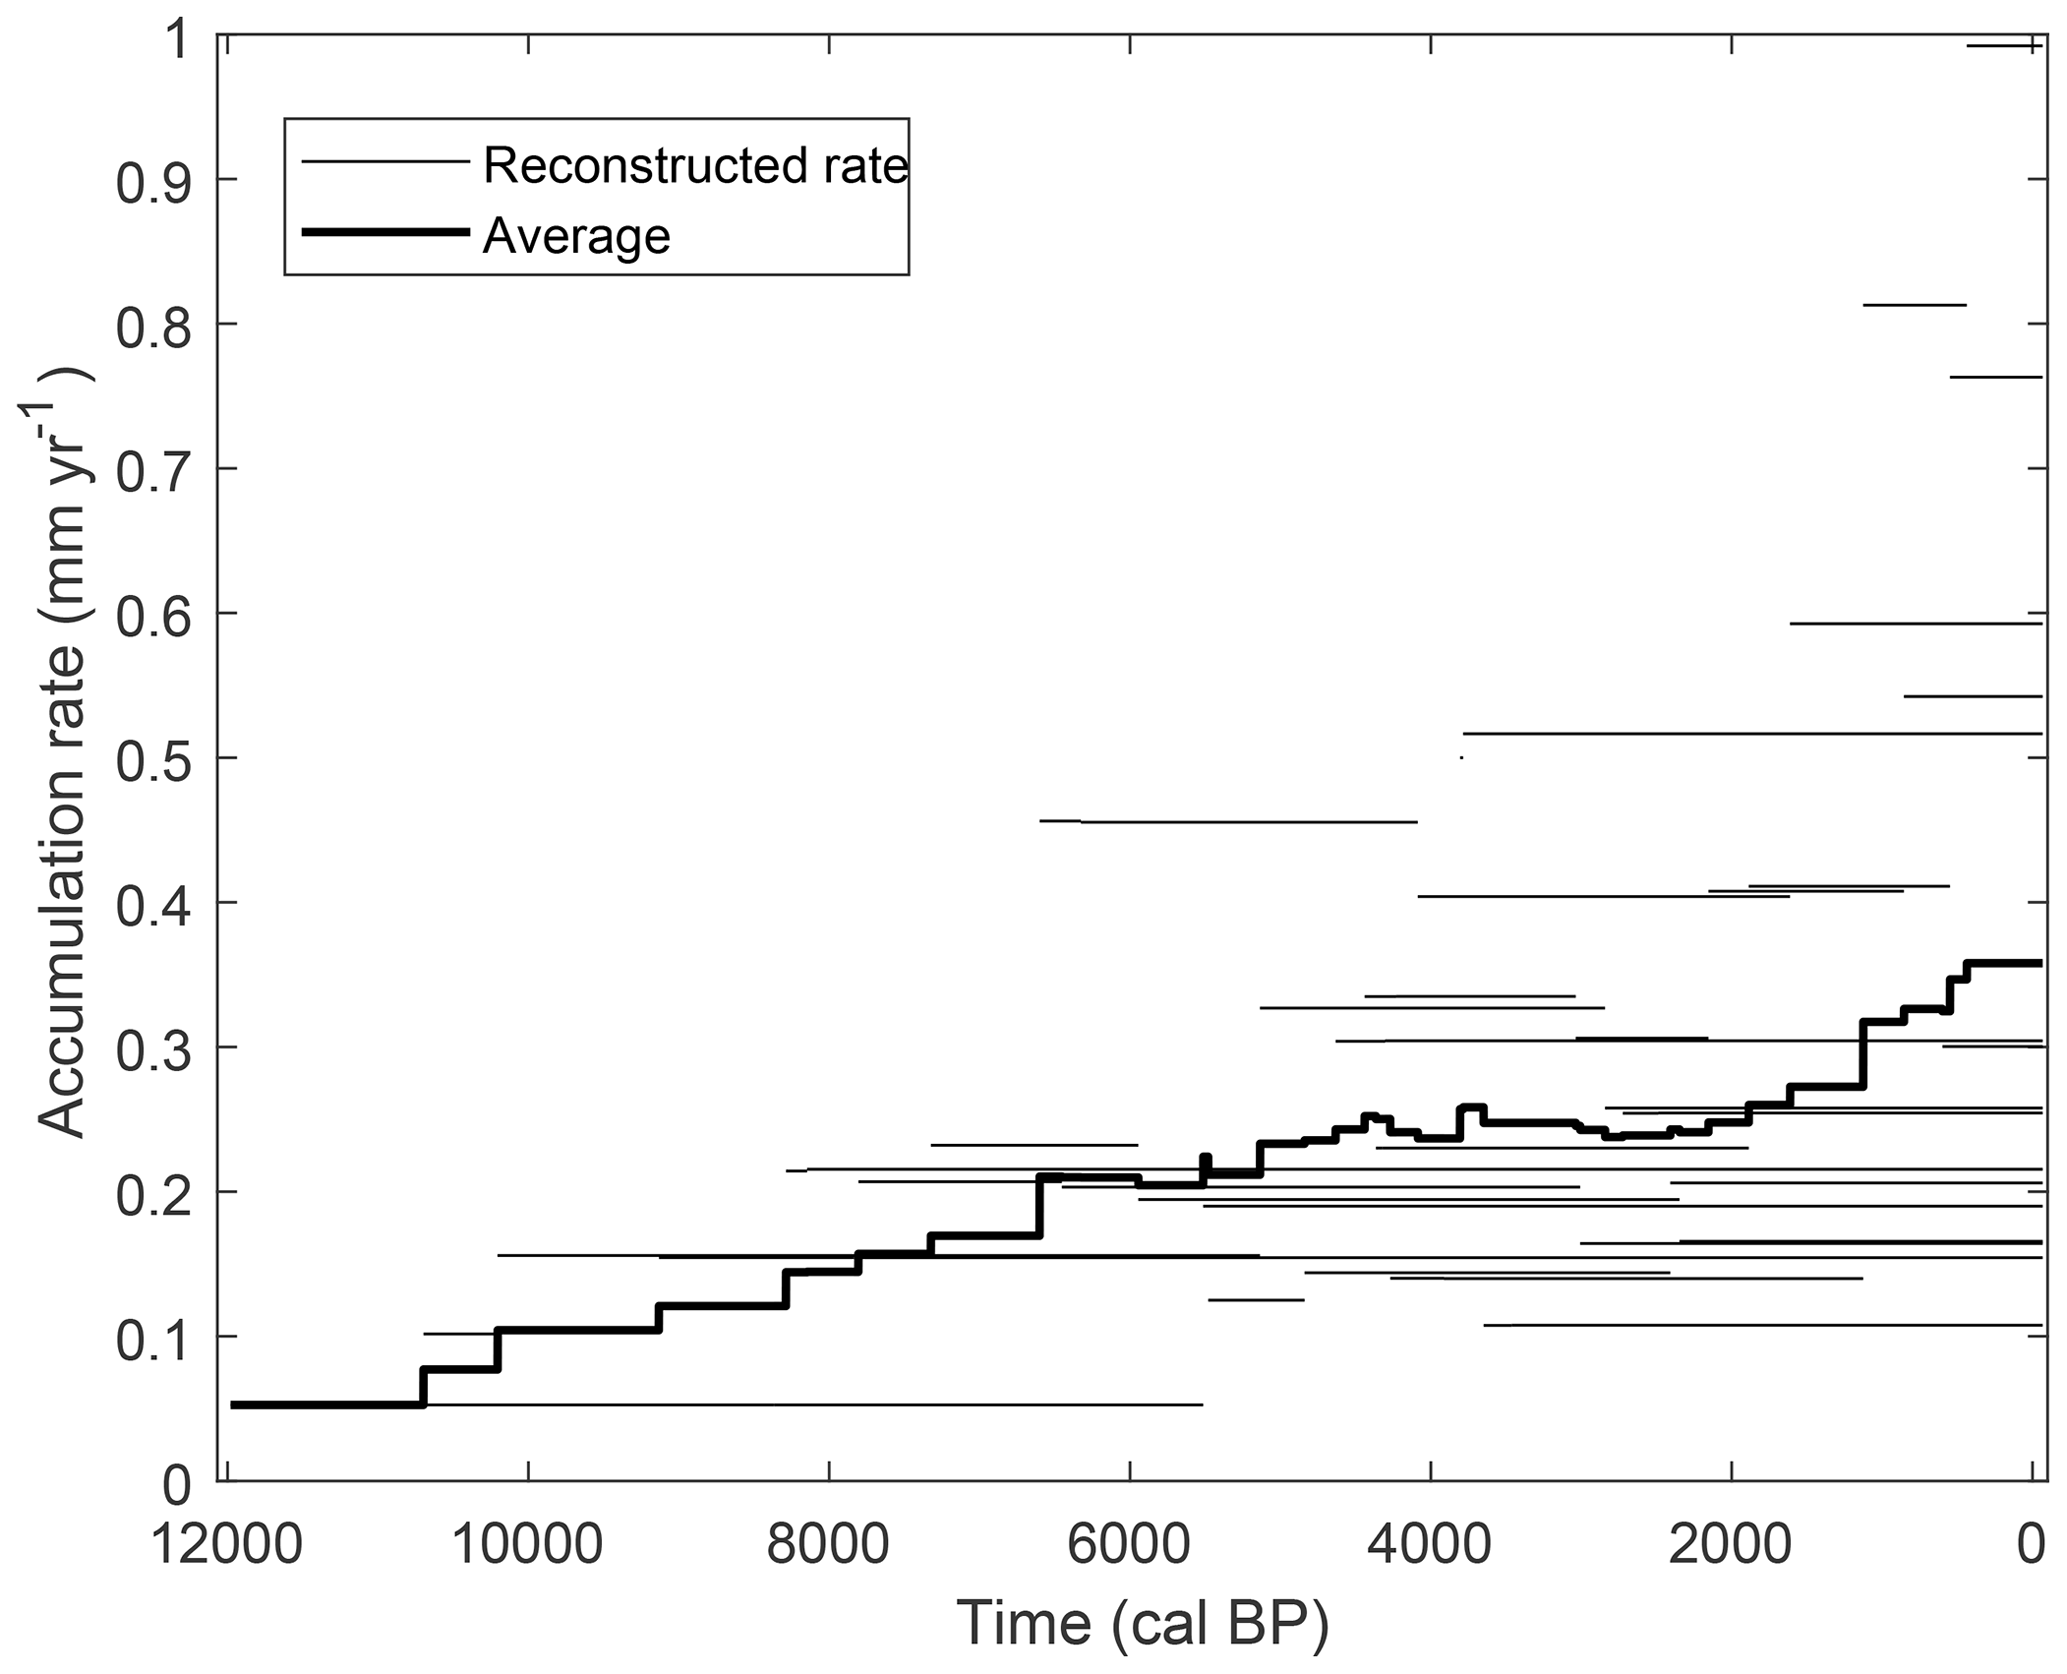
Figure 15Reconstructed peat accumulation rates based on all available radiocarbon dates within the study area and the mean peat accumulation rate.
A study for the British Isles based on an envelope climate model for blanket peatlands finds a contraction in the area suitable for blanket peatland development in eastern Scotland since 6 kyr BP, and other studies find accumulation rates after 6 kyr BP to be relatively low (Gallego-Sala et al., 2016; Simmons and Innes, 1988). In this study, accumulation rates decrease from 8 to 6 kyr BP onwards (Fig. 7). Overall, the mean accumulation rate remains positive until approximately 2 kyr BP, but it never reaches the high values which occurred during the Early Holocene. This results in a slowdown of peatland development and carbon storage after 6 kyr BP (Fig. 9). The asymptotic behaviour of the peat thickness evolution at the landscape scale, stabilizing after 6 kyr BP, is also found in other studies modelling long-term peatland development at the local scale. While the modelled peat thickness trajectory is dependent on the specific conditions (climate, land cover, topography, etc.), it is clear that the carbon sequestering potential of a peatland has it limits at millennial timescales, as the balance between biomass production and decomposition comes in equilibrium with the environmental conditions (Frolking et al., 2010; Heinemeyer et al., 2010).
The conclusion that the blanket peatland development in the Upper Dee area can be attributed to climate warming, independent of an increase in precipitation, as demonstrated by the sensitivity analysis, is in line with a study by a Morris et al. (2018), who compared a large dataset of peatland initiation dates across the globe with GCM (general circulation model) paleoclimate simulations, concluding that peatland initiation in formerly glaciated areas can be attributed to rising growing season temperatures. Additionally, a recent study on buried peat layers indicates that in northern latitudes (> 40∘ N) peat growth is extensive during warm periods such as the last interglacial and the marine isotope stage (MIS) 3 interstadial periods (57–29 kyr BP) (Treat et al., 2019). It is clear that anaerobic conditions are required for the development of peat soils. However, regional climatic changes towards wetter conditions do not seem to be necessary for blanket peatland initiation. Apparently, local factors driving the hydrology such as hillslope topography, soil properties, etc. will determine where anoxic conditions will be established in order to enable blanket peatlands to develop (Morris et al., 2018).
The model simulations do not support the original hypothesis on the origin of the blanket peatlands, linking the peatland development to a deforestation-driven change in hillslope hydrology (Moore, 1973). Firstly, both the available basal radiocarbon dates and the simulated initiation dates indicate a shift towards peat soils during a period of increasing or stable woodland cover (Figs. 6, 10). Secondly, the parameter sensitivity analysis indicates that a decrease in tree cover, either by natural or anthropogenic causes, decreases the peat growth potential because the decrease in evapotranspiration due to a loss of tree cover is outweighed by the reduction in biomass production under the environmental conditions present in the study area. Tipping (2008) studied the Holocene blanket peatland development in five upland and northern sites in Scotland using a combination of geomorphic, archaeological and radiocarbon data, resulting in the hypothesis that blanket peatlands were common over large parts of the Scottish Highlands within the first few millennia of the Holocene either due to rapid soil development or climatic changes (Tipping, 2008). This study supports Tipping's hypothesis, as shown by the model simulations and peatland initiation dates, and it provides evidence that a changing climate (increasing mean annual temperature) was the main driver of blanket peatland development.
Although the simulated mean peat accumulation rates remain at low levels after 6 kyr BP, this does not mean peat profiles are unable to develop but rather that the peatlands at a landscape scale are in dynamic equilibrium with the stabilizing Holocene climate. This can be demonstrated using a forced model simulation where all peat soils are removed at 6 kyr BP. The resultant simulated peat thickness evolution indicates that peat starts to develop immediately after the peat removal (Fig. 16). After approximately 1500 years, the mean peat thickness over the study area again reaches the values of the standard model run. This indicates that the model can simulate peatland regeneration at locations which are impacted by the removal of peat cover either by natural processes (e.g. by shallow mass movements or gullies) or following anthropogenic peat cutting.
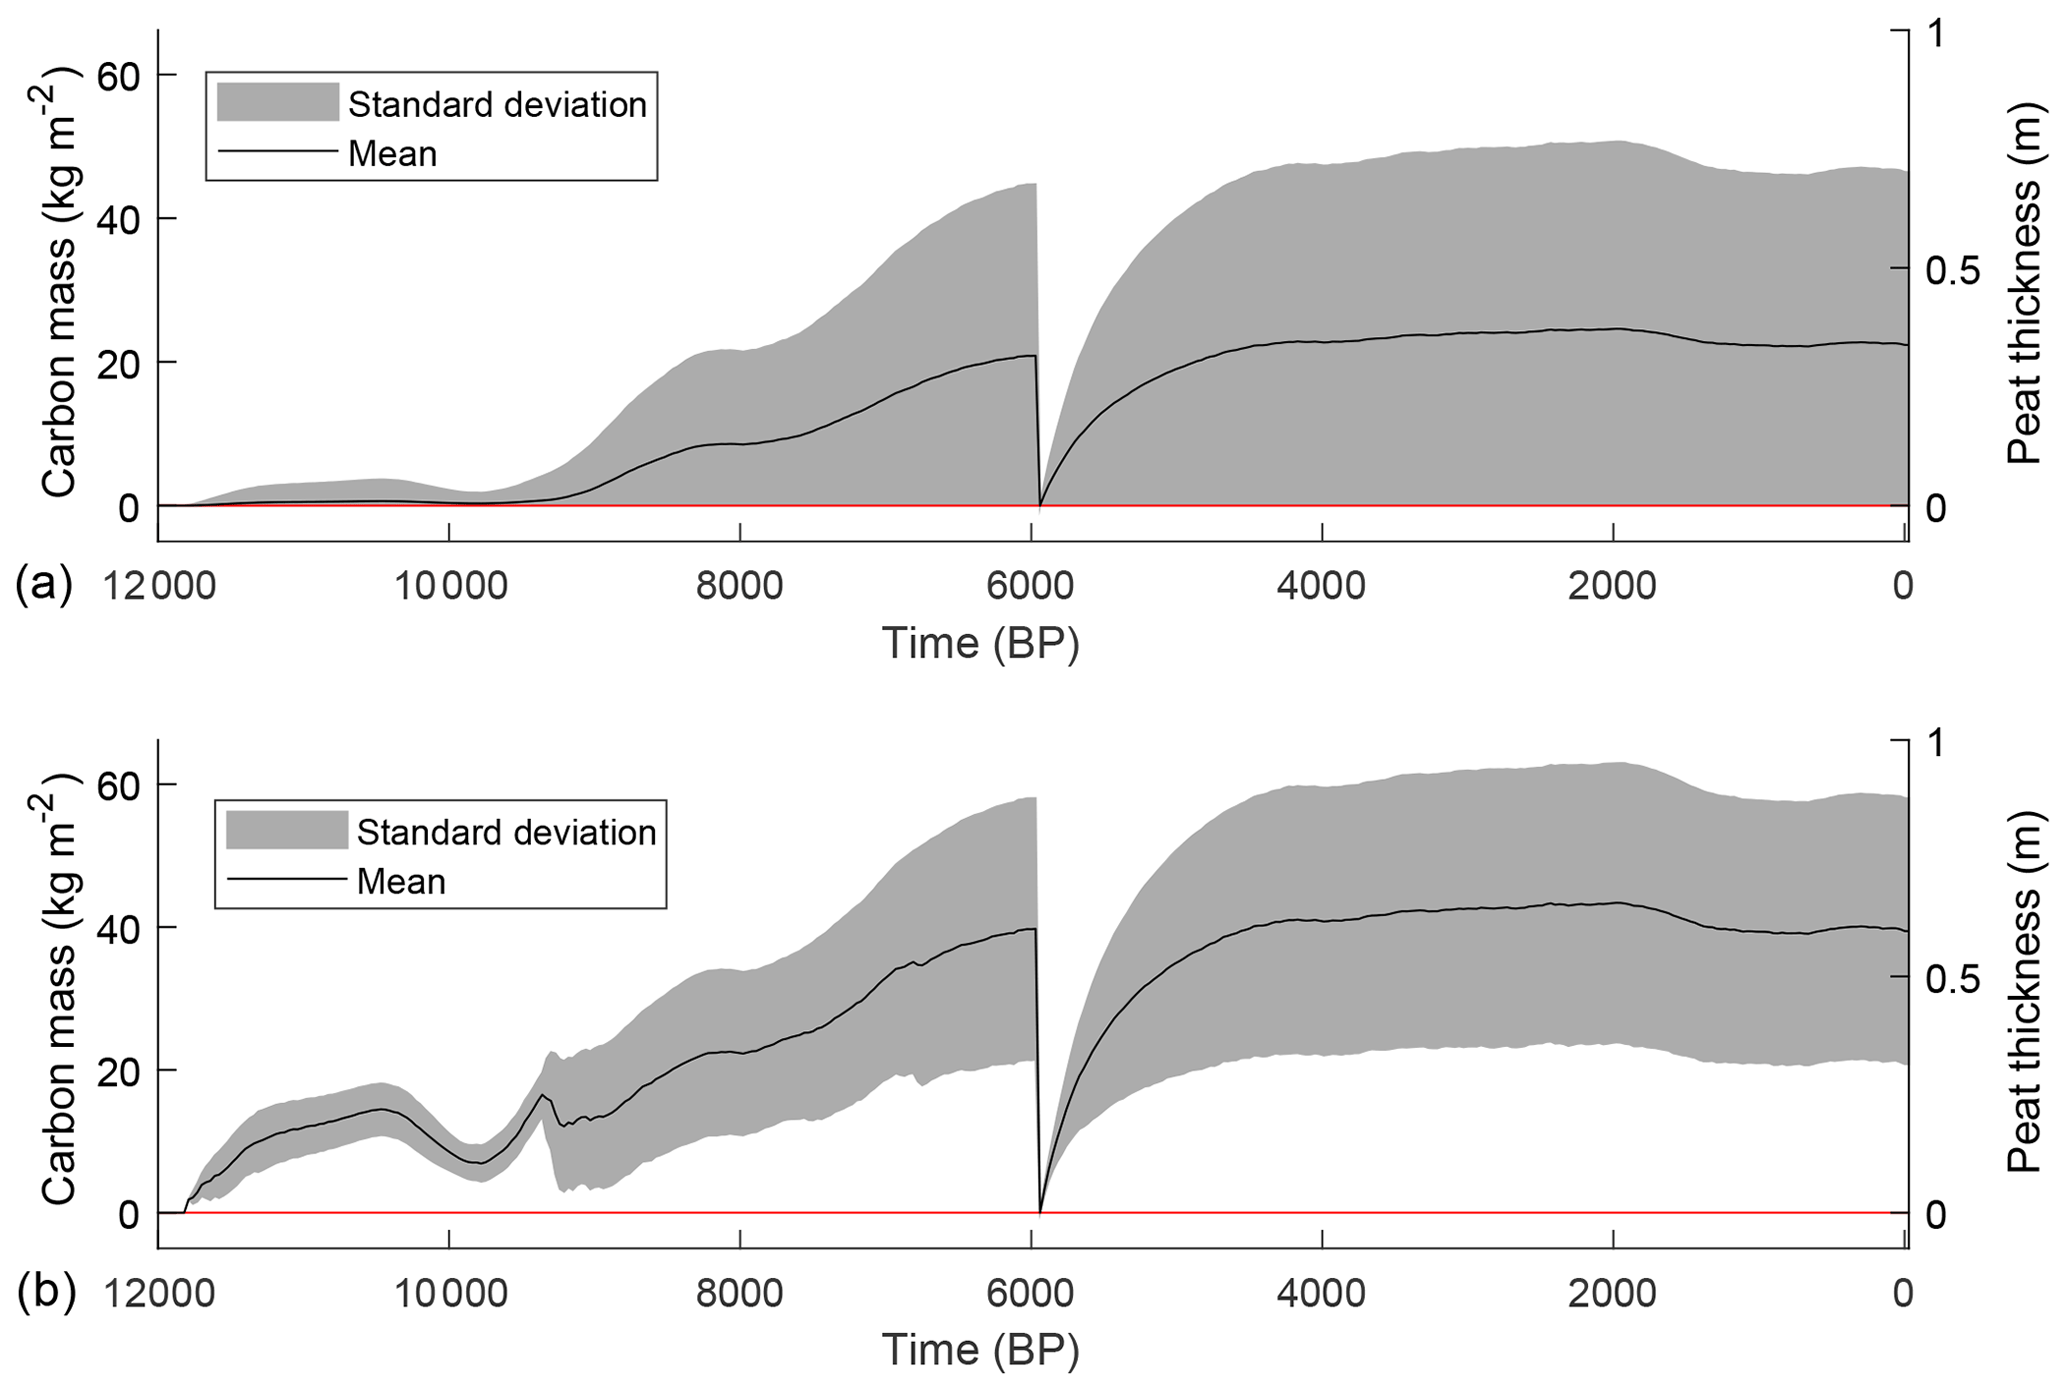
Figure 16Simulated mean peat thickness/carbon mass and standard deviation for all grid points (a) and for the grid points with peat cover (b), with a removal of all peat cover within the study area at 6 kyr BP.
A new process-based model was presented to study long-term blanket peatland development along hillslopes. The simulations for the past 12 000 years indicate that a relatively simple diplotelmic model is able to capture long-term peatland dynamics on the landscape scale. However, point-by-point comparison still shows poor results, which can be attributed to the use of a single set of calibrated parameters and the idealized representation of the model domain. Overall, both the field data and model simulations indicate that the blanket peatlands in the Upper Dee area developed mostly during the Atlantic period, with a peak in peat growth initiation dates around 9 kyr BP. The timing of peatland initiation together with the results of the sensitivity analysis support the hypothesis of a climate-driven origin of the blanket peatlands in the Scottish highlands, where the peatland development shows to be driven by a long-term regional warming trend during the Early Holocene. A higher woodland cover leads to an increase in peat growth potential, contradicting the original hypothesis of Moore (1973), which identified deforestation as a potential driver of blanket peatland development. In more recent periods, the relatively stable climate and land cover within the study area since 6 kyr BP result in a stabilization of peatland development, indicating that the study area served as a terrestrial carbon sink mainly during the Atlantic period and has stabilized during the Late Holocene.
The supplementary data to this article consist of two datasets. A list of all soil corings, including the coring location, elevation and measured peat depth, is available online at https://doi.org/10.17632/pxszz2wzny.1 (Swinnen, 2019a). The detailed stratigraphic descriptions for each soil coring are available online at https://doi.org/10.17632/ms484mrjj5.1 (Swinnen, 2019b).
Table A1MIDAS (Met Office Integrated Data Archive System) weather stations used for the construction of the regression equations for orographic temperature and precipitation corrections.
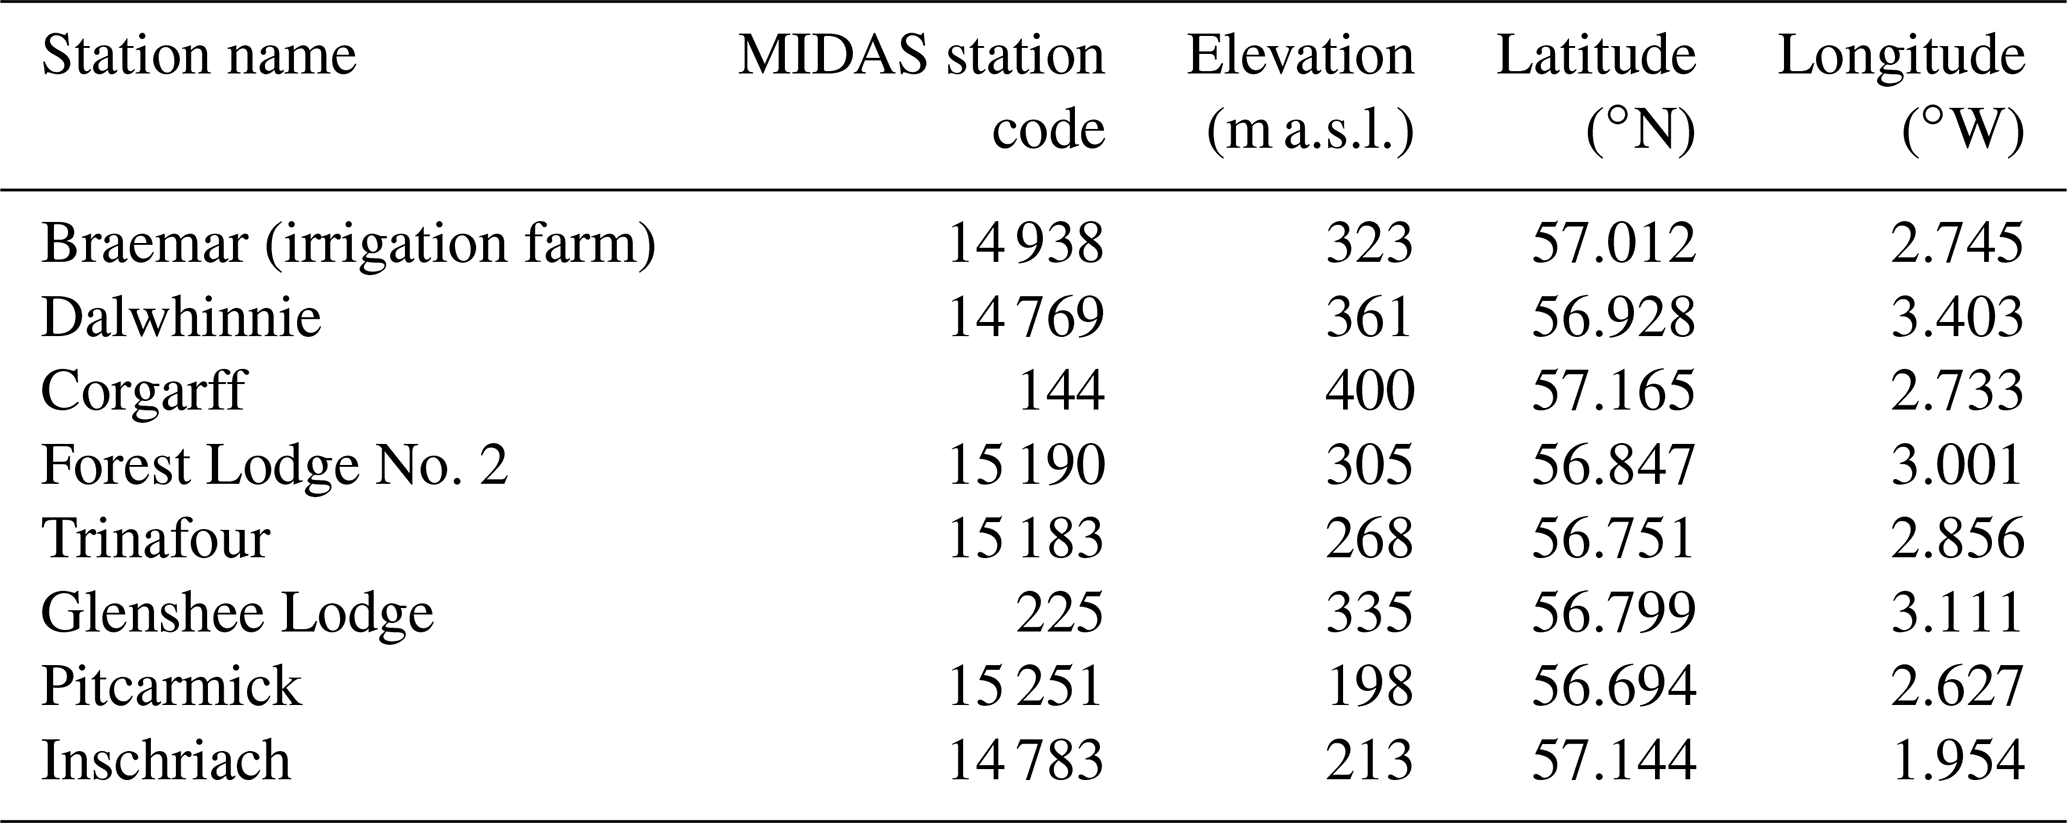
Table A2Radiocarbon dating results. Calibrated ages were calculated using the software OxCal 4.3 and the IntCal13 calibration curve (Bronk Ramsey, 2009; Reimer et al., 2013).
The conceptualization and methodology development of this project was carried out by WS, NB and GV. The field work was performed by WS, NB and GV. WS carried out the lab work, developed the model code and performed the model simulations. GV and NB supervised the research. The writing of the paper was carried out by WS, NB and GV.
The authors declare that they have no conflict of interest.
The authors thank the Mar Estate, Mar Lodge Estate and Invercauld Estate for permission to access the area. The authors thank Teun Daniëls, Sofie De Geeter, Yasmine Hunter, Ellen Jennen, Vincent Lenaerts and Remi Swinnen for their assistance during the field campaigns. Danny Paterson and Richard Tipping are thanked for sharing their pollen data from the Upper Dee area. The pollen data of Birks (1969) and Huntley (1994) were extracted from the European Pollen Database (EPD; http://www.europeanpollendatabase.net/, last access: 1 June 2018), and the work of the data contributors and the EPD community is gratefully appreciated.
This research has been supported by the Fonds Wetenschappelijk Onderzoek (grant nos. 1167019N and G0A6317N).
This paper was edited by Alexey V. Eliseev and reviewed by Andreas Heinemeyer and one anonymous referee.
Alexandrov, G. A., Brovkin, V. A., and Kleinen, T.: The influence of climate on peatland extent in Western Siberia since the Last Glacial Maximum, Sci. Rep., 6, 6–11, https://doi.org/10.1038/srep24784, 2016.
Baird, A. J., Morris, P. J., and Belyea, L. R.: The DigiBog peatland development model 1: rationale, conceptual model, and hydrological basis, Ecohydrology, 5, 242–255, https://doi.org/10.1002/eco.2, 2012.
Ballantyne, C. K.: After the ice: Holocene geomorphic activity in the Scottish Highlands, Scottish Geogr. J., 124, 8–52, https://doi.org/10.1080/14702540802300167, 2008.
Ballard, C. E., McIntyre, N., Wheater, H. S., Holden, J., and Wallage, Z. E.: Hydrological modelling of drained blanket peatland, J. Hydrol., 407, 81–93, https://doi.org/10.1016/j.jhydrol.2011.07.005, 2011.
Beilman, D. W. and Yu, Z.: Differential Response of Peatland Types to Climate: Modeling Peat Accumulation in Continental Western Canada, 38–86, 2001.
Belyea, L. R. and Clymo, R. S.: Feedback control of the rate of peat formation, P. R. Soc. B, 268, 1315–1321, https://doi.org/10.1098/rspb.2001.1665, 2001.
Belyea, L. R. and Malmer, N.: Carbon sequestration in peatland?: patterns and mechanisms of response to climate change, Glob. Change Biol., 10, 1043–1052, 2004.
Birks, H. H.: Studies in the vegetational history of Scotland, University of Cambridge, 1969.
Blaauw, M.: Methods and code for “classical” age-modelling of radiocarbon sequences, Quat. Geochronol., 5, 512–518, https://doi.org/10.1016/j.quageo.2010.01.002, 2010.
Bronk Ramsey, C.: Bayesian Analysis of Radiocarbon Dates, Radiocarbon, 51, 337–360, https://doi.org/10.1017/S0033822200033865, 2009.
Cairns, A., Dutch, M. E., Guy, E. M., and Stout, J. D.: Effect of irrigation with municipal water or sewage effluent on the biology of soil cores: I. Introduction, total microbial populations, and respiratory activity, New Zeal. J. Agr. Res., 21, 1–9, https://doi.org/10.1080/00288233.1978.10427377, 1978.
Campforts, B. and Govers, G.: Keeping the edge: A numerical method that avoids knickpoint smearing when solving the stream power law, J. Geophys. Res.-Earth, 120, 1189–1205, https://doi.org/10.1002/2014JF003376, 2015.
Carroll, M. J., Heinemeyer, A., Pearce-Higgins, J. W., Dennis, P., West, C., Holden, J., Wallage, Z. E., and Thomas, C. D.: Hydrologically driven ecosystem processes determine the distribution and persistence of ecosystem-specialist predators under climate change, Nat. Commun., 6, 1–10, https://doi.org/10.1038/ncomms8851, 2015.
Chapman, S. J. and Thurlow, M.: Peat respiration at low temperatures, Soil Biol. Biochem., 30, 1013–1021, https://doi.org/10.1016/S0038-0717(98)00009-1, 1998.
Clymo, R. S.: The Limits to Peat Bog Growth, Philos. T. R. Soc. B, 303, 605–654, https://doi.org/10.1098/rstb.1984.0002, 1984.
Cunliffe, A. M., Baird, A. J., and Holden, J.: Hydrological hotspots in blanket peatlands: Spatial variation in peat permeability around a natural soil pipe, Water Resour. Res., 49, 5342–5354, https://doi.org/10.1002/wrcr.20435, 2013.
Dai, T. S. and Sparling, J. H.: Measurement of hydraulic conductivity of peats, Can. J. Soil Sci., 53, 21–26, 1973.
Dunn, S. M., Langan, S. J., and Colohan, R. J. E.: The impact of variable snow pack accumulation on a major Scottish water resource, Sci. Total Environ., 265, 181–194, https://doi.org/10.1016/S0048-9697(00)00658-6, 2001.
Ellis, C. J. and Tallis, J. H.: Climatic control of blanket mire development at Kentra Moss, north-west Scotland, J. Ecol., 88, 869–889, https://doi.org/10.1046/j.1365-2745.2000.00495.x, 2000.
Everest, J. and Kubik, P.: The deglaciation of eastern Scotland: Cosmogenic 10Be evidence for a Lateglacial stillstand, J. Quat. Sci., 21, 95–104, https://doi.org/10.1002/jqs.961, 2006.
Frolking, S., Roulet, N. T., Tuittila, E., Bubier, J. L., Quillet, A., Talbot, J., and Richard, P. J. H.: A new model of Holocene peatland net primary production, decomposition, water balance, and peat accumulation, Earth Syst. Dynam., 1, 1–21, https://doi.org/10.5194/esd-1-1-2010, 2010.
Fyfe, R. M., Twiddle, C., Sugita, S., Gaillard, M. J., Barratt, P., Caseldine, C. J., Dodson, J., Edwards, K. J., Farrell, M., Froyd, C., Grant, M. J., Huckerby, E., Innes, J. B., Shaw, H., and Waller, M.: The Holocene vegetation cover of Britain and Ireland: Overcoming problems of scale and discerning patterns of openness, Quaternary Sci. Rev., 73, 132–148, https://doi.org/10.1016/j.quascirev.2013.05.014, 2013.
Gallego-Sala, A. V., Charman, D. J., Harrison, S. P., Li, G., and Prentice, I. C.: Climate-driven expansion of blanket bogs in Britain during the Holocene, Clim. Past, 12, 129–136, https://doi.org/10.5194/cp-12-129-2016, 2016.
Gallego-Sala, A. V. and Prentice, I. C.: Blanket peat biome endangered by climate change, Nat. Clim. Change, 3, 152–155, https://doi.org/10.1038/nclimate1672, 2013.
Garnett, M. H.: Carbon storage in Pennine moorland and response to change, University of Newcastle upon Tyne, 302 pp., 1998.
Gorham, E.: Northern Peatlands?: Role in the Carbon Cycle and Probable Responses to Climatic Warming, Ecol. Appl., 1, 182–195, 1991.
Heinemeyer, A., Croft, S., Garnett, M. H., Gloor, E., Holden, J., Lomas, M. R., and Ineson, P.: The MILLENNIA peat cohort model: Predicting past, present and future soil carbon budgets and fluxes under changing climates in peatlands, Clim. Res., 45, 207–226, https://doi.org/10.3354/cr00928, 2010.
Hilbert, D. W., Roulet, N., and Moore, T.: Modelling and analysis of peatlands as dynamical systems, J. Ecol., 88, 230–242, 2000.
Hilberts, A. G. J., van Loon, E. E., Troch, P. A., and Paniconi, C.: The hillslope-storage Boussinesq model for non-constant bedrock slope, J. Hydrol., 291, 160–173, https://doi.org/10.1016/J.JHYDROL.2003.12.043, 2004.
Holden, J. and Burt, T. P.: Infiltration, runoff and sediment production in blanket peat catchments: Implications of field rainfall simulation experiments, Hydrol. Process., 16, 2537–2557, 2002.
Holden, J. and Burt, T. P.: Hydraulic conductivity in upland blanket peat: measurement and variability, Hydrol. Process., 17, 1227–1237, https://doi.org/10.1002/hyp.1182, 2003.
Holden, J., Wallage, Z. E., Lane, S. N., and McDonald, A. T.: Water table dynamics in undisturbed, drained and restored blanket peat, J. Hydrol., 402, 103–114, https://doi.org/10.1016/j.jhydrol.2011.03.010, 2011.
Huang, C. C.: Holocene landscape development and human impact in the Connemara Uplands, Western Ireland, J. Biogeogr., 29, 153–165, 2002.
Hunter, Y.: A Holocene paleo-ecological analysis of peat stratigraphy in the Upper-Dee valley (Scotland) and the Dijle catchment (Belgium), KU Leuven, 86 pp., 2016.
Huntley, B.: Late Devensian and Holocene palaeoecology and palaeoenvironments of the Morrone Birkwoods, Aberdeenshire, Scotland, J. Quaternary Sci., 9, 311–336, 1994.
Ingram, H. A. P.: Size and shape in raised mire ecosystems: a geophysical model, Nature, 297, 300–303, https://doi.org/10.1038/297300a0, 1982.
Ingram, H. A. P.: Hydrology, in: Mires: Swamp, Bog, Fen and Moor, A. General Studies, edited by: Gore, A. J. P., Elsevier Scientific Publishing Company, Amsterdam, 67–158, 1983.
Jetten, V., Govers, G., and Hessel, R.: Erosion models: Quality of spatial predictions, Hydrol. Process., 17, 887–900, https://doi.org/10.1002/hyp.1168, 2003.
Jones, P. S., Stevens, D. P., Blackstock, T. H., Burrows, C. R., and Howe, E. A. (Eds.): Priority Habitats of Wales: A Technical Guide, Bangor, 140 pp., 2003.
Kleinen, T., Brovkin, V., and Schuldt, R. J.: A dynamic model of wetland extent and peat accumulation: Results for the Holocene, Biogeosciences, 9, 235–248, https://doi.org/10.5194/bg-9-235-2012, 2012.
Lafleur, P. M., Hember, R. A., Admiral, S. W., and Roulet, N. T.: Annual and seasonal variability in evapotranspiration and water table at a shrub-covered bog in southern Ontario, Canada, Hydrol. Process., 19, 3533–3550, https://doi.org/10.1002/hyp.5842, 2005.
Lieth, H.: Primary production: Terrestrial ecosystems, Hum. Ecol., 1, 303–332, 1973.
Lieth, H. and Box, E. O.: Evapotranspiration and primary productivity, Publ. Climatol., 25, 37–46, 1972.
Lindsay, R.: Bogs: The Ecology, Classification and Conservation of Ombrotrophic Mires, 124 pp., 1995.
Lucchese, M., Waddington, J. M., Poulin, M., Pouliot, R., Rochefort, L., and Strack, M.: Organic matter accumulation in a restored peatland: Evaluating restoration success, Ecol. Eng., 36, 482–488, https://doi.org/10.1016/j.ecoleng.2009.11.017, 2010.
Maizels, J.: The physical background of the River Dee, in: The biology and management of the river Dee, edited by: Jenkins, D., Huntingdon, 7–22, 1985.
Malmer, N. and Wallen, B.: Input rates, decay losses and accumulation rates of carbon in bogs during the last millennium: internal processes and environmental changes, The Holocene, 14, 111–117, 2004.
Maurer, E.: Spatial variation in organic carbon storage in Holocene floodplain soils, Msc thesis, 132 pp., 2015.
Mauri, A., Davis, B. A. S., Collins, P. M., and Kaplan, J. O.: The climate of Europe during the Holocene: A gridded pollen-based reconstruction and its multi-proxy evaluation, Quaternary Sci. Rev., 112, 109–127, https://doi.org/10.1016/j.quascirev.2015.01.013, 2015.
Mazier, F., Gaillard, M. J., Kuneš, P., Sugita, S., Trondman, A. K., and Broström, A.: Testing the effect of site selection and parameter setting on REVEALS-model estimates of plant abundance using the Czech Quaternary Palynological Database, Rev. Palaeobot. Palynol., 187, 38–49, https://doi.org/10.1016/j.revpalbo.2012.07.017, 2012.
Met Office: Met Office Integrated Data Archive System (MIDAS) Land and Marine Surface Stations Data (1853-current), available at: http://catalogue.ceda.ac.uk/uuid/220a65615218d5c9cc9e4785a3234bd0 (last access: 16 January 2019), 2012.
Moore, P. D.: The Influence of Prehistoric Cultures upon the Initiation and Spread of Blanket Bog in Upland Wales, Nature, 241, 350–353, 1973.
Morris, P. J., Baird, A. J., and Belyea, L. R.: The DigiBog peatland development model 2: ecohydrological simulations in 2D, Ecohydrology, 5, 256–268, https://doi.org/10.1002/eco.2, 2012.
Morris, P. J., Baird, A. J., Young, D. M., and Swindles, G. T.: Untangling climate signals from autogenic changes in long-term peatland development, Geophys. Res. Lett., 42, 10788–10797, https://doi.org/10.1002/2015GL066824, 2015.
Morris, P. J., Swindles, G. T., Valdes, P. J., Ivanovic, R. F., Gregoire, L. J., Smith, M. W., Tarasov, L., Haywood, A. M., and Bacon, K. L.: Global peatland initiation driven by regionally asynchronous warming, P. Natl. Acad. Sci. USA, 115, 4851–4856, https://doi.org/10.1073/pnas.1717838115, 2018.
Paniconi, C., Troch, P. A., Van Loon, E. E., and Hilberts, A. G. J.: Hillslope-storage Boussinesq model for subsurface flow and variable source areas along complex hillslopes: 2. Intercomparison with a three-dimensional Richards equation model, Water Resour. Res., 39, 1317, https://doi.org/10.1029/2002WR001730, 2003.
Parry, L. E., Charman, D. J., and Noades, J. P. W.: A method for modelling peat depth in blanket peatlands, Soil Use Manag., 28, 614–624, https://doi.org/10.1111/j.1475-2743.2012.00447.x, 2012.
Paterson, D.: The Holocene history of Pinus sylvestris woodland in the Mar Lodge Estate, Cairngorms, Eastern Scotland, University of Stirling, 363 pp., 2011.
Peeters, I., Rommens, T., Verstraeten, G., Govers, G., Van Rompaey, A., Poesen, J., and Van Oost, K.: Reconstructing ancient topography through erosion modelling, Geomorphology, 78, 250–264, https://doi.org/10.1016/j.geomorph.2006.01.033, 2006.
Reimer, P. J., Bard, E., Bayliss, A., Beck, J. W., Blackwell, P. G., Ramsey, C. B., Buck, C. E., Cheng, H., Edwards, R. L., Friedrich, M., Grootes, P. M., Guilderson, T. P., Haflidason, H., Hajdas, I., Hatté, C., Heaton, T. J., Hoffmann, D. L., Hogg, A. G., Hughen, K. A., Kaiser, K. F., Kromer, B., Manning, S. W., Niu, M., Reimer, R. W., Richards, D. A., Scott, E. M., Southon, J. R., Staff, R. A., Turney, C. S. M., and van der Plicht, J.: IntCal13 and Marine13 Radiocarbon Age Calibration Curves 0–50,000 Years cal BP, Radiocarbon, 55, 1869–1887, 2013.
Rosa, E. and Larocque, M.: Investigating peat hydrological properties using field and laboratory methods: application to the Lanoraie peatland complex (southern Quebec, Canada), Hydrol. Process., 22, 1866–1875, https://doi.org/10.1002/hyp, 2008.
Rosswall, T.: Decomposition of plant litter at Stordalen – a summary, in: International Biological Programme: Swedish tundra biome progress report 14, 124–133, 1973.
Simmons, I. G. and Innes, J. B.: Late Quaternary vegetational history of the North York Moors. VIII. Correlation of Flandrian II litho- and pollen stratigraphy at North Gill, Glaisdale Moor, J. Biogeogr., 15, 249–272, 1988.
Smith, J. S.: Land use within the catchment of the river Dee, in: The biology and management of the river Dee, edited by: D. Jenkins, Huntingdon, 29–33, 1985.
Sugita, S.: Theory of quantitative reconstruction of vegetation I: Pollen from large sites REVEALS regional vegetation composition, Holocene, 17, 229–241, https://doi.org/10.1177/0959683607075837, 2007.
Swinnen, W.: Soil coring list, https://doi.org/10.17632/pxszz2wzny.1, 2019a.
Swinnen, W.: Soil coring description, https://doi.org/10.17632/ms484mrjj5.1, 2019b.
Szumigalski, A. R. and Bayley, S. E.: Net aboveground primary production along a peatland gradient in central Alberta in relation to environmental factors, Ecoscience, 4, 385–393, https://doi.org/10.1080/11956860.1997.11682417, 1997.
Tetzlaff, D. and Soulsby, C.: Sources of baseflow in larger catchments – Using tracers to develop a holistic understanding of runoff generation, J. Hydrol., 359, 287–302, https://doi.org/10.1016/j.jhydrol.2008.07.008, 2008.
Tipping, R.: Blanket peat in the Scottish Highlands: Timing, cause, spread and the myth of environmental determinism, Biodivers. Conserv., 17, 2097–2113, https://doi.org/10.1007/s10531-007-9220-4, 2008.
Treat, C. C., Kleinen, T., Broothaerts, N., Dalton, A. S., Dommain, R., Douglas, T. A., Drexler, J. Z., Finkelstein, S. A., Grosse, G., Hope, G., Hutchings, J., Jones, M. C., Kuhry, P., Lacourse, T., Lähteenoja, O., Loisel, J., Notebaert, B., Payne, R. J., Peteet, D. M., Sannel, A. B. K., Stelling, J. M., Strauss, J., Swindles, G. T., Talbot, J., Tarnocai, C., Verstraeten, G., Williams, C. J., Xia, Z., Yu, Z., Väliranta, M., Hättestrand, M., Alexanderson, H., and Brovkin, V.: Widespread global peatland establishment and persistence over the last 130,000 y, P. Natl. Acad. Sci. USA, 116, 4822–4827, https://doi.org/10.1073/pnas.1813305116, 2019.
Trondman, A. K., Gaillard, M. J., Sugita, S., Björkman, L., Greisman, A., Hultberg, T., Lagerås, P., Lindbladh, M., and Mazier, F.: Are pollen records from small sites appropriate for REVEALS model-based quantitative reconstructions of past regional vegetation? An empirical test in southern Sweden, Veg. Hist. Archaeobot., 25, 131–151, https://doi.org/10.1007/s00334-015-0536-9, 2016.
Van Rompaey, A. J. J. and Govers, G.: Data quality and model complexity for regional scale soil erosion prediction, Int. J. Geogr. Inf. Sci., 16, 663–680, https://doi.org/10.1080/13658810210148561, 2002.
Warren, G., Fraser, S., Clarke, A., Driscoll, K., Mitchell, W., Noble, G., Paterson, D., Schulting, R., Tipping, R., Verbaas, A., Wilson, C., and Wickham-Jones, C.: Little House in the Mountains? A small Mesolithic structure from the Cairngorm Mountains, Scotland, J. Archaeol. Sci. Rep., 18, 936–945, https://doi.org/10.1016/j.jasrep.2017.11.021, 2018.
Wieder, R. K. and Yavitt, J. B.: Peatlands and global climate change: Insights from comparative studies of sites situated along a latitudinal gradient, Wetlands, 14, 229–238, https://doi.org/10.1007/BF03160660, 1994.
Williams, J. R., Dyke, P. T., and Jones, C. A.: EPIC – A model for assessing the effects of erosion on soil productivity, in: Analysis of Ecological Systems: State-of-the-Art in Ecological Modelling, edited by: Lauenroth, W. K., Skogerboe, G. V., and Flug, M., Elsevier, p. 971, 1983.
Wu, J.: Response of peatland development and carbon cycling to climate change: A dynamic system modeling approach, Environ. Earth Sci., 65, 141–151, https://doi.org/10.1007/s12665-011-1073-1, 2012.
Xu, J., Morris, P. J., Liu, J., and Holden, J.: PEATMAP: Refining estimates of global peatland distribution based on a meta-analysis, Catena, 160, 134–140, https://doi.org/10.1016/j.catena.2017.09.010, 2018.
Yu, Z., Turetsky, M. R., Campbell, I. D., and Vitt, D. H.: Modelling long-term peatland dynamics. II. Processes and rates as inferred from litter and peat-core data, Ecol. Modell., 145, 159–173, https://doi.org/10.1016/S0304-3800(01)00387-8, 2001.
Yu, Z., Beilman, D. W., Frolking, S., MacDonald, G. M., Roulet, N. T., Camill, P., and Charman, D. J.: Peatlands and Their Role in the Global Carbon Cycle, Eos, Trans. Am. Geophys. Union, 92, 97, https://doi.org/10.1029/2011EO120001, 2011.