the Creative Commons Attribution 4.0 License.
the Creative Commons Attribution 4.0 License.
 | 11 Feb 2019
Multi-year effect of wetting on CH4 flux at taiga–tundra boundary in northeastern Siberia deduced from stable isotope ratios of CH4
Ryo Shingubara
Atsuko Sugimoto
Jun Murase
Go Iwahana
Shunsuke Tei
Maochang Liang
Shinya Takano
Tomoki Morozumi
Trofim C. Maximov
The response of CH4 emission from natural wetlands due to meteorological conditions is important because of its strong greenhouse effect. To understand the relationship between CH4 flux and wetting, we observed interannual variations in chamber CH4 flux, as well as the concentration, δ13C, and δD of dissolved CH4 during the summer from 2009 to 2013 at the taiga–tundra boundary in the vicinity of Chokurdakh (70∘37′ N, 147∘55′ E), located on the lowlands of the Indigirka River in northeastern Siberia. We also conducted soil incubation experiments to interpret δ13C and δD of dissolved CH4 and to investigate variations in CH4 production and oxidation processes. Methane flux showed large interannual variations in wet areas of sphagnum mosses and sedges (36–140 mg CH4 m−2 day−1 emitted). Increased CH4 emission was recorded in the summer of 2011 when a wetting event with extreme precipitation occurred. Although water level decreased from 2011 to 2013, CH4 emission remained relatively high in 2012, and increased further in 2013. Thaw depth became deeper from 2011 to 2013, which may partly explain the increase in CH4 emission. Moreover, dissolved CH4 concentration rose sharply by 1 order of magnitude from 2011 to 2012, and increased further from 2012 to 2013. Large variations in δ13C and δD of dissolved CH4 were observed in 2011, and smaller variations were seen in 2012 and 2013, suggesting both enhancement of CH4 production and less significance of CH4 oxidation relative to the larger pool of dissolved CH4. These multi-year effects of wetting on CH4 dynamics may have been caused by continued soil reduction across multiple years following the wetting. Delayed activation of acetoclastic methanogenesis following soil reduction could also have contributed to the enhancement of CH4 production. These processes suggest that duration of water saturation in the active layer can be important for predicting CH4 emission following a wetting event in the permafrost ecosystem.
- Article
(3277 KB) - Full-text XML
-
Supplement
(619 KB) - BibTeX
- EndNote


Atmospheric CH4 has an important greenhouse effect (Myhre et al., 2013). The largest source of atmospheric CH4 is the emission from natural wetlands, which is considered to be the main driver of interannual variations in the global CH4 emission, depending on meteorological conditions such as air temperature and precipitation (Ciais et al., 2013). For instance, Dlugokencky et al. (2009) reported that high temperatures in the Arctic and high precipitation in the tropics led to high CH4 emissions from natural wetlands, which caused the observed large growth rates in atmospheric CH4 concentration during 2007 and 2008. Atmospheric CH4 has been increasing from 2007 through the present (Nisbet et al., 2014).
Methane flux from wetland soil to the atmosphere (we define a positive flux value as CH4 emission) is determined by three processes: CH4 production, oxidation, and transport (Lai, 2009). Methane is produced by strictly anaerobic Archaea (methanogens) mainly via hydrogenotrophic methanogenesis () or acetoclastic methanogenesis () as an end product of organic matter decomposition (Lai, 2009). In the soil's aerobic zone, CH4 is oxidized to CO2 by methanotrophic bacteria utilizing O2, which reduces CH4 emission to the atmosphere (Lai, 2009). Underground CH4 is transported to the atmosphere via bubble ebullition, diffusion through soil layers and surface water, and via aerenchyma of vascular plants (Lai, 2009).
High water levels can lead to development of reducing conditions in soil, which can promote CH4 production or depress CH4 oxidation, both leading to increases in CH4 flux (Lai, 2009). This is reflected in the widely observed positive relationship between water level and CH4 flux, found in a meta-analysis across the circum-Arctic permafrost zone (Olefeldt et al., 2013). Meanwhile, Desyatkin et al. (2014) observed increases in CH4 flux during the second consecutive year of flooding at a thermokarst depression in boreal eastern Siberia. Treat et al. (2007) reported observations at a temperate fen in the northeastern USA, showing that high water level coincided with high CH4 flux in interannual variations. However, water level correlated negatively with CH4 flux over shorter timescales, namely as monthly means or individual measurements. These observational results imply that wetting is not directly related to CH4 flux in wetlands. To understand the relationship between wetting and CH4 flux, it is necessary to assess the underlying processes.
Stable isotopes of CH4 have been used to estimate production pathways of CH4 (Sugimoto and Wada, 1993, 1995; McCalley et al., 2014; Itoh et al., 2015), determine the fraction of oxidized CH4 versus produced CH4 (Marik et al., 2002; Preuss et al., 2013), and study mechanisms of CH4 transport by plants (Chanton, 2005). When CH4 in soil is lost by oxidation or diffusion, both δ13C and δD of the remaining CH4 increase. While the hydrogen isotope ratio increases more than that of carbon during oxidation, both ratios are considered to change to the same extent during diffusion. Thus it is useful to analyze both carbon and hydrogen isotopes of CH4 to distinguish the effects of both of these processes (Chanton, 2005).
The taiga–tundra boundary ecosystem (or transition zone) contains vegetation types of both taiga and tundra ecosystems. Liang et al. (2014) reported that the distribution of vegetation types at the taiga–tundra boundary on the lowland of the Indigirka River in northeastern Siberia is controlled by soil moisture, which corresponds to microtopography. Larches, the dominant tree species in the taiga forests of eastern Siberia, grow on microreliefs with higher ground level and drier soil, while wetland vegetation such as sphagnum mosses and sedges, typically seen in wet tundra (van Huissteden et al., 2005; van der Molen et al., 2007), dominates lower and wetter microreliefs. Thus, it is reasonable to assume that the taiga–tundra boundary ecosystem has various microreliefs in terms of interannual variation in soil wetness conditions: always wet microreliefs, always dry microreliefs, and microreliefs with large interannual wetness variations. Hence, this ecosystem is a suitable area to evaluate the processes controlling CH4 flux in relation to soil wetting and/or drying on an interannual timescale.
In this study, to understand relationships between CH4 flux and environmental factors, we observed interannual variations in chamber CH4 flux, along with the concentration, δ13C, and δD of dissolved CH4 during the summer, from 2009 to 2013, at the taiga–tundra boundary located on Indigirka River lowlands in northeastern Siberia. We also conducted soil incubation experiments to investigate how δ values of CH4 reflect CH4 production and oxidation processes in this ecosystem. In 2011, a wetting event with a significant amount of precipitation occurred. We focused in particular on the responses of CH4 flux and other underlying processes to this unusual wetting event.
2.1 Study sites
The taiga–tundra boundary on the lowlands of the Indigirka River was selected as our study area. Observations and sampling were conducted at three sites (V: Verkhny Khatistakha; K: Kodac; B: Boydom) in the vicinity of Chokurdakh (70∘37′ N, 147∘55′ E), Republic of Sakha (Yakutia), Russia (Fig. 1 and Table 1). The sites are located in the Russian Arctic with an annual mean air temperature of −13.9 ∘C and an annual mean precipitation of 208 mm for the period of 1950–2008, according to the Baseline Meteorological Data in Siberia database (Yabuki et al., 2011). Sites V, K, and B are beside the Indigirka River or its tributary, and tree density decreases from site V to site B.
Table 1Observation points of chamber CH4 flux. Concentration and isotopic compositions of dissolved CH4 were also observed in the following wet areas.

a Site K was previously named Kryvaya (Iwahana et al., 2014) or Kodak (Liang et al., 2014). b Observed for the surface soil layer down to 20 cm on 1 to 3 days in July 2011 at each observation point (see Table S2 for detailed observation dates). Standard deviations are shown. c Observed from early July to early August during 2010–2013 (see Table S1 for the interannual variation and Table S2 for detailed observation dates). Standard deviations are shown.

Figure 1Locations of study sites. (a) Location of study region in northeastern Siberia (the Generic Mapping Tools 5.0.0). (b) Satellite image of Indigirka River lowland around Chokurdakh village (Ckh: 70∘37′ N, 147∘55′ E) from Landsat 8. Observation sites (V, K, B) were selected in this region beside the main stem and a tributary of the Indigirka River.
These study sites are underlain by continuous permafrost (Iwahana et al., 2014). Normally, snowmelt and the start of active layer thawing begin in the latter half of May through the first half of June, and the growing season occurs from the end of June through the beginning of August. Air temperature and surface soil temperature (10 cm in depth) peak in July, whereas the maximum thaw depth occurs from the latter half of August to the first half of September. The freezing of the active layer starts in the latter half of September to October and the whole active layer freezes from November to December.
Observations of CH4 flux were conducted at seven points with three typical vegetation types, as summarized in Table 1. These vegetation types are distributed in patches, corresponding to microtopography and soil moisture (Liang et al., 2014). Microrelief with a higher ground level is covered by green moss, larch trees, and shrubs of willows or dwarf birches. Conversely, lower microrelief is covered by wetland vegetation of sphagnum moss or sedges. In this study, the former vegetation type was termed “tree mound”, and the latter type was termed “wet area”. Observation points in tree mounds were selected at each of the sites V, K, and B and termed “tree mound_V”, “tree mound_K”, and “tree mound_B” (Table 1). For observation points of wet areas, a microrelief covered by sphagnum moss at site K was termed “sphagnum_K”, and points covered by sedges including, in particular, cotton sedges (Eriophorum angustifolium) at sites V, K, and B were termed “sedge_V”, “sedge_K”, and “sedge_B”, respectively. Measurements of volumetric water content in the surface soil layer (0–20 cm) by TDR (time domain reflectometry; TDR-341F, Fujiwara Scientific Company, Japan) showed that tree mounds were drier than wet areas; this will be described in Sect. 3.1 (Table 1).
2.2 Field observations and samplings
Methane flux was observed using the chamber method in each of the typical vegetation types described in Sect. 2.1 during the summer from 2009 to 2013. A transparent cylindrical flux chamber (acrylic resin, base area 4.7×102 cm2, height 25 cm) was installed on the ground. The headspace gas of the chamber (ca. 12 L) was circulated with a pump (ca. 1 L min−1). The chamber was closed for 15–30 min and headspace gas was sampled two to three times after chamber closure. In most cases, the chamber was closed for 30 min and headspace gas was collected at 0, 15, and 30 min after closure. Samples were kept in pre-evacuated glass vials with butyl rubber septa. To minimize soil disturbance, we stepped on wooden boards at observation points. In 2009 and 2010, CH4 flux measurements were conducted in the latter half of July, and from 2011 to 2013 observations were conducted continuously from early July to the end of July or early August. For all of these years, the observation period included the warmest season when CH4 emission was expected to be the most active (Table S2).
For measurements of dissolved CH4, surface water and soil pore water were sampled in wet areas from 2011 to 2013. Surface water was directly taken up by a 50 mL plastic syringe with a three-way cock attached to its tip, whereas soil pore water was sampled by a 50 mL syringe (with a three-way cock attached) through a plastic tube inserted in the soil. Soon after collecting water samples, dissolved CH4 was extracted inside the syringes with the headspace method, after adding 15–35 mL of the atmosphere prepared in a 10 L aluminum bag. This atmosphere was collected beforehand at Chokurdakh village or our observation sites and filtered using Molecular Sieves 5Å (1∕16 pellets, FUJIFILM Wako Pure Chemical Corporation, Japan). The atmosphere was analyzed later for CH4 concentration and isotopic compositions as a background sample (2.0–4.3 ppm for CH4 concentration, −53 ‰ to −45 ‰ for δ13C of CH4, and −168 ‰ to −78 ‰ for δD of CH4). The syringes were vigorously shaken for 1 min and left standing for 5 min to ensure equilibration. Finally, headspace gas in the syringes was preserved in 10–20 mL pre-evacuated glass vials with rubber septa.
Concurrently with each flux measurement, soil temperature around the flux chamber was measured with a temperature sensor in an ORP electrode (PST-2739C, DKK-TOA Corporation, Japan) with an ORP meter (RM-30P or RM-20P). After flux measurement samples were collected, thaw depth was observed on the same day around each chamber by inserting a steel rod into the ground. From 2011 on, water level was also measured after flux measurements around each chamber in wet areas using a scale. The water level was expressed as height relative to the ground surface or the moss surface. Observation dates of these environmental factors are shown in Table S2.
2.3 Soil incubation experiments and microbial community analysis
Soil incubation experiments were conducted to estimate δ13C and δD of produced CH4 and fractionation factors of CH4 oxidation for carbon and hydrogen isotopes. For CH4 production experiments, surface soil was sampled in all the wet areas in Table 1 (sedge_V, sphagnum_K, sedge_K, and sedge_B) during summer 2013. Samples were taken at 10 cm in depth at each sampling location. To observe vertical variations in δ values of produced CH4 within the thaw layer, we also collected samples from two additional depths (20 and 30 cm) at sedge_K, which is a location typical of the taiga–tundra boundary region. These samples were from organic layers, except for the samples from 30 cm, which were from the top of the mineral layer.
Approximately 10 mL of soil was directly transferred into each plastic syringe (60 mL maximum capacity) along with in situ water (approximately 50 mL) to prevent the sample from being oxidized by the atmosphere. Syringes were preserved in water to ensure no leakage and were immediately preincubated for 4–8 days and then incubated in triplicate for 8 days. Preincubation and incubation temperatures were set at 5 ∘C. We also incubated syringes at 10 ∘C for samples from 10 cm in depth at sedge_K to investigate temperature dependence of δ values of produced CH4. For each of these seven incubation treatments (sphagnum_K, sedge_V, sedge_K, and sphagnum_K, 10 cm in depth, 5 ∘C; sedge_K, 20 and 30 cm in depth, 5 ∘C; sedge_K, 10 cm in depth, 10 ∘C), three replicate soil samples were prepared. Water in each incubation syringe was sampled twice at the start and the end of incubation, and dissolved CH4 was extracted using the headspace method described in Sect. 2.2. As a consequence, dissolved CH4 samples were collected in triplicate for each of the initial and final conditions of one incubation treatment.
To interpret CH4 production in the incubation experiments (Sect. 2.3), phylogenic composition of methanogens in the surface soil was additionally analyzed in 2016 using 16S rRNA gene sequencing. In July 2016, soil samples from 10 cm in depth were collected in 10 mL plastic tubes in triplicate in the same four wet areas as the anaerobic incubation experiments and kept frozen until analysis. DNA was extracted from 3 g of the soil samples as described by Ikeda et al. (2004). Extracted DNA was purified using the OneStep™ PCR Inhibitor Removal Kit (Zymo Research, California) and quantified using the Quant-iT PicoGreen dsDNA assay kit (Invitrogen, Carlsbad, California). Amplicon sequencing was conducted targeting the V3–V4 regions of 16S rRNA genes (Caporaso et al., 2011). Sequences obtained were processed through the QIIME pipeline (Caporaso et al., 2010). A representative sequence was picked from each operational taxonomic unit (OTU), and the Greengenes reference database (version 13.8) was used to assign taxonomic information and calculate the relative abundance of methanogenic archaea present.
For CH4 oxidation, surface organic layers (0–13 cm in depth) were sampled at sphagnum_K and sedge_K in July 2012 and then kept in a refrigerator until the experiment (6 days). These soil samples were cut into small pieces and mixed well with air. A total of 10 g (about 40 mL) of soil sample was transferred into plastic syringes (maximum 120 mL) in quadruplicate for each sampling location. Approximately 80 mL of air and 0.2–2 mL of 25 % CH4 gas were added to each syringe so the total volume in each syringe was 120 mL and the headspace CH4 concentration was 5.0×10²–4.8×10³ ppm. Syringes were preserved in water and incubated at 8 ∘C for 8 days. Headspace gas was sampled on day 0, day 4, and day 8 from each syringe into 20 mL pre-evacuated glass vials with rubber septa. Consequently, quadruplicate gas samples were collected for each location and each sampling day.
2.4 Sample analysis and data processing
Methane concentrations in air samples were analyzed using a gas chromatograph (HP6890 series G1530A, Hewlett Packard, USA) equipped with a flame ionization detector and a CP-carboPLOT capillary column (Varian, USA). Methane flux was calculated from CH4 concentration in chamber headspace by a linear regression of two to three concentration values against the time elapsed since chamber closure. The detection limit of CH4 flux for each observation was calculated as 0.8–2.4 mg CH4 m−2 day−1, based on whether the change of chamber CH4 concentration during the observation was significant relative to the precision of CH4 concentration analysis. Regression r2 was calculated (formally) as ≥0.87, when the flux value was larger than 2 mg CH4 m−2 day−1. Dissolved CH4 concentrations were obtained from calculation of the headspace method for which equilibrations of CH4 between gas and water phases are described by the Bunsen absorption coefficient of CH4 (Yamamoto et al., 1976).
Carbon and hydrogen isotope ratios of in situ dissolved CH4 and CH4 samples from both incubation experiments were analyzed on a GC–GC–C–IRMS (modified after Sugimoto, 1996) – which is a continuous flow system consisting of two gas chromatographs, a combustion reactor, and an isotope ratio mass spectrometer (MAT253, Thermo Fisher Scientific, USA) – and on a GC–GC–P–IRMS (P: pyrolysis in a HTC reactor of GC IsoLink, Thermo Fisher Scientific), respectively. Carbon and hydrogen isotope ratios obtained were represented relative to Vienna Peedee Belemnite (VPDB) and Vienna Standard Mean Ocean Water (VSMOW), respectively. Precisions of the analyses were ±0.2 ‰ and ±2 ‰ for δ13C and δD, respectively. When calculating δ13C and δD of dissolved CH4, the effect of CH4 in background air was removed based on the mass balance. In the aerobic incubation experiments, the fractionation factors of CH4 oxidation for carbon and hydrogen were calculated using the following Rayleigh distillation equation:
where R0 and Rt represent isotope ratios under initial conditions and at time t, respectively; αox is the fractionation factor for CH4 oxidation (defined so that αox>1); and [CH4]0 and [CH4]t are CH4 concentrations under initial conditions and at time t, respectively.
All statistical tests for detecting differences in CH4 fluxes or dissolved CH4 concentrations were conducted using R software (version 3.3.3). Mann–Whitney's U test was applied to compare magnitudes between 2 years of data and Steel–Dwass's multiple comparison test was used to compare magnitudes among 3 years or more of data.
2.5 Meteorological data
Air temperature and precipitation observed at a weather station in Chokurdakh (WMO station 21946) were used to investigate interannual variations in meteorological conditions during our observation period of CH4 flux (2009–2013) and during the preceding 2 years (2007–2008). The distance between the weather station and our farthest observation site (site V) is approximately 45 km (Fig. 1). These data were obtained from GHCN-Daily, a NOAA database (Menne et al., 2012a, b).
3.1 Environmental factors
Soil wetness conditions and thaw depth differed among vegetation types (Table 1). Tree mounds had lower surface water content (2.1 %–17 %) than wet areas (42 %–48 %). Among the two types of wet areas, the water level was lower in wet areas of sphagnum mosses than those of sedges (Fig. 2). Wet areas of sedges experienced water levels higher than the ground surface (defined as 0 cm), reaching more than 10 cm above the ground surface. Corresponding with soil water content, the thaw depth was shallower at dry tree mounds (20–23 cm) and deeper in wet areas (31–56 cm). In wet areas, thaw depth became deeper from 2011 (22±4 cm) to 2012 (25±8 cm) and 2013 (35±7 cm) in observations made during mid-July (Table S1 in the Supplement). The overall average thaw depth observed on days when flux measurements were taken was 31±12 cm (n=77, 9–58 cm between 3 July and 9 August).
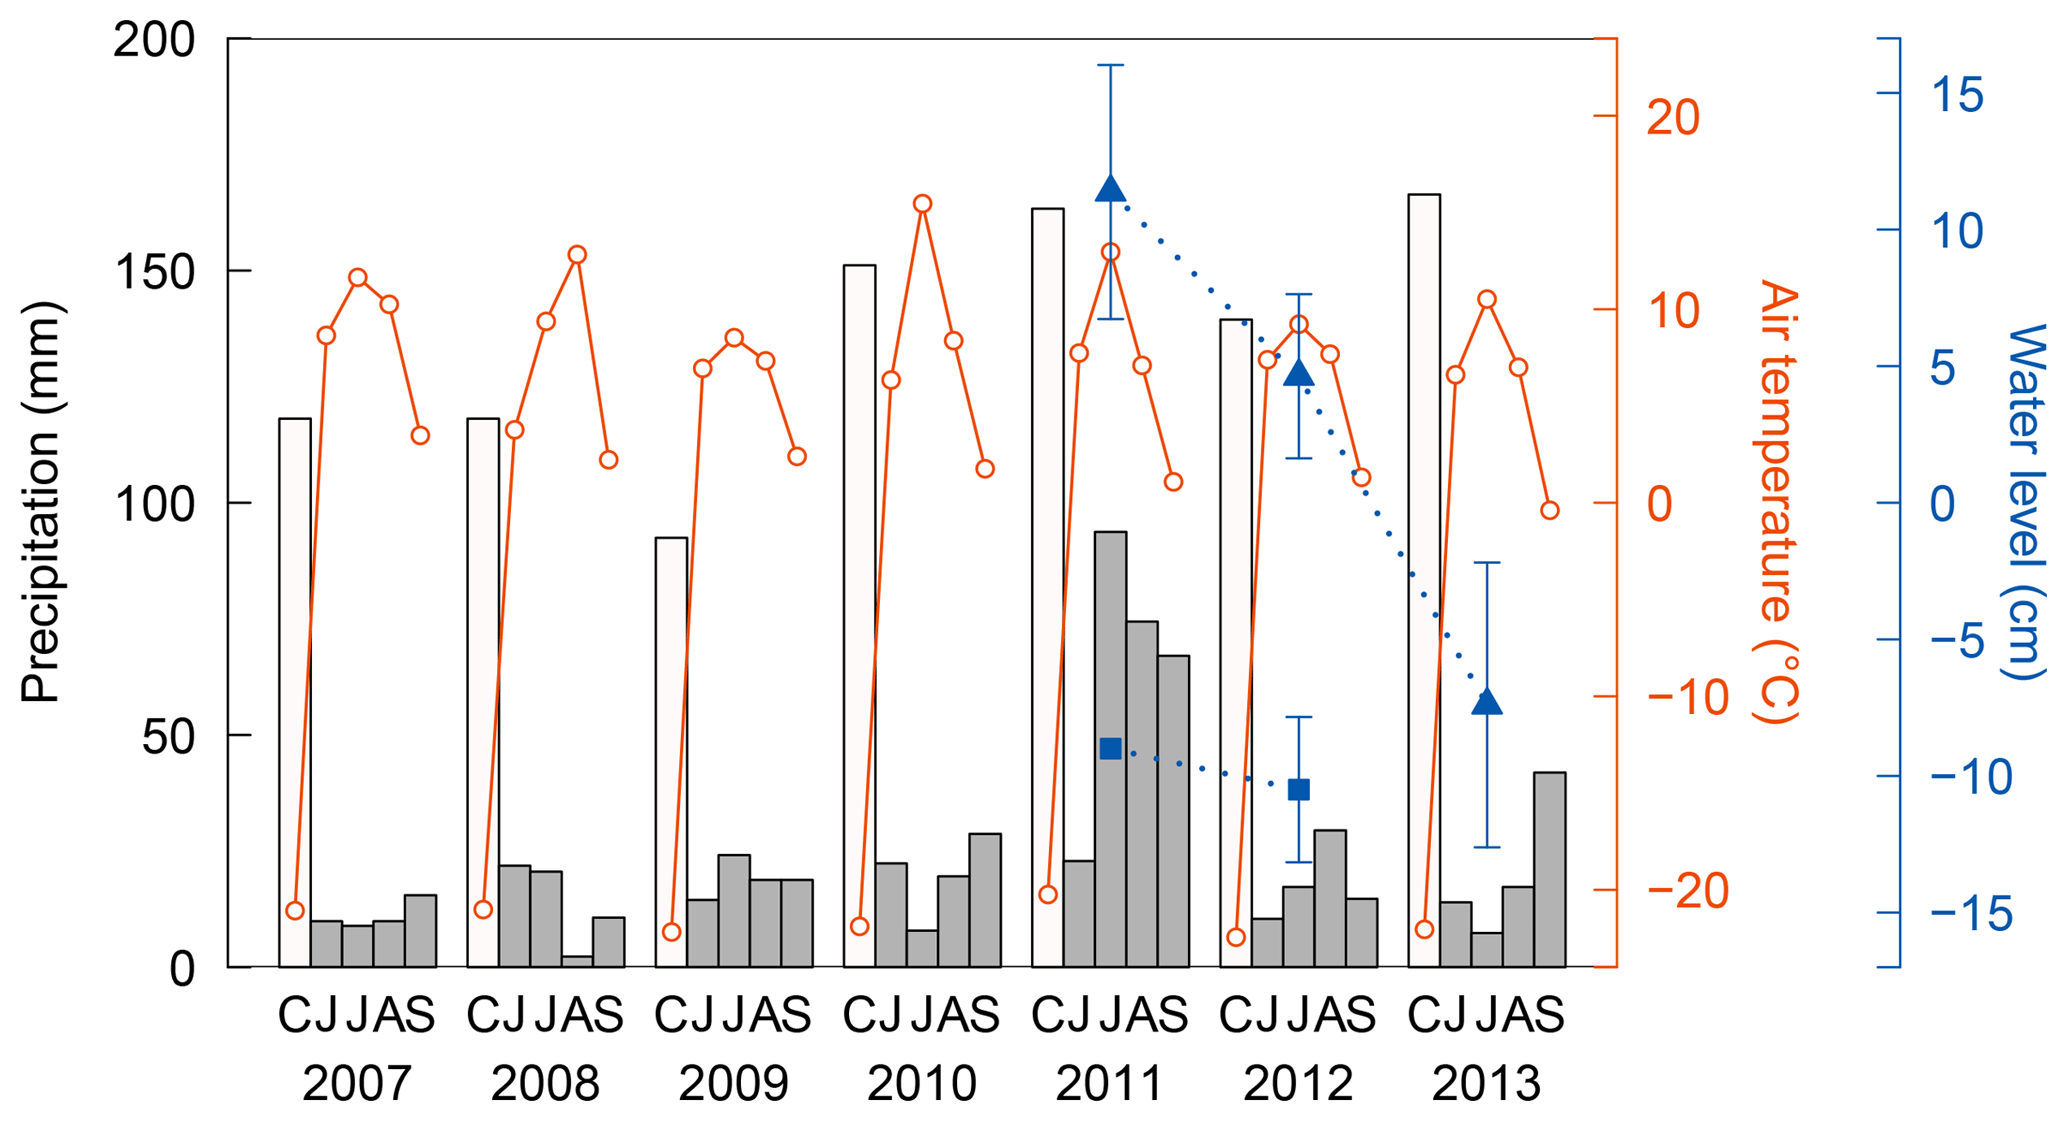
Figure 2Interannual variations in precipitation (bars) and air temperature (solid lines) observed at a weather station at Chokurdakh for the cold season with snow cover (C: total from October in the previous year to May in the current year) and the warm season (JJAS), and water level (dotted lines) measured in wet areas of sedges (triangle) and sphagnum mosses (square). Water level was very low ( cm) in the wet area of sphagnum in 2013 and could not be measured. Error bars represent standard deviations. Methane flux was observed during the main summers (early July to early August) from 2009 to 2013.
Figure 2 shows persistently low annual precipitation (162–173 mm) from 2007 to 2009. In 2010, July air temperature was characteristically high (15.5 ∘C) accompanying low monthly precipitation (8 mm). These show dry conditions during our flux observations in 2009 and 2010. Parmentier et al. (2011) reported that water level was lower in summer 2009 than the previous two summers at a tundra research station (Kytalyk) in the vicinity, approximately 30 km to the northwest of Chokurdakh. In contrast, precipitation in July 2011 was extremely high (94 mm) with a relatively mild temperature (13.0 ∘C), which caused an unusual wetting. High precipitation continued in August (74 mm) and September (67 mm) of the same year. Corresponding with this heavy rainfall, water levels were also high in 2011, and subsequent observations show a clear decrease from 2011 to 2013 in wet areas of sedges (p<0.005). Water levels also declined in wet area of sphagnum mosses, with values of −9, −10 cm, and less than −12 cm in 2011–2013.
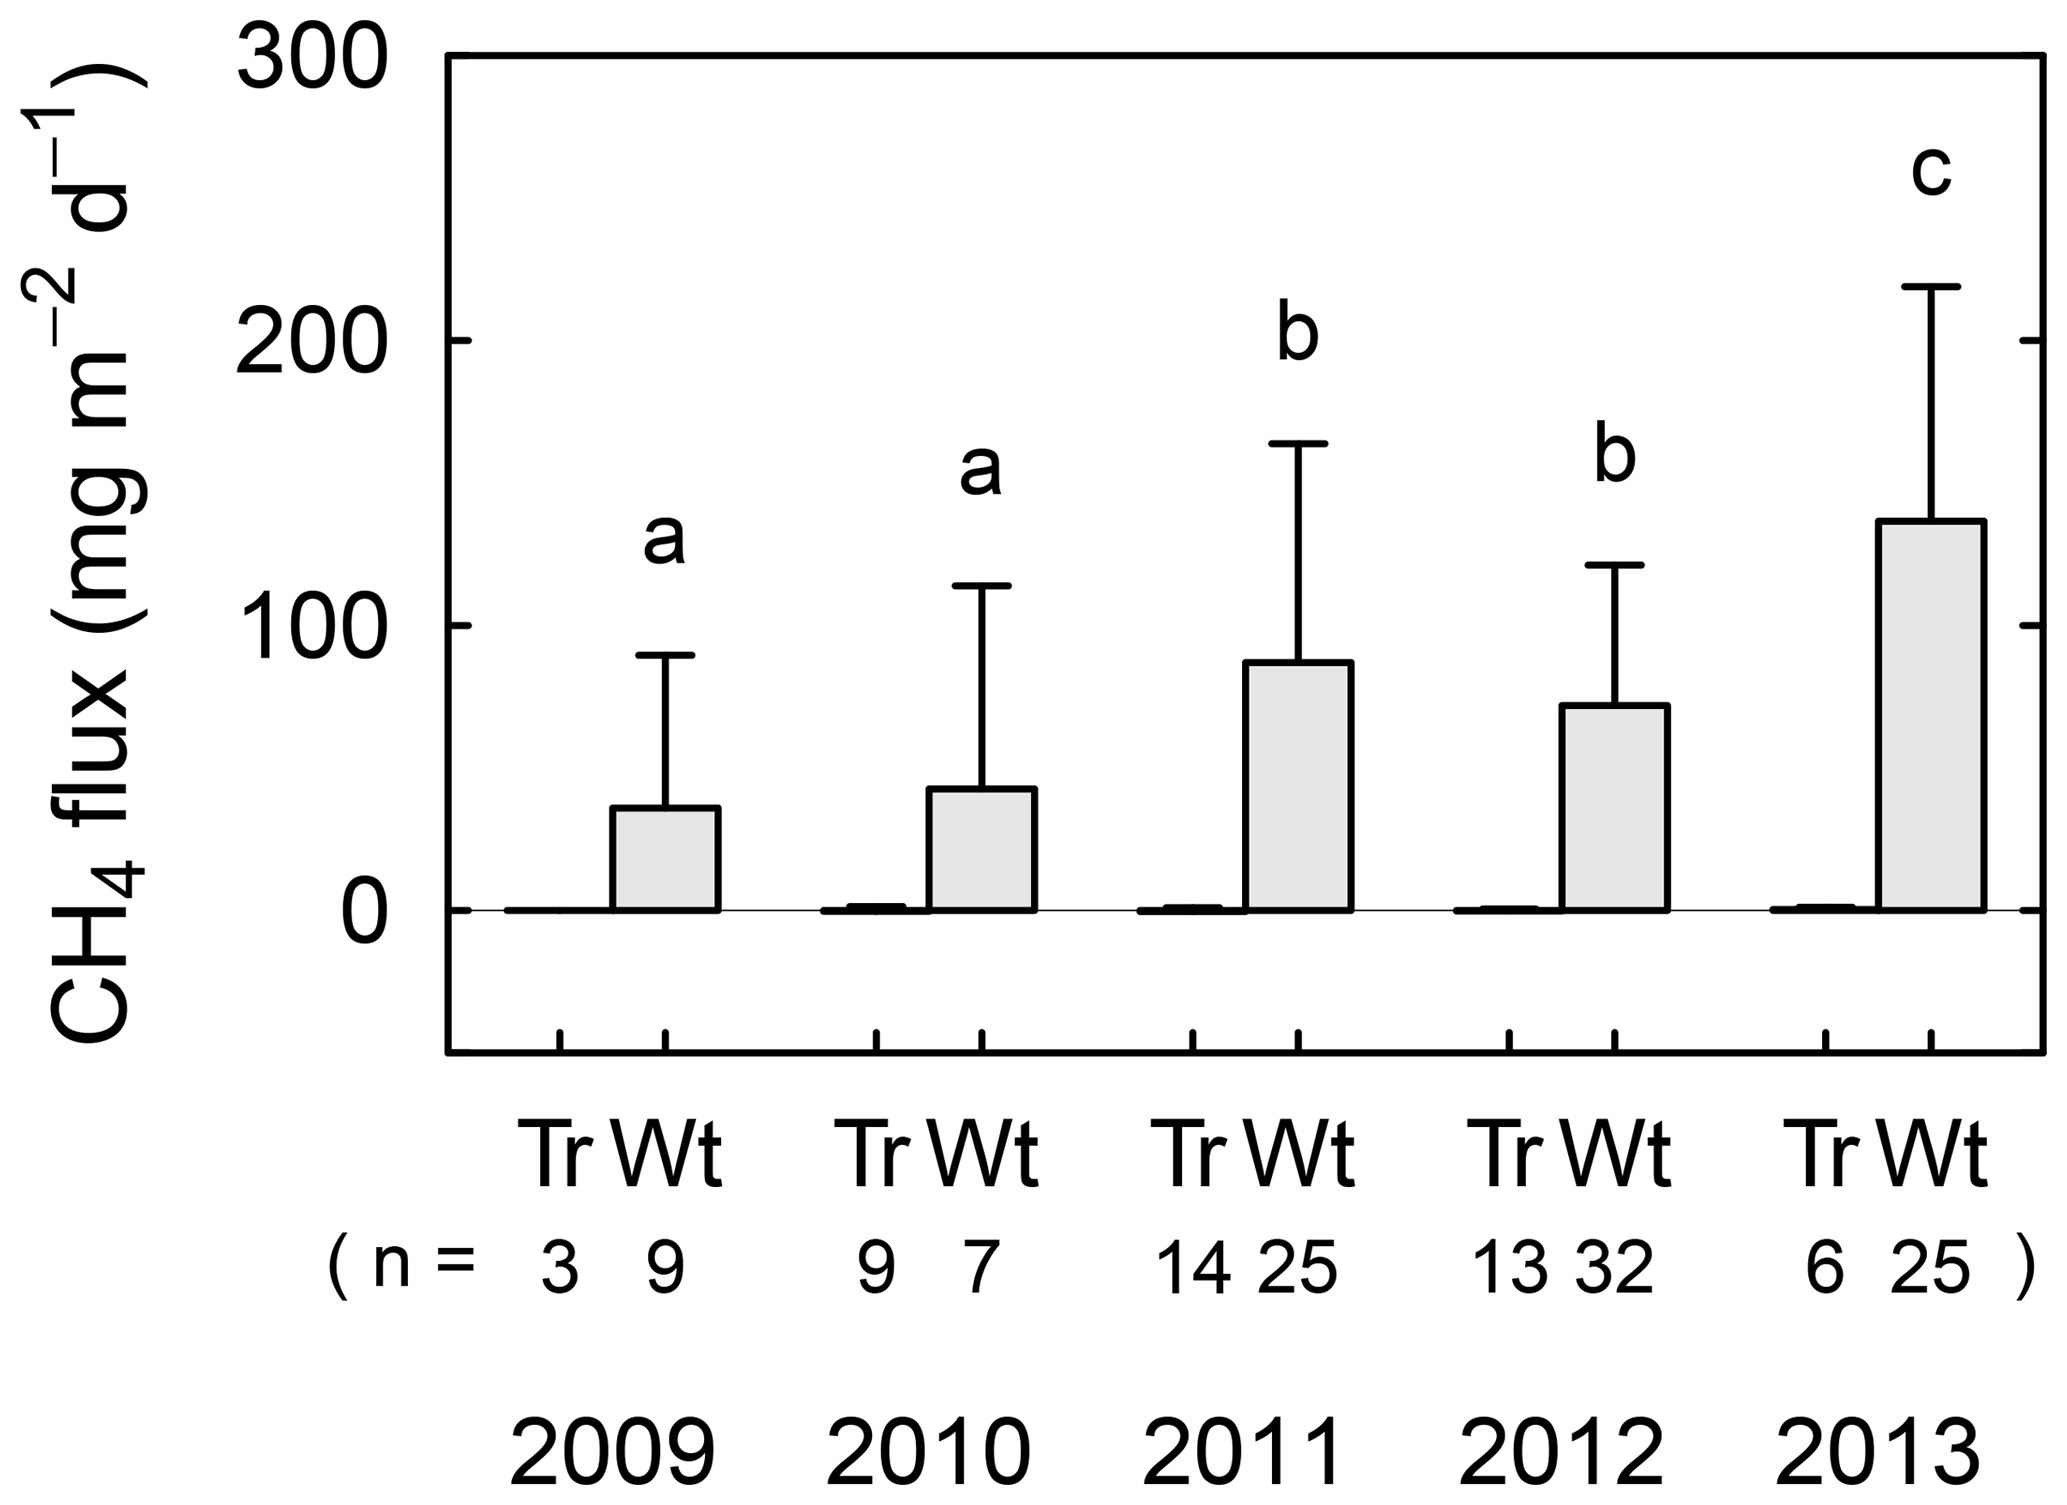
Figure 3Interannual variations in averaged CH4 flux in tree mounds (denoted as “Tr”) and wet areas (“Wt”) for the main summer seasons from 2009 to 2013. Replication numbers (“n”) are shown for each averaged flux value, and standard deviations are represented by error bars. Different letters show statistical interannual differences in the flux values for wet areas. See Table S2 for flux values at respective observation points.
3.2 CH4 flux and dissolved CH4 concentration
Obtained CH4 flux shows clear spatial and interannual variations (Fig. 3). Individual flux measurements (n=143 in total) are summarized as mean values for the main summer seasons. From 2011 to 2013, continuous flux observations (Table S2) were conducted in concert with dissolved CH4 analysis, and the interannual variation during this period will be discussed in detail.
With regards to the spatial variation in CH4 flux, tree mounds had consistently small values around the detection limit for all measurements (−4.9 to 1.9 mg CH4 m−2 day−1), while wet areas showed CH4 emissions. From 2009 to 2013, the CH4 flux in wet areas showed large interannual variations ranging from 36 to 140 mg CH4 m−2 day−1. The flux increased in 2011 when the wetting event occurred, and then remained relatively large in 2012 (compared to 2009 and 2010). Moreover, the flux increased again from 2011/2012 to 2013 (p<0.05). No statistically significant correlation was found when CH4 flux was plotted against soil temperature (10 cm in depth), thaw depth, or water level using all the data from wet areas (Fig. S1 in the Supplement).
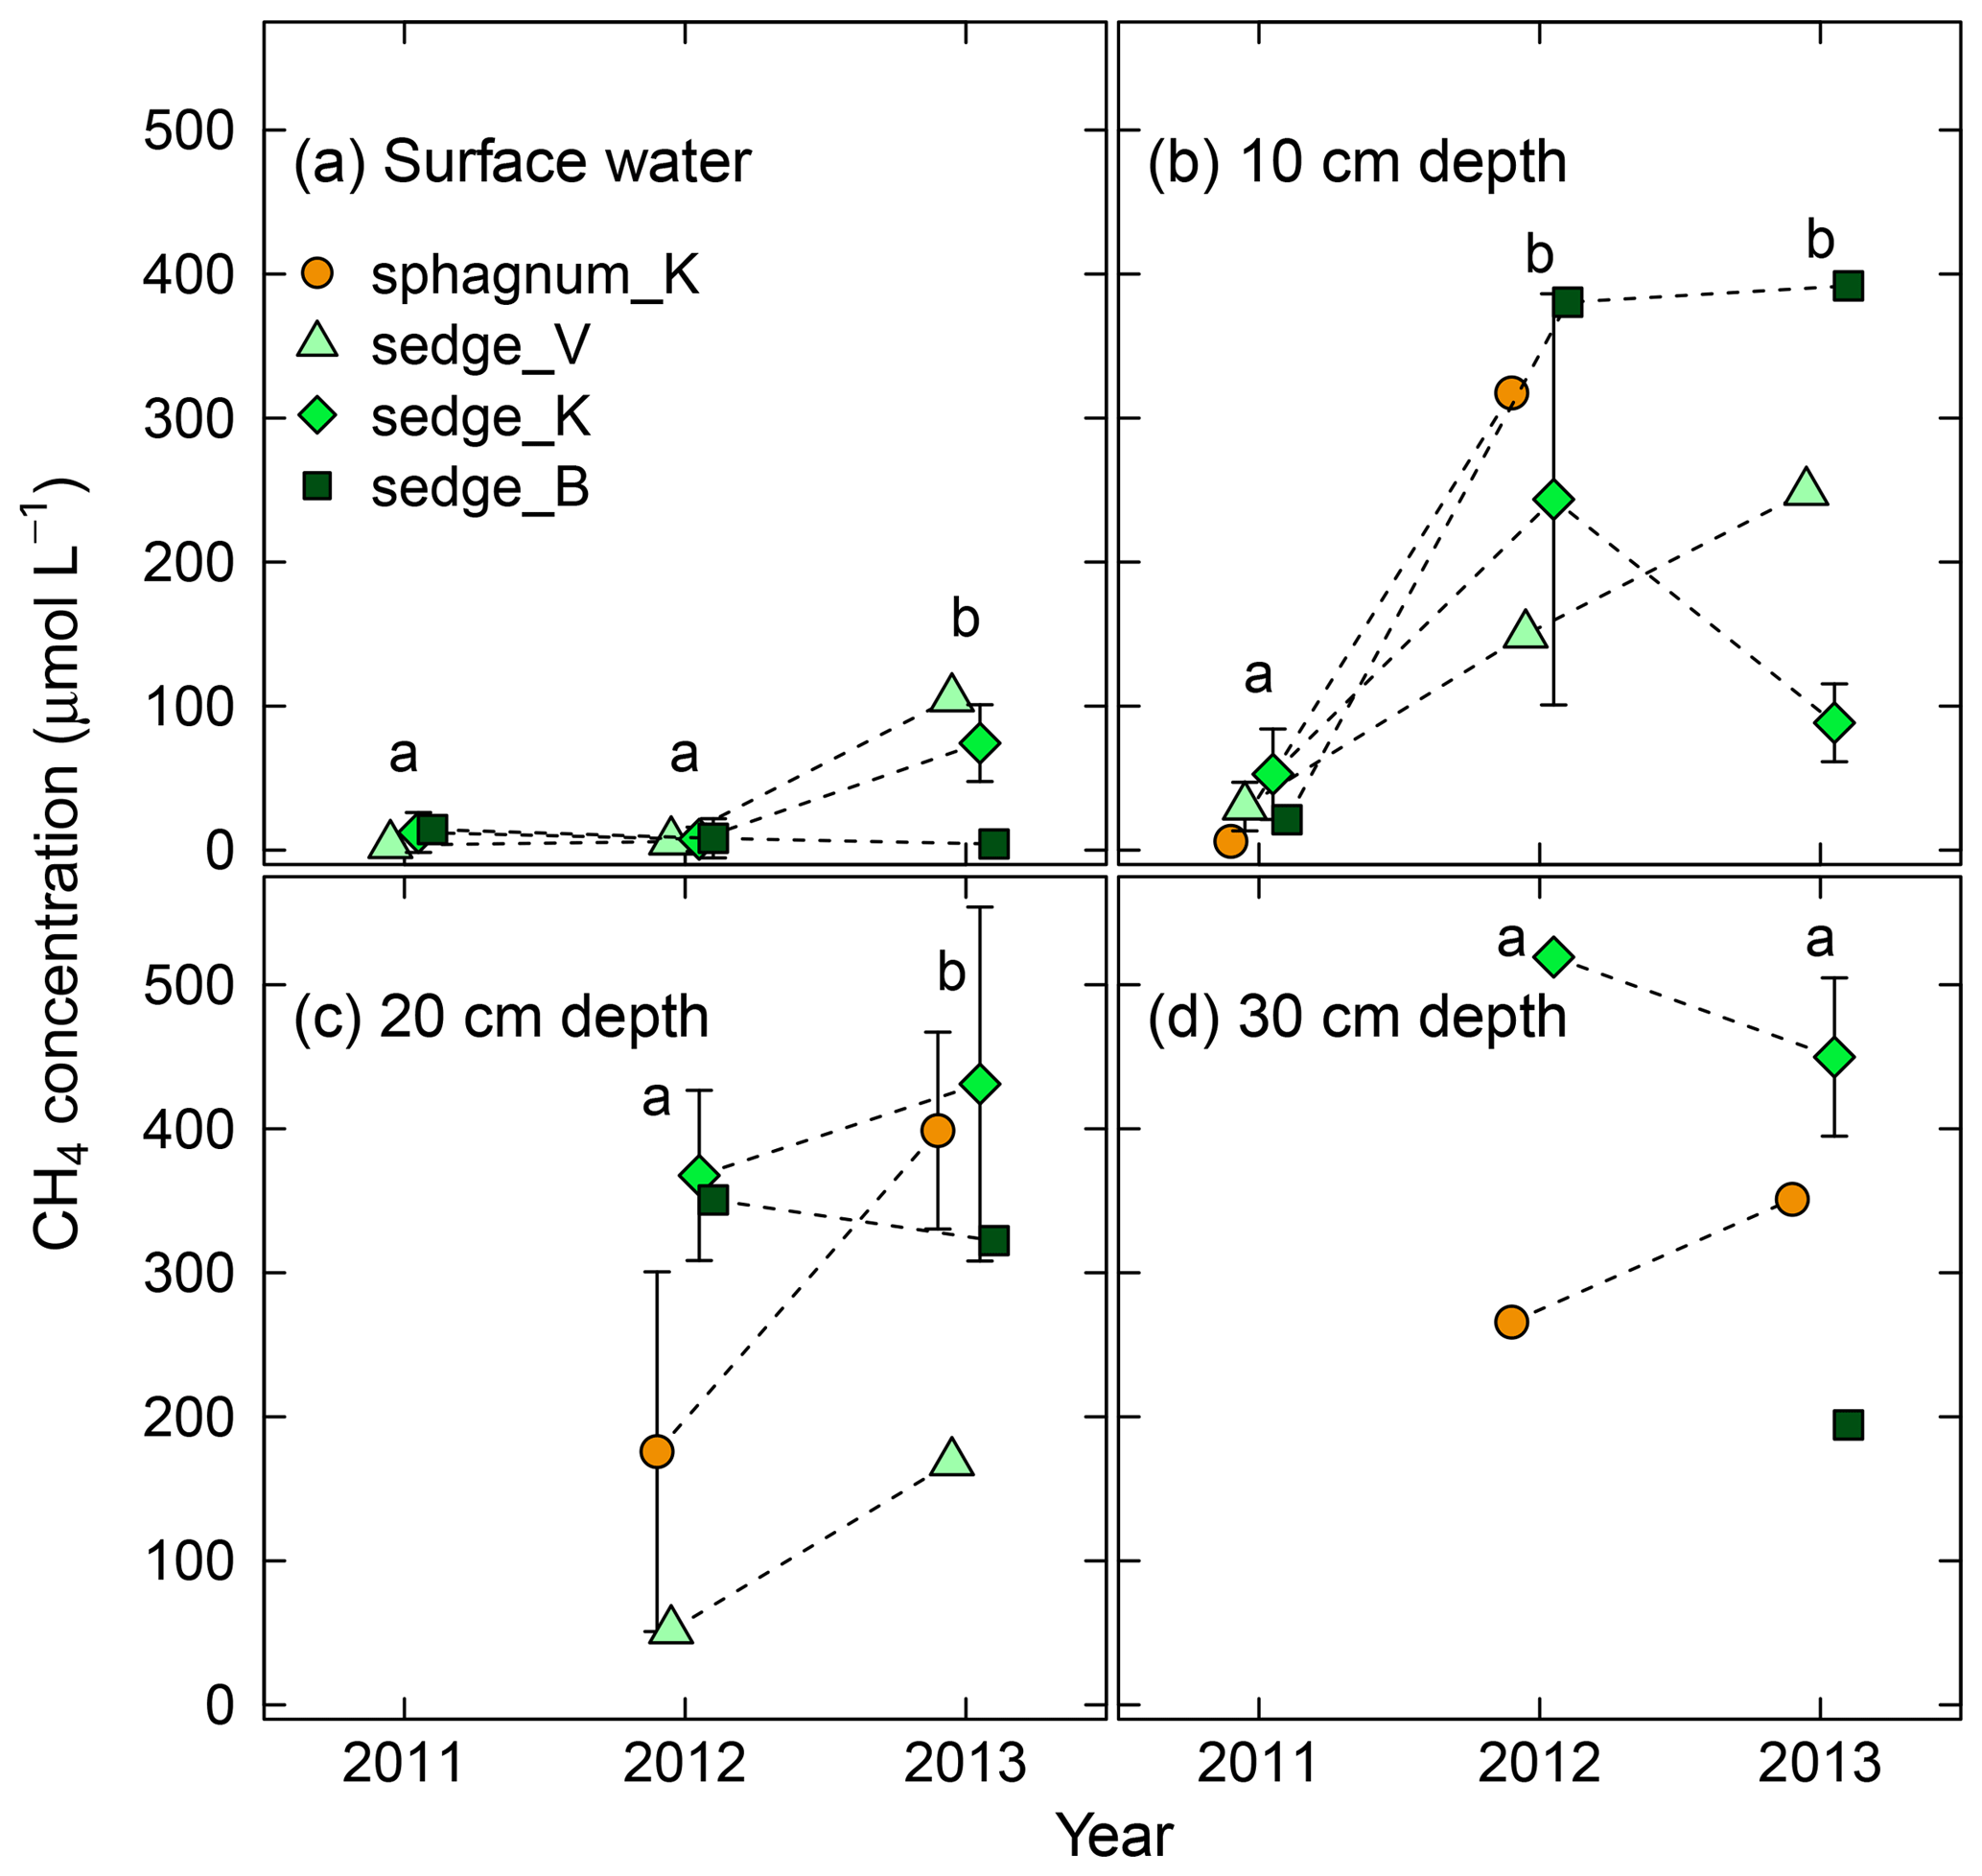
Figure 4Interannual variation in dissolved CH4 concentration in (a) surface water and soil pore water at (b) 10 cm, (c) 20 cm, and (d) 30 cm in depth in wet areas from 2011 (wetting event) to 2013. Different letters in each panel denote statistical differences among years in averaged concentration across the four wet areas (p<0.05). Error bars represent standard deviations. See Table S3 for numerical values of dissolved CH4 concentrations.
In addition to CH4 flux, dissolved CH4 concentration increased after the wetting event in 2011 (Fig. 4). From 2011 to 2012, CH4 concentration in soil pore water at 10 cm in depth (Fig. 4b) exhibited a sharp increase of 1 order of magnitude (p<0.005). It remained high from 2012 to 2013, and the concentrations in surface water and that at 20 cm in depth (Fig. 4a and c) also increased significantly over the same period (p<0.05). No significant difference in concentration was observed at 30 cm in depth between 2012 and 2013. In terms of vertical variation, the concentration in surface water was lower than that in soil pore water (10, 20, and 30 cm in depth).
3.3 δ13C and δD of in situ dissolved CH4
Variability in both δ13C and δD of dissolved CH4 was smaller in deeper layers, showing different patterns between δ13C and δD, and across years (Fig. 5). The δ13C of dissolved CH4 had similarly large ranges (−68 ‰ to −40 ‰) in surface water and at 10 cm and 20 cm in depth, compared to a small range (−53 ‰ to −46 ‰) at 30 cm in depth. The δD of dissolved CH4 was variable only in surface water (−415 ‰ to −308 ‰) and at 10 cm in depth (−417 ‰ to −341 ‰), whereas it had a constant value of around −408 ‰ at 20 and 30 cm in depth. Additionally, δ13C values approached a relatively high value (approximately −50 ‰) at depth, while δD values converged to almost their lowest value. In terms of interannual variations in δ13C and δD of dissolved CH4 from 2011 to 2013, both δ13C and δD values in surface soil pore water (10 cm in depth) were scattered more widely in 2011, showing standard deviations (SD) of 6.6 ‰ and 24 ‰, respectively, whereas their ranges were smaller in 2012 and 2013 (SD: 3.3 ‰ and 17 ‰ at maxima, respectively).
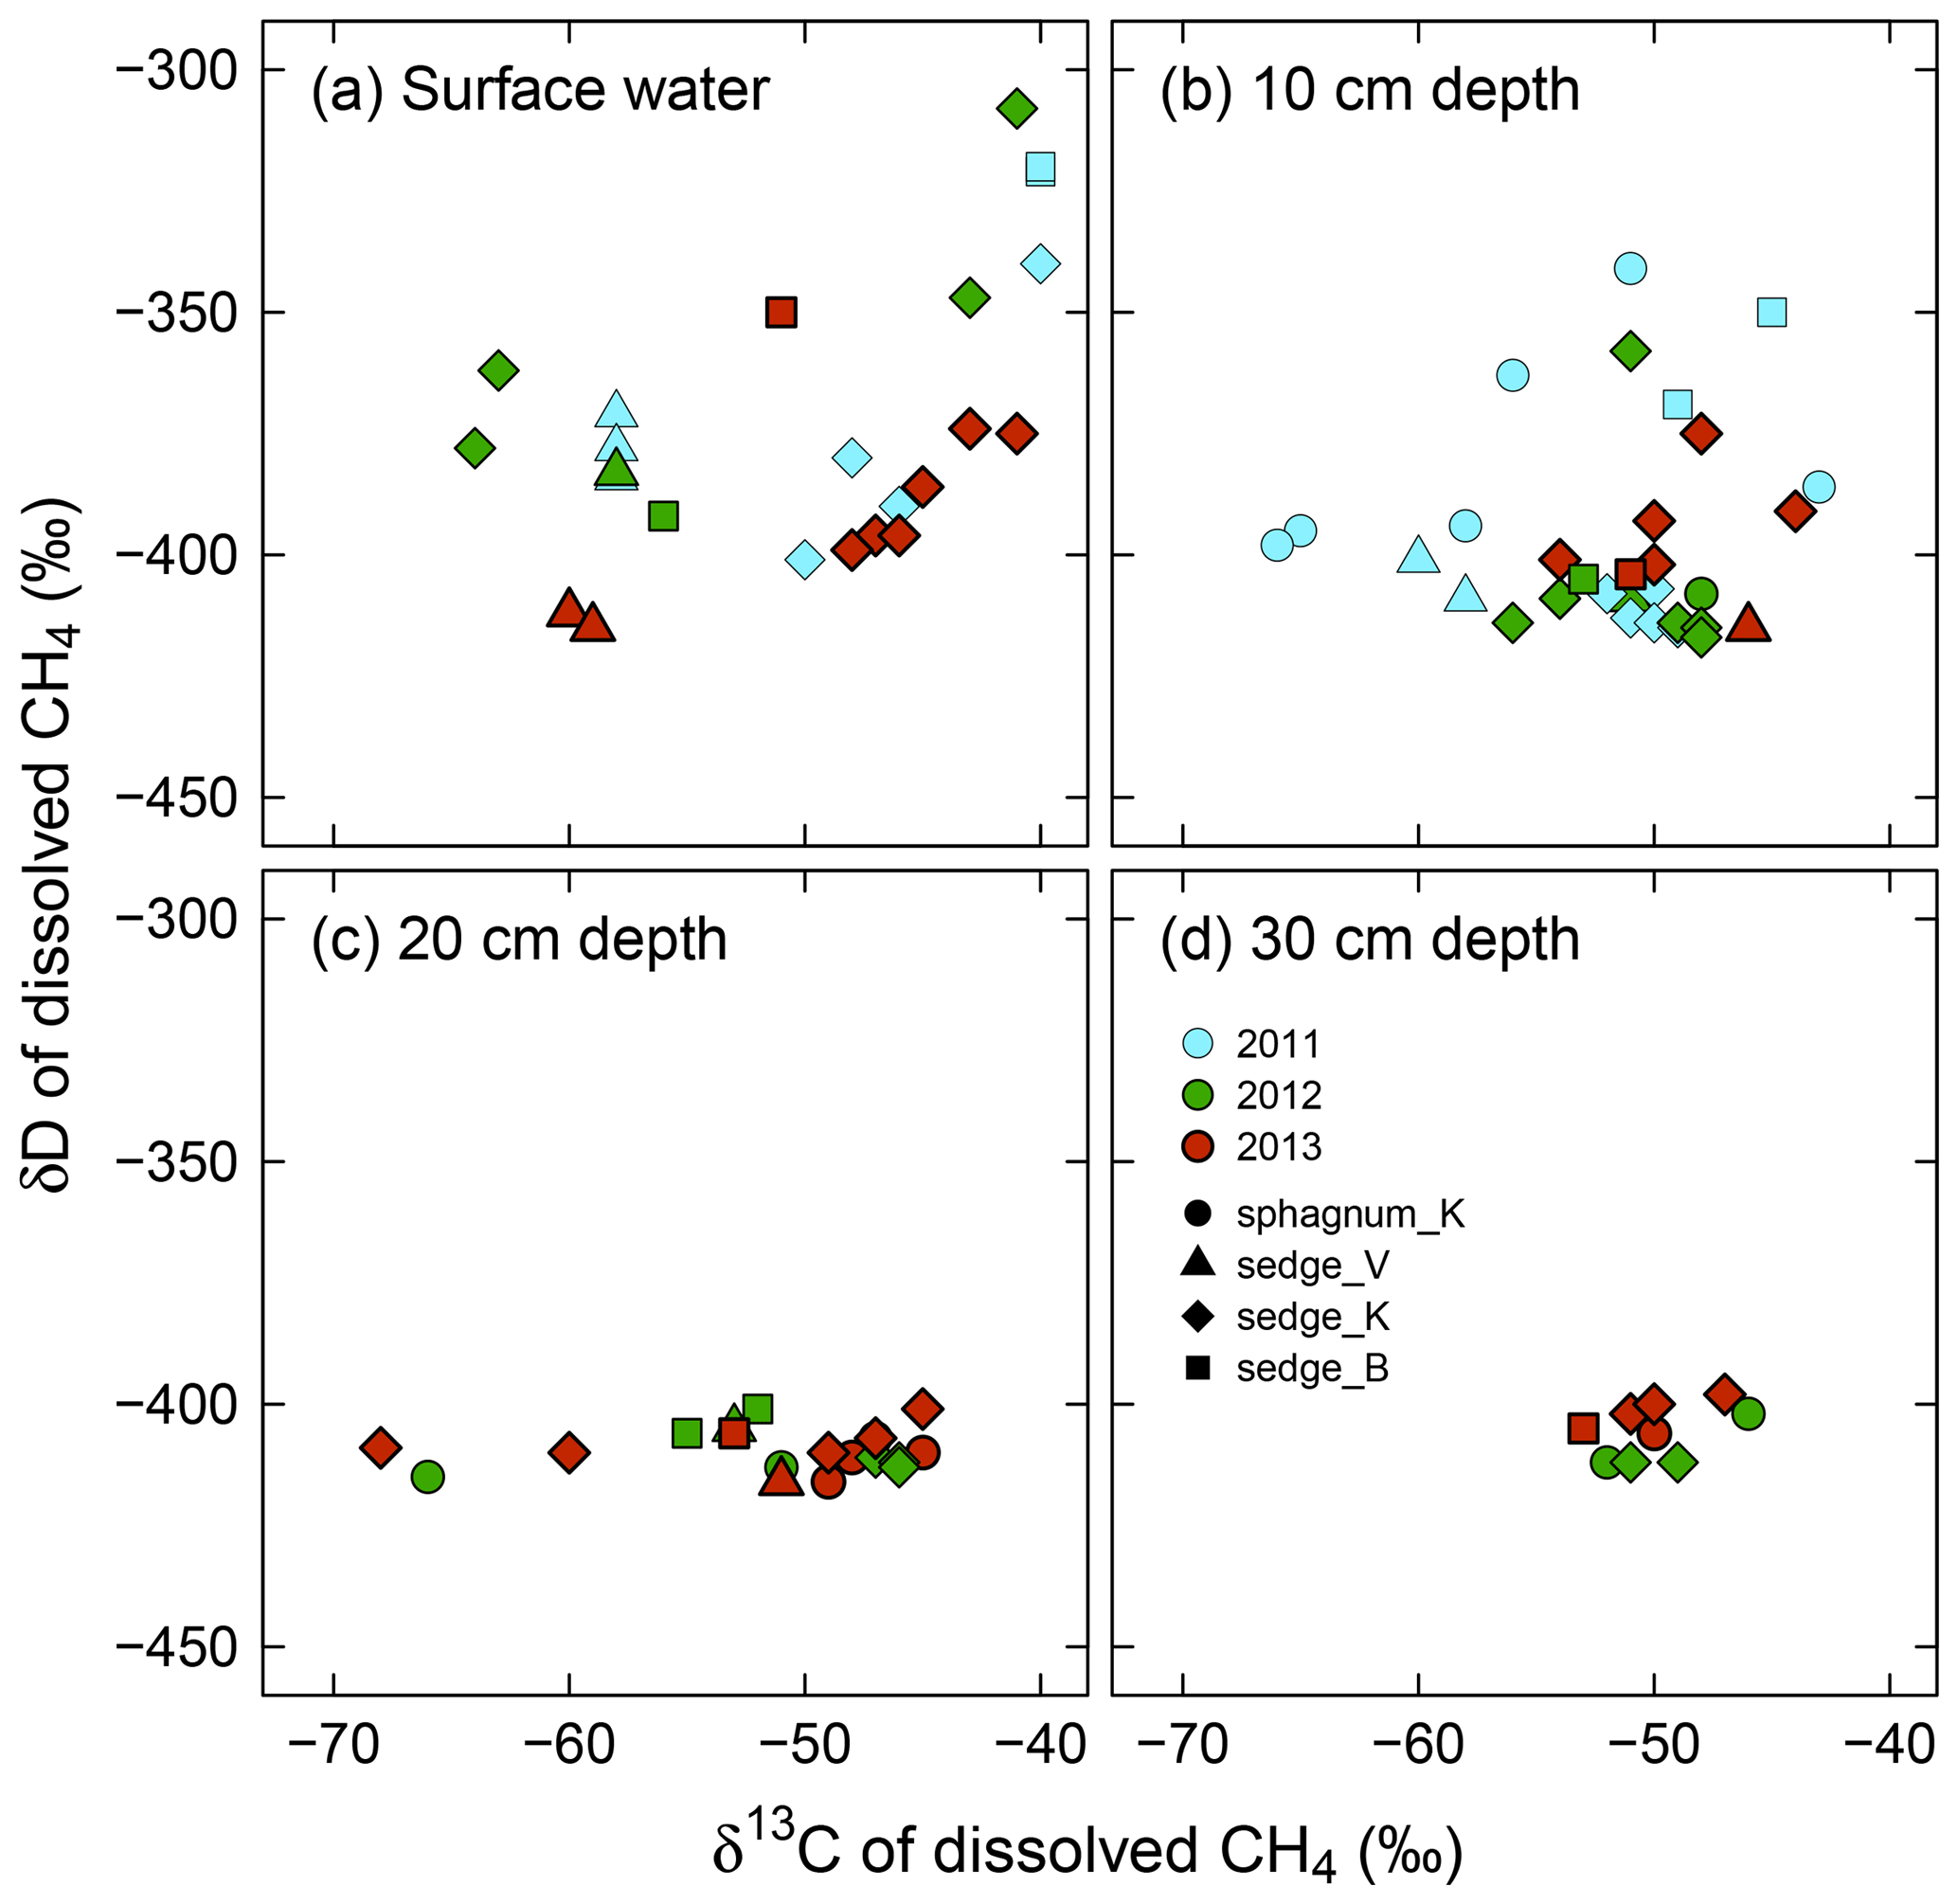
Figure 5In situ δ13C versus δD of dissolved CH4 in (a) surface water and soil pore water at (b) 10 cm in depth, (c) 20 cm in depth, and (d) 30 cm in depth from the wetting event in 2011 to 2013. Individual delta values are shown here. See Table S3 for averaged delta values for each observation point and each year.
As shown in Fig. 6, convergence of δ13C and δD of dissolved CH4 is associated with dissolved CH4 concentrations. The δ13C and δD values of dissolved CH4, including surface water and 10 cm in depth, converged at high CH4 concentrations to the values seen in deeper soil layers (δ13C = ‰ and δD = ‰ at >200 µmol CH4 L−1).
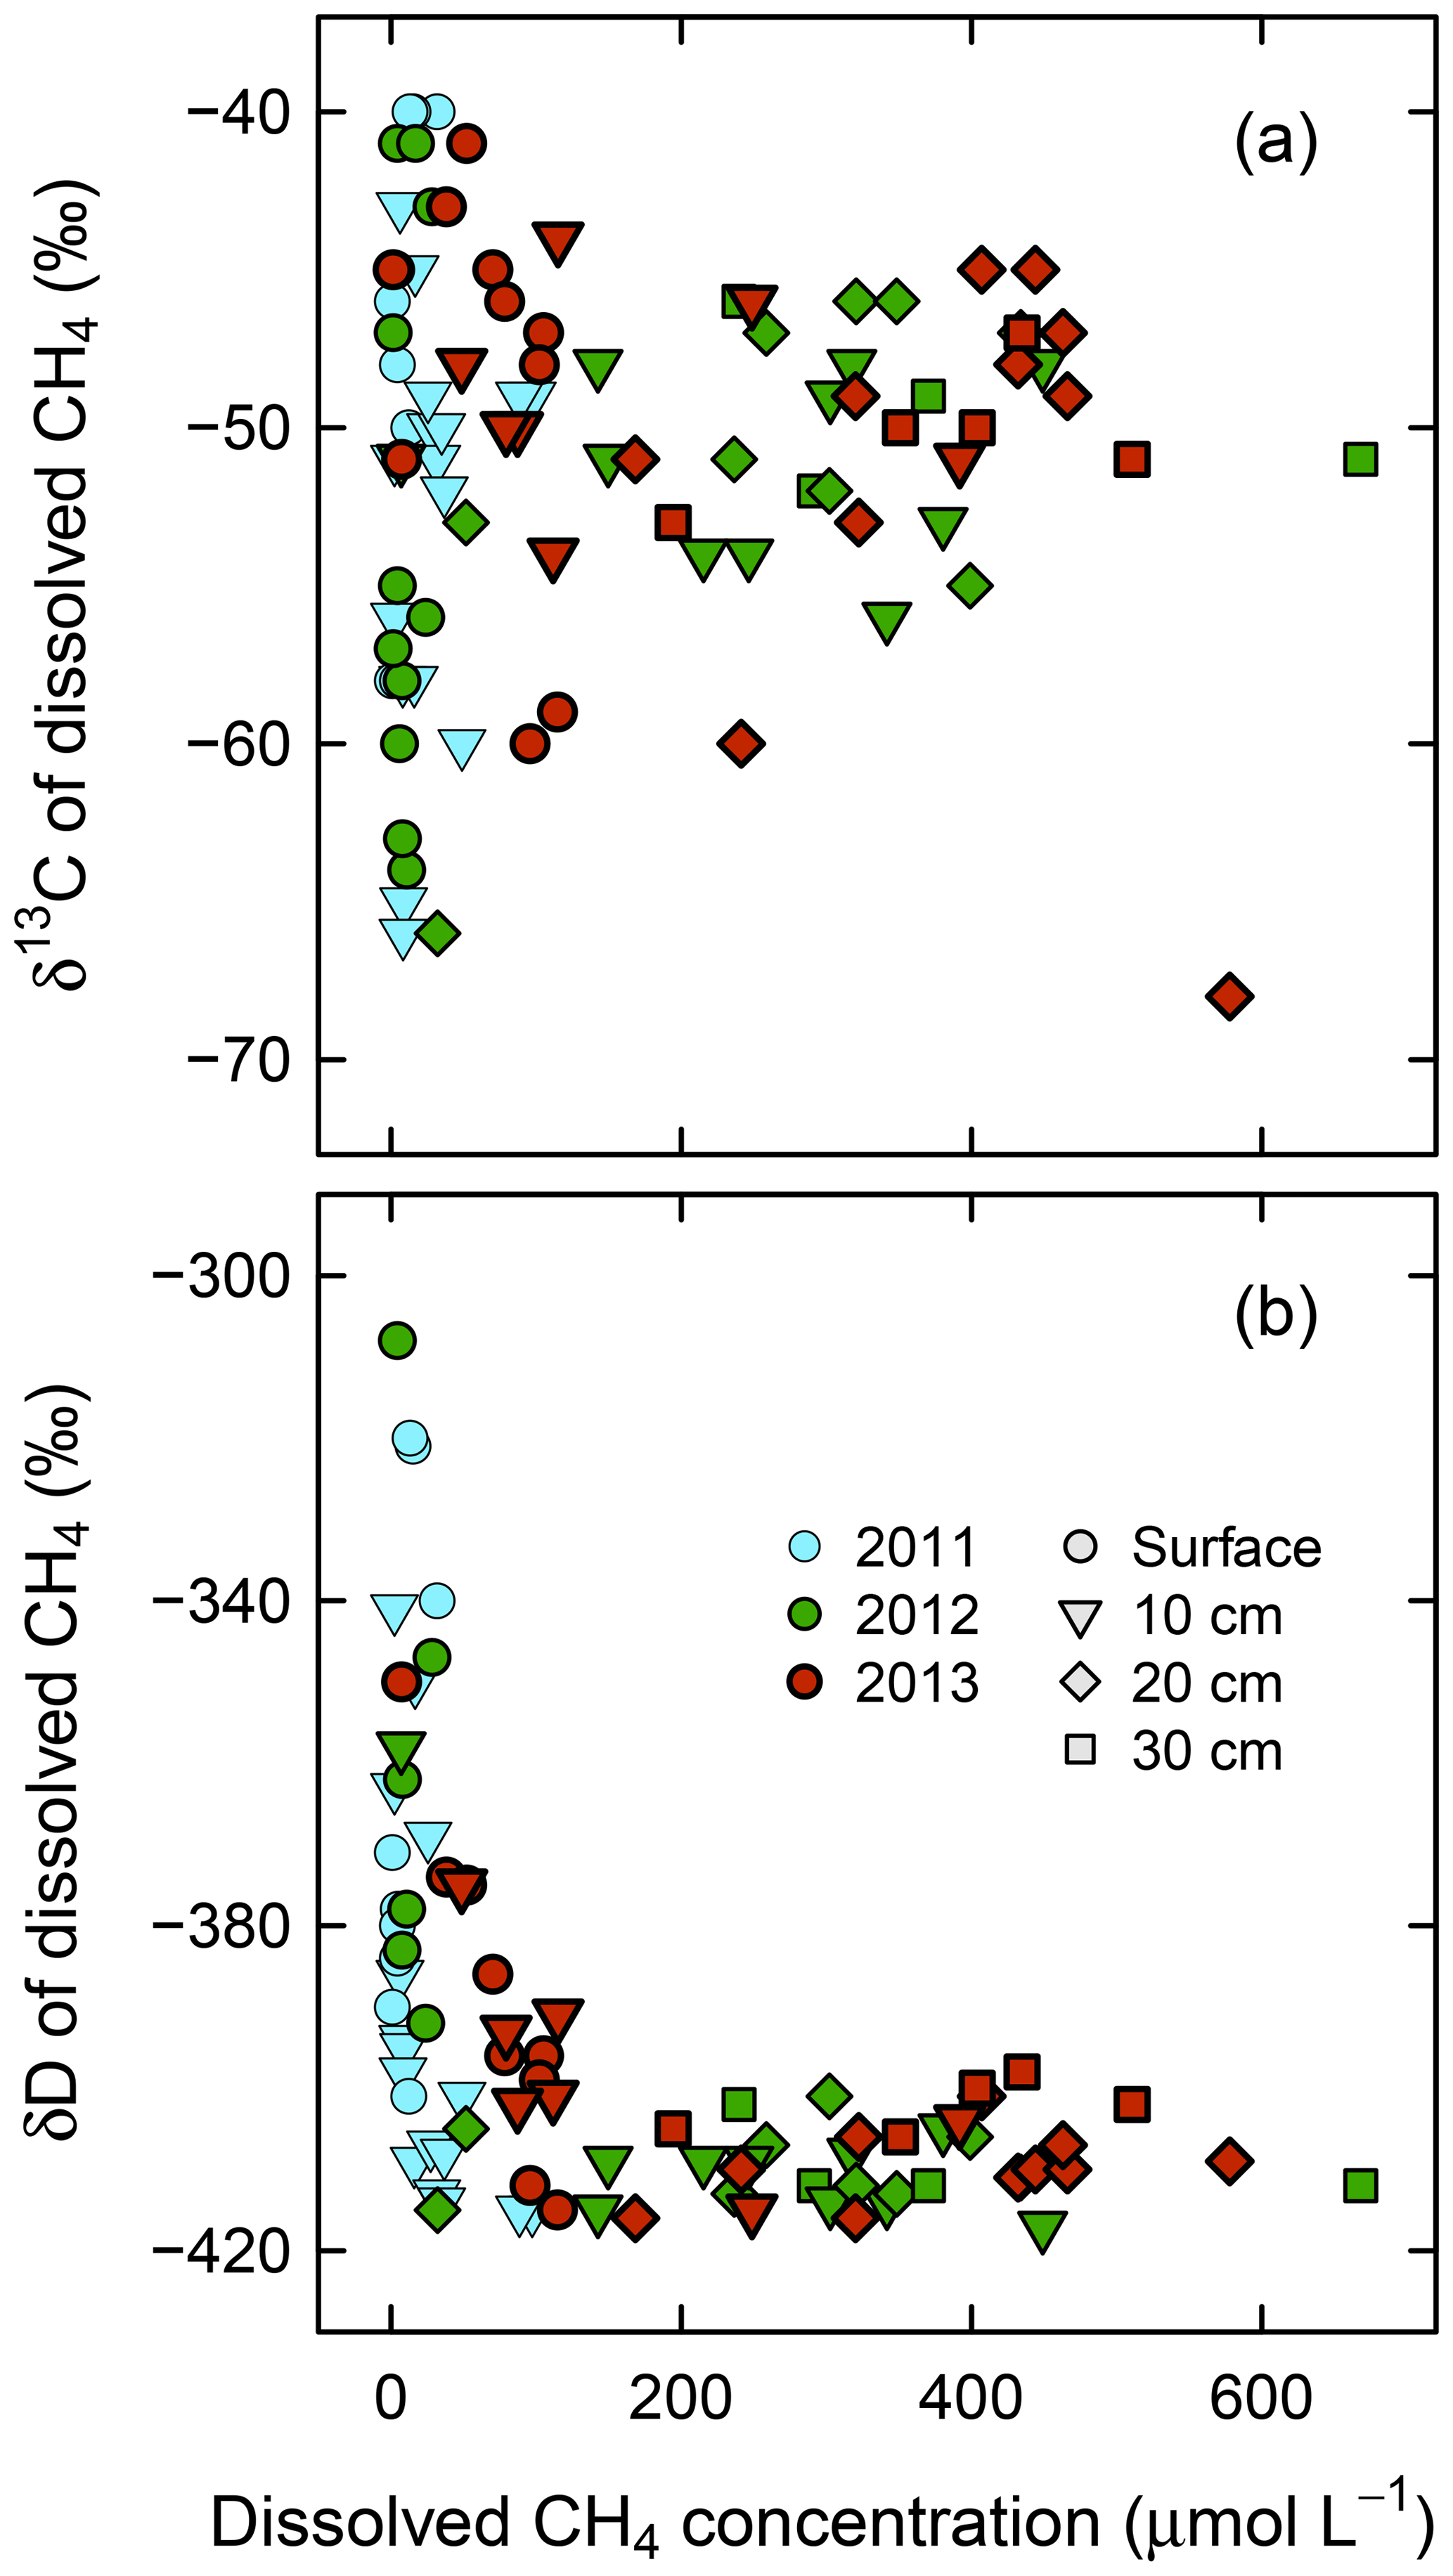
Figure 6In situ (a) δ13C and (b) δD versus concentration of dissolved CH4 at four depths (surface water, 10, 20, and 30 cm) in wet areas from 2011 to 2013.
3.4 Soil incubation experiments and microbial community analysis
In the anaerobic incubation experiment, the CH4 production rate was different among sampling locations (Fig. 7); the rate was higher for sedge_K and sedge_B (0.66±0.15 and 0.43±0.09 µmol day−1 g−1 (dry weight), respectively) than sedge_V and sphagnum_K (0.24±0.02 and 0.08±0.01 µmol day−1 g−1 (dry weight), respectively). At sedge_K, the sampling location tested in detail, production was more rapid for shallower soil layers among the 10, 20, and 30 cm in depth (0.66±0.15, 0.33±0.06, 0.003±0.004 µmol day−1 g−1 (dry weight), respectively; p<0.01 in Welch's ANOVA test), while no difference in the rate was found between incubation temperatures (0.66±0.15 µmol day−1 g−1 (dry weight) at 5 ∘C and 0.74±0.14 µmol day−1 g−1 (dry weight) at 10 ∘C, p>0.5 in t test). When the CH4 production rate was high, the δ13C and δD values of produced CH4 were less variable irrespective of sampling location, sampling depth, or incubation temperature. The δ13C value of produced CH4 at a high production rate (>0.26 µmol day−1 g−1) (dry weight) was ‰ (n=12). Similarly, δD under rapid CH4 production was ‰ (n=12). These δ13C and δD values of CH4 obtained under rapid production were mostly comparable with the δ values of in situ dissolved CH4 that converged in deep soil layers (δ13C = ‰ at 30 cm in depth and δD = ‰ at 20–30 cm in depth; Fig. 5c and d), although δ13C values in the incubation experiment were slightly lower than those in situ.
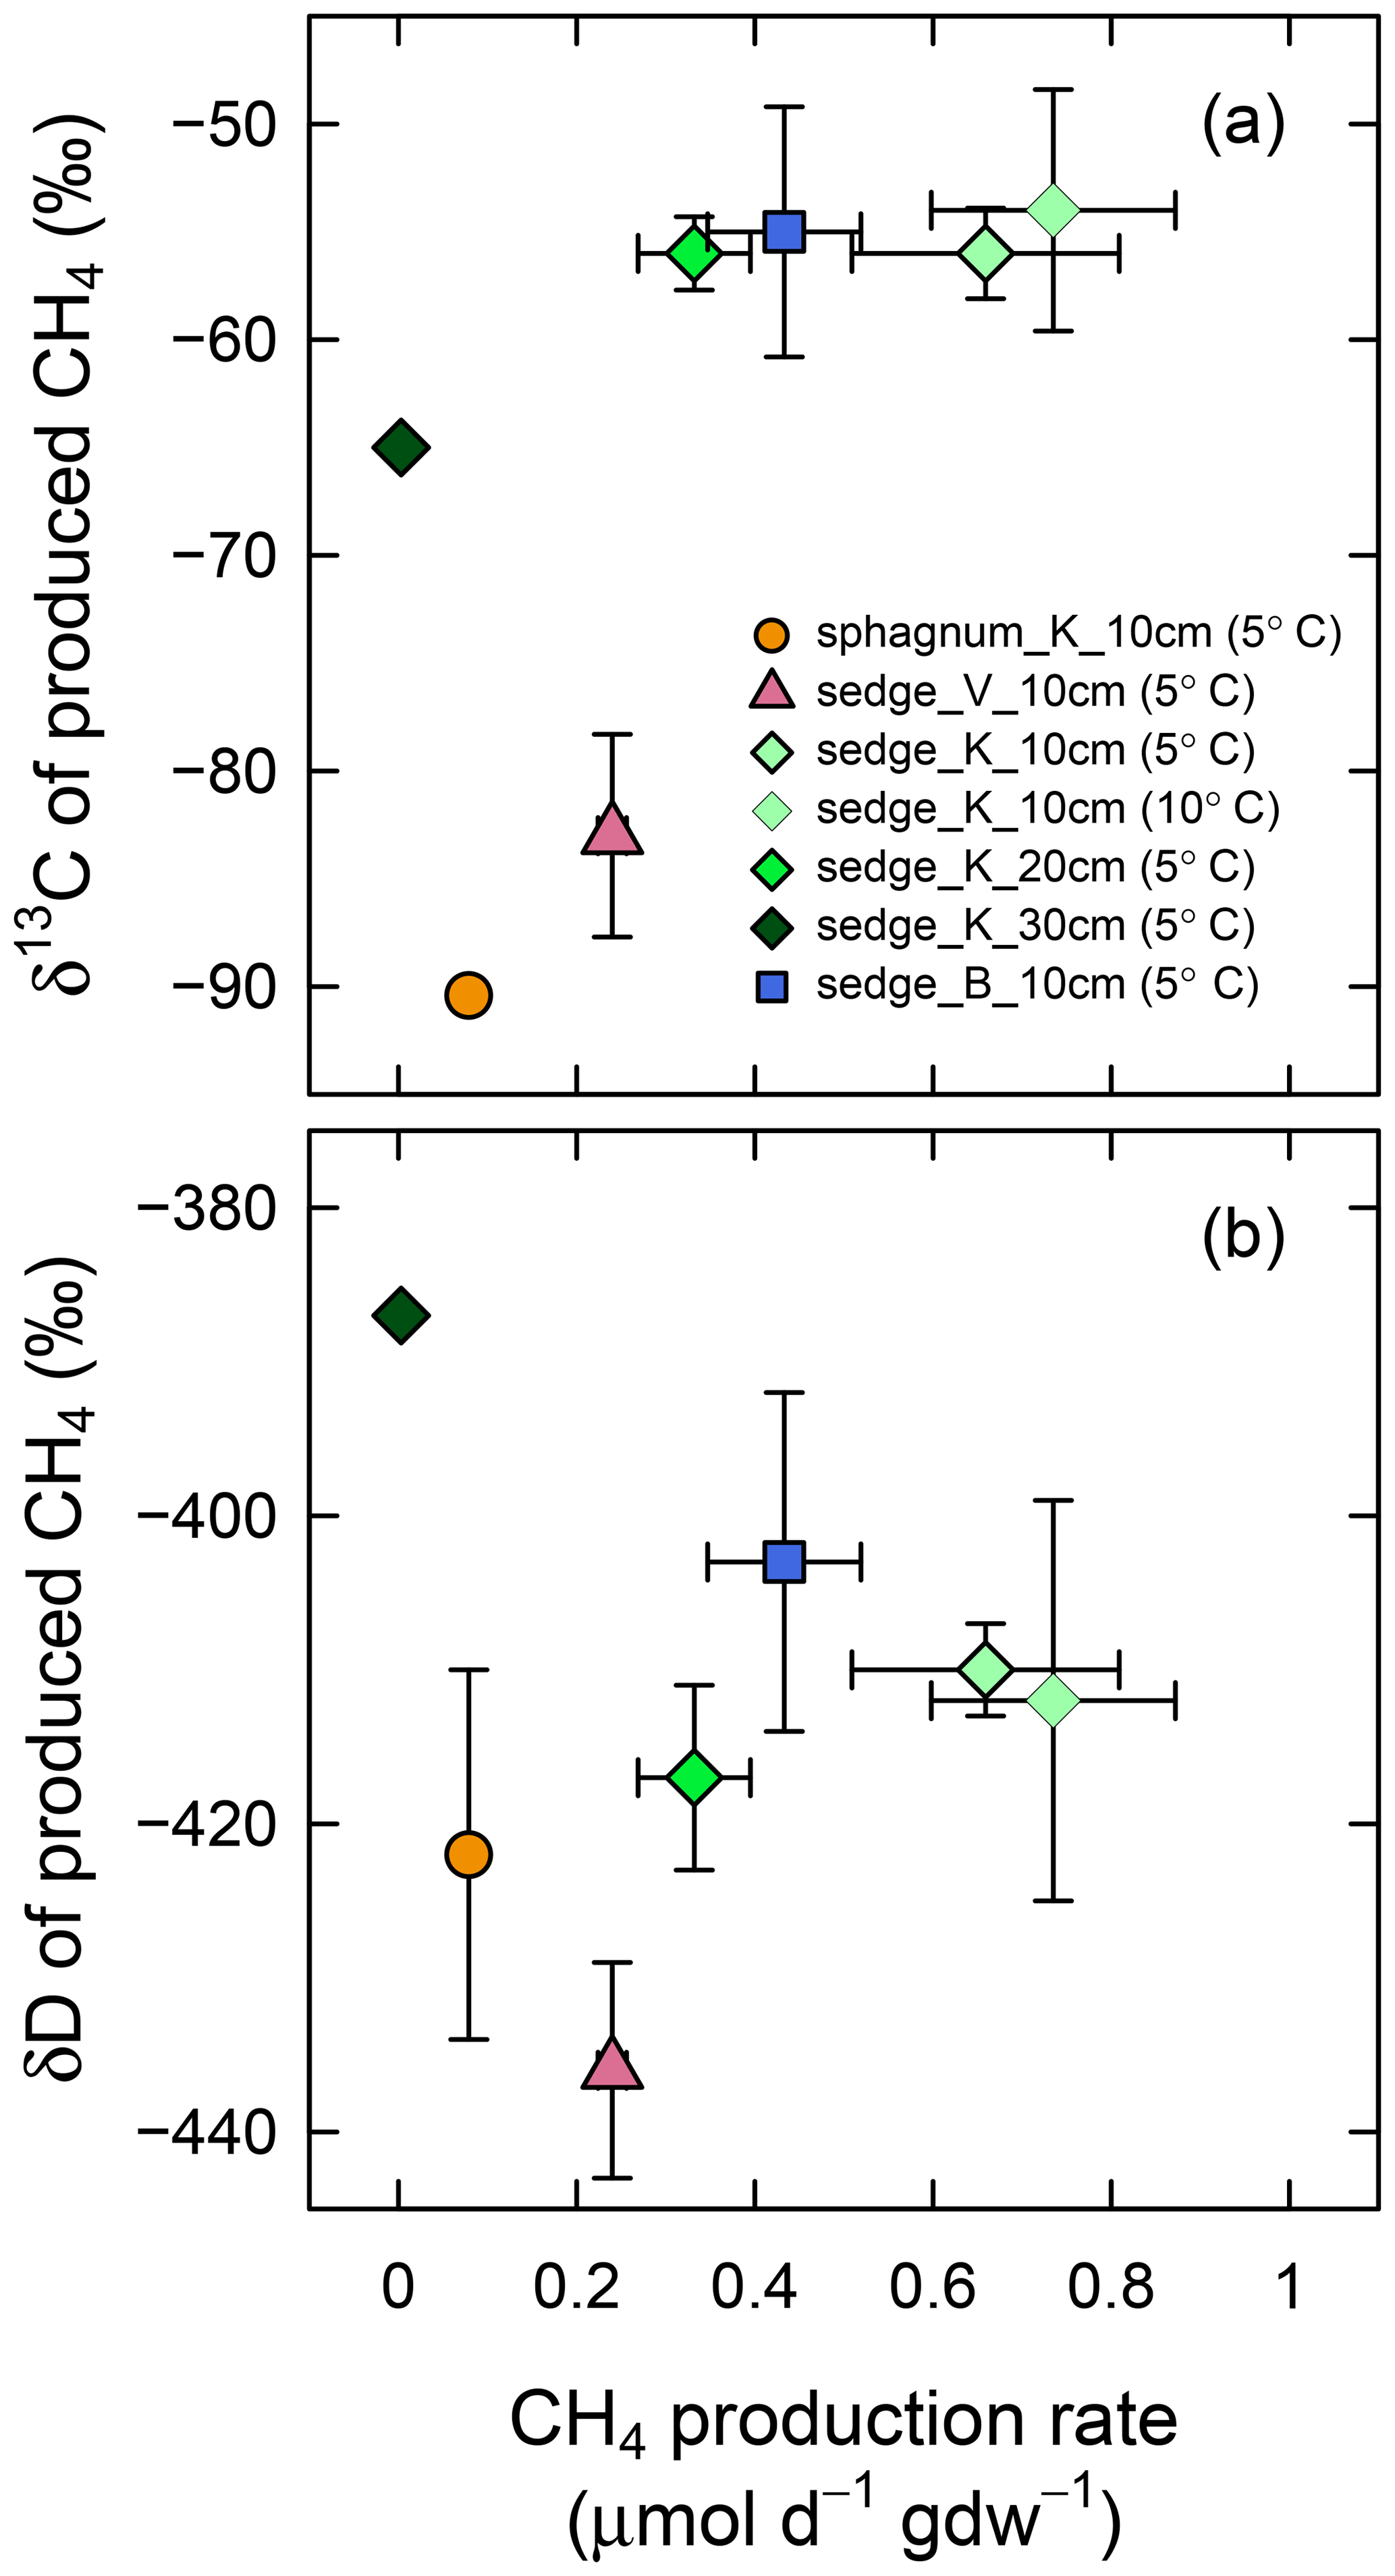
Figure 7(a) δ13C and (b) δD of produced CH4 versus CH4 production rate in the anaerobic soil incubation experiment. Production rates are shown in micromoles of produced CH4 per day and per weight of dry soil in grams. Soil samples were collected at four observation points (sphagnum_K, sedge_V, sedge_K, and sedge_B) at three depths (10, 20, and 30 cm) and incubated at two temperatures (5 and 10 ∘C). These samples contain organic layers except for those collected at 30 cm. Error bars represent standard deviations.
In the microbial community analysis using 16S rRNA gene sequencing (Fig. 8), soil with high rates of CH4 production shown in the incubation experiment (sedge_K and sedge_B as in Fig. 7) had more abundant total methanogens within the detected archaea than that with slow CH4 production rates (sphagnum_K and sedge_V). Acetoclastic methanogens in the order Methanosarcinales were higher in proportion among methanogens in sedge_K and sedge_B, where δ13C values of produced CH4 in the incubation were higher. In contrast, Methanosarcinales were fewer in proportion in sphagnum_K, where δ13C of the produced CH4 was lower.

Figure 8Phylogenetic compositions of methanogenic archaea by order in wet areas. Soil samples (organic layers) were taken in triplicate from 10 cm in depth in each wet area in July 2016. See Table S5 for detailed results.
In the CH4 oxidation experiment, CH4 concentration in headspace declined continuously in every sample (Fig. S2). As CH4 oxidation proceeded, both δD and δ13C of the remaining CH4 increased with a linear relationship between them (Figs. 9 and S2). Observed slope Δ(δD)∕Δ(δ13C) was 11, indicating a much larger fractionation of hydrogen than carbon, regardless of vegetation types in wet areas (sphagnum or sedge). The hydrogen isotope fractionation factors of CH4 oxidation calculated from the data shown in Fig. 9 were 1.25 and 1.16 for wet areas of sphagnum and sedge, respectively, while carbon isotope fractionations were 1.021 and 1.015, respectively.
4.1 CH4 flux at tree mounds and wet areas at the taiga–tundra boundary on the Indigirka River lowlands
Methane flux observed in our study was clearly larger in wet areas than at dry tree mounds (Table 1, Fig. 3). Such differences in CH4 flux between wetland vegetation and dry areas with trees or shrubs is generally observed (van Huissteden et al., 2005; van der Molen et al., 2007; Flessa et al., 2008) and is consistent with the fact that CH4 production requires reducing conditions in soil (Conrad, 2007). Our CH4 flux in wet areas (36–140 mg CH4 m−2 day−1) was comparable to that reported for wet tundras (32–101 mg CH4 m−2 day−1) or permafrost fens (42–147 mg CH4 m−2 day−1) in a database across permafrost zones compiled by Olefeldt et al. (2013). In forests, many studies have observed CH4 absorption instead of emission (King, 1997; Dutaur and Verchot, 2007; Flessa et al., 2008; Morishita et al., 2014). However, our observations at tree mounds rarely found CH4 absorption or emission. In addition, CH4 was not consumed even under O2- and CH4-rich conditions in incubation experiments of tree mound soil from site K (Murase et al., 2014), indicating that a lack of methanotrophic bacterial activity limited CH4 absorption at this vegetation type. Our results show that CH4 emission from wet areas is expected to make a greater contribution to ecosystem-scale CH4 exchange at the taiga–tundra boundary on the Indigirka River lowlands.
4.2 Methane flux, production, and oxidation responses to the wetting event
In 2009 and 2010 the CH4 emission in wet areas was low (Fig. 3), even at relatively high soil temperatures in 2010 (Fig. S1), under dry conditions that were not directly observed in this study. The wetting event in 2011 initiated the high CH4 emission that continued through 2013 despite decreasing water levels (Fig. 2). Moreover, a further increase in flux was observed in 2013, accompanying a buildup of dissolved CH4 (2011–2013) as shown in Fig. 4.
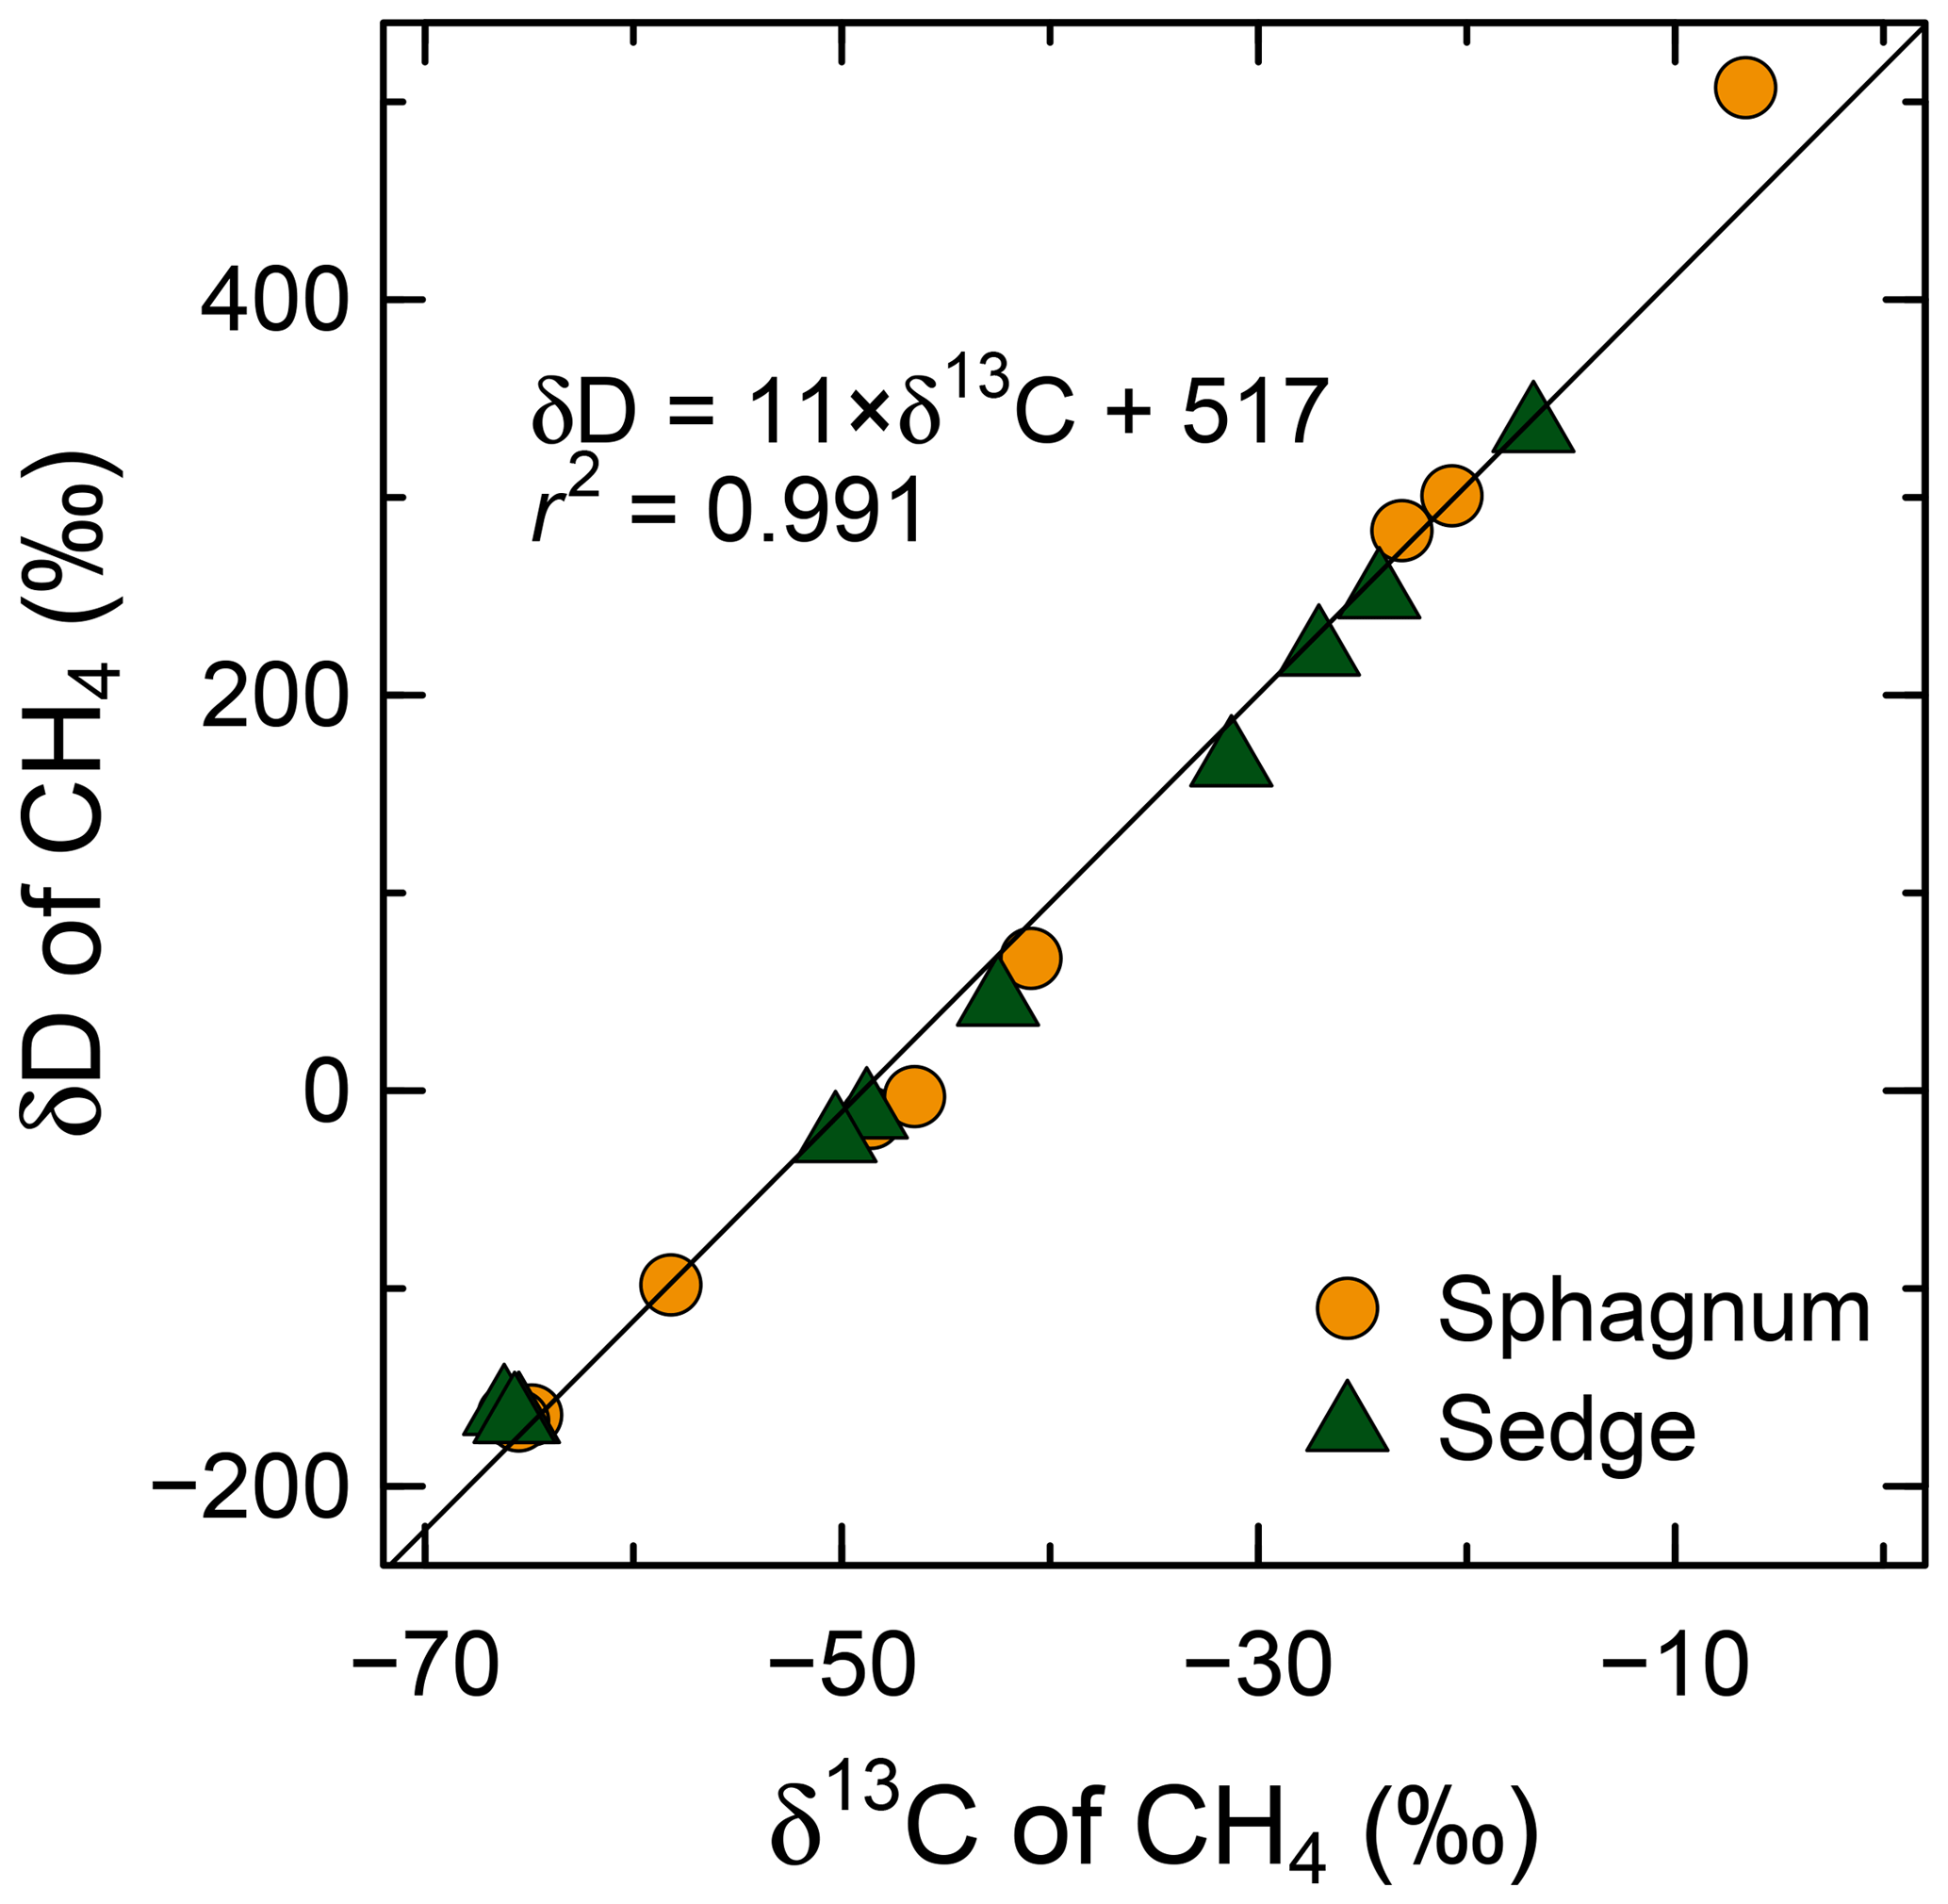
Figure 9Enrichment of D/H (CH4) and 13C∕12C (CH4) through CH4 oxidation during the aerobic incubation experiment of surface organic layers from wet areas of sphagnum mosses and sedges at site K. Individual delta values of the headspace CH4 from each incubated syringe and each day are shown. Initial isotopic compositions of the headspace CH4 were −66 ‰ to −65 ‰ for δ13C and −167 ‰ to −162 ‰ for δD.
These interannual variations from 2011 to 2013 could be caused by the development of reducing soil conditions over multiple years after the wetting event. Reducing soil conditions may have developed, to some extent, as a result of the extreme precipitation in the summer of 2011 (Fig. 2). The surface soil layer, particularly under high water levels, could eliminate O2 from soil pore spaces due to water saturation. These reducing conditions may have been preserved by freezing of the soil throughout the following winter. Additionally, a surface soil layer saturated with ice could have prevented snowmelt water (rich in O2) from infiltrating the soil during the spring thaw season of 2012 (Woo, 2012). These processes would have led to the continuation of reducing conditions in the soil, which were created in summer 2011, into 2012. Through further decomposition of soil organic matter with the consumption of O2, reducing soil conditions may have been exacerbated in the water-saturated soil layer to a greater extent in summer 2012. Water in the saturated soil layer may be retained without exchange for a relatively long time at our study sites because lateral runoff is assumed to be small in the flat floodplain that comprises the Indigirka River lowlands (Nassif and Wilson, 1975). In addition, deep percolation loss is prevented by the impermeable permafrost layer (Woo, 2012). From summer 2012 to summer 2013, reducing conditions in the soil may have been similarly prolonged, especially in the deep soil layer, despite the decrease in water level from summer 2011 to summer 2013. This continuous soil reduction from 2011 to 2013 could have promoted CH4 production and/or decreased CH4 oxidation, which may explain the increase in dissolved CH4 concentration and CH4 flux in wet areas following the wetting event and continuing until 2013 (Figs. 3 and 4).
In 2011, δ13C and δD of dissolved CH4 (10 cm in depth) were scattered broadly across a wide range, whereas in 2012 and 2013 the ranges were narrower and they clustered around a high δ13C value (−50 ‰) and a low δD value (−408 ‰; Fig. 5b). Considering that δD increased much more rapidly than δ13C in our oxidation experiment (Fig. 9), δD can be considered a sensitive indicator of CH4 oxidation. In contrast, δ13C is not a good indicator because its fractionation factor of CH4 oxidation (1.015–1.021) was similar to that of CH4 diffusion (1.019; Chanton, 2005); thus the effects of CH4 oxidation and diffusion cannot be discerned by δ13C. Additionally, δD of dissolved CH4 (Fig. 5) was clearly lower in deeper layers (20 and 30 cm in depth) than in shallower layers (surface water and 10 cm in depth), which indicates δD showed CH4 oxidation in situ as well because shallower layers are provided with O2 from the atmosphere and precipitation. The effect of CH4 exchange between surface dissolved CH4 and atmospheric CH4 can be excluded because all the dissolved CH4 observed in this study was highly oversaturated (>0.3 µmol L−1, Fig. 4) compared to the equilibrium concentration of atmospheric CH4 (4–5 nmol L−1, assuming 1–10 ∘C water temperature and 2 ppm atmospheric CH4 concentration; Yamamoto et al., 1976). Thus, δD values at 10 cm in 2011 were scattered broadly compared with those in 2012 and 2013 that clustered around a low value, suggesting that CH4 oxidation was significant in the surface soil layer during the year of the wetting event (2011). In 2012 and 2013, CH4 oxidation became insignificant, relative to the larger pool of dissolved CH4 (Fig. 4). In the CH4 production incubation experiment, δ13C and δD of produced CH4 were less variable at higher production rates (δ13C = ‰ and δD = ‰ as in Fig. 7). Analogously, those of in situ dissolved CH4 converged at a high CH4 concentration around similar values (δ13C = ‰ and δD = ‰ in Fig. 6). This suggests that δ values of produced CH4 became almost constant under rapid CH4 production in situ and that the convergence of δ values of dissolved CH4 observed in situ reflect rapid CH4 production. Hence, the narrow ranges of δ13C and δD values of dissolved CH4 at 10 cm in depth observed in 2012 and 2013 (δ13C around −50 ‰ and δD around −408 ‰, Fig. 5b) suggest enhanced CH4 production relative to the wetting year (2011).
Multi-year effects of wetting on CH4 flux through soil reduction processes have been previously proposed by Kumagai and Konno (1998) and Desyatkin et al. (2014) as one possible factor for explaining the increase in CH4 flux after wetting. Kumagai and Konno (1998) reported a CH4 flux increase at a temperate rice field in Japan 1 year after the rice field was irrigated and restored from farmland that had been drained for 8 years. Desyatkin et al. (2014) observed flux increases at a thermokarst depression in boreal eastern Siberia during the second consecutive year of flooding following large volumes of precipitation. Conversely, studies at natural wetlands in the northeastern USA (Smemo and Yavitt, 2006; Treat et al., 2007; Olson et al., 2013) and southern Canada (Moore et al., 2011) reported that interannual variations in CH4 flux correspond with those of water level and/or precipitation in the current year. In our study area, multi-year soil reduction may be important because soil temperature is generally lower than 11 ∘C (10 to 30 cm in depth; Fig. S1a and Iwahana et al., 2014) due to a shallow active layer underlain by permafrost. Therefore, decomposition of organic matter can be slow (Treat et al., 2015), which would slowly decrease soil redox potential, allowing it to remain relatively high in the first year of wetting.
In the following 2 years (2012–2013), we observed redox potential values lower than −100 mV in wet areas (Table S6), which are well below the upper limit for CH4 production in soil (Conrad, 2007; Street et al., 2016). Methane production at a potential higher than −100 mV can also occur because soil is heterogeneous and can have more reducing microsites than the rest of the bulk soil, where redox potential can be measured (Teh et al., 2005; Teh and Silver, 2006).
In addition to the multi-year soil reduction, it appears that the wetting event led to the thaw depth increase in wet areas from 2011 to 2013 (Table S1). Although thaw depth increased, summer air temperatures decreased from 2011 (7.7 and 13.0 ∘C as June and July mean temperatures, respectively) to 2012 (7.4, 9.2 ∘C) and 2013 (6.6, 10.5 ∘C) as shown in Fig. 2. The wetting event may have led to the CH4 flux increase from 2011 to 2013 (Fig. 3) partly through the thaw depth increase, by thickening the soil layer where CH4 production occurs (Nakano et al., 2000; van Huissteden et al., 2005). However, the clear increase in dissolved CH4 concentration (Fig. 4) and the enhanced CH4 production and less significant CH4 oxidation reflected in our isotopic data (Fig. 5b) cannot be explained by the thaw depth increase. Additionally, in the incubation experiment of CH4 production (Fig. 7), the CH4 production rate under anaerobic conditions was slower in the deeper layer, especially at 30 cm in depth (mineral soil) compared to 10 cm and 20 cm in depth (organic soil) in sedge_K. Treat et al. (2015) also reported, from a pan-Arctic synthesis of anaerobic incubations, that differences in soil types (organic/mineral) and in substrate quality along depth are important controls on CH4 production rate. Our results from the incubations suggests that the deep layer comprised of mineral soil, where CH4 production becomes active when thaw depth increases, is not the main region for CH4 production.
This study did not evaluate vegetation cover quantitatively, and the wetting event might have also led to some vegetation change (such as increase in sedges), although no drastic changes were found visually in the observed wet areas. Increase in cover by sedges might have raised CH4 flux partly by providing labile organic substrate for CH4 production or conduits for the CH4 transport from the soil to the atmosphere (Chanton, 2005; Lai, 2009; Ström et al., 2015).
4.3 Process behind CH4 production response
When CH4 production is initiated after the onset of anoxia in rice paddy soil, it first occurs via hydrogenotrophic methanogenesis, and then by both hydrogenotrophic and acetoclastic methanogenesis, which increases CH4 production rate (Conrad, 2007). Afterwards, the ratio of acetoclastic to hydrogenotrophic methanogenesis can stabilize (Roy et al., 1997). Considering that this ratio is an important control on isotopic compositions of produced CH4, stabilization of production pathways might explain the convergence in δ values of dissolved CH4 at our study sites under high CH4 concentration (Fig. 6) and the reduced variability in δ values of produced CH4 in our experiment under rapid production conditions (Fig. 7). As acetoclastic methanogenesis leads to higher δ13C in produced CH4 than hydrogenotrophic methanogenesis (Sugimoto and Wada, 1993), acetoclastic methanogenesis may have been activated when dissolved CH4 concentration or CH4 production rate were high during our study. This interpretation is supported by the microbial community analysis (Fig. 8), in which acetoclastic methanogens of Methanosarcinales were more abundant in wet areas, with a higher δ13C of produced CH4 in the incubation. Therefore, the high δ13C values with smaller variation observed at 10 cm in depth in 2012 and 2013 (Fig. 5b) suggest a greater contribution from acetoclastic methanogenesis compared to the wetting year (2011). Similar to findings from rice paddy soil (Conrad, 2007), acetoclastic methanogenesis may have experienced delayed activation after anoxic conditions began in 2011, which could also have promoted CH4 production in 2012 and 2013.
At the taiga–tundra boundary on the Indigirka River lowlands, we observed an increase in CH4 flux in wet areas following the wetting event in 2011 and a further increase in flux in 2013. Our results show interannual variations in δ13C and δD of dissolved CH4, and when compared with our incubation experiments, these variations suggest both enhancement of CH4 production and less significance of CH4 oxidation in 2012 and 2013 compared to 2011. This enhancement of production could be partly caused by activation of acetoclastic methanogenesis following the development of reducing soil conditions after the wetting event. Analyses of isotopic compositions of CH4 both in situ and in incubation experiments can be combined to investigate the effects of CH4 production and oxidation on these isotopic compositions and to clarify the relationship between CH4 flux and wetting. In the future, measuring the δ13C of dissolved CO2 would be useful to further validate activation of acetoclastic methanogenesis (Sugimoto and Wada, 1993; McCalley et al., 2014; Itoh et al., 2015). Outside of these processes, the wetting event might have affected CH4 flux partly via the thaw depth increase or some amount of vegetation change. It would be useful to analyze δ13C and δD values of emitted CH4 in order to assess changes in CH4 transport (such as by increase in sedge cover) and to investigate the relationship between dissolved CH4 concentration and CH4 flux in detail (Chanton, 2005).
In recent years, strong storm activity and wetting events in terrestrial ecosystems have been observed in northern regions (Iijima et al., 2016). A wetting event at the taiga–tundra boundary can switch microreliefs with large interannual variations in soil wetness conditions to significant CH4 sources; we observed clear increases in CH4 flux in wet areas after the wetting event. In order to predict CH4 flux following a wetting event in a permafrost ecosystem, our results show the multi-year process of soil reduction affected by the duration of water saturation in the active layer.
Our data of CH4 flux, concentration and isotope ratios of dissolved CH4, soil incubation experiments, phylogenic compositions of methanogenic archaea, soil temperature, thaw depth, and water level have been deposited in the Arctic Data archive System (ADS), Japan (https://ads.nipr.ac.jp/dataset/A20190211-001, Shingubara et al., 2019). Meteorological data shown in Fig. 2 are available from GHCN-Daily, a NOAA database (https://doi.org/10.7289/V5D21VHZ, Menne et al., 2012b).
The supplement related to this article is available online at: https://doi.org/10.5194/bg-16-755-2019-supplement.
RS and AS designed the experiments and RS carried them out. GI, ST, LM, ST, TM, and TCM helped with sampling, in situ data collection, and preparing resources for the fieldwork. JM contributed to the laboratory analysis. RS prepared the paper with contributions from all co-authors.
The authors declare that they have no conflict of interest.
This research was supported by JSPS Grants-in-Aid for Scientific Research
(KAKENHI) numbers 21403011 and 16H05618, a Grant-in-Aid from the Global
COE Program “Establishment of Center for Integrated Field Environmental
Science” (IFES-GCOE) funded by the Ministry of Education, Culture, Sports,
Science and Technology – Japan (MEXT), JST (Strategic International Collaborative
Research Program: SICORP) EU cooperative research project “Dynamics of
permafrost and methane emission in Arctic terrestrial ecosystem in Eastern
Siberia”, the Green Network of Excellence (GRENE) program funded by MEXT,
and the COPERA (C budget of Ecosystems, Cities and Villages on Permafrost
in Eastern Russian Arctic) project funded by the Belmont Forum through JST.
We sincerely thank Alexander Kononov, Roman Petrov, Egor Starostin, Alexandra Alexeeva, and
other members of the Institute for Biological Problems of Cryolithozone
SB RAS and Tatiana Stryukova, Sergey Ianygin, and other staff at the Allikhovsky Ulus
Inspectorate of Nature Protection for supporting our fieldwork in the
vicinity of Chokurdakh. We also wish to acknowledge help from Yumi Hoshino,
Satori Nunohashi, Kanako Tanaka, Kayoko Saito, Hanae Kudo, and Ruslan Shakhmatov
in our research group at Hokkaido University.
Edited by: Nobuhito Ohte
Reviewed by: two anonymous referees
Caporaso, J. G., Kuczynski, J., Stombaugh, J., Bittinger, K., Bushman, F. D., Costello, E. K., Fierer, N., Peña, A. G., Goodrich, J. K., Gordon, J. I., Huttley, G. A., Kelley, S. T., Knights, D., Koenig, J. E., Ley, R. E., Lozupone, C. A., McDonald, D., Muegge, B. D., Pirrung, M., Reeder, J., Sevinsky, J. R., Turnbaugh, P. J., Walters, W. A., Widmann, J., Yatsunenko, T., Zaneveld, J., and Knight, R.: QIIME allows analysis of high-throughput community sequencing data, Nat. Meth., 7, 335–336, https://doi.org/10.1038/nmeth.f.303, 2010.
Caporaso, J. G., Lauber, C. L., Walters, W. A., Berg-Lyons, D., Lozupone, C. A., Turnbaugh, P. J., Fierer, N., and Knight, R.: Global patterns of 16S rRNA diversity at a depth of millions of sequences per sample, P. Natl. Acad. Sci. USA, 108, 4516–4522, https://doi.org/10.1073/pnas.1000080107, 2011.
Chanton, J. P.: The effect of gas transport on the isotope signature of methane in wetlands, Org. Geochem., 36, 753–768, https://doi.org/10.1016/j.orggeochem.2004.10.007, 2005.
Ciais, P., Sabine, C., Bala, G., Bopp, L., Brovkin, V., Canadell, J., Chhabra, A., DeFries, R., Galloway, J., Heimann, M., Jones, C., Le Quéré, C., Myneni, R. B., Piao, S., and Thornton, P.: Carbon and other biogeochemical cycles, in: Climate change 2013: The physical science basis, Contribution of Working Group I to the Fifth Assessment Report of the Intergovernmental Panel on Climate Change, Cambridge University Press, Cambridge, UK and New York, NY, USA, 465–570, 2014.
Conrad, R.: Microbial ecology of methanogens and methanotrophs, in: Advances in Agronomy, vol. 96, Academic Press, Burlington, San Diego, USA, 1–63, 2007.
Desyatkin, A. R., Takakai, F., and Hatano, R.: Flood effect on CH4 emission from the alas in Central Yakutia, East Siberia, Soil Sci. Plant Nutr., 60, 242–253, https://doi.org/10.1080/00380768.2014.883486, 2014.
Dlugokencky, E. J., Bruhwiler, L., White, J. W. C., Emmons, L. K., Novelli, P. C., Montzka, S. A., Masarie, K. A., Lang, P. M., Crotwell, A. M., Miller, J. B., and Gatti, L. V.: Observational constraints on recent increases in the atmospheric CH4 burden, Geophys. Res. Lett., 36, L18803, https://doi.org/10.1029/2009GL039780, 2009.
Dutaur, L. and Verchot, L. V.: A global inventory of the soil CH4 sink, Global Biogeochem. Cy., 21, GB4013, https://doi.org/10.1029/2006GB002734, 2007.
Flessa, H., Rodionov, A., Guggenberger, G., Fuchs, H., Magdon, P., Shibistova, O., Zrazhevskaya, G., Mikheyeva, N., Kasansky, O. A., and Blodau, C.: Landscape controls of CH4 fluxes in a catchment of the forest tundra ecotone in northern Siberia, Global Change Biol., 14, 2040–2056, https://doi.org/10.1111/j.1365-2486.2008.01633.x, 2008.
Iijima, Y., Nakamura, T., Park, H., Tachibana, Y., and Fedorov, A. N.: Enhancement of Arctic storm activity in relation to permafrost degradation in eastern Siberia, Int. J. Climatol., 36, 4265–4275, https://doi.org/10.1002/joc.4629, 2016.
Ikeda, S., Watanabe, K. N., Minamisawa, K., and Ytow, N.: Evaluation of Soil DNA from Arable Land in Japan Using a Modified Direct-extraction Method, Microbes Environ., 19, 301–309, https://doi.org/10.1264/jsme2.19.301, 2004.
Itoh, M., Shimamura, T., Ohte, N., and Takemon, Y.: Differences in hydrophyte life forms induce spatial heterogeneity of CH4 production and its carbon isotopic signature in a temperate bog peatland: δ13CH4 variations in hydrophyte species, J. Geophys. Res.-Biogeo., 120, 1177–1195, https://doi.org/10.1002/2014JG002881, 2015.
Iwahana, G., Takano, S., Petrov, R. E., Tei, S., Shingubara, R., Maximov, T. C., Fedorov, A. N., Desyatkin, A. R., Nikolaev, A. N., Desyatkin, R. V., and Sugimoto, A.: Geocryological characteristics of the upper permafrost in a tundra-forest transition of the Indigirka River Valley, Russia, Polar Science, 8, 96–113, https://doi.org/10.1016/j.polar.2014.01.005, 2014.
King, G.: Responses of atmospheric methane consumption by soils to global climate change, Global Change Biol., 3, 351–362, https://doi.org/10.1046/j.1365-2486.1997.00090.x, 1997.
Kumagai, K. and Konno, Y.: Methane emissions from rice paddy fields after upland farming, Japan. J. Soil Sci. Plant Nutr., 69, 333–339, https://doi.org/10.20710/dojo.69.4_333, 1998.
Lai, D. Y. F.: Methane dynamics in northern peatlands: A review, Pedosphere, 19, 409–421, https://doi.org/10.1016/S1002-0160(09)00003-4, 2009.
Liang, M., Sugimoto, A., Tei, S., Bragin, I. V., Takano, S., Morozumi, T., Shingubara, R., Maximov, T. C., Kiyashko, S. I., Velivetskaya, T. A., and Ignatiev, A. V.: Importance of soil moisture and N availability to larch growth and distribution in the Arctic taiga-tundra boundary ecosystem, northeastern Siberia, Polar Science, 8, 327–341, https://doi.org/10.1016/j.polar.2014.07.008, 2014.
Marik, T., Fischer, H., Conen, F., and Smith, K.: Seasonal variations in stable carbon and hydrogen isotope ratios in methane from rice fields: Seasonal variations in CH4 isotope ratios from rice, Global Biogeochem. Cy., 16, 1094, https://doi.org/10.1029/2001GB001428, 2002.
McCalley, C. K., Woodcroft, B. J., Hodgkins, S. B., Wehr, R. A., Kim, E.-H., Mondav, R., Crill, P. M., Chanton, J. P., Rich, V. I., Tyson, G. W., and Saleska, S. R.: Methane dynamics regulated by microbial community response to permafrost thaw, Nature, 514, 478–481, https://doi.org/10.1038/nature13798, 2014.
Menne, M. J., Durre, I., Vose, R. S., Gleason, B. E., and Houston, T. G.: An overview of the Global Historical Climatology Network-Daily database, J. Atmos. Ocean. Tech., 29, 897–910, https://doi.org/10.1175/JTECH-D-11-00103.1, 2012a.
Menne, M. J., Durre, I., Korzeniewski, B., McNeal, S., Thomas, K., Yin, X., Anthony, S., Ray, R., Vose, R. S., Gleason, B. E., and Houston, T. G.: Global Historical Climatology Network – Daily (GHCN-Daily), Version 3.22, NOAA National Data Climatic Data Center, Asheville, USA, https://doi.org/10.7289/V5D21VHZ, 2012b.
Moore, T. R., De Young, A., Bubier, J. L., Humphreys, E. R., Lafleur, P. M., and Roulet, N. T.: A multi-year record of methane flux at the Mer Bleue Bog, southern Canada, Ecosystems, 14, 646–657, https://doi.org/10.1007/s10021-011-9435-9, 2011.
Morishita, T., Matsuura, Y., Kajimoto, T., Osawa, A., Zyryanova, O. A., and Prokushkin, A. S.: CH4 and N2O dynamics of a Larix gmelinii forest in a continuous permafrost region of central Siberia during the growing season, Polar Science, 8, 156–165, https://doi.org/10.1016/j.polar.2014.01.004, 2014.
Murase, J., Sugimoto, A., Shingubara, R., and Maximov, T. C.: Methane oxidation potential of Arctic wetland soil of a taiga-tundra ecotone in Northeastern Siberia, in: Japan Geoscience Union Meeting, 28 April–2 May 2014, Yokohama, Japan, ACG36-P16, 2014.
Myhre, G., Shindell, D., Bréon, F.-M., Collins, W., Fuglestvedt, J., Huang, J., Koch, D., Lamarque, J.-F., Lee, D., Mendoza, B., Nakajima, T., Robock, A., Stephens, G., Takemura, T., and Zhang, H.: Anthropogenic and natural radiative forcing, in: Climate change 2013: The physical science basis, Contribution of Working Group I to the Fifth Assessment Report of the Intergovernmental Panel on Climate Change, Cambridge University Press, Cambridge, UK and New York, NY, USA, 658–740, 2013.
Nakano, T., Kuniyoshi, S., and Fukuda, M.: Temporal variation in methane emission from tundra wetlands in a permafrost area, northeastern Siberia, Atmos. Environ., 34, 1205–1213, https://doi.org/10.1016/S1352-2310(99)00373-8, 2000.
Nassif, S. H. and Wilson, E. M.: The Influence of slope and rain intensity on runoff and infiltration, Hydrolog. Sci. Bull., 20, 539–553, https://doi.org/10.1080/02626667509491586, 1975.
Nisbet, E. G., Dlugokencky, E. J., and Bousquet, P.: Methane on the Rise – Again, Science, 343, 493–495, https://doi.org/10.1126/science.1247828, 2014.
Olefeldt, D., Turetsky, M. R., Crill, P. M., and McGuire, A. D.: Environmental and physical controls on northern terrestrial methane emissions across permafrost zones, Global Change Biol., 19, 589–603, https://doi.org/10.1111/gcb.12071, 2013.
Olson, D. M., Griffis, T. J., Noormets, A., Kolka, R., and Chen, J.: Interannual, seasonal, and retrospective analysis of the methane and carbon dioxide budgets of a temperate peatland, J. Geophys. Res.-Biogeo., 118, 226–238, https://doi.org/10.1002/jgrg.20031, 2013.
Parmentier, F. J. W., van Huissteden, J., van der Molen, M. K., Schaepman-Strub, G., Karsanaev, S. A., Maximov, T. C., and Dolman, A. J.: Spatial and temporal dynamics in eddy covariance observations of methane fluxes at a tundra site in northeastern Siberia, J. Geophys. Res.-Biogeo., 116, G01099, https://doi.org/10.1029/2010JG001637, 2011.
Preuss, I., Knoblauch, C., Gebert, J., and Pfeiffer, E.-M.: Improved quantification of microbial CH4 oxidation efficiency in arctic wetland soils using carbon isotope fractionation, Biogeosciences, 10, 2539–2552, https://doi.org/10.5194/bg-10-2539-2013, 2013.
Roy, R., Klüber, H. D., and Conrad, R.: Early initiation of methane production in anoxic rice soil despite the presence of oxidants, FEMS Microbiol. Ecol., 24, 311–320, https://doi.org/10.1111/j.1574-6941.1997.tb00448.x, 1997.
Shingubara, R., Sugimoto, A., Murase, J., Iwahana, G., Tei, S., Liang, M., Takano, S., Morozumi, T., and Maximov, T. C.: Chamber CH4 flux observed at taiga–tundra boundary near Chokurdakh in northeastern Siberia during the summer from 2009 to 2013 as well as isotopic compositions of dissolved CH4 and soil incubation experiments, 1.00, Arctic Data archive System (ADS), Japan, https://ads.nipr.ac.jp/dataset/A20190211-001, last access: 11 February 2019.
Smemo, K. A. and Yavitt, J. B.: A multi-year perspective on methane cycling in a shallow peat fen in central New York State, USA, Wetlands, 26, 20–29, https://doi.org/10.1672/0277-5212(2006)26[20:AMPOMC]2.0.CO;2, 2006.
Street, L. E., Dean, J. F., Billett, M. F., Baxter, R., Dinsmore, K. J., Lessels, J. S., Subke, J.-A., Tetzlaff, D., and Wookey, P. A.: Redox dynamics in the active layer of an Arctic headwater catchment; examining the potential for transfer of dissolved methane from soils to stream water, J. Geophys. Res.-Biogeo., 121, 2776–2792, https://doi.org/10.1002/2016JG003387, 2016.
Ström, L., Falk, J. M., Skov, K., Jackowicz-Korczynski, M., Mastepanov, M., Christensen, T. R., Lund, M., and Schmidt, N. M.: Controls of spatial and temporal variability in CH4 flux in a high arctic fen over three years, Biogeochemistry, 125, 21–35, https://doi.org/10.1007/s10533-015-0109-0, 2015.
Sugimoto, A.: GC/GC/C/IRMS system for carbo isotope measurement of low level methane concentration, Geochem. J., 30, 195–200, https://doi.org/10.2343/geochemj.30.195, 1996.
Sugimoto, A. and Wada, E.: Carbon isotopic composition of bacterial methane in a soil incubation experiment: Contributions of acetate and CO2∕H2, Geochim. Cosmochim. Ac., 57, 4015–4027, https://doi.org/10.1016/0016-7037(93)90350-6, 1993.
Sugimoto, A. and Wada, E.: Hydrogen isotopic composition of bacterial methane: CO2∕H2 reduction and acetate fermentation, Geochim. Cosmochim. Ac., 59, 1329–1337, https://doi.org/10.1016/0016-7037(95)00047-4, 1995.
Teh, Y. A. and Silver, W. L.: Effects of soil structure destruction on methane production and carbon partitioning between methanogenic pathways in tropical rain forest soils, J. Geophys. Res.-Biogeo., 111, G01003, https://doi.org/10.1029/2005JG000020, 2006.
Teh, Y. A., Silver, W. L., and Conrad, M. E.: Oxygen effects on methane production and oxidation in humid tropical forest soils, Global Change Biol., 11, 1283–1297, https://doi.org/10.1111/j.1365-2486.2005.00983.x, 2005.
Treat, C. C., Bubier, J. L., Varner, R. K., and Crill, P. M.: Timescale dependence of environmental and plant-mediated controls on CH4 flux in a temperate fen, J. Geophys. Res., 112, G01014, https://doi.org/10.1029/2006JG000210, 2007.
Treat, C. C., Natali, S. M., Ernakovich, J., Iversen, C. M., Lupascu, M., McGuire, A. D., Norby, R. J., Chowdhury, T. R., Richter, A., Šantrůčková, H., Schädel, C., Schuur, E. A. G., Sloan, V. L., Turetsky, M. R., and Waldrop, M. P.: A pan-Arctic synthesis of CH4 and CO2 production from anoxic soil incubations, Global Change Biol., 21, 2787–2803, https://doi.org/10.1111/gcb.12875, 2015.
van der Molen, M. K., van Huissteden, J., Parmentier, F. J. W., Petrescu, A. M. R., Dolman, A. J., Maximov, T. C., Kononov, A. V., Karsanaev, S. V., and Suzdalov, D. A.: The growing season greenhouse gas balance of a continental tundra site in the Indigirka lowlands, NE Siberia, Biogeosciences, 4, 985–1003, https://doi.org/10.5194/bg-4-985-2007, 2007.
van Huissteden, J., Maximov, T. C., and Dolman, A. J.: High methane flux from an arctic floodplain (Indigirka lowlands, eastern Siberia): Methane Flux Arctic Floodplain Siberia, J. Geophys. Res.-Biogeo., 110, G02002, https://doi.org/10.1029/2005JG000010, 2005.
Woo, M.-K.: Permafrost hydrology, Springer, Berlin, Heidelberg, Germany, https://doi.org/10.1007/978-3-642-23462-0, 2012.
Yabuki, H., Park, H., Suzuki, R., and Ohata, T.: Baseline Meteorological Data in Siberia (BMDS) Version 5.0, 5.00, Arctic Data archive System (ADS), Japan, available at: https://ads.nipr.ac.jp/dataset/A20131107-002 (last access: 31 October 2017), 2011.
Yamamoto, S., Alcauskas, J. B., and Crozler, T. E.: Solubility of methane in distilled water and seawater, J. Chem. Eng. Data, 21, 78–80, https://doi.org/10.1021/je60068a029, 1976.