the Creative Commons Attribution 4.0 License.
the Creative Commons Attribution 4.0 License.
 | 25 Mar 2020
High organic carbon burial but high potential for methane ebullition in the sediments of an Amazonian hydroelectric reservoir
Gabrielle R. Quadra
Sebastian Sobek
José R. Paranaíba
Anastasija Isidorova
Fábio Roland
Roseilson do Vale
Raquel Mendonça
Reservoir sediments sequester significant amounts of organic carbon (OC), but at the same time, high amounts of methane (CH4) can be produced and emitted during the degradation of sediment OC. While the greenhouse gas emission of reservoirs has received a lot of attention, there is a lack of studies focusing on OC burial. In particular, there are no studies on reservoir OC burial in the Amazon, even though hydropower is expanding in the basin. Here we present results from the first investigation of OC burial and CH4 concentrations in the sediments of an Amazonian hydroelectric reservoir. We performed sub-bottom profiling, sediment coring and sediment pore water analysis in the Curuá Una (CUN) reservoir (Amazon, Brazil) during rising- and falling-water periods. The spatially resolved average sediment accumulation rate was 0.6 cm yr−1, and the average OC burial rate was 91 g C m−2 yr−1. This is the highest OC burial rate on record for low-latitude hydroelectric reservoirs. Such a high rate probably results from a high OC deposition onto the sediment, which compensates the high OC mineralization at a 28–30 ∘C water temperature. Elevated OC burial was found near the dam and close to major river inflow areas. C:N ratios between 10.3 and 17 (average ± SD: 12.9±2.1) suggest that both land-derived and aquatic OC accumulate in CUN sediments. About 23 % of the sediment pore water samples had dissolved CH4 above the saturation concentration. This represents a higher share than in other hydroelectric reservoirs, indicating a high potential for CH4 ebullition, particularly in river inflow areas.
- Article
(1549 KB) - Full-text XML
-
Supplement
(813 KB) - BibTeX
- EndNote


Although freshwater ecosystems represent a small fraction of the global area (∼4 % of terrestrial area; Downing et al., 2012; Verpoorter et al., 2014), they play an important role in the global carbon cycle, both emitting carbon to the atmosphere and burying carbon in the sediments (Cole et al., 2007; Tranvik et al., 2009). Many studies have been conducted on inland water carbon emissions, while the organic carbon (OC) burial in inland water sediments is comparatively understudied on a global scale (Raymond et al., 2013; Mendonça et al., 2017). Since a part of the buried OC may offset a share of greenhouse gas emission, it is essential to include OC burial in the carbon balance of inland water ecosystems (Kortelainen et al., 2013; Mendonça et al., 2017).
The freshwater OC burial rate varies both in space and time due to many factors, such as land cover, hydrological conditions, OC and nutrient input, and climate change (Radbourne et al., 2017; Stratton et al., 2019). Several studies have shown that reservoirs bury more OC per unit area than lakes, rivers and oceans (Mulholland and Elwood, 1982; Mendonça et al., 2017), which may be attributed to the high sedimentation rate caused by the extensive sediment trapping when water flow is dammed (Vörösmarty et al., 2003). Considering the importance of reservoirs as a carbon sink (∼28 % to 55 % of total inland water OC burial; Mendonça et al., 2017) and the increasing number of hydroelectric dams (Zarfl et al., 2015), the limited number of studies on OC burial in reservoirs severely hampers the understanding of this important component in the carbon balance of the continents (Mendonça et al., 2017). In particular, large regions of the Earth are at present completely unsampled concerning inland water carbon burial. Approximately 90 % of the sites sampled for carbon burial are in North America and Europe, while there are only few measurements in South American, African and Asian countries (Mendonça et al., 2017).
To the best of our knowledge, OC burial has so far not been studied in an Amazonian reservoir. However, it is likely that reservoirs in tropical rainforest areas bury OC at a comparatively high rate, as temperature and runoff were identified as important drivers of OC burial in lakes and reservoirs (Mendonça et al., 2017). Indeed, OC burial in Amazonian floodplain lakes was reported to be much higher than in other lakes (Sanders et al., 2017). Moreover, many new hydropower dams are planned in the Amazon due to the high potential of the area for hydroelectricity (da Silva Soito and Freitas, 2011; Winemiller et al., 2016). However, there are currently no data to gauge the potential effect of hydropower expansion in the Amazon on carbon burial.
Besides the significant potential of trapping OC in the sediment, reservoirs can be strong sources of methane (CH4) to the atmosphere (Deemer et al., 2016). Several studies have shown a positive relationship between CH4 production and temperature in freshwater ecosystems (Marotta et al., 2014; Wik et al., 2014; Yvon-Durocher et al., 2014; DelSontro et al., 2016; Aben et al., 2017), and also organic matter supply to sediment is an important regulator of CH4 production and emission (Segers, 1998; Sobek et al., 2012; Grasset et al., 2018). Thus, tropical reservoirs, especially those situated in highly productive humid tropical biomes, such as the Amazon, may produce more CH4 than temperate ones due to higher annual temperatures and availability of organic matter in their sediments (Barros et al., 2011; Mendonça et al., 2012; Fearnside and Pueyo, 2012; Almeida et al., 2013), although highly emitting reservoirs can also be situated in temperate regions (Deemer et al., 2016). Further, in many reservoirs, CH4 ebullition (i.e., emission of gas bubbles) is an important or dominant emission pathway, but it is very difficult to measure due to its strong variability in space and time (McGinnis et al., 2006; Deemer et al., 2016). Measurements of dissolved CH4 concentration in sediment pore water may, therefore, help to identify if ebullition is likely to occur (CH4 concentrations close to the sediment pore water saturation) and thus to judge if the sediments act mainly as carbon sinks or also as CH4 sources. While CH4 emission typically constitutes a very small flux in terms of carbon mass, it is highly relevant to climate, since CH4 is a ∼ 34 times stronger greenhouse gas than CO2 (IPCC, 2013). The transformation of sediment OC (i.e., previously fixed CO2) to atmospheric CH4 therefore represents an amplification of radiative forcing in the atmosphere.
Both OC burial and CH4 production take place in sediments. Here, we present results of a study approaching these processes on sediments of an Amazonian hydroelectric reservoir during hydrologically different seasons, which was motivated by an absence of such studies even though sediment carbon processing in Amazonian reservoirs may potentially be high. We aimed at providing a spatially resolved quantification of OC burial, as well as a mapping of CH4 saturation in the sediment pore water, which is indicative of the potential occurrence of CH4 ebullition. This study is thereby intended to contribute to improved understanding of the potential biogeochemical effects of the current expansion of hydropower (Almeida et al., 2019) on the Amazonian carbon budget.
2.1 Study area
Curuá Una (CUN) is an Amazonian reservoir (2∘ 50′ S 54∘18′ W) located in the state of Pará (north of Brazil), created in 1977 and used mainly to produce energy. The average water depth of CUN is 6 m (Fearnside, 2005; Paranaíba et al., 2018), and it has a maximum flooded area of 72 km2 (Duchemin et al., 2000; Fearnside, 2005). The main tributary is the Curuá Una River, contributing with most of the reservoir's water discharge (57.4 %), but the Moju (11.7 %), Mojuí (4.4 %), Poraquê (3.2 %) and other small rivers (2.9 %) are also important (Fearnside, 2005). While tropical rainforest covers 90.8 % of the total CUN catchment area, managed lands, which cover 8.9 % of the total catchment, contribute with a high share (up to 41 %) of the land cover in some sub-catchments (Fig. 1).
The reservoir is characterized by a high number of flooded dead trees (area with trees covers ∼90 % of the total reservoir area), which may be expected to decrease water flow and promote sedimentation. According to a previous study (Paranaíba et al., 2018), CUN is oligotrophic (total nitrogen – TN: 0.7 mg L−1, average; total phosphorus – TP: 0.02 mg L−1, average) and the surface water is warm (average ± SD: 30.1±1.4 ∘C), is slightly acidic (pH of 6.1±0.7), has low conductivity (16±11 µS cm−1) and is moderately oxygenated (6.7±1.9 mg L−1).
2.2 Sampling
We carried out two samplings in the CUN reservoir. In February 2016, during the rising-water period (Fig. S1 in the Supplement), we used an Innomar SES-2000 parametric sub-bottom profiler operating at 100 kHz (primary frequency) and 15 kHz (secondary frequency) to determine the bathymetry and sediment thickness from which we planned to acquire spatially resolved sediment accumulation rates and the OC burial rate, similar to Mendonça et al. (2014). Sediment thickness was difficult to observe with the sub-bottom profiler, though, presumably because of the widespread presence of gas bubbles in the sediment which reflect the sound waves very efficiently, preventing them from reaching the sub-bottom layer. Therefore, OC burial rates were determined from sediment cores only. In September 2017, during the falling water period (Fig. S1), additional sediment cores were then taken to cover the reservoir as much as possible.
We took a total of 114 sediment cores during the two sampling occasions, approximately evenly distributed along the reservoir, both longitudinally and laterally, to measure sediment thickness and, thus, estimate sediment accumulation and OC burial rates (Fig. 1; Table S1 in the Supplement). Cores were retrieved using a gravity corer equipped with a hammer device (UWITEC, Mondsee, Austria) to sample the entire sediment layer, including the pre-flooding material. The layer of transition between post- and pre-flooding material was visually identified. Visual identification is possible because the moment when the reservoir was flooded is the onset of a lacustrine depositional regime, which is characterized by a different sediment texture and composition in relation to the pre-flooding soil or fluvial sediment (Fig. S2). The thickness of the post-flooding sediment was noted in all cores and used to calculate sediment accumulation rates (“data analysis”). Nineteen sediment cores, from sites spread out evenly over the reservoir, were sliced into 2 cm thick slices and dried at 40 ∘C for further laboratory analysis. The samples were weighed before and after drying, and the results are, then, expressed in dry weight.
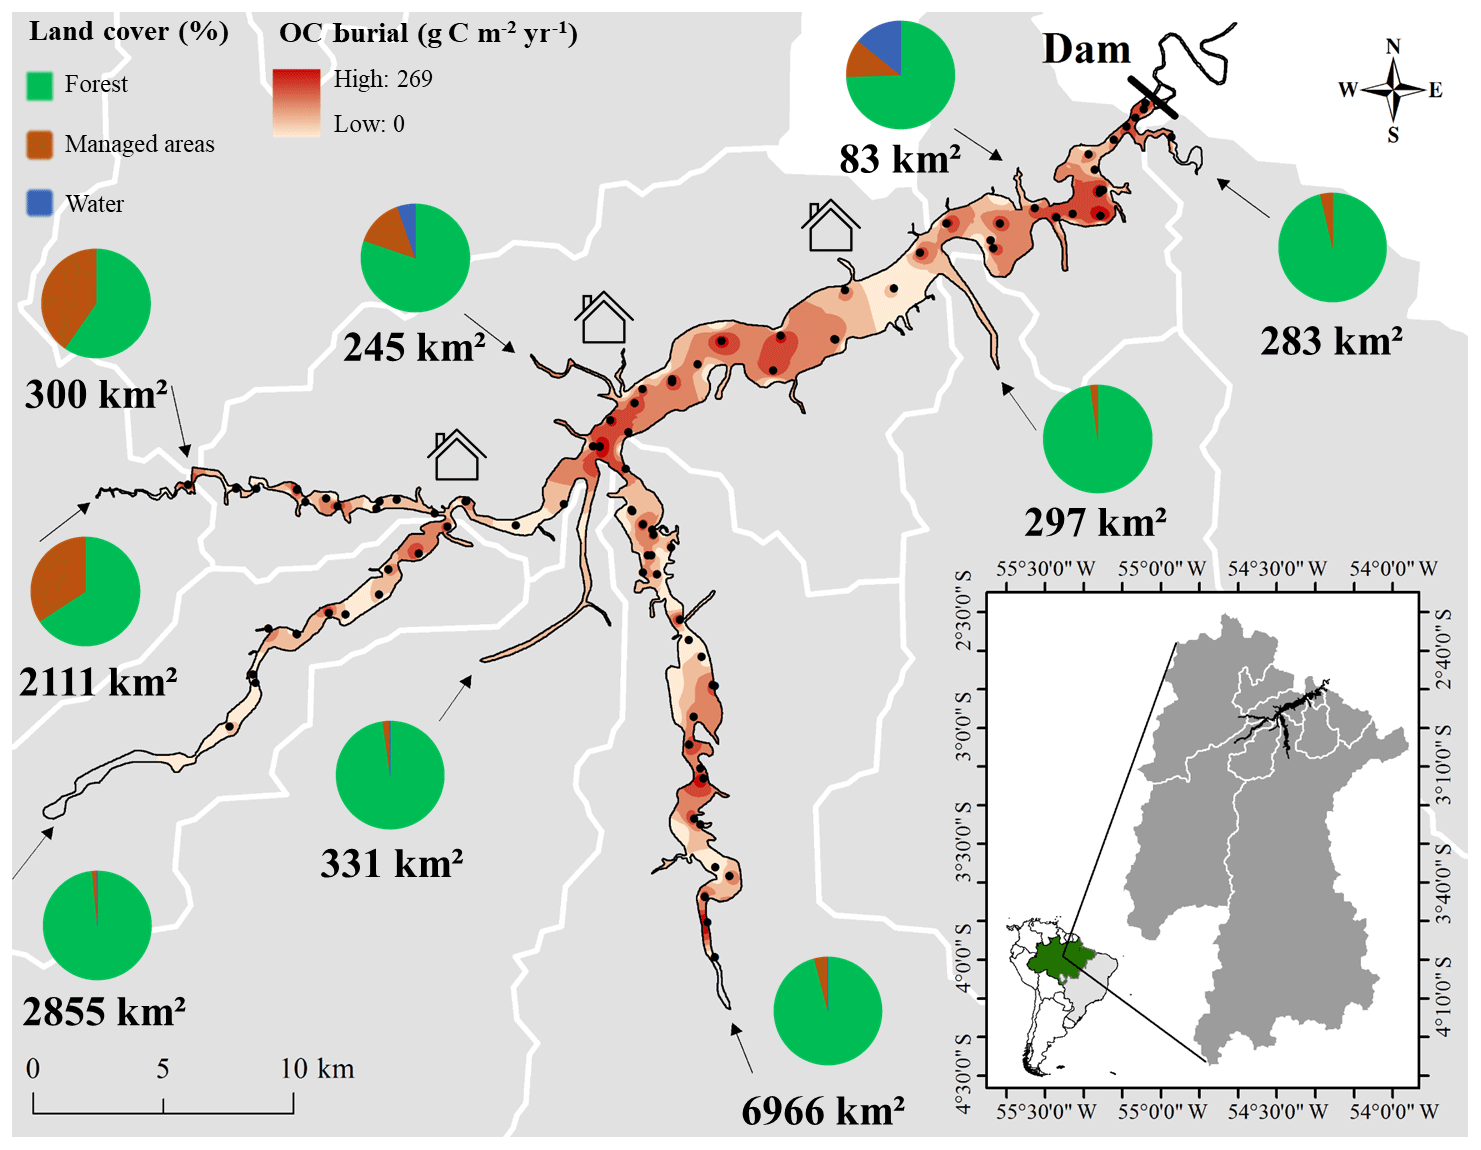
Figure 1Organic carbon burial rate (OC burial; g C m−2 yr−1) of the Curuá Una reservoir. The circles show the land cover of each sub-catchment, delineated by white lines. The numbers near the circles show the area (in km2) for each sub-catchment. The black dots represent the sediment sampling sites to estimate OC burial rates. The arrows represent the main river inflows. The houses represent settlements at the reservoir. The bottom-right map shows the location of the reservoir in Brazil (the green area is the Brazilian Amazon region) and the total extension of each sub-catchment.
In both sampling campaigns, targeted to rising- and falling-water periods, sediment cores were taken for the analysis of pore water CH4 concentration profiles (n=16 in February 2016 and n=9 in September 2017). Of the nine cores taken in September 2017, eight were situated at sites previously sampled in February 2016 to compare the CH4 concentrations between sampling occasions. It is difficult to sample the exact same location at different periods due to the water level changes, GPS error and boat drifting. Thus, the repeated samplings at these eight sites were within <100 m distance.
Water temperature and dissolved oxygen profiles were measured with a multiparameter sonde (YSI 6600 V2) in a total of 28 depth profiles, distributed across the reservoir at both sampling occasions. Air pressure and temperature were measured with a portable anemometer (SkyMaster SpeedTech SM-28, accuracy: 3 %), water depth was measured with a depth gauge (Hondex PS-7), and sediment temperature was measured with a thermometer (Incoterm), which was inserted into the sediment right after core retrieval.
2.3 Carbon and nitrogen analysis
OC and TN concentrations were determined in a subset of 19 cores, distributed evenly across the reservoir area. In each of these cores, the first and second layers (0 to 4 cm deep, containing the fresher OC), the last sediment layer above the pre-flooding soil surface (containing the older OC) and one sample every ∼8 cm in between (OC of intermediate age) were analyzed. This selection of layers for carbon and nitrogen analyses was motivated by the exponential decrease in OC mass loss rates during sediment degradation (Middelburg et al., 1993; Gälman et al., 2008). Linear interpolation was used to derive OC and TN concentrations of layers that were not measured.
Dried sediment samples were ground in a planetary ball mill (Retsch PM 100) equipped with a stainless-steel cup and balls. Sediment was packed into pressed tin capsules and analyzed for TC and TN with a Costech 4010 elemental analyzer. The molar carbon-to-nitrogen (C:N) ratio in the surface layers was then calculated. The presence of carbonates was checked in the samples qualitatively by adding drops of acid and checking visually for reaction. No evidence of solid carbonates was found; thus measurements of TC correspond to OC.
2.4 CH4 concentration in pore water
The CH4 concentration in pore water was measured according to Sobek et al. (2012) to determine if CH4 is close to saturation concentration and, thus, prone to forming gas bubbles. The saturation concentration, calculated here from temperature and pressure along the sediment profiles, represents the maximum concentration that dissolves in pore water, above which bubbles are formed. The presence of gas bubbles is indicative of an elevated probability of CH4 ebullition but does not necessarily relate quantitatively to ebullition flux, since ebullition flux to the atmosphere is also dependent on water depth, sediment grain size and pressure fluctuations (McGinnis et al., 2006; Maeck et al., 2014; Liu et al., 2016). The top 20 cm (February 2016) or 40 cm (September 2017) of the sediment cores was sampled every 2 cm. Deeper sediment was sampled every 4 cm until the bottom or pre-flooding material was reached. Using a core liner with side ports, 2 mL of sediment was collected using a syringe with a cut-off tip, added to a 25 mL glass vial with 10 mL of distilled water and closed with a 10 mm thick butyl rubber stopper. The slurry (2 mL sediment plus 10 mL distilled water) was equilibrated with 13 mL headspace of ambient air (void volume of the glass vial) immediately after sampling by vigorously shaking the glass vial, and then the headspace was transferred to another syringe. The headspace was stored in the syringe, closed with a gas-tight valve and then analyzed for CH4 concentration within the same day using an Ultraportable Greenhouse Gas Analyzer (UGGA; Los Gatos Research) with a custom-made sample injection port. Then, the resulting peaks were integrated using R software (RStudio Version 1.1.383, RStudio Team, 2015). The CH4 concentration in the pore water was calculated from the headspace CH4 concentration based on Henry's law constants. The saturation concentration of CH4 in each sediment layer was calculated based on air pressure, water depth, sediment temperature and sample depth within the sediment core. The sediment layers with CH4 concentrations above 100 % saturation were considered to be prone to ebullition. This is a conservative assumption because it is likely that a part of the CH4 in the sediment was lost to the atmosphere due to pressure drop during core retrieval as well as during sample processing.
2.5 Data analysis
The average sediment accumulation rate (SAR; cm yr−1) was calculated for each of the 114 cores by dividing the thickness of the post-flooding sediment (cm) by the years since the reservoir construction (39 years in 2016 or 40 years in 2017), according to the following equation:
This approach returns the average sediment accumulation rate over the lifetime of the reservoir (Renwick et al., 2005; Kunz et al., 2011; Mendonça et al., 2014; Quadra et al., 2019) and therefore incorporates any short-term variability in sediment deposition, for example, caused by an episodic change in sediment load or internal sediment movement. The large number of core samples distributed evenly across the reservoir body also covers the spatial variability in sediment deposition, for example due to sediment focusing (sediment movement with preferential deposition in deeper areas).
OC burial rates (g C m−2 yr−1) were calculated for the subset of 19 sites where OC content was analyzed. OC mass (g C) in each sediment slice was calculated as OC content (g C g−1) multiplied by dry sediment mass (g). Total OC mass (g C) in the cores was the sum of OC mass in all post-flooding sediment layers. Then, the average OC burial rate (g C m−2 yr−1) for each of these 19 sites was calculated by dividing the total OC mass in post-flooding sediment (g C) by the core surface area ( m2) and the reservoir age (years) at the sampling dates, according to the following equation:
The empirical relationship between the SAR and OC burial rate (see Results; ; R2=0.87; Fig. S3) was used to estimate the OC burial rate (g C m−2 yr−1) for the remaining 95 coring sites where OC content was not analyzed.
To produce spatially resolved maps of the SAR and OC burial rate, the data from the 114 cores were interpolated to the reservoir area using the inverse-distance weighting (IDW) algorithm (cell size of approximately 22 m × 22 m). From the spatially resolved average OC burial rate, the reservoir age (40 years) and total flooded area (72 km2), we calculated the total OC stock in the reservoir sediment. Using the same approach, we interpolated the pore water CH4 concentration and C:N ratio for the whole reservoir area. Spatial analyses were performed in ArcGIS 10.3.1 (ESRI).
To investigate any potential relationships between the land cover of sub-catchments and the spatial distribution of sediment characteristics and rates, land cover data were derived from maps of 1 km resolution (Global Land Cover Project, GLC2000), made available by the European Commission's science and knowledge service, including 23 land cover classes. The classes found in the CUN watershed were then grouped into three main classes: (1) forest (tree cover, natural vegetation, shrub and herbaceous cover), (2) managed areas (cultivated and managed areas, cropland and bare areas) (3) and water bodies. The extent of the CUN watershed and sub-catchments were identified using the WWF HydroBASINS tool (HydroSHEDS, 2019).
To verify the differences between CH4 concentrations in the two seasons (rising and falling water), the non-parametric Wilcoxon test was performed using the software JMP 14.1.0 (SAS).
3.1 Water column profiles
The water column temperature profiles showed an average of 30±1, 29±1 and 29±2 ∘C (average ± SD) in the surface, the middle and the bottom layer, respectively. The dissolved oxygen average was 7±1, 6±1 and 5±1 mg L−1 in the surface, the middle and the bottom layer, respectively. These water profiles suggest that the relatively shallow water column does not develop stable stratification over any extended periods of time, even if short-lived stratification events can occur (Table S2).
3.2 Sediment accumulation and organic carbon burial rates
The SAR in the coring sites (n=114) varied from 0 to 1.7 cm yr−1 (0.6±0.4 cm yr−1, 95 % confidence interval: 0.5–0.7 cm yr−1; Table S1). In some areas of rocky or sandy bottom, especially near river inflows and along the main riverbed, sediment could not be retrieved with our corer, and the SAR was considered to be zero (total of 10 sites). The OC burial rate in the coring sites (n=114) varied from 0 to 269 g C m−2 yr−1 (91±61 g C m−2 yr−1, 95 % confidence interval: 80–102 g C m−2 yr−1; Table S1). The highest values of OC burial were observed near the dam, at the confluence of the major inflowing rivers and in the inflow area of the main tributary of the Curuá Una River (Fig. 1). Our sampling was representative of the whole system, from the margins, where there is a greater presence of dead tree trunks, to the riverbed, where the sedimentation was lower (Fig. 1). Therefore, the simple average OC burial from the cores resulted in the same average OC burial rate derived from the spatial interpolation (91 g C m−2 yr−1). The total burial rate for the CUN reservoir area was 6.5×10¹⁰ g C yr−1, corresponding to an accumulation of 0.3 Tg C in CUN sediments since its construction.
3.3 C:N ratio and land cover
The C:N ratio of the surface layers of sediment (n=19), used as an indicator of the organic matter source, varied from 10.3 to 17 (12.9±2.1; Table S3; Fig. 2). Higher C:N ratios were observed in the dam area and at the river inflows (Fig. 2).
Tropical rainforest was the dominant land cover in CUN, covering from 60.6 % to 98.6 % of the sub-catchment areas. Managed areas covered 1.4 % to 40.9 % of the sub-catchments areas, with the higher values occurring in the northwestern tributaries, which were also smaller compared to the southern ones (Fig. 1). Water surfaces covered 0.3 % of the total CUN catchment area (Table S4).
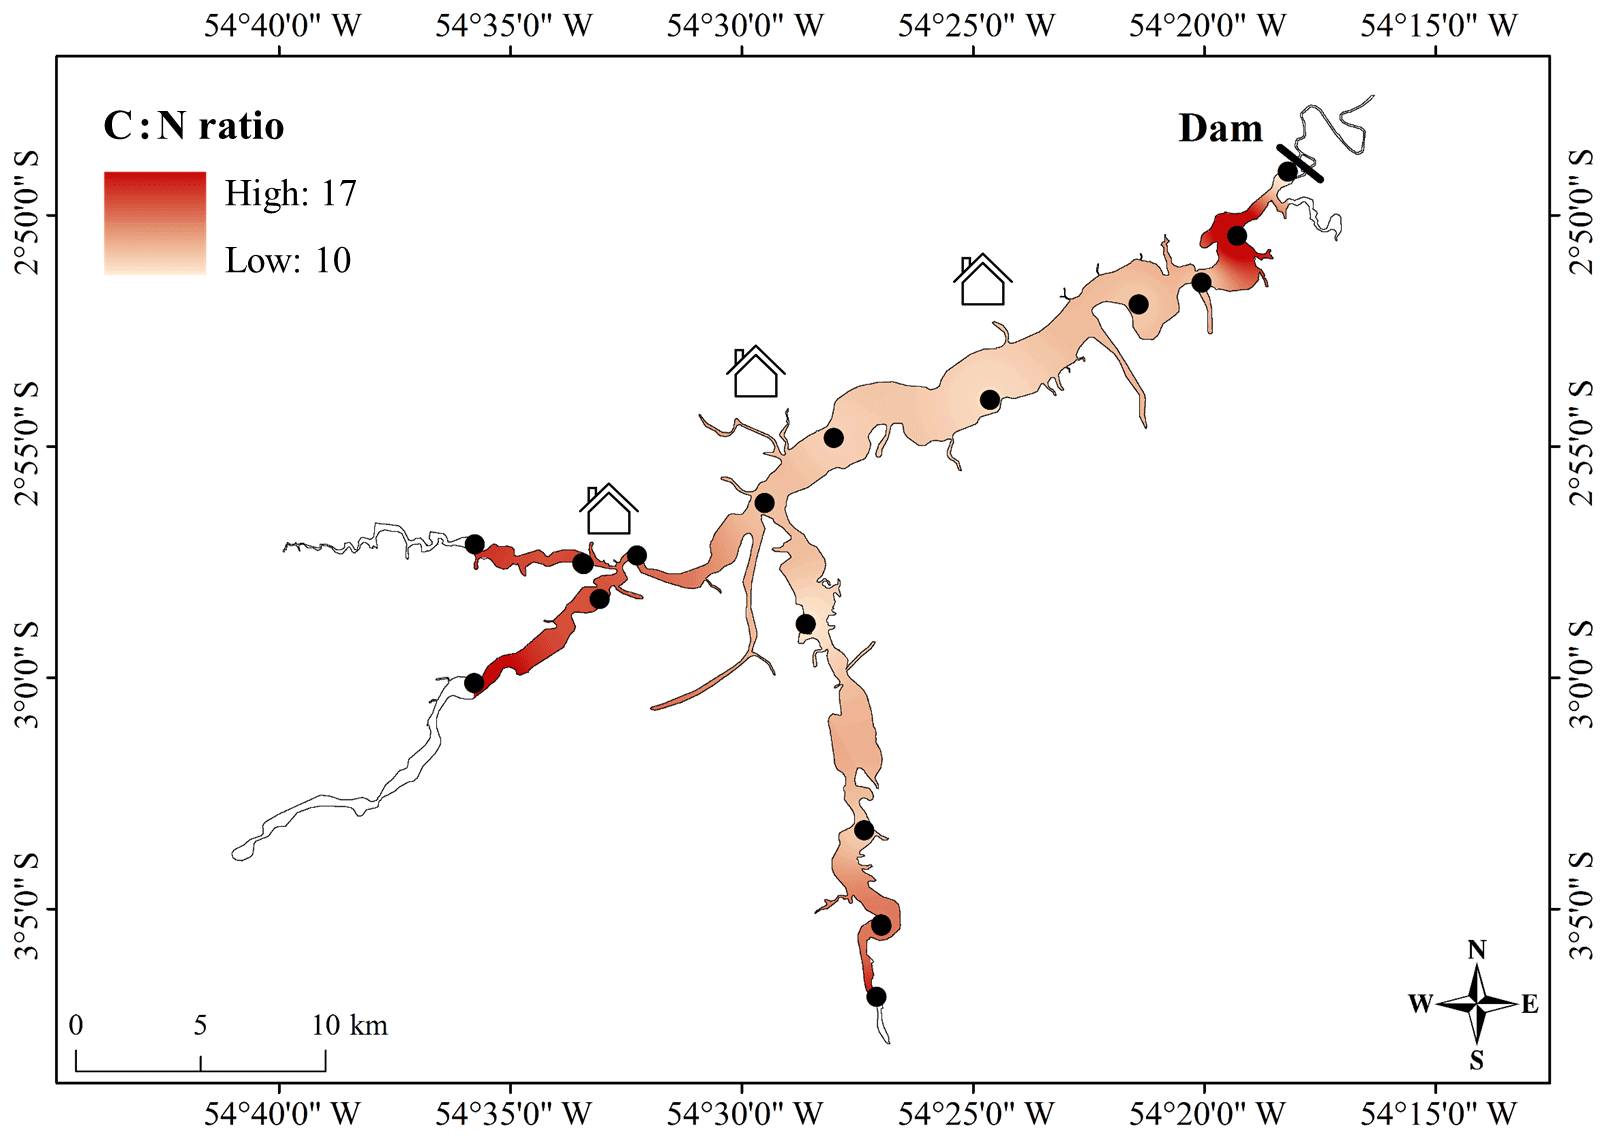
Figure 2C:N ratio of surface sediment in Curuá Una reservoir. The black dots represent the sampling sites. The houses represent the settlements at the reservoir.
3.4 Pore water CH4 profiles and saturation
The overall average CH4 concentration in pore water from CUN was 1729±1939 µmol L−1 of CH4, with similar averages during rising-water (1700±1637 µmol L−1 of CH4; Fig. S4) and falling-water (1764±2243 µmol L−1 of CH4; Fig. S4) periods. At eight sites, we could make paired observations of CH4 concentration in sediment pore water at both rising-water and falling-water periods (Fig. 3). These data show that the seasonal difference of CH4 concentration in pore water was low and not significant (S=33213, , ). Of the 25 pore water CH4 profiles, 20 contained at least one sample with pore water CH4 above the 100 % saturation concentration; of the total of 386 pore water samples, 90 samples (23 %) were above the CH4 saturation concentration. Pore water CH4 saturation was higher in river inflow areas, especially in sampling sites in the main Curuá Una River. The confluence of the rivers and the dam area was also characterized by high pore water CH4 (Fig. 4). The widespread appearance of gas bubbles in the sediment is in accordance with the sub-bottom profiler data, which for a large part of the reservoir could not be used to identify sub-bottom structures because of a very strong acoustic reflector in surficial sediment, presumably gas bubbles.

Figure 3Paired observations of pore water CH4 profiles during rising-water (R) and falling-water (F) periods at eight different sampling sites across the reservoir. Black lines represent the CH4 saturation concentration (µmol L−1), and grey lines represent the measured CH4 concentration (µmol L−1) over sediment depth. The numbers following the letters F and R correspond to the site codes in Table S1.
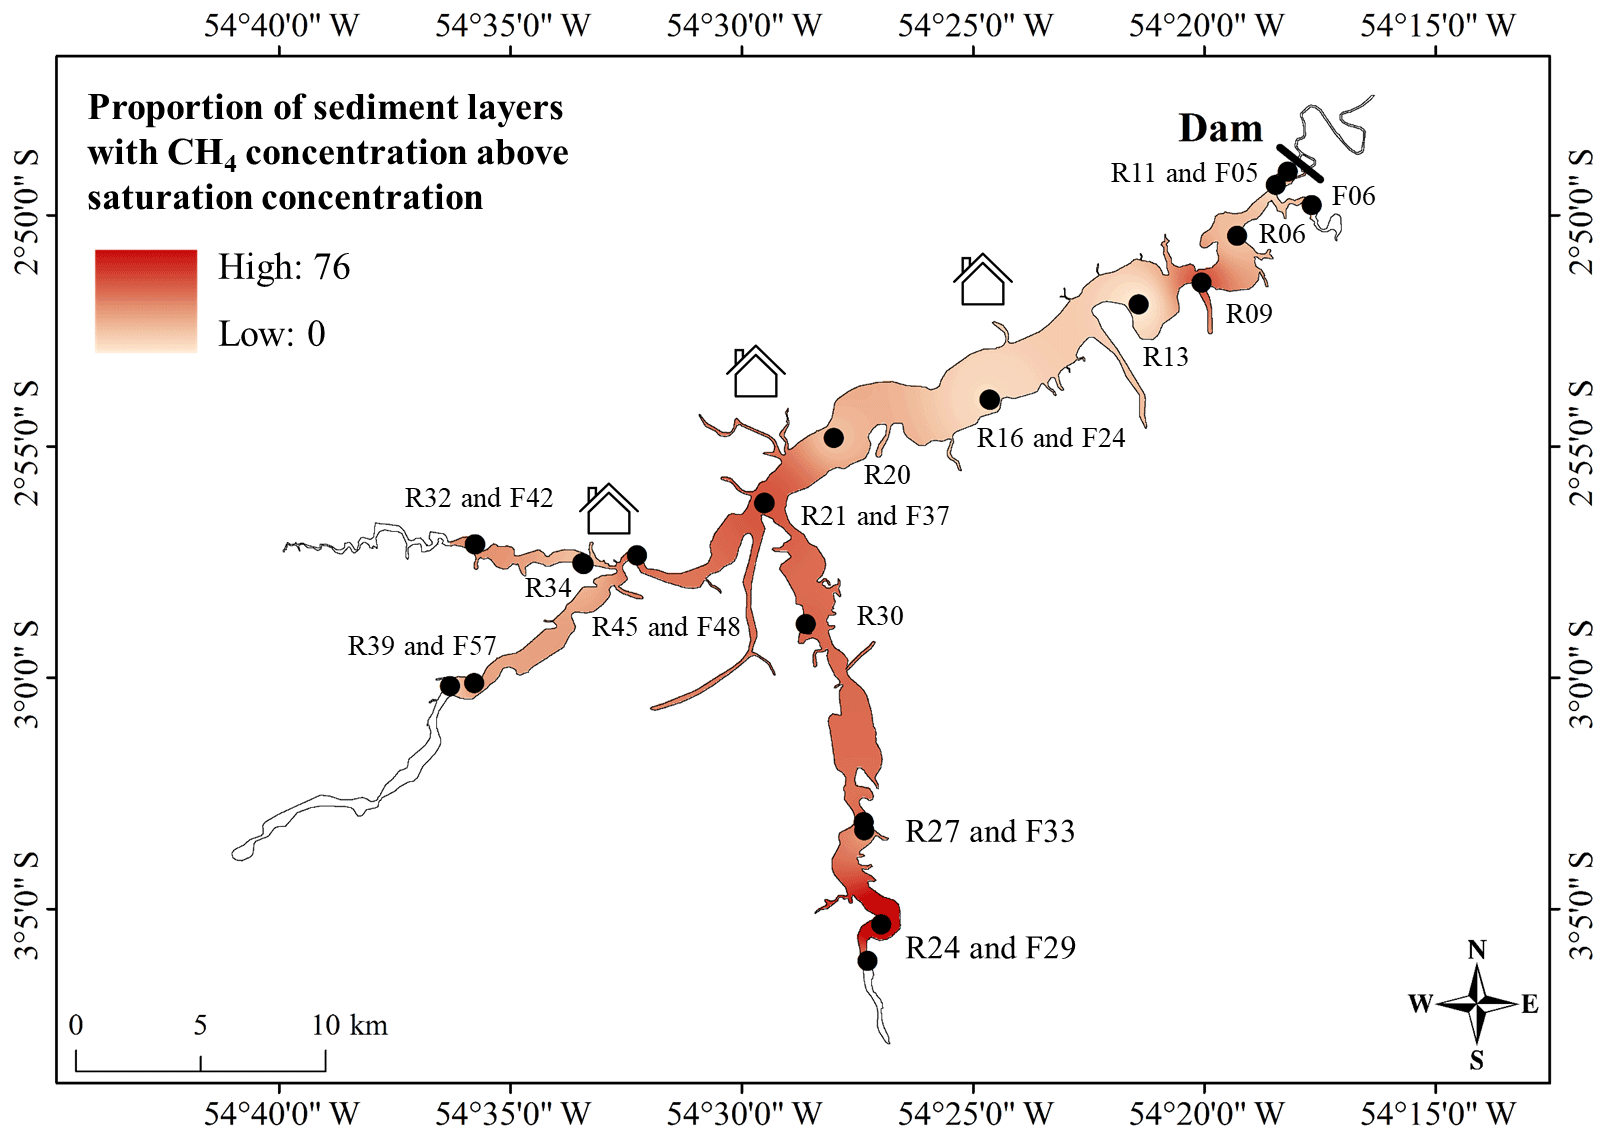
Figure 4Percentage of sediment layers with CH4 concentration above saturation. The black dots represent the sampling sites to produce the interpolation. The houses represent the settlements at the reservoir.
Despite the intense OC mineralization in the tropics, this study found that OC burial in the sediment of the Amazonian Curuá Una reservoir was high when compared to sub-tropical and other tropical reservoirs, probably due to the high carbon inputs from the forest. However, autochthonous material was also an important component of CUN sediment. CH4 concentrations in the sediment pore water were frequently supersaturated, indicating that the sediment of CUN also has the potential to emit CH4 to the atmosphere via ebullition.
4.1 SAR and OC burial in an Amazonian reservoir
When a river enters a reservoir, the water flow tends to decrease, favoring the deposition of suspended particles (Fisher, 1983; Scully et al., 2003). Typically, reservoir sedimentation rates are higher in the inflow areas and lower near the shores (Morris and Fan, 1998; Sedláček et al., 2016). CUN showed a high SAR near the inflow areas, especially in the main tributary, but in contrast to other reservoirs (e.g., Mendonça et al., 2014), we did not observe any decrease in the SAR towards the margins (i.e., the shore). In CUN, sediment accumulation across the entire reservoir area is favored by the shallow topography of the area and by the presence of dead tree trunks along the reservoir including the margins, which reduce water flow and wave-driven resuspension. Accordingly, our data show that the SAR was randomly distributed in relation to the water column depth (Fig. S5). Some reservoirs show higher sedimentation rates near the dam; this can be called “muddy lake area” (Morris and Fan, 1998; Sedláček et al., 2016) and occurs in reservoirs where the fine sediment is transported all the way to the dam (Morris and Fan, 1998; Jenzer Althaus et al., 2009; Sedláček et al., 2016; Schleiss et al., 2016). CUN may be one of those cases (Fig. 1), possibly because water retention time is short in the main river channel, which is narrow and well separated from the dead tree area, permitting transport of fine-grained sediment until the deeper dam area, where sediments tend to accumulate (Lehman, 1975; Blais and Kalff, 1995). Sediment accumulation was also high at the confluence of the three main tributaries (Fig. 1), probably due to sediment deposition as water flow slows down when the rivers enter the main body of the reservoir.
Although the average SAR in CUN (0.6 cm yr−1) was only slightly higher than that of non-Amazonian reservoirs in Brazil (e.g., Mendonça et al., 2014: 0.5 cm yr−1; Franklin et al., 2016: 0.4 cm yr−1), OC burial rates were much higher in CUN than in other hydroelectric reservoirs in the tropics and sub-tropics. For example, OC burial was 4 times lower in Lake Kariba (23 g C m−2 yr−1, Zimbabwe; Kunz et al., 2011) and about 2 times lower in Mascarenhas de Moraes (42 g C m−2 yr−1, Brazil; Mendonça et al., 2014) and other Brazilian reservoirs (40±28 g C m−2 yr−1, Brazil; Sikar et al., 2009) when compared to CUN. Even though natural lakes tend to bury OC at lower rates than artificial reservoirs (Mendonça et al., 2017), some Amazonian floodplain lakes showed higher OC burial rates than the CUN reservoir (266±57 g C m−2 yr−1; Sanders et al., 2017). This is probably due to their smaller sizes, which may result in a higher SAR, since there is little area for sediment deposition but high sediment load from the river during periods of high discharge. While a comparison with the latest global estimate of OC burial in reservoirs – median of 291 g C m−2 yr−1 (Mendonça et al., 2017) – may lead to the conclusion that OC burial in CUN is low, it must be accounted that this global estimate (Mendonça et al., 2017) includes many small agricultural reservoirs (farm ponds), which are generally highly eutrophic systems that receive high sediment inputs from agriculture, resulting in extremely high OC burial rates (Downing et al., 2008). Hence, if compared to other hydroelectric reservoirs at low latitudes, our conclusion remains that OC burial in CUN is high. Importantly, comparisons of the average SAR and OC burial rate between studies may be complicated by different sampling schemes, as sedimentation can vary in space and time (Radbourne et al., 2017; Stratton et al., 2019); for example, while in some studies, sites along the margins with zero sedimentation were sampled (e.g., Mendonça et al., 2014; our study), in other studies this was not sampled (Moreira-Turcq et al., 2004; Knoll et al., 2014).
The high OC burial in CUN when compared to other low-latitude hydroelectric reservoirs is probably due to the high OC inputs from the productive Amazonian rainforest (Zhang et al., 2017), which compensates the intense sediment mineralization rates caused by high temperature. Using the linear regression model from a compilation of mineralization in freshwater sediments from the literature (Cardoso et al., 2014),
and the average temperature of the bottom water in CUN (29 ∘C), sediment OC mineralization is estimated at an average of 325 g C m−2 yr−1. This estimation assumes the same sample size as OC burial (n=114) and consequently that the random error of each individual prediction (Cardoso et al., 2014) largely averages out and becomes negligible (<1 g C m−2 yr−1) for the average of predicted OC mineralization. This estimate of the average sediment OC mineralization rate is on the upper end of the range of values found for Brazilian reservoirs (Cardoso et al., 2014) but may even be conservative given that the CUN reservoir is located in a highly productive biome with high organic matter supply. The total OC deposition rate onto the sediment (OC mineralization + OC burial) of CUN is thus 418 g C m−2 yr−1, returning a estimated average OC burial efficiency of 22 % (OC burial efficiency is the OC burial ∕ OC deposition rate; Sobek et al., 2009). As expected, due to the positive effect of temperature on mineralization, the estimated average OC burial efficiency in the CUN reservoir is low in comparison to other reservoirs (at least 41 % in the tropical Lake Kariba – Kunz et al., 2011; average of 67 % in the sub-tropical Mascarenhas de Moraes reservoir – Mendonça et al., 2016; average of 87 % in the temperate lake Wohlen reservoir – Sobek et al., 2012). A low OC burial efficiency allows high OC burial only if OC deposition onto the sediment is high enough, and we suggest that the high productivity of the surrounding Amazonian rainforest constitutes a strong OC supply to CUN sediments.
The C:N ratio indicates that the sediment OC in CUN consists of a mixture of land-derived and internally produced OC. The surface sediment C:N ratio varied from 10.3 to 17.0 (Table S3), and the C:N ratio of phytoplankton is typically 6–9, that of aquatic macrophytes is >10, that of land plants is >40 (Meyers and Ishiwatari, 1993; Grasset et al., 2019) and that of Amazonian topsoils is 10 to 14 (Batjes and Dijkshoorn, 1999). Although we refrained from making quantitative analysis based on C:N ratios, higher C:N values at the river inflow areas (Fig. 2) may indicate input from the highly productive watershed and thus the high load of land-derived OC to the sediment. Tropical rainforest is the dominant land cover in the CUN catchment (91 %; Fig. 1), which may suggest that the high OC burial rates in CUN are related to a high OC input from the watershed. However, there was no strong relation between the OC burial rate and C:N ratio (Fig. S7a), even though the C:N ratio has been shown to affect the OC burial efficiency (Sobek et al., 2009). Possibly, the strong effect of the SAR on OC burial masked the potential effect of the C:N ratio. In addition, the middle section of the reservoir was characterized by a relatively low C:N ratio, indicating a significant share of aquatic OC in the sediment (Fig. 2). Likely, the higher water transparency downstream from the river inflow areas due to particle settling stimulates aquatic primary production. Possibly, also sewage input from riverside communities (represented as houses in Fig. 2) contributes with N to the reservoir and thus further stimulates aquatic production, since a comparatively low C:N ratio was found near these settlements. Also, even at low C:N ratios, OC burial rates were high (Fig. S6a). Hence, it is evident that internally produced OC makes up an important contribution to the OC buried in the sediments of CUN. The source of buried OC has an important implication in terms of accounting for the sediment carbon as a new sink or not (Prairie et al., 2017), since the burial of aquatic OC can be ascribed to aquatic primary production in the reservoir, which would not have taken place in the absence of the dam and thus represents a new carbon sink. However, our data do not allow us to make a quantitative estimate of the share of the CUN sediment carbon stock that is of aquatic origin and thus may be accountable as a new carbon sink resulting from river damming (Prairie et al., 2017).
The spatial pattern of OC burial suggests that the catchment size affects sediment load and sedimentation, since the largest sub-catchment (6966 km2), entering CUN from the south, corresponds to high OC burial rates in the southern river inflow area (Fig. 1). The northwestern tributaries, which drain only 2111 and 300 km2, are not associated with high OC burial in the northeastern tributary (Fig. 1), possibly because they are smaller, even though they have a higher share of managed land (34 % and 41 %, respectively) than the southern sub-catchment (4 %). Apparently, even though land management increases erosion (Syvitski and Kettner, 2011), we cannot detect any such effect on sediment OC burial. Also concerning the C:N ratio, an effect of land cover is not evident, since the inflow area of the forest-dominated sub-catchment in the southwest (2855 km2; 99 % forest) had a similar C:N ratio to the tributary of the northwestern sub-catchments, with their higher share of managed land. Possibly, the effect of land cover is masked by other factors affecting sediment OC and C:N, such as internal productivity and local particle settling patterns.
Despite being high compared to other hydroelectric reservoirs, OC burial in CUN represents only 15 % of the total carbon emission to the atmosphere reported for the CUN reservoir (509 g C m−2 yr−1; Duchemin et al., 2000). Similarly, a study conducted in a boreal Canadian reservoir found that OC burial corresponded to 10 % of reservoir carbon emission (Teodoru et al., 2012), although burial in other reservoirs can be close to (70 %; Mendonça et al., 2014) or even much higher than the total carbon emission to the atmosphere (1600 %; Sobek et al., 2012). The magnitudes of carbon burial in relation to the emission in reservoirs depend on many factors (Mendonça et al., 2012). Therefore, although freshwater carbon emission tends to be consistently higher than OC burial in Amazonian freshwater systems (Mendonça et al., 2012), we cannot speculate in how far the results of this study apply to other reservoirs in the Amazon region, since many factors affect the carbon processing in inland waters.
4.2 High potential for CH4 ebullition
The high amount of pore water CH4 profiles with samples above the CH4 saturation concentration indicates a high likelihood of gas bubble formation in most of the sampled sites and thus the possibility of CH4 ebullition (Table S5). Importantly, however, the link between bubble presence in the sediment and CH4 ebullition flux is entirely qualitative and cannot be used to estimate the magnitude of CH4 ebullition. Sites with a higher OC burial rate, i.e., river inflow areas, especially the Curuá Una River, the confluence of the three main rivers and the dam area, also showed a tendency towards a higher extent of CH4 saturation (Fig. 4). However, while the relationship between average CH4 saturation and OC burial at the different sites was positive, it was also weak but clearly shows the overall high level of CH4 saturation in CUN sediments (Fig. 5). Hence, the CH4 production in CUN sediments may rather be influenced by the OC supply rate to anaerobic sediment layers than by the reactivity of the sediment OC, since there was no association between the C:N ratio and the extent of CH4 saturation (Fig. S7b). Links between the high sedimentation rate and sediment CH4 pore water concentration as well as CH4 ebullition have been reported previously (Sobek et al., 2012; Maeck et al., 2013), and in addition, fresh land plant-derived organic matter such as leaves transported by the rivers may fuel substantial CH4 production at anoxic conditions (Grasset et al., 2018). This highlights that sediment accumulation bottoms close to river inflow areas can be prone to exhibiting high CH4 ebullition (DelSontro et al., 2011), not least because the shallow water column in inflow areas (Fig. S6) facilitates CH4 bubble transport to the atmosphere.
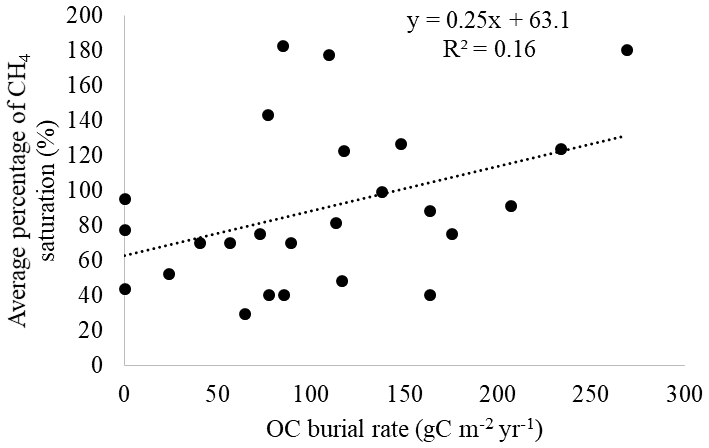
Figure 5Regression model of average percentage of CH4 saturation (%) in the sediment pore water and OC burial rate (g C m−2 yr−1). Each circle represents one sampling site.
Compared to other reservoirs, CUN had a higher share of sites (20 of 25) with pore water CH4 concentration over the saturation threshold. In the Mascarenhas de Morais reservoir (Brazil), 6 of 16 sites with pore water CH4 concentration over the saturation threshold were found (Mendonça et al., 2016). In Lake Wohlen (Switzerland), four of eight sites with pore water CH4 concentration over the threshold were found (Sobek et al., 2012). However, these differences should be interpreted with caution. Using the 100 % saturation concentration as a threshold may underestimate the potential for ebullition, since changes in the pressure may result in bubble release during sediment sampling, especially in layers above 100 % saturation. Therefore, our results of the degree of pore water CH4 saturation, as well as the results from the literature cited above, are conservative.
We did not find a statistical difference between CH4 pore water concentration during rising-water and falling-water periods (Fig. 3), although other studies suggest a strong influence of water level or pressure changes on CH4 ebullition (Mattson and Likens, 1990; Eugster et al., 2011; Maeck et al., 2014). Interestingly, two of the eight sites with generally low CH4 pore water concentration were low at both sampling occasions, indicating that there may be an important spatial component in sediment CH4 production and saturation (Fig. 3; sites F24×R16 and F57×R39), which, however, was not related to the C:N ratio or OC burial rate at these sites.
The comparatively high OC burial rate of the Amazonian CUN reservoir probably results from high OC deposition onto the sediment, since the warm water (28–30 ∘C) implies a high sediment OC mineralization rate. The forest seems to be a major OC source to the reservoir, although the relatively low C:N ratio in some parts of the reservoir suggests an also significant aquatic contribution to sediment OC burial. In some parts of the reservoir, particularly in the river inflow areas, sediments are probably a CH4 source by ebullition. Therefore, large inputs from a highly productive forest probably boost the OC burial rate, as well as CH4 production, with a still unknown net effect on the regional carbon budget. Given the planned expansion of hydropower dams in the Amazon region, and the high OC burial rate in CUN shown here, future studies should quantify how OC burial and CH4 emission may be affected by new Amazonian hydroelectric reservoirs. Moreover, it will be critical to quantify the effect of the new Amazonian reservoirs on the ocean's carbon budget, since the CUN dam alone retains yearly 7500 t of OC, and a part of it would likely reach the ocean in the absence of the dam.
All the data used in this study can be found in the paper and in the Supplement.
The supplement related to this article is available online at: https://doi.org/10.5194/bg-17-1495-2020-supplement.
GRQ, JRP, AI, RM and RV carried out the sampling campaigns. GRQ processed the data. AI analyzed the samples. GRQ and JRP prepared the figures. RM, SS and FR designed the study. All authors contributed to interpreting data and writing the paper.
The authors declare that they have no conflict of interest.
The research leading to these results has received funding from the European Research Council under the European Union's Seventh Framework Programme (FP7/2007–2013; ERC grant agreement no. 336642). Sebastian Sobek received additional support by the program Pesquisador Visitante Especial, Ciência sem Fronteiras, grant no. 401384/2014-4. This study was also financed in part by the Coordenação de Aperfeiçoamento de Pessoal de Nível Superior (CAPES) – finance code 001. Fábio Roland has been supported by the Conselho Nacional de Desenvolvimento Científico e Tecnológico (CNPq; grant no. 401384/2014-4). We are thankful for the support from ELETRONORTE during the field campaigns.
This research has been supported by the European Research Council (grant no. HYDROCARB (336642)), the Coordenação de Aperfeiçoamento de Pessoal de Nível Superior (grant no. 001), and the Conselho Nacional de Desenvolvimento Científico e Tecnológico (grant no. 401384/2014-4).
This paper was edited by Clare Woulds and reviewed by Maciej Bartosiewicz and three anonymous referees.
Aben, R. C., Barros, N., Van Donk, E., Frenken, T., Hilt, S., Kazanjian, G., Lamers, L. P., Peeters, E. T., Roelofs, J. G., and de Senerpont Domis, L. N.: Cross continental increase in methane ebullition under climate change, Na. Commun., 8, 1682, https://doi.org/10.1038/ngeo1211, 2017.
Almeida, R. M., Barros, N., Cole, J. J., Tranvik, L., and Roland, F.: Emissions from Amazonian dams, Nature Clim. Change, 3, 1005, https://doi.org/10.1038/nclimate2049, 2013.
Almeida, R. M., Shi, Q., Gomes-Selman, J. M., Wu, X., Xue, Y., Angarita, H., Barros, N., Forsberg, B. R., García-Villacorta, R., Hamilton, S. K., Melack, J. M., Montoya, M., Perez, G., Sethi, S. A., Gomes, C. P., and Flecker, A. S.: Reducing greenhouse gas emissions of Amazon hydropower with strategic dam planning, Nat. Commun., 10, 1–9, 2019.
Barros, N., Cole, J. J., Tranvik, L. J., Prairie, Y. T., Bastviken, D., Huszar, V. L., Del Giorgio, P., and Roland, F.: Carbon emission from hydroelectric reservoirs linked to reservoir age and latitude, Nature Geosci., 4, 593, https://doi.org/10.1038/ngeo1211, 2011.
Batjes, N. H. and Dijkshoorn, J. A.: Carbon and nitrogen stocks in the soils of the Amazon Region, Geoderma, 89, 273–286, 1999.
Blais, J. M. and Kalff, J.: The influence of lake morphometry on sediment focusing, Limnol. Oceanogr., 40, 582–588, 1995.
Cardoso, S. J., Enrich-Prast, A., Pace, M. L., and Roland, F.: Do models of organic carbon mineralization extrapolate to warmer tropical sediments?, Limnol. Oceanogr., 59, 48–54, 2014.
Cole, J. J., Prairie, Y. T., Caraco, N. F., McDowell, W. H., Tranvik, L. J., Striegl, R. G., Duarte, C. M., Kortelainen, P., Downing, J. A., and Middelburg, J. J.: Plumbing the global carbon cycle: integrating inland waters into the terrestrial carbon budget, Ecosystems, 10, 172–185, 2007.
da Silva Soito, J. L., and Freitas, M. A. V.: Amazon and the expansion of hydropower in Brazil: Vulnerability, impacts and possibilities for adaptation to global climate change, Renew. Sust. Energ. Rev., 15, 3165–3177, 2011.
Deemer, B. R., Harrison, J. A., Li, S., Beaulieu, J. J., DelSontro, T., Barros, N., Bezerra-Neto, J. F., Powers, S. M., Dos Santos, M. A., and Vonk, J. A.: Greenhouse gas emissions from reservoir water surfaces: a new global synthesis, BioScience, 66, 949–964, 2016.
DelSontro, T., Kunz, M. J., Kempter, T., Wüest, A., Wehrli, B., and Senn, D. B.: Spatial heterogeneity of methane ebullition in a large tropical reservoir, Environ. Sci. Technol., 45, 9866–9873, 2011.
DelSontro, T., Boutet, L., St-Pierre, A., del Giorgio, P. A., and Prairie, Y. T.: Methane ebullition and diffusion from northern ponds and lakes regulated by the interaction between temperature and system productivity, Limnol. Oceanogr., 61, S62–S77, 2016.
Downing, J. A., Cole, J. J., Middelburg, J. J., Striegl, R. G., Duarte, C. M., Kortelainen, P., Prairie, Y. T., and Laube, K. A.: Sediment organic carbon burial in agriculturally eutrophic impoundments over the last century, Global Biogeochem. Cy., 22, 1–10, https://doi.org/10.1029/2006GB002854, 2008.
Downing, J. A., Cole, J. J., Duarte, C., Middelburg, J. J., Melack, J. M., Prairie, Y. T., Kortelainen, P., Striegl, R. G., McDowell, W. H., and Tranvik, L. J.: Global abundance and size distribution of streams and rivers, Inland Waters, 2, 229–236, 2012.
Duchemin, É., Lucotte, M., Canuel, R., Queiroz, A. G., Almeida, D. C., Pereira, H. C., and Dezincourt, J.: Comparison of greenhouse gas emissions from an old tropical reservoir with those from other reservoirs worldwide, Internationale Vereinigung für theoretische und angewandte Limnologie: Verhandlungen, 27, 1391–1395, 2000.
Eugster, W., DelSontro, T., and Sobek, S.: Eddy covariance flux measurements confirm extreme CH4 emissions from a Swiss hydropower reservoir and resolve their short-term variability, Biogeosciences, 8, 2815–2831, https://doi.org/10.5194/bg-8-2815-2011, 2011.
Fearnside, P. M.: Do hydroelectric dams mitigate global warming? The case of Brazil's Curuá-Una Dam, Mitigation and Adaptation Strategies for Global Change, 10, 675–691, 2005.
Fearnside, P. M. and Pueyo, S.: Greenhouse-gas emissions from tropical dams, Nature Clim. Change, 2, 382, https://doi.org/10.1038/nclimate1540, 2012.
Fisher, R. V.: Flow transformations in sediment gravity flows, Geology, 11, 273–274, 1983.
Franklin, R. L., Fávaro, D. I. T., and Damatto, S. R.: Trace metal and rare earth elements in a sediment profile from the Rio Grande Reservoir, Sao Paulo, Brazil: determination of anthropogenic contamination, dating, and sedimentation rates, J. Radioanal. Nucl. Ch., 307, 99–110, 2016.
Gälman, V., Rydberg, J., de-Luna, S. S., Bindler, R., and Renberg, I.: Carbon and nitrogen loss rates during aging of lake sediment: changes over 27 years studied in varved lake sediment, Limnol. Oceanogr., 53, 1076–1082, 2008.
Grasset, C., Mendonça, R., Villamor Saucedo, G., Bastviken, D., Roland, F., and Sobek, S.: Large but variable methane production in anoxic freshwater sediment upon addition of allochthonous and autochthonous organic matter, Limnol. Oceanogr., 63, 1488–1501, 2018.
Grasset, C., Abril, G., Mendonça, R., Roland, F., and Sobek, S.: The transformation of macrophyte-derived organic matter to methane relates to plant water and nutrient contents, Limnol. Oceanogr., 64, 1737–1749, https://doi.org/10.1002/lno.11148, 2019.
HydroBASINS: https://www.hydrosheds.org/page/hydrobasins (last access: June 2019), 2019.
IPCC: Stocker, T. F., Qin, D., Plattner, G. K., Tignor, M., Allen, S. K., Boschung, J., Nauels, A., Xia, Y., Bex, V., Midgley, P. M. Climate change 2013: The physical science basis, available at: https://www.ipcc.ch/site/assets/uploads/2017/09/WG1AR5_Frontmatter_FINAL.pdf (last access: March 2020), 2013.
Jenzer Althaus, J., De Cesare, G., Boillat, J.-L., and Schleiss, A.: Turbidity currents at the origin of reservoir sedimentation, case studies, Proceedings (on CD) of the 23rd Congress of the Int. Commission on Large Dams CIGB-ICOLD, 58–60, 2009.
Knoll, L. B., Vanni, M. J., Renwick, W. H., and Kollie, S.: Burial rates and stoichiometry of sedimentary carbon, nitrogen and phosphorus in M idwestern US reservoirs, Freshwater Biol., 59, 2342–2353, 2014.
Kortelainen, P., Rantakari, M., Pajunen, H., Huttunen, J. T., Mattsson, T., Juutinen, S., Larmola, T., Alm, J., Silvola, J., and Martikainen, P. J.: Carbon evasion/accumulation ratio in boreal lakes is linked to nitrogen, Global Biogeochem. Cy., 27, 363–374, 2013.
Kunz, M. J., Anselmetti, F. S., Wüest, A., Wehrli, B., Vollenweider, A., Thüring, S., and Senn, D. B.: Sediment accumulation and carbon, nitrogen, and phosphorus deposition in the large tropical reservoir Lake Kariba (Zambia/Zimbabwe), J. Geophys. Res.-Biogeosc., 116, G03003, https://doi.org/10.1029/2010JG001538, 2011.
Lehman, J. T.: Reconstructing the Rate of Accumulation of Lake Sediment: The Effect of Sediment Focusing 1, Quaternary Res., 5, 541–550, 1975.
Liu, L., Wilkinson, J., Koca, K., Buchmann, C., and Lorke, A.: The role of sediment structure in gas bubble storage and release, J. Geophys. Res.-Biogeosc., 121, 1992–2005, 2016.
Maeck, A., DelSontro, T., McGinnis, D. F., Fischer, H., Flury, S., Schmidt, M., Fietzek, P., and Lorke, A.: Sediment trapping by dams creates methane emission hot spots, Environ. Sci. Technol., 47, 8130–8137, 2013.
Maeck, A., Hofmann, H., and Lorke, A.: Pumping methane out of aquatic sediments – ebullition forcing mechanisms in an impounded river, Biogeosciences, 11, 2925–2938, https://doi.org/10.5194/bg-11-2925-2014, 2014.
Marotta, H., Pinho, L., Gudasz, C., Bastviken, D., Tranvik, L. J., and Enrich-Prast, A.: Greenhouse gas production in low-latitude lake sediments responds strongly to warming, Nature Clim. Change, 4, 467, https://doi.org/10.1038/nclimate2222, 2014.
Mattson, M. D. and Likens, G. E.: Air pressure and methane fluxes, Nature, 347, 718, https://doi.org/10.1038/347718b0, 1990.
McGinnis, D. F., Greinert, J., Artemov, Y., Beaubien, S., and Wüest, A.: Fate of rising methane bubbles in stratified waters: How much methane reaches the atmosphere?, J. Geophys. Res.-Oceans, 111, C09007, https://doi.org/10.1029/2005JC003183, 2006.
Mendonça, R., Kosten, S., Sobek, S., Barros, N., Cole, J. J., Tranvik, L., and Roland, F.: Hydroelectric carbon sequestration, Nature Geosci., 5, 838, https://doi.org/10.1038/ngeo1653, 2012.
Mendonça, R., Kosten, S., Sobek, S., Cole, J. J., Bastos, A. C., Albuquerque, A. L., Cardoso, S. J., and Roland, F.: Carbon sequestration in a large hydroelectric reservoir: an integrative seismic approach, Ecosystems, 17, 430–441, 2014.
Mendonça, R., Kosten, S., Sobek, S., Cardoso, S. J., Figueiredo-Barros, M. P., Estrada, C. H. D., and Roland, F.: Organic carbon burial efficiency in a subtropical hydroelectric reservoir, Biogeosciences, 13, 3331–3342, https://doi.org/10.5194/bg-13-3331-2016, 2016.
Mendonça, R., Müller, R. A., Clow, D., Verpoorter, C., Raymond, P., Tranvik, L. J., and Sobek, S.: Organic carbon burial in global lakes and reservoirs, Nat. Commun., 8, 1694, https://doi.org/10.1038/s41467-017-01789-6, 2017.
Meyers, P. A. and Ishiwatari, R.: Lacustrine organic geochemistry – an overview of indicators of organic matter sources and diagenesis in lake sediments, Organ. Geochem., 20, 867–900, 1993.
Middelburg, J. J., Vlug, T., Jaco, F., and Van der Nat, W. A.: Organic matter mineralization in marine systems, Global Planet. Change, 8, 47–58, 1993.
Moreira-Turcq, P., Jouanneau, J., Turcq, B., Seyler, P., Weber, O., and Guyot, J.-L.: Carbon sedimentation at Lago Grande de Curuai, a floodplain lake in the low Amazon region: insights into sedimentation rates, Palaeogeogr. Palaeoclimatol. Palaeoecol., 214, 27–40, 2004.
Morris, G. L. and Fan, J.: Reservoir sedimentation handbook: design and management of dams, reservoirs, and watersheds for sustainable use, McGraw Hill Professional, 1998.
Mulholland, P. J. and Elwood, J. W.: The role of lake and reservoir sediments as sinks in the perturbed global carbon cycle, Tellus, 34, 490–499, 1982.
Paranaíba, J. R., Barros, N., Mendonc ̧a, R., Linkhorst, A., Isidorova, A., Roland, F., Almeida, R. M., and Sobek, S.: Spatially resolved measurements of CO2 and CH4 concentration and gas-exchange velocity highly influence carbon-emission estimates of reservoirs, Environ. Sci. Technol., 52, 607–615, 2018.
Prairie, Y. T., Alm, J., Beaulieu, J., Barros, N., Battin, T., Cole, J., Del Giorgio, P., DelSontro, T., Guérin, F., and Harby, A.: Greenhouse gas emissions from freshwater reservoirs: what does the atmosphere see?, Ecosystems, 21, 1058–1071, https://doi.org/10.1007/s10021-017-0198-9, 2017.
Quadra, G. R., Lino, A., Sobek, A., Malm, O., Barros, N., Guida, Y., Thomaz, J., Mendonça, R., Cardoso, S., Estrada, C., Rust, F., and Roland, F.: Environmental Risk of Metal Contamination in Sediments of Tropical Reservoirs, B. Environ. Contam. Tox., 103, 292–301, https://doi.org/10.1007/s00128-019-02668-0, 2019.
Radbourne, A. D., Ryves, D. B., Anderson, N. J., and Scott, D. R.: The historical dependency of organic carbon burial efficiency, Limnol. Oceanogr., 62, 1480–1497, 2017.
Raymond, P. A., Hartmann, J., Lauerwald, R., Sobek, S., McDonald, C., Hoover, M., Butman, D., Striegl, R., Mayorga, E., and Humborg, C.: Global carbon dioxide emissions from inland waters, Nature, 503, 355, https://doi.org/10.1038/nature12760, 2013.
Renwick, W. H., Smith, S. V., Bartley, J. D., and Buddemeier, R. W.: The role of impoundments in the sediment budget of the conterminous United States, Geomorphology, 71, 99–111, 2005.
Sanders, L. M., Taffs, K. H., Stokes, D. J., Sanders, C. J., Smoak, J. M., Enrich-Prast, A., Macklin, P. A., Santos, I. R., and Marotta, H.: Carbon accumulation in Amazonian floodplain lakes: A significant component of Amazon budgets?, Limnol. Oceanogr. Lett., 2, 29–35, 2017.
Schleiss, A. J., Franca, M. J., Juez, C., and De Cesare, G.: Reservoir sedimentation, J. Hydraul. Res., 54, 595–614, 2016.
Scully, M., Friedrichs, C. T., and Wright, L.: Numerical modeling of gravity-driven sediment transport and deposition on an energetic continental shelf: Eel River, northern California, J. Geophys. Res.-Oceans, 108, 3120, https://doi.org/10.1029/2002JC001467, 2003.
Sedláček, J., Bábek, O., and Kielar, O.: Sediment accumulation rates and high-resolution stratigraphy of recent fluvial suspension deposits in various fluvial settings, Morava River catchment area, Czech Republic, Geomorphology, 254, 73–87, 2016.
Segers, R.: Methane production and methane consumption: a review of processes underlying wetland methane fluxes, Biogeochemistry, 41, 23–51, 1998.
Sikar, E., Matvienko, B., Santos, M., Rosa, L., Silva, M., Santos, E., Rocha, C., and Bentes Jr., A.: Tropical reservoirs are bigger carbon sinks than soils, Internationale Vereinigung für theoretische und angewandte Limnologie: Verhandlungen, 30, 838–840, 2009.
Sobek, S., Durisch-Kaiser, E., Zurbrügg, R., Wongfun, N., Wessels, M., Pasche, N., and Wehrli, B.: Organic carbon burial efficiency in lake sediments controlled by oxygen exposure time and sediment source, Limnol. Oceanogr., 54, 2243–2254, 2009.
Sobek, S., DelSontro, T., Wongfun, N., and Wehrli, B.: Extreme organic carbon burial fuels intense methane bubbling in a temperate reservoir, Geophys. Res. Lett., 39, L01401, https://doi.org/10.1029/2011GL050144, 2012.
Stratton, L. E., Haggerty, R., and Grant, G. E.: The Importance of Coarse Organic Matter and Depositional Environment to Carbon Burial Behind Dams in Mountainous Environments, J. Geophys. Res.-Ea. Surf., 124, 2118–2140, 2019.
Syvitski, J. P. and Kettner, A.: Sediment flux and the Anthropocene. Philosophical Transactions of the Royal Society A: Mathematical, Phys. Eng. Sci., 369, 957–975, 2011.
RStudio Team: RStudio: Integrated Development for R. RStudio, Inc., Boston, MA, available at: http://www.rstudio.com/ (last access: March 2020), 2015.
Teodoru, C. R., Bastien, J., Bonneville, M. C., del Giorgio, P. A., Demarty, M., Garneau, M., Hélie, J. F., Pelletier, L., Prairie, Y. T., and Roulet, N. T.: The net carbon footprint of a newly created boreal hydroelectric reservoir, Global Biogeochem. Cy., 26, GB2016, https://doi.org/10.1029/2011GB004187, 2012.
Tranvik, L. J., Downing, J. A., Cotner, J. B., Loiselle, S. A., Striegl, R. G., Ballatore, T. J., Dillon, P., Finlay, K., Fortino, K., and Knoll, L. B.: Lakes and reservoirs as regulators of carbon cycling and climate, Limnol. Oceanogr., 54, 2298–2314, 2009.
Verpoorter, C., Kutser, T., Seekell, D. A., and Tranvik, L. J.: A global inventory of lakes based on high-resolution satellite imagery, Geophys. Res. Lett., 41, 6396–6402, 2014.
Vörösmarty, C. J., Meybeck, M., Fekete, B., Sharma, K., Green, P., and Syvitski, J. P.: Anthropogenic sediment retention: major global impact from registered river impoundments, Global Planet. Change, 39, 169–190, 2003.
Wik, M., Thornton, B. F., Bastviken, D., MacIntyre, S., Varner, R. K., and Crill, P. M.: Energy input is primary controller of methane bubbling in subarctic lakes, Geophys. Res. Lett., 41, 555–560, 2014.
Winemiller, K. O., McIntyre, P. B., Castello, L., Fluet-Chouinard, E., Giarrizzo, T., Nam, S., Baird, I., Darwall, W., Lujan, N., and Harrison, I.: Balancing hydropower and biodiversity in the Amazon, Congo, and Mekong, Science, 351, 128–129, 2016.
Yvon-Durocher, G., Allen, A. P., Bastviken, D., Conrad, R., Gudasz, C., St-Pierre, A., Thanh-Duc, N., and Del Giorgio, P. A.: Methane fluxes show consistent temperature dependence across microbial to ecosystem scales, Nature, 507, 488, https://doi.org/10.1038/nature13164, 2014.
Zarfl, C., Lumsdon, A. E., Berlekamp, J., Tydecks, L., and Tockner, K.: A global boom in hydropower dam construction, Aquat. Sci., 77, 161–170, 2015.
Zhang, Y., Xiao, X., Wu, X., Zhou, S., Zhang, G., Qin, Y., and Dong, J.: A global moderate resolution dataset of gross primary production of vegetation for 2000–2016, Scientific Data, 4, 170165, https://doi.org/10.1038/sdata.2017.165, 2017.