the Creative Commons Attribution 4.0 License.
the Creative Commons Attribution 4.0 License.
 | 15 Apr 2020
Acrylic acid and related dimethylated sulfur compounds in the Bohai and Yellow seas during summer and winter
Xi Wu
Pei-Feng Li
Hong-Hai Zhang
Mao-Xu Zhu
Chun-Ying Liu
Gui-Peng Yang
Spatiotemporal distributions of dissolved acrylic acid (AAd) and related biogenic sulfur compounds including dimethylsulfide (DMS) and dissolved and total dimethylsulfoniopropionate (DMSPd and DMSPt) were investigated in the Bohai Sea (BS) and Yellow Sea (YS) during summer and winter. AAd and DMS production from DMSPd degradation and AAd degradation were analyzed. Significant seasonal variations in AAd and DMS(P) were observed. AAd exhibited similar distributions during summer and winter; i.e., relatively high values of AAd occurred in the BS and the northern YS, and the concentrations decreased from inshore to offshore areas in the southern YS. Due to strong biological production from DMSP and abundant terrestrial inputs from rivers in summer, the AAd concentrations in the surface seawater during summer (30.01 nmol L−1) were significantly higher than those during winter (14.98 nmol L−1). The average concentration sequence along the transects during summer (AAd > DMSPt > DMS > DMSPd) showed that particulate DMSP (DMSPp) acted as a DMS producer and that terrestrial sources of AAd were present; in contrast, the sequence in winter was AAd > DMSPt > DMSPd > DMS. High values of AAd and DMS(P) were mostly observed in the upper layers, with occasional high values at the bottom. High AAd concentrations in the porewater, which could be transported to the bottom water, might result from the cleavage of intracellular DMSP and reduce bacterial metabolism in sediments. In addition, the production and degradation rates of biogenic sulfur compounds were significantly higher in summer than in winter, and the removal of AAd was primarily attributed to microbial consumption. Other sources of AAd existed aside from the production from DMSPd.
- Article
(4967 KB) - Full-text XML
- BibTeX
- EndNote


Dimethylsulfide (DMS), which is biologically derived from the enzymatic cleavage of dimethylsulfoniopropionate (DMSP), is the dominant volatile sulfur compound released from the ocean to the atmosphere (Lovelock et al., 1972; Dacey and Wakeham, 1986). The annual emission of DMS from the ocean contributes 28.1 (17.6–34.4) Tg S to the atmosphere (Lana et al., 2011). Moreover, DMS is correlated with the natural acidity of rain (Nguyen et al., 1992). DMS produced in surface waters can chemically influence the marine system, global sulfur cycle, and global climate. The CLAW hypothesis proposes that the oxidation products of DMS are the major sources of cloud condensation nuclei (CCN), leading to an increase in aerosol albedo over the ocean and, consequently, to a decrease in solar radiation on the Earth's surface (Charlson et al., 1987; Malin et al., 1992; Zindler et al., 2012), although recent studies argued that other sources (e.g., bubbles bursting at the ocean surface) are the major contributors to CCN on global scales (Quinn and Bates, 2011). Therefore, more studies are needed to further our understanding of the potential links between DMS and climate change.
DMSP, the biochemical precursor of DMS (Malin and Erst, 1997; Alcolombri et al., 2015), is produced by marine phytoplankton and marine heterotrophic bacteria (Keller et al., 1989; Curson et al., 2017). As an antioxidant, a cryoprotectant, and an osmolyte in marine phytoplankton, the production of DMSP is influenced by environmental parameters such as salinity (Stefels, 2000), temperature (Kirst et al., 1991), and oxidative stress (Sunda et al., 2002). DMSP distributions are also controlled by phytoplankton species, among which coccolithophorids, dinoflagellates, and prymnesiophytes are highly productive algae of DMSP (Keller et al., 1989), and diatoms, flagellates, prochlorophytes, and cyanobacteria are low producers of DMSP (McParland and Levine, 2019). Furthermore, DMSP provides considerable sulfur and carbon sources for the microbial food web. In addition, the degradation of DMSP occurs through two main pathways. The dominant pathway is demethylation, a complicated process generating different ultimate products through different enzymes possibly including methanethiol, hydrogen sulfide, and acrylic acid (AA) (Taylor and Visscher, 1996; Bentley and Chasteen, 2004; Reisch et al., 2011). The other pathway is enzymatic cleavage of DMSP into equimolar DMS and AA by phytoplankton (Steinke et al., 2002) and bacteria (Ledyard and Dacey, 1996); this is a minor pathway that contributes, on average, only 10 % to DMSP degradation (Reisch et al., 2011).
AA is chemically the simplest unsaturated carboxylic acid, and in coastal seawater it is not only derived from DMSP cleavage but also from anthropogenic contamination via river discharges (Sicre et al., 1994). The removal of AA occurs mainly through two mechanisms, i.e., photochemical degradation (Bajt et al., 1997; Wu et al., 2015) and microbial degradation (Noordkamp et al., 2000). AA plays diverse roles in marine systems. For example, AA is an important carbon source for the microbial community (Noordkamp et al., 2000), while it also acts as an antibacterial agent (Sieburth, 1960; Slezak et al., 1994). Furthermore, the presence of AA functions as grazing-activated chemical defense and thus inhibits the predation of phytoplankton by microzooplankton (Wolfe et al., 1997).
Many aspects of DMS and DMSP have been well documented, including spatiotemporal distributions, degradation, sea-to-air fluxes, and particle size fractionation (Lana et al., 2011; Levine et al., 2012; Yang et al., 2014; Espinosa et al., 2015). Recently, the biogeochemistry of AA in the oceans and the roles of AA in the marine sulfur cycle and the microbial community have received increasing attention globally. Kinsey et al. (2016) explored the effects of iron limitation and UV radiation on Phaeocystis antarctica growth and AA concentrations. The concentrations, biological uptake, and respiration of dissolved AA (AAd) were investigated in the northern Gulf of Mexico (Tyssebotn et al., 2017). Tan et al. (2017) and Wu et al. (2017) reported the spatial distributions of AA in the Changjiang Estuary and the East China Sea. Liu et al. (2016) investigated the spatial and diurnal variations in AA in the Bohai Sea (BS) and Yellow Sea (YS) during autumn and measured the apparent production rates of AA through DMSP degradation by incubations. However, seasonal variations, the source and removal of AA, and the key factors controlling these processes remain unclear; thus, further studies are needed to obtain a better understanding of the biogeochemical cycle of sulfur in the oceans. In this study, we investigate the horizontal and vertical distributions of AAd and related dimethylated sulfur compounds in the BS and YS in different seasons (summer and winter) to determine if temperature, phytoplankton and bacteria species, and abundance are the key factors controlling AA dynamics. In addition, for the first time, we collect AAd samples in the porewater of surface sediment during summer in the BS and YS. We also examine the degradation of dissolved DMSP (DMSPd) and AAd simultaneously through on-deck incubations during summer and winter to understand the production and consumption mechanisms of AA, DMS, and DMSP to explore the influencing factors (i.e., the changes in the bacteria species and abundance) of microbial degradation and to discover other potential sources of AA. This study is expected to provide insightful information on sulfur cycling regarding AA in the marginal seas.
2.1 Study area
The BS, the largest inner sea in China, is surrounded by Tianjin City, Hebei Province, and the Shandong and Liaodong peninsulas. The total water area of the sea is 7.7×10⁴ km2, and the average water depth is 18 m. The hydrological conditions of the BS are substantially influenced by discharges from over 40 rivers, including the Yellow River, Hai River, Daliao River, and Luan River (Ning et al., 2010). In particular, the Yellow River, the world's second-largest river in terms of sediment load, brings large amounts of particulates and nutrients to the BS. The YS, which is separated from the BS by the Bohai Strait, is a shallow semi-enclosed marginal sea located between the Chinese mainland and the Korean Peninsula, with a total water area of 3.8×10⁵ km2 and a mean depth of 44 m. The YS is divided into the northern Yellow Sea (NYS) and the southern Yellow Sea (SYS) by a line between Chengshan Cape on the Shandong Peninsula and Changshanchuan on the Korean Peninsula. The BS and YS are substantially affected by complicated water currents and two main water masses including the Bohai Sea Coastal Current (BSCC), the Yellow Sea Coastal Current (YSCC), the Korea Coastal Current (KCC), the Yellow Sea Warm Current (YSWC), the Changjiang River Diluted Water (CRDW), and the Yellow Sea cold water mass (YSCWM) (Lee et al., 2000; Su, 1998) (Fig. 1). Moreover, anthropogenic pollution on both the Chinese and Korean coasts has notable effects on the ecosystems, including species diversity and community structure of phytoplankton and benthos in the BS and YS (Liu et al., 2011).
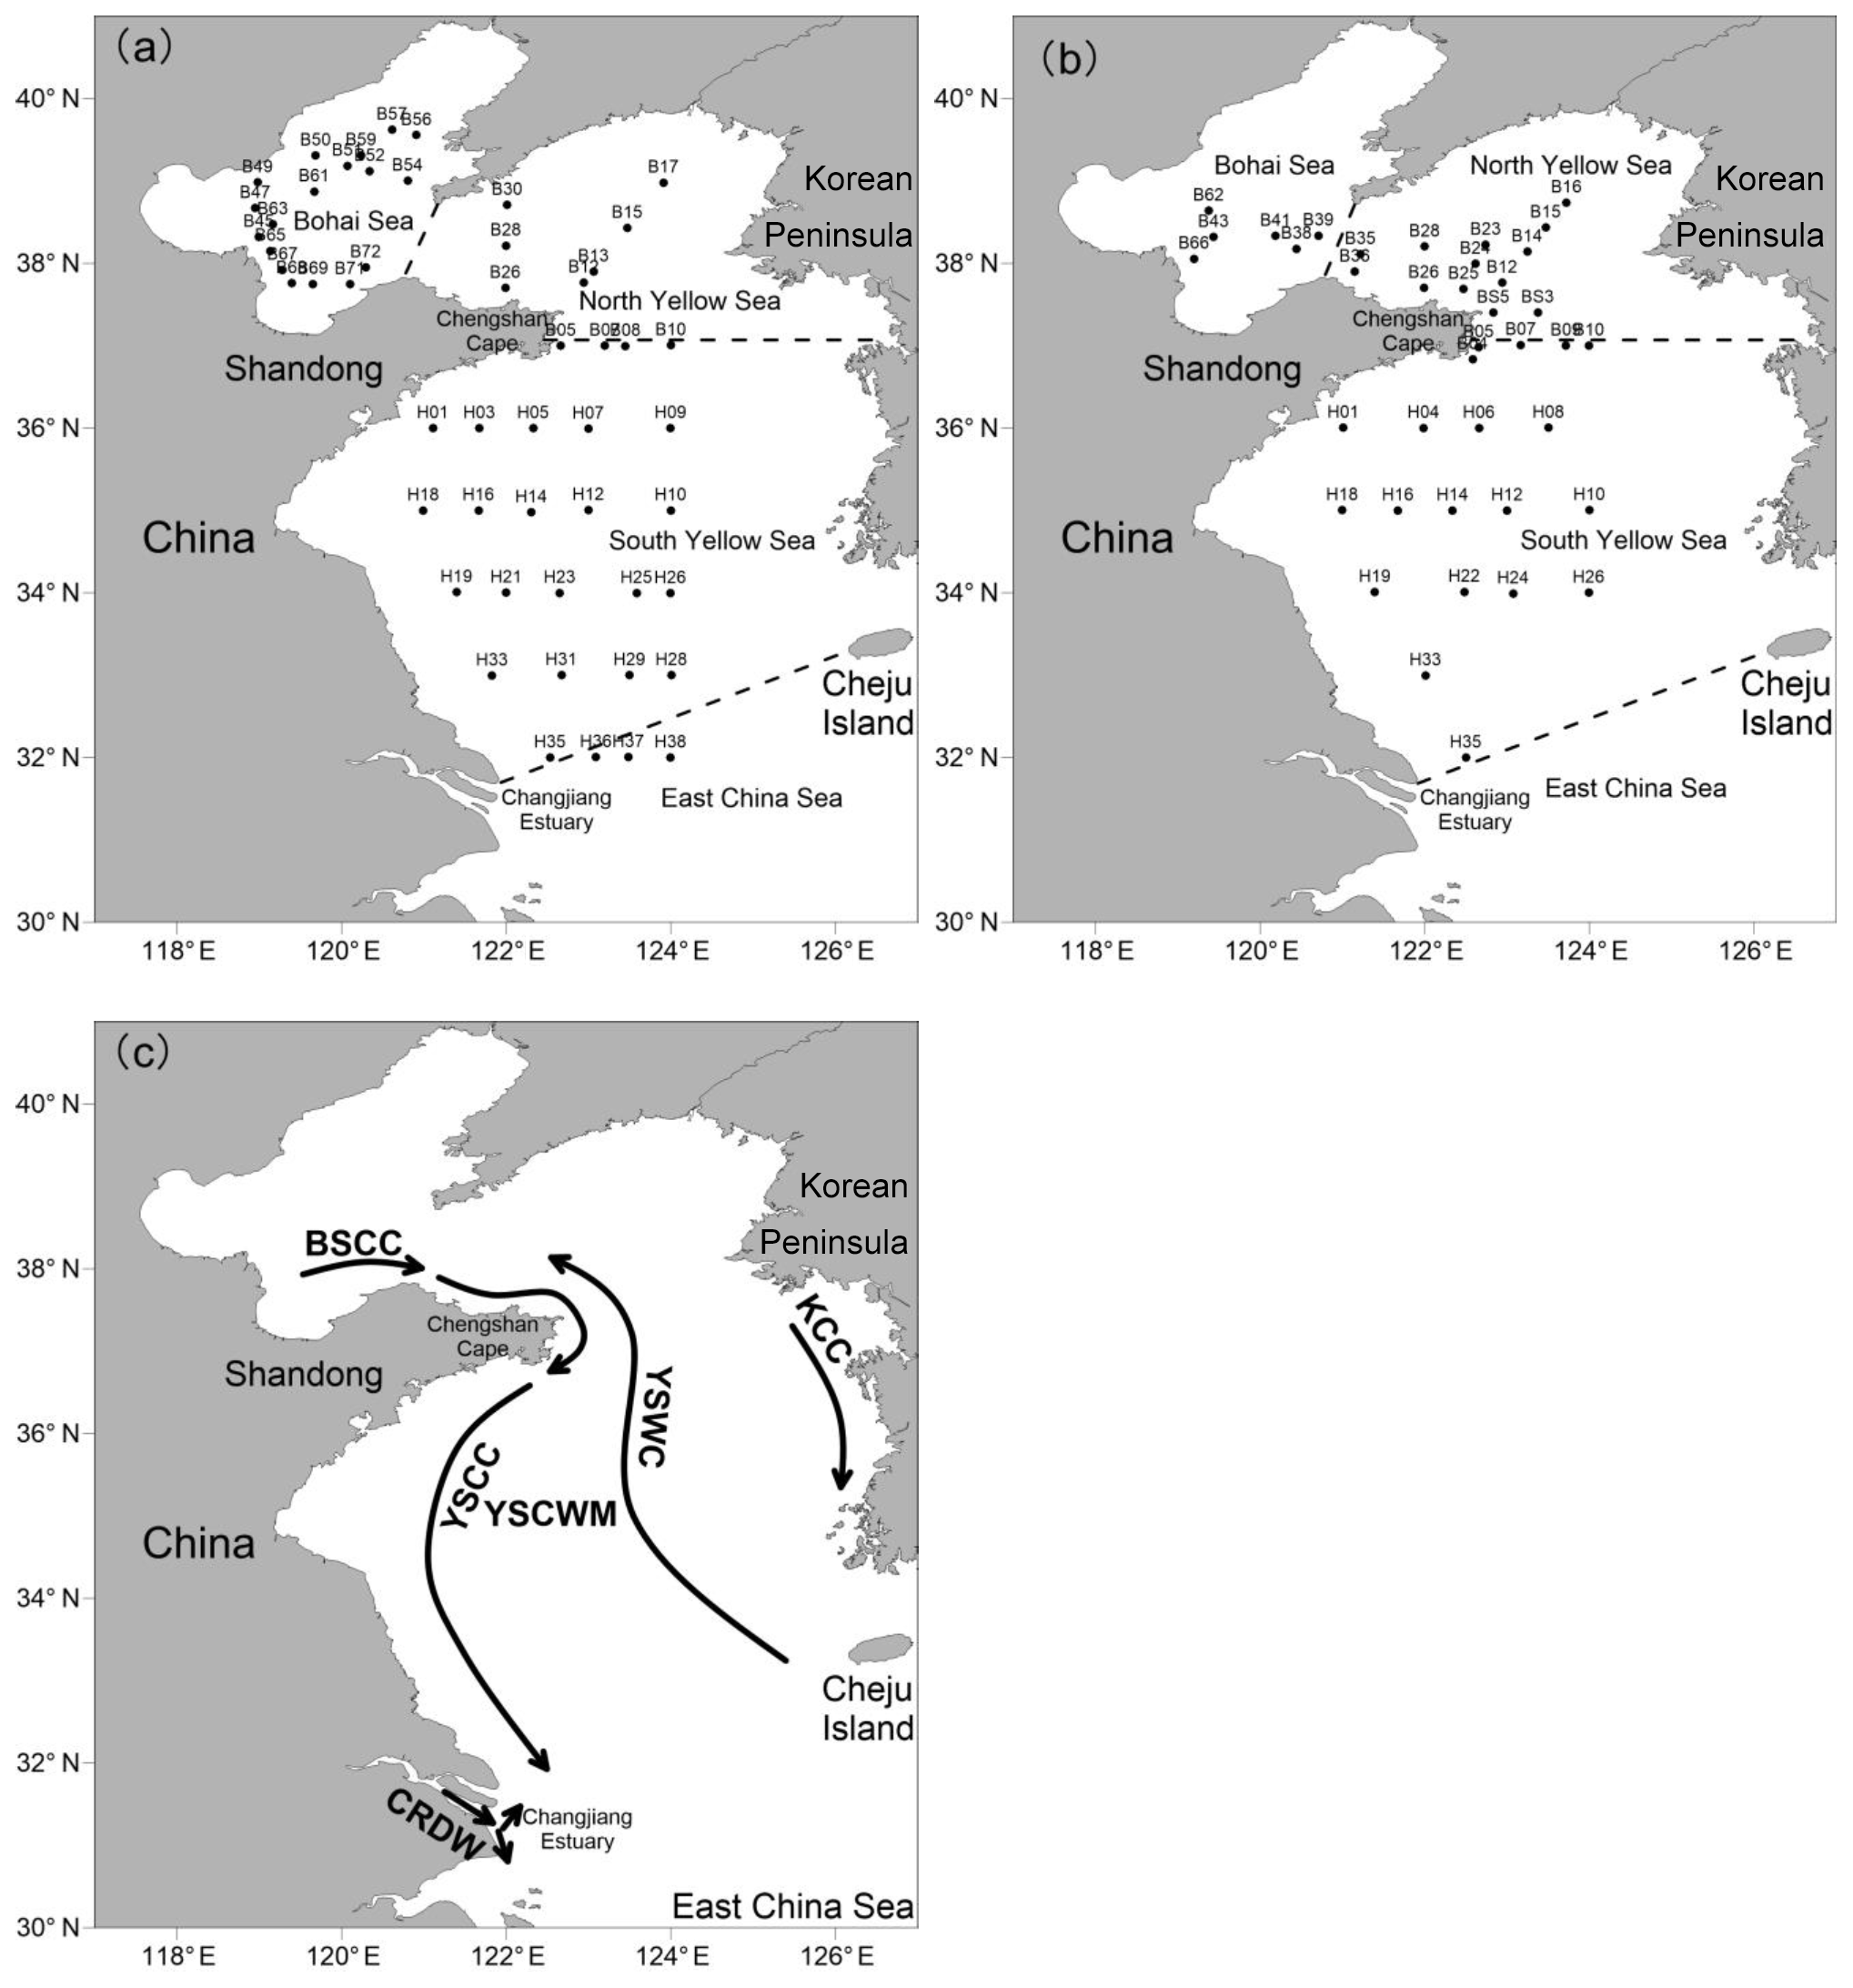
Figure 1Locations of the sampling stations in the BS and YS during summer (a) and winter (b). (c) Schematic circulations and water masses in the BS and YS (Su, 1998; Lee et al., 2000). BSCC: Bohai Sea Coastal Current; YSCC: Yellow Sea Coastal Current; KCC: Korea Coastal Current; YSWC: Yellow Sea Warm Current; CRDW: Changjiang River Diluted Water; YSCWM: Yellow Sea Cold Water Mass.
2.2 Sampling
Two cruises were conducted aboard the R/V Dong Fang Hong 2 in the BS and YS from 17 August to 5 September 2015 (summer) and from 14 January to 1 February 2016 (winter). The summer cruise covered 52 grid stations and three transects, and the winter cruise was comprised of 39 grid stations and two transects (Fig. 1). Seawater samples were collected using 12 L Niskin bottles mounted on a Sea-bird 911+ Conductivity–Temperature–Depth (CTD) sensor (Sea-Bird Electronics, Inc., USA). Temperature and salinity were measured by the CTD sensor. Water samples were transferred from the Niskin bottles to a 250 mL brown glass bottle through silicone tubing. While filling the bottles, the samples were allowed to overflow from the top of the bottle to eliminate any headspace to minimize partitioning into the gas phase. Sediments were collected using a stainless steel box corer and were subsampled to a depth of ca. 3 cm at 12 stations during summer cruise, as shown in Table 1.
Table 1Summary of the mean values (ranges) and the significance of seasonal differences of AAd, DMS, DMSPd, and DMSPt in the surface seawater of the BS and YS and the entire vertical profiles of transects during summer and winter. The significance of seasonal differences was obtained using the Mann–Whitney test.
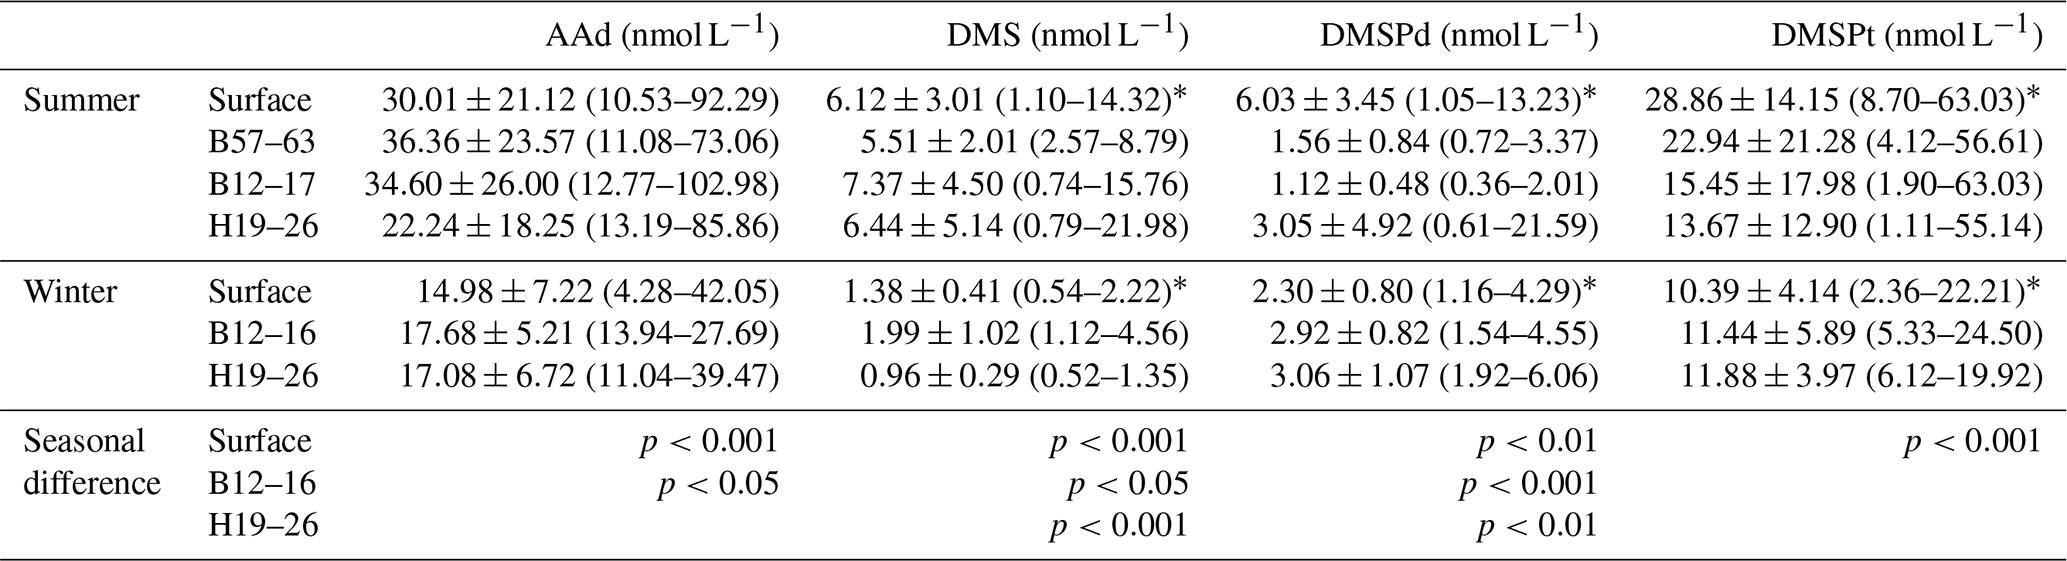
* Collected from published MS theses (Jin, 2016; Sun, 2017).
2.3 Analytical procedures
The DMS concentrations of all samples were measured onboard immediately after sampling with a purge-and-trap technique modified from Andreae and Barnard (1983) and Kiene and Service (1991). A 2 mL aliquot of seawater sample was extracted from the 250 mL brown glass bottle using a 2 mL glass syringe and was filtered by syringe filtration through a 25 mm Whatman glass fiber (GF/F) filter (Li et al., 2016); the sample was directly injected into a glass bubbling chamber and extracted with high-purity nitrogen at a flow rate of 40 mL min−1 for 3 min. Following this, the sulfur gases were dried using Nafion gas sample dryer (Perma Pure, USA) and trapped in a loop of Teflon tubing immersed in liquid nitrogen (−196 ∘C). After extraction, the Teflon tubing was heated in boiling water, and the desorbed gases were introduced into a 14B gas chromatograph (Shimadzu, Japan) equipped with a flame photometric detector and a 3 m × 3 mm glass chromatographic column packed with 10 % DEGS on Chromosorb W-AW-DMCS. The analytical precision of DMS was generally better than 10 % and the detection limit was 0.4 nmol L−1 (Yang et al., 2015a).
A 4 mL aliquot of seawater was filtered under gravity through a 47 mm Whatman GF/F filter (Kiene and Slezak, 2006) for DMSPd analysis. A 10 mL aliquot of seawater without filtering was used for total DMSP (DMSPt) analysis. For an even DMSP concentration and the oxidation of endogenous DMS, 100 and 40 µL of 50 wt % sulfuric acid were added to the samples for DMSPt and DMSPd analysis, respectively (Shooter and Brimblecombe, 1989). The DMSPt and DMSPd samples were incubated in the dark at room temperature for 2 d to oxidize preexisting gaseous DMS fully. Before analysis, the samples were injected with 300 µL of 10 mol L−1 KOH solution and stored in the dark at 4 ∘C for at least 24 h to allow a complete conversion of DMSP into DMS. The measured DMS concentration was used to estimate the DMSP concentration, according to 1 : 1 stoichiometry (Dacey and Blough, 1987). This method provided detection limits for DMS of 0.05–0.5 nmol L−1. Details on the concentrations of DMS and DMSP in surface seawater have been published in two Master theses (Jin, 2016; Sun, 2017).
Seawater samples for AAd analyses were collected directly from the Niskin bottles and filtered under gravity through a pre-cleaned 0.2 µm AS 75 Polycap filter capsule (a nylon membrane with a glass microfiber prefilter enclosed in a polypropylene housing; Whatman Corporation, USA) (Wu et al., 2015). The filtrate was transferred to a 40 mL glass vial with a Teflon™-lined cap and stored at 4 ∘C. Porewater samples for AAd analyses were extracted from surface sediments via Rhizon soil moisture samplers (0.1 µm porous polymer, Rhizosphere Research, Wageningen, the Netherlands), following the method of Seeberg-Elverfeldt et al. (2005). All porewater samples were stored at 4 ∘C and filtered through 0.22 µm polyethersulfone syringe filters (Membrana Corporation, Germany) before analysis. The AAd seawater and porewater samples were analyzed using a high-performance liquid chromatograph (L-2000, Hitachi Ltd., Japan), according to Gibson et al. (1996). An Agilent SB-Aq-C18 column and the eluent of 0.35 % H3PO4 (pH = 2.0) at a flow rate of 0.5 mL min−1 were used to separate the AAd. The column eluate was detected by a UV detector at 210 nm. The analytical precision was between 1.3 % and 1.6 %, and the detection limit was 4 nmol L−1 (Liu et al., 2013).
For the chlorophyll a (Chl a) analysis, 300 mL of seawater was filtered through Whatman GF/F filters. Then the filtrates were soaked in 10 mL of 90 % acetone and kept in the dark at 4 ∘C. The contents of Chl a were measured after 24 h using an F-4500 fluorescence spectrophotometer (Hitachi, Japan), following the method of Parsons et al. (1984). In addition, the nutrient concentrations (including , , , , and ) were analyzed using an automatic nutrient analyzer (Auto Analyzer 3, SEAL Analytical, USA). The phytoplankton data recorded by Utermöhl method and bacteria data measured by qPCR were collected from Zhang (2018) and Liang et al. (2019), respectively. The analytical samples for DMS, DMSPd, DMSPt, AAd, Chl a, and the nutrients were run in duplicate.
2.4 Incubation experiments
The incubation experiments for DMSPd and AAd degradation were conducted on deck using seawater collected at stations H19, H26, B12, B17, B53, and B63 in summer and at H19, H26, B12, and B16 in winter, following the method of Wu et al. (2017). We determined the degradation rates of DMSPd and the production rates of DMS and AAd by incubating unfiltered seawater samples in two 250 mL gas-tight glass syringes (wrapped in aluminum foil) in the dark at in situ temperatures. Before the incubations, 80 µL of concentrated DMSPd solution (0.2 mmol L−1) was added to the two syringes to reach an initial concentration of DMSPd higher than 50 nmol L−1. One syringe was used as the treatment group, and the other was used as the control by injecting it with glycine betaine (GBT, final concentration of 50 µmol L−1, 1000× the concentration of added DMSPd). GBT inhibits microbial degradation of DMSP within a short time (Kiene and Service, 1993; Kiene and Gerard, 1995) because it is chemically and physiologically similar to DMSP and acts as a competitive inhibitor of DMSP (Kiene et al., 1998). After 0, 3, and 6 h, 25 mL aliquots of samples were taken from the incubations for measuring the DMSPd, DMS, and AAd concentrations. Linear regression equations were fit to the DMSPd, DMS, and AAd time course data, and the apparent rates were estimated as the differences between the slopes of the samples with and without GBT.
Two pathways of AAd degradation, i.e., photochemical consumption and microbial consumption, were experimentally investigated in this study. For the photochemical consumption of AAd, a drop of oversaturated NaN3 solution was added to 300 mL seawater samples (the final concentration was approximately 1 mmol L−1) to eliminate the microbial consumption of AAd. After filtration, the seawater samples were immediately injected into a 125 mL photic quartz tube and a 125 mL photophobic quartz tube (as a control) to initiate photochemical degradation; 10 mL aliquots of samples were taken for analyses of AAd at 0, 3, and 6 h. Linear regression equations were fit to the AAd time course data, and the photochemical degradation rates of AAd were calculated based on the differences between the slopes of the samples in the photic and photophobic quartz tubes (Wu et al., 2015).
For the microbial consumption of AAd, unfiltered seawater samples were used for incubations in 100 mL glass syringes (wrapped in aluminum foil) in the dark at in situ temperatures. Prior to incubation, concentrated AAd was added to one syringe to reach an initial concentration that was 10–50 times that of the background concentration. Another seawater sample without exogenous AAd addition was used as the control; 10 mL aliquots of samples were taken for determination of AAd at 0, 3, and 6 h. Linear regression equations were fit to the AAd time course data, and the microbial degradation rates of AAd were estimated as the differences between the slopes of the samples with exogenous AAd addition and the control (Wu et al., 2015). Duplicate samples were analyzed for AAd, DMS, and DMSPd in all the incubation experiments.
3.1 Horizontal distributions of AAd in the BS and YS
In summer, the Chl a contents in the surface seawater were in the range of 0.01–8.91 µg L−1, with an average value of 1.95±2.31 µg L−1. The contents in the BS were relatively high, and an extremely high value (7.07 µg L−1) occurred at the center of the sea, whereas the concentrations decreased gradually from the inshore to offshore areas in the NYS and the northern area of the SYS. The minimum value of Chl a occurred in the center of the SYS, and the maximum was observed in the southern area of the SYS (station H37).
The AAd concentrations in the surface seawater during summer ranged from 10.53 to 92.29 nmol L−1, with a mean of 30.01±21.12 nmol L−1, and the concentrations generally decreased from the north to the south (Fig. 2 and Table 1). The average values in the BS and the NYS were 40.76±24.80 and 38.89±22.61 nmol L−1, respectively; these values were higher than the average value of the entire study area. In contrast, the mean value in the SYS was 18.02±7.70 nmol L−1, which was more than half of the average value of the entire study area, even though the Chl a values were relatively high in the SYS. In addition, AAd was positively dependent on the temperature in the NYS (Table 2). Jin (2016) observed that DMS and DMSP showed decreasing trends from inshore to offshore areas (Fig. 3), which were coupled to the distribution pattern of Chl a. DMS and DMSP also exhibited higher values in the BS than in the YS, similar to the case of AAd.
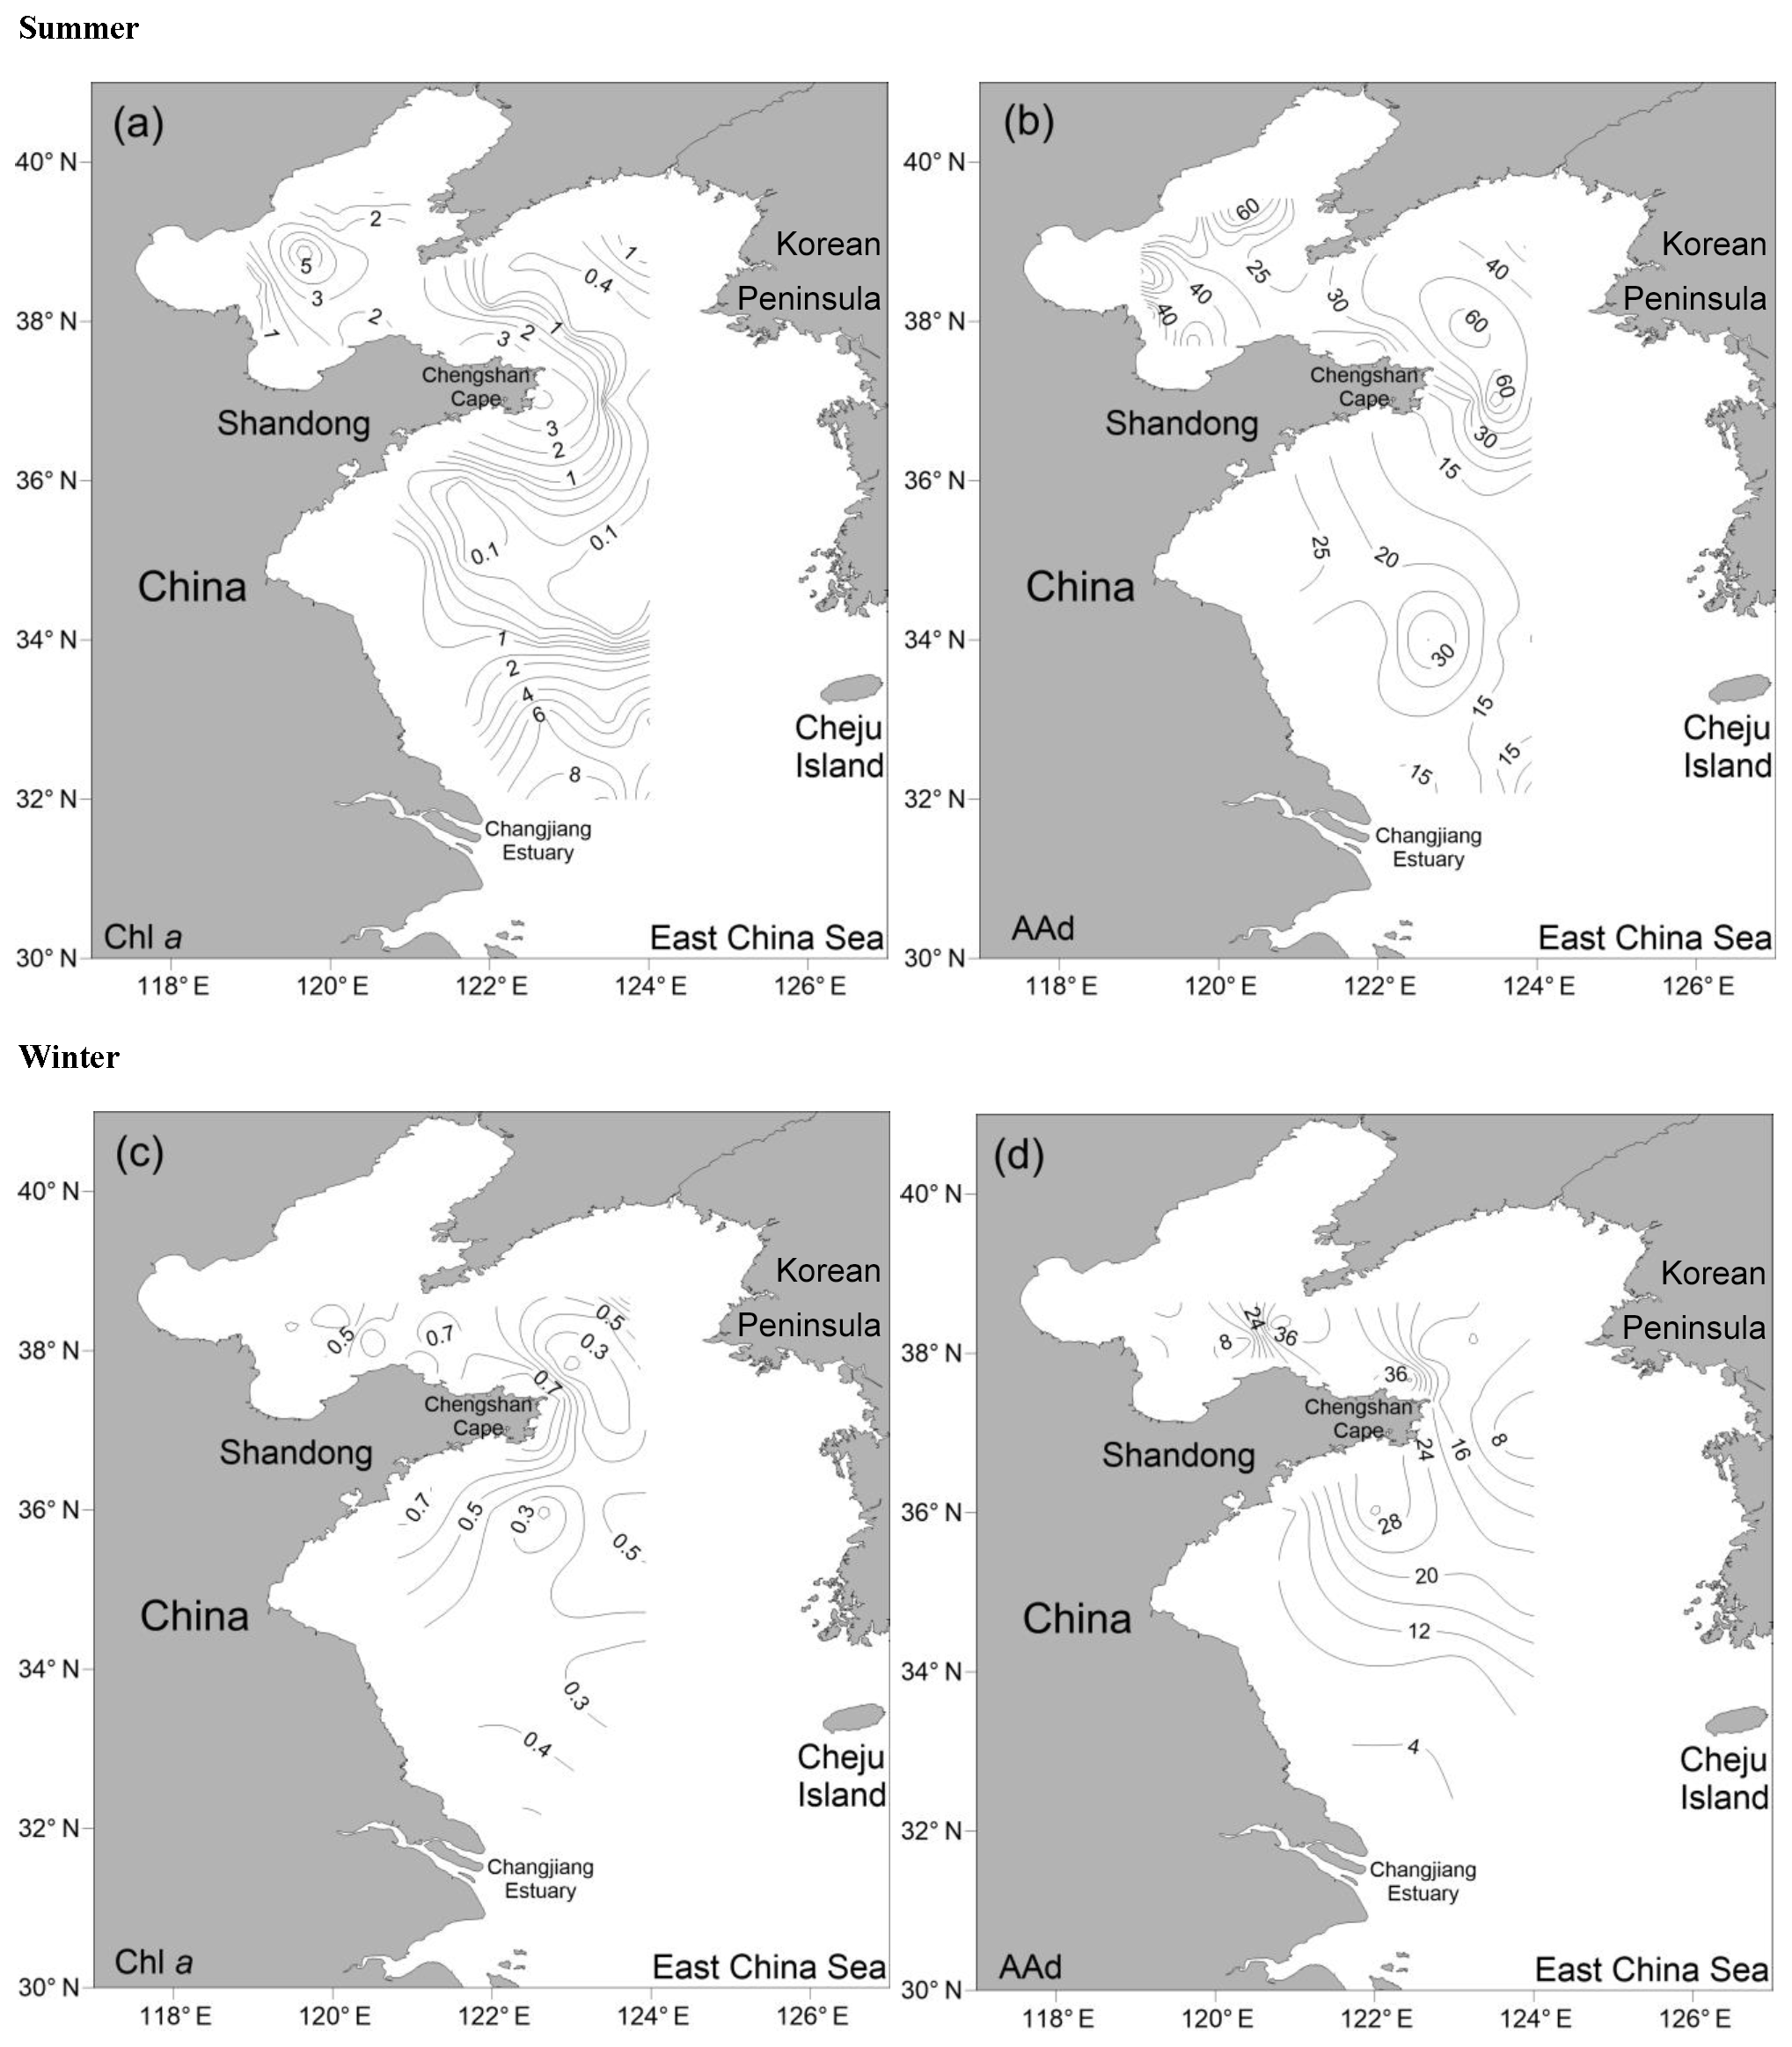
Figure 2Horizontal distributions of Chl a (µg L−1) and AAd (nmol L−1) in the surface water of the BS and YS during summer and winter. (a) Chl a in summer; (b) AAd in summer; (c) Chl a in winter; (d) AAd in winter.
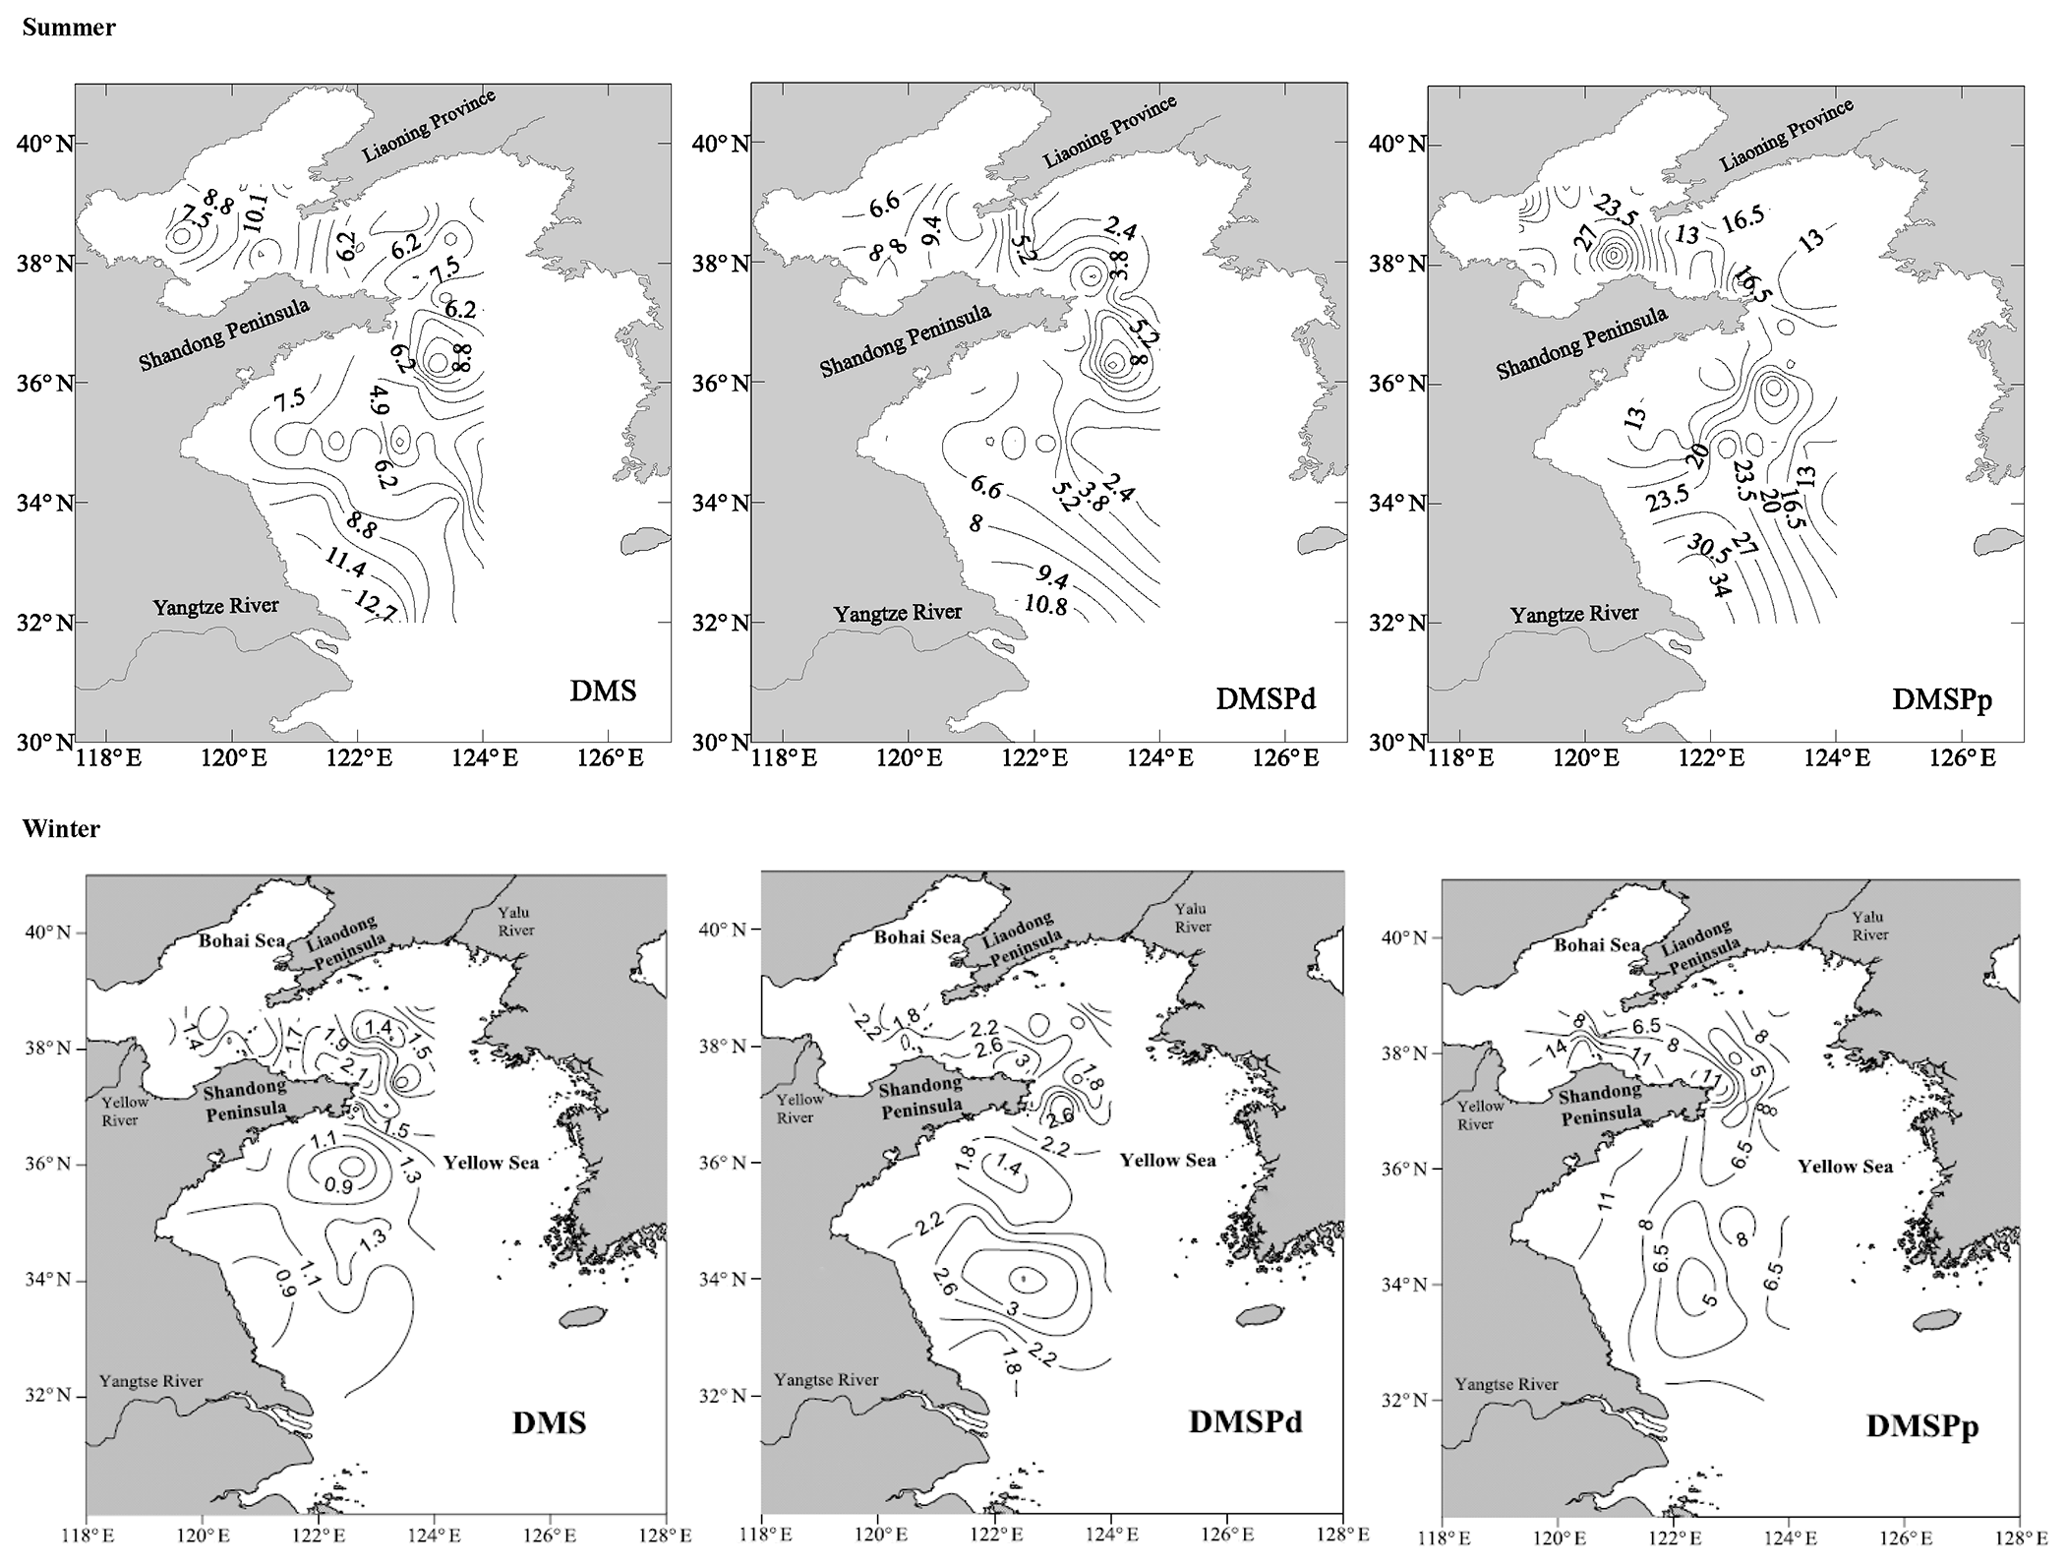
Figure 3Horizontal distributions of DMS (nmol L−1), DMSPd (nmol L−1), and DMSPp (nmol L−1) in the surface water of the BS and YS during summer and winter. Data in summer and winter presented here were described by Jin (2016) and Sun (2017), respectively.
Table 2Correlations between AAd, DMS, DMSP, and other biogeochemical parameters in the BS and YS during summer and winter. A Pearson correlation test was used here.
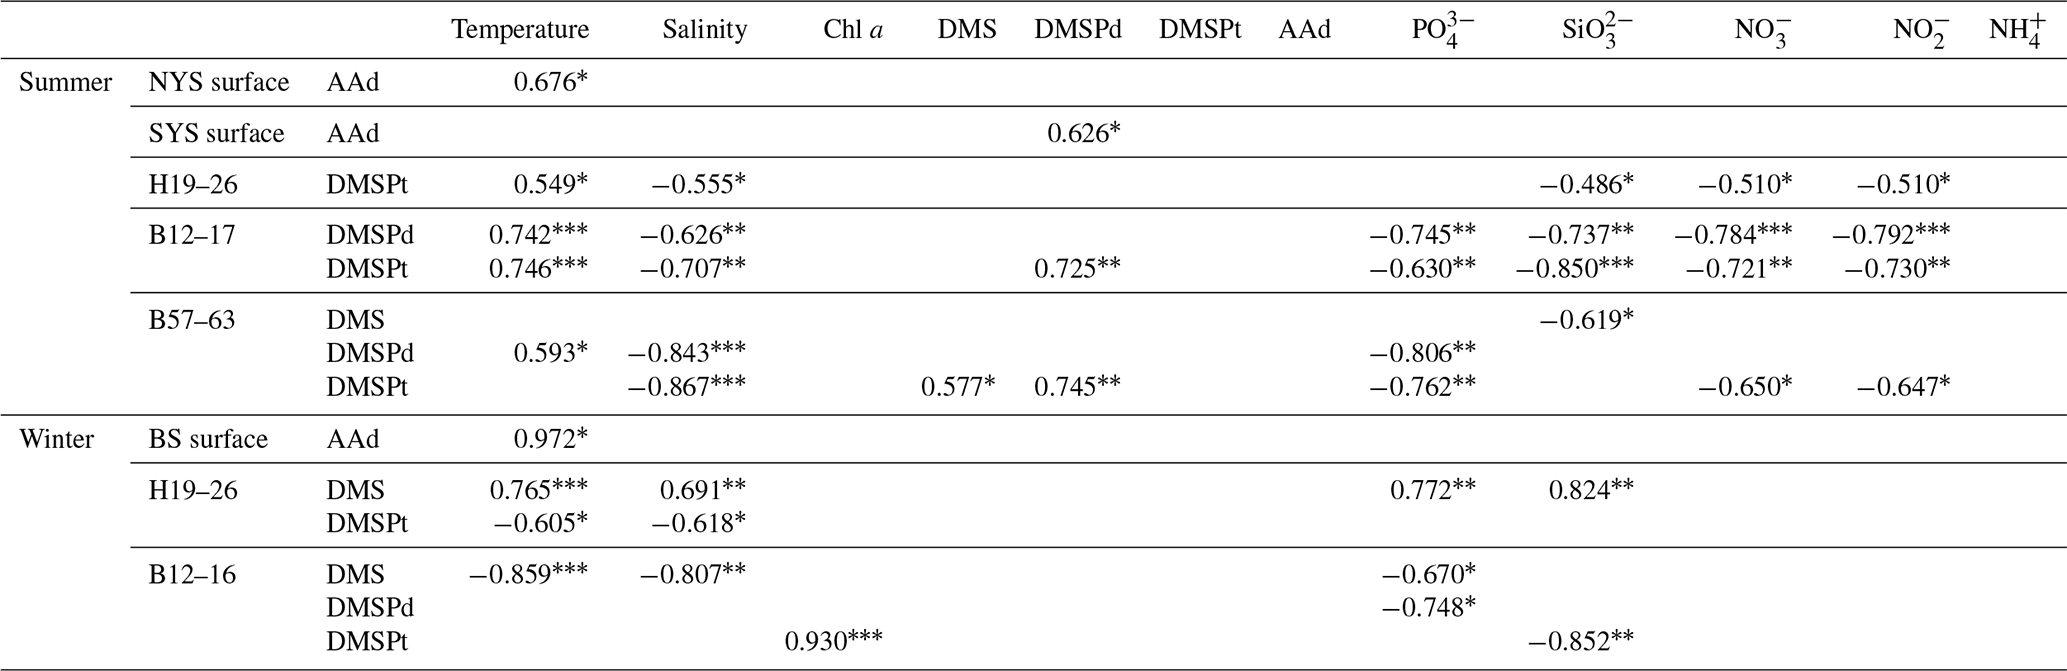
* Significant at p<0.05. Significant at p<0.01. Significant at p<0.001.
In winter, the Chl a contents in the surface seawater ranged from 0.16 to 0.99 µg L−1 (mean: 0.47±0.21 µg L−1) and generally decreased from the inshore to offshore areas. The AAd concentrations ranged from 4.28 to 42.05 nmol L−1 (mean: 14.98±7.72 nmol L−1), and high concentrations occurred near the Chengshan Cape, where high values of Chl a, DMS, and DMSP, as well as high phytoplankton abundance, were also observed (Figs. 2 and 3) (Sun, 2017; Zhang, 2018). Chl a, AAd, DMS, and DMSPd all showed declining trends from the inshore to offshore areas in the SYS. Note that the AAd concentrations in the BS (15.94±10.49 nmol L−1), the NYS (14.53±7.64 nmol L−1), and the SYS (14.91±6.31 nmol L−1) were not significantly different.
3.2 Vertical distributions of AAd, DMS, and DMSP in the BS and YS
In summer, the three transects B57–63, B12–17, and H19–26, which were located in the BS, the NYS, and the SYS, respectively, were chosen to investigate the vertical distributions of AAd, DMS, and DMSP. Along transect B57–63, the Chl a, AAd, DMS, DMSPd, and DMSPt concentrations were in the ranges 0.15–7.07 µg L−1 (mean 1.58±1.88 µg L−1), 11.08–73.06 nmol L−1 (mean 36.36±23.57 nmol L−1), 2.57–8.79 nmol L−1 (mean 5.51±2.01 nmol L−1), 0.72–3.37 nmol L−1 (mean 1.56±0.84 nmol L−1), and 4.12–56.61 nmol L−1 (mean 22.94±21.28 nmol L−1), respectively. All of the compounds had high values in the upper layers. Meanwhile, Chl a and AAd showed relatively high values at the bottom of station B61 and B57, respectively (Fig. 4).
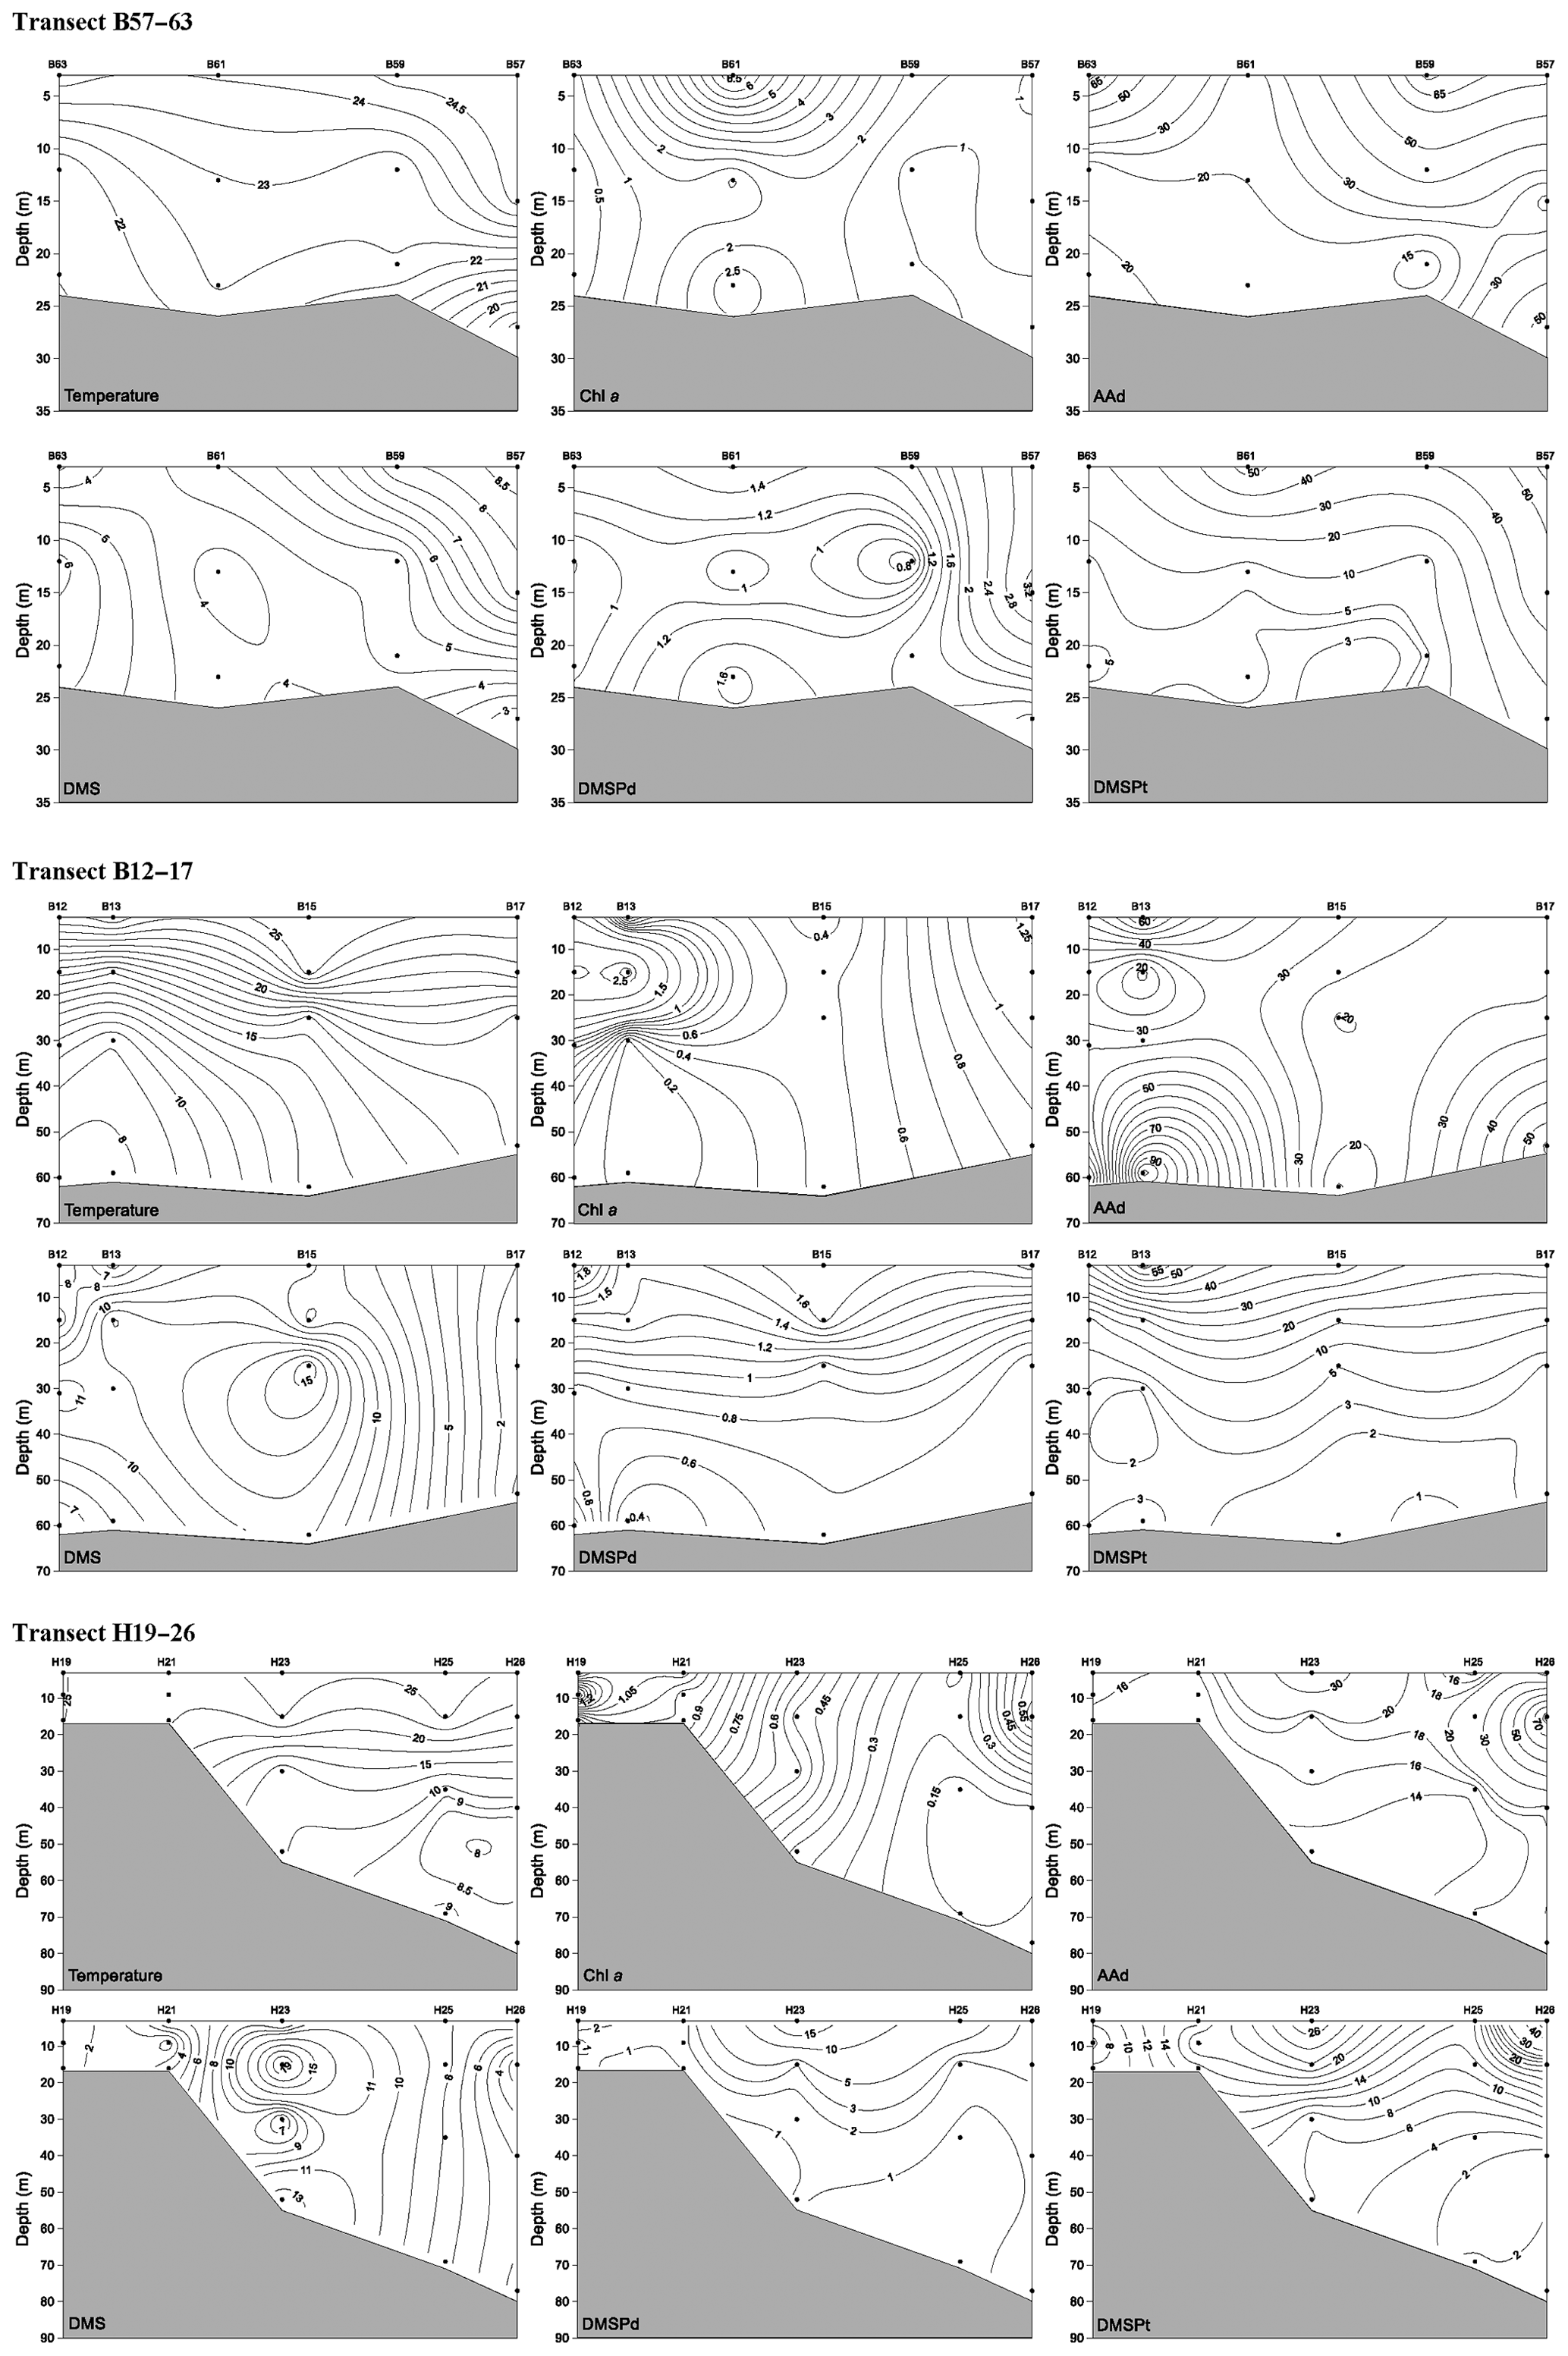
Figure 4Vertical profiles of temperature (∘C), Chl a (µg L−1), AAd (nmol L−1), DMS (nmol L−1), DMSPd (nmol L−1), and DMSPt (nmol L−1) along transect B57–63, transect B12–17, and transect H19–26 during summer. A kriging method is used for interpolating contours. The black dots represent sampling points.
Along transect B12–17, the Chl a and DMS concentrations ranged from 0.18 to 2.87 µg L−1 and from 0.74 to 15.76 nmol L−1, with means of 0.92±0.96 µg L−1 and 7.37±4.50 nmol L−1, respectively. Low values of Chl a occurred in the bottom seawater of the transect and in the water column of station B15, whereas Chl a and DMS exhibited maximum values at 15 m depth at stations B13 and 25 m depth at station B15, respectively (Fig. 4). The concentrations of DMSPd, DMSPt, and AAd were in the ranges 0.36–2.01, 1.90–63.03, and 12.77–102.988 nmol L−1, with averages of 1.12±0.48, 15.45±17.98, and 34.60±26.00 nmol L−1, respectively. The concentrations generally declined with depth, and the highest concentrations were observed in the surface layers of stations B12 and B13. Yang et al. (2015a) also found maximum values of DMS and DMSP in the upper water column along transect B12–17 during late fall, which were restricted mostly to the euphotic layer. High values of AAd also occurred in the bottom water of stations B13 and B17. DMSPd and DMSPt showed a strong positive correlation (Table 2), whereas AAd was not correlated with DMSP. The average value of AAd was more than 2 times that of DMSPt, the precursor of AAd, which demonstrated that terrestrial inputs contributed substantially to AAd along transect B12–17.
Transect H19–26 was affected by the YSCWM in summer, as indicated by low temperatures (<10 ∘C) below 40 m water depth. A tidal front divided the transect into a well-mixed shallow-water area (station H19) and a stratified deep-water area occupied by the YSCWM (stations H21–H26) (Fig. 4). The concentrations of Chl a, DMS, DMSPd, DMSPt, and AAd were in the ranges 0.12–1.50 µg L−1 (mean 0.58±0.39 µg L−1), 0.79–21.98 nmol L−1 (mean 6.44±5.14 nmol L−1), 0.61–21.59 nmol L−1 (mean 3.05 ±4.92 nmol L−1), 1.11–55.14 nmol L−1 (mean 13.67 ±12.90 nmol L−1), and 13.19–85.86 nmol L−1 (mean 22.24±18.25 nmol L−1), respectively. DMSPd, DMSPt, and AAd showed stratified distributions similar to those of the temperature, whereas Chl a and DMS did not. The Chl a contents generally decreased from the inshore to offshore areas, with minimum values in the medium and bottom layers of the offshore stations. High values of sulfur compounds in the surface seawater and higher concentrations in the YSCWM region than in the well-mixed shallow-water region were in agreement with the results of Yang et al. (2015b). In addition, there was a relatively high value of DMS in the bottom layer of station H23. There were no significant correlations between AAd, DMS, DMSPd, and DMSPt, although these compounds showed similar patterns of spatial distribution. DMSPt had a positive correlation with temperature and a negative correlation with salinity (Table 2). Many other investigations also reported analogous correlations (Shenoy and Patil, 2003; Deschaseaux et al., 2014; Wu et al., 2017).
In winter, transect B57–63 was inaccessible to sampling due to frozen conditions; thus, we only report the results of transect B12–16 in the NYS and transect H19–26 in the SYS. Along transect B12–16, the Chl a, DMS, DMSPd, DMSPt, and AAd concentrations were in the ranges 0.17–1.56 µg L−1, 1.12–4.56 nmol L−1, 1.54–4.55 nmol L−1, 5.33–24.50 nmol L−1, and 13.94–27.69 nmol L−1, with averages of 0.53±0.43 µg L−1, 1.99±1.02 nmol L−1, 2.92±0.82 nmol L−1, 11.44±5.89 nmol L−1, and 17.68±5.21 nmol L−1, respectively. Furthermore, Chl a, DMS, and DMSPt showed homogeneous distributions from the surface to the bottom, whereas DMSPd and AAd were heterogeneously distributed, with minimum values at the surface and maximum values at the bottom (Fig. 5).
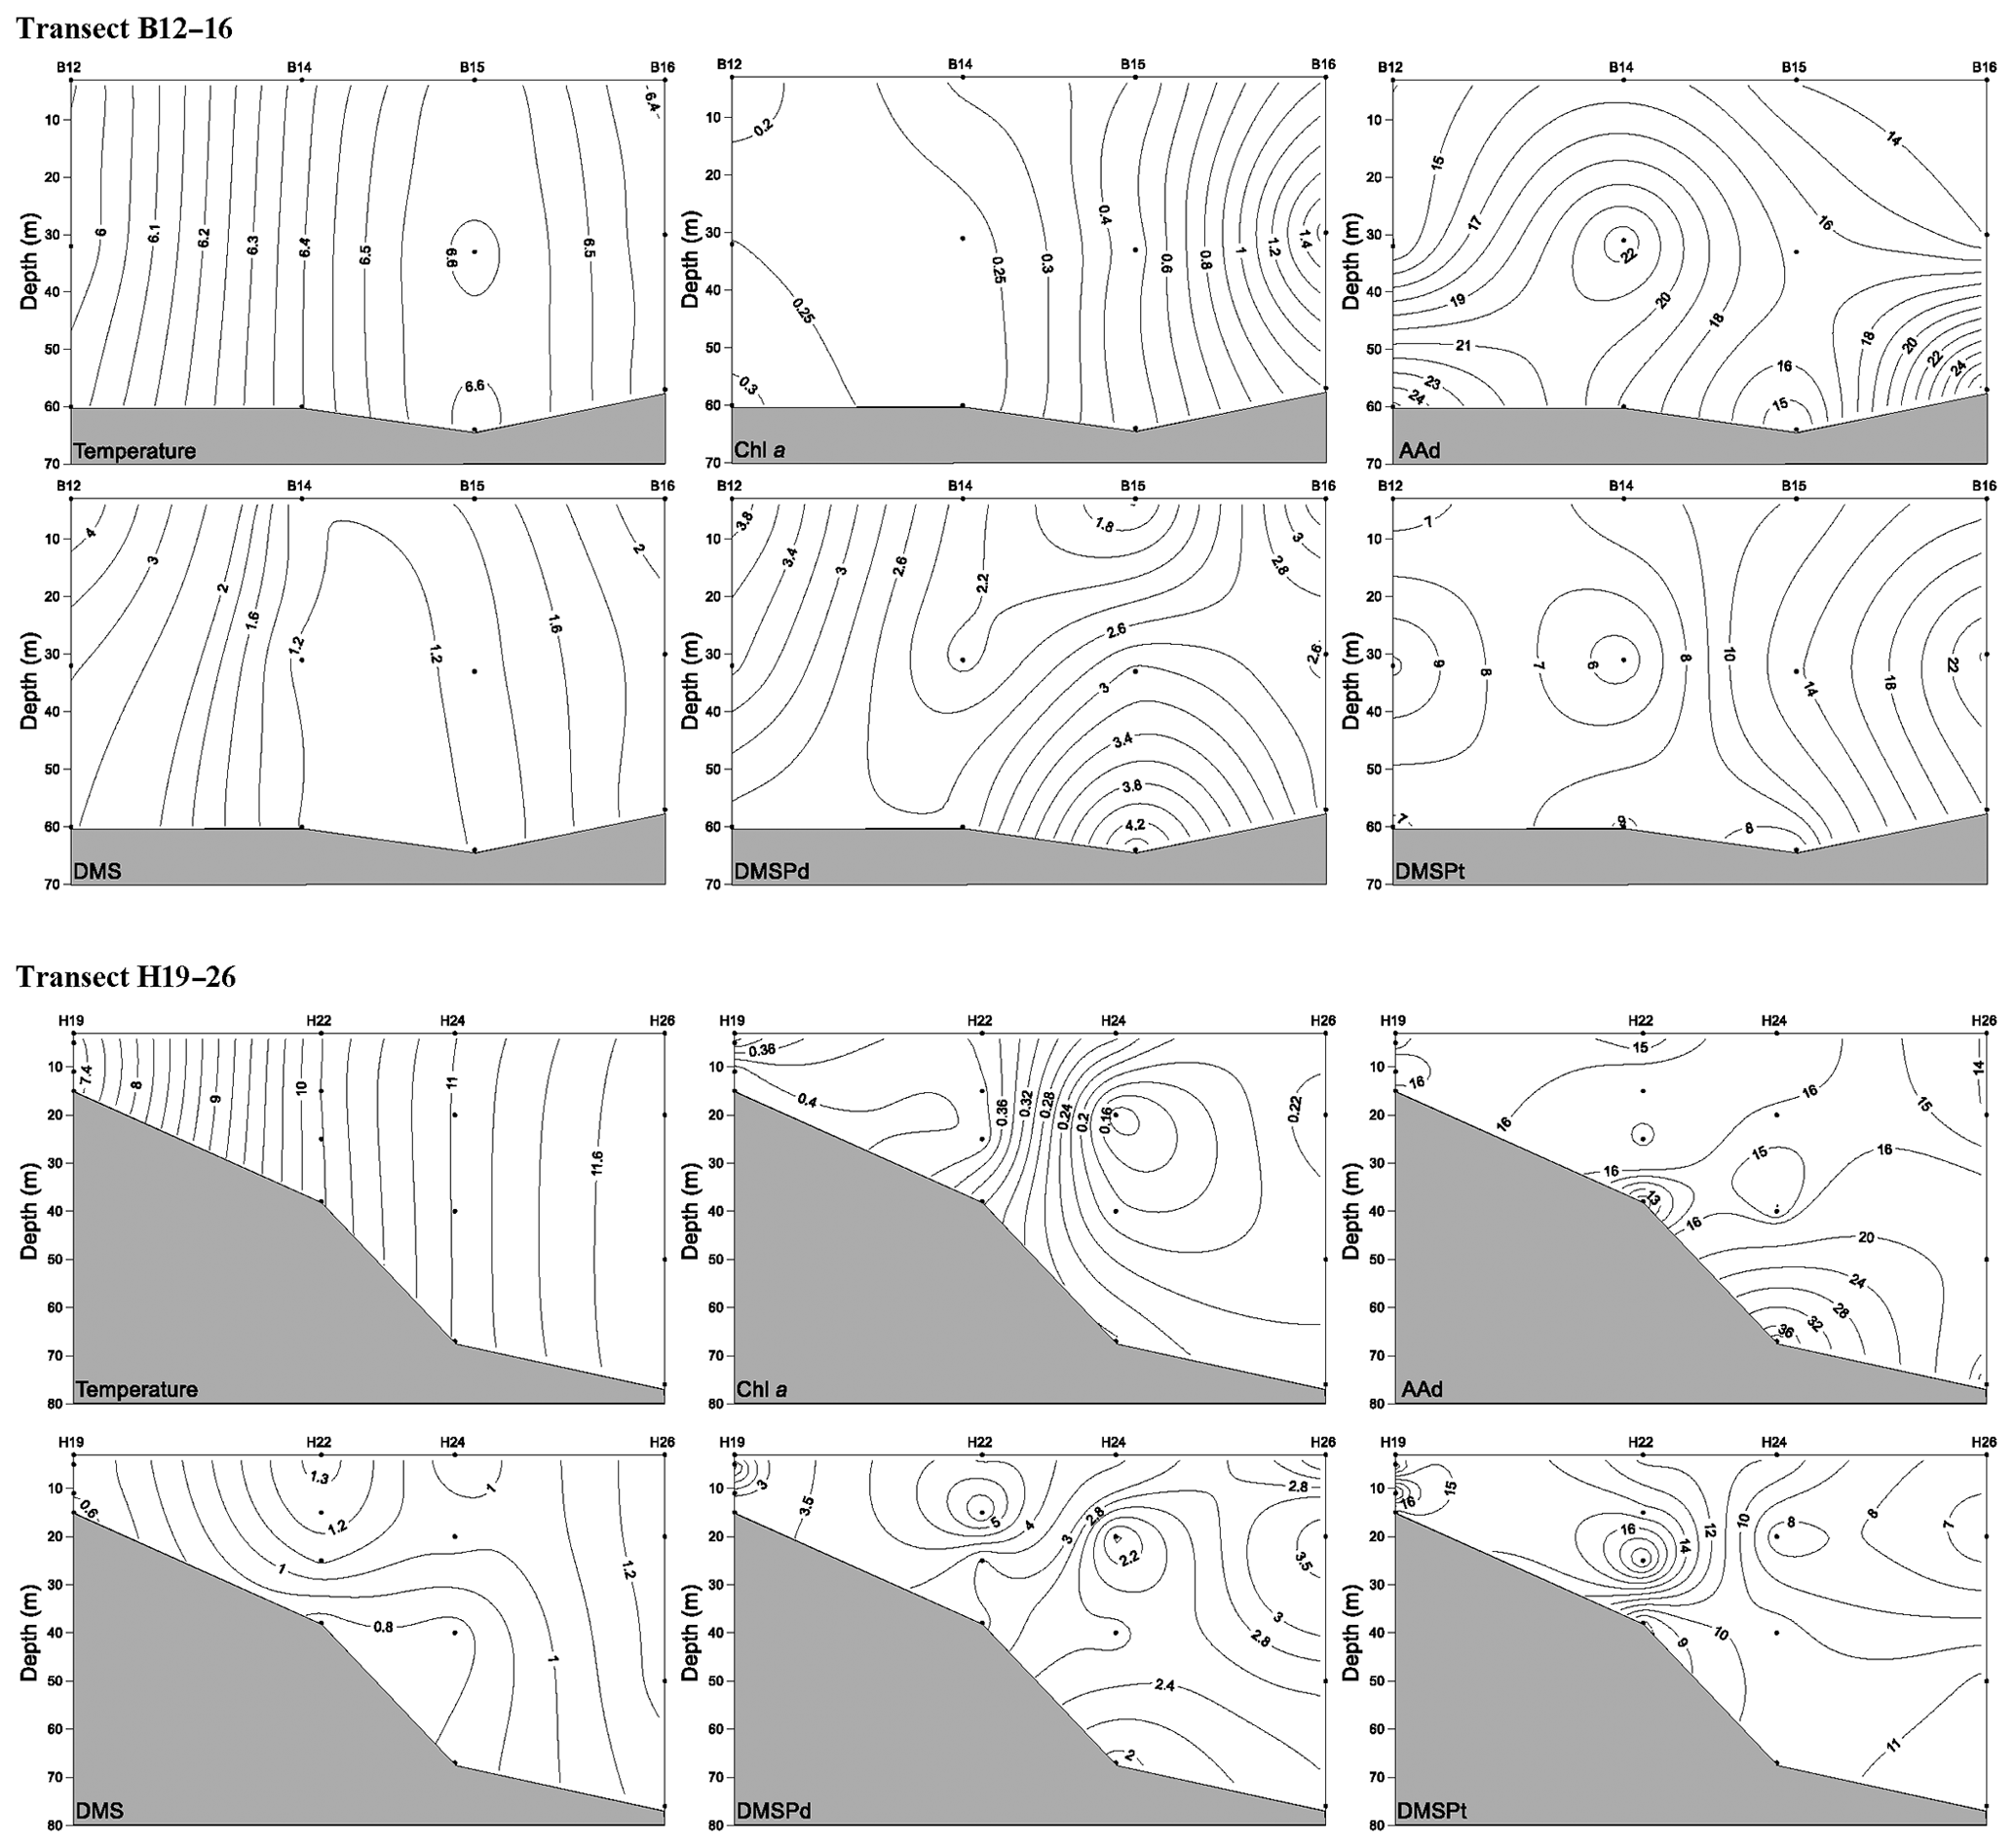
Figure 5Vertical profiles of temperature (∘C), Chl a (µg L−1), AAd (nmol L−1), DMS (nmol L−1), DMSPd (nmol L−1), and DMSPt (nmol L−1) along transect B12–16 and transect H19–26 during winter. A kriging method is used for interpolating contours. The black dots represent sampling points.
Along transect H19–26, the concentrations of Chl a and DMSPt ranged from 0.13 to 0.42 µg L−1 and from 6.12 to 19.92 nmol L−1, with means of 0.28±0.09 µg L−1 and 11.88±3.97 nmol L−1, respectively. The concentrations declined from the inshore to offshore areas, whereas DMS (0.52–1.35 nmol L−1, average 0.96±0.29 nmol L−1) and DMSPd (1.92–6.06 nmol L−1, average 3.06±1.07 nmol L−1) showed decreasing trends from the surface to the bottom (Fig. 5). The AAd concentrations ranged from 11.04 to 39.47 nmol L−1 (mean 17.08±6.72 nmol L−1), and there were no significant differences along the transect H19–26, except for the maximum value at the bottom of station H24.
Along the three transects, high values of AAd, DMS, and DMSP occurred in the bottom water occasionally during summer and winter, which might have resulted from the release from porewater (Andreae, 1985) (Figs. 4 and 5). DMSP showed positive correlations with temperature and negative correlations with salinity along the three transects during summer, whereas DMS and DMSP had negative correlations with temperature and salinity during winter; these results may be attributed to the co-correlation between the abiotic parameters themselves. DMS and DMSP had negative correlations with nutrients along the three transects during summer and winter, except for the positive correlations between DMS and nutrients ( and ) along transect H19–26 during winter. In addition, positive correlations between DMS, DMSPd, and DMSPt along transect B57–63 and B12–17 during summer and positive correlation between DMSPt and Chl a along transect B12–16 during winter indicated that DMSP was the phytoplankton-derived precursor of DMS (Table 2).
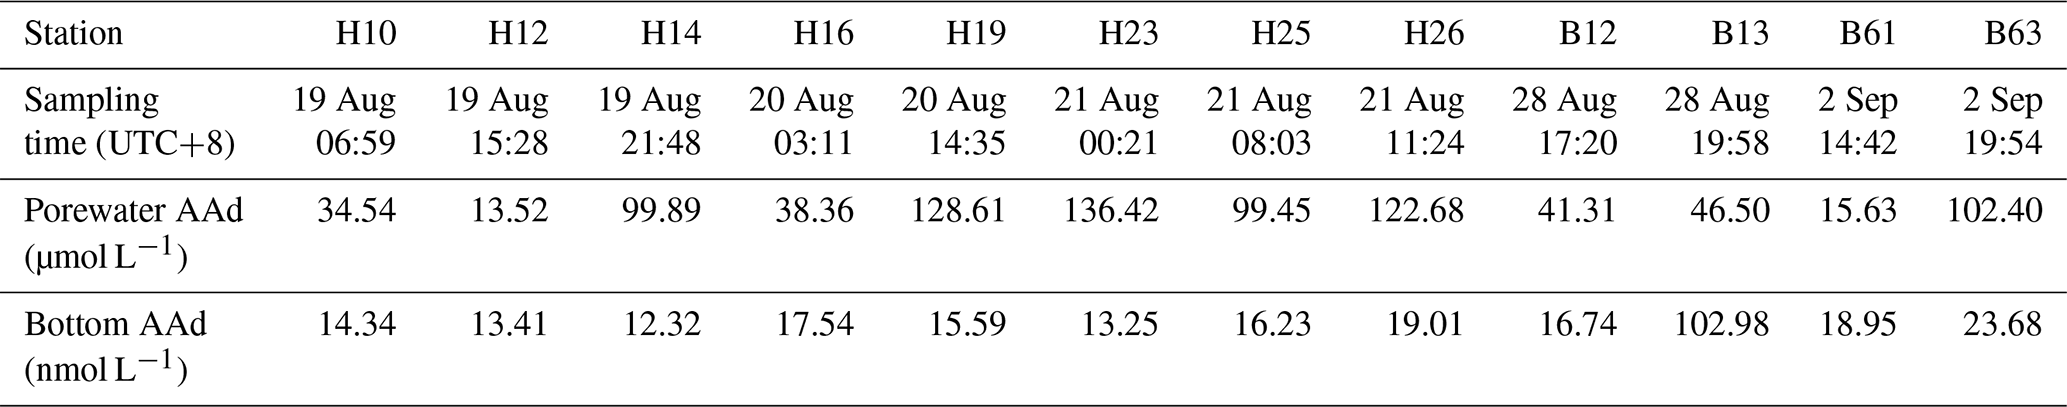
The AAd concentrations in the porewater of the surface sediments during summer were 13.52–136.42 µmol L−1, with an average of 73.03±46.05 µmol L−1 (Table 3). However, no significant correlation was observed between the AAd concentrations in the porewater and those in the bottom seawater. The maximum concentration of AAd was observed at station H23; meanwhile, the AAd concentrations were all relatively high in the sediment porewater of transect H19–26 in the SYS, with an average of 121.79 µmol L−1. The stations at transect H10–18 in the SYS and transect B12–17 in the NYS showed similar AAd concentrations (about 45 µmol L−1), whereas the AA concentrations at stations (B61 and B63) in the BS showed big differences. Generally, the AAd concentrations in the porewater of the surface sediments were higher in the YS than in the BS.
Table 3The AAd concentrations in the porewater of the surface sediments and in the bottom seawater during summer 2015.
3.3 Degradation of DMSPd and AAd in the BS and YS
The DMSPd and AAd degradation experiments were conducted using seawater at the endpoint stations of the investigated transects in the BS and YS during the two cruises. The production and/or degradation rates of DMSPd, DMS, and AAd are summarized in Table 4. In summer, the rates of DMS production were significantly lower than the rates of DMSPd degradation (Mann–Whitney test, p=0.01) at all stations, whereas the rates of AAd production were slightly higher than the rates of DMSPd degradation at stations B12 and B63. The rates of AAd production were higher than those of DMS production (Mann–Whitney test, p<0.05) at all stations. The enzymatic cleavage ratio of DMSP can be estimated using the ratio of the DMS production rate and the DMSPd degradation rate. The ratios were within the range of 7.8 %–64.5 %, with a mean of 27.7 %. The maximum rates of DMSPd degradation (5.76±0.47 nmol L−1 h−1) and DMS (2.71±0.36 nmol L−1 h−1) and AAd (5.20±0.40 nmol L−1 h−1) production occurred at stations B57 and B63 in the BS, respectively. The minimum rates of DMS (0.29±0.12 nmol L−1 h−1) and AAd (1.15±0.31 nmol L−1 h−1) production occurred at stations H26 and H19 in the SYS, respectively. Although the rates of AAd microbial degradation at all stations were extremely high compared to the rates of AAd production and AAd photochemical degradation due to the addition of exogenous AAd at the beginning of incubation, the measured rates still reflect the capability of bacterially mediated degradation of AAd. Specifically, the AAd microbial degradation rates were higher at the inshore stations than the offshore stations, and the rates in the NYS were lower than those in the BS and the SYS. Moreover, the average AAd photochemical degradation rates were higher in the SYS than in the BS and the NYS. Since the DMSPd and AAd degradation follow first-order kinetics (Kiene and Linn, 2000a; Wu et al., 2015), the turnover times of DMSPd and the rate constants of the AAd microbial and photochemical degradation were calculated (Table 4). The turnover times of DMSPd in the BS and YS fell in the range of 0.03–2.8 d, which were estimated in earlier studies using radioisotopes, inhibitors, and low-level addition methods in different oceanic regions worldwide (Ledyard and Dacey, 1996; Kiene and Linn, 2000a; Simó et al., 2000). In addition, the AAd microbial degradation rate constants were higher than the AAd photochemical degradation rate constants at most stations.
Table 4Rates and rate constants of DMS and AAd production from DMSPd degradation and AAd degradation in the BS and YS during summer and winter.

Almost all production and degradation rates were lower in winter than in summer. Furthermore, the turnover times of DMSPd were much longer in winter than in summer (Mann–Whitney test, p<0.05) but still fell in the range of earlier studies. The rates of DMS production were lower than the rates of DMSPd degradation and AAd production (Mann–Whitney test, p<0.05) in winter, indicating an agreement with the results obtained in summer. Even though the difference in the DMS production rates between the stations was not large, the maximum rates of DMSPd degradation (2.26±0.75 nmol L−1 h−1), DMS production (0.10±0.02 nmol L−1 h−1), and AAd production (1.48±0.29 nmol L−1 h−1) were all observed in the SYS, in contrast to the results obtained in summer. The enzymatic cleavage ratio of DMSP (3.5 %–11.1 %; average: 7.0 %) was much lower in winter than in summer. The microbial degradation rates of AAd significantly decreased from summer to winter, but the rate constants in winter did not show a substantial decline compared to those in summer and even increased slightly at some stations. The AAd microbial degradation rates and rate constants were higher than the photochemical rates and rate constants at most stations in winter; this result was in agreement with that obtained in summer.
4.1 Biogeochemical processes influencing the AAd in the surface water of the BS and YS
In summer, the average concentrations of in the BS (0.04 µmol L−1), the NYS (0.05 µmol L−1) and the SYS (0.04 µmol L−1) were similar; however, the average , , and concentrations in the BS (: 0.89 µmol L−1; : 0.18 µmol L−1; : 7.91 µmol L−1) were much higher than those in the NYS (: 0.22 µmol L−1; : 0.04 µmol L−1; : 3.26 µmol L−1) and the SYS (: 0.52 µmol L−1; : 0.10 µmol L−1; : 4.17 µmol L−1). Therefore, the high total nutrient contents, which were attributed to poor water circulation in the BS, promoted phytoplankton productivity and resulted in high Chl a contents in the BS (Wei et al., 2004; Wang et al., 2009). The minimum value of Chl a was observed in the center of the SYS and was ascribed to limited phytoplankton growth due to low nutrient contents (concentration of total inorganic nutrients <3 µmol L−1); the maximum value occurred in the southern area of the SYS and was due to high nutrient concentrations (total inorganic nutrients concentration of about 15 µmol L−1) delivered via the CRDW (Wei et al., 2010).
The AAd concentrations in the BS and YS during summer were an order of magnitude higher than those (0.8–2.1 nmol L−1, median 1.5 nmol L−1) in the northern Gulf of Mexico in September 2011 (Tyssebotn et al., 2017). The reasons for these differences might be related to differences in sample storage, analytical methods, and study areas. We stored the samples at 4 ∘C, whereas Tyssebotn et al. (2017) stored the samples at −20 ∘C. In addition, our study area was strongly affected by anthropogenic activities. Relatively high AAd concentrations in the BS and the NYS compared to in the SYS during summer implied that terrestrial inputs might play an important role in controlling the AAd distribution in the BS and the NYS. It has been reported that the Yalu River flowing into the NYS has large amounts of organic pollutants, including AA (Liu, 2001); in addition, the densely populated Chengshan Cape may also be an anthropogenic source of AAd to the NYS. Furthermore, poor water circulation in the semi-enclosed NYS and inner BS favors local accumulations of AAd. On the contrary, the SYS is a relatively open water area and thus is much less affected by terrestrial discharges. Moreover, AAd from DMSP degradation was not abundant in the SYS, although the Chl a values were relatively high, which might be related to the dominance of primary phytoplankton species with low ability for AAd production. Specifically, diatoms, a type of algal with low ability of DMSP and AAd production, were dominant in the SYS during summer (Liu et al., 2015). According to Zhang (2018), the maximum phytoplankton abundance in the SYS was 172.39 cell mL−1, of which the diatom abundance accounted for 146.81 cell mL−1. Furthermore, the diatom/dinoflagellate ratio was 28.96. In addition, some freshwater algae that do not produce DMSP and AAd have been found adjacent to the Changjiang Estuary (Luan et al., 2006), and the north branch of the Changjiang Estuary flows into the SYS. All of these factors may have led to low AAd concentrations in the SYS.
The Chl a contents were substantially lower in winter (<1 µg L−1 overall) than those in summer due to the lower temperature, light intensity, and phytoplankton activities, whereas the distribution patterns of Chl a were similar in the two seasons. These results were in agreement with Zhang (2018), who found that the average phytoplankton abundance in winter (3.84 cell mL−1) was much lower than that in summer (29.81 cell mL−1), but diatoms (3.83 cell mL−1) were still the dominant type of phytoplankton in winter. Moreover, Sun et al. (2001) also found that the diatoms in the study area consisted primarily of small diatoms in winter and larger diatoms in summer.
The AAd, DMS, and DMSP concentrations in the surface seawater during winter were about 2–4 times lower than those during summer (Table 1), but the distribution patterns were similar. Jin (2016) and Sun (2017) found significant positive correlations between DMS(P) and Chl a during summer (DMS: r=0.418, n=50, p<0.01; DMSPd: r=0.351, n=50, p<0.05) and winter (DMS: r=0.629, p<0.01; particulate DMSP (DMSPp): r=0.527, p<0.01). These results demonstrated that DMS(P) originated primarily from biological production, which was stronger in summer than in winter. However, AAd showed no correlations with Chl a, nutrients, DMS, or DMSP in the entire study area during summer and winter; the reason may be that we only measured dissolved AA. It is assumed that the majority of AA produced from DMSPd degradation is stored intracellularly (Kinsey et al., 2016; Tyssebotn et al., 2017), whereas the majority of the produced DMS is found in the dissolved phase (Spiese et al., 2016). Therefore, AAd was not correlated with other biological parameters, but DMS presented good correlations with others. In addition to biological production, terrestrial inputs might affect the AAd distributions. Therefore, AAd exhibited high values near the Chengshan Cape, which has intense human activities; in this area, Chl a, DMS, DMSP, and phytoplankton abundance also had high values. Nonetheless, the terrestrial inputs were weaker in winter than in summer, which resulted in slightly higher AAd concentrations in the BS than in the YS. AAd, DMS, and DMSP exhibited relatively high values in the BS and the NYS, and the concentrations decreased from the inshore to offshore areas in the SYS during summer and winter; these results were consistent with the distribution patterns in the BS and YS during autumn (Liu et al., 2016).
The positive correlation between AAd and temperature in the NYS during summer and in the BS during winter (Table 2) indicated that high temperatures might have enhanced both the biological production and the terrestrial sources of AAd. The positive correlation between AAd and DMSPd in the SYS during summer suggested that AAd in the SYS was mainly produced by DMSPd degradation rather than terrestrial inputs.
4.2 Biogeochemical processes influencing AAd, DMS, and DMSP in the vertical profiles of the BS and YS
In summer, the average concentration order was AAd > DMSPt > DMS > DMSPd along the three transects; this result was consistent with the order in the surface seawater (Table 1). Higher values of DMS than DMSPd might be produced through the intracellular cleavage of phytoplankton DMSPp catalyzed by the enzyme DMSP lyase and the photochemical and biological reduction of dimethylsulfoxide (DMSO) to DMS (Asher et al., 2017). In contrast, the higher values of AAd than DMSPt indicated that there were terrestrial sources of AAd aside from the contribution of in situ DMSP degradation along the three transects. Although there were only small differences in the average concentrations of sulfur compounds between the three transects, the average concentrations of AAd showed significant differences (Kruskal–Wallis test, p<0.05). For instance, the AAd concentrations along transect B12–17 (NYS) and transect B57–63 (BS) were higher than those along transect H19–26 (SYS), which was in agreement with the distributions in the surface seawater. The high concentration could be ascribed to anthropogenic activities. The average contents of both Chl a and DMSPt along the three transects followed the order: B57–63 > B12–17 > H19–26. This result suggested that large amounts of phytoplankton biomass might have induced high concentrations of DMSPt.
In winter, the average Chl a and DMS concentrations along transect B12–16 were about twice as high as those along transect H19–26, which suggested that Chl a had a controlling effect on DMS production. However, the average concentrations of DMSPd, DMSPt, and AAd along transect H19–26 were quite similar to those along transect B12–16; this result implied that the enzymatic cleavage of DMSP had been enhanced and that river discharges were not the dominant influence on the concentrations of AAd in winter. The concentration order along both transect H19–26 and transect B12–16 was AAd > DMSPt > DMSPd > DMS. The AAd concentrations were only slightly higher than the DMSPt concentrations, whereas the DMSPd concentrations exceeded the DMS concentrations in winter.
A comparison of the vertical profiles in different seasons (Figs. 4 and 5, Table 1) indicated that the DMS concentrations declined dramatically (by more than 5 nmol L−1) from summer to winter and that the DMSPd concentrations also exhibited significant seasonal variations. The DMSPt concentrations were also slightly higher in summer than in winter, which was consistent with the seasonal pattern of Chl a, indicating the control of phytoplankton in DMS(P) production in both seasons. The higher AAd concentrations in summer than in winter were the combined result of high phytoplankton biomass and terrestrial inputs in summer. Overall, the reduced AAd concentrations from summer to winter along transect H19–26 were lower than those along transect B12–17(16), which suggested that terrestrial discharges contributed substantially to the AAd concentrations in the NYS and thus influenced the spatial distribution.
The AAd concentrations in the porewater were much higher in our study than those (50–60 nmol L−1) in the Gulf of Mexico reported by Vairavamurthy et al. (1986). The differences might be attributed to differences in the sampling and analytical methods and the locations. In the study by Vairavamurthy et al. (1986), sediment porewater was obtained by centrifugation of thawed samples that were kept deep-frozen and the authors measured only two samples using electron capture gas chromatography, whereas we collected porewater via Rhizon soil moisture samplers connected to vacuum tubes and analyzed samples using high-performance liquid chromatography. The pressure in the vacuum tube might have caused cell breakage in the sediments, thus releasing large amounts of AAd in the porewater. Moreover, the bacteria abundance and species in the sediments of the BS and YS in 2015 might be different from those in the Gulf of Mexico in 1986. Wang (2015) reported that δ- and γ-proteobacteria were the dominant taxa in the sediments of the BS and YS, with proportions in the range of 24 %–70 %. DddY, which is the only known periplasmic DMSP lyase (Li et al., 2017), is widely present in δ- and γ-proteobacteria and can cleave large amounts of intracellular DMSP (mmol L−1 levels) concentrated by DMSP-catabolizing bacteria (Wang et al., 2017). Therefore, all of these factors led to high AAd concentrations in the porewater of the surface sediments.
Slezak et al. (1994) discovered that the bacterial activity was reduced at AA concentrations > 10 µmol L−1 in long-term incubations of seawater cultures (24 to 110 h). Therefore, AAd in the porewater might have reduced the bacterial metabolism, thus impacting the microbial community in the sediments; this aspect is very important in the study of marine sediment ecosystems. In addition, we speculated that high concentrations of AAd in the sediments might have been transported to the bottom seawater because Nedwell et al. (1994) found that DMS was emitted to the water column from the sediments. To date, there are very few studies on AAd in sediments, and the potential factors influencing AAd concentrations in porewater remain unknown. For a better understanding of the source and fate of AAd in marine sediments, a detailed investigation of multiple parameters such as dissolved organic carbon, DMS, and DMSP in sediments is needed.
4.3 Degradation of DMSPd and AAd in the BS and YS
The microbial degradation rates of AAd in the BS and YS during summer were extremely high compared to the total biological uptake of AAd (0.07–1.8 nmol L−1 d−1) in the northern Gulf of Mexico in September 2011 (Tyssebotn et al., 2017); these discrepancies might be due to differences in the initial concentrations. Specifically, in our study, we added exogenous AAd at the beginning of incubation. Nevertheless, we found that the microbial degradation rates were higher at the inshore stations than the offshore stations. In addition, almost all production and degradation rates during summer and winter were independent of Chl a; these results were consistent with the results of Motard-Côté et al. (2016) and Tyssebotn et al. (2017).
The production and degradation rates of DMSPd, DMS, and AAd exhibited similar distributions in different sea areas during different seasons. For instance, the DMS production rates were lower than the AAd production rates at all stations in both summer and winter, implying that AAd was produced by DMSP through more complicated demethylation processes in addition to enzymatic cleavage, which is thought to be the sole pathway of DMS production from DMSP. The low enzymatic cleavage ratio (<50 %) during both summer and winter indicated that the enzymatic cleavage was not the dominant pathway of DMSP degradation (Ledyard and Dacey, 1996; Kiene and Linn, 2000b). It is noteworthy that the AAd production rates were slightly higher than the DMSPd degradation rates at some stations during summer and winter; the reason might be the direct production from DMSPp at those stations, in addition to the exogenous DMSPd during the incubation experiments. In addition, the AAd microbial degradation rates were always higher than the photochemical degradation rates, suggesting that microbial degradation was a more important pathway of AAd removal than photochemical degradation.
Nevertheless, the production and degradation rates of DMSPd, DMS, and AAd also showed seasonal and spatial variations. Higher production and degradation rates of DMSPd, DMS, and AAd in summer than in winter indicated that the temperature promoted the production and degradation rates. In addition, the seasonal differences in bacteria abundance and light intensity also made great contributions to different rates of microbial degradation and photochemical degradation, respectively. According to Liang et al. (2019), the abundances of Vibrio (belonging to the class γ-proteobacteria) averaged 1.4×10⁶ copies L−1 in summer, which was significantly higher than in winter (mean value of 1.9×10⁵ copies L−1) (Mann–Whitney test, p<0.01). Significant seasonal differences in total bacterial abundance were also observed (Mann–Whitney test, p<0.001). The average light intensity in summer was 49 400 lx, which was higher than that in winter (34 050 lx). All those factors led to high production and degradation rates in summer. In addition, Liang et al. (2019) also found that the dominant bacteria groups exhibited different distributions in abundance with different seasons and sea areas. Specifically, the abundance of V. campbellii was higher in the YS than in the BS in summer (p<0.05), whereas the abundance of V. caribbeanicus drastically decreased from the BS to the YS (p<0.05). Therefore, the different microbial production and degradation rates of DMSPd, DMS, and AAd in different sea areas might have resulted from the differences in bacteria species and abundance in the BS and YS. Moreover, there are differences in the capabilities of different bacteria species to degrade AAd, which resulted in the disparities of AAd microbial degradation rates and rate constants between the inshore and offshore stations.
We applied a simple box model to estimate the contribution of different sources and sinks of AAd in the surface seawater of the BS and YS:
We assumed that AAd concentrations were in a steady state; therefore, . The AAd production rate (rprod) was calculated by multiplying the AAd production rate constant with in situ concentration. The AAd microbial degradation rate (rbio) and photochemical degradation rate (rphoto) were calculated similarly. rother represented sources and sinks of AAd other than the production from DMSPd. Based on the equations, the mean rprod, rbio, and rphoto in summer were 5.76, 8.43, and 2.83 nmol L−1 h−1, respectively; the results indicated that there were other sources of AAd, i.e., a production rate of 5.50 nmol L−1 h−1. These sources might include the production from DMSPp, riverine inputs and other unknown sources. In winter, the mean rprod, rbio, and rphoto were 1.65, 2.66, and 1.32 nmol L−1 h−1, respectively, and the rate from other sources was 2.33 nmol L−1 h−1. The relationship of the rates from other sources between summer and winter was similar to that of the AAd concentrations in the surface seawater between summer and winter; namely, the rate from the other sources and the AAd concentrations in the surface seawater in winter were less than half of those in summer.
We investigated the horizontal and vertical distributions of AAd, DMS, and DMSP in the BS and YS during summer and winter. Significant seasonal variations were observed in the study area. The AAd concentrations were relatively high in the surface seawater during summer compared to during winter due to strong biological production from DMSP and abundant terrestrial inputs from rivers in summer. The distribution patterns of AAd were similar during summer and winter, i.e., relatively high values of AAd occurred in the BS and the NYS, and the concentrations decreased from the inshore to offshore areas in the SYS. In the vertical profiles, high values of AAd, DMS, and DMSP were mostly observed in the upper layers, with occasional high values in the bottom layers along the three different transects. The average concentration sequence was AAd > DMSPt > DMS > DMSPd among all three transects during summer, illustrating that DMSPp acted as a DMS producer and that terrestrial sources of AAd were present. In contrast, the sequence along transects in winter was AAd > DMSPt > DMSPd > DMS. DMS and AAd presented a stronger decrease from summer to winter than DMSP along transects. We also measured the AAd concentrations in the porewater of the surface sediments. The extremely high AAd concentrations in the porewater were attributed to the abundant bacteria and active bacteria DMSP lyases in the sediments. Moreover, the DMS and AAd production from DMSPd degradation and the AAd degradation rates were always higher during summer than during winter. The AAd microbial degradation rates and rate constants were higher than the photochemical degradation rates and rate constants during both summer and winter. The AAd production and degradation experiments also proved that other sources of AAd existed in addition to the production from DMSPd.
Most data used in this study are shown in the figures, tables, and references. More detailed data can be accessed by email request to the corresponding authors.
XW participated in the two cruises to collect and analyze samples, designed the on-deck experiments and carried them out, and wrote the original draft. PFL helped design the experiments. HHZ and MXZ reviewed and edited the draft. CYL designed the experiments and revised the draft. GPY gave suggestions for revisions.
The authors declare that they have no conflict of interest.
We thank the captain and crew of the R/V Dong Fang Hong 2 for their help during the investigations. We also thank the associate editor and two anonymous reviewers for their constructive comments, which greatly improved the manuscript.
This research has been supported by the National Key Research and Development Program of China (grant no. 2016YFA0601301), the National Natural Science Foundation of China (grant nos. 41676065 and 41176062), and the Fundamental Research Funds for the Central Universities (grant no. 201762032).
This paper was edited by Minhan Dai and reviewed by two anonymous referees.
Alcolombri, U., Ben-Dor, S., Feldmesser, E., Levin, Y., Tawfik, D. S., and Vardi, A.: Identification of the algal dimethyl sulfide–releasing enzyme: A missing link in the marine sulfur cycle, Science, 348, 1466–1469, 2015.
Andreae, M. O.: Dimethylsulfide in the water column and the sediment porewaters of the Peru upwelling area, Limnol. Oceanogr., 30, 1208–1218, 1985.
Andreae, M. O. and Barnard, W. R.: Determination of trace quantities of dimethyl sulfide in aqueous solutions, Anal. Chem., 55, 608–612, 1983.
Asher, E. C., Dacey, J. W. H., Stukel, M., Long, M. C., and Tortell, P. D.: Processes driving seasonal variability in DMS, DMSP, and DMSO concentrations and turnover in coastal Antarctic waters, Limnol. Oceanogr., 62, 104–124, 2017.
Bajt, O., Šket, B., and Faganeli, J.: The aqueous photochemical transformation of acrylic acid, Mar. Chem., 58, 255–259, 1997.
Bentley, R. and Chasteen, T. G.: Environmental VOSCs – formation and degradation of dimethyl sulfide, methanethiol and related materials, Chemosphere, 55, 291–317, 2004.
Charlson, R. J., Lovelock, J. E., Andreae, M. O., and Warren, S. G.: Oceanic phytoplankton, atmospheric sulphur, cloud albedo and climate, Nature, 326, 655–661, 1987.
Curson, A. R. J., Liu, J., Bermejo Martínez, A., Green, R. T., Chan, Y., Carrión, O., Williams, B. T., Zhang, S.-H., Yang, G.-P., Bulman Page, P. C., Zhang, X.-H., and Todd, J. D.: Dimethylsulfoniopropionate biosynthesis in marine bacteria and identification of the key gene in this process, Nature Microbiol., 2, 17009, https://doi.org/10.1038/nmicrobiol.2017.9, 2017.
Dacey, J. W. and Blough, N. V.: Hydroxide decomposition of dimethylsulfoniopropionate to form dimethylsulfide, Geophys. Res. Lett., 14, 1246–1249, 1987.
Dacey, J. W. and Wakeham, S. G.: Oceanic dimethylsulfide: production during zooplankton grazing on phytoplankton, Science, 233, 1314–1316, 1986.
Deschaseaux, E. S., Jones, G. B., Deseo, M. A., Shepherd, K. M., Kiene, R. P., Swan, H. B., Harrison, P. L., and Eyre, B. D.: Effects of environmental factors on dimethylated sulfur compounds and their potential role in the antioxidant system of the coral holobiont, Limnol. Oceanogr., 59, 758–768, 2014.
Espinosa, M. D. L. L., Martínez, A., Peralta, O., and Castro, T.: Spatial variability of dimethylsulfide (DMS) and dimethylsulfoniopropionate (DMSP) in the southern Gulf of Mexico, Environ. Chem., 13, 352–363, 2015.
Gibson, J. A. E., Swadling, K. M., and Burton, H. R.: Acrylate and Dimenthylsulfoniopropionate (DMSP) Concentrations during an Antarctic Phytoplankton Bloom, in: Biological and Environmental Chemistry of DMSP and Related Sulfonium Compounds, edited by: Kiene, R. P., Visscher, P. T., Keller, M. D., and Kirst, G. O., Springer US, Boston, MA, 213–222, 1996.
Jin, N.: Studies on Photochemical Process of Dimethylsulfide and its Transformation Rates in the Yellow Sea and the Bohai Sea, MS thesis, Ocean University of China, Qingdao, 2016.
Keller, M. D., Bellows, W. K., and Guillard, R. R. L.: Dimethyl sulfide production in marine phytoplankton, in: Biogenic Sulfur in the Environment, edited by: Saltzman, E. S. and Cooper, W. J., American Chemical Society, Washington, DC, 167–182, 1989.
Kiene, R. P. and Gerard, G.: Evaluation of glycine betaine as an inhibitor of dissolved dimethylsulfoniopropionate degradation in coastal waters, Mar. Ecol.-Prog. Ser., 128, 121–131, 1995.
Kiene, R. P. and Linn, L. J.: Distribution and turnover of dissolved DMSP and its relationship with bacterial production and dimethylsulfide in the Gulf of Mexico, Limnol. Oceanogr., 45, 849–861, 2000a.
Kiene, R. P. and Linn, L. J.: The fate of dissolved dimethylsulfoniopropionate (DMSP) in seawater: tracer studies using 35S-DMSP, Geochim. Cosmochim. Ac., 64, 2797–2810, 2000b.
Kiene, R. P. and Service, S. K.: Decomposition of dissolved DMSP and DMS in estuarine waters: dependence on temperature and substrate concentration, Mar. Ecol.-Prog. Ser., 76, 1–11, 1991.
Kiene, R. P. and Service, S. K.: The Influence of Glycine Betaine on Dimethyl Sulfide and Dimethylsulfoniopropionate Concentrations in Seawater, in: Biogeochemistry of Global Change, edited by: Oremland, R. S., Springer US, Boston, M.A., 654–671, 1993.
Kiene, R. P. and Slezak, D.: Low dissolved DMSP concentrations in seawater revealed by small-volume gravity filtration and dialysis sampling, Limnol. Oceanogr., 4, 80–95, 2006.
Kiene, R. P., Williams, L. P. H., and Walker, J. E.: Seawater microorganisms have a high affinity glycine betaine uptake system which also recognizes dimethylsulfoniopropionate, Aquat. Microb. Ecol., 15, 39–51, 1998.
Kinsey, J. D., Kieber, D. J., and Neale, P. J.: Effects of iron limitation and UV radiation on Phaeocystis antarctica growth and dimethylsulfoniopropionate, dimethylsulfoxide and acrylate concentrations, Environ. Chem., 13, 195–211, 2016.
Kirst, G. O., Thiel, C., Wolff, H., Nothnagel, J., Wanzek, M., and Ulmke, R.: Dimethylsulfoniopropionate (DMSP) in icealgae and its possible biological role, Mar. Chem., 35, 381–388, 1991.
Lana, A., Bell, T., Simó, R., Vallina, S., Ballabrera-Poy, J., Kettle, A., Dachs, J., Bopp, L., Saltzman, E., and Stefels, J.: An updated climatology of surface dimethlysulfide concentrations and emission fluxes in the global ocean, Global Biogeochem. Cy., 25, 3–25, 2011.
Ledyard, K. M. and Dacey, J. W.: Microbial cycling of DMSP and DMS in coastalandoligotrophicseawater, Limnol. Oceanogr., 41, 33–40, 1996.
Lee, H. J., Jung, K. T., Foreman, M., and Chung, J. Y.: A three-dimensional mixed finite-difference Galerkin function model for the oceanic circulation in the Yellow Sea and the East China Sea, Cont. Shelf Res., 20, 863–895, 2000.
Levine, N. M., Varaljay, V. A., Toole, D. A., Dacey, J. W., Doney, S. C., and Moran, M. A.: Environmental, biochemical and genetic drivers of DMSP degradation and DMS production in the Sargasso Sea, Environ. Microbiol., 14, 1210–1223, 2012.
Li, C. X., Yang, G. P., Wang, B. D., and Xu, Z. J.: Vernal distribution and turnover of dimethylsulfide (DMS) in the surface water of the Yellow Sea, J. Geophys. Res.-Oceans, 121, 7495–7516, 2016.
Li, C.-Y., Zhang, D., Chen, X.-L., Wang, P., Shi, W.-L., Li, P.-Y., Zhang, X.-Y., Qin, Q.-L., Todd, J. D., and Zhang, Y.-Z.: Mechanistic Insights into Dimethylsulfoniopropionate Lyase DddY, a New Member of the Cupin Superfamily, J. Mol. Biol., 429, 3850–3862, 2017.
Liang, J., Liu, J., Wang, X., Lin, H., Liu, J., Zhou, S., Sun, H., and Zhang, X.-H.: Spatiotemporal dynamics of free-living and particle-associated Vibrio communities in the northern Chinese marginal seas, Appl. Environ. Microbiol., 85, e00217–00219, 2019.
Liu, C. Y., Wang, L. L., Yang, G. P., Chen, Y., and Li, P. F.: Determination of acrylic acid in seawater by high performance liquid chromatography and its application, Acta Oceanol. Sin., 35, 172–176, 2013.
Liu, Q.: Analysis and Identification of Organic Compounds and Sifting of Items of Toxic Organic Compounds for the Water of Yalu River, Urban Environment & Urban Ecology, 14, 41–43, 2001.
Liu, S., Lou, S., Kuang, C., Huang, W., Chen, W., Zhang, J., and Zhong, G.: Water quality assessment by pollution-index method in the coastal waters of Hebei Province in western Bohai Sea, China, Mar. Pollut. Bull., 62, 2220–2229, 2011.
Liu, X., Huang, B., Huang, Q., Wang, L., Ni, X., Tang, Q., Sun, S., Wei, H., Liu, S., and Li, C.: Seasonal phytoplankton response to physical processes in the southern Yellow Sea, J. of Sea Res., 95, 45–55, 2015.
Liu, Y., Liu, C.-Y., Yang, G.-P., Zhang, H.-H., and Zhang, S.-H.: Biogeochemistry of dimethylsulfoniopropionate, dimethylsulfide and acrylic acid in the Yellow Sea and the Bohai Sea during autumn, Environ. Chem., 13, 127–139, 2016.
Lovelock, J. E., Maggs, R. J., and Rasmussen, R. A.: Atmospheric dimethyl sulphide and the natural sulphur cycle, Nature, 237, 452–453, 1972.
Luan, Q., Sun, J., Shen, Z., Song, S., and Wang, M.: Phytoplankton assemblage of Yangtze River Estuary and the adjacent East China Sea in summer, 2004, J. Ocean U. China, 5, 123–131, 2006.
Malin, G. and Erst, G. O.: Algal Production of Dimethyl Sulfide and Its Atmospheric Role1, J. Phycol., 33, 889–896, 1997.
Malin, G., Turner, S. M., and Liss, P. S.: Sulfur: the plankton/climate connection, J. Phycol., 28, 590–597, 1992.
McParland, E. L. and Levine, N. M.: The role of differential DMSP production and community composition in predicting variability of global surface DMSP concentrations, Limnol. Oceanogr., 64, 757–773, 2019.
Motard-Côté, J., Kieber, D. J., Rellinger, A., and Kiene, R. P.: Influence of the Mississippi River plume and non-bioavailable DMSP on dissolved DMSP turnover in the northern Gulf of Mexico, Environ. Chem., 13, 280–292, 2016.
Nedwell, D. B., Shabbeer, M. T., and Harrison, R. M.: Dimethyl sulphide in North Sea waters and sediments, Estuar. Coast. Shelf S., 39, 209–217, 1994.
Nguyen, B. C., Mihalopoulos, N., Putaud, J. P., Gaudry, A., Gallet, L., Keene, W. C., and Galloway, J. N.: Covariations in oceanic dimethyl sulfide, its oxidation products and rain acidity at Amsterdam Island in the southern Indian Ocean, J. Atmos. Chem., 15, 39–53, 1992.
Ning, X., Lin, C., Su, J., Liu, C., Hao, Q., Le, F., and Tang, Q.: Long-term environmental changes and the responses of the ecosystems in the Bohai Sea during 1960–1996, Deep-Sea Res. Pt. II, 57, 1079–1091, 2010.
Noordkamp, D. J. B., Gieskes, W. W. C., Gottschal, J. C., Forney, L. J., and Van Rijssel, M.: Acrylate in Phaeocystis colonies does not affect the surrounding bacteria, J. Sea Res., 43, 287–296, 2000.
Parsons, T. R., Maita, Y., and Lalli, C. M.: A manual of biological and chemical methods for seawater analysis, Pergamon Press, Oxford, 1984.
Quinn, P. K. and Bates, T. S.: The case against climate regulation via oceanic phytoplankton sulphur emissions, Nature, 480, 51–56, 2011.
Reisch, C. R., Moran, M. A., and Whitman, W. B.: Bacterial catabolism of dimethylsulfoniopropionate (DMSP), Front. Microbiol., 2, 1–12, 2011.
Seeberg-Elverfeldt, J., Schlüter, M., Feseker, T., and Kölling, M.: Rhizon sampling of porewaters near the sediment-water interface of aquatic systems, Limnol. Oceanogr.-Meth., 3, 361–371, 2005.
Shenoy, D. M. and Patil, J. S.: Temporal variations in dimethylsulphoniopropionate and dimethyl sulphide in the Zuari estuary, Goa (India), Mar. Environ. Res., 56, 387–402, 2003.
Shooter, D. and Brimblecombe, P.: Dimethylsulphide oxidation in the ocean, Deep-Sea Res. Pt. A, 36, 577–585, 1989.
Sicre, M. A., Peulve, S., Saliot, A., De Leeuw, J. W., and Baas, M.: Molecular characterization of the organic fraction of suspended matter in the surface waters and bottom nepheloid layer of the Rhone delta using analytical pyrolysis, Org. Geochem., 21, 11–26, 1994.
Sieburth, J. M.: Acrylic acid, an “antibiotic” principle in Phaeocystis blooms in Antarctic waters, Science, 132, 676–677, 1960.
Simó, R., Pedrós-Alió, C., Malin, G., and Grimalt, J. O.: Biological turnover of DMS, DMSP and DMSO in contrasting open-sea waters, Mar. Ecol.-Prog. Ser., 203, 1–11, 2000.
Slezak, D., Puskaric, S., and Herndl, G. J.: Potential role of acrylic acid in bacterioplankton communities in the sea, Mar. Ecol.-Prog. Ser., 105, 191–197, 1994.
Spiese, C. E., Le, T., Zimmer, R. L., and Kieber, D. J.: Dimethylsulfide membrane permeability, cellular concentrations and implications for physiological functions in marine algae, J. Plankton Res., 38, 41–54, 2016.
Stefels, J.: Physiological aspects of the production and conversion of DMSP in marine algae and higher plants, J. Sea Res., 43, 183–197, 2000.
Steinke, M., Malin, G., Archer, S. D., Burkill, P. H., and Liss, P. S.: DMS production in a coccolithophorid bloom: evidence for the importance of dinoflagellate DMSP lyases, Aquat. Microb. Ecol., 26, 259–270, 2002.
Su, J.: Circulation dynamics of the China Seas north of 18∘ N, in: The Sea, edited by: Robinson, A. R. and Brink, K. H., Wiley, Hoboken, New Jersey, 483–505, 1998.
Sun, J.: Distribution of Dimethyl Sulfur Compounds in China Marginal Seas and the Response of Their Algal Release to Acidificaiton MS thesis, Ocean University of China, Qingdao, 2017.
Sun, J., Liu, D., and Qian, S.: Preliminary study on seasonal succession and development pathway of phytoplankton community in the Bohai Sea, Acta Oceanol. Sin., 20, 251–260, 2001.
Sunda, W. G., Kieber, D. J., Kiene, R. P., and Huntsman, S.: An antioxidant function for DMSP and DMS in marine algae, Nature, 418, 317–320, 2002.
Tan, T.-T., Wu, X., Liu, C.-Y., and Yang, G.-P.: Distributions of dimethylsulfide and its related compounds in the Yangtze (Changjiang) River Estuary and its adjacent waters in early summer, Cont. Shelf Res., 146, 89–101, 2017.
Taylor, B. F. and Visscher, P. T.: Metabolic Pathways Involved in DMSP Degradation, in: Biological and Environmental Chemistry of DMSP and Related Sulfonium Compounds, edited by: Kiene, R. P., Visscher, P. T., Keller, M. D., and Kirst, G. O., Springer US, Boston, MA, 265–276, 1996.
Tyssebotn, I. M. B., Kinsey, J. D., Kieber, D. J., Kiene, R. P., Rellinger, A. N., and Motard-Côté, J.: Concentrations, biological uptake, and respiration of dissolved acrylate and dimethylsulfoxide in the northern Gulf of Mexico, Limnol. Oceanogr., 62, 1198–1218, 2017.
Vairavamurthy, A., Andreae, M. O., and Brooks, J. M.: Determination of acrylic acid in aqueous samples by electron capture gas chromatography after extraction with tri-n-octylphosphine oxide and derivatization with pentafluorobenzyl bromide, Anal. Chem., 58, 2684–2687, 1986.
Wang, K.: Chracteristics of bacterial community in the sediments of the Bohai Sea and Yellow Seas, revealed by 454-Pyrosequencing, MS thsis, Ocean University of China, Qingdao, 2015.
Wang, P., Cao, H. Y., Chen, X. L., Li, C. Y., Li, P. Y., Zhang, X. Y., Qin, Q. L., Todd, J. D., and Zhang, Y. Z.: Mechanistic insight into acrylate metabolism and detoxification in marine dimethylsulfoniopropionate-catabolizing bacteria, Mol. Microbiol., 105, 674–688, 2017.
Wang, X., Cui, Z., Guo, Q., Han, X., and Wang, J.: Distribution of nutrients and eutrophication assessment in the Bohai Sea of China, Chin. J. Oceanol. Limn., 27, 177–183, 2009.
Wei, H., Sun, J., Moll, A., and Zhao, L.: Phytoplankton dynamics in the Bohai Sea – observations and modelling, J. Marine Syst., 44, 233–251, 2004.
Wei, Q.-S., Liu, L., Zhan, R., Wei, X.-H., and Zang, J.-Y.: Distribution features of the chemical parameters in the Southern Yellow Sea in summer, Periodical of Ocean University of China, 40, 82–88, 2010.
Wolfe, G. V., Steinke, M., and Kirst, G. O.: Grazing-activated chemical defence in a unicellular marine alga, Nature, 387, 894–897, 1997.
Wu, X., Liu, C. Y., and Li, P. F.: Photochemical transformation of acrylic acid in seawater, Mar. Chem., 170, 29–36, 2015.
Wu, X., Li, P. F., Liu, C. Y., Zhang, H. H., Yang, G. P., Zhang, S. H., and Zhu, M. X.: Biogeochemistry of Dimethylsulfide, Dimethylsulfoniopropionate, and Acrylic Acid in the Changjiang Estuary and the East China Sea, J. Geophys. Res.-Oceans, 122, 10245–10261, 2017.
Yang, G. P., Song, Y. Z., Zhang, H. H., Li, C. X., and Wu, G. W.: Seasonal variation and biogeochemical cycling of dimethylsulfide (DMS) and dimethylsulfoniopropionate (DMSP) in the Yellow Sea and Bohai Sea, J. Geophys. Res.-Oceans, 119, 8897–8915, 2014.
Yang, G. P., Zhang, S. H., Zhang, H. H., Yang, J., and Liu, C. Y.: Distribution of biogenic sulfur in the Bohai Sea and northern Yellow Sea and its contribution to atmospheric sulfate aerosol in the late fall, Mar. Chem., 169, 23–32, 2015a.
Yang, J., Yang, G., Zhang, H., and Zhang, S.: Spatial distribution of dimethylsulfide and dimethylsulfoniopropionate in the Yellow Sea and Bohai Sea during summer, Chin. J. Oceanol. Limn., 33, 1020–1038, 2015b.
Zhang, D.: The Study of Phytoplankton and Biosilicon in the Yellow Sea and the Bohai Sea, MS thesis, Tianjin University of Science and Technology, Tianjin, 2018.
Zindler, C., Peeken, I., Marandino, C. A., and Bange, H. W.: Environmental control on the variability of DMS and DMSP in the Mauritanian upwelling region, Biogeosciences, 9, 1041–1051, https://doi.org/10.5194/bg-9-1041-2012, 2012.