the Creative Commons Attribution 4.0 License.
the Creative Commons Attribution 4.0 License.
 | 16 Apr 2020
Modelling nitrification inhibitor effects on N2O emissions after fall- and spring-applied slurry by reducing nitrifier NH4+ oxidation rate
Guillermo Hernandez-Ramirez
Reductions in N2O emissions from nitrification inhibitors (NI) are substantial but remain uncertain because measurements of N2O emissions are highly variable and discontinuous. Mathematical modelling may offer an opportunity to estimate these reductions if the processes causing variability in N2O emissions can be accurately simulated. In this study, the effect of NI was simulated with a simple, time-dependent algorithm to slow oxidation in the ecosystem model ecosys. Slower nitrification modelled with NI caused increases in soil concentrations and reductions in soil concentrations and in N2O fluxes that were consistent with those measured following fall and spring applications of slurry over 2 years from 2014 to 2016. The model was then used to estimate direct and indirect effects of NI on seasonal and annual emissions. After spring slurry applications, NI reduced N2O emissions modelled and measured during the drier spring of 2015 (35 % and 45 %) less than during the wetter spring of 2016 (53 % and 72 %). After fall slurry applications, NI reduced modelled N2O emissions by 58 % and 56 % during late fall in 2014 and 2015 and by 8 % and 33 % during subsequent spring thaw in 2015 and 2016. Modelled reductions were consistent with those from meta-analyses of other NI studies. Simulated NI activity declined over time so that reductions in N2O emissions modelled with NI at an annual timescale were relatively smaller than those during emission events. These reductions were accompanied by increases in NH3 emissions and reductions in losses with NI that caused changes in indirect N2O emissions. With further parameter evaluation, the addition of this algorithm for NI to ecosys may allow emission factors for different NI products to be derived from annual N2O emissions modelled under diverse site, soil, land use and weather.
- Article
(3810 KB) - Full-text XML
-
Supplement
(1184 KB) - BibTeX
- EndNote


Nitrification inhibitors (NI) have frequently been found to reduce N2O emissions from fertilizer and slurry applications in agricultural fields. In a meta-analysis of field experiments conducted for 2008, Akiyama et al. (2010) found average reductions of 38±6 % in N2O emissions from NI, with some variation attributed to land use type and emission rates. Similar average reductions of 35 %–40 % were reported in more recent meta-analyses by Ruser and Schulz (2015), Gilsanz et al. (2016), and Gao and Bian (2017). However the magnitudes of these reductions are uncertain because they vary with the rate and timing of fertilizer or slurry application, with land use and ecosystem type (Akiyama et al., 2010), and with application method (Zhu et al., 2016). These magnitudes are also uncertain because measurements of the N2O emissions on which they are based are highly variable temporally and spatially and difficult to sustain over the annual time periods needed to estimate NI reductions.
The effects of NI on N2O emissions are attributed to inhibition of ammonia monooxygenase, which slows the oxidation of to during nitrification (Subbarao et al., 2006) and hence slows the reduction of to N2O during nitrifier denitrification. The consequent slowing of oxidation to would also slow the reduction of to N2O during denitrification. The effectiveness of NI has been found to decline over time due to mineralization, adsorption and volatilization, depending on NI formulation. The rate of this decline varies among NI products and soil types and increases with soil temperature (Guardia et al., 2018).
The great majority of the studies included in meta-analyses of NI effects on N2O emissions were conducted following fertilizer or slurry application on warm soils in spring or summer (e.g. Akiyama et al., 2010). The effectiveness of NI with fall applications of fertilizer or slurry on cold soils has thus far received very limited attention (Ruser and Schulz, 2015), although in cold climates N2O emissions during the spring thaw following fall applications may exceed those during late spring and summer following spring applications (Lin et al., 2018). Emissions during spring thaw were attributed by Wagner-Riddle and Thurtell (1998) to soil NO3–N concentrations exceeding 20 mg kg−1 generated by fall-applied slurry that contributed to total N2O emissions exceeding 0.2 g N m−2 measured between January and April of the following year. Large N2O emissions measured in late winter were attributed by Dungan et al. (2017) to labile N not used by soil microorganisms during the previous fall and winter that was actively metabolized when the soils began to warm in early March. Interannual differences in spring thaw emission events after fall slurry applications were related by Kariyapperuma et al. (2012) to those in total soil mineral N content in the upper 15 cm of the soil profile during spring thaw. The effects of NI on N2O emissions during spring thaw will therefore depend on the persistence with which NI reduce nitrification in cold soils during fall and winter and thereby alter mineral N concentrations during the following spring.
Reductions in N2O emissions directly caused by slower nitrification with NI may be partially offset by increases in indirect N2O emissions from increasing NH3 emissions caused by greater soil concentrations (Lam et al., 2017; Qiao et al., 2015). NI may also decrease indirect N2O emissions by reducing concentrations and hence leaching. Both direct and indirect effects of NI on N2O emissions must be considered when estimating effects of NI on total N2O emissions.
The Intergovernmental Panel on Climate Change (IPCC) Tier 3 methodology for estimating N2O emissions under diverse climates, soils, fertilizers and land uses includes the use of comprehensive, process-based mathematical models of terrestrial C, N, and water and energy cycling (IPCC, 2019). Although NI effects on nitrification have been added to some existing process models (Cui et al., 2014; Del Grosso et al., 2009; Li et al., 2020), testing of modelled NI effects on N2O emissions against measurements remains limited to brief periods following soil N amendments (e.g. Giltrap et al., 2011). The mathematical model ecosys explicitly represents the key processes in nitrification (Grant, 1994), denitrification (Grant, 1991) and associated N2O emissions (Grant, 1995) and has been tested against measurements of N2O emissions using micrometeorological methods and manual and automated chambers (Grant and Pattey, 1999, 2008; Grant et al., 2006, 2016; Metivier et al., 2009). In this study, we propose that applying a time-dependent reduction of oxidation rates during nitrification will enable ecosys to simulate the time course of reductions in N2O emissions with NI measured after fall and spring applications of dairy slurry in a field experiment. The model is then used to estimate the direct and indirect effects of NI on annual N2O emissions with fall and spring slurry applications as required for IPCC Tier 3 methodology and how these effects would change with alternative tillage practices and timings of slurry application.
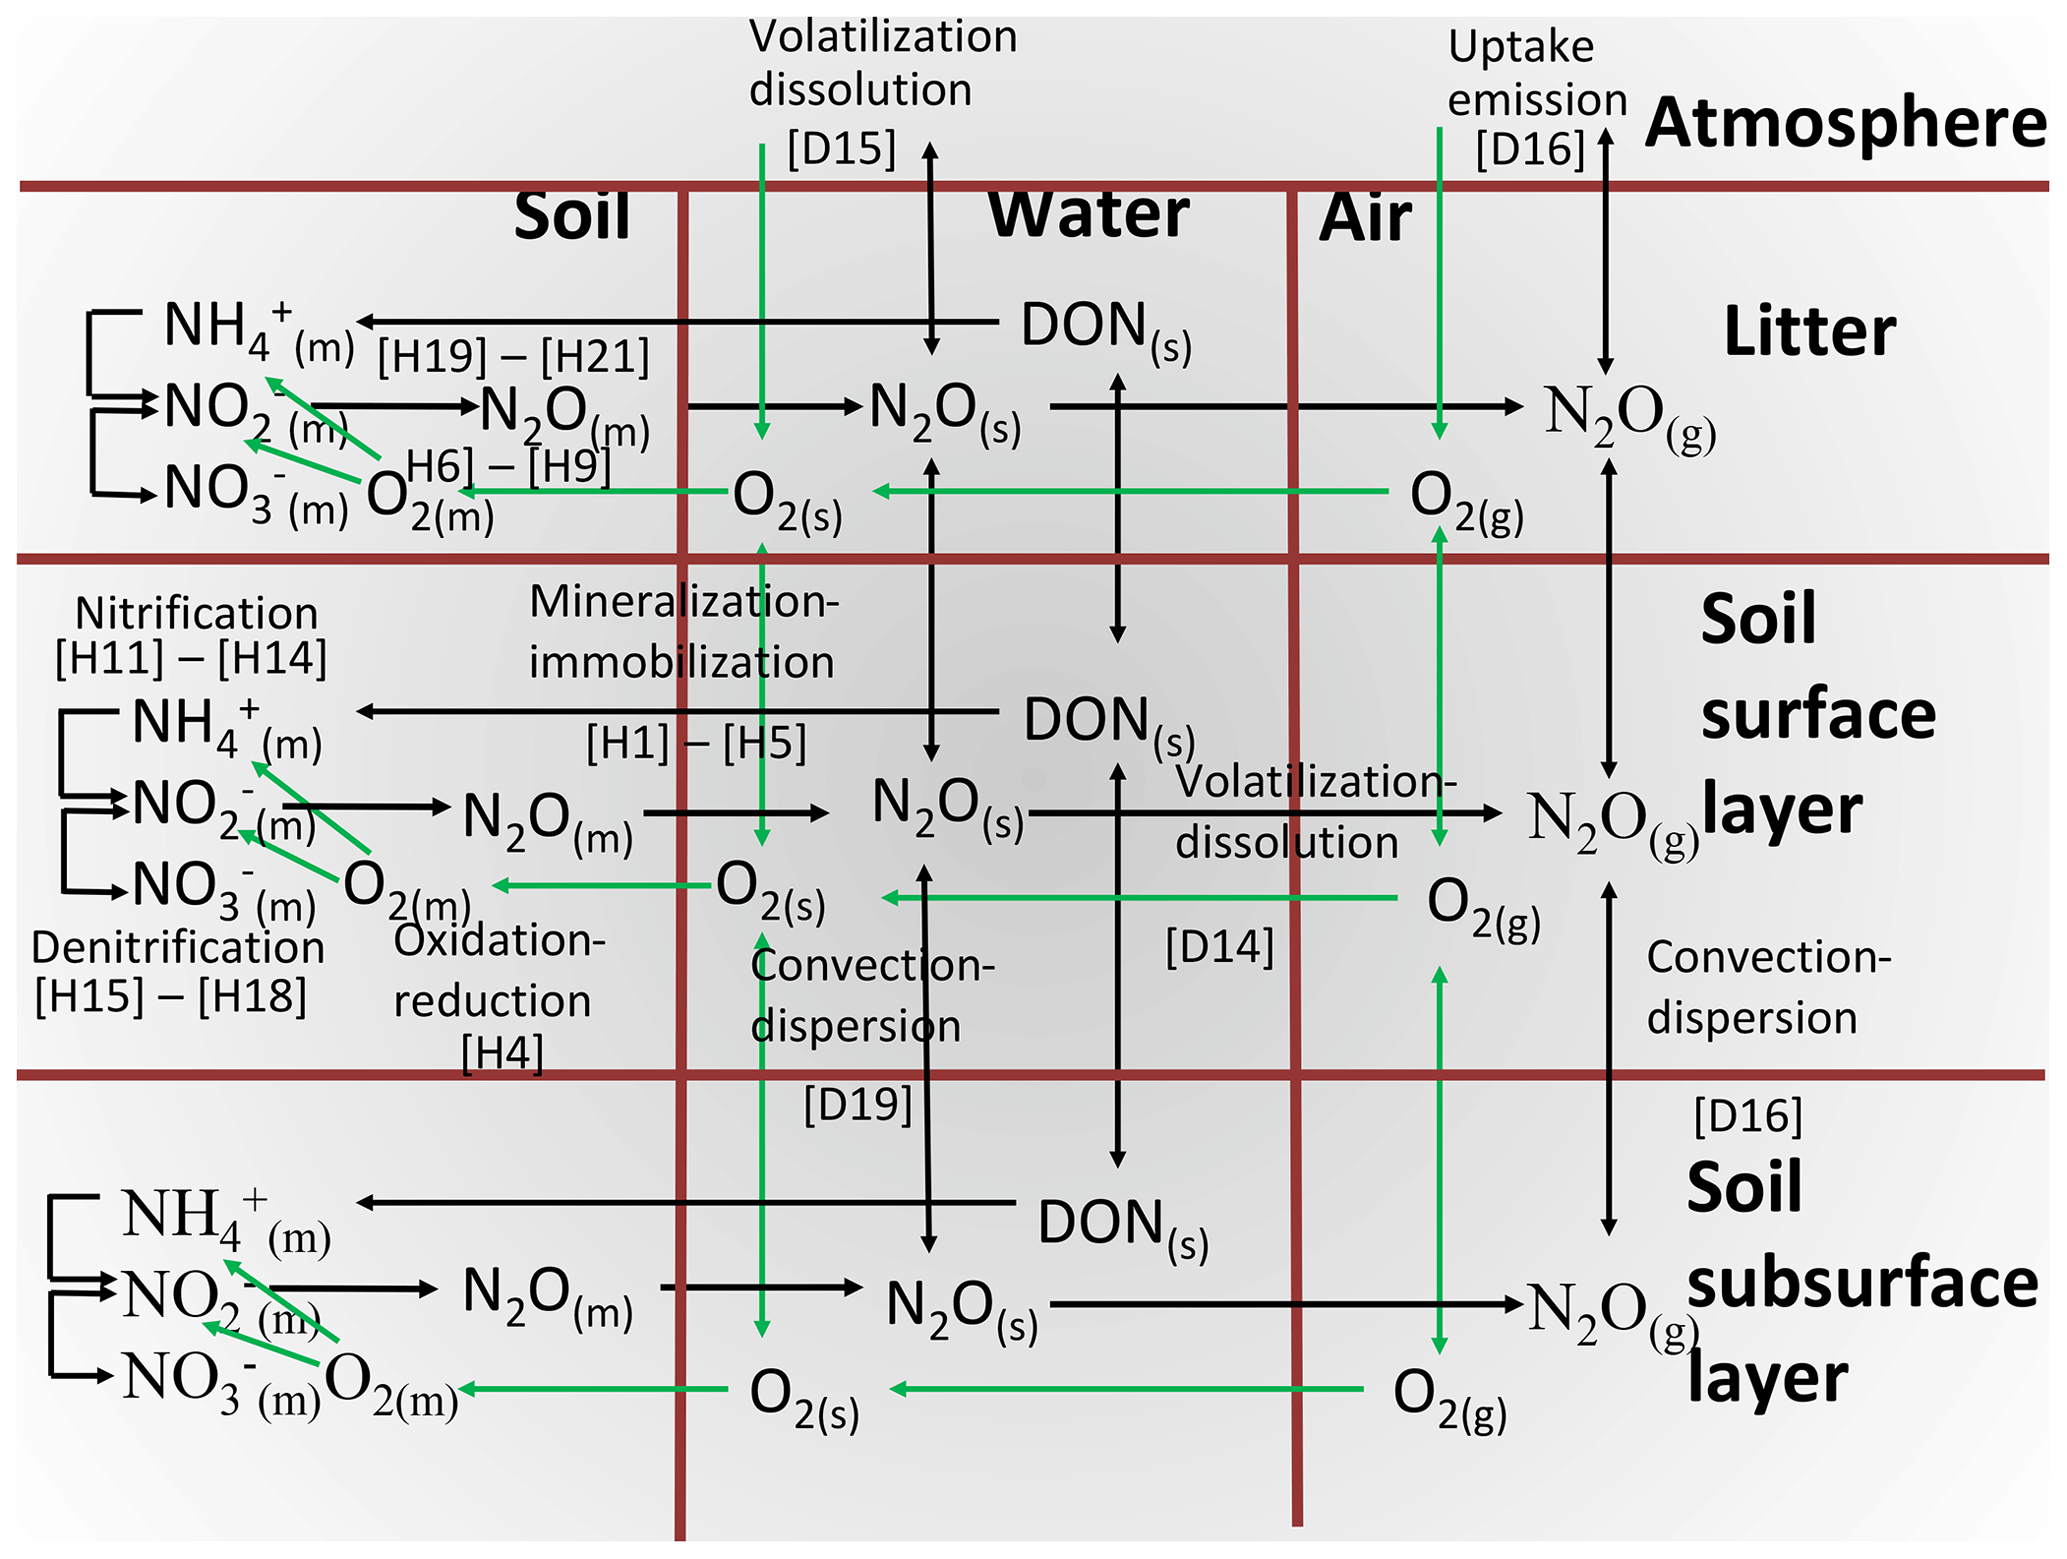
Figure 1Key transformations governing N2O emissions as represented in ecosys. Expressions in square brackets refer to equations in the Supplement, as described in Sect. 2.
2.1 General overview
The hypotheses for oxidation–reduction reactions involving N2O, and the aqueous and gaseous transport of their substrates and products, are represented in Fig. 1 and described in further detail below. These hypotheses function within a comprehensive model of soil C, N and P transformations, which is coupled to models of soil water, heat and solute transport in surface litter and soil layers. These models function within the comprehensive ecosystem model ecosys. Key transformations that drive N2O emissions are described in Sect. 2.2 to 2.8 below, and modifications of these transformations to simulate nitrification inhibition are described in Sect. 2.9. References to equations and definitions in Sect. 2.2 to 2.8 and given in Supplement S1, S3, S4, S5 and S8 (Table 1) are provided for those interested in model methodology but are not needed for a general understanding of model behaviour.

2.2 Mineralization and immobilization of ammonium by microbial functional types
Heterotrophic microbial functional types (MFTs) m (obligately aerobic bacteria, obligately aerobic fungi, facultatively anaerobic denitrifiers, anaerobic fermenters, acetotrophic methanogens, and obligately aerobic and anaerobic non-symbiotic diazotrophs) are associated with each organic substrate i (i is manure, coarse woody plant residue, fine non-woody plant residue, particulate organic matter or humus). Autotrophic MFTs n (aerobic and oxidizers, aerobic methanotrophs, and hydrogenotrophic methanogens) are associated with inorganic substrates. These MFTs grow [A25] with energy generated from oxidation of dissolved organic C (DOC) by heterotrophs [H2, H10], of acetate by acetotrophic methanogens, of mineral N ( and ) [H11, H15] by nitrifiers, of CH4 by methanotrophs [G7] or of H2 by hydrogenotrophic methanogens [G12], coupled with reduction of e− acceptors O2 [H4, G22], acetate [G8], NOx [H7–H9] and CO2 [G13]. These MFTs decay according to first-order rate constants [A23], with internal recycling of resources (C, N, P) from structural to nonstructural components j (j is labile, recalcitrant, nonstructural) varying with nonstructural ratios [A24], the decay products of which form humus C, N and P [A35, A36]. Each MFT seeks to maintain a set nonstructural ratio by mineralizing and [H1a] from, or by immobilizing , and [H1b, H1c] into, its nonstructural N and P components. These transformations control the exchange of N and P between organic and inorganic states, and of O2 between aqueous and gaseous states, and hence affect the availability of substrates and e− acceptors for nitrification and denitrification.
2.3 Oxidation of DOC and reduction of oxygen by heterotrophs
N2O is generated when demand for e− acceptors from oxidation by aerobic heterotrophs and autotrophs (Sect. 2.2) exceeds supply from O2, requiring explicit modelling of O2 transport and uptake and consequent O2 constraints to oxidation–reduction reactions (Fig. 1). Constraints on heterotrophic oxidation of DOC imposed by O2 uptake are solved in four steps:
-
DOC oxidation by heterotrophs under non-limiting O2 is calculated from specific oxidation rates multiplied by active biomasses and an Arrhenius function of Ts [A6] used for all microbial transformations, constrained by DOC concentration [H2].
-
O2 reduction to H2O under non-limiting O2 (O2 demand) by aerobic heterotrophs is calculated from step 1 using a set respiratory quotient [H3].
-
O2 reduction to H2O under ambient O2 is calculated from radial O2 diffusion through water films with thicknesses determined by soil water potential [H4a] coupled with active uptake at heterotroph surfaces driven by step 2 [H4b]. Diffusion and uptake are sustained by O2 transfer through soil aqueous and gaseous phases controlled by soil water- and air-filled porosity governed by freezing, thawing and transfer of soil water [D14–D20]. O2 diffusion and active uptake are calculated for each heterotrophic population associated with each organic substrate, allowing [H4] to calculate lower O2 concentrations at microbial surfaces (O2m) associated with more biologically active substrates (e.g. manure, litter). Localized zones of low O2 concentration (hotspots) are thereby simulated when O2 uptake by any aerobic MFT is constrained by O2 diffusion to that functional type. O2 uptake by each heterotrophic MFT is affected by competition for O2 uptake with other heterotrophs, nitrifiers, roots and mycorrhizae, calculated from its biological O2 demand relative to those of other aerobic functional types.
-
DOC oxidation to CO2 under ambient O2 is calculated from steps 2 and 3 [H5]. The energy yield of DOC oxidation with O2 reduction drives the uptake of additional DOC for construction of microbial biomass Mi,h according to construction energy costs of each heterotrophic functional type [A21]. Energy costs of denitrifiers are slightly larger than those of obligately aerobic heterotrophs, placing denitrifiers at a small competitive disadvantage for growth and hence DOC oxidation under non-limiting O2.
2.4 Oxidation of DOC and reduction of nitrate, nitrite and nitrous oxide by denitrifiers
N2O may be both the product and substrate of NOx reduction coupled with DOC oxidation by denitrifiers. Constraints imposed by availability on denitrifier DOC oxidation are solved in five steps:
-
reduction to by heterotrophic denitrifiers under non-limiting is calculated from demand for e− acceptors by denitrifiers for DOC oxidation to CO2 but not met from O2 reduction to H2O because of diffusion limitations to the O2 supply (Sect. 2.3, step 3). This unmet demand is transferred to [H6].
-
reduction to under ambient is calculated from step 1, accounting for relative concentrations and affinities of and [H7].
-
reduction to N2O under ambient is calculated from demand for e− acceptors not met by reduction in step 2, accounting for relative concentrations and affinities of and N2O. This unmet demand is transferred to [H8].
-
N2O reduction to N2 under ambient N2O is calculated from demand for e− acceptors not met by reduction in step 3 and hence transferred to N2O [H9].
-
Additional energy yield from DOC oxidation to CO2 enabled by NOx reduction in steps 2, 3 and 4 is added to that enabled by O2 reduction from [H5], which drives additional DOC uptake for construction of Mi,n. This additional uptake offsets the disadvantage incurred by the larger construction energy costs of denitrifiers (Sect. 2.3, step 4).
2.5 Oxidation of ammonium and reduction of oxygen by nitrifiers
N2O may also be generated by reduction of coupled with oxidation of by autotrophic nitrifiers. Constraints on nitrifier oxidation of imposed by O2 uptake are solved in four steps:
-
Oxidation of (in dynamic equilibrium with NH3 [E24]) under non-limiting O2 is calculated from a specific oxidation rate multiplied by active biomass and an Arrhenius function of Ts and constrained by and CO2 concentrations [H11].
-
O2 reduction to H2O under non-limiting O2 (O2 demand) is calculated from step 1 using set respiratory quotients [H12].
-
O2 reduction to H2O under ambient O2 is calculated from radial O2 diffusion through water films of thickness determined by soil water potential [H13a] coupled with active uptake at nitrifier surfaces driven by step 2 [H13b]. O2 uptake by nitrifiers is affected by competition for O2 uptake with heterotrophic DOC oxidizers, roots and mycorrhizae, calculated from its biological O2 demand relative to those of other aerobic functional types.
-
oxidation to under ambient O2 is calculated from steps 2 and 3 [H14]. The energy yield of oxidation drives the fixation of CO2 for construction of microbial biomass Mi,n according to nitrifier construction energy costs.
2.6 Oxidation of nitrite and reduction of oxygen by nitrifiers
Constraints on nitrifier oxidation of to imposed by O2 uptake [H15–H18] are solved in the same way as those of to [H11–H14]. The energy yield of oxidation drives the fixation of CO2 for construction of microbial biomass Mi,o according to nitrifier construction energy costs.
2.7 Oxidation of ammonium and reduction of nitrite by nitrifiers
In both nitrifier and denitrifier processes, N2O is generated from reduction of , the availability of which is controlled by oxidation (Sect. 2.6). Under low O2 concentrations oxidation is suppressed [H18], favouring reduction. Constraints on nitrifier oxidation of imposed by availability are solved in three steps:
-
reduction to N2O under non-limiting is calculated from e− acceptors demanded by oxidation to but not met by O2 for reduction to H2O because of diffusion limitations to O2 supply and hence transferred to [H19].
-
reduction to N2O under ambient and CO2 is calculated from step 1 [H20], competing for with denitrifiers [H8] and nitrifiers [H18].
-
Energy yield from additional oxidation to enabled by reduction in step 2 [H21] is added to that enabled by O2 reduction from step 4 in Sect. 2.5 [H14], which drives the fixation of additional CO2 for construction of Mi,n.
2.8 Uptake of ammonium and reduction of oxygen by roots and mycorrhizae
oxidation and O2 reduction by nitrifiers compete for substrates with uptake and O2 reduction by other MFTs and by roots and mycorrhizae.
-
uptake by roots and mycorrhizae under non-limiting O2 is calculated from mass flow and radial diffusion between adjacent roots and mycorrhizae [C23a] coupled with active uptake at root and mycorrhizal surfaces [C23b]. Active uptake is subject to product inhibition by root nonstructural N:C ratios [C23g], where nonstructural N is the active uptake product, and nonstructural C is the CO2 fixation product transferred to roots and mycorrhizae from the canopy.
-
O2 reduction to H2O under non-limiting O2 is calculated from O2 demands for uptake in step 1 and for oxidation of root and mycorrhizal nonstructural C for root maintenance and growth using a set respiratory quotient [C14e].
-
O2 reduction to H2O under ambient O2 is calculated from mass flow and radial diffusion between adjacent roots and mycorrhizae [C14d] coupled with active uptake at root and mycorrhizal surfaces driven by step 2 [C14c]. O2 uptake by roots and mycorrhizae is also affected by competition with O2 uptake by heterotrophic DOC oxidizers, and autotrophic nitrifiers, calculated from their biological O2 demands relative to those of other populations.
-
Oxidation of root and mycorrhizal nonstructural C to CO2 under ambient O2 is calculated from steps 2 and 3 [C14b].
-
uptake by roots and mycorrhizae under ambient O2 is calculated from steps 1, 2, 3 and 4 [C23b].
2.9 Nitrification inhibition
For this study, NI were assumed to reduce specific rates of oxidation by nitrifiers in step 1 in Sect. 2.5, thereby simulating inhibition of ammonia monooxygenase (Subbarao et al., 2006). This reduction was represented by a time-dependent scalar I:
where t is the current time step (h), t−1 is the previous time step (h), I is the inhibition (initialized to 1.0 at t=0 at the time of application), RI is the rate constant for decline of I representing NI degradation (set to h−1 for more persistent NI such as 3,4-dimethylpyrazole phosphate – DMPP – and to h−1 for less persistent NI such as nitrapyrin; Ruser and Schulz, 2015), is an Arrhenius function of soil temperature (Ts) used to simulate Ts effects on microbial activity ([A6] in step 1, Sect. 2.3), and l is the soil layer in which NI are present. The values of RI and for DMPP were selected to give time and temperature dependencies of DMPP activity following application inferred from incubation studies by Guardia et al. (2018). Model results for NI presented below are those using the smaller RI for DMPP unless stated as those using the larger RI for nitrapyrin.
Specific rates of oxidation (step 1, Sect. 2.5) with NI was calculated as
where and are specific oxidation rates with and without NI (g N g nitrifier C−1 h−1), [] is the aqueous concentration (g N m−3 in dynamic equilibrium with [NH3]), and is an inhibition constant set at 7000 g N m−3 to reduce inhibition at very large [] as suggested in Janke et al. (2019). These rates were used to calculate nitrification rates [H11]:
where is the nitrification rate (g N m−2 h−1), Mn is the nitrifier biomass (g C m−2), and and are half-saturation constants for aqueous and CO2 (g N and C m−3). The NI in Eq. (1) slows in Eq. (2) and thereby in Eq. (3) and hence slows production from nitrification (step 4, Sect. 2.5) and thereby N2O production from nitrification (step 2, Sect. 2.7) and denitrification (step 3, Sect. 2.4). By slowing in Eq. (3), NI also reduce nitrification energy yield and hence Mn growth, biomass [A25] and O2 uptake [H13], thereby further reducing N2O production.
Table 2Key soil properties of the Black Chernozem soil at the South Campus Farm used in ecosys. SOC is soil organic carbon, and SON is soil organic nitrogen.
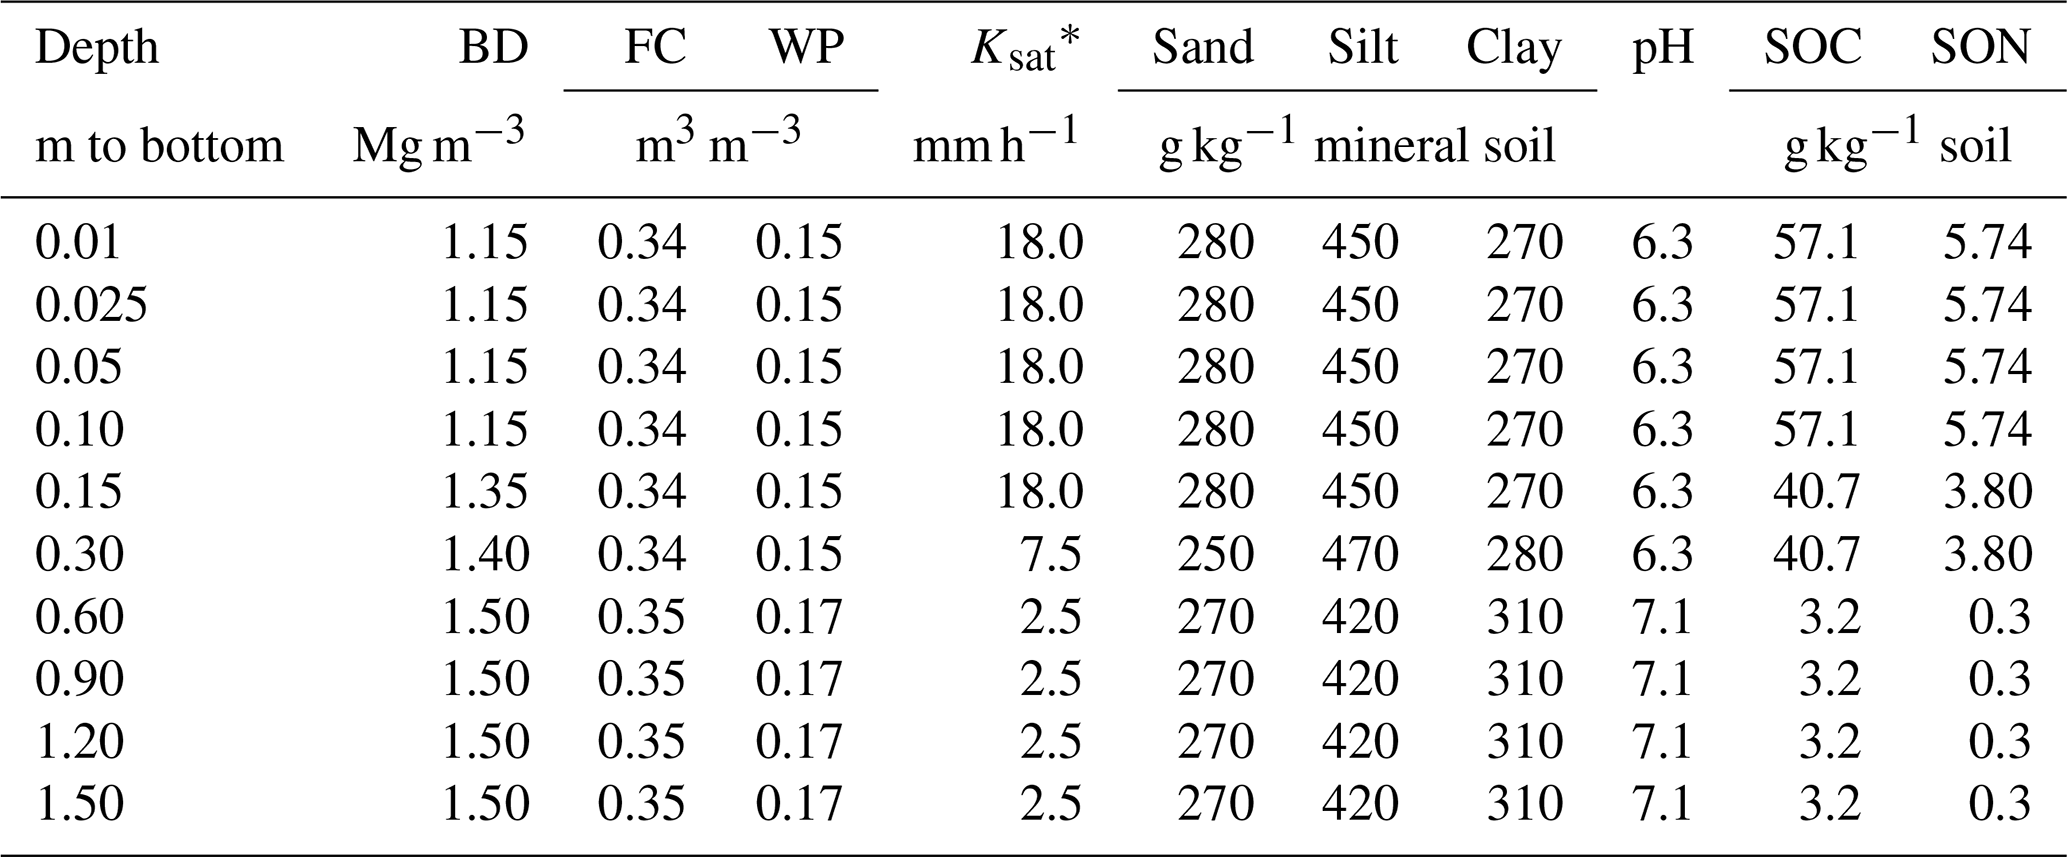
* From Saxton et al. (1986).
3.1 Site description and experimental design
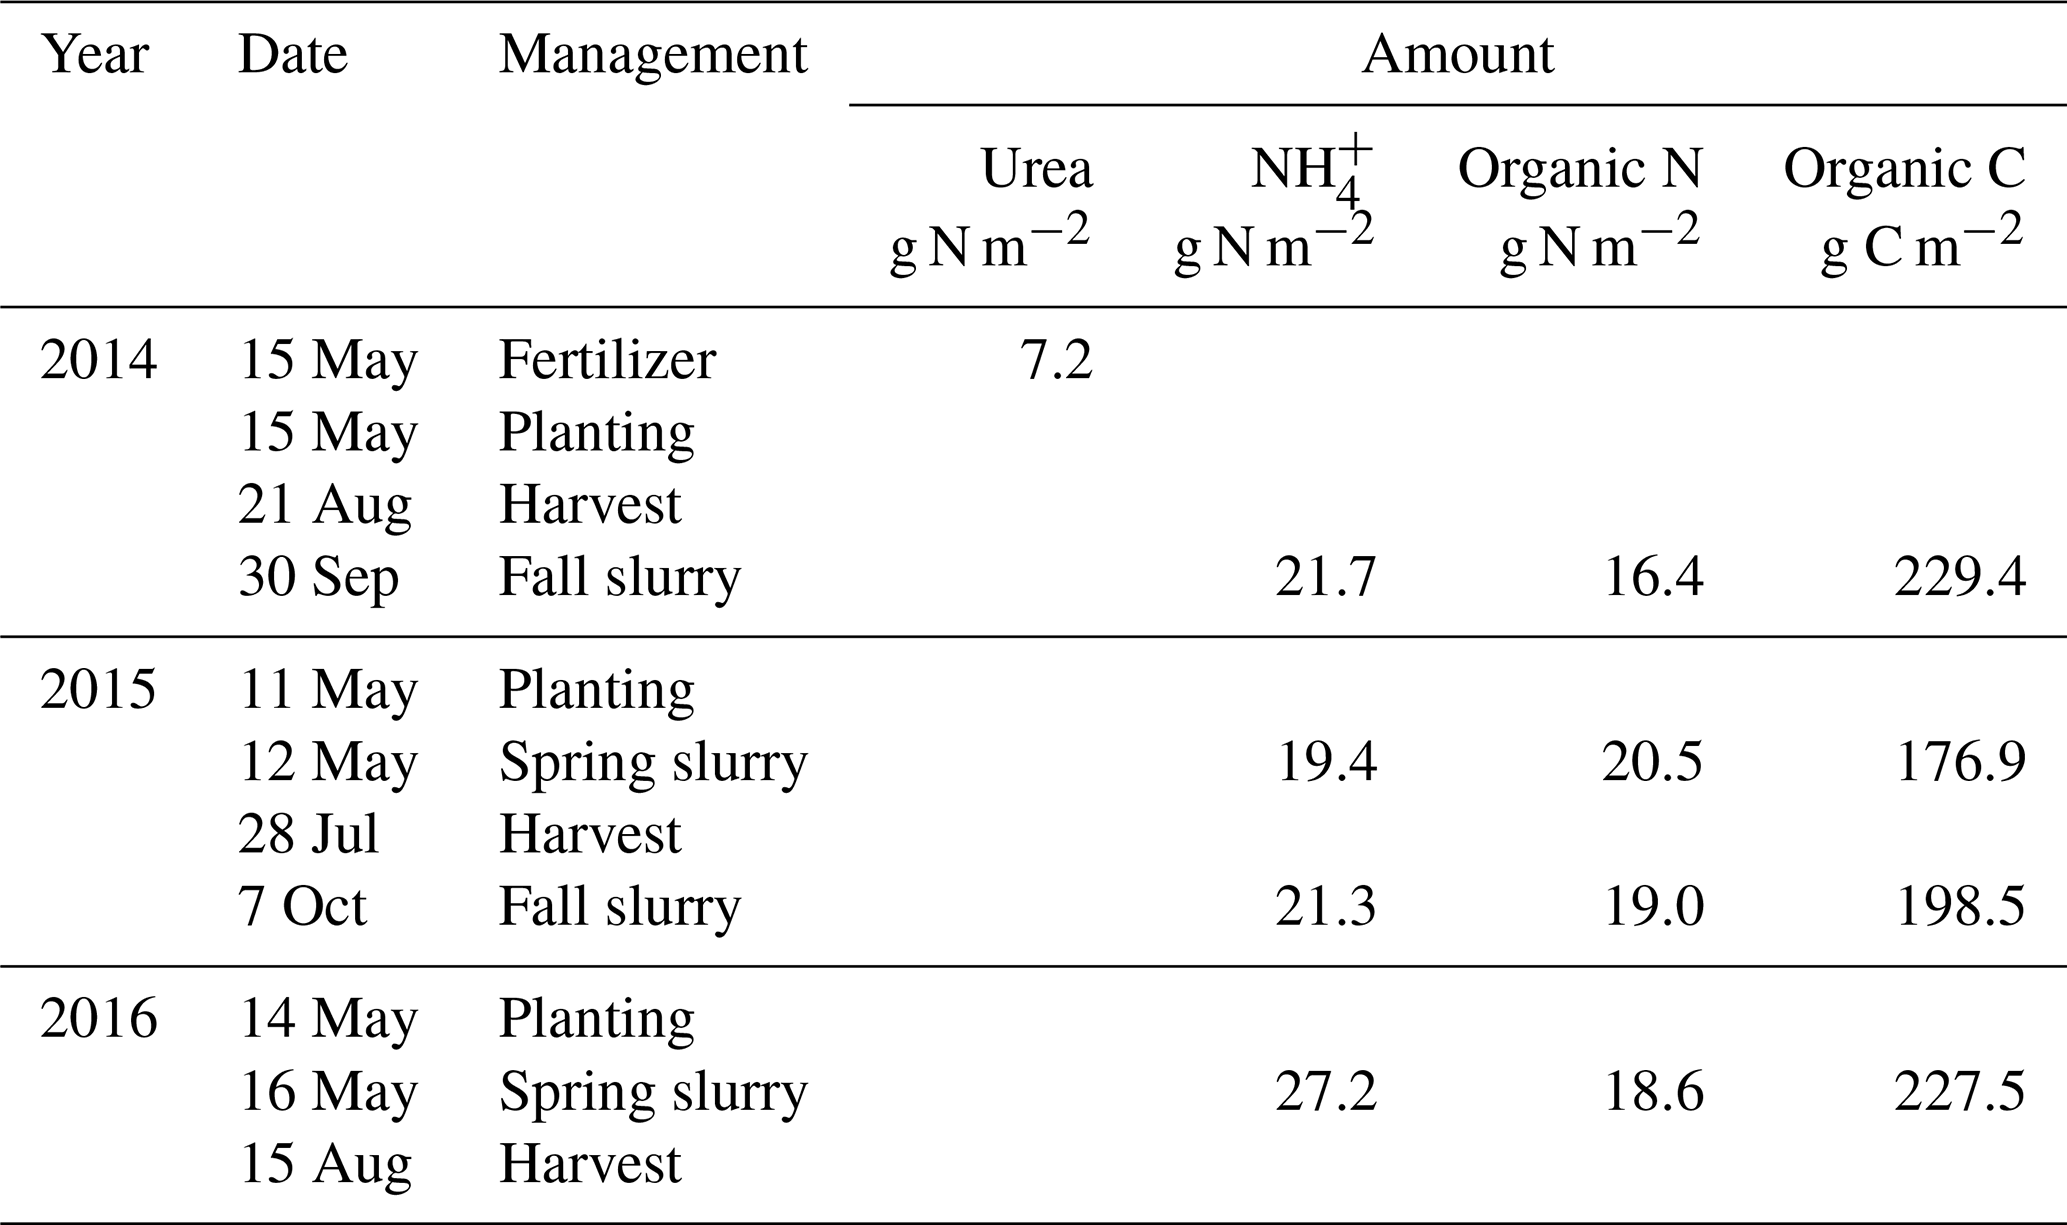
An experiment was established on a Black Chernozem (Table 2) under barley (Hordeum vulgare L.) silage from 2014 to 2016 on a level site at the South Campus Farm in Edmonton, AB, Canada (53∘29′30′′ N, 113∘31′53′′ W). The experimental design was an incomplete split plot (main plot: fall vs. spring application of dairy slurry; split plot: control vs. NI treatments) on plots 2.4 m in width and 6.1 m in length with three replicates. The NI products ENTEC (EuroChem Agro, Mannheim, Germany) and the eNtrench nitrogen stabilizer (Dow Chemical Company, Dow AgroSciences, Calgary, AB, Canada) were mixed with the slurry immediately before application to provide 0.4 kg ha−1 of the active ingredient with slurry injection of 56.17 m3 ha−1 at 12.7 to 15.2 cm (average 14 cm) depth and 28 cm spacing. Measured concentrations of and of organic N and C in each slurry application were used to calculate rates of , organic N and organic C amendments (Table 3). Soil concentrations were measured from 0 to 10 cm every 2–3 weeks between spring thaw and autumn freezing in 2014, 2015 and 2016. Further details of this field experiment are given in Lin et al. (2018).
Table 3Plant and soil management schedule at the Edmonton South Campus Farm.
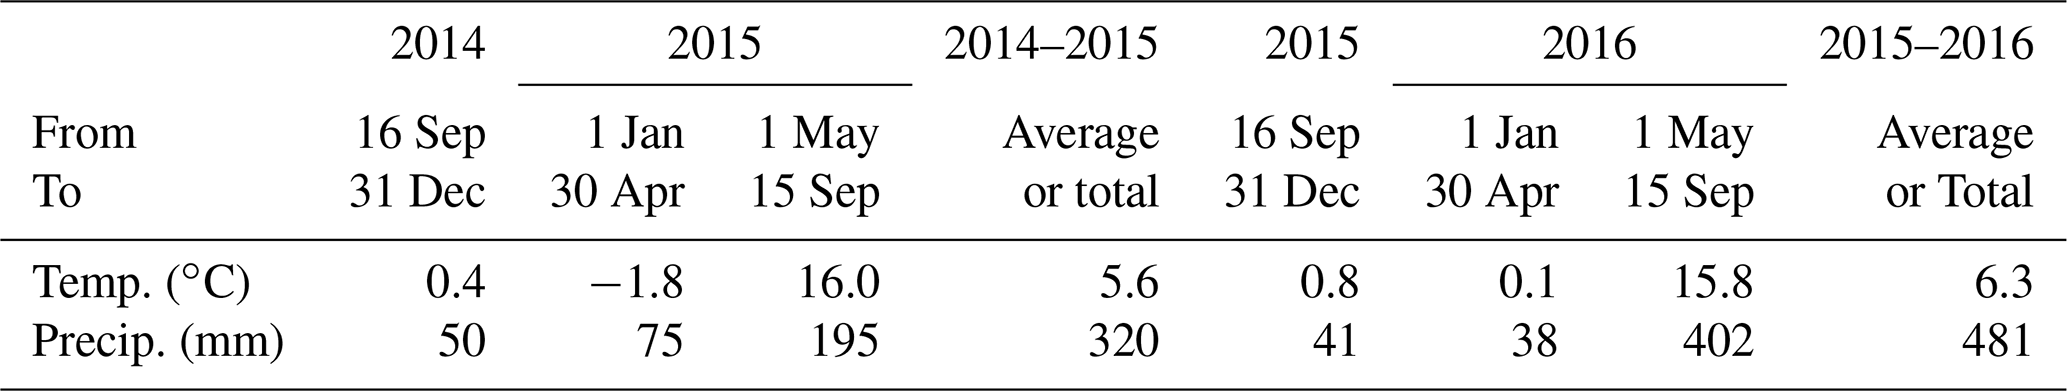
Weather data (radiation, air temperature – Ta, humidity, wind speed and precipitation) were recorded hourly from 2012 to 2016 at the South Campus Farm. During the first experimental year (16 September 2014 to 15 September 2015) Ta remained 1–2 ∘C higher than historical (1981–2010) averages (Lin et al., 2018; Table 4). Precipitation was slightly higher than historical averages during autumn and winter but was about one-half those during spring and summer. During the second experimental year (16 September 2015 to 15 September 2016), Ta was higher than that of the first year during winter and early spring and similar during late spring and summer. However precipitation during the second year was lower from autumn to early spring and much higher during late spring and summer.
Table 4Average temperatures and total precipitation measured at the Edmonton South Campus Farm during autumn–winter, winter–spring and spring–summer in 2014–2015 and 2015–2016.
3.2 N2O flux measurements
N2O fluxes were measured at 3 h intervals from as soon as field conditions allowed after spring thaw to late summer during both experimental years with automated chambers (height of 26 cm, area of 0.216 m2) connected by 0.5 cm i.d. tubes to a FTIR gas analyser (GASMET model CX4025, Temet Instruments, Finland) through which air flow was maintained at 5.1 L min−1. During each 20 min measurement period, the chambers remained open for the first 5 min to restore ambient N2O concentrations in the gas analyser, after which chambers were closed and N2O concentrations were measured at 10 Hz and averages recorded at 1 min intervals. Concentrations during the first minute after closure were discarded, and those during the following 14 min were used to calculate fluxes using linear regression with an acceptance criterion of R2≥0.85. Based on the analytical precision of the gas analyser, the N2O flux detection limit was determined to be ±0.03 mg N m−2 h−1.
N2O emissions were also measured once or twice per week from spring thaw to autumn freezing during both experimental years with manually operated chambers as described in Lin et al. (2018). The time required for installation of the automated chambers after snowmelt limited their ability to measure N2O emissions during spring thaw so that measurements from the manually operated chambers were used to evaluate emissions during these periods.
4.1 Model spin-up
To simulate site conditions prior to the experiment, ecosys was initialized with the properties of the Black Chernozem, simulated as a one-dimensional profile (Table 2) with surface water runoff and subsurface water exchange with a water table at 1.2 m depth. The model was run from model dates 1 January 1992 to 31 December 2013 under a repeating 5-year sequence of weather data (radiation, air temperature – Ta, humidity, wind speed and precipitation) recorded hourly from 2012 to 2016 at the South Campus Farm. During each year of the spin-up run, barley was planted, fertilized and harvested as silage to reproduce land use practices reported from the field site.
4.2 Model runs
The spin-up run was extended from 1 January 2014 to 31 December 2016 under weather data recorded from 2014 to 2016 with the land use schedules and practices from the field site (Table 3). Each modelled slurry application was added to the soil layer, the depth of which corresponded to that of slurry injection in the field experiment (14 cm). Modelled applications were accompanied by addition of water corresponding to the volume and depth of the application (5.6 mm from 56.17 m3 ha−1 at 14 cm in Sect. 3.1), and by tillage using a coefficient for surface litter incorporation and soil mixing of 0.2 to the depth of application (14 cm), based on field observations. A control run was also conducted in which no slurry applications were modelled. For all silage harvests, cutting height and harvest efficiency were set to 0.15 m and 0.9 so that 0.9 of all plant material above 0.15 m was removed as yield. Concentrations of and , and N2O emissions modelled during key emission events, were compared with measured values (Sect. 3.1 and 3.2), and modelled emissions were then aggregated into seasonal and annual values.
There is some flexibility in the timing of fall slurry application between crop harvest in late summer and soil freezing in early November. To examine how timing of fall slurry application would affect subsequent N2O emissions with and without NI, fall slurry application dates were advanced or delayed by 2 weeks from those in Table 3, and effects on spring and annual N2O emissions were evaluated. To examine how increased tillage during slurry application would affect subsequent N2O emissions with and without NI, coefficients for surface litter incorporation and soil mixing to the depth of slurry application were raised from 0.2 to 0.5 and 0.8 for fall and spring applications.
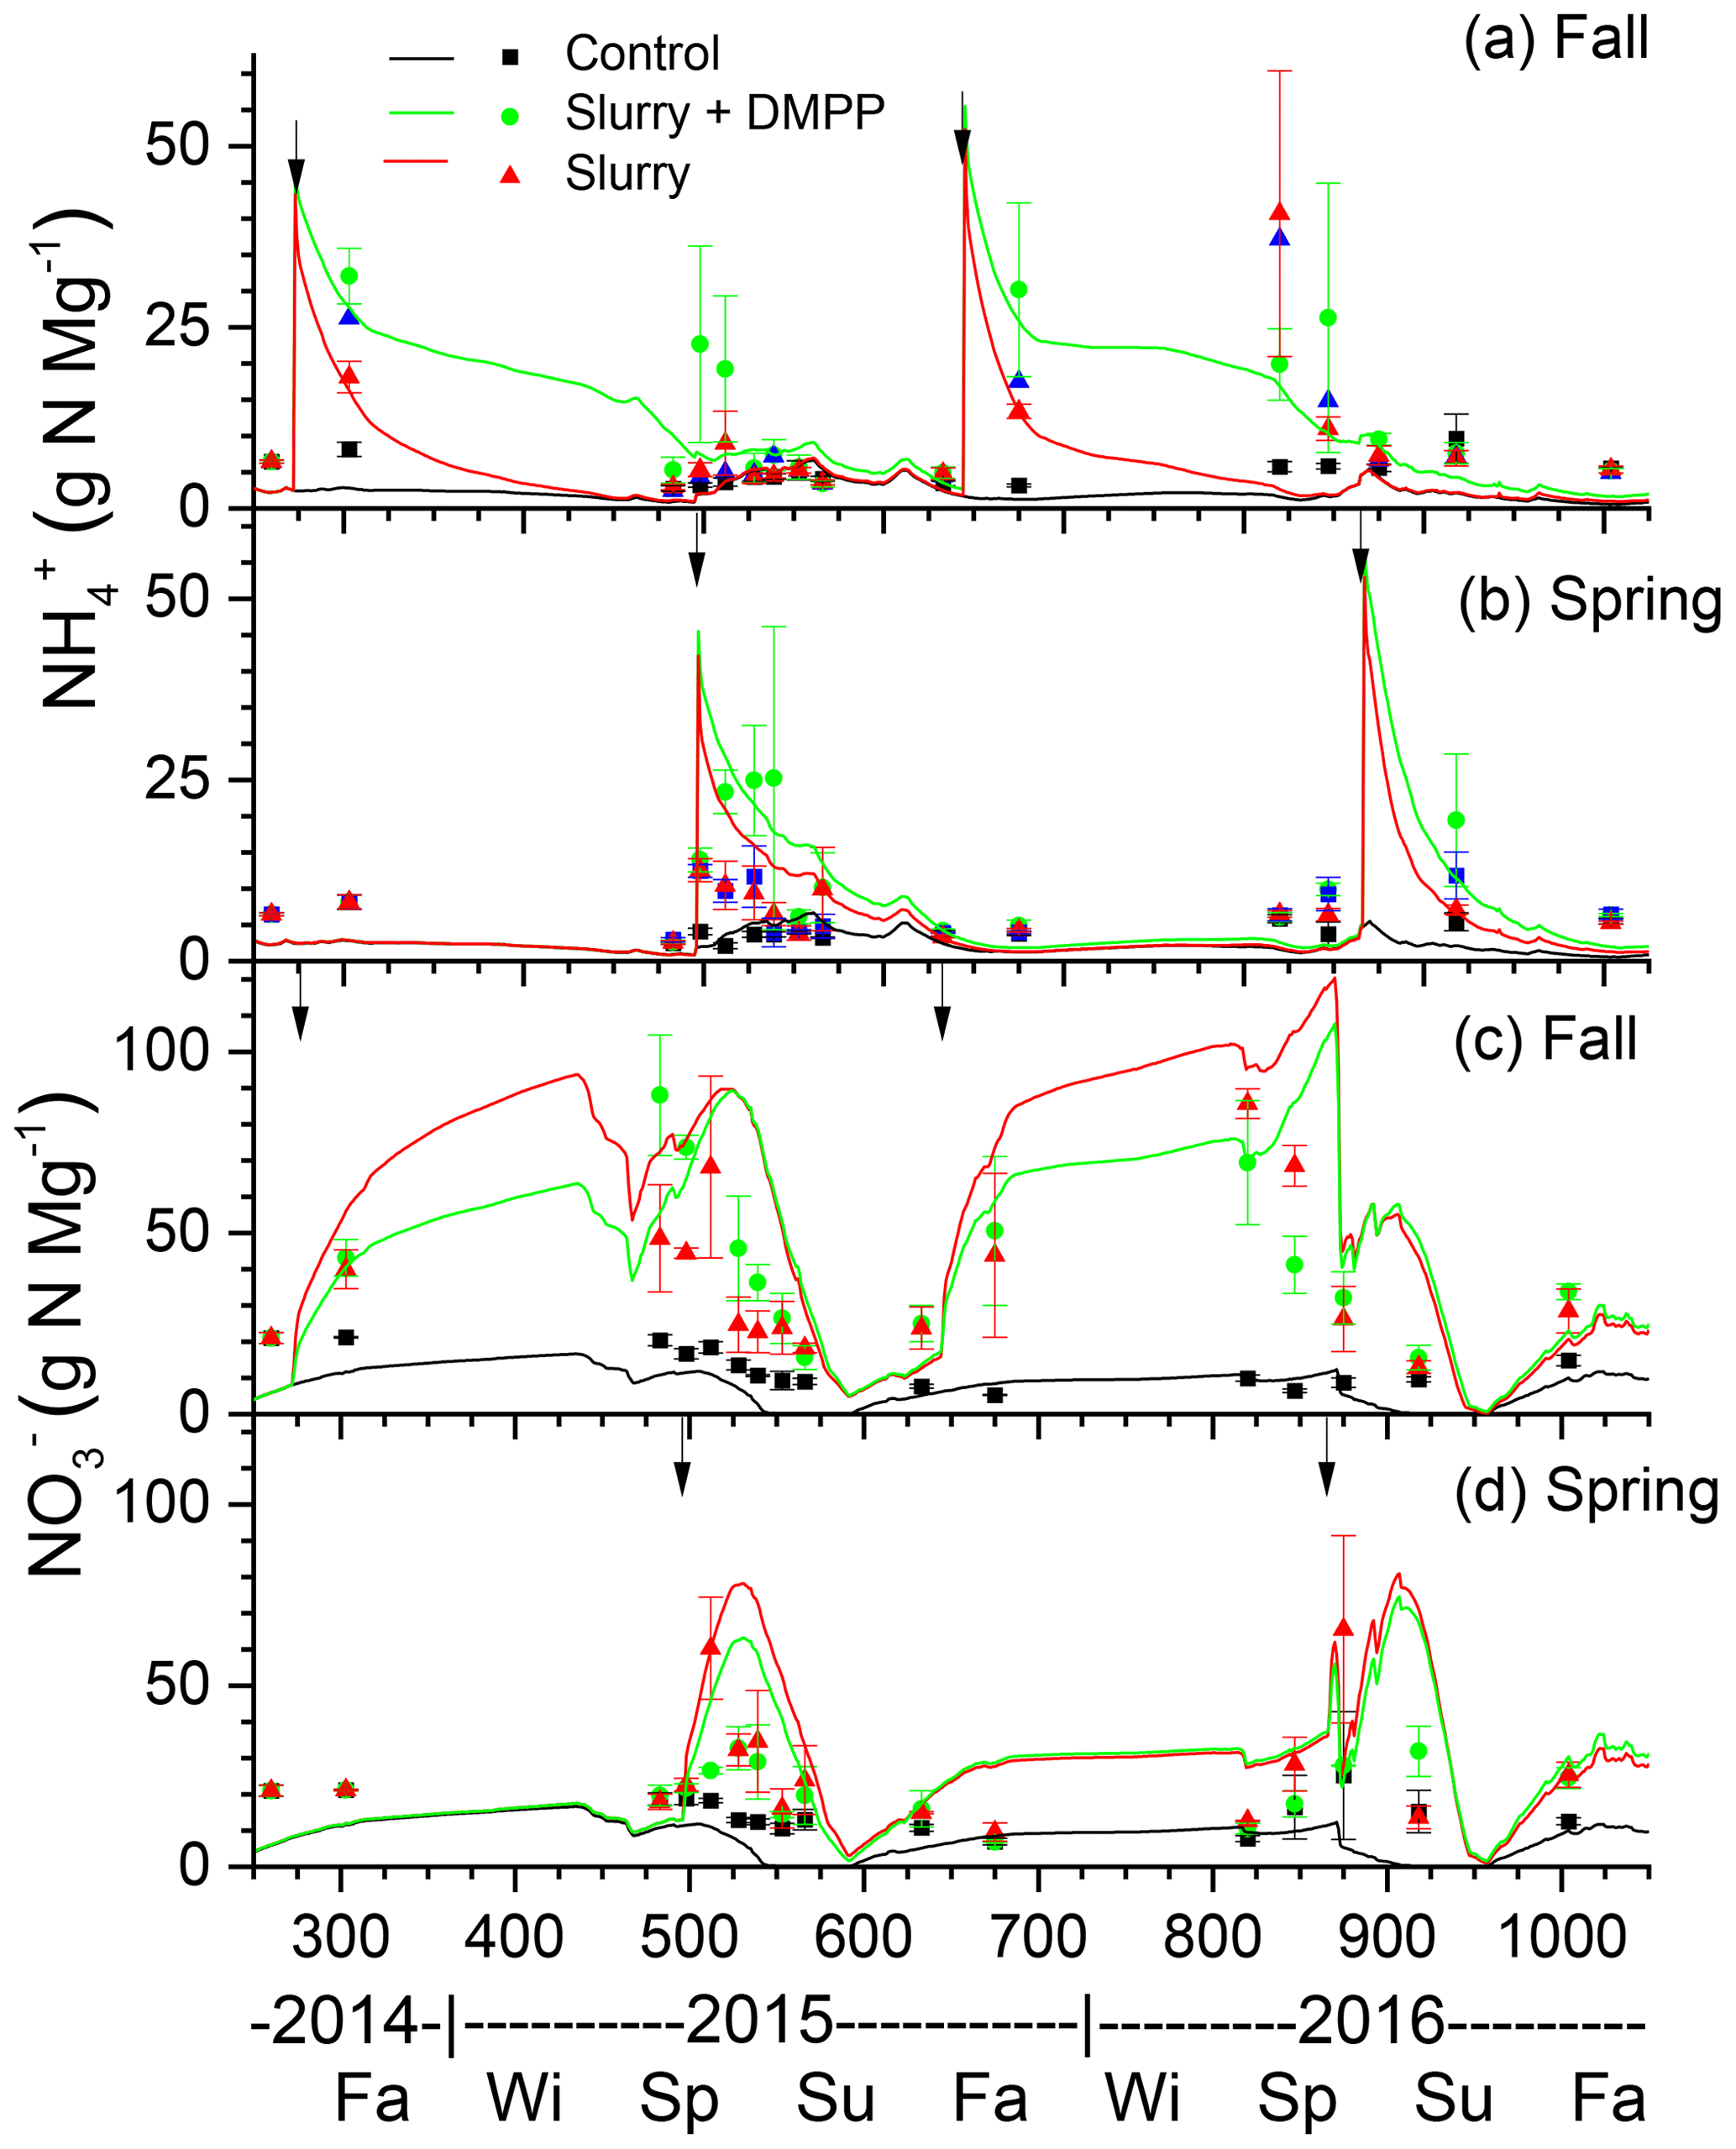
Figure 2Soil and concentrations measured (symbols) and modelled (lines) at 0–10 cm depth following applications of dairy slurry without and with DMPP. Arrows indicate dates of application. (Fa – fall; Wi – winter; Sp – spring; Su – summer.)
5.1 NI and soil and concentrations
5.1.1 Fall slurry applications
In the model, NI slowed oxidation (Sect. 2.9, Eq. 3) so that declines in concentrations modelled and measured after fall and spring slurry applications with NI were slower than those without NI (Fig. 2a), particularly during winter, when declines in inhibition were slowed by low Ts (Sect. 2.9, Eq. 1) following the onset of soil freezing modelled at the depth of slurry injection (DOY 313 in 2014 and DOY 318 in 2015 in Fig. 2a). Overwinter declines in concentrations were slower during the winter of 2015–2016, with lower Ts modelled under less winter precipitation and hence shallower snowpack (Table 4). These slower declines caused larger concentrations to be modelled during the following spring, consistent with measurements (Fig. 2a). The slower declines in concentrations modelled with NI caused slower rises in concentrations following fall slurry applications (Fig. 2c). However slower rises with NI were not always apparent in the measured concentrations.
5.1.2 Spring slurry applications
Declines in concentrations modelled after slurry applications with NI in spring 2015 and 2016 were also slower than after those without NI (Fig. 2b), consistent with higher concentrations measured after spring application with DMPP in both years (Fig. 2b). These slower declines caused slower rises in concentrations to be modelled following spring slurry applications with NI (Fig. 2d).
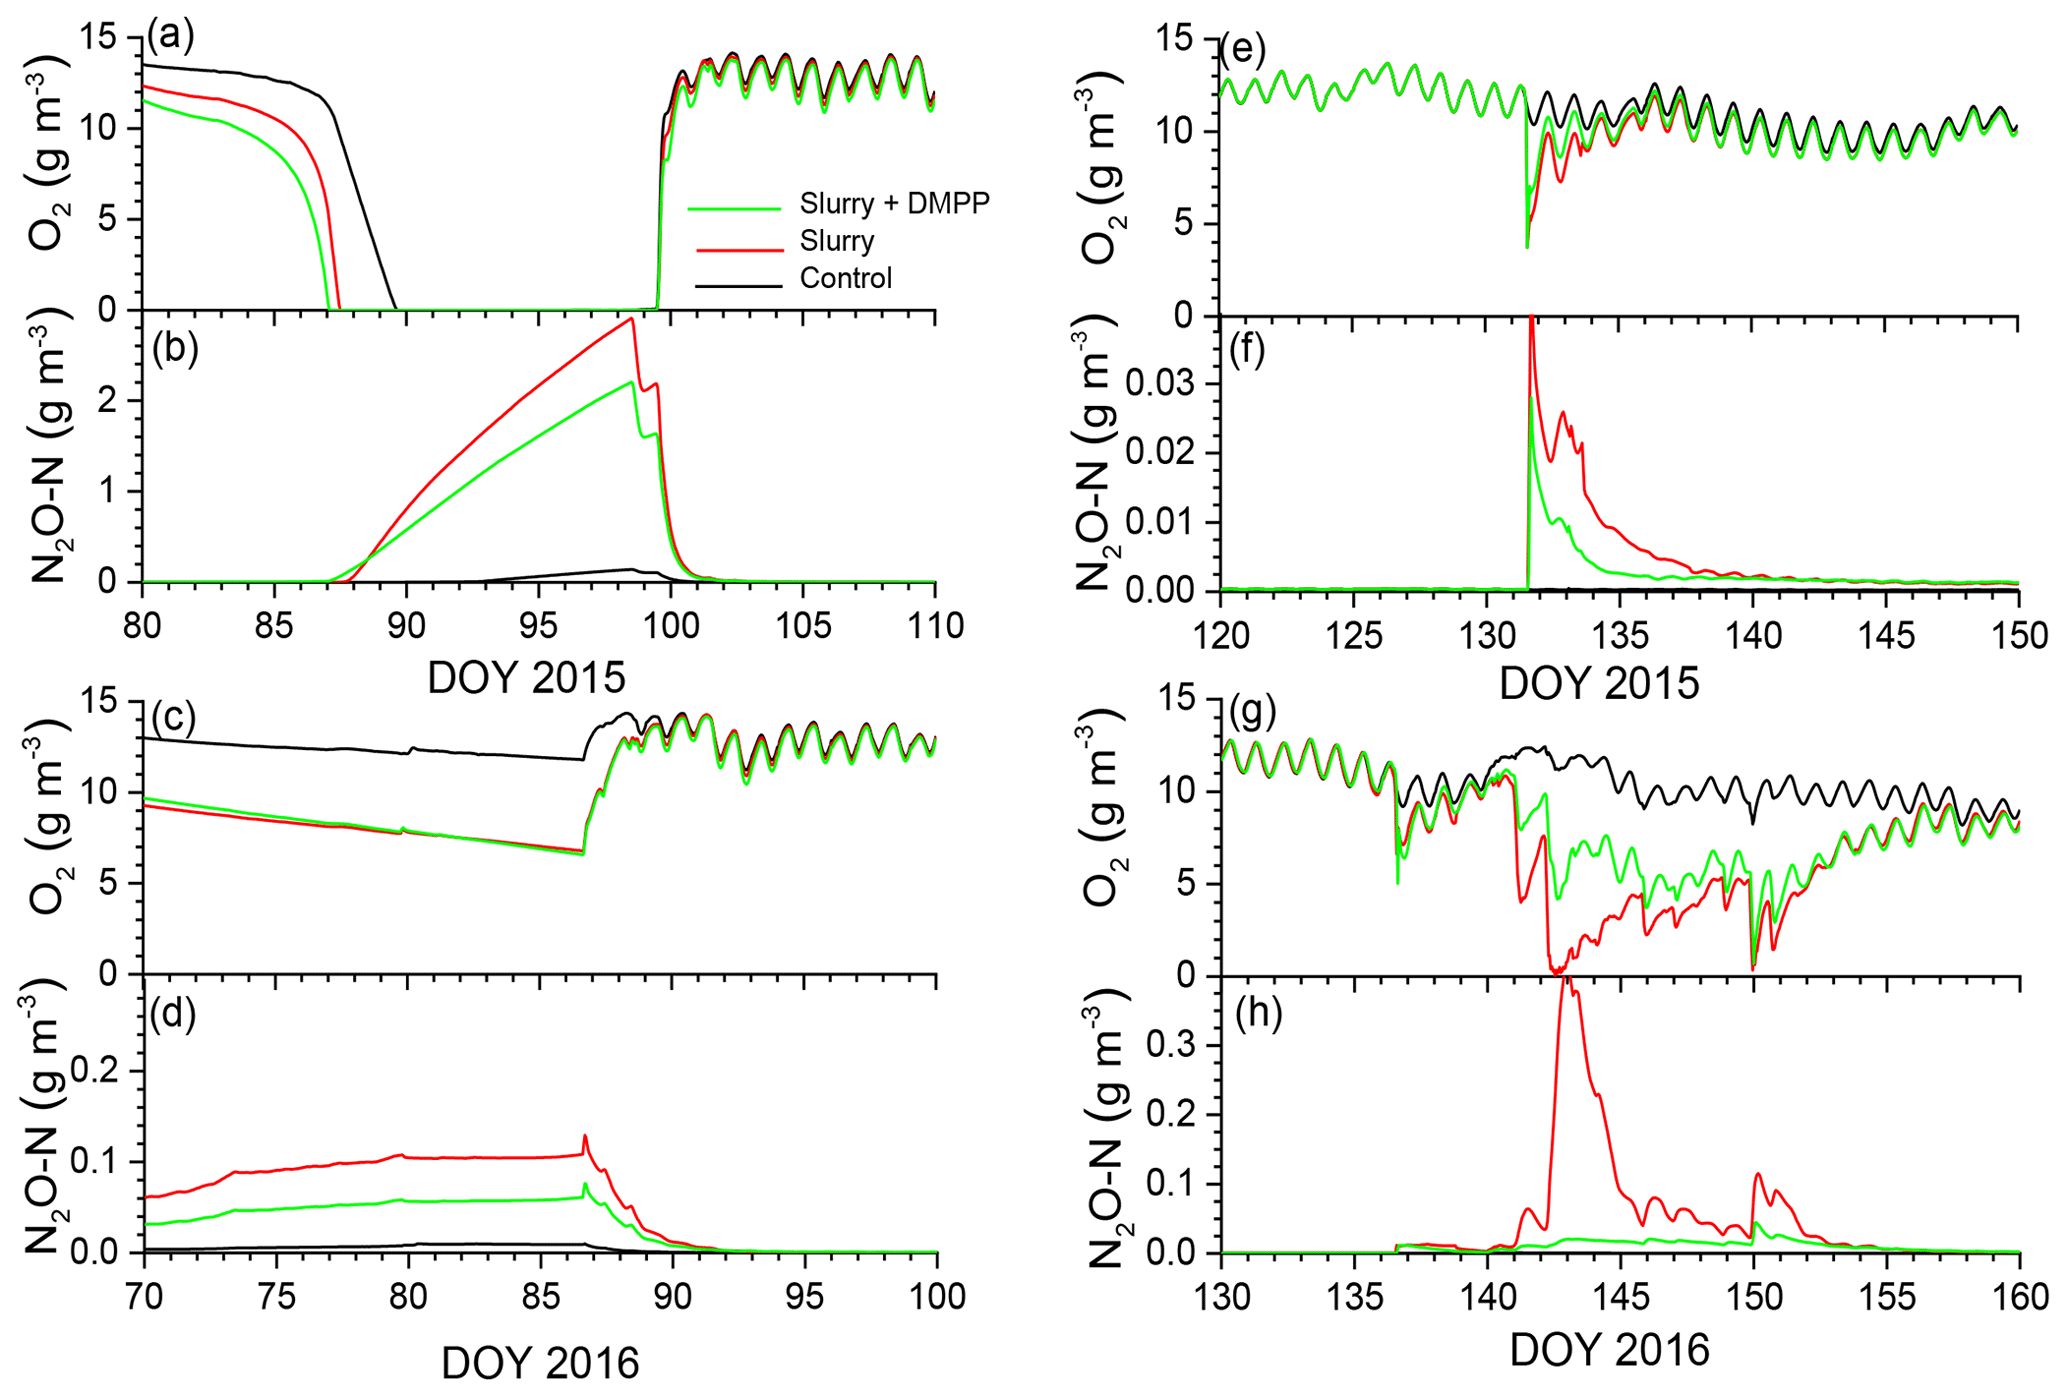
Figure 3Aqueous concentrations of O2 and N2O modelled at depth of slurry injection (14 cm) during emission events in early spring of (a, b) 2015 and (c, d) 2016 after fall slurry applications with or without DMPP on DOY 273 in 2014 and DOY 280 in 2015 and later in spring of (e, f) 2015 and (g, h) 2016 after spring slurry applications on DOY 132 in 2015 and DOY 137 in 2016.
5.2 NI and soil gas concentrations
5.2.1 Fall slurry applications
In the model, soil ice impeded drainage during spring snowmelt and soil thaw, raising θw and lowering θg, thereby slowing gas transfers in gaseous phases and gas exchanges between gaseous and aqueous phases (Sect. 2.3, step 3; Fig. 1). Freeze–thaw effects on N2O emissions modelled during early spring are further described in Grant and Pattey (1999). Slower O2 transfers relative to O2 uptake (Sect. 2.3, 2.5 and 2.6) forced reductions in aqueous O2 concentrations (O2s) to be modelled during early spring in 2015 (Fig. 3a, b) and 2016 (Fig. 3c, d) following fall slurry applications in 2014 and 2015. Declines in aqueous O2 (O2s) were later but more rapid in 2015 than in 2016, following greater winter precipitation and hence greater snowmelt in 2014–2015 (Table 4). Earlier and more persistent declines in O2s were modelled in 2016 because greater θi modelled with less thermal insulation under a shallower snowpack reduced or eliminated θg during much of the winter. Drainage of meltwater after snowmelt eventually lowered θw and raised θg, allowing O2s to return to atmospheric equivalent concentrations.
Declines in O2s in slurry-amended treatments drove increases in aqueous N2O concentrations (N2Os; Fig. 3b, d) during winter and early spring (Sect. 2.7, step 1). These rises were similar with and without NI in spite of higher concentrations without NI (Fig. 2a). Rises in θg following spring drainage allowed volatilization of N2O from aqueous to gaseous phases, reducing N2Os and driving N2O emissions modelled during spring thaw.
5.2.2 Spring slurry applications
Declines in O2s modelled after spring slurry application were small during the drier spring of 2015 (Table 4; Fig. 3e) but were greater with lower θg during the wetter spring of 2016 (Fig. 3g). During both years, these declines were more rapid with slurry than without but less rapid with NI-amended slurry than with unamended slurry. Greater declines in O2s modelled in 2016 vs. 2015 drove greater increases in N2Os (Sect. 2.7), particularly without NI, and hence greater emissions of N2O during subsequent declines in N2Os.
5.3 NI and N2O fluxes
5.3.1 Fall slurry applications
Smaller rises and subsequent declines in N2Os modelled with NI than without (Fig. 3b) drove smaller N2O emission events modelled during spring thaw in 2015 (Fig. 4a) following slurry application in fall 2014 (Fig. 4b). These events were driven by increases in θg during mid-afternoon thawing of near-surface soil but were terminated by loss of θg during nighttime refreezing. These events preceded the start of the automated chamber measurements on DOY 102 and so could not be corroborated by them. However measurements with manual chambers earlier in spring 2015 by Lin et al. (2018) indicated that N2O emission events occurred from DOY 85 to 100 that were similar in magnitude although not always in timing with those modelled (Fig. 4b). These measured emissions were smaller with NI than without, consistent with modelled emissions.
The smaller rises and subsequent declines in N2Os modelled with NI than without in the winter of 2016 (Fig. 3d) drove smaller emission events during thawing and refreezing of near-surface soil in spring 2016 (Fig. 5a) following slurry application in fall 2015 (Fig. 5b). These modelled events preceded the start of automated chamber measurements on DOY 91, but earlier measurements with manual chambers indicated that N2O emission events occurred from DOY 74 to 93. The smaller emission events modelled with NI were consistent with those measured using the manual chambers, although some larger emissions measured with DMPP using the automated chambers from DOY 91 to 102 were not modelled (Fig. 5b). In both years, emissions modelled and measured without slurry remained very small, consistent with low N2Os (Fig. 3b, f).
5.3.2 Spring slurry applications
Modelled N2O emissions closely followed measured values during a brief emission event following slurry application in the drier spring of 2015 (Fig. 6a, b), driven by small rises and declines in N2Os (Fig. 3f). The smaller rise and decline in N2Os modelled with NI than without drove smaller N2O emissions which declined more rapidly after application than emissions measured with DMPP (Fig. 6b).
Emissions modelled without NI in the wetter spring of 2016 were larger than those in the drier spring of 2015 (Fig. 7a, b), driven by a larger rise and decline in N2Os with lower θg (Fig. 3h). These emissions were suppressed by low θg with soil wetting during heavy rainfall on DOY 141–143 shortly after slurry application (Fig. 7a,b) but resumed when θg rose with soil drainage thereafter (Fig. 7b). Emissions modelled without NI remained greater than those measured until DOY 150, after which modelled values declined with soil drying while the measured value rose (Fig. 7b). Greater reductions in N2Os (Fig. 3h) and hence in N2O emissions were modelled with NI after slurry application in the wetter spring of 2016 (Fig. 7b) than in the drier spring of 2015 (Fig. 6b). In both years, emissions modelled and measured without slurry remained very small, consistent with low N2Os (Fig. 3f, h).
5.4 NI effects on seasonal and annual N2O emissions
5.4.1 Modelled vs. measured N2O emissions after spring slurry applications
Total N2O emissions modelled without NI and with NI using RI for DMPP or nitrapyrin (Sect. 2.9) were compared with those aggregated from automated chamber measurements over 30 d periods after spring slurry applications in 2015 and 2016 (Table 5). Total emissions modelled and measured without NI were greater during the wetter spring of 2016 than during the drier spring of 2015. Reductions in 30 d emissions modelled and measured with RI for DMPP and nitrapyrin were greater during the wetter spring in 2016 (53 % and 41 %) than during the drier spring in 2015 (35 % and 30 %). These reductions were somewhat smaller than those measured with DMPP and nitrapyrin in 2016 (72 % and 64 %) and 2015 (45 % and 36 %). Emissions were not measured with automated chambers after fall slurry applications, preventing comparisons with modelled values.
Table 5Seasonal N2O emissions measured and modelled during late spring in 2015 and 2016 without slurry (C) or with slurry applied in spring (S) without NI, with nitrapyrin or with DMPP on dates in the field study (Table 3). Negative values denote emissions, and positive values denote uptake.

5.4.2 Seasonal and annual N2O emissions modelled after fall and spring slurry applications
Fall slurry applications
NI greatly reduced N2O emissions modelled from fall applications during autumn (16 September–31 December in Table 6) in 2014 and 2015 and slightly reduced N2O emissions modelled during the following winter and early spring (1 January–30 April), but they slightly raised N2O emissions modelled during the following summer (1 May–15 September) in both 2015 and 2016. Annual emissions modelled with NI were reduced from those without NI by 26 % and 38 % in 2014–2015 and 2015–2016 respectively (Table 6). The reduction modelled in 2014–2015 was similar to that of 23 %, estimated for DMPP from manual chamber measurements from 1 October 2014 to 30 September 2015 by Lin et al. (2018), although the reduction with NI modelled in 2014–2016 was greater than that of 15 %, estimated from manual chamber measurements from 1 October 2015 to 30 September 2016.
Table 6Seasonal and annual N2O emissions modelled during autumn–winter, winter–spring and spring–summer in 2014–2015 and 2014–2016 without slurry (C) or with slurry applied in fall (F) or spring (S) without NI or with RI for DMPP on dates in the field study (Table 3), in fall on dates 2 weeks before (F−2) or after (F+2) those in the field study, and with soil mixing during slurry application (M) increased to 0.5 and 0.8 from 0.2 in the field study. Negative values denote emissions.
Spring slurry applications
Reductions in annual N2O emissions modelled from spring slurry applications with DMPP and nitrapyrin occurred almost entirely during late spring and summer (1 May–15 September in Table 6). These reductions were 22 % and 40 % from those modelled without NI in 2014–2015 and 2014–2016 respectively (Table 6). The reduction modelled with NI in 2014–2015 was greater than that of 0 % for DMPP estimated from manual chamber measurements from 1 October 2014 to 30 September 2015 by Lin et al. (2018), although the reduction modelled in 2014–2016 was similar to that of 38 %, estimated from manual chamber measurements from 1 October 2015 to 30 September 2016.
5.5 Effects of management on seasonal and annual N2O emissions modelled after fall and spring slurry applications
Advancing fall slurry application by 2 weeks increased N2O emissions modelled with and without NI during autumn but reduced those during subsequent spring thaw (F−2 in Table 6) so that annual emissions modelled with and without NI were similar to those in F with the application dates in the experiment (Table 3). Delaying fall slurry application by 2 weeks reduced N2O emissions modelled with and without NI only slightly during autumn but greatly increased emissions modelled during subsequent spring thaw (F+2 in Table 6), particularly with the later fall application in 2016 (Table 3). Consequently delaying fall slurry application by 2 weeks caused substantial increases in annual N2O emissions. However reductions in N2O emissions modelled with NI in F+2 in 2015 and 2016 (34 % and 47 %) were greater than those in F (26 % and 38 %) because inhibition declined more slowly in colder soil (Eq. 1), particularly with later application in 2016.
Increasing surface litter incorporation and soil mixing during fall slurry application raised N2O emissions modelled without NI only slightly during 2014–2015 but substantially during 2014–2016, particularly during spring thaw (F0.5 and F0.8 vs. F in Table 6). Increasing surface litter incorporation and soil mixing during spring slurry application had limited effects on emissions (S0.5 and S0.8 vs. S in Table 6). Greater mixing caused reductions in N2O emissions modelled with NI to be smaller relative to those without NI.
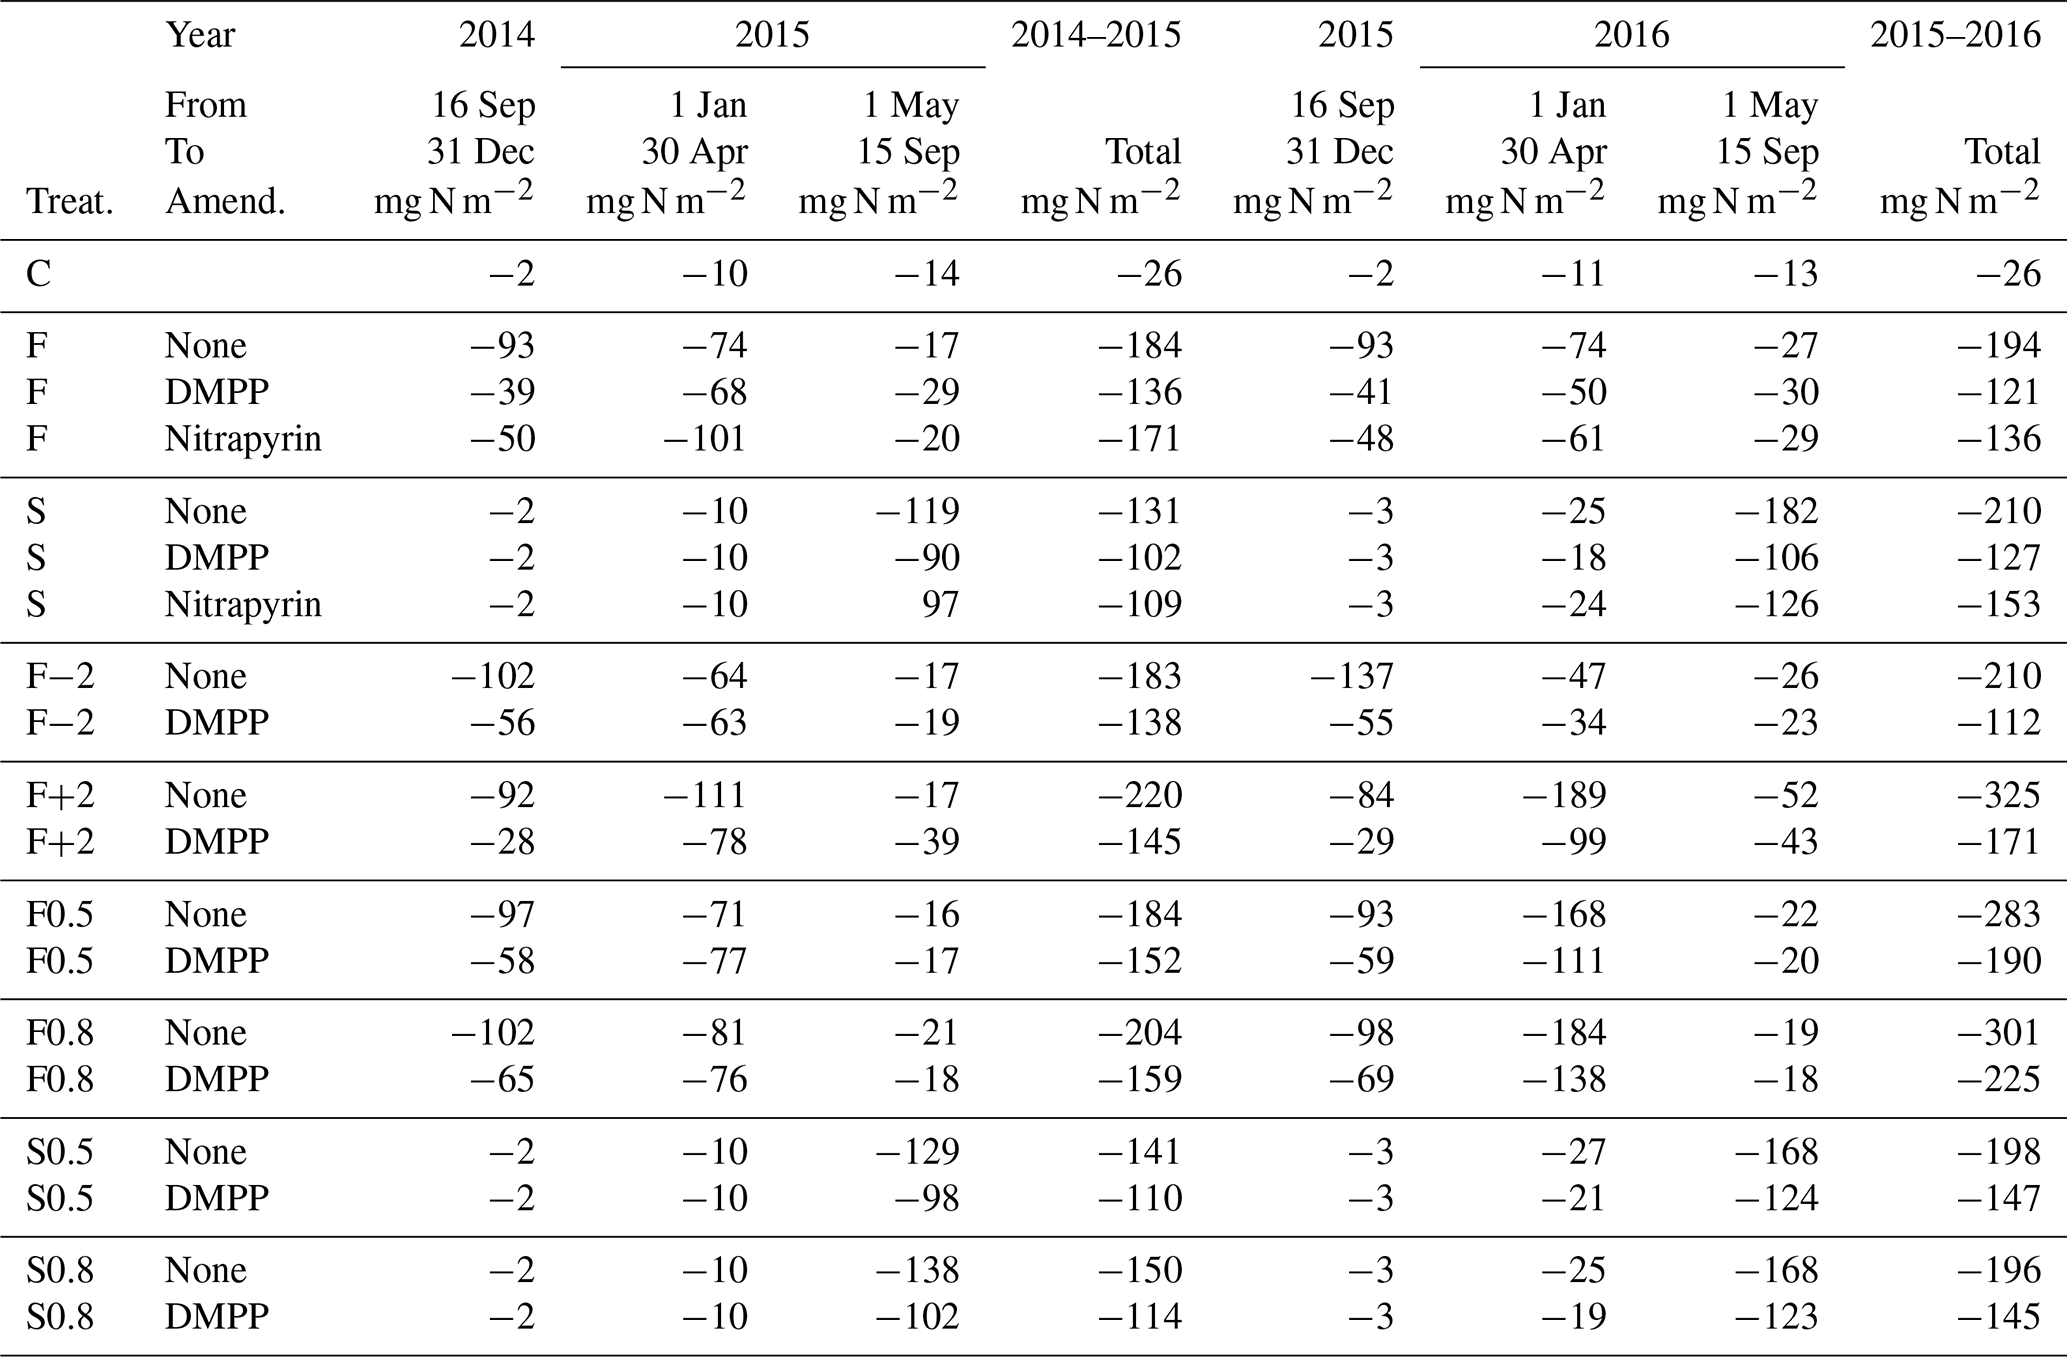
Table 7Annual discharge and NH3 emissions modelled from 16 September to 15 September in 2014–2015 and 2014–2016 without slurry (C) or with slurry applied in fall (F) or spring (S) without NI and with DMPP on dates in the field study (Table 3), in fall on dates 2 weeks before (F−2) or after (F+2) those in the field study, and with soil mixing during slurry application (M) increased to 0.5 and 0.8 from 0.2 in the field study. For NH3 positive values indicate deposition, and negative values indicate emission.
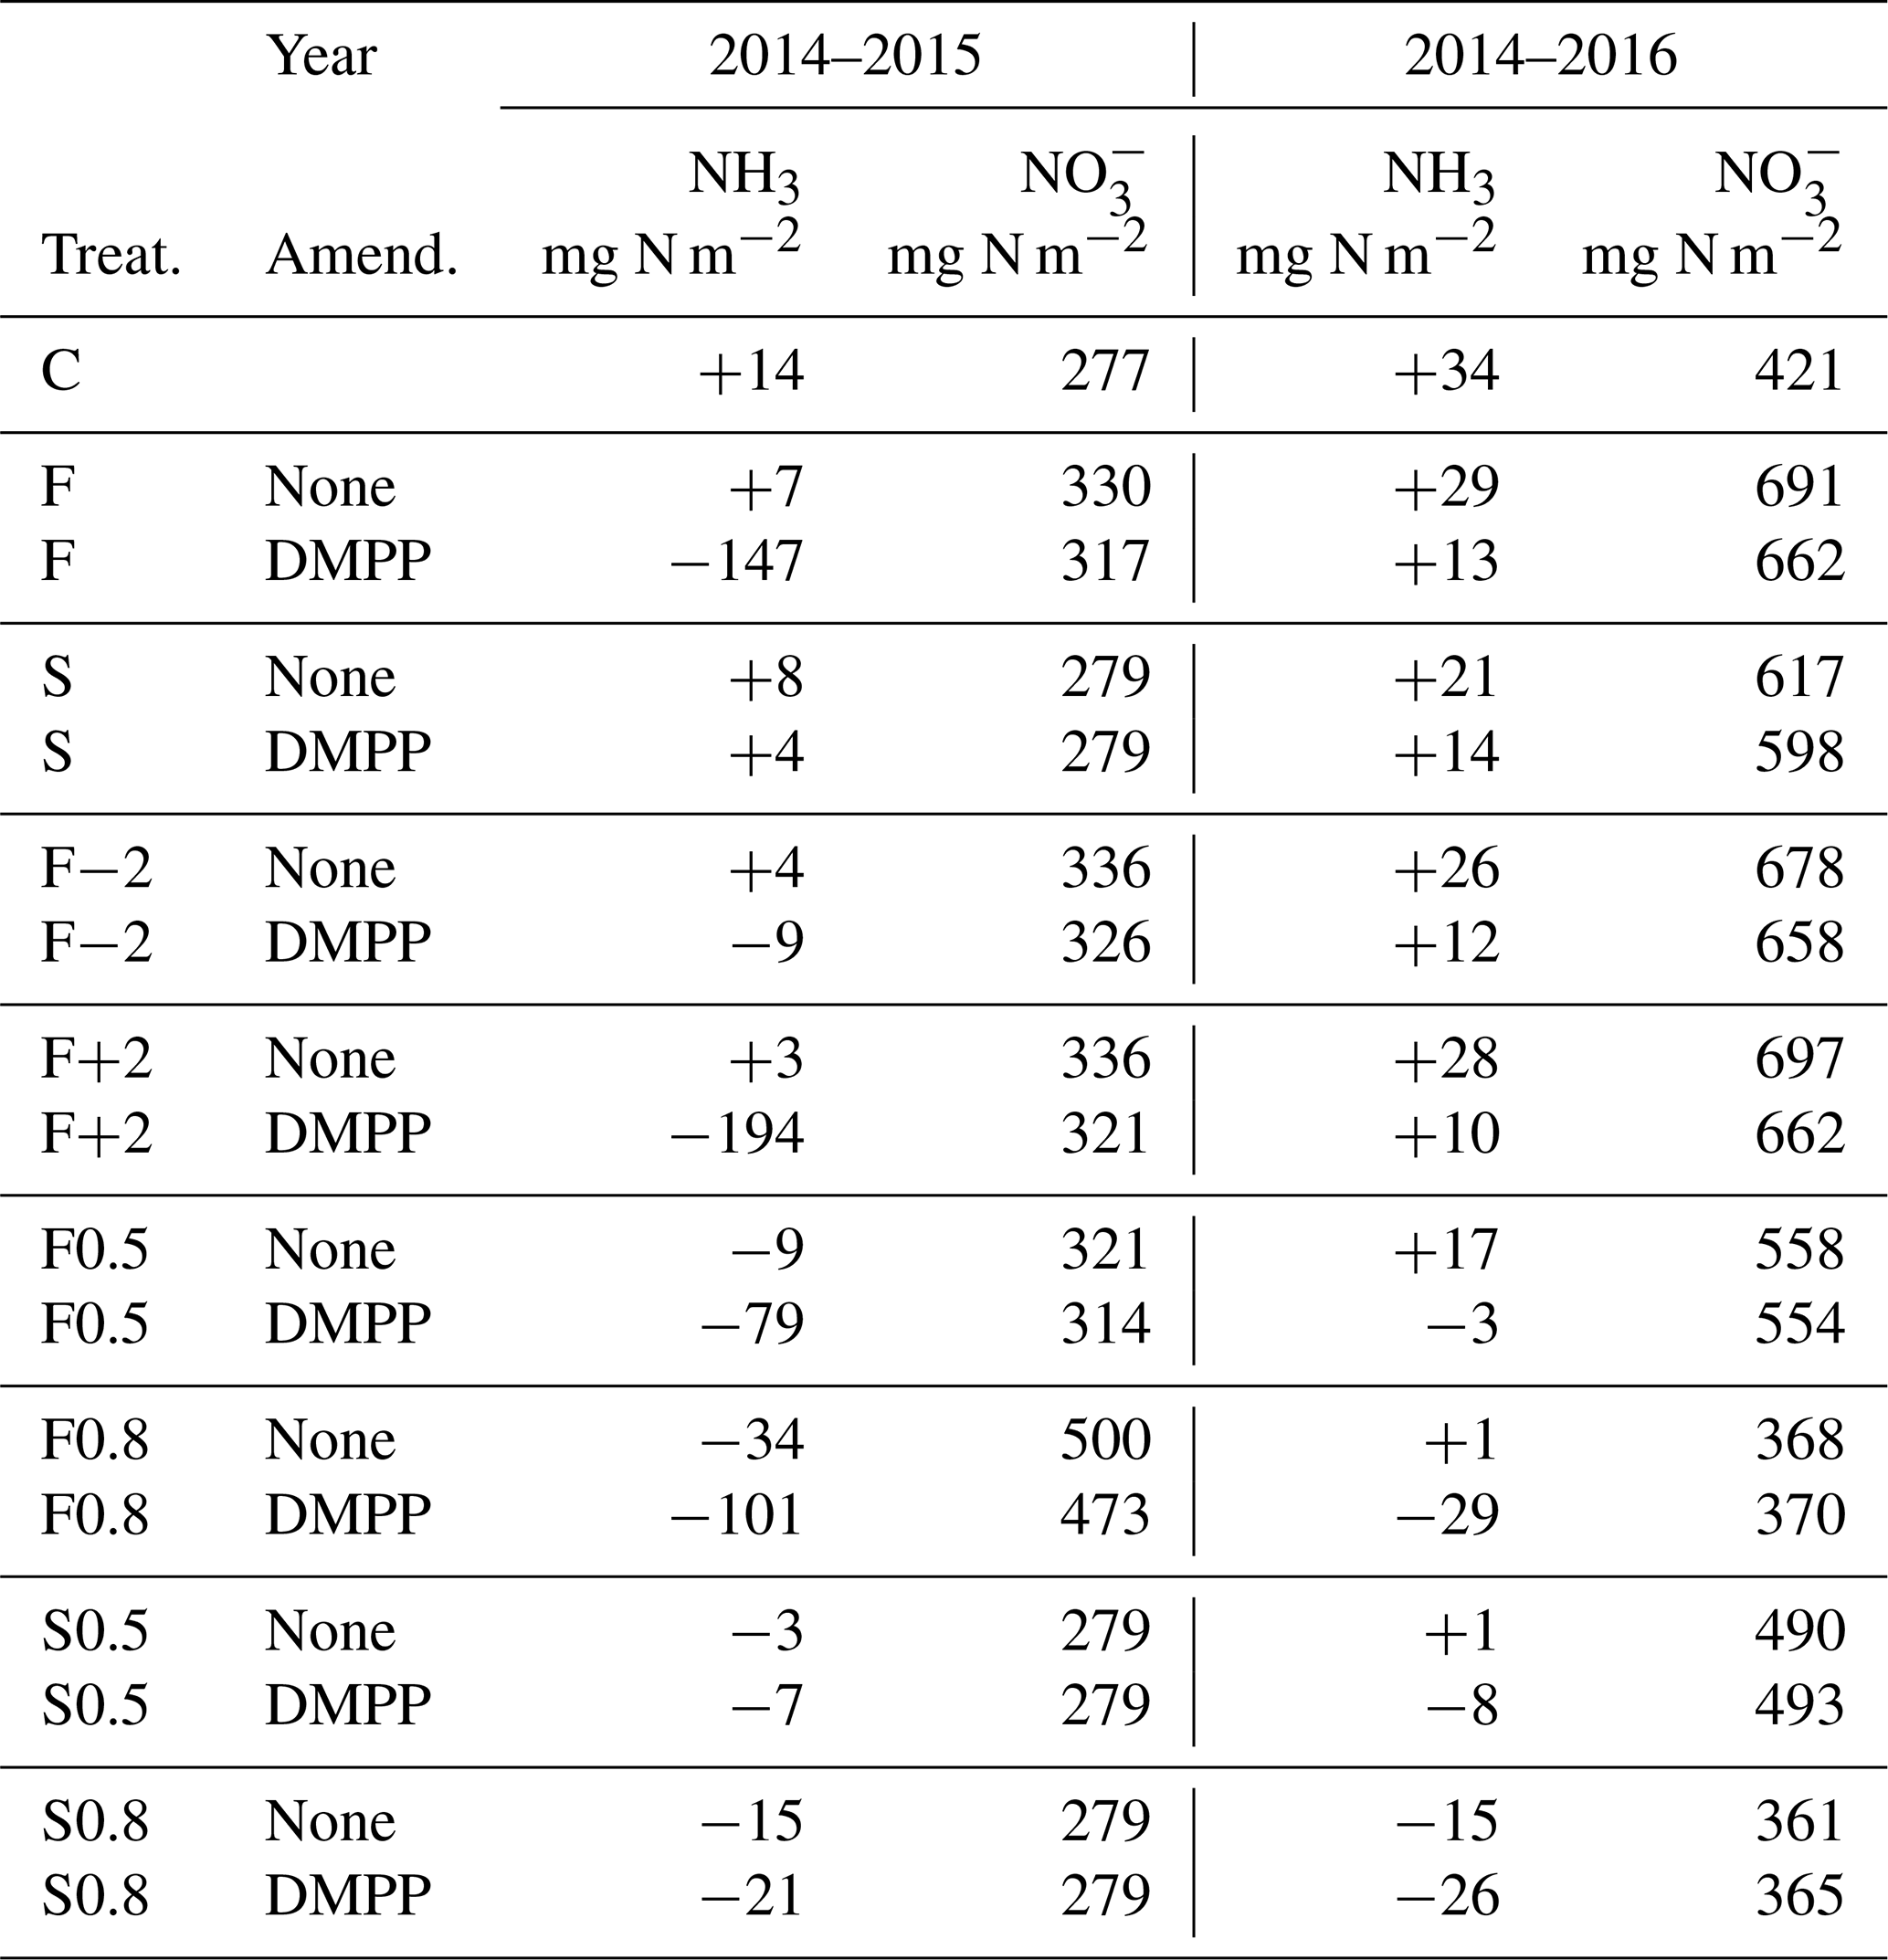
5.6 NI effects on annual mineral N losses and NH3 emissions
Injecting the slurry to 14 cm in the model suppressed NH3 emissions with limited soil mixing and caused only very small emissions with greater mixing (Table 7). Higher concentrations modelled with NI (Fig. 2a, b) increased net NH3 emissions, particularly if fall slurry application was delayed or soil mixing was increased in 2014–2015.
The subhumid climate at Edmonton (Table 4) caused modelled losses to remain small. For both fall and spring applications, lower concentrations modelled with NI (Fig. 2c, d) caused small reductions in losses.
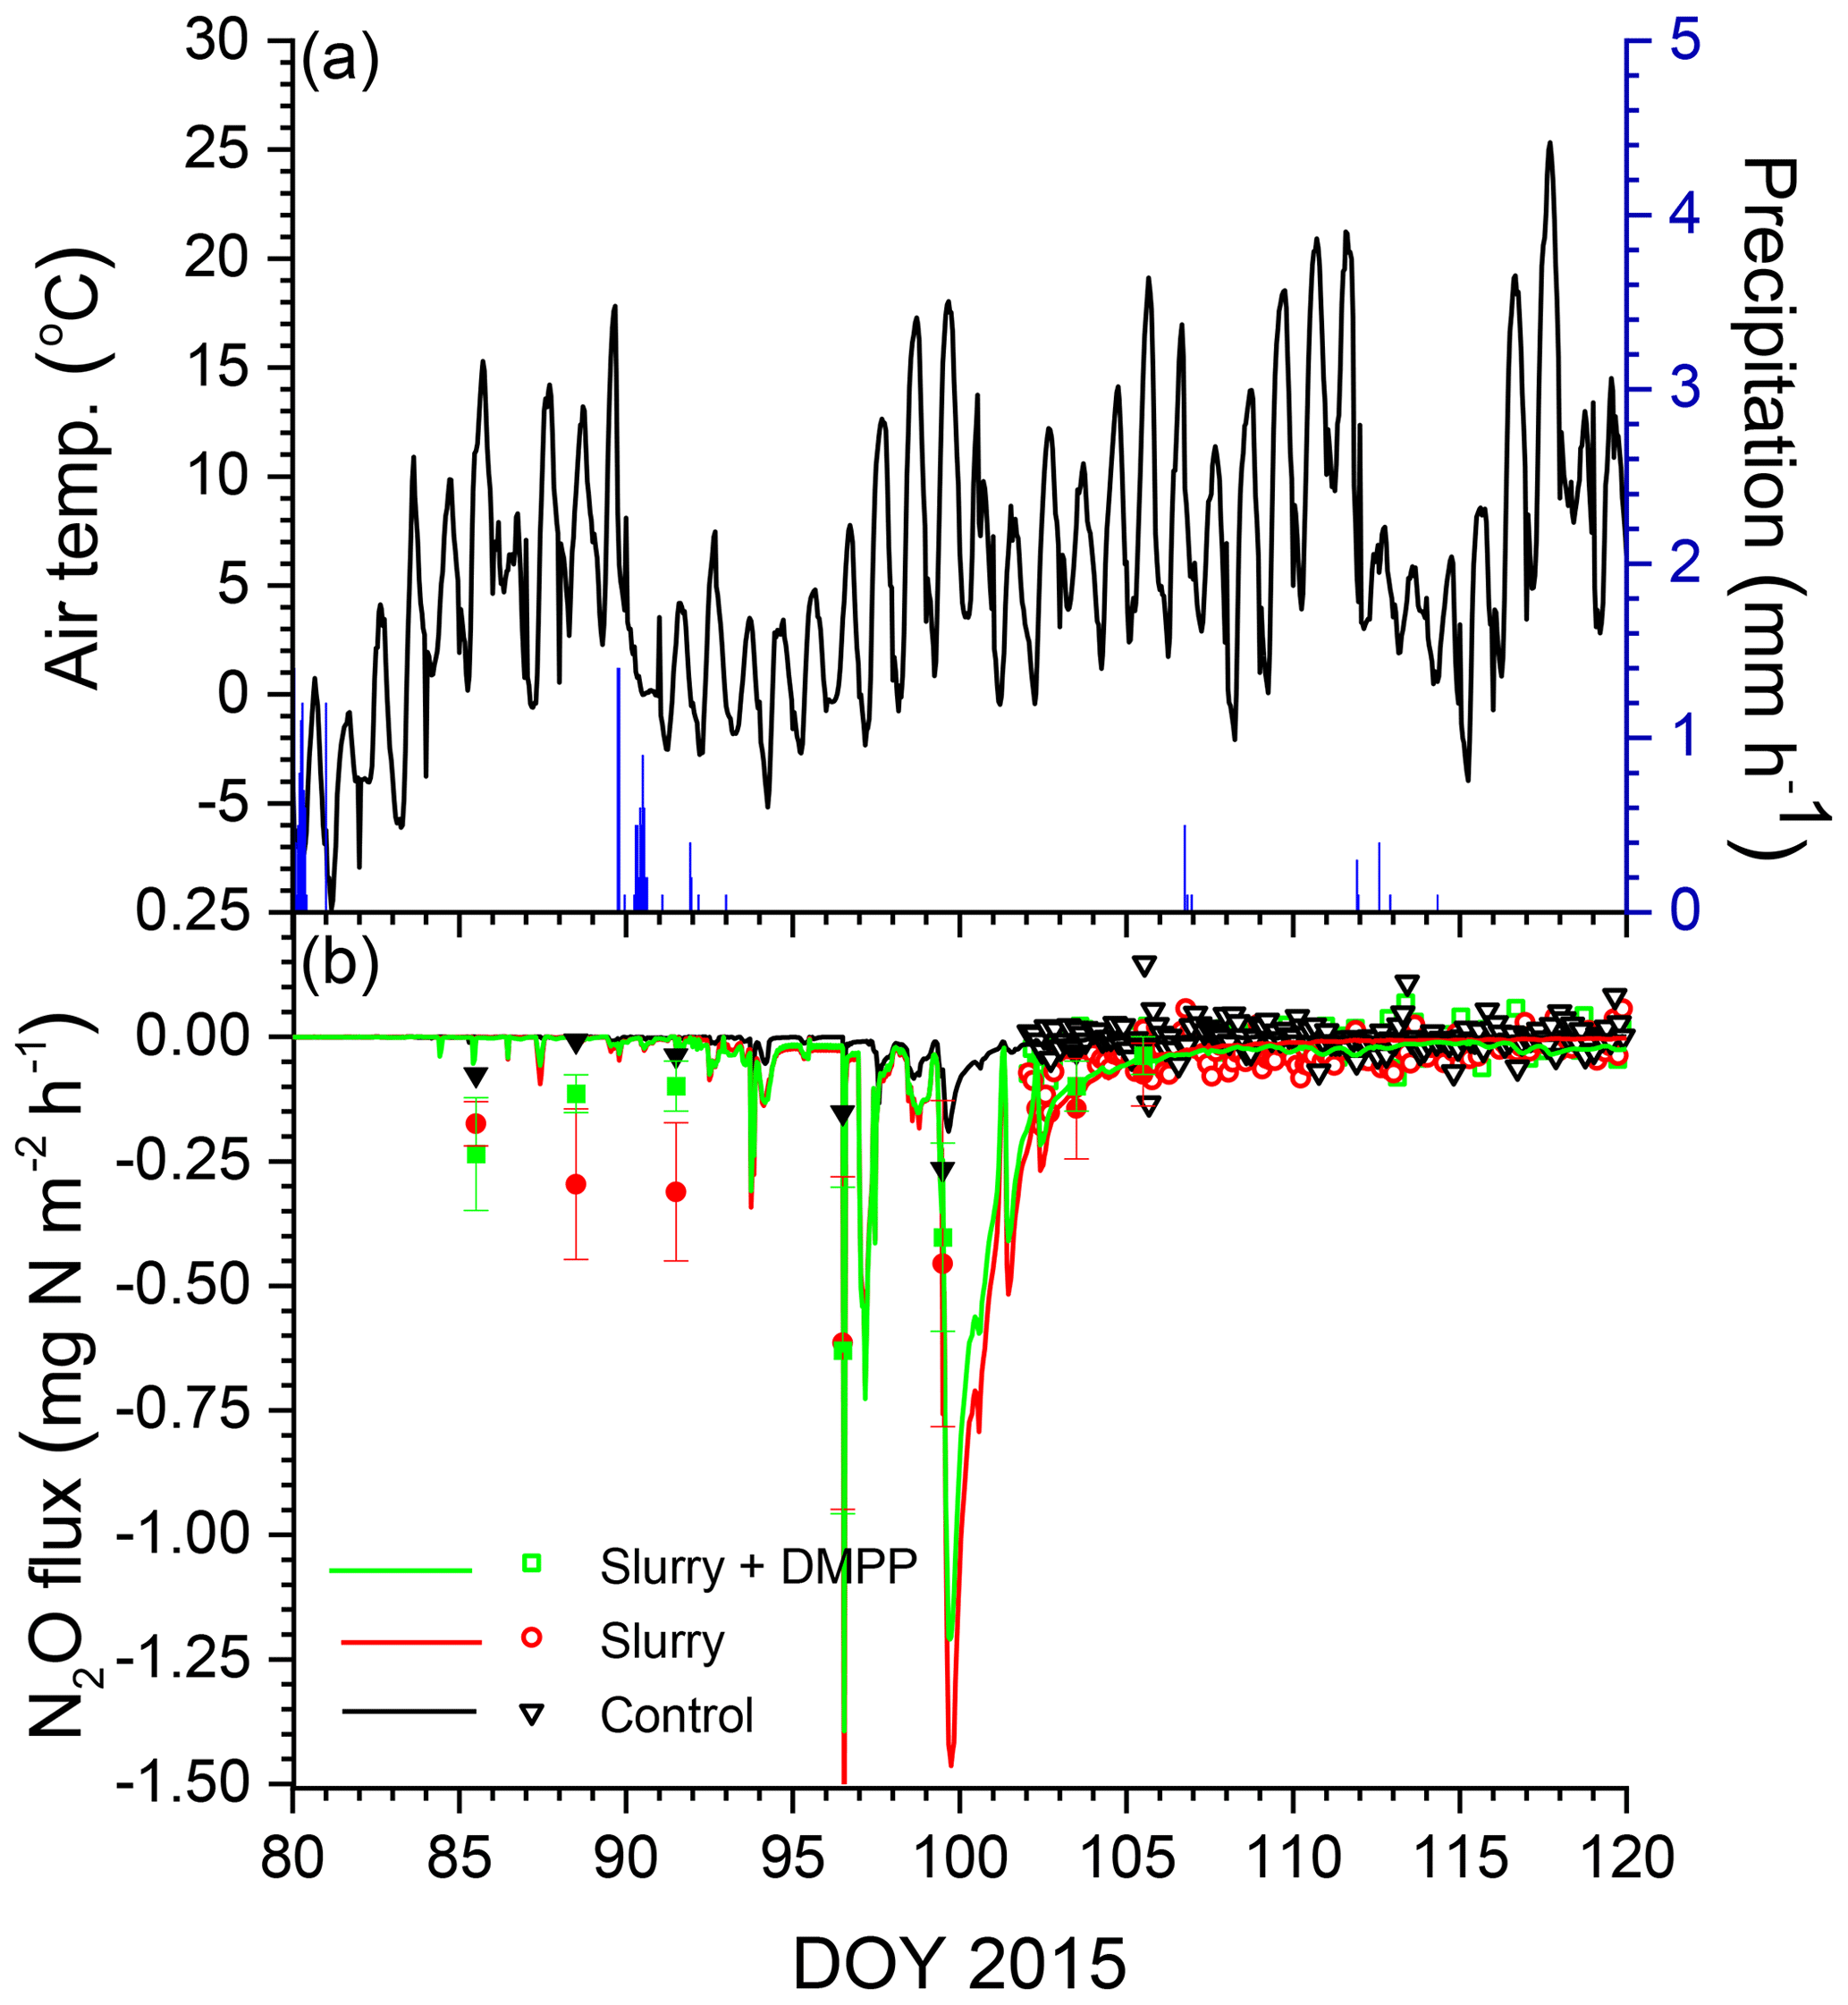
Figure 4(a) Air temperature and precipitation and (b) N2O fluxes measured (symbols) and modelled (lines) during early spring 2015 with no slurry (control) and following slurry application on DOY 273 in 2014 with or without DMPP. Filled symbols represent manual chamber measurements by Lin et al. (2018). Negative values denote emissions.
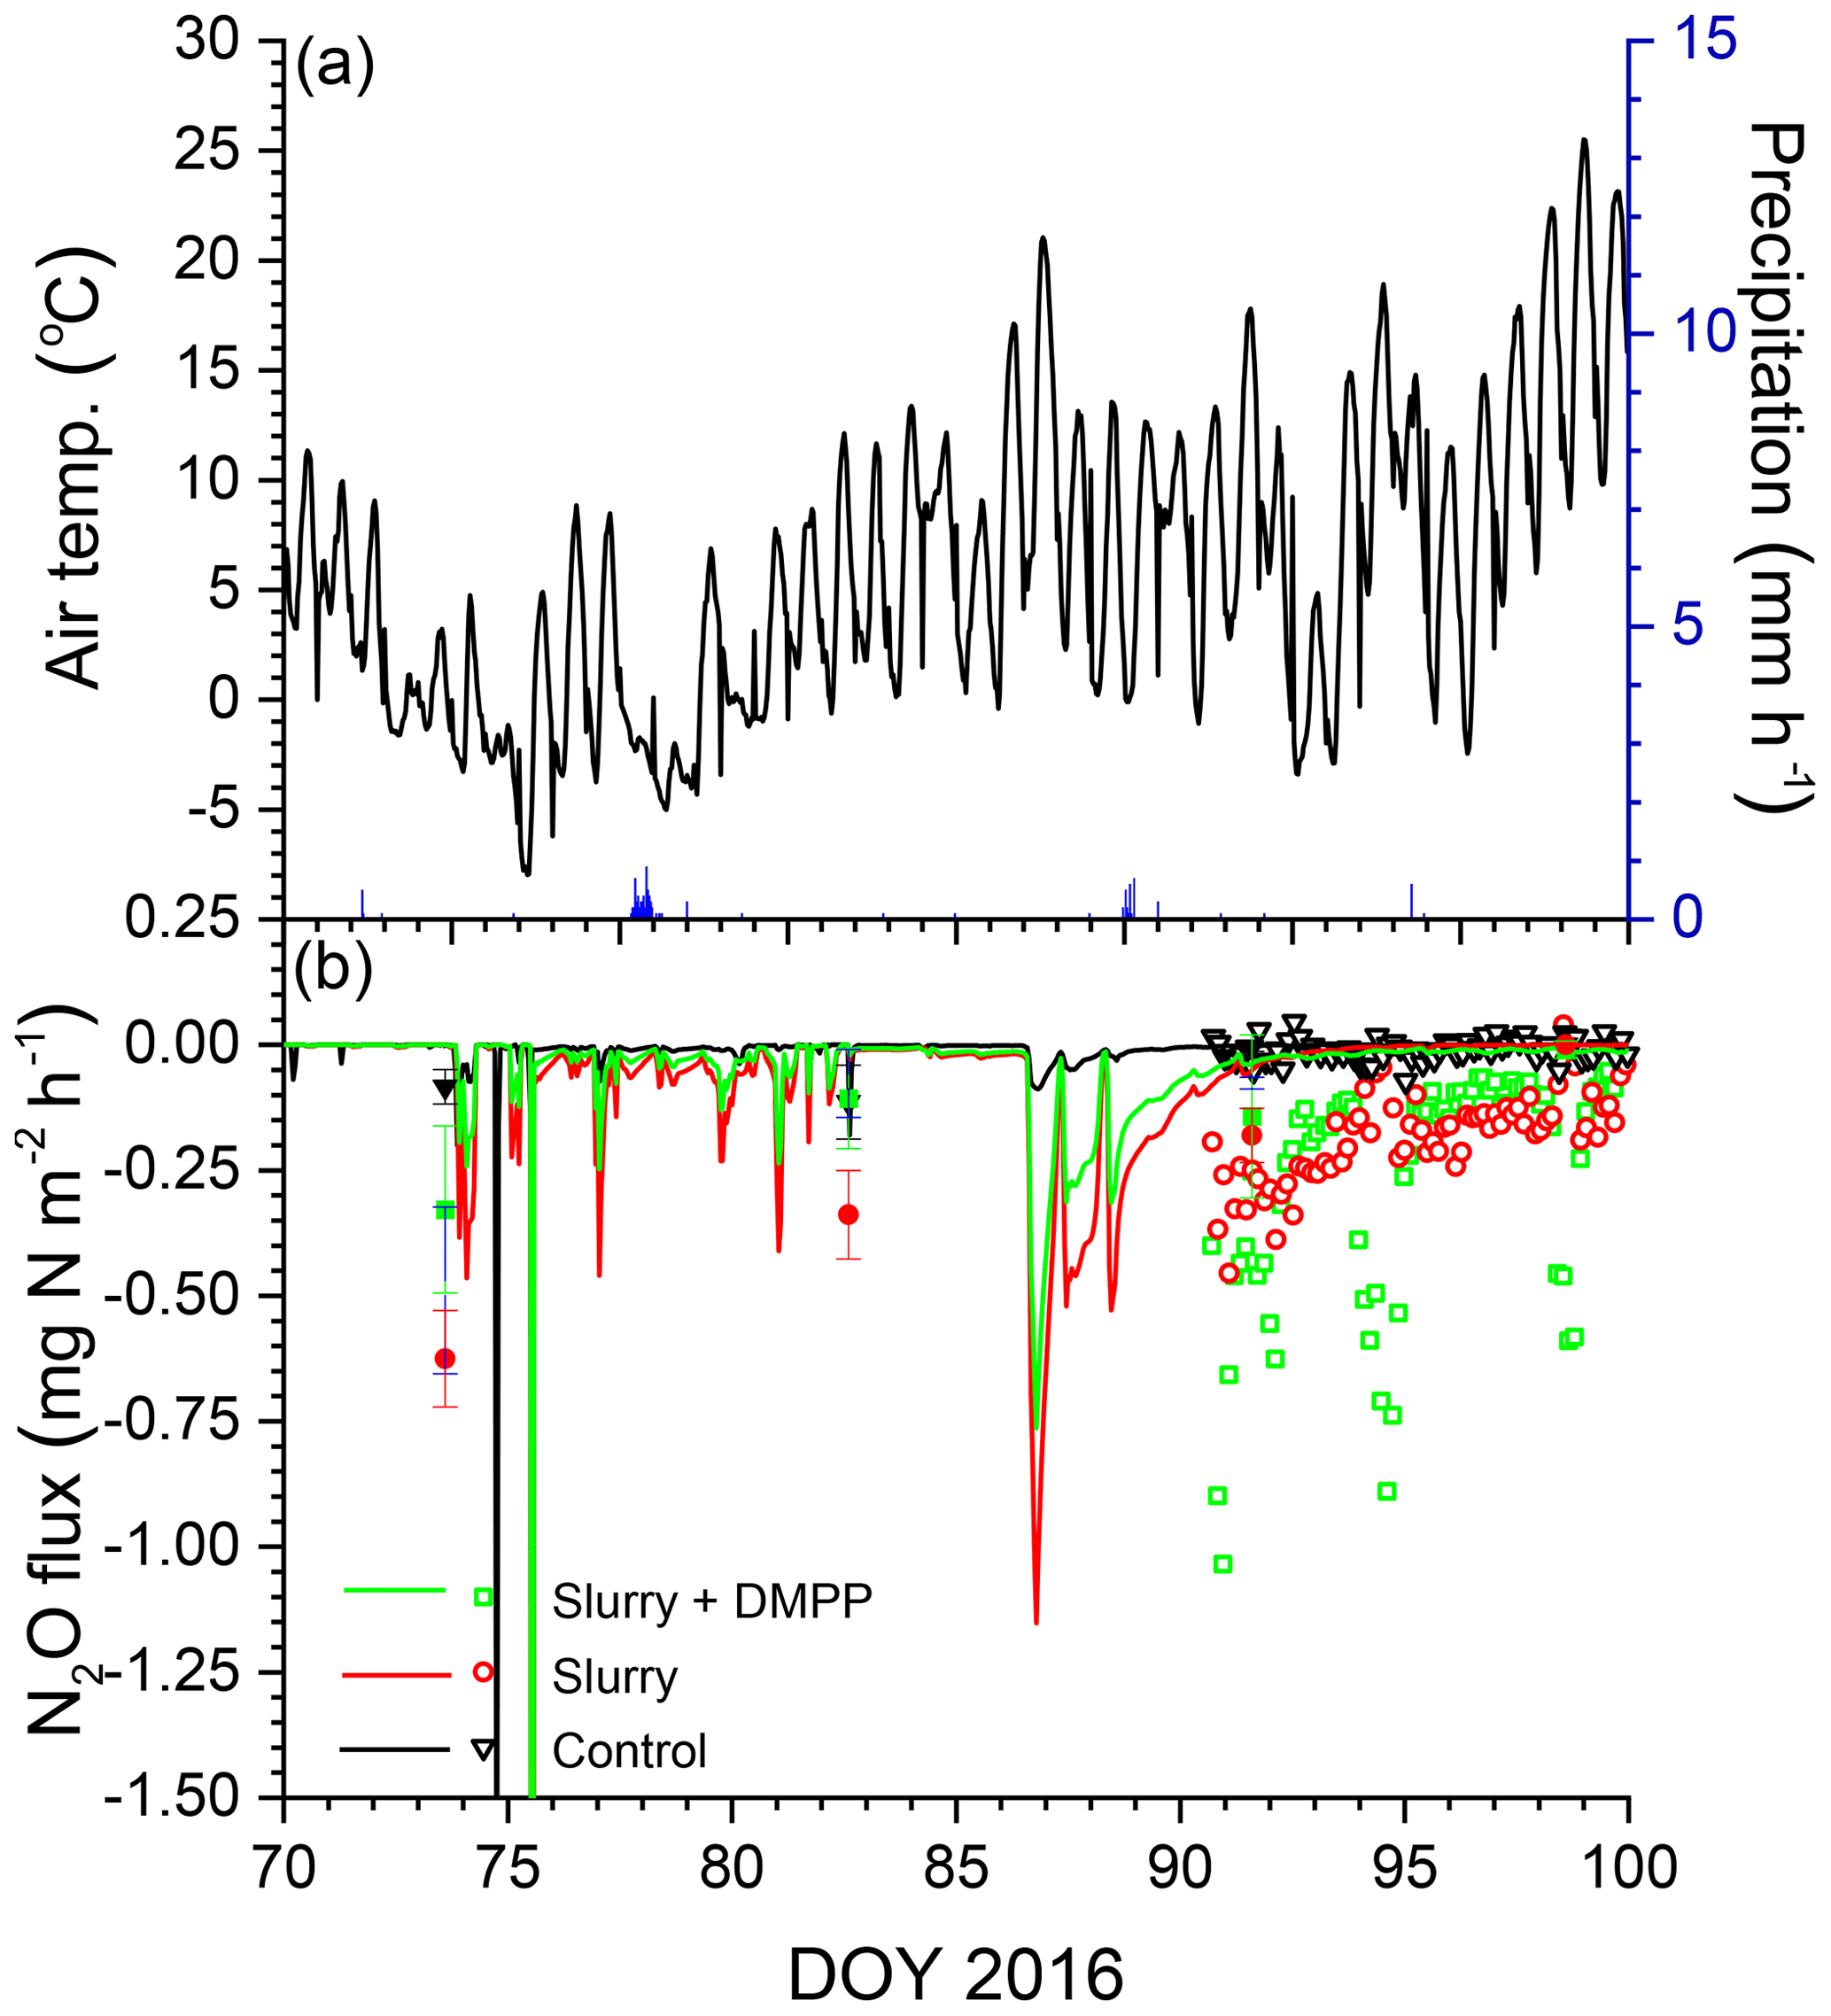
Figure 5(a) Air temperature and precipitation and (b) N2O fluxes measured (symbols) and modelled (lines) during early spring 2016 with no slurry (control) and following slurry application on DOY 280 in 2015 with or without DMPP. Filled symbols represent manual chamber measurements. Negative values denote emissions.
5.7 NI effects on barley silage yields
Silage yields modelled with fall slurry application were smaller than those measured in the drier year 2015, but those modelled with both applications were greater than those measured in the wetter year 2016, likely because of lodging observed in the field plots following the second year of heavy manure use (Table 8). Modelled yields were unaffected by NI for fall and spring applications in both years, although measured yields were raised by NI with spring application in 2015. Modelled yields were affected by the cutting height and harvest efficiency set in the model runs (Sect. 4.2).
6.1 Process modelling of N2O emissions
N2O emissions were driven by declines in gaseous O2 (O2g) and O2s modelled by equilibrating O2 active uptake by autotrophic and heterotrophic oxidation (Sect. 2.5, step 3, and Sect. 2.3, step 3) with O2 diffusion and dissolution through gaseous and aqueous phases, and dissolution from gaseous to aqueous phases, largely controlled by θg (Fig. 1). These O2 transfers were sustained by concentration gradients from O2g to O2s and from O2s to O2 at microbial surfaces (O2m) so that declines in O2s (Fig. 3) and O2m were relatively larger than those in O2g. These greater declines enabled N2O emissions to be modelled from O2 deficits, while O2g remained above one-half of atmospheric concentration, consistent with observations of O2g during N2O emissions from incubation and field experiments (Nguyen et al., 2017; Owens et al., 2017). These O2 deficits were modelled using a Km for O2m of 10 µM by nitrifiers (Sect. 2.5, step 3) and 2 µM by denitrifiers (Sect. 2.3, step 3) derived from biochemical studies by Focht and Verstraete (1977). These Km values are less than 5 % and 1 % of atmospheric equivalent concentration, indicating the importance of explicitly simulating gaseous and aqueous transport processes when modelling N2O emissions.
Table 8Barley silage yields modelled and measured without slurry (C) or with slurry applied in fall (F) or spring (S) with and without NI applied on dates in the field study (Table 3).
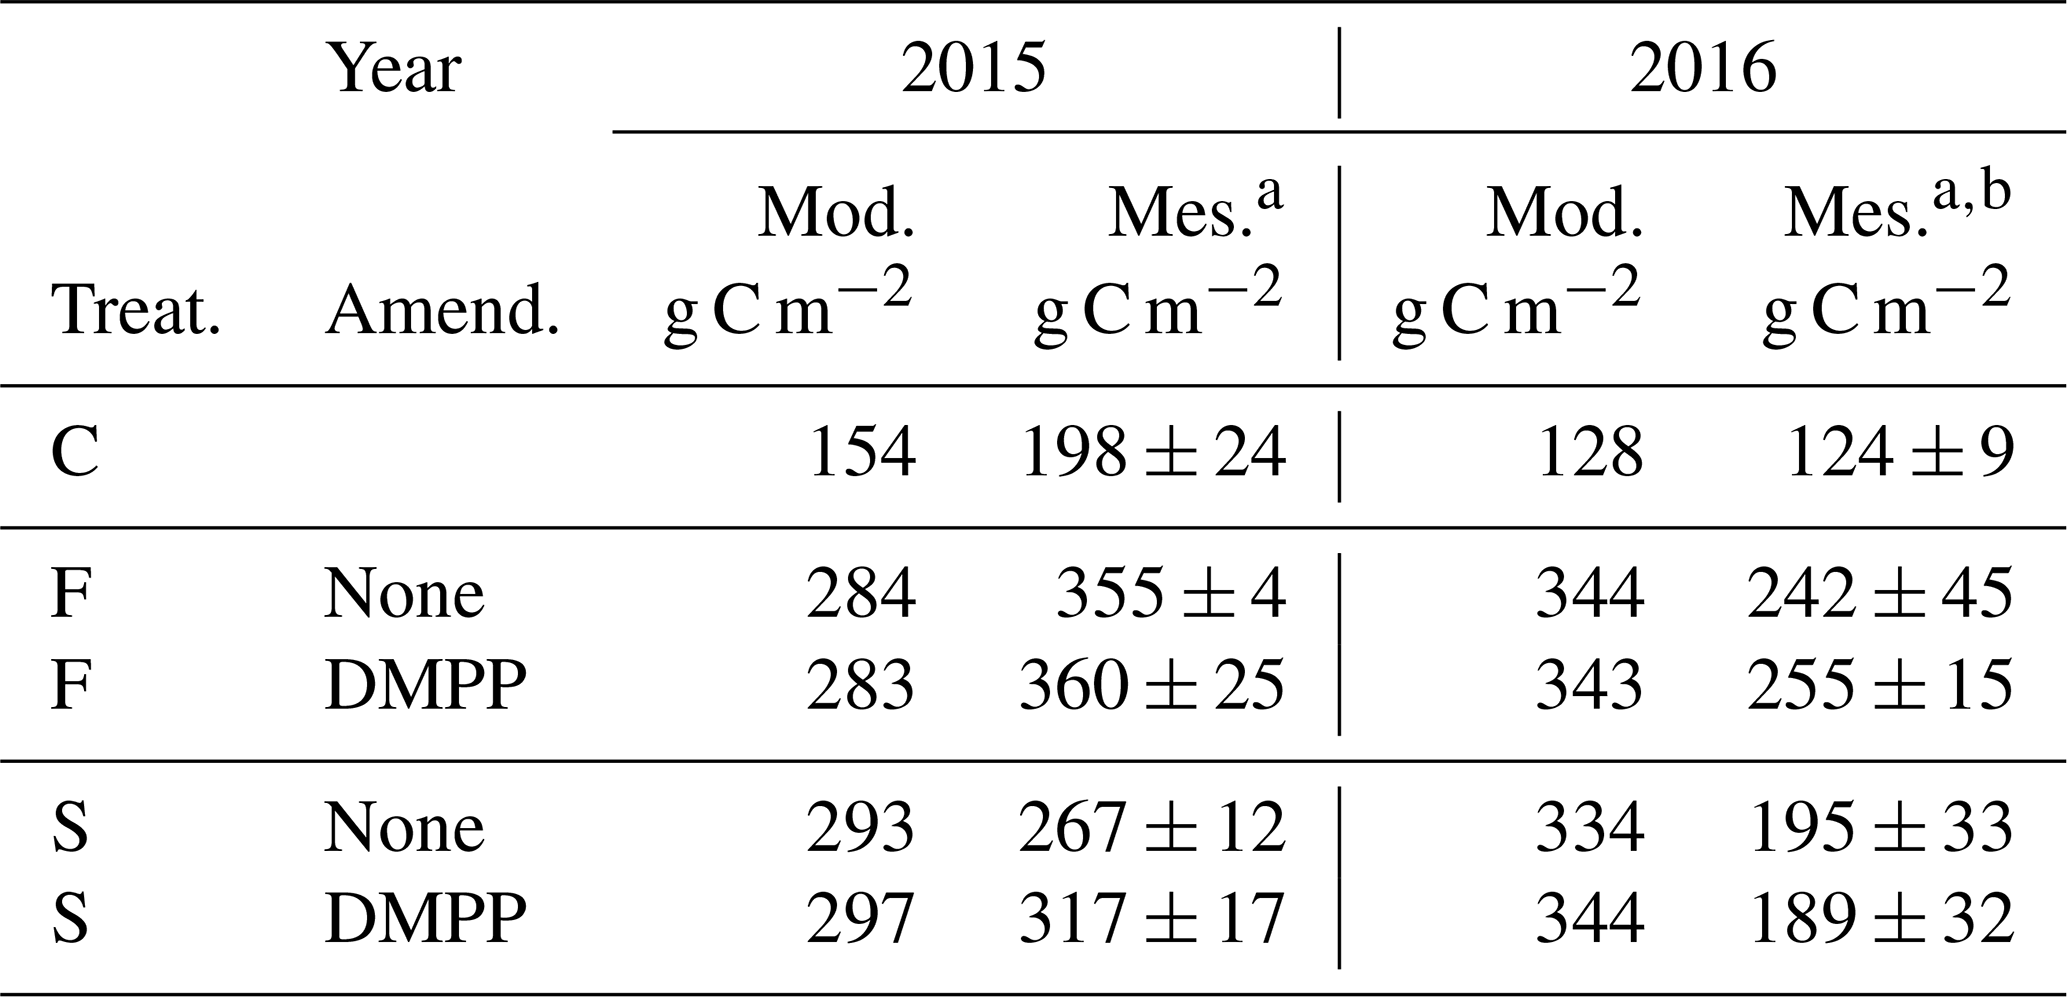
a Calculated as 45 % dry matter. b Measured yields reduced by lodging.
O2 deficits were modelled in spring thaw 2015 (Fig. 3a), when diffusion was sharply reduced by soil saturation because drainage from snowmelt and soil thaw was impeded by underlying ice layers. These declines drove N2O generation (Fig. 3b) and emission (Fig. 4b) almost entirely from reduced during spring thaw. O2 deficits were also modelled during winter 2016, when increased θi from soil freezing with lower Ts under a shallower snowpack caused near-surface soil porosity to be fully occupied by ice and water. Consequent loss of θg greatly reduced surface gas exchange and hence gradually reduced soil O2 concentrations, particularly with increased O2 demand from fall slurry application (Fig. 3c). The extended period of low O2s prolonged overwinter accumulation of N2Os after fall slurry application (Fig. 3d). Transient increases in θg during soil freeze–thaw cycles caused several N2O emission events to be modelled during spring thaw in 2016, mostly from degassing through volatilization of overwinter N2Os (Fig. 5b). Degassing events in the model were consistent with field observations by Chantigny et al. (2017) that passive degassing of accumulated gases made a significant contribution to spring thaw emissions, during which two or more consecutive emission peaks were often observed. In the model, the contribution by degassing of overwinter N2Os to spring thaw emissions increased with intensity and duration of soil freezing during the previous winter. N2O emissions simulated during spring thaw were thus driven by concurrent reduction during spring thaw (2015) and by earlier reduction accumulated over the previous winter (2015–2016), as has been proposed from experimental observations (Teepe et al., 2004).
O2 deficits were also caused by rapid increases in O2 active uptake with addition of labile C in slurry, the rapid decomposition and oxidation of which (Sect. 2.3, step 1) caused transient declines in O2s with soil wetting from slurry application and precipitation (Fig. 3e, g). After slurry application in the wetter spring of 2016, modelled O2g declined to around one-half of atmospheric concentration, driving the sharp declines in O2s shown in Fig. 3g. The modelled declines in O2g were consistent with results from an incubation of wetted soil amended with cattle slurry by Nguyen et al. (2017), in which O2g declined below one-half of atmospheric concentration within 1 d of slurry application and gradually rose again after 2 d, while no decline occurred in an unamended soil. The period of low O2s in this incubation study coincided with peak emissions of CO2 and N2O from the amended soil, as was modelled here in Figs. 3f, h, 6b and 7b. This coincidence indicated that and DOC oxidation drove O2 deficits from demand for O2 from oxidation vs. supply of O2 through convection–dispersion, which caused reduction as represented in the model, again demonstrating the importance of simulating aqueous and gaseous O2 transfers when modelling N2O emissions.
6.2 Process modelling of NI effects on N2O emissions
6.2.1 Fall slurry application
oxidation in the model (Sect. 2.5, step 4) proceeded rapidly after fall slurry application without NI, as indicated by rapid declines in (Fig. 2a), consistent with observations in other studies that soil concentrations returned to background levels 30 d after fall slurry application (Rochette et al., 2004). Slower oxidation modelled with NI (Eq. 3) during fall caused slower declines of soil before and during freezing and hence larger concentrations during spring thaw (Fig. 2a). These slower declines were modelled from slower decline of It with low in cold soils (Eq. 1), which slowed oxidation and thereby reduced N2O emissions simulated during late autumn and spring thaw (Figs. 4b and 5b), despite increased concentrations (Fig. 2). These reductions were consistent with those from chamber measurements at the Edmonton South Campus Farm (Lin et al., 2018) and with those from a limited number of studies elsewhere, in which persistent effects of NI in reducing overwinter N2O emissions have been found (e.g. Pfab et al., 2012), indicating the importance of in Eq. (1).
The slower decline of It from low enabled ecosys to simulate larger reductions in N2O emissions with NI after fall slurry applications in cooler soil vs. spring slurry applications in warmer soil during both years (F during autumn vs. S during late spring–summer in Table 6). Reductions in N2O emissions modelled with NI after fall slurry applications became greater when fall applications were delayed (F+2 in Table 6), further reducing Ts and during subsequent nitrification. The greater reductions modelled with fall applications were consistent with experimental observations by Merino et al. (2005), who attributed larger reductions in N2O emissions measured with NI from fall-applied vs. spring-applied cattle slurry to slower NI degradation in cooler soil. These modelled and experimental results indicated that NI effectiveness in reducing N2O emissions varies with the effect of fall slurry timing on .
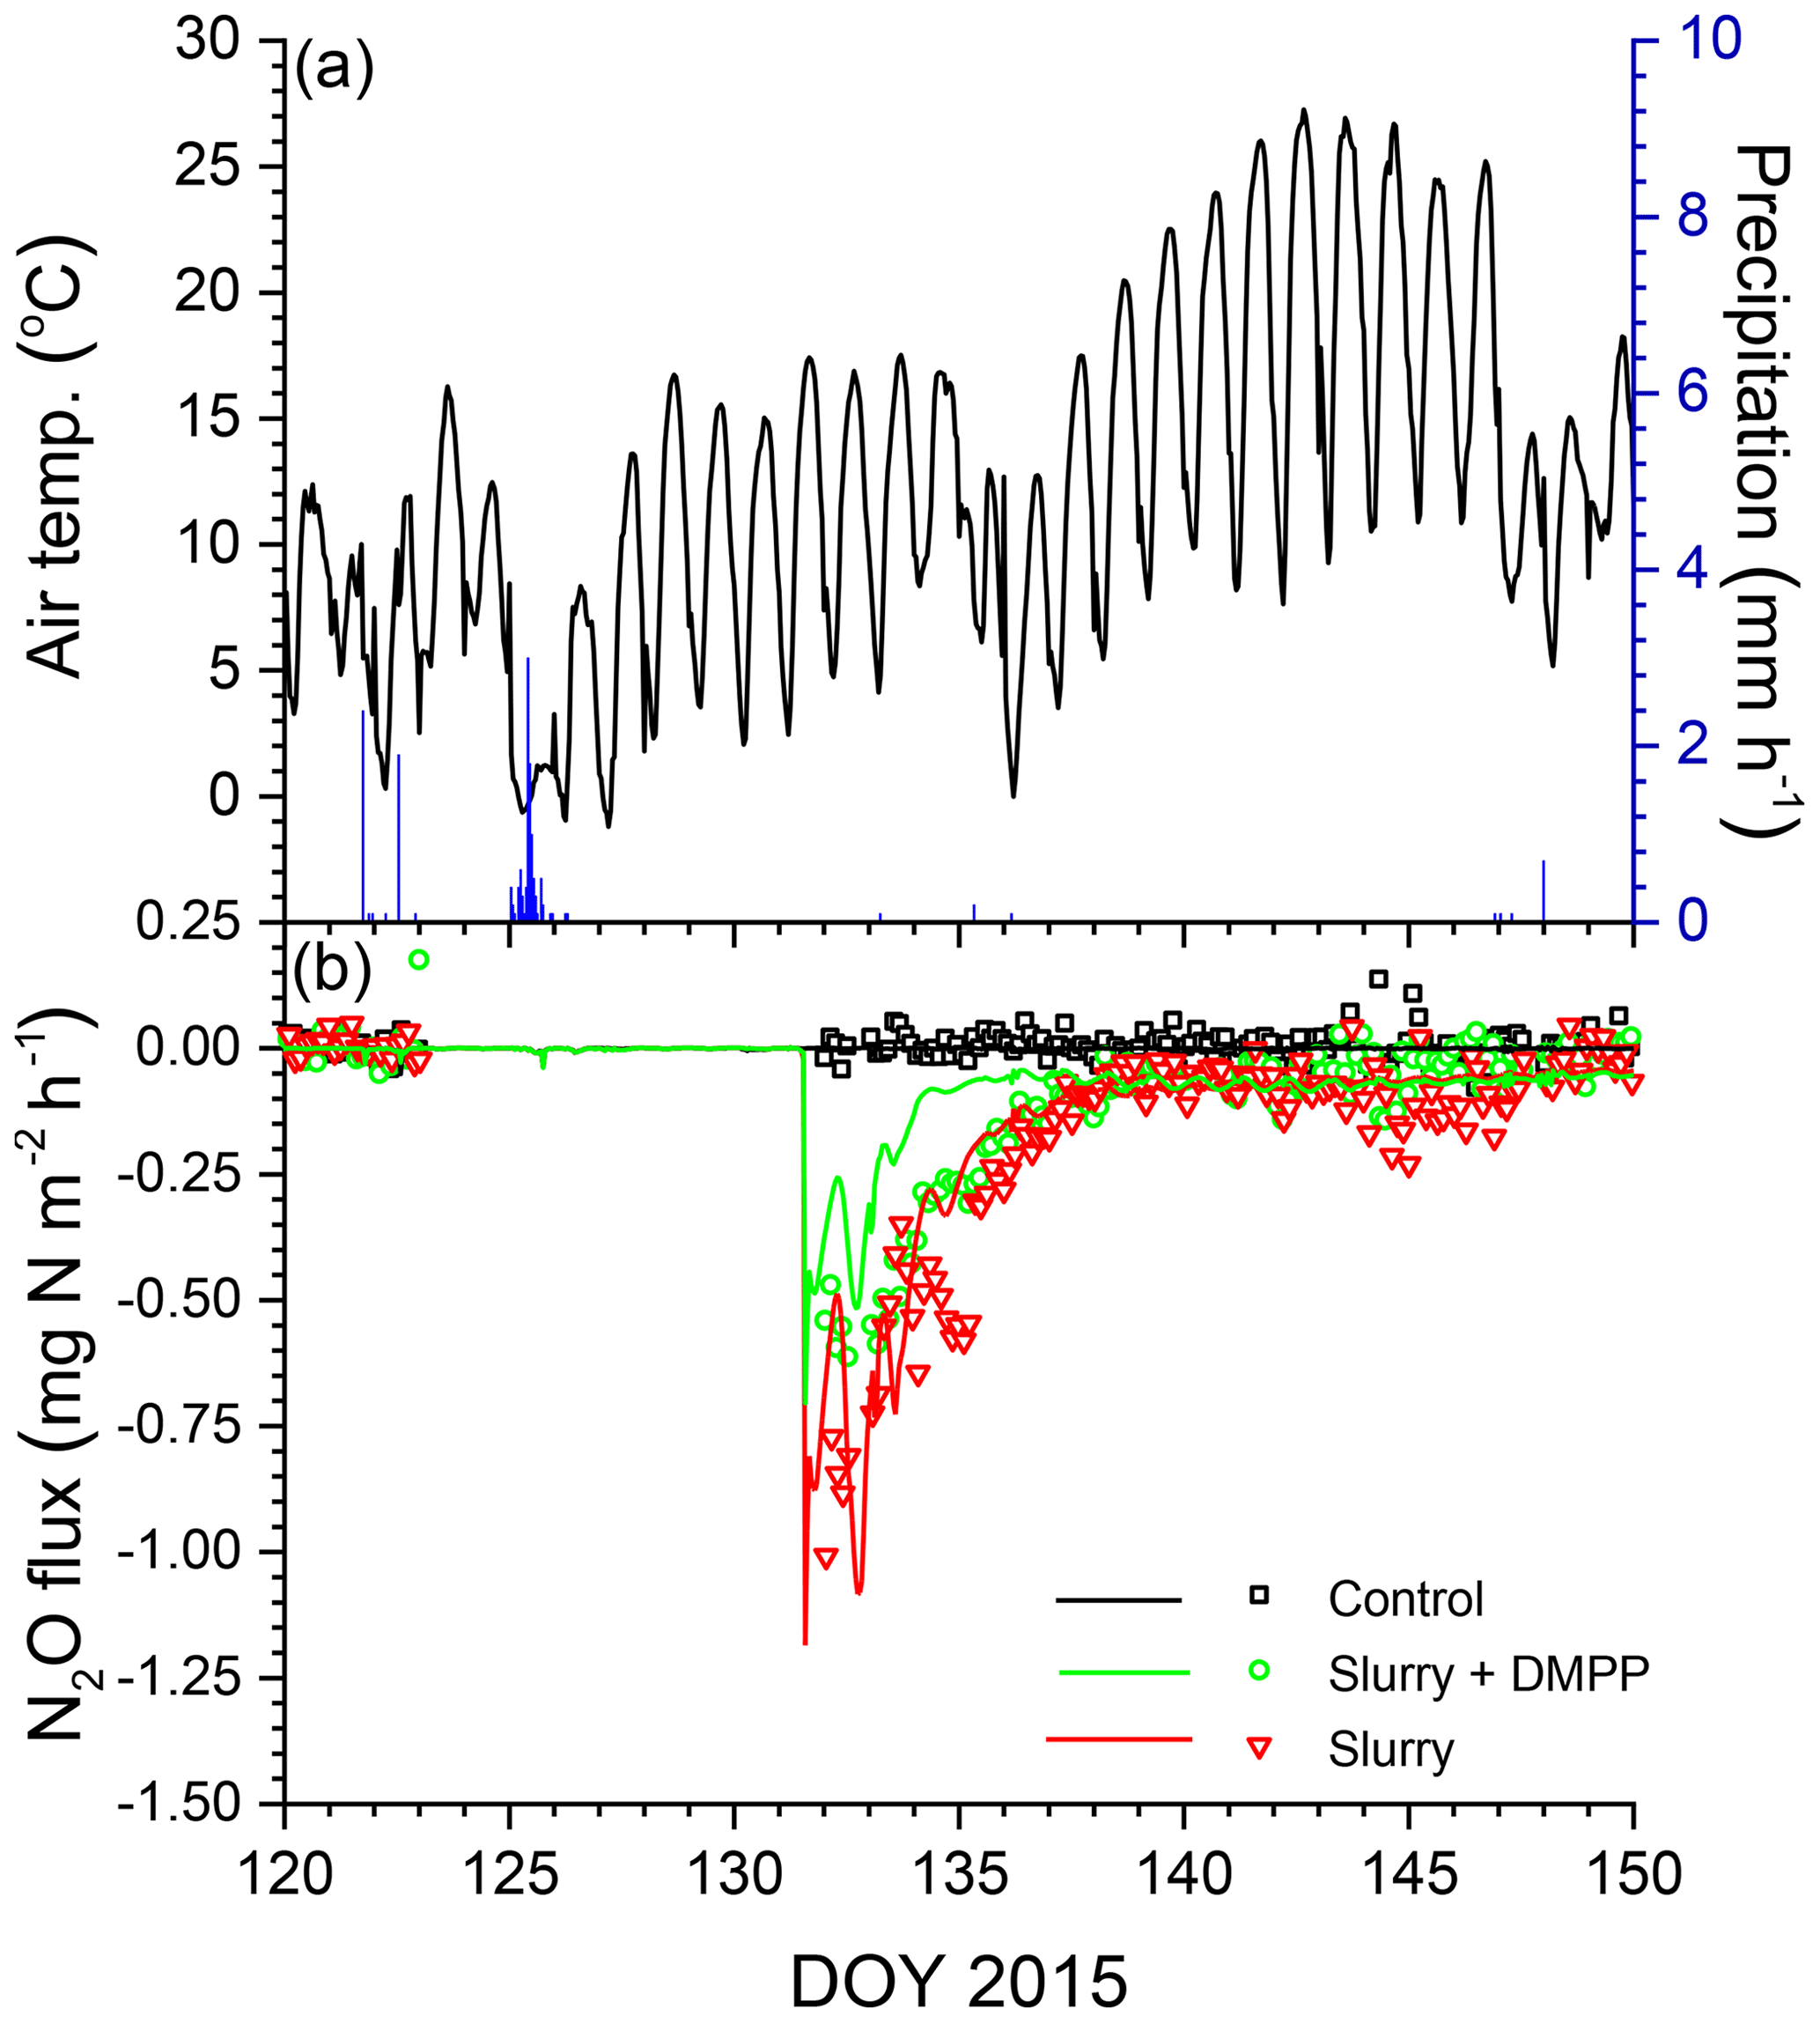
Figure 6(a) Air temperature and precipitation and (b) N2O fluxes measured (symbols) and modelled (lines) during spring 2015 with no slurry (control) and following slurry application on DOY 132 in 2015 with or without DMPP. Negative values denote emissions.
The greater reductions in N2O emissions modelled from delayed fall applications with NI were associated with much greater N2O emissions modelled from delayed fall applications without NI (F+2 in Table 6). These greater emissions were attributed to less oxidation before freeze-up in fall, resulting in more remaining to drive oxidation and hence N2O emissions during spring thaw. These model findings were consistent with field results from Chantigny et al. (2017) in Quebec and Kariyapperuma et al. (2012) in Ontario, where greater spring N2O emissions were measured when fall slurry was applied in late November than in early November. These greater spring thaw N2O emissions were attributed by Kariyapperuma et al. (2012) to greater mineral N concentrations during spring thaw caused by less nitrification before freeze-up during the previous fall, as modelled here. The greater N2O emissions modelled with later slurry application were also driven by more rapid DOC oxidation from more labile manure C remaining during spring thaw. This more labile manure C reduced [O2s] below that simulated after earlier fall applications (Fig. 3d). NI may therefore be particularly effective in reducing N2O emissions during spring thaw following late fall slurry applications.
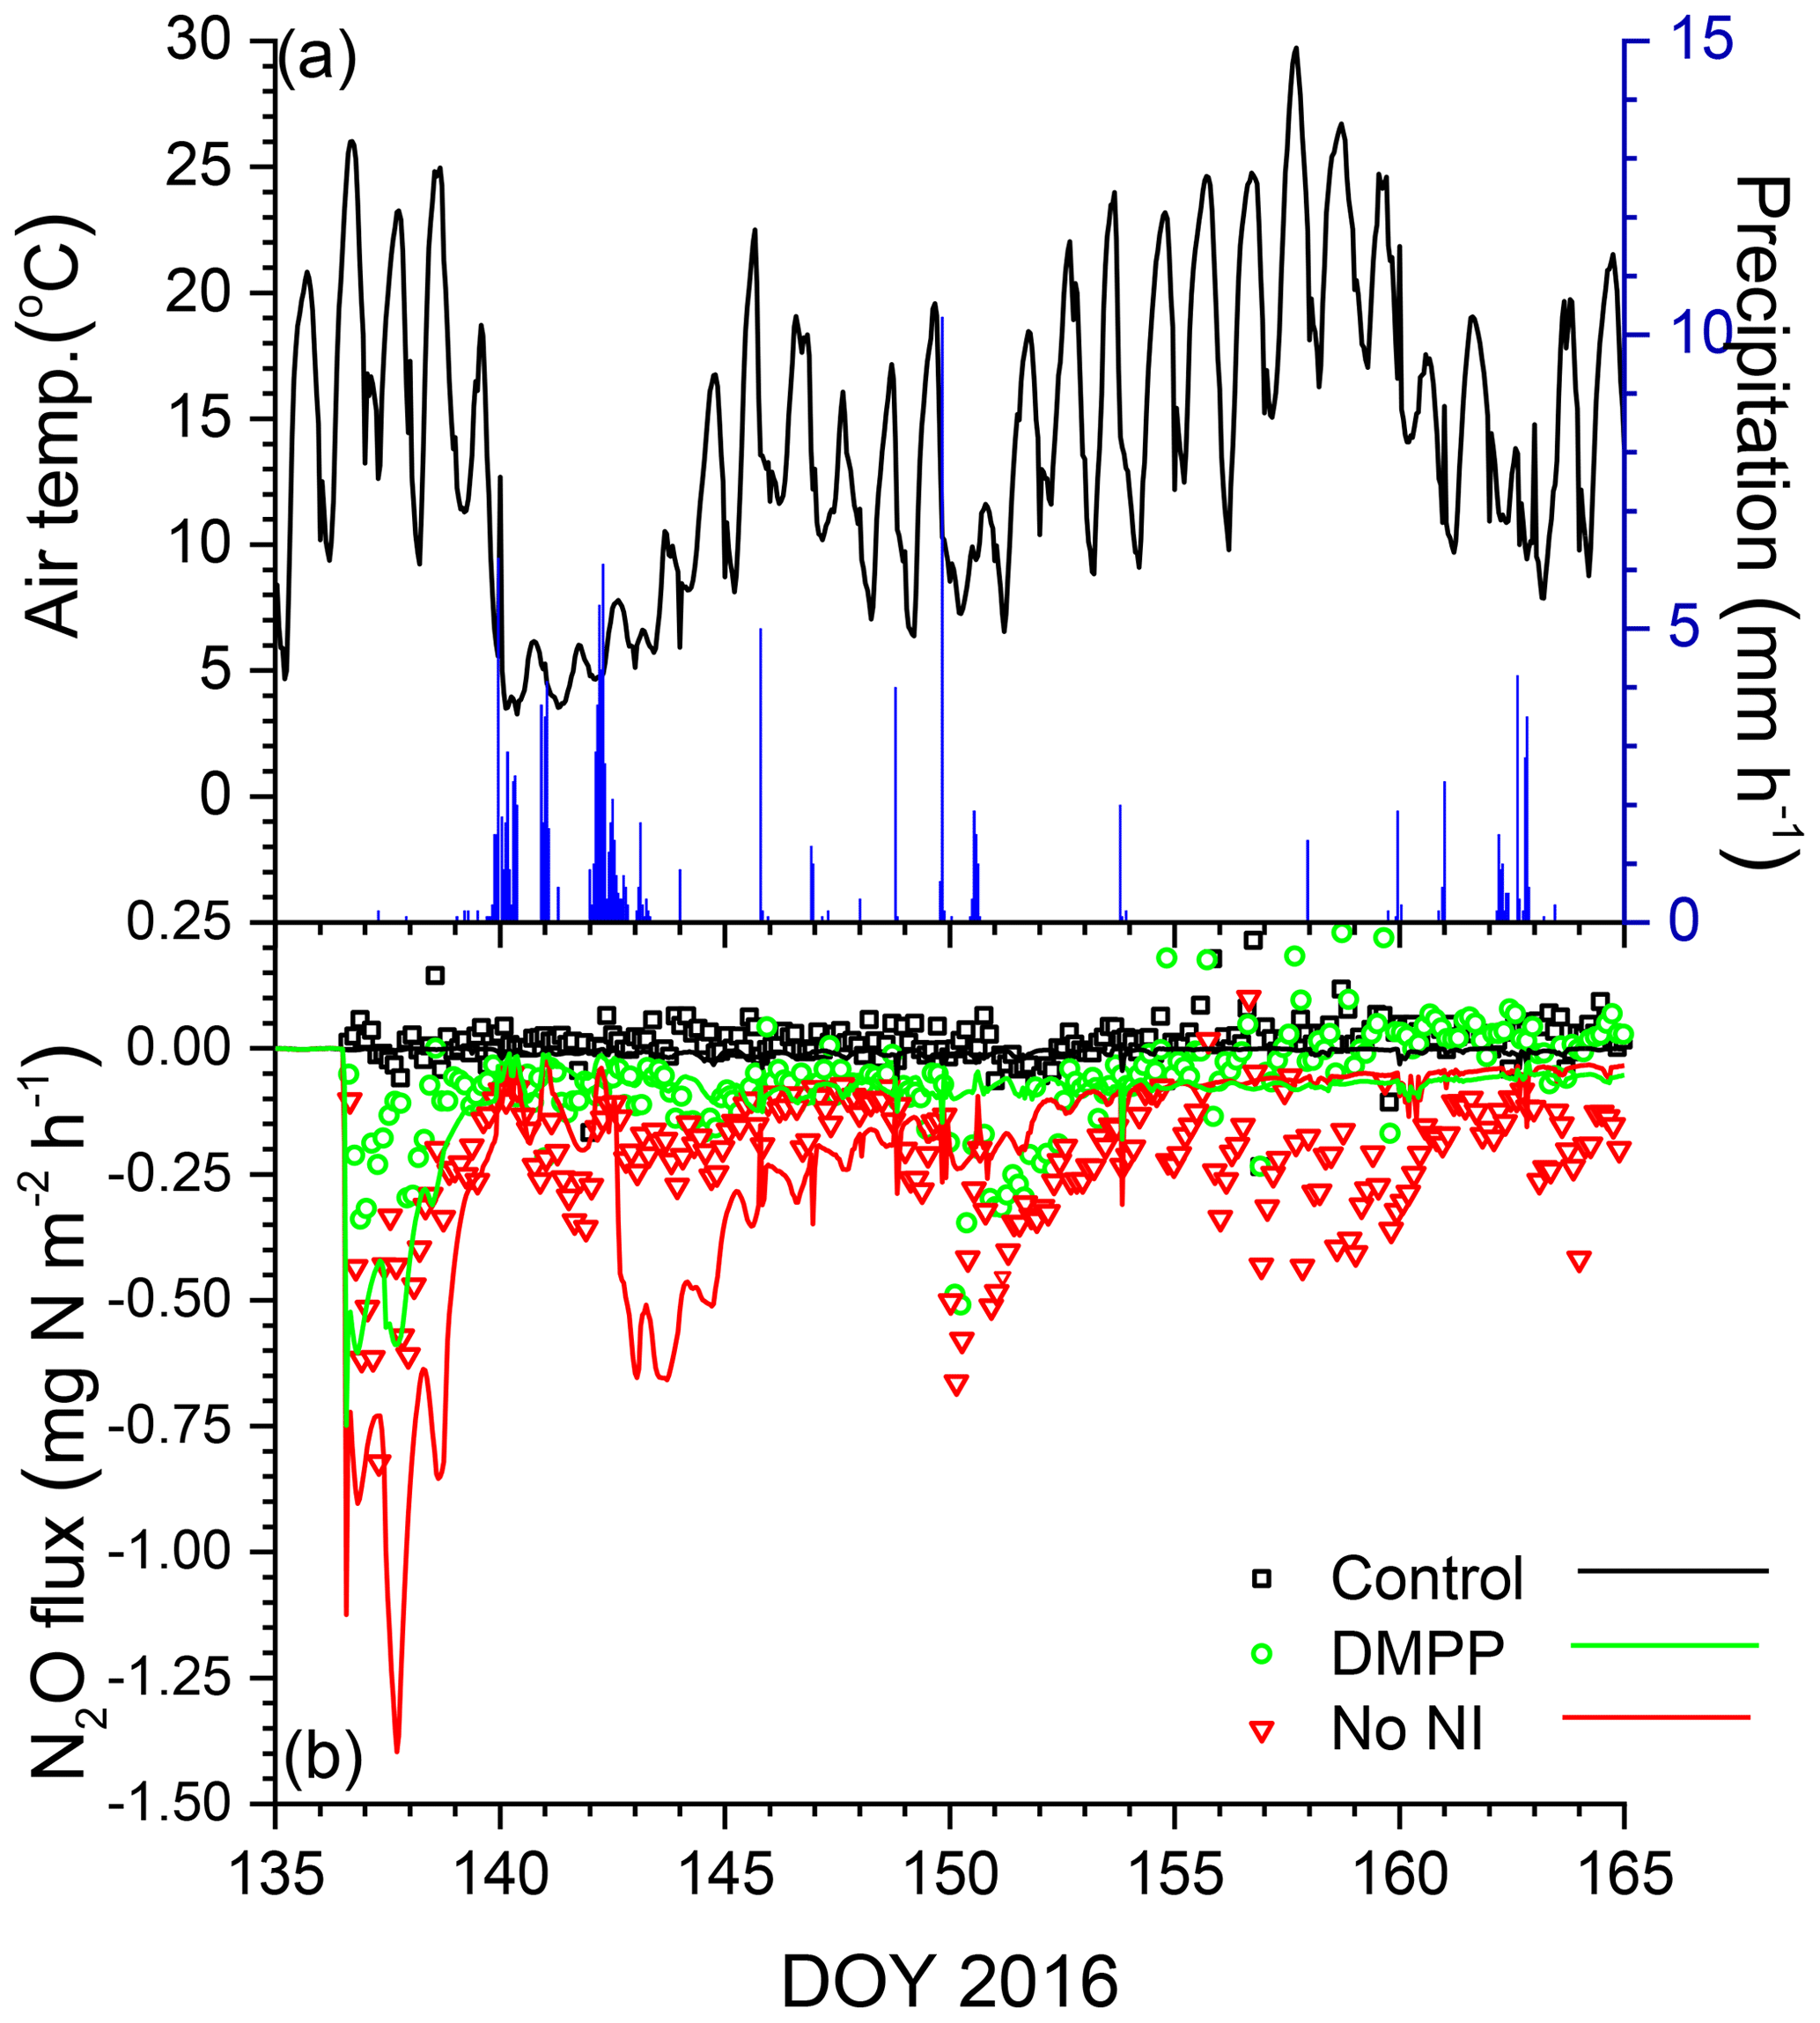
Figure 7(a) Air temperature and precipitation and (b) N2O fluxes measured (symbols) and modelled (lines) during spring 2016 with no slurry (control) and following slurry application on DOY 137 in 2016 with or without DMPP. Negative values denote emissions.
The decreases in N2O emissions modelled with NI from greater soil mixing (F0.5 and F0.8 vs. F in Table 6) were affected by how the redistribution of NI activity with soil mixing was modelled. Simulating this redistribution during tillage requires further consideration and corroboration from observations. These decreases in N2O emissions with NI were associated with greater N2O emissions modelled from greater soil mixing without NI in 2016 (F0.5 and F0.8 in Table 6). These greater emissions were attributed in the model to longer periods with high θi and low θg in the upper soil profile caused by greater heat loss through reduced insulation from less surface litter under a shallow snowpack [D12, D13]. This longer period further reduced overwinter [O2s] from that modelled in F (Fig. 3c), causing greater accumulation of N2Os and hence greater emissions during thaw. These model findings were consistent with field observations by Congreves et al. (2017) and Wagner-Riddle et al. (2010) that overwinter N2O emissions increased with greater freezing under conventional tillage vs. no tillage, particularly with surface residue removal. Model findings were also consistent with observations by Teepe et al. (2004) that N2O emissions during soil thawing rose sharply with increased duration of soil freezing. Consequent changes in Ts with freezing may alter NI effectiveness with tillage.
6.2.2 Spring slurry application
Annual N2O emissions modelled without NI from spring applications were smaller than those from fall applications in 2014–2015, with a wetter early spring and drier late spring, and slightly greater in 2015–2016, with a drier early spring and wetter late spring (Table 4), except when fall application was delayed (e.g. F+2 in Table 6). These modelled differences in emissions were consistent with experimental findings that drier springs reduce N2O emissions from fall applications relative to those from spring (e.g. Cambareri et al., 2017). These model results indicate that effects of spring vs. fall slurry applications on annual N2O emissions may not be consistent but rather will depend on the timing of fall application relative to freeze-up and on precipitation during the following winter and spring.
Amendment of slurry with NI slowed declines in modelled after spring applications comparably to those measured (Fig. 2b). These slower declines were caused by slower oxidation that reduced nitrifier growth (Sect. 2.9, Eq. 3) and active O2 uptake (Sect. 2.5, step 3). Consequently smaller nitrifier biomass and greater [O2s] were modelled with NI vs. without NI (Fig. 3e, g), particularly with rainfall after spring application in 2016 (Fig. 7a). The smaller nitrifier biomass modelled with NI was consistent with the findings of Dong et al. (2013) that DMPP reduced populations of ammonia oxidizing bacteria in soil incubations. Greater [O2s] modelled with NI was consistent with greater [O2g] measured in an incubation of wetted soil amended with cattle slurry with DMPP vs. without DMPP by Nguyen et al. (2017). Slower nitrifier growth and greater [O2s] both contributed to reductions in N2O emissions modelled with NI beyond those from the direct effects of It on nitrification in Eq. (1), indicating additional effects of NI on N2O emissions that should be considered in NI models.
The reductions in N2O emissions modelled for 30 d after spring slurry applications with RI for DMPP and nitrapyrin in 2015 (35 % and 30 %) and 2016 (53 % and 41 %) were less than those measured with automated chambers (Table 5) but within the range of 31 % to 44 % in meta-analyses of NI research by Akiyama et al. (2010) and Ruser and Schultz (2015). The greater reductions modelled in 2016 vs. 2015 (Fig. 7 vs. Fig. 6) were consistent with findings in meta-analyses by Akiyama et al. (2010) and Gilsanz et al. (2016) that NI was more effective in reducing N2O emissions from a given land use when emissions were greater. These greater reductions were attributed in the model to heavy rainfall several days after application in 2016 (Fig. 7a) that extended the N2O emission period (Fig. 7b). During this extension It remained high because [] had declined from the large values modelled immediately after application (Eq. 3).
The effects of NI on N2O emissions modelled with greater soil mixing during spring applications (S0.5 and S0.8 vs. S in Table 6) were affected by how the redistribution of NI activity with soil mixing was modelled, as were those during fall applications. The effects of soil mixing on N2O emissions without NI modelled from slurry applications in spring were smaller than those in fall in the absence of soil freezing effects on O2s. These smaller effects were modelled because tillage in this study involved mixing of injected manure rather than incorporation of surface-applied manure. These small effects were consistent with an observation by VanderZaag et al. (2011) that tillage was less important than timing and placement for N2O emissions from slurry applications.
The reductions in annual N2O emissions modelled after spring slurry applications with RI for DMPP and nitrapyrin in 2015 (22 % and 17 %) and 2016 (40 % and 27 %; Table 6) were smaller than those modelled after 30 d (Table 5) due to gradual degradation of NI effectiveness modelled with time since application (Eq. 1), indicating the importance of year-round modelling and measurements to fully assess NI effects on N2O emission factors for IPCC Tier 3 methodology. However most of the datasets used in meta-analyses of these assessments did not include emissions during autumn, winter and spring thaw (Ruser and Schulz, 2015). which are particularly important for estimating emission factors for NI effects from fall slurry applications in cold climates (Table 6). An ecosystem modelled with well-tested simulation of NI effects may make a valuable contribution to these assessments.
6.3 Modelling NI effects on NH3 emissions and mineral N losses
The small NH3 emissions modelled from slurry injection with limited soil mixing (Table 7) were consistent with observations of almost no NH3 volatilization from closed-slot injection of slurry by Rodhe et al. (2006). In the model, NH3 emissions with or without NI were sharply reduced by adsorption with diffusion of NH3 and from the injection site. Greater soil mixing brought more closer to the surface, reducing adsorption and thereby increasing NH3 emission, particularly from fall applications with NI (Table 7). Consequently only small net increases in NH3 emissions (Table 7) were modelled with NI from increased volatilization of aqueous NH3 in equilibrium with increased concentrations (Fig. 2). However these increases were large in relative terms, particularly following fall applications, consistent with increases of 33 %–67 % and 3 %–65 % relative to emissions without NI derived from meta-analyses of field experiments by Qiao et al. (2015) and Lam et al. (2017) respectively. Increases in NH3 emissions with NI will thus depend on soil adsorptive properties and depth of slurry incorporation.
The small losses of , and consequently the small reductions in these losses with NI, modelled in the subhumid climate at the Edmonton South Campus Farm (Table 7) conform to the assumption by De Klein et al. (2006) that leaching is an insignificant source of indirect N2O emission from dryland cropping systems in subhumid climates. Consequently reductions in leaching have minimal impact on the overall effect of NI on N2O emission in these climates (Lam et al., 2017). Reductions in losses modelled with NI would be larger at sites with better drainage and more excess precipitation, although even under these conditions such reductions may be small and inconsistent (Smith et al., 2002).
The increases in NH3 emissions modelled with NI were larger than reductions in leaching (Table 7), indicating that net increases in N2O emissions from indirect effects of NI will partially offset decreases in N2O emissions from direct effects. This offset must be included when estimating changes in N2O emission factors attributed to NI in IPCC Tier 3 methodology.
6.4 Modelling NI effects on N2O emissions: parameter evaluation
The simulation of N2O emissions from nitrification and denitrification in ecosys is based on a comprehensive representation of biological and physical processes governing production and transport of N2O. Parameters used in these processes are well constrained from basic research so that the model may provide a robust means to predict emissions under diverse climates, soils and land use practices. These processes in ecosys were not changed when adding the algorithm for inhibiting oxidation by nitrifiers proposed in Eqs. (1) and (2) (Sect. 2.9). This algorithm used only three parameters, It=0 and RI in Eq. (1) and in Eq. (2), with values of 1.0, h−1 and 7000 g N m−3 to simulate the time course of NI activity following slurry application. The first two parameters correspond to those in earlier models of NI for inhibition effectiveness (0.5–0.9) and duration (30–60 d; Cui et al., 2014; Del Grosso et al., 2009). These models have given reductions in N2O emissions with NI in agricultural crops of around 25 % (Cui et al., 2014), 10 % (Del Grosso et al., 2009) or less (Abalos et al., 2016), which are frequently smaller than reductions of 26 %–43 % and 24 %–46 % derived from meta-analyses of NI effects in agricultural crops by Akiyama et al. (2010) and Gilsanz et al. (2016) respectively. Direct effects on NI of soil water content and pH were not modelled here due to uncertainty in parameterization, although both affect nitrification and hence the magnitude of NI activity.
Each of the parameters used to model NI in ecosys requires further evaluation. A larger RI, such as that used for nitrapyrin vs. DMPP (Sect. 2.9), caused a more rapid decline of NI activity in soil and hence greater N2O emissions with time after slurry application that were consistent with measurements (Tables 5 and 6; Lin et al., 2018). This larger value might represent more rapid degradation of nitrapyrin through volatilization (Ruser and Schulz, 2015), although meta-analyses of N2O reductions with NI indicate that those with nitrapyrin are similar to those with DMPP. The value of RI used for NI in the model will thus likely be product specific. The effect of Ts on RI might reasonably be represented by , as is the effect of Ts on all other biological reactions in the model. This function allowed modelled NI activity to persist over winter (Fig. 2) and hence reduce N2O emissions modelled during spring thaw (Figs. 6 and 7). However the effects of temperature on reductions in N2O emission with NI over time are sometimes unclear in controlled studies (Kelliher et al., 2008).
The value of It=0 set the value of It at the time of slurry application, after which It underwent first-order decline over time according to Eq. (1) (Sect. 2.9). The current value of 1.0 indicates complete inhibition at the time of application but might be reduced if the amount of NI at application is less than that required for complete inhibition. However It had to remain large enough to reduce N2O emissions from nitrification for several weeks after application (Figs. 6 and 7) even with higher soil concentrations (Fig. 2). Lowering It=0 from 1.0 to 0.8, similar to that in earlier NI models in which It decline was not simulated, increased N2O emissions modelled over 30 d after spring slurry applications by 7 % in 2015 and 25 % in 2016 (Table 9).
Table 9Sensitivity of seasonal N2O emissions modelled during late spring in 2015 and 2016 to changes in initial inhibition (It=0 in Eq. 1) and inhibition constant ( in Eq. 2) following spring slurry application on dates in the field study (Table 3). Negative values denote emissions.
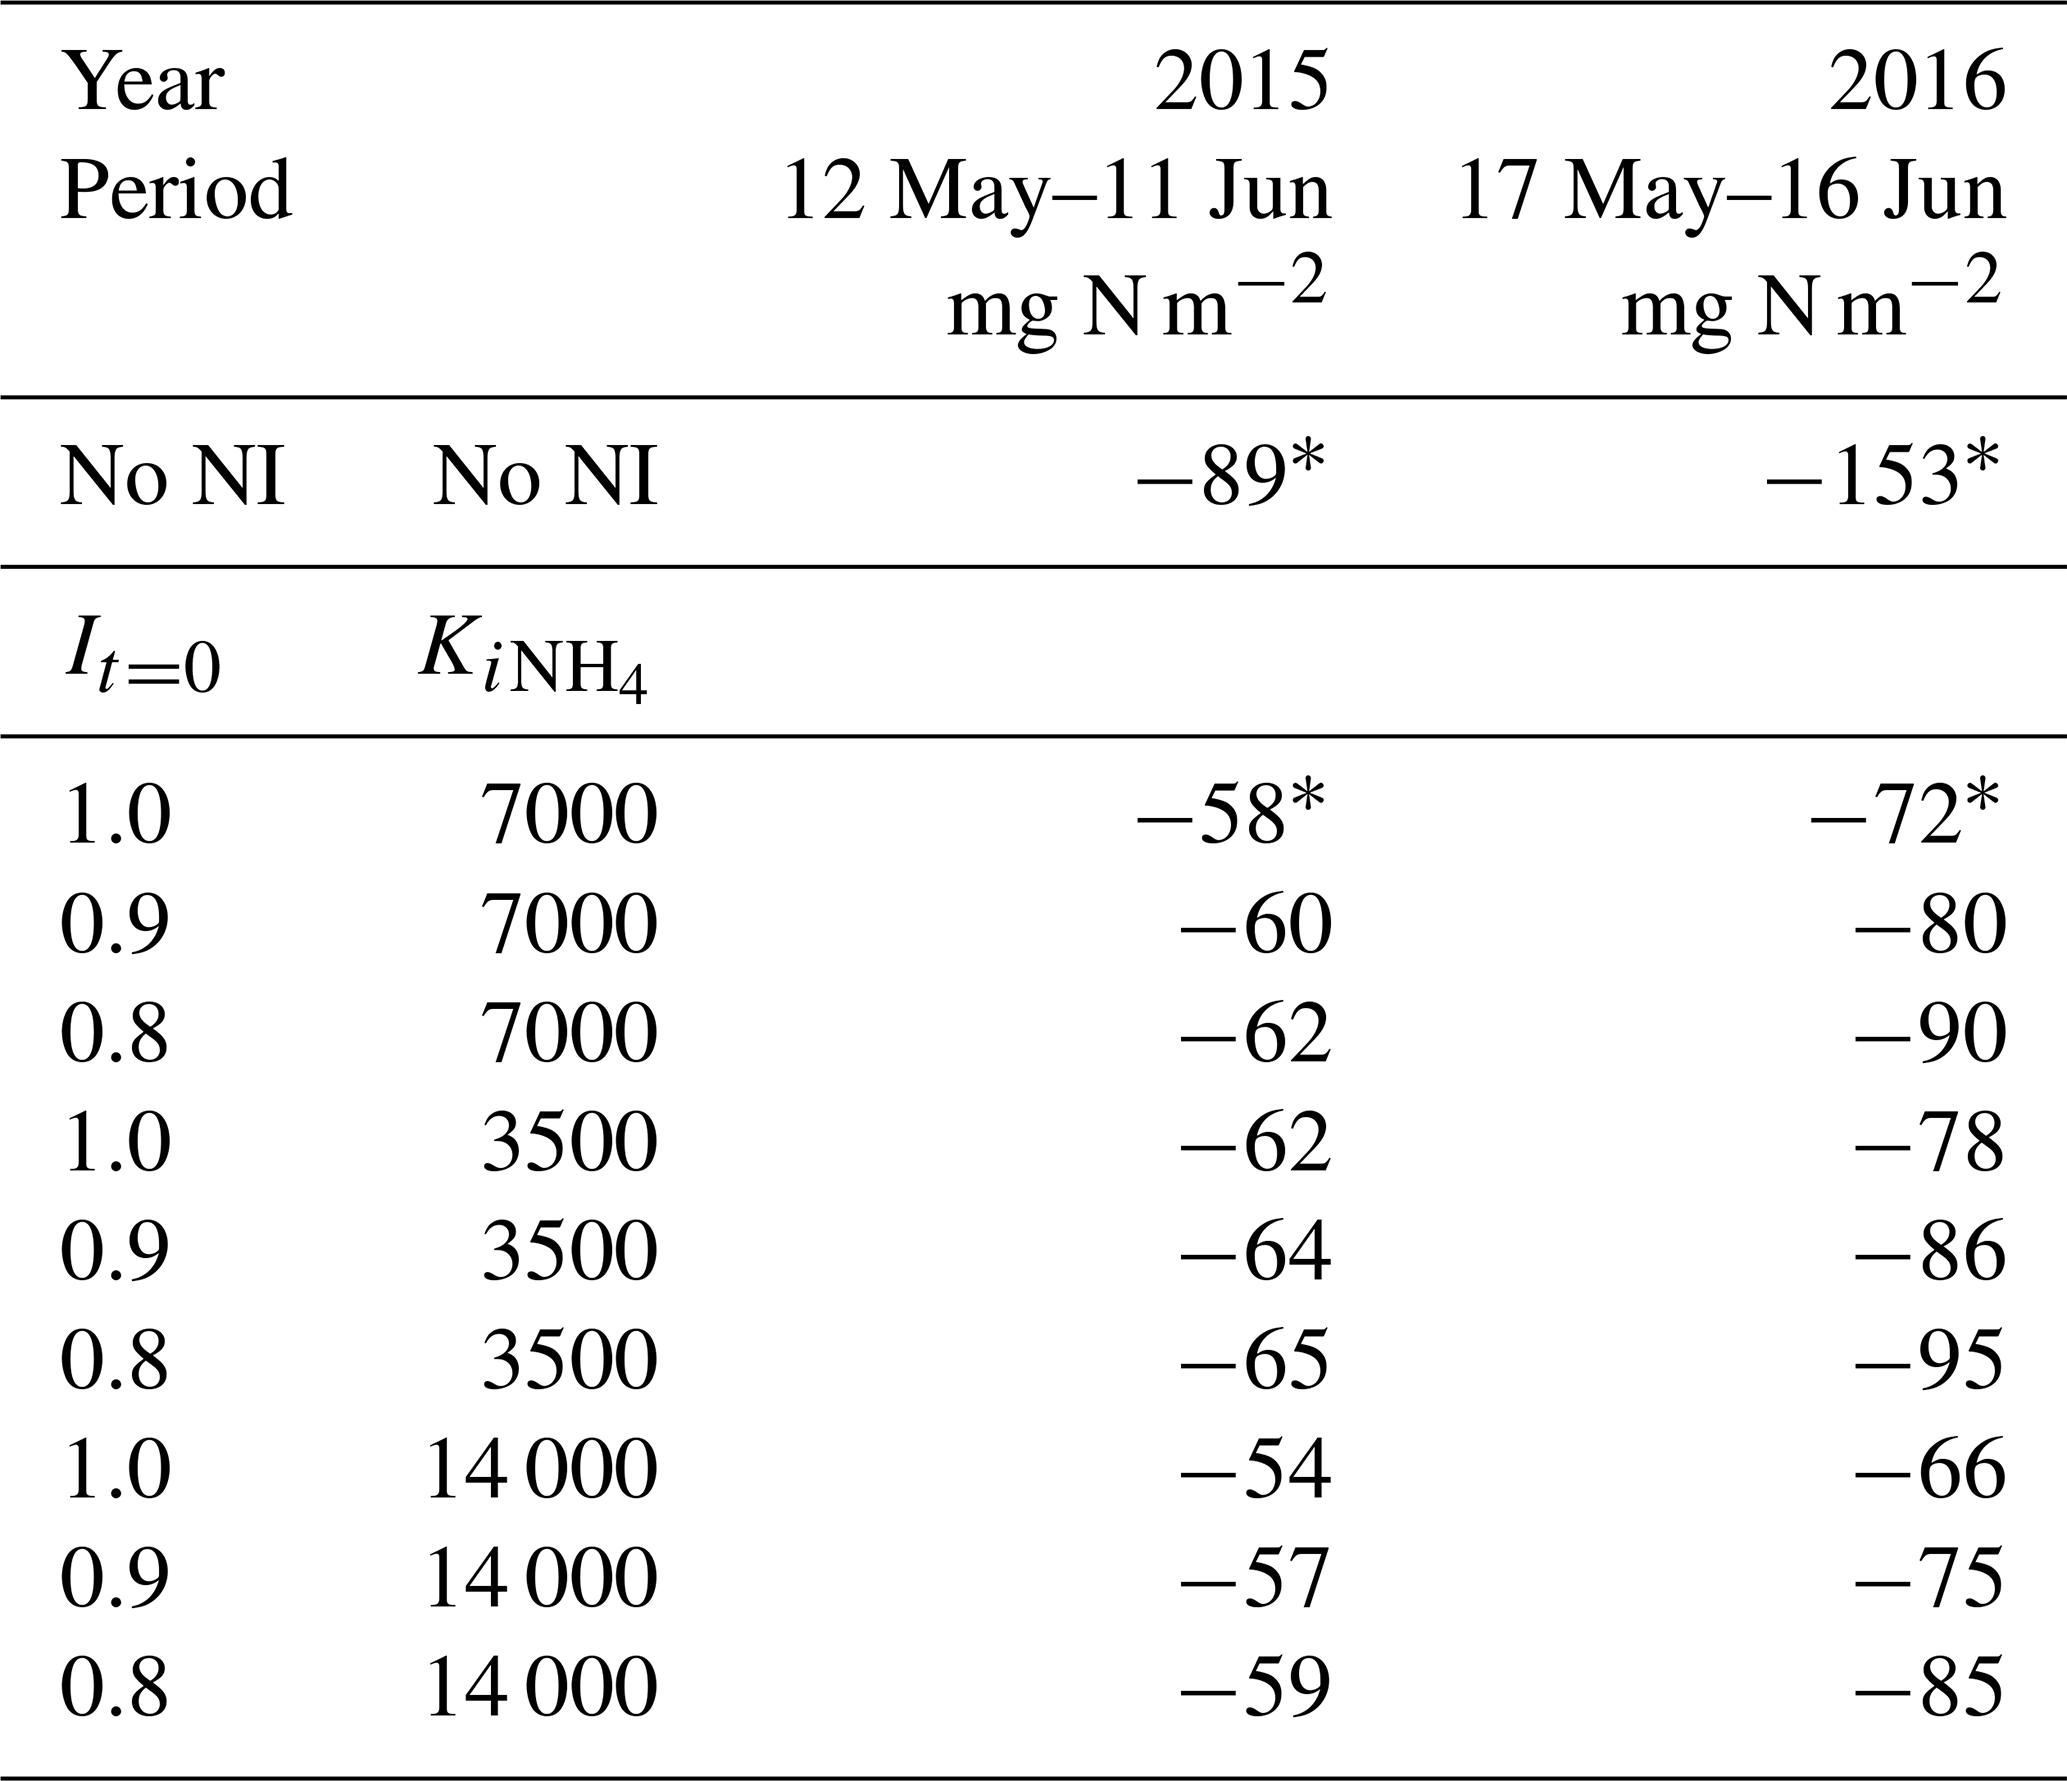
* From Table 5.
The value of in Eq. (2) reduced It with the very large concentrations modelled immediately after injecting slurry with large content (Table 3) into small bands (Sect. 3.1). The use of was suggested by the findings of Janke et al. (2019) that NI may not have the expected impacts on N transformations and availability when applied in a concentrated band with large concentrations (up to 12 kg N Mg−1), similar to those modelled immediately after slurry application in this study. The modelled concentrations declined rapidly after application through diffusion, adsorption and nitrification (Sect. 2.5), and thus so did effects on inhibition. The value of in Eq. (2) therefore governed NI effects modelled during the brief periods of rapid N2O emissions following application (around 3 d in Figs. 6 and 7) but had sharply diminishing impacts on NI effects modelled thereafter. An alternative hypothesis for reduced inhibition by NI immediately after application might be more rapid diffusion of than NI from the band, leading to spatial separation (Ruser and Schulz, 2015), although parameterization of this hypothesis is uncertain. Halving or doubling from the value set in Sect. 2.9 raised or lowered N2O emissions modelled over 30 d after spring slurry applications by 7 %–8 % in 2015 and 2016 (Table 9), indicating some latitude in evaluating this parameter.
Reductions in N2O emissions modelled with all proposed values of It=0 and varied from 27 % to 41 % in 2015, and from 38 % to 57 % in 2016 (Table 9), close to the range of 42.6 %±5.5 % derived from meta-analyses of NI effects with cattle slurry by Gilsanz et al. (2016). Further evaluation of these parameters should be undertaken in future studies in which measurements are taken at higher frequencies (e.g. Figs. 6 and 7) required to assess N2O emissions and NI effects on them.
6.5 Modelling NI effects on N2O emissions: outstanding issues
Several issues remain to be addressed in modelling N2O emissions and NI effects on these emissions. Accurately modelling emissions during spring thaw depended upon accurately modelling soil freezing and thawing following snowmelt and their effects on soil O2 transfer. A small delay of 2–3 d in modelled thawing caused some small emission events measured in early spring of 2015 to be missed (Fig. 4b). However because modelled emissions were driven by overwinter accumulation of N2O (Fig. 3), seasonal emissions were less affected by such delays than emissions from individual events. Algorithms for modelling snowpack accumulation and ablation in ecosys are being further refined to improve simulation of soil freezing and thawing. Accurately modelling emissions later in spring depended upon accurately modelling soil wetting and drying following rainfall and their effects on soil O2 transfer. Soil wetting from heavy precipitation typically drives N2O emission events following soil N additions, as modelled here during DOY 143–146 in 2016, although such events were not always measured (Fig. 7b). Such wetting caused sharp declines in O2s when soil water content rose above a critical threshold, driving N2O generation and subsequent emission (Fig. 3). However modelling these thresholds depends on soil hydrological properties used in the model (Table 2) which may not be known with sufficient accuracy.
Modelling NI effects on N2O emissions depended not only upon It=0 (Eq. 1) and (Eq. 2) as evaluated in Sect. 6.4 and Table 9 but also upon the time course for declining NI activity governed by the first-order rate constant RI and its temperature dependence (Eq. 1). NI activity modelled with RI and in this study reduced nitrification alone (Sect. 2.9), which enabled higher [] and lower [], and hence greater NH3 emissions, to be simulated with NI after amendment, as has been found in field studies (Fig. 2). These higher [] required a low value of RI so that NI activity would persist in reducing nitrification and hence N2O emissions after soil amendment. This model of NI activity contrasted with that in a more complex model in which NI reduced N2O emissions directly rather than through nitrification (Li et al., 2020). In such a model, NI would not directly affect [] and [] so that greater values of RI could be used to get similar reductions in N2O emissions. The values of RI and used in our model caused N2O emissions modelled with NI to decline more rapidly than those measured following spring applications (Figs. 6b and 7b). These values need to be constrained by further studies with more frequent measurements of declines in NI activity following amendment to determine if alternative models for the time course of these declines might be considered.
Findings from this modelling study may be summarized as follows:
- a.
A simple, time-dependent algorithm for adding NI effects on N2O emissions into the existing model ecosys was presented.
- b.
The direct effect of NI on N2O emissions in the model was confined to the inhibition of oxidation.
- c.
Additional effects of NI on N2O emissions were caused by slower nitrifier growth and O2 uptake. The combined effects in (b) and (c) reduced N2O emissions by 35 %–58 % depending on seasonal weather and time of manure application.
- d.
Slower nitrification modelled with this algorithm caused increases in soil concentrations and reductions in soil concentrations and N2O fluxes that were consistent with those measured following fall and spring applications of slurry over 2 years.
- e.
NI in the model remained effective in reducing N2O emissions modelled during spring thaw, particularly when these emissions were increased by delaying fall slurry applications or increasing fall tillage intensity.
- f.
NI in the model increased NH3 emissions more than they reduced leaching, causing indirect effects on N2O emissions that partially offset direct effects.
- g.
NI had no significant effect on modelled or measured barley silage yields.
- h.
Some further work is needed to corroborate parameters in the NI algorithm under a wider range of site conditions.
- i.
The addition of NI to ecosys may allow emission factors for different NI products to be derived from annual N2O emissions modelled under diverse site, soil, land use and weather, as required in IPCC Tier 3 methodology.
The model ecosys used in this study may be accessed at: https://ales-ssl.ales.ualberta.ca/htcomnet/Default.aspx?Standard= using the user ID and password provided by the corresponding author.
The supplement related to this article is available online at: https://doi.org/10.5194/bg-17-2021-2020-supplement.
RFG conceived and implemented the modelling study and is the author of the ecosys model. SL and GHR provided all field measurements used in the study.
The authors declare that they have no conflict of interest.
High-performance computing facilities for ecosys were provided by Compute Canada (https://www.computecanada.ca, last access: 27 March 2020) through the WestGrid computing network (https://www.westgrid.ca, last access: 27 March 2020). Field measurements were supported by the Alberta Livestock and Meat Agency Ltd. (2014E017R), Climate Change and Emissions Management Corporation (0019083), Dow AgroSciences (0022950), and EuroChem Agro (0027592). Weather data were provided by the Alberta Climate Information Service (ACIS).
Field measurements were supported by the Alberta Livestock and Meat Agency Ltd. (grant no. 2014E017R), Climate Change and Emissions Management Corporation (grant no. 0019083), Dow AgroSciences (grant no. 0022950), and EuroChem Agro (grant no. 0027592).
This paper was edited by Jens-Arne Subke and reviewed by three anonymous referees.
Abalos , D., Smith, W. N., Grant, B. B., Drury, C. F., MacKell, S., and Wagner-Riddle, C.: Scenario analysis of fertilizer management practices for N2O mitigation from corn systems in Canada, Sci. Total Environ., 573, 356–365, 2016.
Akiyama, H., Yan, X., and Yagi, K.: Evaluation of effectiveness of enhanced efficiency fertilizers as mitigation options for N2O and NO emissions from agricultural soils: Meta-analysis, Glob. Change Biol., 16, 1837–1846, https://doi.org/10.1111/j.1365-2486.2009.02031.x, 2010.
Cambareri, G., Drury, C., Lauzon, J., Salas, W., and Wagner-Riddle, C.: Year-round nitrous oxide emissions as affected by timing and method of dairy slurry application to corn, Soil Sci. Soc. Am. J., 81, 166–178, 2017.
Chantigny, M. H., Rochette, P., Angers, D. A., Goyer, C., Brin, L. D., and Bertrand, N.: Nongrowing season N2O and CO2 emissions – Temporal dynamics and influence of soil texture and fall-applied slurry, Can. J. Soil Sci., 97, 452–464, 2017.
Congreves, K. A., Brown, S. E., Németh, D. D., Dunfield K. E., and Wagner-Riddle, C.: Differences in field-scale N2O flux linked to crop residue removal under two tillage systems in cold climates, GCB Bioenergy, 9, 666–680, https://doi.org/10.1111/gcbb.12354, 2017.
Cui, F., Zheng, X., Liu, C., Wang, K., Zhou, Z., and Deng, J.: Assessing biogeochemical effects and best management practice for a wheat–maize cropping system using the DNDC model, Biogeosciences, 11, 91–107, https://doi.org/10.5194/bg-11-91-2014, 2014.
De Klein, C., Novoa, R. S. A., Ogle, S., Smith, K. A., Rochette, P., Wirth, T. C., McKonkey, B. G., Mosier, A., and Rypdal, K.: N2O emissions from managed soils, and CO2 emissions from lime and urea application, chap. 11, in: 2006 IPCC Guidelines for National Greenhouse Gas Inventories, edited by: Eggleston, H. S., Buendia, L., Miwa, K., Ngara, T., and Tanabe, K., IGES, Hayama, Japan, 2006.
Del Grosso, S. J., Ojima, D. S., Parton, W. J., Stehfest, E., Heistemann, M., DeAngelo, B., and Rose, S.: Global scale DAYCENT model analysis of greenhouse gas emissions and mitigation strategies for cropped soils, Glob. Planet. Change, 67, 44–50, 2009.
Dong, X. X., Zhang, L. L., Wu, Z. J., Zhang, H. W., and Gong, P.: The response of nitrifier, N-fixer and denitrifier gene copy numbers to the nitrification inhibitor 3,4-dimethylpyrazole phosphate Plant, Soil Environ., 59, 398–403, 2013
Dungan, R. S., Leytem, A. B., Tarkalson, D. D., Ippolito, J. A., and Bjorneberg, D. L.: Dairy forage rotation as influenced by fertilizer and slurry applications, Soil Sci. Soc. Amer. J., 81, 537–545, 2017.
Focht, D. D. and Verstraete, W.: Biochemical ecology of nitrification and denitrification, Adv. Micro. Ecol., 1, 135–214, 1977.
Gao, W. and Bian, X.: Evaluation of the agronomic impacts on yield-scaled N2O emission from wheat and maize fields in China, Sustainability, 9, 1201, https://doi.org/10.3390/su9071201, 2017.
Gilsanz, C., Báez, D., Misselbrook, T. H., Dhanoa, M. S., and Cárdenas, L. M.: Development of emission factors and efficiency of two nitrification inhibitors, DCD and DMPP, Agric, Ecosyst. Environ., 216, 1–8, 2016.
Giltrap, D. L., Saggar, S., Singh, J., Harvey, M., McMillan, A., and Laubach, J.: Field-scale verification of nitrous oxide emission reduction with DCD in dairy-grazed pasture using measurements and modelling, Soil Res., 49, 696–702, https://doi.org/10.1071/SR11090, 2011.
Grant, R. F.: A technique for estimating denitrification rates at different soil temperatures, water contents and nitrate concentrations, Soil Sci., 152, 41–52, 1991.
Grant, R. F.: Simulation of ecological controls on nitrification, Soil Biol. Biochem., 26, 305–315, 1994.
Grant, R. F.: Mathematical modelling of nitrous oxide evolution during nitrification, Soil Biol. Biochem., 27, 1117–1125, 1995.
Grant, R. F. and Pattey, E.: Mathematical modelling of nitrous oxide emissions from an agricultural field during spring thaw, Global Biogeochem. Cy., 13, 679–694, 1999.
Grant, R. F. and Pattey, E.: Temperature sensitivity of N2O emissions from fertilized agricultural soils: mathematical modelling in ecosys, Global Biogeochem. Cy., 22, GB4019, https://doi.org/10.1029/2008GB003273, 2008.
Grant, R. F., Pattey, E. M., Goddard, T. W., Kryzanowski, L. M., and Puurveen, H.: Modelling the effects of fertilizer application rate on nitrous oxide emissions from agricultural fields, Soil Sci Soc. Amer. J., 70, 235–248, 2006.
Grant, R. F., Neftel, A., and Calanca, P.: Ecological controls on N2O emission in surface litter and near-surface soil of a managed grassland: modelling and measurements, Biogeosciences, 13, 3549–3571, https://doi.org/10.5194/bg-13-3549-2016, 2016.
Guardia, G., Marsden, K. A., Vallejo, A., Jones, D. L., and Chadwick, D. R.: Determining the influence of environmental and edaphic factors on the fate of the nitrification inhibitors DCD and DMPP in soil, Sci. Total Environ., 624, 1202–1212, 2018.
IPCC: Refinement to the 2006 IPCC guidelines for national greenhouse gas inventories, available at: https://www.ipcc.ch/, last access: 9 July 2019.
Janke, C. K., Fujinuma, R., Moody, P., and Bell, M. J.: Biochemical effects of banding limit the benefits of nitrification inhibition and controlled-release technology in the fertosphere of high N-input systems, Soil Res., 57, 28–40, https://doi.org/10.1071/SR18211, 2019.
Kariyapperuma, K. A., Furon, A., and Wagner-Riddle, C.: Non-growing season nitrous oxide fluxes from an agricultural soil as affected by application of liquid and composted swine slurry, Can. J. Soil Sci., 92, 315–327, 2012.
Kelliher, F. M., Clough, T. J., Clark, H., Rys, G., and Sedcole, J. R.: The temperature dependence of dicyandiamide (DCD) degradation in soils: a data synthesis, Soil Biol. Biochem., 40, 878–1882, 2008.
Lam, S. K., Suter, H., Mosier, A. R., and Chen, D.: Using nitrification inhibitors to mitigate agricultural N2O emission: a double-edged sword?, Glob. Change Biol., 23, 485–489, 2017.
Li, Y., Shah, S. H. H., and Wang, J.: Modelling nitrification inhibitor effects on emissions of nitrous oxide (N2O) in the UK, Sci. Total Environ., 709, 136156, https://doi.org/10.1016/j.scitotenv.2019, 2020.
Lin, S., Hernandez-Ramirez, G., Kryzanowski, L., Wallace, T., Grant, R., Degenhardt, R., Berger, N., Lohstraeter , G., and Powers, L.-A.: Timing of Slurry Injection and Nitrification Inhibitors Impacts on Nitrous Oxide Emissions and Nitrogen Transformations in a Barley Crop, Soil Sci. Soc. Amer. J., 81, 1595–1605 https://doi.org/10.2136/sssaj2017.03.0093, 2018.
Merino, P., Menéndez, S., Pinto, M., González-Murua, C., and Estavillo, J. M.: 3, 4-Dimethylpyrazole phosphate reduces nitrous oxide emissions from grassland after slurry application, Soil Use Manage, 21, 53–57, 2005.
Metivier, K. A., Pattey, E., and Grant, R. F.: Using the ecosys mathematical model to simulate temporal variability of nitrous oxide emissions from a fertilized agricultural soil, Soil Biol. Biochem., 41, 2370–2386, 2009.
Nguyen, Q. V., Wu, D., Kong, X., Bol, R., Petersen, S. O., Jensen, L. S., Liu, S., Brüggemann, N., Glud, R. N., Larsen, M., and Bruun, S.: Effects of cattle slurry and nitrification inhibitor application on spatial soil-dynamics and N2O production pathways, Soil Biol. Biochem., 11, 200–209, 2017.
Owens, J., Clough, T. J., Laubach, J., Hunt, J. E., and Venterea, R. T.: Nitrous oxide fluxes and soil oxygen dynamics of soil treated with cow urine, Soil Sci. Soc. Amer. J., 81, 289–298, https://doi.org/10.2136/sssaj2016.09.0277, 2017.
Pfab, H., Palmer, I., Buegger, F., Fiedler, S., Muller, T., and Ruser, R.: Influence of a nitrification inhibitor and of placed N-fertilization on N2O fluxes from a vegetable cropped loamy soil, Agr. Ecosyst. Environ., 150, 91–101, 2012.
Qiao, C., Liu, L., Hu, S., Compton, J. E., Greaver, T. L., and Li, Q.: How inhibiting nitrification affects nitrogen cycle and reduces environmental impacts of anthropogenic nitrogen input, Glob. Change Biol., 21, 1249–1257, 2015.
Rochette, P., Angers, D. A., Chantigny, M. H., Bertrand, N., and Côté, D.: Carbon dioxide and nitrous oxide emissions following fall and spring applications of pig slurry to an agricultural soil, Soil Sci. Soc. Amer. J., 68, 1410–1420, 2004.
Rodhe, L., Pell, M., and Yamulki, S.: Nitrous oxide, methane and ammonia emissions following slurry spreading on grassland, Soil Use Manage., 22, 229–237, https://doi.org/10.1111/j.1475-2743.2006.00043.x, 2006.
Ruser, R. and Schulz, R.: The effect of nitrification inhibitors on the nitrous oxide (N2O) release from agricultural soils – a review, J. Plant Nutr. Soil Sci., 178, 171–188, 2015.
Saxton, K. E., Rawls, W. J., Romberger, J. S., and Papendick, R. I.: Estimating generalized soil-water characteristics from texture, Soil Sci. Soc. Amer. J., 50, 1031–1036, 1986.
Smith, K. A., Beckwith, C. P., Chalmers, A. G., and Jackson, D. R.: Nitrate leaching following autumn and winter application of animal manures to grassland, Soil Use Manage., 18, 428–434, 2002.
Subbarao G. V., Ito, O., Sahrawat, K. L., Berry, W. L., Nakahara, K., Ishikawa, T., Watanabe, T., Suenaga, K., Rondon, M., and Rao, I. M.: Scope and strategies for regulation of nitrification in agricultural systems: challenges and opportunities, Crit. Rev. Plant Sci., 25, 303–335, 2006.
Teepe, R., Vor, A., Beese, F., and Ludwig, B.: Emissions of N2O from soils during cycles of freezing and thawing and the effects of soil water, texture and duration of freezing, Euro. J. Soil Sci., 55, 357–365, 2004.
VanderZaag, A. C., Jayasundara, S., and Wagner-Riddle, C.: Strategies to mitigate nitrous oxide emissions from land applied manure, Animal Feed Sci. Tech., 166/167, 464–479, 2011.
Wagner-Riddle, C. and Thurtell, G. W.: Nitrous oxide emissions from agricultural fields during winter and spring thaw as affected by management practices, Nutr. Cycl. Agroecosyst., 52, 151–163, 1998.
Wagner-Riddle, C., Rapai, J., Warland, J., and Furon, A.: Nitrous oxide fluxes related to soil freeze and thaw periods identified using heat pulse probes, Can. J. Soil Sci., 90, 409–418, 2010.
Zhu, K., Bruun, S., and Jensen, L. S.: Nitrogen transformations in and N2O emissions from soil amended with slurry solids and nitrification inhibitor, Euro. J. Soil Sci., 67, 792–803, 2016.