the Creative Commons Attribution 4.0 License.
the Creative Commons Attribution 4.0 License.
 | 17 Jan 2020
Bacterial degradation activity in the eastern tropical South Pacific oxygen minimum zone
Marie Maßmig
Jan Lüdke
Gerd Krahmann
Oxygen minimum zones (OMZs) show distinct biogeochemical processes that relate to microorganisms being able to thrive under low or even absent oxygen. Microbial degradation of organic matter is expected to be reduced in OMZs, although quantitative evidence is low. Here, we present heterotrophic bacterial production (3H leucine incorporation), extracellular enzyme rates (leucine aminopeptidase/β-glucosidase) and bacterial cell abundance for various in situ oxygen concentrations in the water column, including the upper and lower oxycline, of the eastern tropical South Pacific off Peru. Bacterial heterotrophic activity in the suboxic core of the OMZ (at in situ ≤ 5 µmol O2 kg−1) ranged from 0.3 to 281 µmol C m−3 d−1 and was not significantly lower than in waters of 5–60 µmol O2 kg−1. Moreover, bacterial abundance in the OMZ and leucine aminopeptidase activity were significantly higher in suboxic waters compared to waters of 5–60 µmol O2 kg−1, suggesting no impairment of bacterial organic-matter degradation in the core of the OMZ. Nevertheless, high cell-specific bacterial production was observed in samples from oxyclines, and cell-specific extracellular enzyme rates were especially high at the lower oxycline, corroborating earlier findings of highly active and distinct micro-aerobic bacterial communities. To assess the impact of bacterial degradation of dissolved organic matter (DOM) for oxygen loss in the Peruvian OMZ, we compared diapycnal fluxes of oxygen and dissolved organic carbon (DOC) and their microbial uptake within the upper 60 m of the water column. Our data indicate low bacterial growth efficiencies of 1 %–21 % at the upper oxycline, resulting in a high bacterial oxygen demand that can explain up to 33 % of the observed average oxygen loss over depth. Our study therewith shows that microbial degradation of DOM has a considerable share in sustaining the OMZ off Peru.
- Article
(6122 KB) - Full-text XML
-
Supplement
(997 KB) - BibTeX
- EndNote


In upwelling zones at eastern continental margins, oxygen minimum zones (OMZs) with hypoxic (<60 µmol O2 kg−1), suboxic (<5 µmol O2 kg−1) or even anoxic conditions occur (Gruber, 2011; Thamdrup et al., 2012; Tiano et al., 2014). OMZs have expanded over the past years resulting in an ∼ 3.7 % increase in hypoxic waters at a depth (200 dbar) between 1960 and 2008 (Stramma et al., 2010). One of the largest anoxic water masses in the global ocean (2.4×10¹³ m3) is located in the eastern tropical South Pacific and includes the Peruvian upwelling system (Kämpf and Chapman, 2016; Paulmier and Ruiz-Pino, 2009; Thamdrup et al., 2012). There, nutrient-rich water is upwelled and supports high rates of primary production and accumulation of organic matter. Biological degradation of organic matter subsequently reduces oxygen below the surface mixed layer (Kämpf and Chapman, 2016). As a consequence, and supported by sluggish ventilation of water masses, a permanent OMZ forms between 100 and 500 m depth, with upper and lower boundaries, i.e., oxyclines, varying within seasonal and inter-annual cycles (Czeschel et al., 2011; Graco et al., 2017; Kämpf and Chapman, 2016). In austral winter, upwelling and subsequently the nutrient supply to the surface waters increase (Bakund and Nelson, 1991; Echevin et al., 2008). However, chlorophyll a (Chl a) concentration is highest in austral summer, with the seasonal amplitude being stronger for surface- than for depth-averaged Chl a concentrations (Echevin et al., 2008). In winter, phytoplankton growth is, next to iron, mainly limited by light due to the deeper mixing, whereas in summer macronutrients can become a limiting factor (Echevin et al., 2008). Further, the El Niño–Southern Oscillation may affect organic-matter cycling in the area since it affects the depth of the oxycline and therefore the extent of anaerobic processes in the upper water column (Llanillo et al., 2013). During the year of this study (2017), neither a strong La Niña nor a strong El Niño was detected (https://ggweather.com/enso/oni.htm, last access: 7 September 2019). However, in January, February and March 2017, there was a strong coastal El Niño with enhanced warming (+1.5 ∘C) of sea surface temperatures in the eastern Pacific (Garreaud, 2018).
Within OMZs, enhanced vertical carbon export has been observed (Devol and Hartnett, 2001; Roullier et al., 2014) and explained by a potentially reduced remineralization of organic matter in suboxic and anoxic waters. This is possibly because microbes apply anaerobic respiratory pathways that yield less metabolic energy compared to aerobic respiration. For instance, denitrification or dissimilatory nitrate reduction to ammonia (DNRA) result only in 99 % or 64 % of the energy (kJ) per oxidized carbon atom that is produced by aerobic respiration (Lam and Kuypers, 2011). Additionally, the energy yield available for the production of cell mass seems to be less than expected from the chemical equations (Strohm et al., 2007). Meanwhile, bacteria are mainly responsible for the remineralization of organic matter into nutrients and carbon dioxide (CO2) in the ocean (Azam et al., 1983). Thus, microbial activity and consequently organic-matter remineralization in suboxic and anoxic waters might be reduced, possibly explaining the enhanced export of carbon. As a consequence, expanding OMZs could result in increased CO2 storage in the ocean.
During the degradation process, low molecular-weight (LMW < 1 kDa) organic compounds can directly be taken up by bacteria (Azam et al., 1983; Weiss et al., 1991). However, in the ocean, bioavailable organic matter is commonly in the form of particulate organic matter or high molecular-weight (HMW) DOM (Benner and Amon, 2015). To access this organic-matter pool, bacteria produce extracellular, substrate-specific enzymes that hydrolyze polymers into LMW units (Hoppe et al., 2002). Taken up, organic matter is partly incorporated into bacterial biomass, or respired to CO2, which may escape to the atmosphere (Azam et al., 1983). Rates of enzymatic organic-matter hydrolysis or bacterial production are controlled by the environment, i.e., temperature and pH, but can be actively regulated, e.g., in response to changing organic-matter supply and quality (Boetius and Lochte, 1996; Grossart et al., 2006; Pantoja et al., 2009; Piontek et al., 2014). However, the effect of oxygen concentration, which dictates the respiratory pathway and thus energy gain, on bacterial production and the expression of extracellular enzymes in aquatic systems is poorly understood. For instance, bacterial production was higher in anoxic lake waters (Cole and Pace, 1995), whereas in the Pacific waters off Chile, bacterial production and DOM decomposition rates did not change in relation to oxygen concentrations (Lee, 1992; Pantoja et al., 2009). Investigations of hydrolysis rates as the initial step of organic-matter degradation may help to unravel possible adaptation strategies of bacterial communities to suboxic and anoxic conditions (Hoppe et al., 2002). High extracellular enzyme rates might compensate for a putative lower energy yield of anaerobic respiration and the subsequent biogeochemical effects. However, very few studies have investigated the effect of oxygen on hydrolytic rates, so far. Hoppe et al. (1990) did not find differences between oxic and anoxic incubations of Baltic Sea water. In the Cariaco Basin, hydrolytic rates were significantly higher in oxic compared to anoxic water (Taylor et al., 2009). However, this difference did not persist after rates were normalized to particulate organic-matter concentration. The dependence of hydrolysis rates on organic-matter concentrations described by Taylor et al. (2009) suggests that productivity may play a role for extracellular enzymatic rates in oxygen-depleted systems. The Peruvian upwelling system displays high amounts of labile organic matter (Loginova et al., 2019) at shallow oxyclines and thus allows for studying effects of low oxygen on extracellular enzyme rates under substrate-replete conditions. In general, combined investigations of extracellular enzyme rates, bacterial production (measured by 3H leucine incorporation) and carbon fluxes sampled at various in situ oxygen concentrations are still lacking. These data, however, are crucial to inform ocean biogeochemical models that aim at a quantification of CO2 uptake and nitrogen loss processes in oxygen-depleted areas.
We studied bacterial degradation of organic matter in the OMZ off Peru during an extensive sampling campaign in the austral winter 2017. We determined rates of total and cell-specific bacterial production (3H leucine incorporation) as well as of leucine aminopeptidase (LAPase) and β-glucosidase (GLUCase). We estimate bacterial utilization of DOC supplied by diapycnal transport into the OMZ and discuss the contribution of bacterial degradation activity to the formation and persistence of the OMZ off Peru.
2.1 Study site and CTD (conductivity, temperature, depth) measurements
Samples were taken during the cruises M136 and M138 on the R/V METEOR off Peru in April and June 2017, respectively (Fig. 1). Seawater was sampled with 24 Niskin bottles (10 L) on a general oceanic rosette system. At each station, 5 to 11 depths were sampled between 3 and 800 m (Supplement, Table S1). Oxygen concentrations, temperature and depth were measured with a Sea-Bird SBE 9-plus CTD system (Sea-Bird Electronics, Inc., USA). Oxygen concentrations at each depth were determined with an SBE 43 oxygen sensor, calibrated with Winkler titrations (Winkler, 1888), resulting in an overall accuracy of 1.5 µmol kg−1 oxygen. Chl a fluorescence was detected with a WETStar Chl a sensor (WET Labs, USA) and converted to µg L−1 using factors given by the manufacturer (WET Labs).
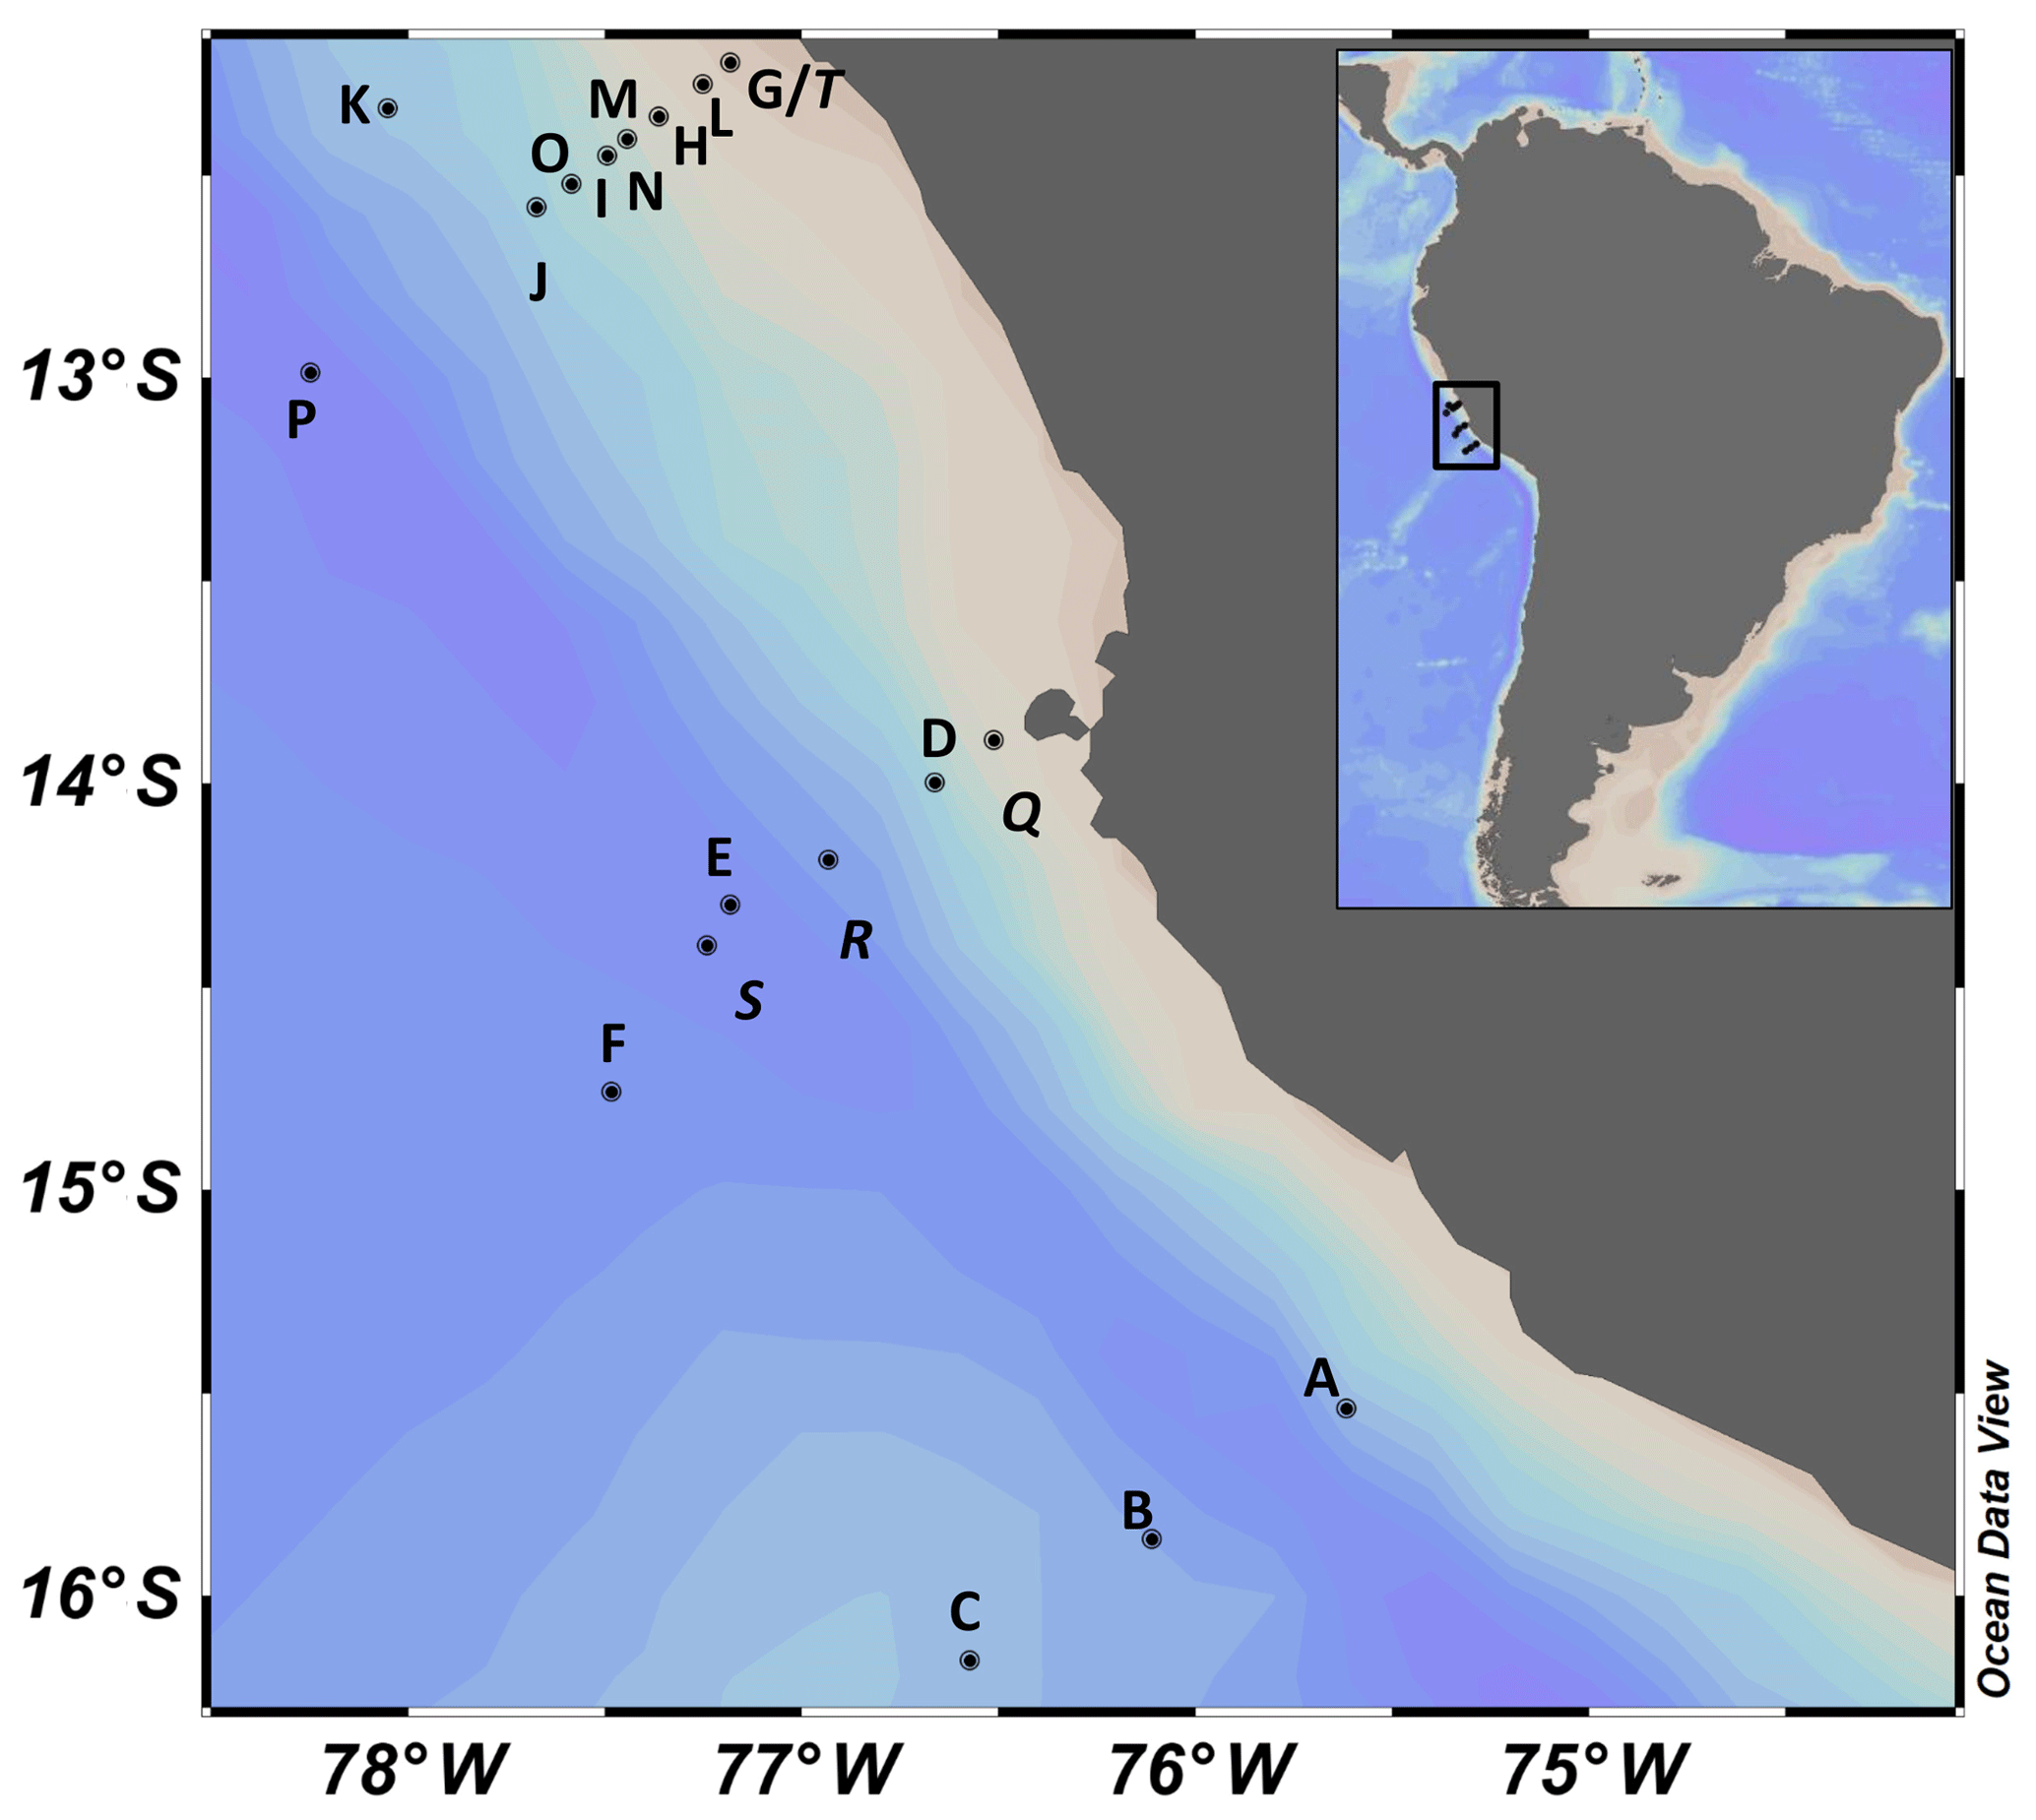
Figure 1Station map. All presented stations in the eastern tropical South Pacific off Peru sampled in 2017. For detailed information about the stations, see Table S1.
2.2 Dissolved organic carbon, total dissolved nitrogen, dissolved hydrolyzable amino acids and dissolved high molecular-weight carbohydrates
DOC and total dissolved nitrogen (TDN) samples were taken at all stations, whereas the further analysis of DOC data was limited to stations with compatible bacterial production data and turbulence measurements (stations G–T). For DOC and TDN 20 mL of seawater was sampled in replicates, whereas both replicates were only analyzed in the case of conspicuous data. Samples were filtered through a syringe filter (0.45 µm glass microfiber GD/X membrane, Whatman™) that was rinsed with 50 mL sample, into a combusted glass ampoule (8 h, 500 ∘C). Before sealing the ampoules, 20 µL of 30 % ultrapure hydrochloric acid were added. Samples were stored at 4 ∘C in the dark for 3 months until analyses. DOC and TDN were analyzed using a TOC–VCSH with a TNM-1 detector (Shimadzu), applying a high-temperature catalytic oxidation method modified from Sugimura and Suzuki (1988). The instrument was calibrated with potassium hydrogen phthalate standard solutions (0 to 416.7 µmol C L−1) (Merck 109017) and a potassium nitrate standard solution (0–57.1 µmol N L−1) (Merck 105065). The instrument blank was examined with reference seawater standards (Hansell laboratory RSMAS University of Miami). The relative standard deviation (RSD) between repeated measurements is <1.1 % and <3.6 %, and the detection limit is 1 and 2 µmol L−1 for DOC and TDN, respectively.
At each station replicate, 4 and 16 mL samples for the analysis of dissolved amino acids (DHAAs) and dissolved combined carbohydrates (DCHOs) were filtered through a rinsed Acrodisc® 0.45 µm GHP membrane (Pall) and stored in combusted vials (8 h, 500 ∘C) at −20 ∘C. Replicates were only analyzed if the first sample analyses resulted in conspicuous data. The following DHAAs were analyzed: alanine, arginine, glycine, leucine, phenylalanine, serine, threonine, tyrosine, valine, aspartic acid + asparagine (co-eluted), glutamine + glutamic acid (co-eluted), γ-aminobutyric acid and isoleucine. DHAA samples were analyzed with a high-performance liquid chromatograph (1260 HPLC system, Aglient Technologies) using a C18 column (Phenomex Kinetex) after in-line ortho-phthaldialdehyde derivatization with mercaptoethanol after Lindroth and Mopper (1979) and Dittmar et al. (2009) with slight modifications after Engel and Galgani (2016). DCHO samples were desalted by membrane dialysis (1 kDa, Spectra Por) and analyzed with a high-performance anion exchange chromatography (HPAEC) (DIONEX ICS3000DC) after Engel and Händel (2011). The detection limit of DHAA was 1.4 nmol L−1 depending on amino acid and 10 nmol L−1 for DCHO. The precision was 2 % and 5 % for DHAA and DCHO, respectively.
2.3 Diapycnal fluxes of oxygen and dissolved organic carbon
In this study, we calculated DOC and oxygen loss rates (mmol m−3 d−1) from the changes in diapycnal fluxes over depth. Therefore, oxygen and DOC profiles were used (stations G–T), excluding the mixed layer, defined by temperature deviating ≤0.2 ∘C from the maximum, but excluding at least the upper 10 m. The diapycnal flux (ΦS) was calculated for each CTD (Fischer et al., 2013; Schafstall et al., 2010) assuming a constant gradient between two sampled depths for DOC and oxygen:
where ∇CS is the gradient (mol m−4). The diapycnal diffusivity of mass (Kρ) (m2 s−1) was assumed to be constant (10−3 m2 s−1), which is reasonable compared with turbulence measurements by a freefalling microstructure probe (see the methods in the Supplement and Fig. 2a). DOC loss rates (∇ΦDOC; mmol m−3 d−1) and oxygen loss rates (∇ΦDO; mmol m−3 d−1) were assumed to be equal to the negative vertical divergence of ΦS calculated from the mean diapycnal flux profile, implying all other physical supply processes to be negligible.
2.4 Bacterial abundance
Bacterial abundance was sampled in replicates at each station, whereas replicates were only analyzed in exceptions. Abundance was determined by flow cytometry after Gasol and Del Giorgio (2000) from 1.6 mL sample, fixed with 0.75 µL 25 % glutaraldehyde on board and stored at −80 ∘C for a maximum of 3 months until analyses. Prior to analysis samples were thawed and 10 µL Flouresbrite® fluorescent beads (Polyscience, Inc.) and 10 µL Sybr Green (Invitrogen) (final concentration: 1× of the 1000× Sybr Green concentrate) were added to 400 µL sample. Cells were counted on a FACS Calibur (Becton Dickinson), calibrated with TruCount Beads™ (BD) with a measurement error of 2 % RSD.
2.5 Bacterial production, oxygen demand and growth efficiency
For bacterial production, the incorporation of radioactive labeled leucine (3H) (specific activity 100 Ci mmol−1, Biotrend) was measured (Kirchman et al., 1985; Smith and Azam, 1992) at all depths of stations G–T as replicates. For this, the radiotracer at a saturating final concentration of 20 nmol L−1 was added to 1.5 mL of sample and incubated for 3 h in the dark at 13 ∘C. Controls were poisoned with trichloracetic acid. Samples were measured with a liquid scintillation counter (Hidex 300 SL, TriathalerTM, FCI). Samples taken at in situ oxygen concentrations of <5 µmol kg−1 were incubated under anoxic conditions by gentle bubbling with gas (0.13 % CO2 in pure N2). Samples from oxic waters were incubated with head space, without bubbling. All samples were shaken thoroughly in between; therefore, the bubbling of just one treatment would not have any effect. 3H-leucine uptake was converted to carbon units applying a conversion factor of 1.5 kg C mol−1 leucine (Simon and Azam, 1989). An analytical error of 5.2 % RSD was estimated with triplicate calibrations. Samples with an SD (standard deviation) >30 % between replicates were excluded.
The incubation of samples at a constant temperature of 13 ∘C resulted in deviations of max. 11 ∘C between incubation (Tincubation) and in situ temperatures (Tinsitu). In order to estimate in situ bacterial production from measured bacterial production during incubations, measured temperature differences were taken into account following the approach of López-Urrutia and Morán (2007). First, the temperature difference between Tinsitu and Tincubation (δT) was computed in electron volt (eV−1), after Tinsitu and Tincubation (K) had been multiplied with the Boltzmann's constant eV K−1):
The decadal logarithm of in situ bacterial production (log 10BPinsitu) was then calculated from the decadal logarithm of measured bacterial production during incubations (log 10BPincubation). Therefore, we applied three different factors (F) depending on in situ Chl a concentration as proposed by López-Urrutia and Morán (2007), with F being −0.583, −0.5 and −0.42 (fgC cell−1 d−1 eV) for <0.5, 0.5–2 and >2 µg Chl a L−1, respectively:
The text, figures, equations and statistical results always refer to temperature-corrected in situ bacterial production. Temperature-corrected bacterial production and original bacterial production measured during incubation can be compared in Table S2.
The bacterial oxygen demand (BOD; mmol O2 m−3 d−1) is the amount of oxygen needed to fully oxygenize organic carbon that has been taken up and not transformed into biomass by bacterial production (mmol C m−3 d−1). The BOD was calculated as the difference between the estimated bacterial DOC uptake and the bacterial production applying a respiratory quotient (cf) of 1 (Eq. 4) (Del Giorgio and Cole, 1998).
The bacterial DOC uptake was calculated under two different assumptions: (i) the DOC uptake by bacteria equals the DOC loss rate over depth or (ii) the bacterial growth efficiency (BGE) follows the established temperature dependence (, ∘C), resulting in a BGE between 0.1 and 0.3 in the depth range of 10–60 m and an in situ temperature of 14 to 19 ∘C (Rivkin and Legendre, 2001), and it can be used to estimate the bacterial DOC uptake from bacterial production (Eq. 5).
2.6 Extracellular enzyme rates
Potential hydrolytic rates of LAPase and GLUCase were determined with fluorescent substrate analogs (Hoppe, 1983). L-leucine-7-amido-4-methylcoumarin (Sigma Aldrich) and 4-methylumbelliferyl-β-D-glucopyranoside (Acros Organics) were added in final concentrations of 1, 5, 10, 20, 50, 80, 100 and 200 µmol L−1 in black 69 well plates (Costar) and kept frozen for at most 1 d until replicates of 200 µL sample were added. After 0 and 12 h of incubation at 13 ∘C in the dark, fluorescence was measured with a plate reader fluorometer (FLUOstar Optima, BMG labtech) (excitation: 355 nm; emission: 460 nm). An error of 2 % RSD was defined using the calibration with triplicates. Blanks with MilliQ were performed to exclude an increase in substrate decay over time.
Samples were collected in replicates (n=2) at stations A–K and incubated directly after sampling under oxygen conditions resembling in situ oxygen conditions. For samples >5 µmol in situ O2 kg−1 incubations were conducted under atmospheric oxygen conditions. Samples <5 µmol in situ O2 kg−1 were incubated in a gastight incubator that had two openings to fill and flush it with gas. For our experiment the incubator was flushed and filled with N2 to reduce oxygen concentrations. Still, control measurements occasionally revealed oxygen concentrations of 8 to 40 µmol O2 kg−1. Additionally, samples were in contact with oxygen during pipetting and measurement. To investigate the influence of the different incubation methods we additionally incubated samples >5 µmol in situ O2 kg−1 under reduced oxygen concentrations. On average incubations under reduced oxygen concentration yielded 2 %–27 % higher values than those incubated under atmospheric oxygen conditions. However, the observed trends over depth remained similar (see discussion in the Supplement).
Calibration was conducted with 7-amino-4-methylcoumarin (2 nmol L−1 to 1 µmol L−1) (Sigma Aldrich) and 4-methylumbelliferone (Sigma Aldrich) (16 nmol L−1 to 1 µmol L−1) in seawater at atmospheric oxygen concentrations and under N2 atmosphere.
Maximum reaction velocity (Vmax) at saturating substrate concentrations was calculated using both replicates at once, with the simple ligand binding function in SigmaPlot™ 12.0 (Systat Software Inc., San Jose, CA). Values for Vmax with an SD > 30 % were excluded from further analyses. The degradation rate (δ) (µmol C m−3 d−1) of DHAA by LAPase and DCHO by GLUCase was calculated after Piontek et al. (2014):
where hr (% d−1) is the hydrolysis turnover at 103 µmol m−3 substrate concentration and c is the carbon content of DHAA (µmol C m−3). Measurements of hr with an SD between duplicates of more than 30 % were excluded. The same procedure was conducted with the carbon content of dissolved hydrolyzable leucine, instead of DHAA, to account for variations in leucine concentrations, which is the main amino acid hydrolyzed by LAPase.
Similar to bacterial production, in situ extracellular enzyme rates were estimated based on extracellular enzyme rates measured during incubation. To account for the differences between in situ and incubation temperatures a correction factor (F) was applied based on differences in extracellular enzyme rates after additional incubations at 22.4 ∘C next to the regular incubations at 13 ∘C at five stations during the cruises. The fluorescence signals at different substrate concentrations increased on average by a factor of 0.05 and 0.03 (∘C−1) for GLUCase and LAPase, respectively. Under the assumption that the increase in rates with temperature was linear, measured enzyme rates were adapted to in situ temperature, with EERinsitu (nmol L−1 h−1) and EERincubation being the in situ extracellular enzyme rates and extracellular enzyme rates during incubation, respectively:
The text, figures, equations and statistical results always refer to the temperature-corrected in situ extracellular enzyme rates. Temperature-corrected extracellular enzyme rates and original extracellular enzyme rates measured during incubation can be compared in Table S2.
2.7 Data analyses
Data were plotted with Ocean Data View 4.74 (Schlitzer, 2016), MATLAB (8.3.0.532 (R2014a)) and R version 3.4.2 using the package ggplot2 (Wickham, 2009; R Core Team, 2017). Statistical significances between different regimes (see Table S2 for mean and SD within different regimes and statistical results) were tested with a Wilcoxon test (W) and correlation with the Spearman rank correlation (S) in R version 3.4.2 (R Core Team, 2017) using the following R packages: FSA, car and multcomp (Ogle, 2017; Horthorn et al., 2008; Fox and Weisberg, 2011). For this, extracellular enzyme data of stations A–K and bacterial production data of stations G–T were used, since not all parameters could be sampled at all depth. Diapycnal fluxes of DOC and oxygen were calculated with MATLAB (8.3.0.532 (R2014a)) and the Toolbox Gibbs SeaWater (GSW) Oceanographic Toolbox (3.05) (McDougall and Barker, 2011).
Samples were categorized into different oxygen regimes. Due to the sensitivities of oxygen measurements, we did not distinguish between anoxic and suboxic regimes but defined the suboxic “OMZ” oxygen regime by a threshold ≤5 µmol O2 kg−1 (Gruber, 2011). We defined the oxycline as one regime (>5 to <60 µmol O2 kg−1) including the upper and lower oxycline or separated it into “low_hypoxic” (>5 to <20 µmol O2 kg−1) and “high_hypoxic” (>20 to <60 µmol O2 kg−1) regimes, representing important thresholds of oxygen concentrations for biological processes (Gruber, 2011). Oxygen concentrations >60 µmol O2 kg−1 were defined as “oxic”. Moreover, we partly differentiated between oxygen regimes situated above and below the OMZ (see Table S2 for results).
3.1 Biogeochemistry of the Peruvian OMZ
During our two cruises to the Peruvian upwelling system (Fig. 1), the maximum Chl a concentration was higher and temperatures were warmer in April compared to June 2017, probably representing seasonal variability. Chl a concentration reached up to 11 and 4 µg L−1 within the upper 25 m in April and June, respectively. Still, average Chl a concentrations at a depth <10 m (M136: 3.1±2.6 µg L−1; M138: 2.8±1.3 µg L−1) were not significantly different between the two cruises. At depths >50 m, Chl a concentration was generally below the detection limit (Figs. 3a and S1 in the Supplement). At a depth <10 m the water was warmer in April (21.3±1.6 ∘C) than in June (17.6±0.6 ∘C) (Figs. 3b, S1). An oxygen concentration >100 µmol kg−1 was observed in the surface mixed layer. Oxygen decreased steeply with depth, reached suboxic concentrations (<5 µmol kg−1) at m (Figs. 2c, 4a, 5a and S1) and fell below the detection of Winkler titration. For further analysis and within the text, in situ oxygen concentrations <5 µmol O2 kg−1 are referred to as “suboxic”. The shallowest depth with suboxic oxygen concentrations was 14 m in April (station Q) and 29 m in June (station D), probably reflecting that station Q was situated closer to the shore than station D. Oxygen increased again to up to 15 µmol kg−1 at >500 m (Figs. 4a, 5a and S1). TDN concentrations increased with depth from 18±8 and 22±7 µmol L−1 within the upper 20 m in April and June, respectively, and reached a maximum of 54 µmol L−1 at 850 m (Fig. 3c). DOC decreased with depth from 94±37 µmol L−1 and 69±12 µmol L−1 in the upper 20 m in April and June, respectively, to lowest values of 37 µmol L−1 at 850 m. The steepest gradient in DOC concentration was observed in the upper 20–60 m (Figs. 2b and 3d) during both cruises.
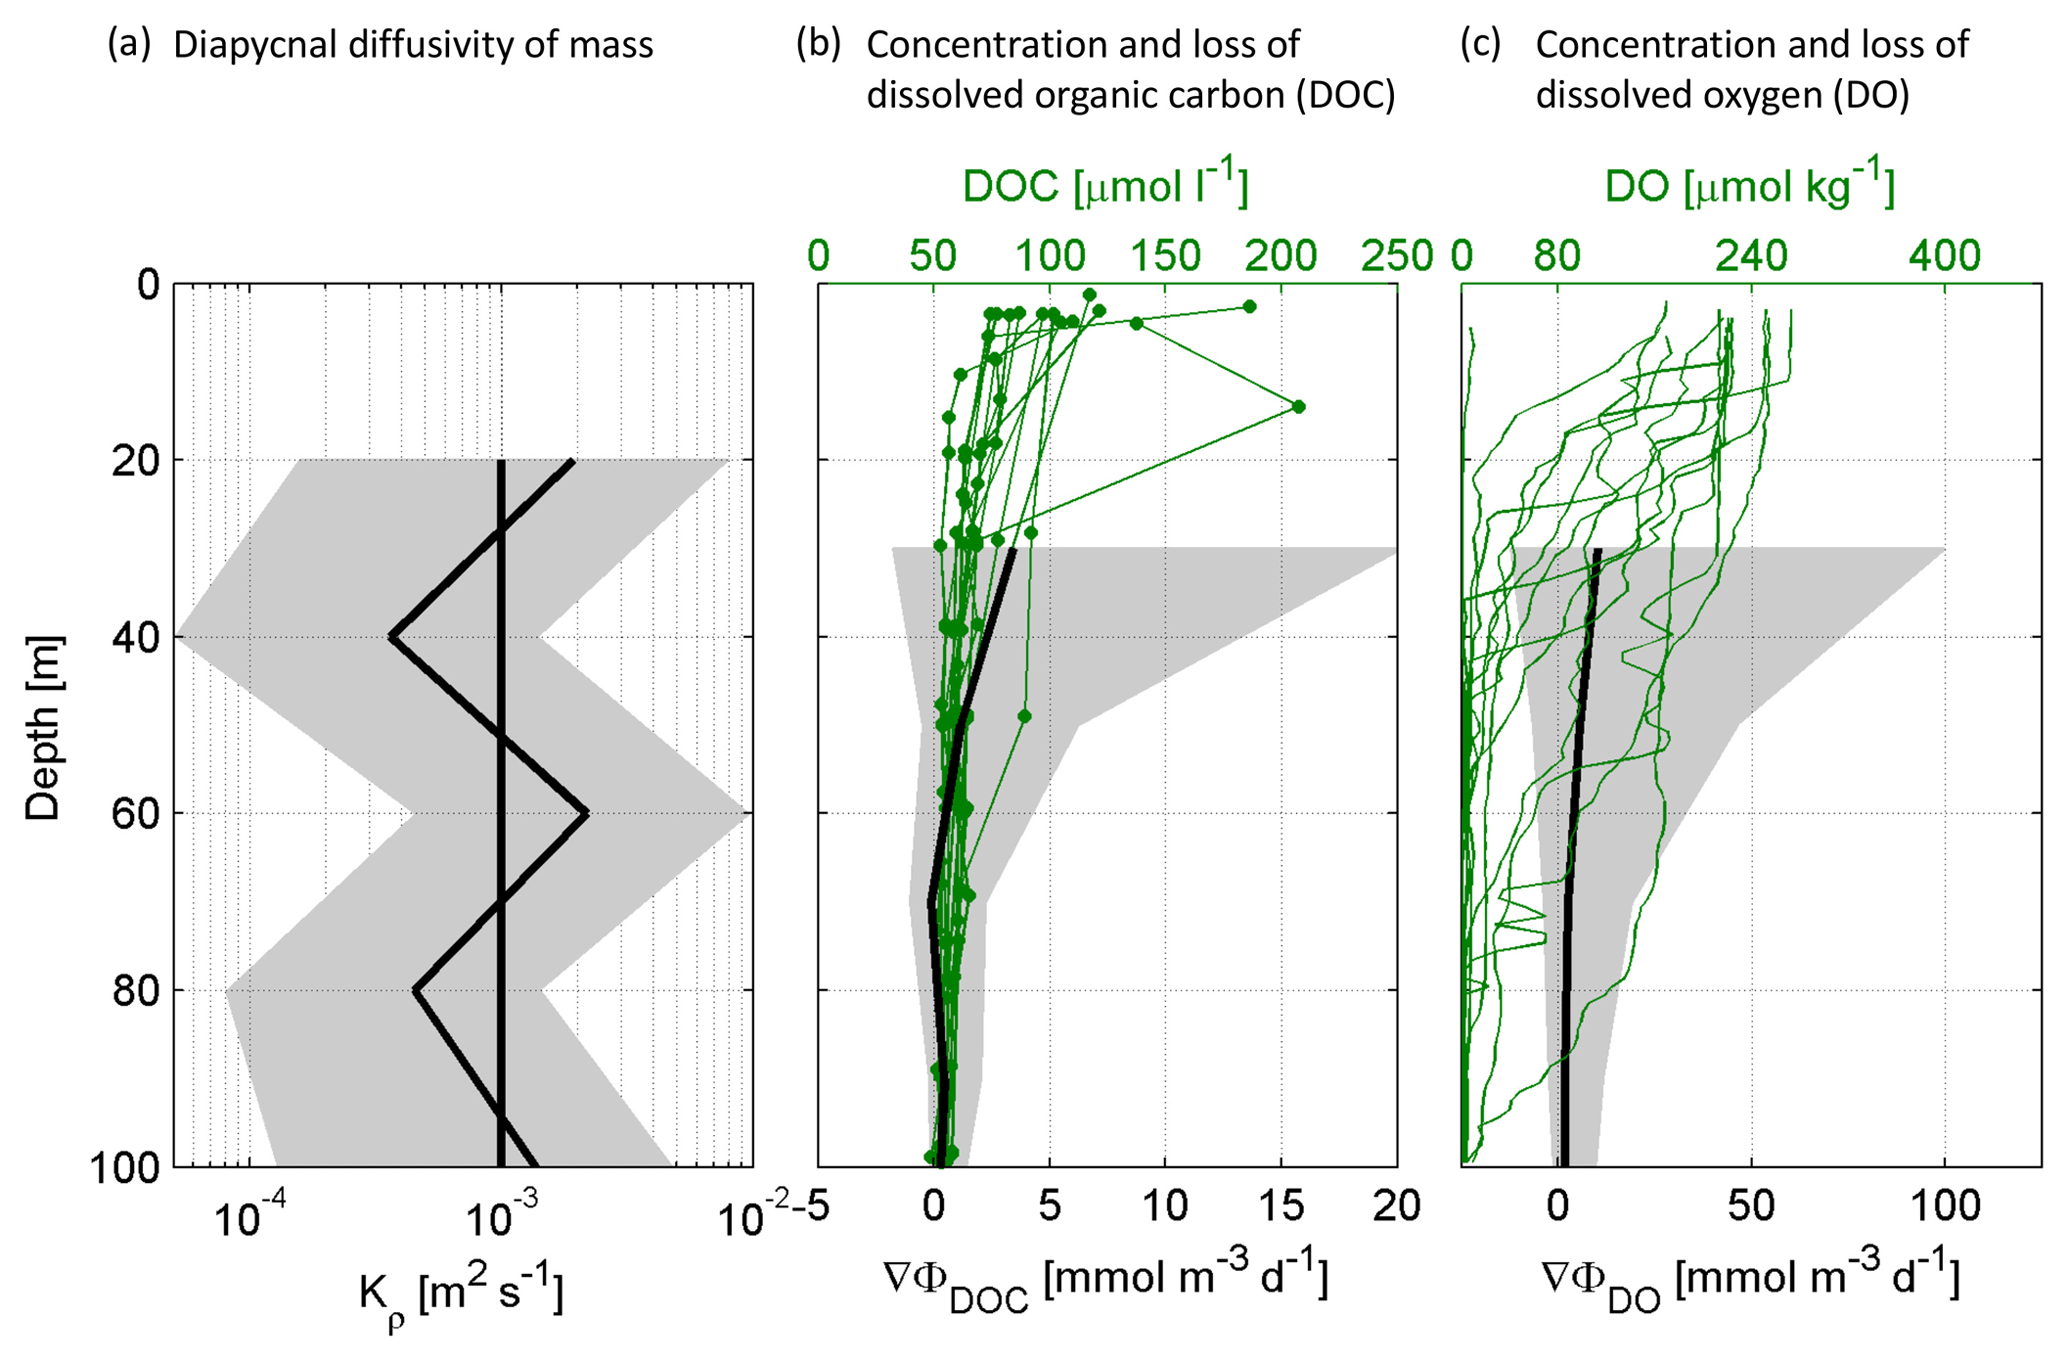
Figure 2Measured concentrations and calculated proxies for the change in dissolved organic carbon (DOC) and dissolved oxygen (DO) flux over depth for stations G–T: The average diapycnal diffusivity of mass (Kρ) over depth with confidence interval and the constant Kρ ( m2 s−1) that was used for further calculations (a). Concentrations of DOC in the upper 100 m and the resulting change in DOC flux over depth (∇Φ) (b). Concentrations of DO in the upper 100 m and the resulting change in DO flux over depth (∇Φ) (c).
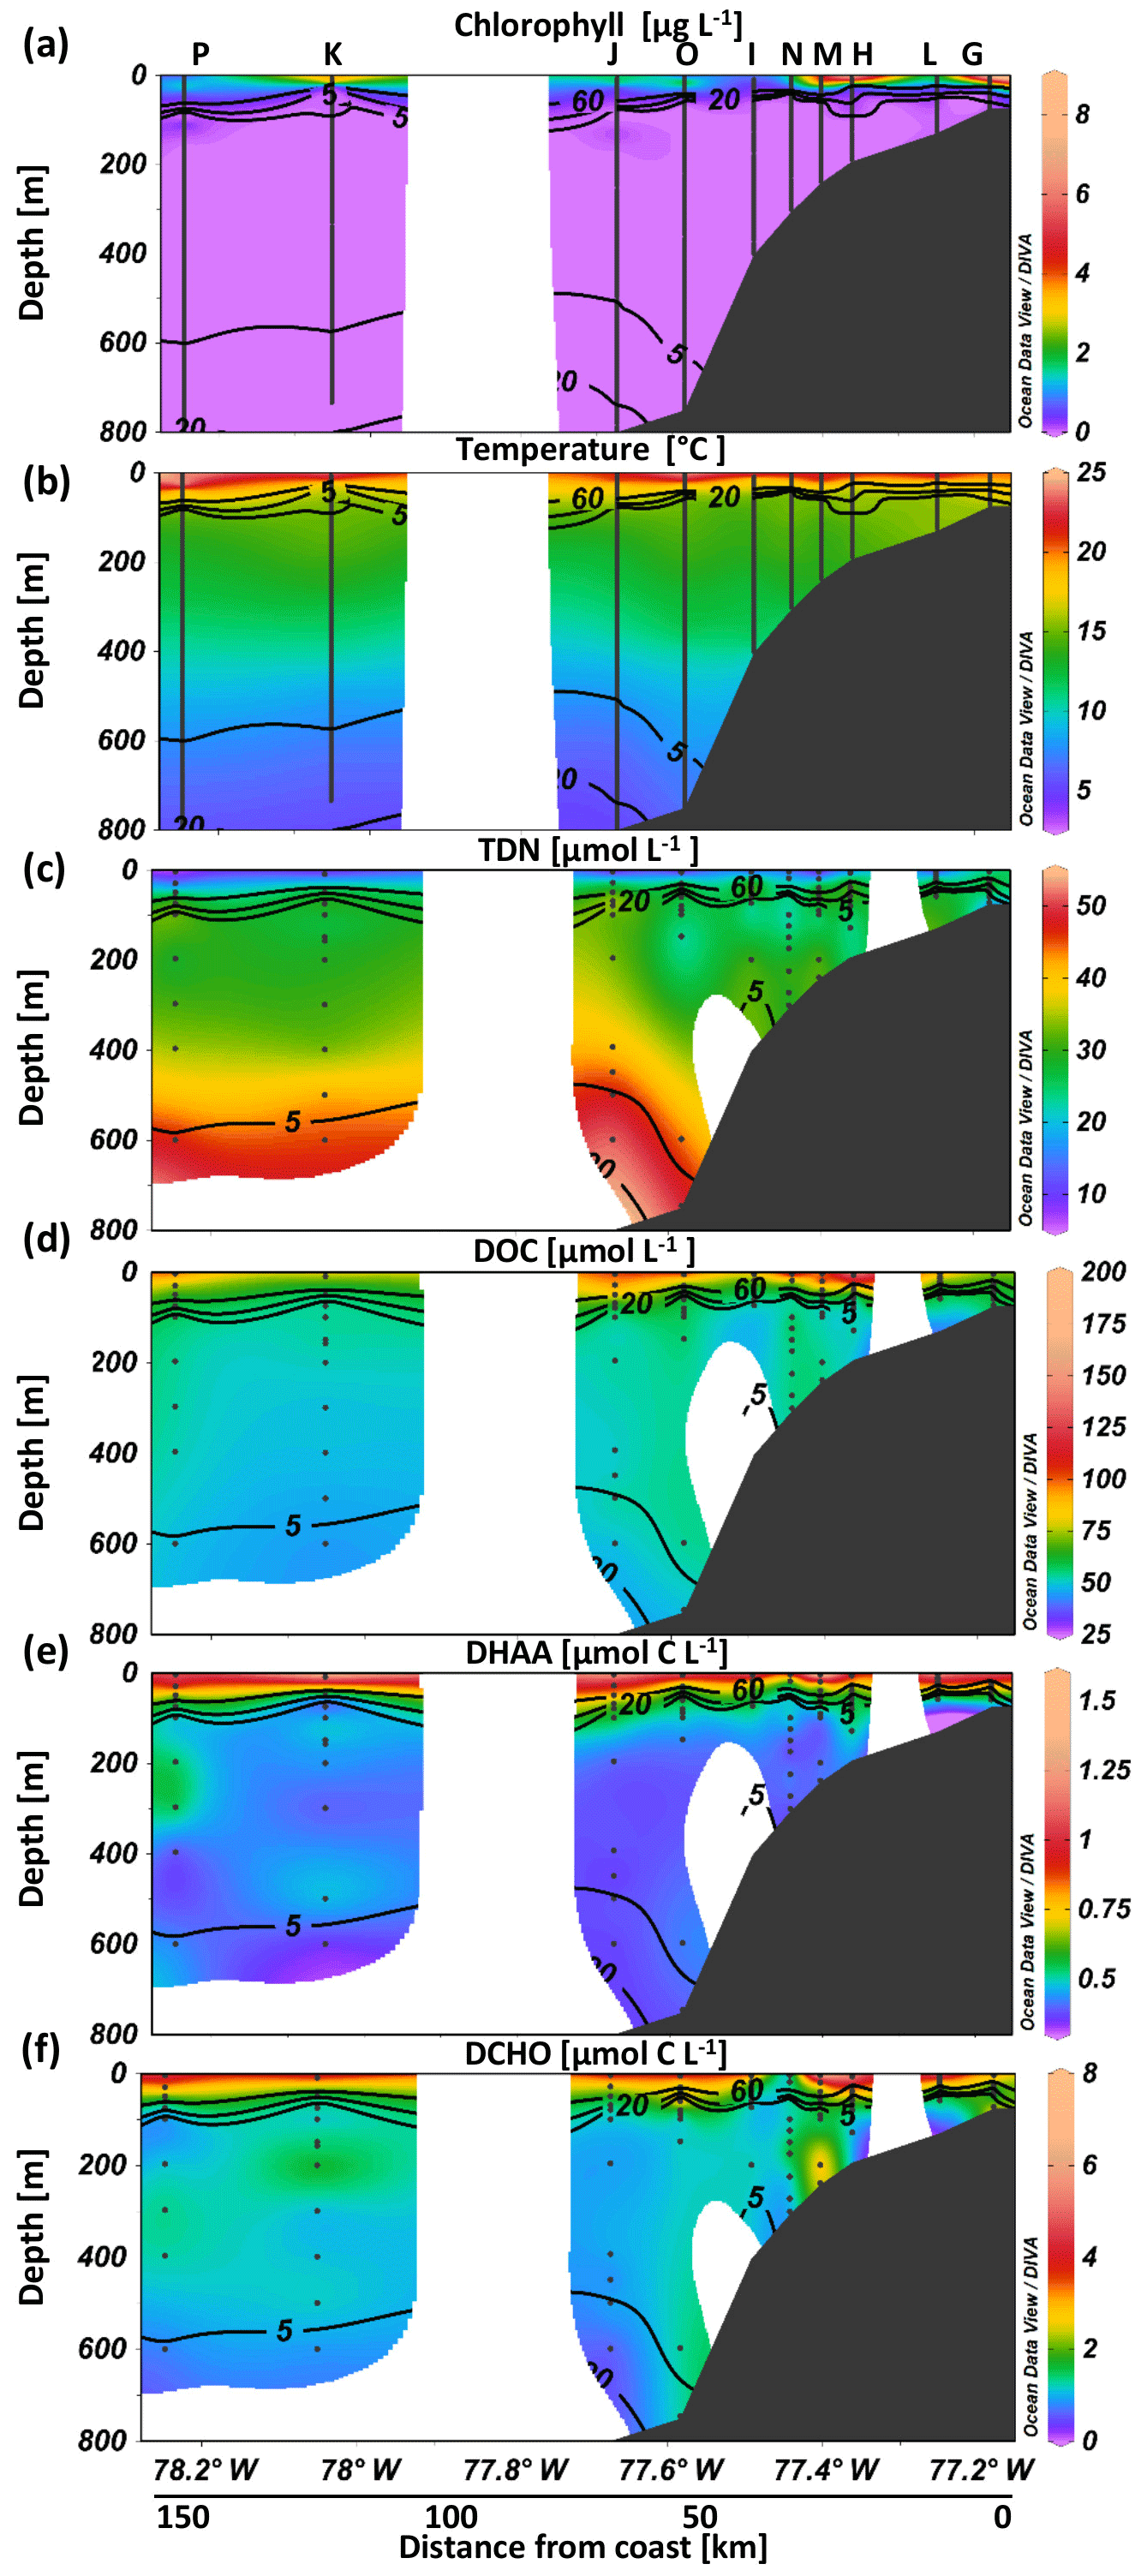
Figure 3Biotic and abiotic conditions at selected stations exemplary for the sampling conditions. Chlorophyll (a), temperature (b), total dissolved nitrogen (TDN) (c), dissolved organic carbon (DOC) (d), carbon content of dissolved hydrolyzable amino acids (DHAA) (e) and carbon content of high molecular-weight dissolved carbohydrates (DCHO) (f) over depth at different stations from on- to offshore off Peru.
3.2 Bacterial production and enzymatic activity
Bacterial production varied strongly throughout the study region and ranged from 0.2 to 2404 µmol C m−3 d−1 (Fig. 4b), decreased in general from surface to depth (except for the most coastal station), and showed significantly higher rates in the oxygenated surface compared to the OMZ (Fig. 4b). At the most coastal station (G) bacterial production remained high near the bottom depth of 75 m (280 µmol C m−3 d−1 at 72 m) (Fig. 4b). Bacterial production did not differ significantly between the oxyclines and the suboxic core waters, neither offshore (suboxic: 0.3–127 µmol C m−3 d−1; oxyclines: 1–304 µmol C m−3 d−1) nor at the most coastal stations (G and T) (suboxic: 146–281 µmol C m−3 d−1) (oxycline: 74–452 µmol C m−3 d−1) (see Table S2 for all statistical results). Further, no significant correlation was observed between bacterial production and oxygen at in situ < 20 µmol O2 kg−1 concentration. Additionally, significantly lower bacterial production was observed within the lower oxycline (0.7–3.3 µmol C m−3 d−1) compared to the core OMZ (0.3–281 µmol C m−3 d−1) even though oxygen increased from <5 to 15 µmol kg−1 (Fig. 4a, b). Trends between oxygen regimes were similar between temperature-corrected bacterial production (presented throughout the text) and original bacterial production measured during incubation (Table S2).
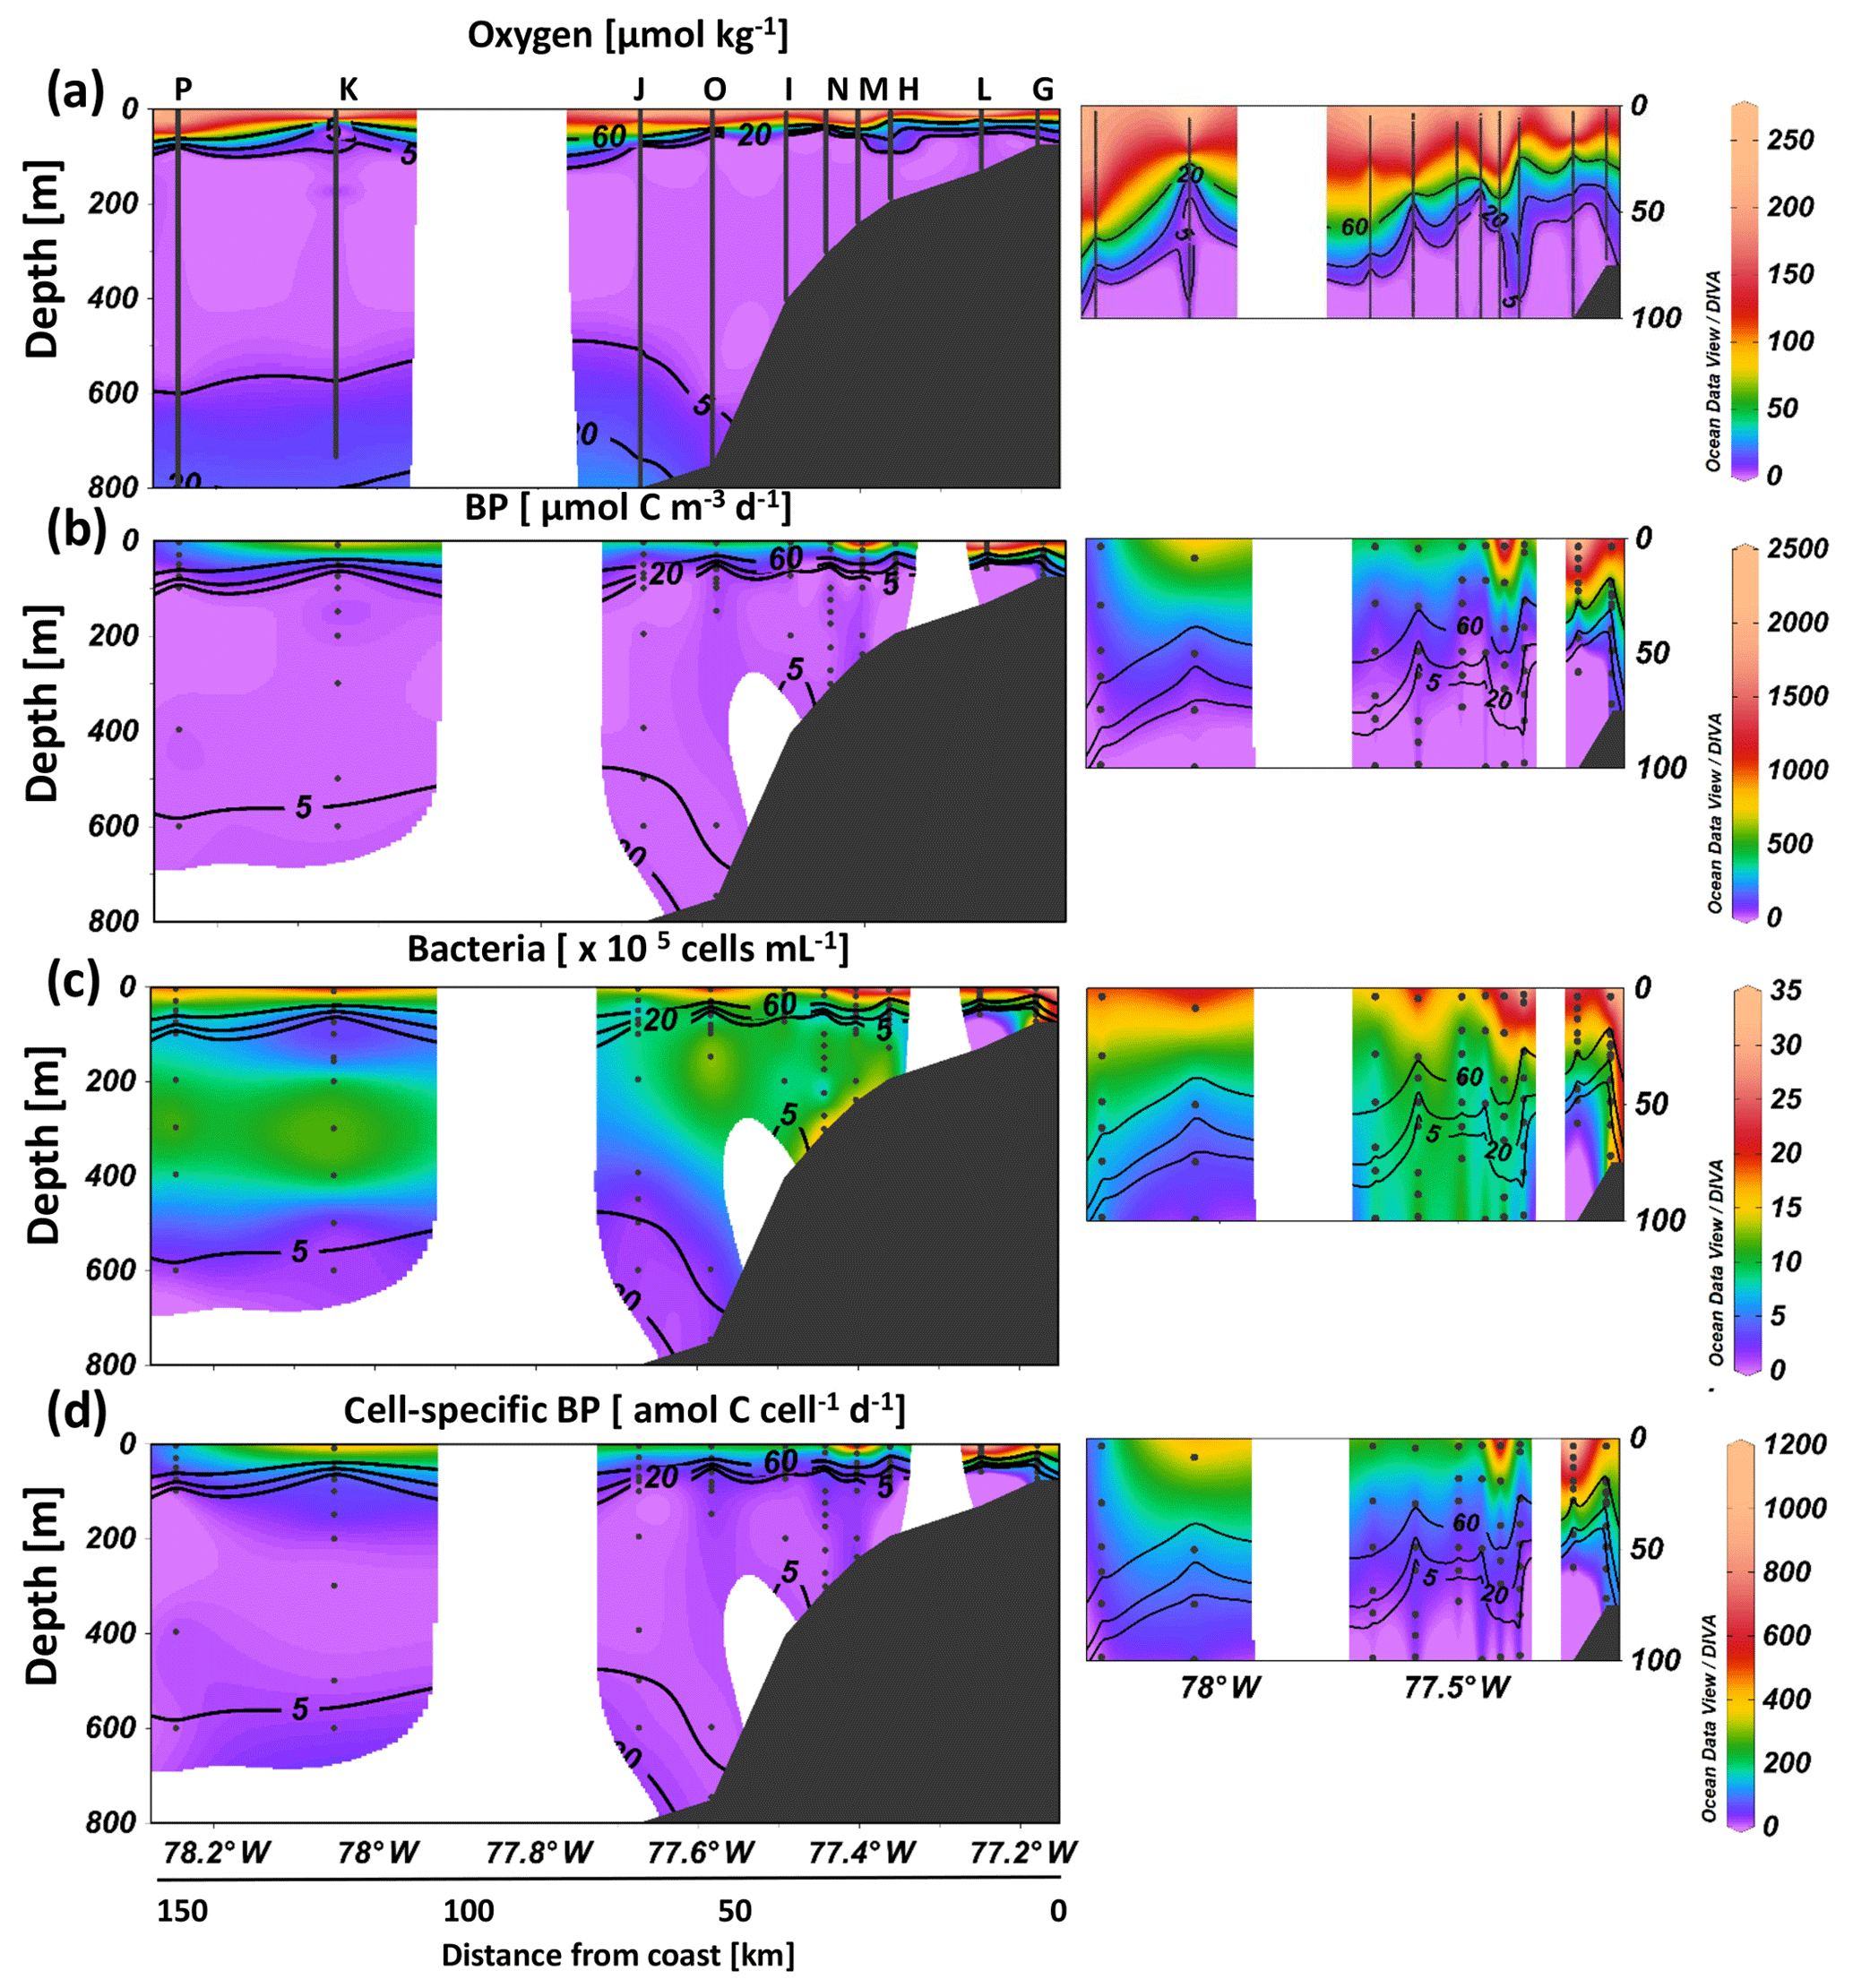
Figure 4Bacterial growth activity at different in situ oxygen concentrations from on- to offshore off Peru during April 2017 (M136). Oxygen concentrations (a), total bacterial production (BP) (b), bacterial abundance (c) and cell-specific BP (d) over the upper 800 m depth with a zoom in the upper 100 m (small plots).
Overall, bacterial abundance ranged from 1 to 49×105 cells mL−1, with the highest abundance observed at the surface and close to the sediment. Cell abundance in the oxyclines (1–16×105 cells mL−1) was significantly lower than in the OMZ core (1–25×105 cells mL−1) (Fig. 4c). A sharp decrease in bacterial abundance was observed below the OMZ.
Estimates for the in situ degradation rate of DHAA by LAPase take into account the available concentrations of DHAA and varied between 0.7 and 39.7 µmol C m−3 d−1. LAPase degradation rates observed within the OMZ core (5.5±2.1 µmol C m−3 d−1) were significantly higher than in the oxyclines (3.1±2.3 µmol C m−3 d−1) (Fig. 5b). To exclude an influence of changing DHAA composition over depth, LAPase activity was also calculated using in situ concentrations of dissolved hydrolyzable leucine instead of total DHAA. Degradation rates of dissolved hydrolyzable leucine by LAPase (0.01–1.92 µmol C m−3 d−1) showed the same trend with significantly higher rates in suboxic waters than in the oxyclines. Thus, differences in the molecular composition of DHAA had no influence on spatial degradation patterns being higher in suboxic waters than in the upper oxycline. In contrast, degradation rates of DCHO (>1 kDa) were slightly reduced within the suboxic waters (0.69±1.30 µmol C m−3 d−1) compared to the oxyclines (1.1±1.0 µmol C m−3 d−1) (Fig. 5c). Since degradation rates were calculated by multiplying enzyme rates and carbon concentrations of DCHO and DHAA at in situ depth, differences in carbon concentrations are important for further interpretation. In situ carbon concentrations of DHAA were similar between the OMZ core (0.53±0.1 µmol C L−1) and the oxycline (0.57±0.2 µmol C L−1). In contrast, in situ carbon concentrations of DCHO were reduced within the OMZ core (1.3±0.4 µmol C L−1) compared to the oxycline (1.5±0.6 µmol C L−1) (Fig. 3e, f), suggesting that calculated differences between degradation rates may be influenced by different carbon concentrations. Potential hydrolytic rates at saturating substrate concentration (Vmax) of LAPase ranged between 9 and 158 nmol L−1 h−1 and were ∼ 30 times lower for GLUCase. LAPase Vmax was significantly higher within the suboxic waters (50±21 nmol L−1 h−1) compared to the oxycline (36±20 nmol l−1 h−1), and GLUCase Vmax was more similar within the suboxic waters (1.6±1.5 nmol L−1 h−1) compared to the oxycline (1.2±0.6 nmol L−1 h−1) (Fig. 5d, e). Trends between oxygen regimes were similar between temperature-corrected extracellular enzyme rates (presented throughout the text) and extracellular enzyme rates measured during incubation (Table S2).

Figure 5Extracellular enzyme rates at different in situ oxygen concentrations during April and June 2017 (M136, M138). Oxygen concentrations (a), degradation rates of dissolved amino acids (DHAA) by leucine-aminopeptidase (LAPase) (b), degradation rates of high molecular-weight dissolved carbohydrates (DCHO) by β-glucosidase (GLUCase) (c), total potential LAPase rates (Vmax) (d), GLUCase Vmax (e), cell abundance (f), cell-specific degradation rates DHAA by LAPase (g), cell-specific degradation rates of DCHO by GLUCase (h), cell-specific LAPase Vmax (i) and cell-specific GLUCase Vmax (j) at different oxygen regimes off Peru.
To investigate the physiological effects of suboxia, we normalized bacterial production and enzymatic rates to cell abundance. Cell-specific production ranged between 1 and 1120 amol C cell−1 d−1 (Fig. 4d). In contrast to total production, cell-specific production was significantly higher at the oxyclines compared to suboxic core waters at the offshore stations (suboxic: 1–102 µmol C m−3 d−1; oxyclines: 6–219 µmol C m−3 d−1). At the most coastal stations (G and T) cell-specific rates were more similar between suboxic waters and the oxyclines (suboxic: 129–135 µmol C m−3 d−1) (oxycline: 72–284 µmol C m−3 d−1). Further, cell-specific bacterial production was slightly correlated (Spearman rank correlation = 0.36) to oxygen concentrations at ≤20 µmol O2 kg−1, and as long as the most coastal stations (G and T) were included, this correlation was significant (Fig. 4d, Table S2). A detailed view at total- and cell-specific bacterial production in dependence of in situ oxygen concentrations reveals a stronger increase in cell-specific bacterial production, especially at <10 µmol O2 kg−1 at different stations (Fig. S2).
Cell-specific degradation rates of DHAA increased with depth and yielded significantly higher rates at the lower oxycline compared to all shallower depths. Cell-specific LAPase Vmax, GLUCase Vmax and the GLUCase degradation rate showed the same trends; however, for the latter this trend was not significant (Fig. 5g–j, Table S2)
3.3 Bacterial contribution to the loss of dissolved organic carbon and oxygen in the oxycline
We calculated the loss of oxygen and DOC during physical transport from below the mixed layer depth (MLD; 10–32 m) to 60 m based on observed changes in diapycnal fluxes (Eq. 1, Fig. 2b, c). We estimated the bacterial contribution to this loss using two different approaches (Table 1): (i) we assumed that the loss of DOC over depth equalled the bacterial uptake implying that the DOC is subsequently incorporated as bacterial biomass (bacterial production) or respired to CO2; (Eq. 4) (ii) the amount of DOC taken up by bacteria was determined by the measured bacterial incorporation of carbon (bacterial production) and a constant ratio between carbon that is taken up and carbon that is incorporated as biomass (bacterial production) (Eq. 5) (see Sect. 2.5 for details). This ratio (BGE), was here assumed to be 10 % or 30 %, based on the empirical equation by Rivkin and Legendre with an in situ temperature that varied between 14 and 19 ∘C (Rivkin and Legendre, 2001).
Table 1Estimates of oxygen and DOC loss over depth based on in situ physical observations and bacterial rate measurements. Oxygen and DOC loss rates (mmol m−3 d−1) were estimated from the change in oxygen and DOC fluxes over depth. The bacterial uptake of DOC (mmol m−3 d−1) was calculated from bacterial production (mmol m−3 d−1) based on a growth efficiency of 10 % and 30 % (DOC uptakeφ). The bacterial oxygen demand (BOD, mmol m−3 d−1) and bacterial growth efficiency (BGEε, %) were calculated from bacterial production and the assumption that DOC loss can be completely explained by bacterial uptake (BODε) or estimated based on a BGE of 10 % and 30 % (BODφ).

For total average DOC loss (∇ΦDOC), we calculated a range of 1.13–3.40 mmol C m−3 d−1, with loss rates decreasing most strongly below the shallow mixed layer down to 40 m (Table 1, Fig. 2c). Following the first (i) assumption, all DOC that was lost over depth was taken up by bacteria and the measured bacterial production represents the fraction of DOC that was incorporated as biomass. Consequently, the remaining DOC that has been taken up, in other words the difference between DOC loss and bacterial production (0.03–0.71 mmol C m−3 d−1), was respired to CO2 and represents the bacterial oxygen demand to account for the DOC loss (BODε) (0.98–3.36 mmol O2 m−3 d−1) (Eq. 4). Following this calculation, the BGE would vary between 1 %–21 % and 2 %–13 % in the depth range of MLD–40 and 40–60 m, respectively, being on average almost constant over the two different depth ranges (6.6 % and 5.0 %). (ii) Applying a BGE in the range of 10 % and 30 % and the measured bacterial production, the calculated bacterial DOC uptakeφ was 0.08–7.10 mmol C m−3 d−1. Hence, the respiration of DOC to CO2 accounted for a BODφ of 0.06–6.39 mmol O2 m−3 d−1 (Table 1).
We investigated bacterial degradation of DOM by measuring bacterial production as an estimate for organic carbon transformation into biomass as well as rates of extracellular hydrolytic enzymes to provide information on the initial steps of organic-matter degradation (Hoppe et al., 2002). We expected reduced rates of organic-matter degradation within oxygen-depleted waters, since reduced bacterial degradation activity might explain enhanced carbon fluxes in suboxic and anoxic waters (Devol and Hartnett, 2001). However, although bacterial production decreased with depth (Fig. 4b), this decrease was not related to oxygen concentrations. Moreover, no significant increase in bacterial production was observed at the lower oxycline, when oxygen concentration increased again (Fig. 4b). Decreasing bacterial production with depth has also been observed for fully oxygenated regions in the Atlantic (Baltar et al., 2009) and the equatorial Pacific (Kirchman et al., 1995) and has been explained by a decrease in the amount of bioavailable organic matter over depth.
The hypothesis of reduced bacterial degradation activity within the OMZ also implies reduced extracellular enzyme rates for the hydrolysis of organic matter. The extracellular enzyme rates of our study have to be interpreted carefully since incubation was not fully anoxic and the remaining oxygen might have biased the results. Still, we assume that most extracellular enzymes were present at the time of sampling and thus oxygen contamination during the incubations did not strongly influence the rate measurements. In our study, neither GLUCase nor LAPase Vmax were reduced within the suboxic waters compared to the oxyclines irrespective of incubation conditions (Figs. 5d, e, S3 and S4). Thus, our findings show no evidence for reduced organic-matter degradation in suboxic waters and are in good agreement with studies, which report similar bacterial degradation rates for oxic and suboxic waters (Cavan et al., 2017; Lee, 1992; Pantoja et al., 2009). Consequently, the hypothesis of enhanced carbon export in OMZ waters due to reduced organic-matter degradation seems fragile and alternative explanations for enhanced carbon export efficiency, e.g., reduced particle fragmentation due to zooplankton avoiding hypoxia (Cavan et al., 2017) may be more likely. Likewise, a reduced degradation of particulate organic carbon in suboxic waters as is often assumed in global ocean biogeochemical models may have to be reconsidered (Ilyina et al., 2013).
Within OMZs dissolved nitrogen fuels processes such as denitrification or anaerobic ammonium oxidation (anammox) and is reduced to, e.g., dinitrogen gas that evades to the atmosphere. Current estimates result in 20 %–50 % of the total oceanic nitrogen loss occurring in OMZs (Lam and Kuypers, 2011). Meanwhile, a preferential degradation of amino-acid-containing organic matter in suboxic waters compared to oxic waters has been suggested (Van Mooy et al., 2002). The degradation of nitrogen compounds by heterotrophic bacteria (e.g., denitrifiers) in suboxic waters enables the release of ammonia and nitrite and subsequently may support anammox, an autotrophic anaerobic pathway (Babbin et al., 2014; Kalvelage et al., 2013; Lam and Kuypers, 2011; Ward, 2013). This interaction between denitrifiers and anammox bacteria could fuel the loss of nitrogen to the atmosphere. Our data indeed showed enhanced degradation of amino-acid-containing organic matter in low-oxygen waters. Indicators of protein decomposition, i.e., LAPase Vmax and the degradation rate of DHAA by LAPase, were more pronounced within the suboxic waters (Fig. 5b, d). Therefore, observed LAPase rates are in line with the hypothesis of preferential degradation of nitrogen compounds under suboxia. However, simultaneous rate measurements of protein hydrolysis, nitrate reduction (e.g., denitrification) and anammox are needed to prove an indirect stimulation of anammox by protein hydrolysis via denitrification. A close coupling between anammox and nitrate reducing bacteria has previously been shown for wastewater treatments. There, nitrate reducers directly take up organic matter excreted by the anammox bacteria which in turn benefit from the released nitrite by respiratory nitrate reduction (Lawson et al., 2017). In the Pacific, denitrifiers and anammox bacteria are separated in space and time (Dalsgaard et al., 2012), potentially weakening a direct inter-dependency.
To investigate physiological effects of suboxia, we normalized bacterial production and enzymatic rates to cell abundance and found higher cell-specific bacterial production near the oxycline compared to suboxic waters and highest cell-specific enzyme rates at the lower oxycline (Figs. 4d, 5g–j). Higher cell-specific bacterial production at oxic–anoxic interfaces in the water column has previously been reported for the Baltic Sea (Brettar et al., 2012). Baltar et al. (2009) showed increasing cell-specific enzymatic rates and decreasing cell-specific bacterial production, with increasing depth in the subtropical Atlantic and related this pattern to decreasing organic-matter lability. In our study, differences in cell-specific bacterial production between suboxic waters and the oxycline did not persist at the most coastal stations (G and T). This indicates the stimulation of bacterial activity, including anaerobic respiratory processes, by the high input of labile organic matter. Therefore, our study suggests that a possible impairment of cell-specific bacterial production under suboxia is reduced by the supply of organic matter. However, this hypothesis is restricted to a very limited number of samples and should be tested in further studies. While labile organic matter is decreasing with depth (e.g., Loginova et al., 2019), TDN (Fig. 3c), especially inorganic nitrogen, is increasing with depth. Thus, high concentrations of inorganic nitrogen at the lower oxycline are available for heterotrophic and chemoautotrophic energy gains. For instance, the co-occurrence of nitrate reduction, which was still detected at 25 µmol O2 L−1, and micro-aerobic respiration might have stimulated cell-specific production or the accumulation of especially active bacterial species (Kalvelage et al., 2011, 2015).
The depth distribution of cell-specific and total bacterial production was different (Figs. 4b, d and S2); cell-specific production was significantly reduced in suboxic waters, while total production was more similar in suboxic waters compared to the oxycline. This suggests that lower cell-specific production was compensated by higher cell abundance within the suboxic waters (Fig. 4c), resulting in an overall unhampered bacterial organic-matter cycling in the OMZ core. One reason for the accumulation of cells within the OMZ might be reduced predation, suggesting the OMZ core as an ecological niche for slowly growing bacteria. Reduced grazing by bacterivores thus preserves bacterial biomass in suboxic waters from entering into the food chain. This way of bacterial biomass preservation has been suggested as a possible explanation for enhanced carbon preservation in anoxic sediments by Lee (1992) and may also explain our observations for the anoxic water column.
In general, bacterial community composition in OMZs has been shown to be strongly impacted by oxygen. In the OMZ near the shelf off Chile, Arctic96BD-19 and SUP05 dominate heterotrophic and autotrophic groups in hypoxic waters (Aldunate et al., 2018). Next to the appearance of autotrophic bacteria that are related to sulfur (e.g., SUP05) or nitrogen cycling (e.g., Planctomycetes), bacteria related to cycling of complex carbohydrates have also been discovered in OMZs (Callbeck et al., 2018; Galán et al., 2009; Thrash et al., 2017) and may explain the unaltered high potential (Vmax) of the extracellular enzymes GLUCase and heterotrophic bacterial production in suboxic waters in our study (Figs. 5e, 4b). For instance, SAR406, SAR202, ACD39 and PAUC34f have the genetic potential for the turnover of complex carbohydrates and anaerobic respiratory processes in the Gulf of Mexico (Thrash et al., 2017). Consequently, our findings of active bacterial degradation of DOM are supported by molecular biological studies. Still, simultaneous measurements of bacterial degradation and production have to be combined with molecular analysis in future studies off Peru.
Heterotrophic bacteria are the main users of marine DOM (Azam et al., 1983; Carlson and Hansell, 2015) and responsible for ∼79 % of total respiration in the Pacific Ocean (Del Giorgio et al., 2011), proposing that heterotrophic bacteria drive organic matter and oxygen cycling in the ocean and significantly contribute to the formation of the OMZ. Under the assumption that the calculated loss of DOC during diapycnal transport (<60 m) is caused solely by bacterial uptake and subtracting the amount of carbon channeled into biomass production, our study verifies the importance of bacterial DOC degradation for the formation of the OMZ. We estimated a BOD (0.98–3.36 mmol O2 m−3 d−1) that is in line with earlier respiration measurements in the upper oxycline off Peru (Kalvelage et al., 2015) and represents 18 %–33 % of the oxygen loss over depth, implying a rather low average BGE (6.5 % and 5.0 %) (Table 1). Calculating the bacterial uptake of DOC from production rates and a more conservative BGE between 10 % and 30 % as previously suggested (Rivkin and Legendre, 2001) for the in situ temperature of 14 to 19 ∘C, 3 %–209 % of the DOC loss and 1 %–62 % of oxygen loss could be attributed to bacterial degradation of DOM. The first approach reveals an average BGE (6.5 % and 5.0 %) that is still within the range of previous reports for upwelling systems of the Atlantic (< 1 %–58 %) and northeastern Pacific (<10 %) (Alonso-Sáez et al., 2007; Del Giorgio et al., 2011). The high variability in BGE is a topic of ongoing research. Until now 54 % of the variability could be explained by variations in temperature (Rivkin and Legendre, 2001). Our data suggest that oxygen availability may be another control of BGE leading to rather low BGE in low-oxygen waters. This is especially indicated by a low but rather constant average BGE (6.5 % and 5.0 %), which we estimated for the water column down to 60 m depth under the assumption that all DOC that is lost over depth can be attributed to bacterial uptake. A low BGE might be explained by a bacterial community that has higher energetic demands but in return is adapted to variable oxygen conditions. Additionally, the BGE decreases with an increasing carbon-to-nitrogen ratio of the available substrate (Goldman et al., 1987). In the OMZ off Peru the ratio between DOC and dissolved organic nitrogen is frequently high (∼12 to 16) (Loginova et al., 2019) and might further contribute to the low BGE. High respiration rates induced by bacterial DOC degradation contribute to sustaining the OMZ, besides oxygen consumption by bacteria that hydrolyze and degrade particulate organic matter (Cavan et al., 2017). Another, but likely minor contribution to overall respiration is made by zooplankton and higher trophic levels (e.g., Kiko et al., 2016). Additionally, physical processes such as an intrusion of oxygen-depleted waters by eddies, upwelling or advection may add to the oxygen and DOC loss over depth (Brandt et al., 2015; Llanillo et al., 2018; Steinfeldt et al., 2015).
Uncertainties of our assumption that the loss of DOC is caused solely by bacterial uptake include other processes potentially contributing to DOC removal but not taken into consideration here, like DOC adsorption onto particles, DOC uptake by eukaryotic cells or the physical coagulation of DOC into particles, e.g., by the formation of gel-like particles such as transparent exopolymer particles and Coomassie stainable particles (Carlson and Hansell, 2015; Engel et al., 2004, 2005). Moreover, temporal variations in diapycnal fluxes may be large, as indicated by the confidence interval of solute fluxes (Fig. 2b, c) during this study and by 2 to 10 times lower DOC and oxygen loss rates during other seasons (Loginova et al., 2019). However, our study is the first combining physical and microbial rate measurements and gives estimates for carbon and oxygen losses in the upwelling system off Peru and can help improve current biogeochemical models by constraining bacterial DOM degradation.
Loginova et al. (2019) conducted similar physical rate measurements in the same study area with ∼2 and ∼10 times lower DOC and oxygen loss in the upper ∼40 m compared to our study. Differences in loss rates were mainly caused by a ∼10 times higher diapycnal diffusivity of mass in our study. This may have been caused by weaker stratification in the upper 100 m depth or differences in the turbulence conditions. Loginova et al. (2019) estimated a contribution of bacterial DOM degradation to oxygen loss (38 %) based on the loss of labile DOC (DHAA and DCHO). This value agrees well with our estimates of 18 %–33 % of total oxygen loss, calculated under the assumption that DOC loss is solely attributed to bacterial degradation. However, the comparison of DOC and oxygen loss within each study revealed different patterns. Loginova et al. (2019) found a loss of DOC that clearly exceeded the loss of oxygen within the upper ∼40 m. Hence, the respiration of DOC could fully explain the observed oxygen loss in that study. In our study, more oxygen than DOC was lost over depth (Table 1). This loss of oxygen needs additional explanations such as the degradation of particulate organic matter and physical mixing processes. One reason for the observed differences between the two studies that have been conducted in the same region might be seasonality. The study by Loginova et al. (2019) took place in austral summer, whereas our data were gained during austral winter. Water temperature was quite similar during both studies, probably due to the coastal El Niño 1 month before our sampling campaign (Garreaud, 2018). Still, the study by Loginova et al. (2019) included more stations with high Chl a concentrations (∼8 µg L−1), as typical for the austral summer, indicating a more productive system with more labile DOM (DCHO and DHAA). The prevalence of more labile DOM might explain the higher contribution of microbial DOM respiration to oxygen loss in the study by Loginova et al. (2019).
In oxygen-depleted waters of the Peruvian upwelling system, the chemoautotrophic process of anammox has been assumed to dominate anaerobic nitrogen cycling (Kalvelage et al., 2013), with lower but more constant rates compared to more sporadically occurring heterotrophic denitrification (Dalsgaard et al., 2012). Studies based on the stoichiometry of organic matter suggest a general dominance of denitrification in relation to anammox and relate variable ratios between these two processes to the stoichiometry of locally available organic matter (Babbin et al., 2014; Ward, 2013). Our study points towards a widespread occurrence of heterotrophic anaerobic processes such as denitrification or sulfate reduction (Canfield et al., 2010) in the Peruvian OMZ, since the method applied here for measuring bacterial production is restricted to heterotrophs. Our rates for bacterial production within the suboxic waters averaged to 37 µmol C m−3 d−1 (0.3–281 µmol C m−3 d−1).
We compared bacterial production, i.e., rates of carbon incorporation, with denitrification rates previously reported for the South Pacific. Therefore, we converted 1 mol of reduced nitrogen that was measured by Dalsgaard et al. (2012) and Kalvelage et al. (2013) to 1.25 mol of oxidized carbon after the reaction equation given by Lam and Kuypers (2011). This calculation indicates that on average ≤19 µmol C m−3 d−1 are oxidized by denitrifying bacteria in the eastern tropical Pacific (Dalsgaard et al., 2012; Kalvelage et al., 2013).
The amount of carbon oxidized by denitrification based on the studies of Dalsgaard et al. (2012) and Kalvelage et al. (2013) can be converted into bacterial production applying a BGE. The average temperature-dependent BGE was 20 %. A BGE of 20 % agrees well with other studies (Del Giorgio and Cole, 1998). Assuming a BGE of 20 %, the denitrification rates of Dalsgaard et al. (2012) and Kalvelage et al. (2013) suggest a bacterial production of ≤ 5 µmol C m−3 d−1, equivalent to only about 14 % of total average heterotrophic bacterial production in suboxic waters determined in our study. For the sum of anaerobic carbon oxidation rates including denitrification, DNRA and simple nitrate reduction, 109 µmol C m−3 d−1 (6–515 µmol C m−3 d−1) may be expected for the Peruvian shelf, with the reduction of nitrate to nitrite representing the largest proportion (2–505 µmol C−1 m−3 d−1), based on the relative abundance of the different N-functional genes (Kalvelage et al., 2013). These anaerobic respiration measurements are equivalent to a bacterial production of ∼ 27 µmol C m−3 d−1 (1–129 µmol C m−3 d−1) and are thus lower than our direct measurements of bacterial production rates. Moreover, the reduction of nitrate, could not be detected at every depth and incubation experiments partly showed huge variations over depth (Kalvelage et al., 2013), whereas we were able to measure bacterial production in every sample. The same calculation can be repeated assuming a BGE of 6 %, which is the average BGE within this study based on DOC loss and bacterial production. Assuming a BGE of 6 %, the estimated 109 µmol C m−3 d−1 that are respired by anaerobic carbon oxidation (Kalvelage et al., 2013) would represent 94 % of the carbon uptake. Consequently, 7 µmol C m−3 d−1, i.e., 6 % of the carbon uptake, is incorporated into the bacterial biomass. A bacterial biomass production of 7 µmol C m−3 d−1 is even lower than the bacterial production of 27 µmol C m−3 d−1, based on a BGE of 20 % and cannot explain the average bacterial production measured in suboxic waters during our study (37 µmol C m−3 d−1). Therefore, this estimation suggests higher rates of heterotrophic anaerobic respiratory processes than previously measured. Since denitrification rates were not measured directly, the comparability of published denitrification rates and our measurements of bacterial production are limited. However, our data suggest that the carbon oxidation potential off Peru is more evenly horizontally and vertically distributed than expected and also corroborate earlier suggestions of unexpectedly high rates of heterotrophic nitrogen cycling in the OMZ off Peru based on observations of high concentrations of atmospheric nitrous oxide (Bourbonnais et al., 2017).
Our study suggests that suboxia does not reduce bacterial degradation of organic matter in the eastern tropical South Pacific off Peru. Bacterial species are seemingly adapted to these environments and higher cell abundance compensates for hampered cell-specific bacterial production under suboxia. Therefore, the previously observed enhanced carbon export in OMZs compared to oxygenated waters requires alternative explanations. Differences between cell-specific and total rates of bacterial activity allude to different controls of cell abundance in suboxic systems, highlighting the OMZ as a specific ecological niche. The combination of bacterial and physical rate measurements suggests that low BGEs in the upper oxycline contribute to sustaining the OMZ. Meanwhile, new findings during our study call for additional studies: (i) DOC loss differed strongly between our investigation and the study of Loginova et al. (2019). Therefore, combined physical and biological rate measurements in the Peruvian upwelling system should be repeated during austral summer, to learn more about the interplay of DOC loss and bacterial production during different seasons. (ii) Integrated measurements of denitrification, micro-aerobic respiration and bacterial production are needed to estimate the fractions of incorporated and respired carbon under suboxia. The BGE received in that way could support or disprove the low BGE estimate, which was calculated from DOC loss and bacterial production in our study. Consequently, our study highlights the need for a better mechanistic understanding and quantification of processes responsible for oxygen and DOM loss in OMZs that is inevitable to predict future patterns of deoxygenation in a warming climate.
Data are available at https://doi.pangaea.de/10.1594/PANGAEA.891247 (Maßmig and Engel, 2018).
The supplement related to this article is available online at: https://doi.org/10.5194/bg-17-215-2020-supplement.
MM and AE designed the scientific study, analyzed the data and wrote the paper. JL calculated DOC and oxygen fluxes, GK sampled and calibrated the CTD data, and both JL and GK commented on the paper.
The authors declare that they have no conflict of interest.
This article is part of the special issue “Ocean deoxygenation: drivers and consequences – past, present and future (BG/CP/OS inter-journal SI)”. It is not associated with a conference.
We thank Jon Roa, Tania Klüver and Ruth Flerus for the sampling and/or analysis of DOC and TDN, cell abundance, bacterial production, and DHAA. Moreover, we would like to thank Judith Piontek, Sören Thomsen, Carolina Cisternas-Novoa and Frédéric A. C. Le Moigne, who helped and gave advice for sampling during the cruises. We are grateful to the working group of Hermann Bange and Stefan Sommer, who provided Winkler measurements. We thank the cruise leaders Hermann Bange and Marcus Dengler, crew, officers, and the captains of the R/V Meteor for the support on board and the successful cruises. We also thank the referees for their comments that helped improve the paper.
This research has been supported by the German Science Foundation (SFB Sonderforschungsbereich 754 “Climate-Biogeochemistry Interactions in the Tropical Ocean”) and the Helmholtz Association (grant no. POF III).
The article processing charges for this open-access
publication were covered by a Research
Centre of the Helmholtz Association.
This paper was edited by S. Wajih A. Naqvi and reviewed by two anonymous referees.
Aldunate, M., De la Iglesia, R., Bertagnolli, A. D., and Ulloa, O.: Oxygen modulates bacterial community composition in the coastal upwelling waters off central Chile, Deep-Sea Res. Pt. II, 156, 68–79, https://doi.org/10.1016/j.dsr2.2018.02.001, 2018.
Alonso-Sáez, L., Gasol, J. M., Arístegui, J., Vilas, J. C., Vaqué, D., Duarte, C. M., and Agustí, S.: Large-scale variability in surface bacterial carbon demand and growth efficiency in the subtropical northeast Atlantic Ocean, Limnol. Oceanogr., 52, 533–546, https://doi.org/10.4319/lo.2007.52.2.0533, 2007.
Azam, F., Fenchel, T., Field, J. G., Gray, J. S., Meyer-Reil, L. A., and Thingstadt, F.: The ecological role of water-column microbes in the sea, Mar. Ecol.-Prog. Ser., 10, 257–263, 1983.
Babbin, A. R., Keil, R. G., Devol, A. H., and Ward, B. B.: Organic matter stoichiometry, flux, and oxygen control nitrogen loss in the ocean, Science, 344, 406–408, https://doi.org/10.1126/science.1248364, 2014.
Bakund, A. and Nelson, C. S.: The seasonal cycle of wind-stress curl in subtropical eastern boundary current regions, J. Phys. Oceanogr., 21, 1815–1834, 1991.
Baltar, F., Arístegui, J., Sintes, E., van Aken, H. M., Gasol, J. M., and Herndl, G. J.: Prokaryotic extracellular enzymatic activity in relation to biomass production and respiration in the meso- and bathypelagic waters of the (sub)tropical Atlantic, Environ. Microbiol., 11, 1998–2014, https://doi.org/10.1111/j.1462-2920.2009.01922.x, 2009.
Benner, R. and Amon, R. M. W.: The size-reactivity continuum of major bioelements in the ocean, Annu. Rev. Mar. Sci., 7, 185–205, https://doi.org/10.1146/annurev-marine-010213-135126, 2015.
Boetius, A. and Lochte, K.: Effect of organic enrichments on hydrolytic potentials and growth of bacteria in deep-sea sediments, Mar. Ecol.-Prog. Ser., 140, 239–250, https://doi.org/10.3354/meps140239, 1996.
Bourbonnais, A., Letscher, R. T., Bange, H. W., Échevin, V., Larkum, J., Mohn, J., Yoshida, N., and Altabet, M. A.: N2O production and consumption from stable isotopic and concentration data in the Peruvian coastal upwelling system, Global Biogeochem. Cy., 31, 678–698, https://doi.org/10.1002/2016GB005567, 2017.
Brandt, P., Bange, H. W., Banyte, D., Dengler, M., Didwischus, S.-H., Fischer, T., Greatbatch, R. J., Hahn, J., Kanzow, T., Karstensen, J., Körtzinger, A., Krahmann, G., Schmidtko, S., Stramma, L., Tanhua, T., and Visbeck, M.: On the role of circulation and mixing in the ventilation of oxygen minimum zones with a focus on the eastern tropical North Atlantic, Biogeosciences, 12, 489–512, https://doi.org/10.5194/bg-12-489-2015, 2015.
Brettar, I., Christen, R., and Höfle, M. G.: Analysis of bacterial core communities in the central Baltic by comparative RNA–DNA-based fingerprinting provides links to structure–function relationships, ISME J., 6, 195–212, https://doi.org/10.1038/ismej.2011.80, 2012.
Callbeck, C. M., Lavik, G., Ferdelman, T. G., Fuchs, B., Gruber-Vodicka, H. R., Hach, P. F., Littmann, S., Schoffelen, N. J., Kalvelage, T., Thomsen, S., Schunck, H., Löscher, C. R., Schmitz, R. A., and Kuypers, M. M. M.: Oxygen minimum zone cryptic sulfur cycling sustained by offshore transport of key sulfur oxidizing bacteria, Nat. Commun., 9, 1–11, https://doi.org/10.1038/s41467-018-04041-x, 2018.
Canfield, D. E., Stewart, F. J., Thamdrup, B., De Brabandere, L., Dalsgaard, T., Delong, E. F., Revsbech, N. P., and Ulloa, O.: A Cryptic Sulfur Cycle in Oxygen-Minimum-Zone Waters off the Chilean Coast, Science, 330, 1375–1379, https://doi.org/10.1126/science.1196889, 2010.
Carlson, C. A. and Hansell, D. A.: DOM sources, sinks, reactivity, and budgets, in Biogeochemistry of marine dissolved organic matter, edited by: Carlson, C. A. and Hansell, D. A., 65–126, Elsevier, London, 2015.
Cavan, E. L., Trimmer, M., Shelley, F., and Sanders, R.: Remineralization of particulate organic carbon in an ocean oxygen minimum zone, Nat. Commun., 8, 14847, https://doi.org/10.1038/ncomms14847, 2017.
Cole, J. J. and Pace, M. L.: Bacterial secondary production in oxic and anoxic freshwaters, Limnol. Oceanogr., 40, 1019–1027, https://doi.org/10.4319/lo.1995.40.6.1019, 1995.
Czeschel, R., Stramma, L., Schwarzkopf, F. U., Giese, B. S., Funk, A., and Karstensen, J.: Middepth circulation of the eastern tropical South Pacific and its link to the oxygen minimum zone, J. Geophys. Res., 116, C01015, https://doi.org/10.1029/2010JC006565, 2011.
Dalsgaard, T., Thamdrup, B., Farías, L., and Revsbech, N. P.: Anammox and denitrification in the oxygen minimum zone of the eastern South Pacific, Limnol. Oceanogr., 57, 1331–1346, https://doi.org/10.4319/lo.2012.57.5.1331, 2012.
Del Giorgio, P. A. and Cole, J. J.: Bacterial growth efficiency in natural aquatic systems, Annu. Rev. Ecol. Syst., 29, 503–541, 1998.
Del Giorgio, P. A., Condon, R., Bouvier, T., Longnecker, K., Bouvier, C., Sherr, E., and Gasol, J. M.: Coherent patterns in bacterial growth, growth efficiency, and leucine metabolism along a northeastern Pacific inshore-offshore transect, Limnol. Oceanogr., 56, 1–16, https://doi.org/10.4319/lo.2011.56.1.0001, 2011.
Devol, A. H. and Hartnett, H. E.: Role of the oxygen-deficient zone in transfer of organic carbon to the deep ocean, Limnol. Oceanogr., 46, 1684–1690, https://doi.org/10.4319/lo.2001.46.7.1684, 2001.
Dittmar, T., Cherrier, J., and Ludichowski, K. U.: The analysis of amino acids in seawater, in: Practical guidelines for the analysis of seawater, edited by: Wurl, O., 67–78, CRC Press, Boca Raton, 2009.
Echevin, V., Aumont, O., Ledesma, J., and Flores, G.: The seasonal cycle of surface chlorophyll in the Peruvian upwelling system?: A modelling study, Prog. Oceanogr., 79, 167–176, https://doi.org/10.1016/j.pocean.2008.10.026, 2008.
Engel, A. and Galgani, L.: The organic sea-surface microlayer in the upwelling region off the coast of Peru and potential implications for air–sea exchange processes, Biogeosciences, 13, 989–1007, https://doi.org/10.5194/bg-13-989-2016, 2016.
Engel, A. and Händel, N.: A novel protocol for determining the concentration and composition of sugars in particulate and in high molecular weight dissolved organic matter (HMW-DOM) in seawater, Mar. Chem., 127, 180–191, https://doi.org/10.1016/j.marchem.2011.09.004, 2011.
Engel, A., Thoms, S., Riebesell, U., Rochelle-Newall, E., and Zondervan, I.: Polysaccharide aggregation as a potential sink of marine dissolved organic carbon, Nature, 428, 929–932, https://doi.org/10.1038/nature02453, 2004.
Engel, A., Zondervan, I., Aerts, K., Beaufort, L., Benthien, A., Chou, L., Delille, B., Gattuso, J.-P., Harlay, J., Heemann, C., Hoffmann, L., Jacquet, S., Nejstgaard, J., Pizay, M.-D., Rochelle-Newall, E., Schneider, U., Terbrueggen, A., and Riebesell, U.: Testing the direct effect of CO2 concentration on a bloom of the coccolithophorid Emiliania huxleyi in mesocosm experiments, Limnol. Oceanogr., 50, 493–507, https://doi.org/10.4319/lo.2005.50.2.0493, 2005.
Fischer, T., Banyte, D., Brandt, P., Dengler, M., Krahmann, G., Tanhua, T., and Visbeck, M.: Diapycnal oxygen supply to the tropical North Atlantic oxygen minimum zone, Biogeosciences, 10, 5079–5093, https://doi.org/10.5194/bg-10-5079-2013, 2013.
Fox, J. and Weisberg, S.: An {R} Companion to Applied Regression, 2nd Edn., SAGE Publications Ltd, Thousant OAk (CA), 2011.
Galán, A., Molina, V., Thamdrup, B., Woebken, D., Lavik, G., Kuypers, M. M. M., and Ulloa, O.: Anammox bacteria and the anaerobic oxidation of ammonium in the oxygen minimum zone off northern Chile, Deep-Sea Res. Pt. II, 56, 1021–1031, https://doi.org/10.1016/j.dsr2.2008.09.016, 2009.
Garreaud, R. D.: A plausible atmospheric trigger for the 2017 coastal El Niño, Int. J. Climatol., 38, 1296–1302, https://doi.org/10.1002/joc.5426, 2018.
Gasol, J. M. and Del Giorgio, P. A.: Using flow cytometry for counting natural planktonic bacteria and understanding the structure of planktonic bacterial communities, Sci. Mar., 64, 197–224, https://doi.org/10.3989/scimar.2000.64n2197, 2000.
Goldman, J. C., Caron, D. A., and Dennett, M. R.: Regulation of gross growth efficiency and ammonium regeneration in bacteria by substrate C : N ratio, Limnol. Oceanogr., 32, 1239–1252, https://doi.org/10.4319/lo.1987.32.6.1239, 1987.
Graco, M. I., Purca, S., Dewitte, B., Castro, C. G., Morón, O., Ledesma, J., Flores, G., and Gutiérrez, D.: The OMZ and nutrient features as a signature of interannual and low-frequency variability in the Peruvian upwelling system, Biogeosciences, 14, 4601–4617, https://doi.org/10.5194/bg-14-4601-2017, 2017.
Grossart, H., Allgaier, M., Passow, U., and Riebesell, U.: Testing the effect of CO2 concentration on the dynamics of marine heterotrophic bacterioplankton, Limnol. Oceanogr., 51, 1–11, https://doi.org/10.4319/lo.2006.51.1.0001, 2006.
Gruber, N.: Warming up, turning sour, losing breath?: ocean biogeochemistry under global change, Philos. T. R. Soc. A, 369, 1980–1996, https://doi.org/10.1098/rsta.2011.0003, 2011.
Hoppe, H.-G.: Significance of exoenzymatic activities in the ecology of brackish water: measurements by means of methylumbelliferyl-substrates, Mar. Ecol.-Prog. Ser., 11, 299–308, 1983.
Hoppe, H.-G., Gocke, K., and Kuparinen, J.: Effect of H2S on heterotrophic substrate uptake, extracellular enzyme activity and growth of brackish water bacteria, Mar. Ecol.-Prog. Ser., 64, 157–167, https://doi.org/10.3354/meps064157, 1990.
Hoppe, H.-G., Arnosti, C., and Herndl, G. F.: Ecological significance of bacterial enzymes in the marine environment, in: Enzymes in the environment: activity, ecology, and applications, edited by: Burns, R. and Dick, R., 73–108, Marcel Dekker, Inc., New York, 2002.
Horthorn, T., Bretz, F., and Westfall, P.: Simultaneous Inference in General Parametric Models, Biometrical J., 50, 346–363, 2008.
Ilyina, T., Six, K. D., Segschneider, J., Maier-Reimer, E., Li, H., and Nunez-Riboni, I.: Global ocean biogeochemistry model HAMOCC?: Model architecture and performance as component of the MPI-Earth system model in different CMIP5 experimental realizations, J. Adv. Model. Earth Sy., 5, 1–29, https://doi.org/10.1029/2012MS000178, 2013.
Kalvelage, T., Jensen, M. M., Contreras, S., Revsbech, N. P., Lam, P., Günter, M., LaRoche, J., Lavik, G., and Kuypers, M. M. M.: Oxygen sensitivity of anammox and coupled N-cycle processes in oxygen minimum zones, edited by: Gilbert, J. A., PLoS One, 6, e29299, https://doi.org/10.1371/journal.pone.0029299, 2011.
Kalvelage, T., Lavik, G., Lam, P., Contreras, S., Arteaga, L., Löscher, C. R., Oschlies, A., Paulmier, A., Stramma, L., and Kuypers, M. M. M.: Nitrogen cycling driven by organic matter export in the South Pacific oxygen minimum zone, Nat. Geosci., 6, 228–234, https://doi.org/10.1038/ngeo1739, 2013.
Kalvelage, T., Lavik, G., Jensen, M. M., Revsbech, N. P., Löscher, C., Schunck, H., Desai, D. K., Hauss, H., Kiko, R., Holtappels, M., LaRoche, J., Schmitz, R. A., Graco, M. I., and Kuypers, M. M. M.: Aerobic microbial respiration in oceanic oxygen minimum zones, edited by: Quan, Z.-X., PLoS One, 10, e0133526, https://doi.org/10.1371/journal.pone.0133526, 2015.
Kämpf, J. and Chapman, P.: Upwelling Systems of the World, Springer International Publishing Switzerland, Cham., https://doi.org/10.1007/978-3-319-42524-5, 2016.
Kiko, R., Hauss, H., Buchholz, F., and Melzner, F.: Ammonium excretion and oxygen respiration of tropical copepods and euphausiids exposed to oxygen minimum zone conditions, Biogeosciences, 13, 2241–2255, https://doi.org/10.5194/bg-13-2241-2016, 2016.
Kirchman, D., K'nees, E., and Hodson, R.: Leucine incorporation and its potential as a measure of protein synthesis by bacteria in natural aquatic systems, Appl. Environ. Microbiol., 49, 599–607, 1985.
Kirchman, D. L., Rich, J. H., and Barber, R. T.: Biomass and biomass production of heterotrophic bacteria along 140∘ W in the equatorial Pacific: Effect of temperature on the microbial loop, Deep-Sea Res. Pt. II, 42, 603–619, https://doi.org/10.1016/0967-0645(95)00021-H, 1995.
Lam, P. and Kuypers, M. M. M.: Microbial nitrogen cycling processes in oxygen minimum zones, Annu. Rev. Mar. Sci, 3, 317–348, https://doi.org/10.1146/annurev-marine-120709-142814, 2011.
Lawson, C. E., Wu, S., Bhattacharjee, A. S., Hamilton, J. J., Mcmahon, K. D., Goel, R., and Noguera, D. R.: Metabolic network analysis reveals microbial community interactions in anammox granules, Nat. Commun., 8, 1–12, https://doi.org/10.1038/ncomms15416, 2017.
Lee, C.: Controls on organic carbon preservation?: the use of stratified water bodies to compare intrinsic rates of decomposition in oxic and anoxic systems, Geochim. Cosmochim. Ac., 56, 3323–3335, https://doi.org/10.1016/0016-7037(92)90308-6, 1992.
Lindroth, P. and Mopper, K.: High performance liquid chromatographic determination of subpicomole amounts of amino acids by precolumn fluorescence derivatization with o-phthaldialdehyde, Anal. Chem., 51, 1667–1674, https://doi.org/10.1021/ac50047a019, 1979.
Llanillo, P. J., Karstensen, J., Pelegrí, J. L., and Stramma, L.: Physical and biogeochemical forcing of oxygen and nitrate changes during El Niño/El Viejo and La Niña/La Vieja upper-ocean phases in the tropical eastern South Pacific along 86∘ W, Biogeosciences, 10, 6339–6355, https://doi.org/10.5194/bg-10-6339-2013, 2013.
Llanillo, P. J., Pelegrí, J. L., Talley, L. D., Pena-Izquirdo, J., and Cordero, R. R.: Oxygen Pathways and Budget for the Eastern South Pacific Oxygen Minimum Zone, J. Geophys. Res., 123, 1722–1744, https://doi.org/10.1002/2017JC013509, 2018.
Loginova, A. N., Thomsen, S., Dengler, M., Lüdke, J., and Engel, A.: Diapycnal dissolved organic matter supply into the upper Peruvian oxycline, Biogeosciences, 16, 2033–2047, https://doi.org/10.5194/bg-16-2033-2019, 2019.
López-Urrutia, Á. and Morán, X. A. G.: Resource limitation of bacterial production distorts the temperature dependence of oceanic carbon cycling, Ecology, 88, 817–822, https://doi.org/10.1890/06-1641, 2007.
Maßmig, M. and Engel, A.: Bacterial Biomass Production, Extracellular Enzyme Rates, Bacterial Cell Abundances and Dissolved Organic Carbon in the Upwelling System off Peru in Austral Winter 2017, PANGAEA, https://doi.org/10.1594/PANGAEA.891247, 2018.
McDougall, T. J. and Barker, P. M.: Getting started with TEOS-10 and the Gibbs Seawater (GSW) oceanographic toolbox, SCOR/IAPSO WG 127, 28 pp., ISBN 978-0-646-55621-5, 2011.
Ogle, D. H.: FSA: Fisheries Stock Analysis, R package version 0.8.17, 2017.
Pantoja, S., Rossel, P., Castro, R., Cuevas, L. A., Daneri, G., and Córdova, C.: Microbial degradation rates of small peptides and amino acids in the oxygen minimum zone of Chilean coastal waters, Deep-Sea Res. Pt. II, 56, 1055–1062, https://doi.org/10.1016/j.dsr2.2008.09.007, 2009.
Paulmier, A. and Ruiz-Pino, D.: Oxygen minimum zones (OMZs) in the modern ocean, Prog. Oceanogr., 80, 113–128, https://doi.org/10.1016/j.pocean.2008.08.001, 2009.
Piontek, J., Sperling, M., Nöthig, E. M., and Engel, A.: Regulation of bacterioplankton activity in Fram Strait (Arctic Ocean) during early summer: The role of organic matter supply and temperature, J. Marine Syst., 132, 83–94, https://doi.org/10.1016/j.jmarsys.2014.01.003, 2014.
R Core Team: R: A language and environment for statistical computing, R Foundation for Statistical Computing, Vienna, Austria, available at: https://www.R-project.org/ (last access: 13 January 2020), 2017.
Rivkin, R. B. and Legendre, L.: Biogenic carbon cycling in the upper ocean: Effects of microbial respiration, Science, 291, 2398–2400, https://doi.org/10.1126/science.291.5512.2398, 2001.
Roullier, F., Berline, L., Guidi, L., Durrieu De Madron, X., Picheral, M., Sciandra, A., Pesant, S., and Stemmann, L.: Particle size distribution and estimated carbon flux across the Arabian Sea oxygen minimum zone, Biogeosciences, 11, 4541–4557, https://doi.org/10.5194/bg-11-4541-2014, 2014.
Schafstall, J., Dengler, M., Brandt, P., and Bange, H.: Tidal-induced mixing and diapycnal nutrient fluxes in the Mauritanian upwelling region, J. Geophys. Res., 115, C10014, https://doi.org/10.1029/2009JC005940, 2010.
Schlitzer, R.: Ocean Data View, available at: https://odv.awi.de (last access: 13 January 2020), 2016.
Simon, M. and Azam, F.: Protein content and protein synthesis rates of planktonic marine bacteria, Mar. Ecol.-Prog. Ser., 51, 201–213, 1989.
Smith, D. C. and Azam, F.: A simple, economical method for measuring bacterial protein synthesis rates in seawater using 3H-leucine, Mar. Microb. Food Web, 6, 107–114, 1992.
Steinfeldt, R., Sültenfuß, J., Dengler, M., Fischer, T., and Rhein, M.: Coastal upwelling off Peru and Mauritania inferred from helium isotope disequilibrium, Biogeosciences, 12, 7519–7533, https://doi.org/10.5194/bg-12-7519-2015, 2015.
Stramma, L., Schmidtko, S., Levin, L. A., and Johnson, G. C.: Ocean oxygen minima expansions and their biological impacts, Deep-Sea Res. Pt. I, 57, 587–595, https://doi.org/10.1016/j.dsr.2010.01.005, 2010.
Strohm, T. O., Griffin, B., Zumft, W. G., and Schink, B.: Growth yields in bacterial denitrification and nitrate ammonification, Appl. Environ. Microb., 73, 1420–1424, https://doi.org/10.1128/AEM.02508-06, 2007.
Sugimura, Y. and Suzuki, Y.: A high-temperature catalytic oxidation method for the determination of non-volatile dissolved organic carbon in seawater by direct injection of a liquid sample, Mar. Chem., 24, 105–131, https://doi.org/10.1016/0304-4203(88)90043-6, 1988.
Taylor, G. T., Thunell, R., Varela, R., Benitez-Nelson, C., and Scranton, M. I.: Hydrolytic ectoenzyme activity associated with suspended and sinking organic particles within the anoxic Cariaco Basin, Deep-Sea Res. Pt. I, 56, 1266–1283, https://doi.org/10.1016/j.dsr.2009.02.006, 2009.
Thamdrup, B., Dalsgaard, T., and Revsbech, N. P.: Widespread functional anoxia in the oxygen minimum zone of the Eastern South Pacific, Deep-Sea Res. Pt. I, 65, 36–45, https://doi.org/10.1016/j.dsr.2012.03.001, 2012.
Thrash, C. J., Seitz, K. W., Baker, B. J., Temperton, B., Gillies, L. E., Rabalais, N. N., Henrissat, B., and Mason, U.: Metabolic roles of uncultivated bacterioplankton lineages in the northern Gulf of Mexico “Dead Zone”, MBio, 8, 1–20, https://doi.org/10.1128/mBio.01017-17, 2017.
Tiano, L., Garcia-Robledo, E., Dalsgaard, T., Devol, A. H., Ward, B. B., Ulloa, O., Canfield, D. E., and Peter Revsbech, N.: Oxygen distribution and aerobic respiration in the north and south eastern tropical Pacific oxygen minimum zones, Deep-Sea Res. Pt. I, 94, 173–183, https://doi.org/10.1016/j.dsr.2014.10.001, 2014.
Van Mooy, B. A. S., Keil, R. G., and Devol, A. H.: Impact of suboxia on sinking particulate organic carbon: Enhanced carbon flux and preferential degradation of amino acids via denitrification, Geochim. Cosmochim. Ac., 66, 457–465, https://doi.org/10.1016/S0016-7037(01)00787-6, 2002.
Ward, B. B.: How nitrogen is lost, Science, 341, 352–353, https://doi.org/10.1126/science.1240314, 2013.
Weiss, M., Abele, U., Weckesser, J., Welte, W., Schiltz, E., and Schulz, G.: Molecular architecture and electrostatic properties of a bacterial porin, Science, 254, 1627–1630, https://doi.org/10.1126/science.1721242, 1991.
Wickham, H.: ggplot2: Elegant Graphics for Data Analysis, Springer-Verlag, New York, 2009.
Winkler, W. L.: Die Bestimmung des im Wasser gelösten Sauerstoffes, Ber. Dtsch. Chem. Ges., 21, 2843–2854, https://doi.org/10.1002/cber.188802102122, 1888.