the Creative Commons Attribution 4.0 License.
the Creative Commons Attribution 4.0 License.
 | 26 Jun 2020
Assessing the potential for non-turbulent methane escape from the East Siberian Arctic Shelf
Matteo Puglini
Victor Brovkin
Pierre Regnier
Sandra Arndt
The East Siberian Arctic Shelf (ESAS) hosts large yet poorly quantified reservoirs of subsea permafrost and associated gas hydrates. It has been suggested that the global-warming induced thawing and dissociation of these reservoirs is currently releasing methane (CH4) to the shallow coastal ocean and ultimately the atmosphere. However, a major unknown in assessing the contribution of this CH4 flux to the global CH4 cycle and its climate feedbacks is the fate of CH4 as it migrates towards the sediment–water interface. In marine sediments, (an)aerobic oxidation reactions generally act as a very efficient methane sink. However, a number of environmental conditions can reduce the efficiency of this biofilter. Here, we used a reaction-transport model to assess the efficiency of the benthic methane filter and, thus, the potential for benthic methane escape across a wide range of environmental conditions that could be encountered on the East Siberian Arctic Shelf. Results show that, under steady-state conditions, anaerobic oxidation of methane (AOM) acts as an efficient biofilter. However, high CH4 escape is simulated for rapidly accumulating and/or active sediments and can be further enhanced by the presence of organic matter with intermediate reactivity and/or intense local transport processes, such as bioirrigation. In addition, in active settings, the sudden onset of CH4 flux triggered by, for instance, permafrost thaw or hydrate destabilization can also drive a high non-turbulent methane escape of up to 19 µmol CH4 cm−2 yr−1 during a transient, multi-decadal period. This “window of opportunity” arises due to delayed response of the resident microbial community to suddenly changing CH4 fluxes. A first-order estimate of non-turbulent, benthic methane efflux from the Laptev Sea is derived as well. We find that, under present-day conditions, non-turbulent methane efflux from Laptev Sea sediments does not exceed 1 Gg CH4 yr−1. As a consequence, we conclude that previously published estimates of ocean–atmosphere CH4 fluxes from the ESAS cannot be supported by non-turbulent, benthic methane escape.
- Article
(5845 KB) - Full-text XML
-
Supplement
(12652 KB) - BibTeX
- EndNote


The Siberian shelf represents the largest shelf on Earth (∼3 millions km2 Wegner et al., 2015) and spreads from the Kara Sea to the Laptev, East Siberian and Chuckhi seas. The East Siberian Arctic Shelf (ESAS) corresponds to the broad area beneath the shallow (∼45 m water depth, James et al., 2016) Laptev and East Siberian Arctic Sea (Romanovskii et al., 2004; Shakhova et al., 2010a) and represents the largest region on the Siberian shelf (Romanovskii et al., 2005), covering about 25 % of the total Arctic shelf (Shakhova et al., 2010a).
Although similar in many aspects to other shelf environments, a distinguishing feature of the ESAS is the presence of subsea permafrost and associated gas hydrates buried in the sediment (Sloan and Koh, 2007; Romanovskii et al., 2005). Subsea permafrost is a terrestrial relict that mainly formed during glacial periods, when retreating sea levels (with a minimum of 120 m below the current level around the Last Glacial Maximum) exposed Arctic shelves (Fairbanks, 1989; Bauch et al., 2001). Under these conditions, permafrost aggraded on the shelf and was subsequently submersed (Romanovskii and Hubberten, 2001; Romanovskii et al., 2005) by rising sea levels during the Holocene sea transgression (12–5 kyr BP) (Bauch et al., 2001). Gas hydrates are solid, methane-concentrated formations in which a gas molecule is trapped in a cage of water molecules (Ruppel and Kessler, 2017). They are thermodynamically stable under specific temperature–pressure–salinity in the ocean floor, including areas beneath the subsea permafrost (Sloan and Koh, 2007).
Little is known about the total amount of carbon stored in subsea permafrost or its original extent. Published estimates of carbon reservoir sizes diverge by orders of magnitude. For instance Shakhova et al. (2010a) estimate that 1175 Pg C are locked in subsea permafrost on the ESAS alone, while McGuire et al. (2009) calculate that, across the entire Arctic shelf, 9.4 Pg C reside in upper sediments and 1.5–49 Pg C (2–65 Pg CH4) in methane gas hydrates. Thus, the size of the Arctic subsea permafrost reservoir, its spatial distribution, as well as its biogeochemical and physical characteristics remain poorly known.
These knowledge gaps are critical as climate change is amplified in polar regions. The Arctic is currently warming at a rate twice as fast as the global mean (Trenberth et al., 2007; Bekryaev et al., 2010; Jeffries and Richter-Menge, 2012; Christensen et al., 2013). Recent observations indicate that bottom water temperatures in the coastal and inner shelf regions of the ESAS (water depth <30 m, Dmitrenko et al., 2011) are rising, while the central shelf sea may be subject to intense episodic warming (Janout et al., 2016). The increasing influx of warmer Atlantic water into the Arctic Ocean – the so-called Atlantification (Polyakov et al., 2017; Barton et al., 2018) – will not only further enhance this warming, but will also influence circulation and salinity patterns on the shelf (Carmack et al., 1995; Zhang et al., 1998; Biastoch et al., 2011). At the same time, it has been long recognized that the Arctic is a potential hotspot for methane emissions. Extensive methane gas bubbling has been observed in the Laptev Sea and has been directly linked to these environmental changes (Shakhova et al., 2010b, 2014). Shakhova et al. (2014) suggest that warming induced subsea permafrost thaw and hydrate destabilization may support methane emissions of up to 17 Tg CH4 yr−1 from the ESAS alone. Projected change in temperature (Shakhova et al., 2017, 2019) due to climate change is expected to further destabilize Arctic subsea permafrost and gas hydrate reservoirs and might thus enhance further methane emissions (Piechura and Walczowski, 1995; Westbrook et al., 2009; Reagan and Moridis, 2009; Biastoch et al., 2011; Hunter et al., 2013; Drake et al., 2015; Ruppel and Kessler, 2017). However, a number of recent studies have questioned the significance of subsea permafrost thaw and hydrate destabilization for methane efflux from Arctic sediment (Thornton et al., 2016; Ruppel and Kessler, 2017), for methane concentrations in Arctic Ocean waters (Overduin et al., 2015; Sapart et al., 2017) and, ultimately, for methane emissions from the Arctic waters (Ruppel and Kessler, 2017; Sparrow et al., 2018). Thus, the contribution of subsea permafrost thaw and gas hydrate destabilization to methane emissions from the warming Arctic shelf and, ultimately, methane–climate feedbacks remains poorly quantified (James et al., 2016; Saunois et al., 2016). As a consequence, it has not received much attention in the recent IPCC special report (Masson-Delmotte et al., 2018). At present, a major unknown is the strength of methane sinks in Arctic sediments and waters and their influence on methane emissions (Ruppel and Kessler, 2017). Therefore, improved assessments of the present and future climate impact of permafrost thaw and hydrate destabilization require not only a better knowledge of the Arctic subsea permafrost and hydrate distribution, reservoir size and characteristics, but also a better quantitative understanding of Arctic methane sinks.
In marine sediments, upward migrating methane is generally efficiently consumed by the anaerobic oxidation of methane (AOM) and, to a lesser extent, the aerobic oxidation of methane (AeOM) (Hinrichs and Boetius, 2002; Reeburgh, 2007; Knittel and Boetius, 2009). Although the exact AOM process has not been fully understood yet (James et al., 2016; McGlynn et al., 2015; Milucka et al., 2012; Wegener et al., 2015; Dean et al., 2018), it is thought that AOM is mediated by a consortium of methane-oxidizing Archaea and sulfate-reducing bacteria (Boetius et al., 2000) according to the reaction (Hinrichs and Boetius, 2002; Krüger et al., 2003)
A recent assessment indicates that, in global sediments, around 45–61 Tg CH4 yr−1 (Egger et al., 2018) are consumed by AOM, thus significantly reducing previously published estimates of 320–360 Pg CH4 yr−1 (Hinrichs and Boetius, 2002; Reeburgh, 2007).
AOM generally acts as a particularly efficient biofilter for upward migrating methane and oxidizes up to 100 % of the methane flux coming from below (e.g. Regnier et al., 2011). However, a number of environmental conditions can reduce the efficiency of this AOM biofilter, allowing methane to escape from the sediment (Iversen and Jorgensen, 1985; Piker et al., 1998; Jørgensen et al., 2001; Treude et al., 2005; Knab et al., 2008; Dale et al., 2008c; Thang et al., 2013; Egger et al., 2016). It has been shown that, in particular, high sedimentation rates (Egger et al., 2016), slow microbial growth (Dale et al., 2006, 2008c) or the accumulation of free gas can promote methane efflux from the sediment. These findings are particularly relevant for potential methane escape from Arctic shelf sediments. The Siberian shelf is the largest sedimentary basin in the world (Gramberg et al., 1983) and shelf areas close to the large Arctic rivers reveal sedimentation rates than can be up to 5 times faster than rates that are typically observed in the ocean (Leifer et al., 2017). In addition, the Arctic shelf is subject to large seasonal, as well as climate-induced long-term changes in environmental conditions, namely concentration in seawater and availability of CH4 in the sediments coming from deeper strata. These factors may influence the efficiency of the AOM biofilter through their effect on microbial biomass dynamics. Finally, observations from the ESAS also indicate that methane gas accumulates in the sediments. When free gas pockets grow enough, methane tends to migrate upwards along pathways with higher permeability or where fractures occur (Yakushev, 1989; Boudreau et al., 2005; Wright et al., 2008; Shakhova et al., 2014, 2015, 2017; Leifer et al., 2017) and might even crack the sediments themselves (O'Connor et al., 2010; Overduin et al., 2016; Yao et al., 2019; Stranne et al., 2019). However, despite a wealth of AOM-related research, a holistic, quantitative evaluation of the most important environmental controls on the efficiency of the AOM biofilter and its impact on methane escape from marine sediments is currently lacking. Thus our ability to understand and quantify AOM sink in ESAS sediments and thus the climate impact of subsea permafrost thaw and gas hydrate destabilization is seriously compromised.
Therefore, we here use a one-dimensional reaction-transport model approach to understand and quantify the efficiency of the AOM biofilter and its influence on the potential benthic release of methane in response to a plausible range of upward migrating dissolved methane fluxes from thawing permafrost and/or dissociating methane gas hydrates on the warming ESAS. The developed model accounts for the most pertinent primary and secondary redox processes, as well as mineral precipitation, methane gas formation and fast equilibrium reactions. Both active sites (characterized by an upward water flow) and passive sites (without an upward water flow) are investigated. We limit our model analysis to non-turbulent methane efflux, because methane in gaseous form is not directly accessible for the AOM community. As a consequence, free gas bubbles are less prone to be consumed by AOM and methane gas either is trapped in the sediments or rapidly migrates upwards through cracks, faults or fractures (Boudreau, 2012), bypassing the AOM biofilter.
The model is forced with a set of boundary conditions that are broadly representative of the conditions potentially encountered on the ESAS. It is applied to conduct a comprehensive one-at-a-time, steady-state sensitivity study over the entire plausible range of (1) sedimentation rates, (2) active fluid flow velocities, (3) AOM rate constants, (4) organic matter reactivity and (5) non-local transport activity encountered on the ESAS. In addition, we also evaluated the influence of (1) seasonal variability and (2) idealized, projected climate change on the efficiency of the AOM biofilter and potential non-turbulent methane escape from the ESAS under transient conditions. For this purpose, the model is extended by adopting an explicit description of AOM biomass dynamics and a bioenergetic rate law for AOM (Dale et al., 2006, 2008c, b). Finally, the results of all sensitivity study runs are used to identify the most important controls on methane efflux and derive a transfer function that allows establishment of a first-order estimate of methane escape from the ESAS.
The specific aims of this work are thus (1) to identify and quantitatively understand the most important environmental controls on the efficiency of the AOM biofilter, as well as (2) its significance in reducing upward migrating methane fluxes originating from thawing subsea permafrost or destabilizing methane gas hydrates under a plausible range of environmental conditions encountered on the present and future Siberian shelf. Model results are then used to (3) identify environmental conditions (and thus areas on the ESAS) that favour non-turbulent dissolved methane fluxes across the sediment–water interface and (4) derive transfer functions that allow estimation of the potential for non-turbulent CH4 escape from ESAS sediments, thus providing first-order constraints on the Arctic methane budget.
2.1 BRNS: reaction-transport model
The Biogeochemical Reaction Network Simulator (BRNS) (Regnier et al., 2002; Aguilera et al., 2005; Centler et al., 2010) – an adaptive simulation environment suitable for simulating large, mixed kinetic-equilibrium reaction networks in porous media (e.g. Jourabchi et al., 2005; Thullner et al., 2005; Dale et al., 2009) – is used to quantitatively explore the fluxes and transformations of methane in a sediment column representative for ESAS conditions. For this purpose, we set up a reaction network (Tables S1, S2 in the Supplement), model parameters (Table S6), as well as boundary conditions (Table S7) that cover the conditions encountered on the present-day Siberian shelf.
In the BRNS, the general mass conservation for each solid and dissolved species is described by a set of coupled advection–diffusion–reaction equations in porous media which are solved simultaneously (e.g. Berner, 1980; Boudreau, 1997; note that dependencies on z and t have been omitted for simplicity):
Ci is the concentration of the species i (mass per porewater volume for dissolved species or mass per solid matrix volume for a solid species); ξ i.e. the porosity ξ=φ for dissolved species and for solid species. Di is the effective diffusion coefficient for species i and is affected by salinity, temperature and tortuosity (see Table S6). Db denotes the bioturbation coefficient and v is the advective velocity. For solid species v=ω with ω being the burial rate, while the advective velocity for dissolved species is given by the sum of the burial rate and an advective flow velocity, vup, i.e. . A site where vup≠0 is defined as an active site, while a site with no advective upward water flow is defined as passive. αi is the bioirrigation coefficient (αi=0 for solid species) and Ci(0) is the concentration of the species i at the sediment–water interface (SWI). The reaction term 𝒮i is written as
where λij are the stoichiometric coefficients of all reaction rates Rj that affect species i.
2.1.1 Transport
The effective diffusion coefficients Di are determined by correcting the diffusion coefficients in free solution (Boudreau, 1997) for tortuosity θ and temperature. Tortuosity is calculated by means of porosity φ according to a modified Weissberg relation (Boudreau, 1997): . Note that the effective diffusion coefficients used in the model neglect pressure effects. Following Dale et al. (2008a), migration of methane gas is simply parameterized via a pseudo-diffusive term, with an apparent gas diffusion coefficient, . Bioturbation in the upper decimetres of the sediment is simulated using a diffusive term (e.g. Boudreau, 1986), with a constant bioturbation coefficient, . The model assumes that bioturbation ceases at the bioturbation depth, zbio (Boudreau, 1997). Bioirrigation is included in the mass conservation equation as a source or a sink function analogous to a kinetic rate. It is calculated as the product of the irrigation intensity, α (α=0 for all solids), and the difference in concentration of species i relative to the concentration at the SWI, Ci(0). The bioirrigation rate α, is evaluated from the bioirrigation coefficient at the sediment surface (α0) and the bioirrigation attenuation depth (zirr) and is given by Eq. (S9) in the Supplement. Porosity is assumed to decrease with depth according to an exponential decay (Athy, 1930):
with φ0 the porosity at the SWI and c0 the typical length scale for compaction.
2.1.2 Biogeochemical network
The reaction network implemented here (33 species, 37 reactions) encompasses the most pertinent primary and secondary redox reactions, equilibrium reactions and mineral precipitation and adsorption reactions. A summary of the reactions, their stoichiometry and their rate formulations can be found in Tables S2 and S3. The following section provides a short description of the implemented reaction network, as well as a more detailed description of the reactions that affect the production/consumption of methane. A complete description can be found in the Supplement.
The BRNS model accounts for the degradation of organic matter by aerobic degradation, denitrification, manganese oxide reduction, iron reduction, sulfate reduction and methanogenesis (Table S2). Organic matter degradation is described by means of the reactive continuum model (RCM) (Aris, 1968; Ho and Aris, 1987; Boudreau and Ruddick, 1991) that describes compound-specific reactivities (Tesi et al., 2014) and, thus, captures the widely observed decrease in apparent organic matter reactivity with degradation state. The relative importance of each metabolic pathway is simulated through a series of kinetic limitation terms, reflecting their sequential utilization in the order of their decreasing Gibbs energy yields (Table S1). After all terminal electron acceptors (TEAs) are consumed, the remaining organic matter may be degraded by methanogenesis. The rates of secondary redox reactions (Table S3), are described by bimolecular rate laws (e.g. Wang and Van Cappellen, 1996). Adsorption reactions are considered as fast equilibrium processes (Table S3, R28–R31 in the Supplement). Mineral precipitation rates are simulated according to kinetic–thermodynamic rate laws (Table S3, R16–R24).
As described above, methane is produced during organic matter degradation by methanogens in deeper sediment layers, once all TEAs are depleted (Table S2, R6). If the concentration of dissolved methane exceeds the saturation concentration [CH4]*, methane gas forms. The transfer rate of methane between the dissolved and gaseous phase is linearly controlled by the departure of the simulated dissolved methane concentration from the saturation concentration (Haeckel et al., 2004; Hensen and Wallmann, 2005; Tishchenko et al., 2005; Mogollón et al., 2009; Graves et al., 2017). [CH4]* is calculated according to Dale et al. (2008a), derived from the formulation proposed by Duan et al. (1992) for which [CH4]* depends on in situ salinity, pressure and temperature. Here, we assume that the formed methane gas is inaccessible to microbial activity and hence bypasses anaerobic and/or aerobic oxidation zones. In contrast, dissolved methane can be consumed by anaerobic (AOM) or aerobic oxidation of methane (AeOM). Free gas can re-dissolve into porewater once porewater methane concentration falls below the saturation level and may then become available to methanotrophs. AeOM rate is simply described by a bimolecular rate law (Table S3, R14). The description of AOM depends on the model scenario. For steady-state simulations, we apply a simple bimolecular rate:
It is the simplest and most commonly used formulation of the AOM rate in reaction-transport models (e.g. Regnier et al., 2011). It accounts for kinetic controls and assumes that, under steady-state conditions, bioenergetic controls are negligible (Dale et al., 2006; Regnier et al., 2011).
For transient model simulations, we apply a bioenergetic rate law in combination with an explicit description of the AOM-performing biomass (Dale et al., 2006, 2008c). It has been shown that the rates of redox reactions, whose energy yield is used by micro-organisms to grow, can be coupled to biomass growth rates via a kinetic Monod term and a thermodynamic Boltzmann term (e.g. Rittmann and VanBriesen, 2019). Hence, the time derivative of AOM-performing biomass (B) can be written as
where μg is the growth rate and μd is the decay rate. FK is the kinetic constraint given by
with half saturation constant of and half saturation constant of CH4, according to a typical Michaelis–Menten formulation for enzymatically catalysed reactions. FT represent the thermodynamic limitation and is given by
where R is the gas constant, T is the absolute temperature, χ is the average number of electrons transferred per reaction per mole of ATP produced (Jin and Bethke, 2005), ΔGr is the Gibbs free energy of the reaction and ΔGBQ=20 kJ (mol e−)−1 is the minimum energy needed to support synthesis of mol ATP (Dale et al., 2008c). In order to be thermodynamically favourable, the total energy ΔGr+ΔGBQ has to be negative, meaning that Gibbs free energy provided by the catabolic reaction is sufficient to sustain the microbial biomass growth. ΔGr is given by
with the standard free energy of the reaction, the second term the deviation from standard conditions (temperature and reaction quotient) on Gibbs free energy, and γ a parameter representing departure from ideal behaviour.
The link between substrate consumption and microbial growth (anabolism) is given by Dale et al. (2006)
assuming that the cellular composition of the biomass B is equal to C5H7O2N (Bruce and Perry, 2001; Dale et al., 2006, 2008c; Rittmann and McCarty, 2012). SD is the conversion factor between dissolved and solid species, here represented by micro-organisms (which are assumed to be attached to the solid matrix). Catabolism is linked to biomass growth (anabolism) through the growth yield. We apply a yield of 0.0713 (Dale et al., 2006), which falls at the upper end of reported AOM growth yields, i.e. 0.05–0.07 (Dale et al., 2006; Nauhaus et al., 2007).
2.1.3 Boundary conditions
Boundary conditions place the model in its environmental context. For dissolved species, constant bottom water concentrations (Dirichlet boundary conditions) are applied at the sediment–water interface, while a known flux condition (Neumann boundary condition) are applied for solid species. At the lower boundary, a zero gradient flux boundary condition () is considered for all species except methane, for which a Dirichlet condition is specified to account for methane supplied from thawing permafrost and/or dissociating gas hydrates below.
2.2 Model evaluation
To evaluate the performance of the BRNS set-up in capturing the main diagenetic patterns observed in Arctic shelf sediments we run the model for two case study sites in the area of interest: (1) a site offshore Kotelny Island in the central region of the Laptev Sea, north of the Lena River delta (76.171∘ N, 129.333∘ E, 56 m water depth) collected during the SWERUS-C3 expedition in summer 2014 (Brüchert et al., 2018; Brüchert, 2020).
Although observations are merely available for the first 22 cm, the first 3 m of sediment are simulated to allow for the full development of the early diagenetic network, thus also accounting for biogeochemical processes (e.g. methanogenesis) in deeper sediment layers that potentially affect biogeochemical cycling in the shallower sediment. Observations at the site indicate the absence of active flow and the advective velocity vup is thus set to zero. Upper boundary conditions and model parameters are constrained on the basis of the observations reported (Brüchert, 2020) (Table S4). The observed organic carbon profile is imposed in the first 19 cm (Table S5) and organic carbon contents in deeper sediments are calculated on the basis of the reactive continuum model for organic matter degradation (described in Sects. S2 and S3) and the deepest observed value. In addition, the possibility of a source of methane is implemented at the bottom of the modelled sediment column by applying a Dirichlet boundary condition, thus taking into account the possible presence of methane seeping from deep sediments as results of destabilizing gas hydrates/subsea permafrost – a distinguishing feature of the ESAS sediments. The methane boundary condition is determined by model fitting (see below).
When evaluating model performance, particular attention is given to sulfate, methane, ammonium (), phosphates () and dissolved inorganic carbon (DIC) depth profiles. While the former two species are of main interest for evaluating simulated AOM dynamics, the remaining three serve as indicators for OM degradation dynamics since they are metabolic byproducts of degradation (see Table S2). Moreover, is only affected by nitrification (R7) and adsorption (R28). The latter, although important, acts homogeneously throughout the sediment (considering the slight variation in sediment porosity, LaRowe et al., 2017). It can thus only cause uniform shifts in the profile, but does not affect the overall shape of the depth profile. Similarly, is only consumed by fluorapatite precipitation (R22) and adsorption processes (R29 and R31). Fluorapatite precipitation controls maximum dissolved concentrations, while the mineral adsorption process (R29) exerts a homogeneous influence and the interaction with Fe(OH)3 is expected to be minor and mainly affects within the iron reduction zone.
OM reactivity parameters (a and ν), bottom methane concentration ([CH4]−) and reaction rates are varied to find the best fit between observed and simulated profiles. Methane concentrations at the bottom of the model domain can also exceed the saturation concentration mM (estimated according to the value reported in Dale et al., 2008a) to include the possibility of methane in gaseous form.
2.3 Modelling strategy
2.3.1 Steady-state sensitivity analysis
To evaluate the main physical and biogeochemical controls on the efficiency of the AOM biofilter and its impact on non-turbulent methane emission from deep methane sources such as dissociating permafrost and/or disintegrating methane gas hydrates in ESAS sediments, we conduct a comprehensive, steady-state sensitivity study. For this purpose, we design a set of two baseline scenarios that are broadly representative for environmental conditions encountered on the shallow ESAS:
-
a passive case, i.e. vup=0 cm yr−1;
-
an active case, i.e. with vup=1 cm yr−1, a value which falls within the range of fluid flow velocities cm yr−1 observed across a wide range of different active environments (Regnier et al., 2011).
For both baseline scenarios, we assume a water depth of 30 m, which is slightly shallower than the average water depth of the ESAS ∼45 m (James et al., 2016), since we are here interested in the shallow, near-coastal part of the shelf that potentially hosts large subsea permafrost reservoirs and is most affected by the warming. Temperature is set equal to 0∘ C and is thus similar to the yearly average of −0.79∘ C observed in the Laptev Sea at a depth of about 30 m (Dmitrenko et al., 2011). The bioturbation coefficients and bioirrigation coefficients α0 (Thullner et al., 2009) are then derived from global empirical relationships according to Middelburg et al. (1997) and Thullner et al. (2009), respectively. The methane saturation concentration [CH4]* is calculated on the basis of the relationship proposed by Dale et al. (2008a) assuming a soil matrix density of 2.41 g cm−3. Values of φ0 and c0 (see Eq. 4) are determined based on LaRowe et al. (2017). Boundary conditions are reported in Table S7 and informed by observations. They are chosen to be broadly representative of the wider Siberian shelf environment.
Each sensitivity study run is forced with a range of different dissolved [CH4] concentrations at the lower model boundary, mimicking different methane fluxes from thawing subsea permafrost and/or disintegrating methane gas hydrates at depth. The applied set of methane concentrations at the lower boundary range from zero to the methane gas saturation concentration 0–20–100–330–1169–5455 µM and also include the highest methane concentration that has been to date observed in ESAS cores (Overduin et al., 2015) ( mM).
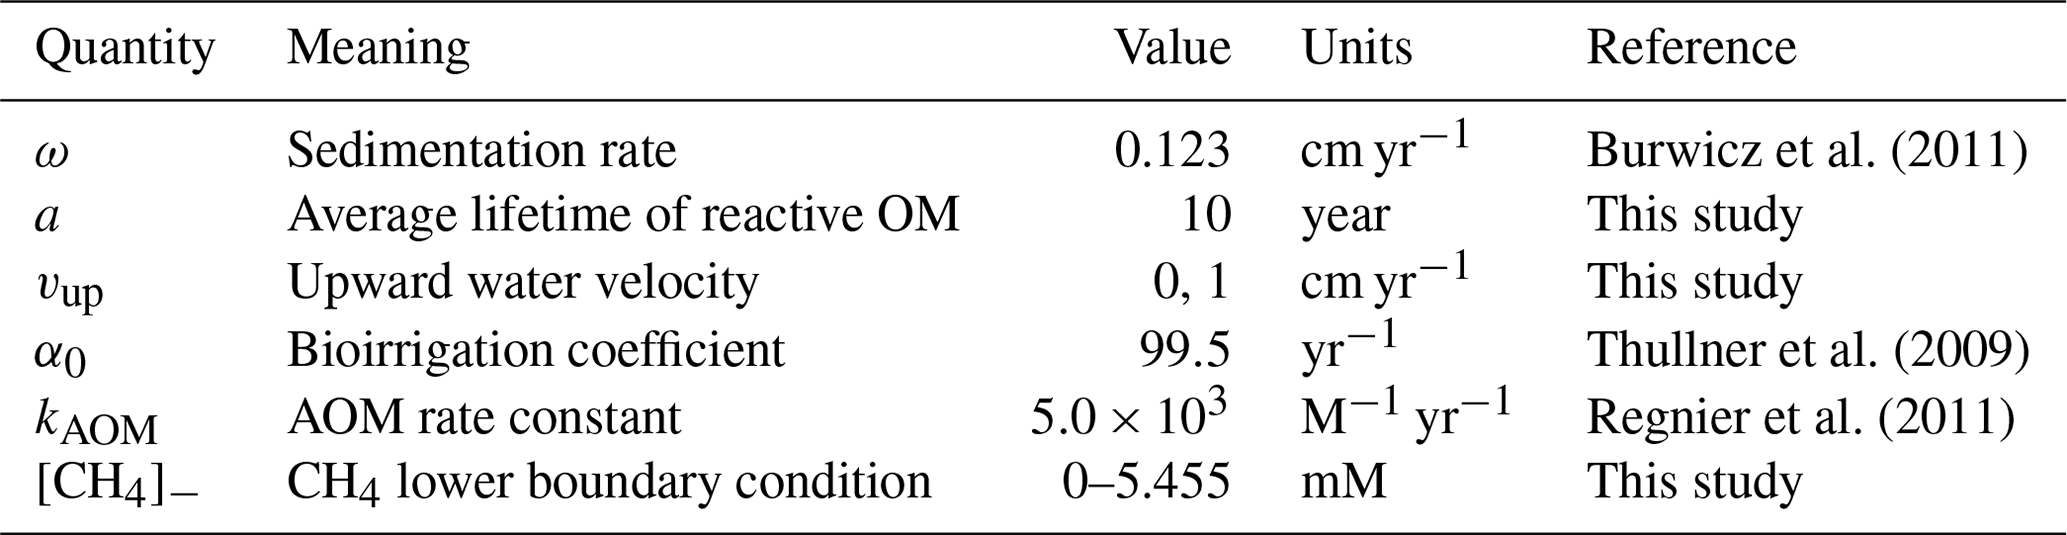
Table 1 and Table S6 summarize the parameters applied in the baseline simulation and Table S7 provides an overview of the applied upper boundary conditions.
Burwicz et al. (2011)Thullner et al. (2009)Regnier et al. (2011)Table 1Model parameters changed in the “one-at-time” sensitivity studies. Reported values are for the baseline simulations.
To assess the influence of environmental conditions on the efficiency of the AOM biofilter and its influence on non-turbulent methane emission from dissociating permafrost and/or disintegrating methane gas hydrates in ESAS sediments a set of five “one-at-time” parameter variation experiments is designed. It encompasses the most important controls on benthic methane cycling (Regnier et al., 2011; Meister et al., 2013; Egger et al., 2018) and parameter variation experiments are performed for both the passive as well as active baseline scenarios.
-
Sedimentation rate ω. The sedimentation rate is varied over 2 orders of magnitude (0.03–0.123–0.17–1.5 cm yr−1). Maximum values are comparable to terrestrial sediment accumulation rates in the Lena River delta (Bolshiyanov et al., 2015), fast marine sedimentation rates during the early Holocene sea transgression (Bauch et al., 2001) and marine accumulation on subsea permafrost deposit in Buor Khaya Bay (∼1.1 cm yr−1, inferred from Overduin et al., 2015), while minimum values are representative of sedimentation rates found in the East Siberian Arctic Sea (Stein et al., 2001 in Levitan and Lavrushin, 2009). The baseline value of ω is calculated based on the empirical global relationship proposed by Burwicz et al. (2011).
-
Active fluid flow vup. Buoyancy-induced motion (Baker and Osterkamp, 1988), water streams channeled through fault lines or groundwater discharge (Charkin et al., 2017) can cause active fluid flow in Arctic shelf sediments underlain by subsea permafrost or gas hydrates (Judd and Hovland, 2009; Semenov et al., 2019). Therefore, vup is varied from 0–0.3–0.5–1–3–7–10 cm yr−1. This interval falls in the range of reported upward advective water velocities in marine sediments 0.005–30 cm yr−1 (Regnier et al., 2011).
-
AOM constant kAOM. Rate constants implicitly account for factors that are not explicitly described in the model and thus tend to show a strong variability between sites. A comprehensive compilation of published model AOM rate constants (Regnier et al., 2011) reveals a variability of over 6 orders of magnitude (10–107 M−1 yr−1). The AOM rate constant kAOM (Eq. 5) is thus varied over the range –5×10³–5×10⁴–5×10⁵–5×10⁶–5×10⁷ M−1 yr−1.
-
Organic matter reactivity (i.e. RCM parameters). Although the apparent OM reactivity is controlled by a combination of two parameters (a and ν), previous studies indicate a less pronounced variability in ν (Arndt et al., 2013; Sales de Freitas, 2018), as well as a strong control of a on the sulfate–methane transition zone (SMTZ) depth (Regnier et al., 2011; Meister et al., 2013). Thus, ν was kept constant, while a was varied over the entire range of previously published values a=0.1–1–10–100–500–1000 years (Arndt et al., 2013). Studies about ESAS organic matter degradation show a reactivity of deposited organic matter which is compatible with the RCM parameters we explored. For instance, Bröder et al. (2016) found a half life for the organic carbon in the East Siberian Arctic Shelf of 19–27 years, which would correspond to a=3.4–4.8 years, with ν=0.125.
-
Bioirrigation coefficient α0. Bioirrigation activity remains largely unconstrained on the Siberian shelf due to the scarcity of observational data (Teal et al., 2008). However, environmental stressors, such as ice scouring (e.g. Shakhova et al., 2017, and references therein) and trawling, which can dig furrows up to few metres (Shakhova et al., 2017) are detrimental to the local fauna, thus suggesting a low bioirrigation intensity. However, observations from other polar sites indicate that although biological diversity and activity is often low, it might be locally enhanced (Clough et al., 1997). In addition, ice scouring might also enhance non-local transport seasonally. We therefore varied α0 over the entire range of plausible values: 0–33–66–99.5–120–240 yr−1 (Thullner et al., 2009).
2.3.2 Transient sensitivity study
Dale et al. (2008c) showed that temporally varying environmental conditions may reduce the efficiency of the benthic AOM filter and facilitate methane escape due to the delayed response of the microbial community to changing conditions. Therefore, in addition to the steady-state sensitivity study, we also performed a series of transient simulations to explore the impacts of seasonal and projected climate change on benthic methane effluxes on the ESAS in response to changing upward methane fluxes from dissociating permafrost and/or disintegrating methane gas hydrates. Transient simulations were run with a bioenergetic rate law for AOM (Eq. 6) and an explicit description of AOM biomass. Simulation results from the passive steady-state baseline run with mM were used as initial conditions for the transient experiments. Four different transient environmental perturbation scenarios that reflect seasonal (1, 2) as well as idealized future (3, 4) environmental variability on the ESAS were run with three different values of vup=0–1–5 cm yr−1 over a period of 200 years.
-
Seasonal CH4: seasonal change in methane supply from permafrost thaw and/or hydrate destabilization. CH4 concentration at the bottom of the sediment column: null for 6 months, then increasing up to a peak of [CH4]− (20–100–330–1169–5455 µM) for the remaining 6 months of the year and again back to null concentration.
-
Seasonal : seasonal freshening of waters due to riverine discharge and sea ice melt. During winter, higher bottom salinity (Dmitrenko et al., 2011) results in higher sulfate concentration (Dickson and Goyet, 1994), while lower salinities and thus sulfate concentrations characterize the melt season. The bottom boundary condition for methane [CH4]− follows an opposite trend: it is set to zero during the winter months and increases in Arctic summer.
-
Linear CH4: slow increase in methane supply from permafrost thaw and/or hydrate destabilization. A linear increase in the bottom boundary methane concentration [CH4]− (from 0 up to the peak) over 200 years is applied.
-
Sudden CH4: abrupt increase in methane supply from permafrost thaw and/or hydrate destabilization. An instantaneous change in bottom boundary methane concentration – from 0 to one of the peak value [CH4]− – is applied.
2.3.3 Analysed output
For each simulation we evaluate the effect of the respective parameter change on
-
the non-turbulent (i.e. not-ebullition-driven) flux of methane from the sediments into the water column;
-
the depth of the SMTZ;
-
the efficiency (η) of the AOM biofilter (see Appendix A for the exact definition of AOM applied here).
In addition, fluxes of and CH4 at the SMTZ, the maximum and integrated AOM rate and the Damköhler number (Da) for AOM and methanogenesis are also calculated. The Damköhler number is defined as Eq. (B4) (see Appendix B) and sets the ratio between the typical transport timescale and the typical reaction timescale. If Da<1, the reaction timescale is longer than transport timescale (i.e. the reaction is slower) and the process is reaction-limited. If Da>1 the process is transport-limited. Finally, for transient simulations, the integrated AOM-performing biomass (ΣB) was also analysed.
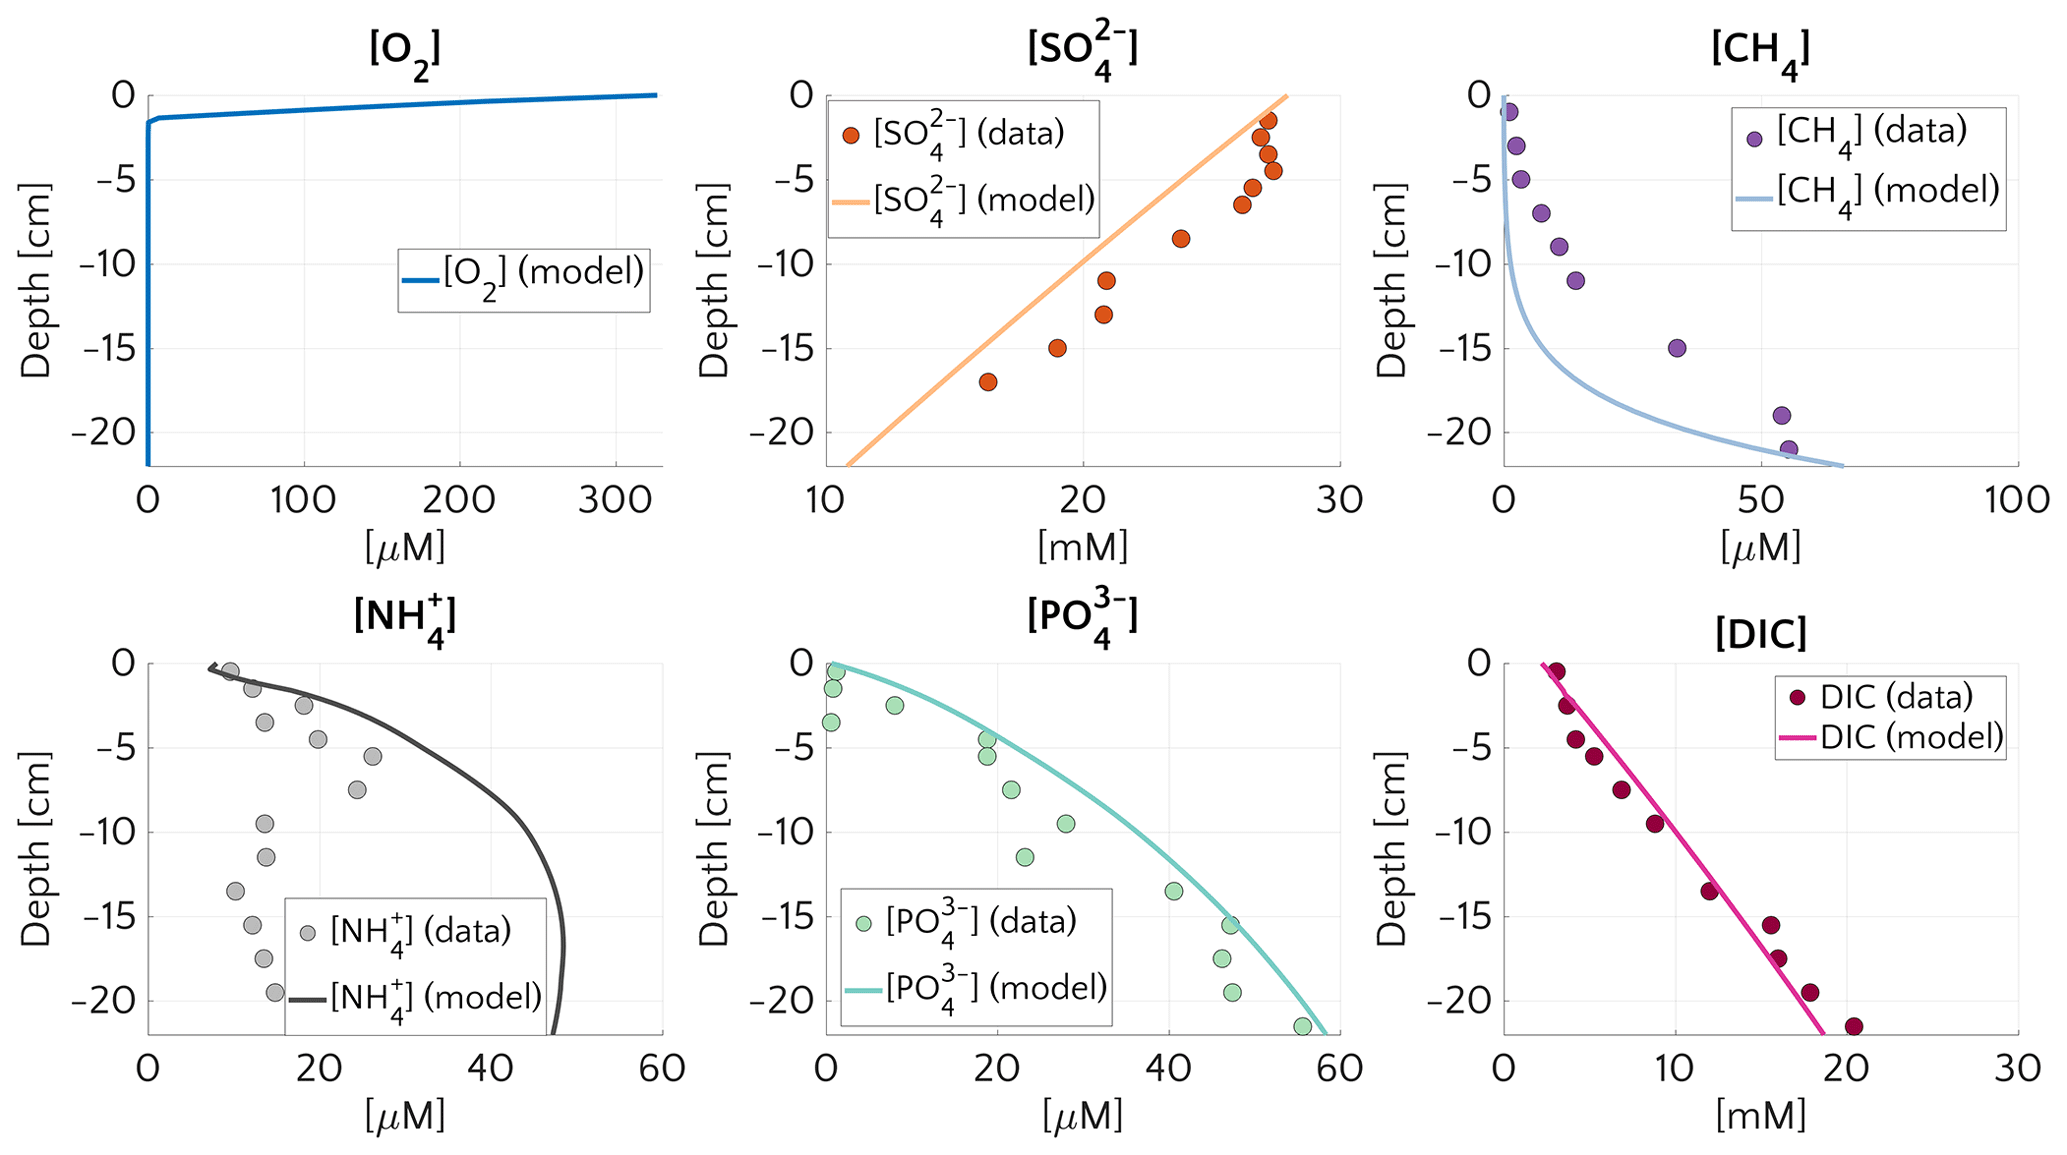
Figure 1Pore water concentration profiles for O2, , CH4, , and DIC at site 14-3 on the Laptev Sea (76.171∘ N, 129.333∘ E, 56 m water depth). Dots represents the measurements and continuous lines the simulated results. The boundary conditions and model parameters employed in the model are reported in Table S4, the measured organic carbon content in Table S5. For O2 no measured profile is available.
3.1 Case study: sediment core on the Laptev Sea shelf
Figure 1 compares simulated and observed depth profiles for site 14-3. Cores were retrieved during the SWERUS-C3 campaign (Miller et al., 2017; Brüchert et al., 2018; Brüchert, 2020). Simulation results show an overall good agreement with measurements, but also reveal a slight overestimation of . Data–model fitting reveals that reconciling simulated and observed CH4 and depth profiles requires a diffusive flux of CH4 through the lower model boundary (i.e. a bottom boundary concentration of mM). Neither higher marine OM contents in sediment layers below the first 22 cm for which observations are available, nor higher reactivities results, can satisfactorily reproduce the observed sulfate depletion and observed gradients. Model–data fitting thus not only highlights the important role of AOM in controlling the SMTZ, but also indicates that upward migrating methane from deep, pre-Holocene sources, such as subsea permafrost in the sediment might be an ubiquitous feature on the Siberian shelf.
The simulated and DIC profiles are in good agreement with data, suggesting that the degradation dynamics of marine organic matter and adsorption are well captured by the model – although the maximum concentration of at depth is mostly controlled by the saturation value of . The largest discrepancy between data and modelling results is observed for . Observed concentrations first increase to a maximum at about 6 cm depth and the slightly decrease in the lower sediment layers, whereas simulated show an asymptotic increase in concentrations. The observed profile might either indicate changes in OM reactivity and/or characteristics or spatially heterogeneous adsorption/desorption dynamics. Such heterogeneity is not incorporated into the model, and accounting for it would require additional information.
3.2 Main physical and biogeochemical controls on potential non-turbulent methane flux from ESAS sediments
3.2.1 General patterns of methane and sulfate cycling on the ESAS
The comprehensive ensemble of all sensitivity experiments allows exploration of the general patterns of methane and sulfate cycling under a range of environmental conditions that is broadly representative for conditions encountered on the ESAS at present (Fig. 2). Model results confirm that AOM is an efficient sink for the diffusive CH4 supply from below. For most of the investigated environmental conditions (95 % of the runs), 95 %–99.9 % of the upward diffusing CH4 is consumed within the SMTZ, resulting in very small or negligible methane effluxes ( µmol CH4 cm−2 yr−1) from the sediment. If upscaled to the total area of the ESAS ( km2, Wegener et al., 2015), for which methane outgassing estimates have been published, the smallest simulated non-turbulent methane flux (i.e. µmol cm−2 yr−1, Fig. 2b) would sum up to a total flux of 2.1 mmol CH4 yr−1, resulting in a negligible role of non-turbulent, benthic methane fluxes to the Arctic methane budget.
However, results also show that, under a specific set of environmental conditions that lower the efficiency of the AOM biofilter (see detailed discussion below), non-turbulent CH4 escape from ESAS sediments can reach values of up to 27 µmol CH4 cm−2 yr−1. Simulation analysis shows that these high effluxes and, thus, low AOM biofilter efficiencies are generally obtained for environmental conditions that cause a shallow location of the SMTZ (<18 cm) and that they are very sensitive to changes in environmental conditions that would cause a deepening of the SMTZ. For instance, a deepening of the SMTZ from 18 to 26 cm results in a rapid increase in AOM efficiency from 1 % to 98 % (Fig. 2a). Furthermore, results indicate that, for SMTZ depths larger than 26 cm, AOM remains an efficient barrier across the full spectrum of investigated environmental conditions (Fig. 2). The observed link between AOM filter efficiency and SMTZ is reflected in the strong (semilog) linear relationship between methane flux at the SWI and the SMTZ depth (Fig. 2b). Such a relationship reveals the pivotal connections between these two quantities and mirrors the empirically found linear log–log relationship between measured CH4 fluxes at the SMTZ and the SMTZ depths (Fig. S5 in the Supplement) by Egger et al. (2018). Maximum simulated CH4 effluxes are thus comparable in magnitude to fluxes reported from other settings potentially sensible for CH4 emissions. These include mud volcanoes, e.g. in the Gulf of Cadiz: 2.1–40.7 µmol CH4 cm−2 yr−1 (Niemann et al., 2006a); Håkon Mosby mud volcano in the Barents Sea: 0.03 µmol CH4 cm−2 yr−1 (Niemann et al., 2006b) and coastal settings, e.g. a Dutch coastal reservoir (20–80 µmol CH4 cm−2 yr−1, Egger et al. (2016)) or tidal flats (4–800 µmol CH4 cm−2 yr−1 Borges and Abril, 2011). Upscaling the highest simulated non-turbulent flux (27.48 µmol CH4 cm−2 yr−1) to the ESAS results in a total efflux of 0.408 Tmol CH4 yr Tg CH4 yr−1. This value represents an estimated upper limit which, for comparison, equals ∼10 % of global marine seepage at seabed level (Saunois et al., 2016) and is in magnitude similar to the global methane efflux that has been estimated for upper continental slope sediments on a centennial timescale (4.73 Tg CH4 yr−1, Kretschmer et al., 2015).
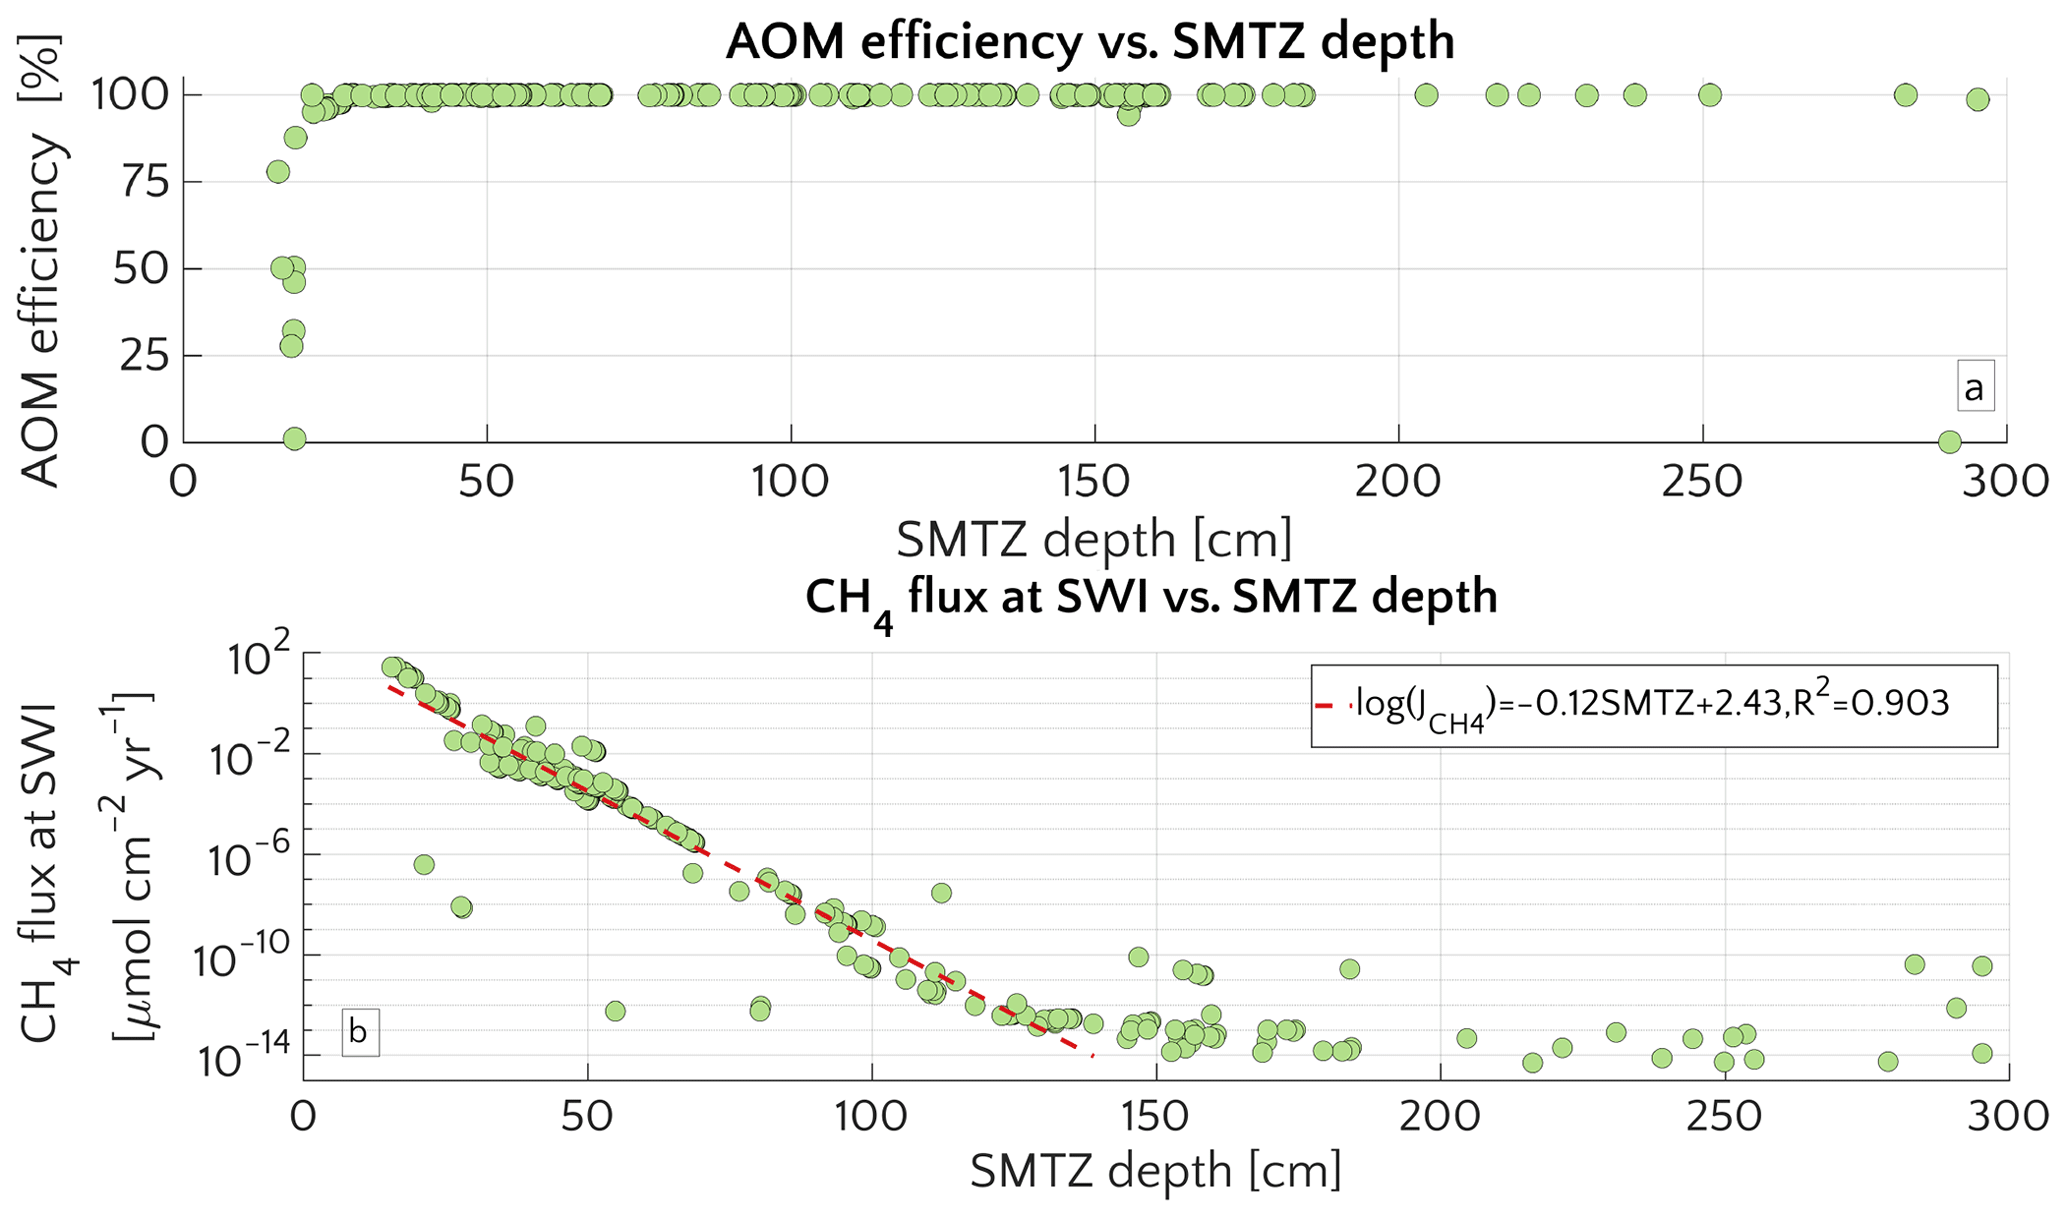
Figure 2Aggregation of all the simulation performed for the “one-at-time” sensitivity study. (a) AOM efficiency versus the depth of the SMTZ. (b) Scatter plot and semi-log fit of the methane flux () at the SWI versus SMTZ depth.
Further insights into the general drivers that control methane dynamics in ESAS sediments are provided by Damköhler numbers. Damköhler numbers for simulated methanogenesis (DaMG) and AOM (DaAOM) are reported in Fig. S2. DaMG (purple circles) are <1, span a range of ∼0.0021–0.43 and are thus comparable to previously reported DaMG of 0.22 for methane gas hydrate bearing sites, such as the Hydrate Ridge and Kithley Canyon (Chatterjee et al., 2011). They reveal that methanogenesis is always slower than methane transport and that CH4 dynamics driven by methanogenesis are thus reaction-limited. This result is consistent with the fact that methanogenesis rates are merely supported by the slow influx and transport of OM by burial and bioturbation.
In contrast, high DaAOM values (DaAOM=32–2.78×10⁵ – Fig. S2, orange circles), show that AOM is transport-limited, suggesting a sensitive role of transport parameters in determining AOM efficiency and in controlling methane flux across the SMTZ and subsequently the SWI.
3.2.2 Environmental controls and mechanisms of methane escape from ESAS sediments
The simulated general patterns of methane and sulfate cycling on the ESAS broadly corroborate previous findings regarding the dominant environmental controls on AOM biofilter efficiency and SMTZ depth (Regnier et al., 2011; Egger et al., 2018; Meister et al., 2013; Winkel et al., 2018). However, they also challenge intuitive views on the factors that favour high CH4 escape through the SWI. In particular, they highlight the essential link between AOM efficiency and SMTZ depth and the central importance of environmental conditions that control the depth of the SMTZ. In addition, they suggest that transport processes play a dominant role for non-turbulent methane effluxes from ESAS sediments. The following sections explore the role of each of the investigated environmental conditions on methane efflux in more detail and also shed light on the mechanisms behind non-turbulent methane escape from ESAS sediments.
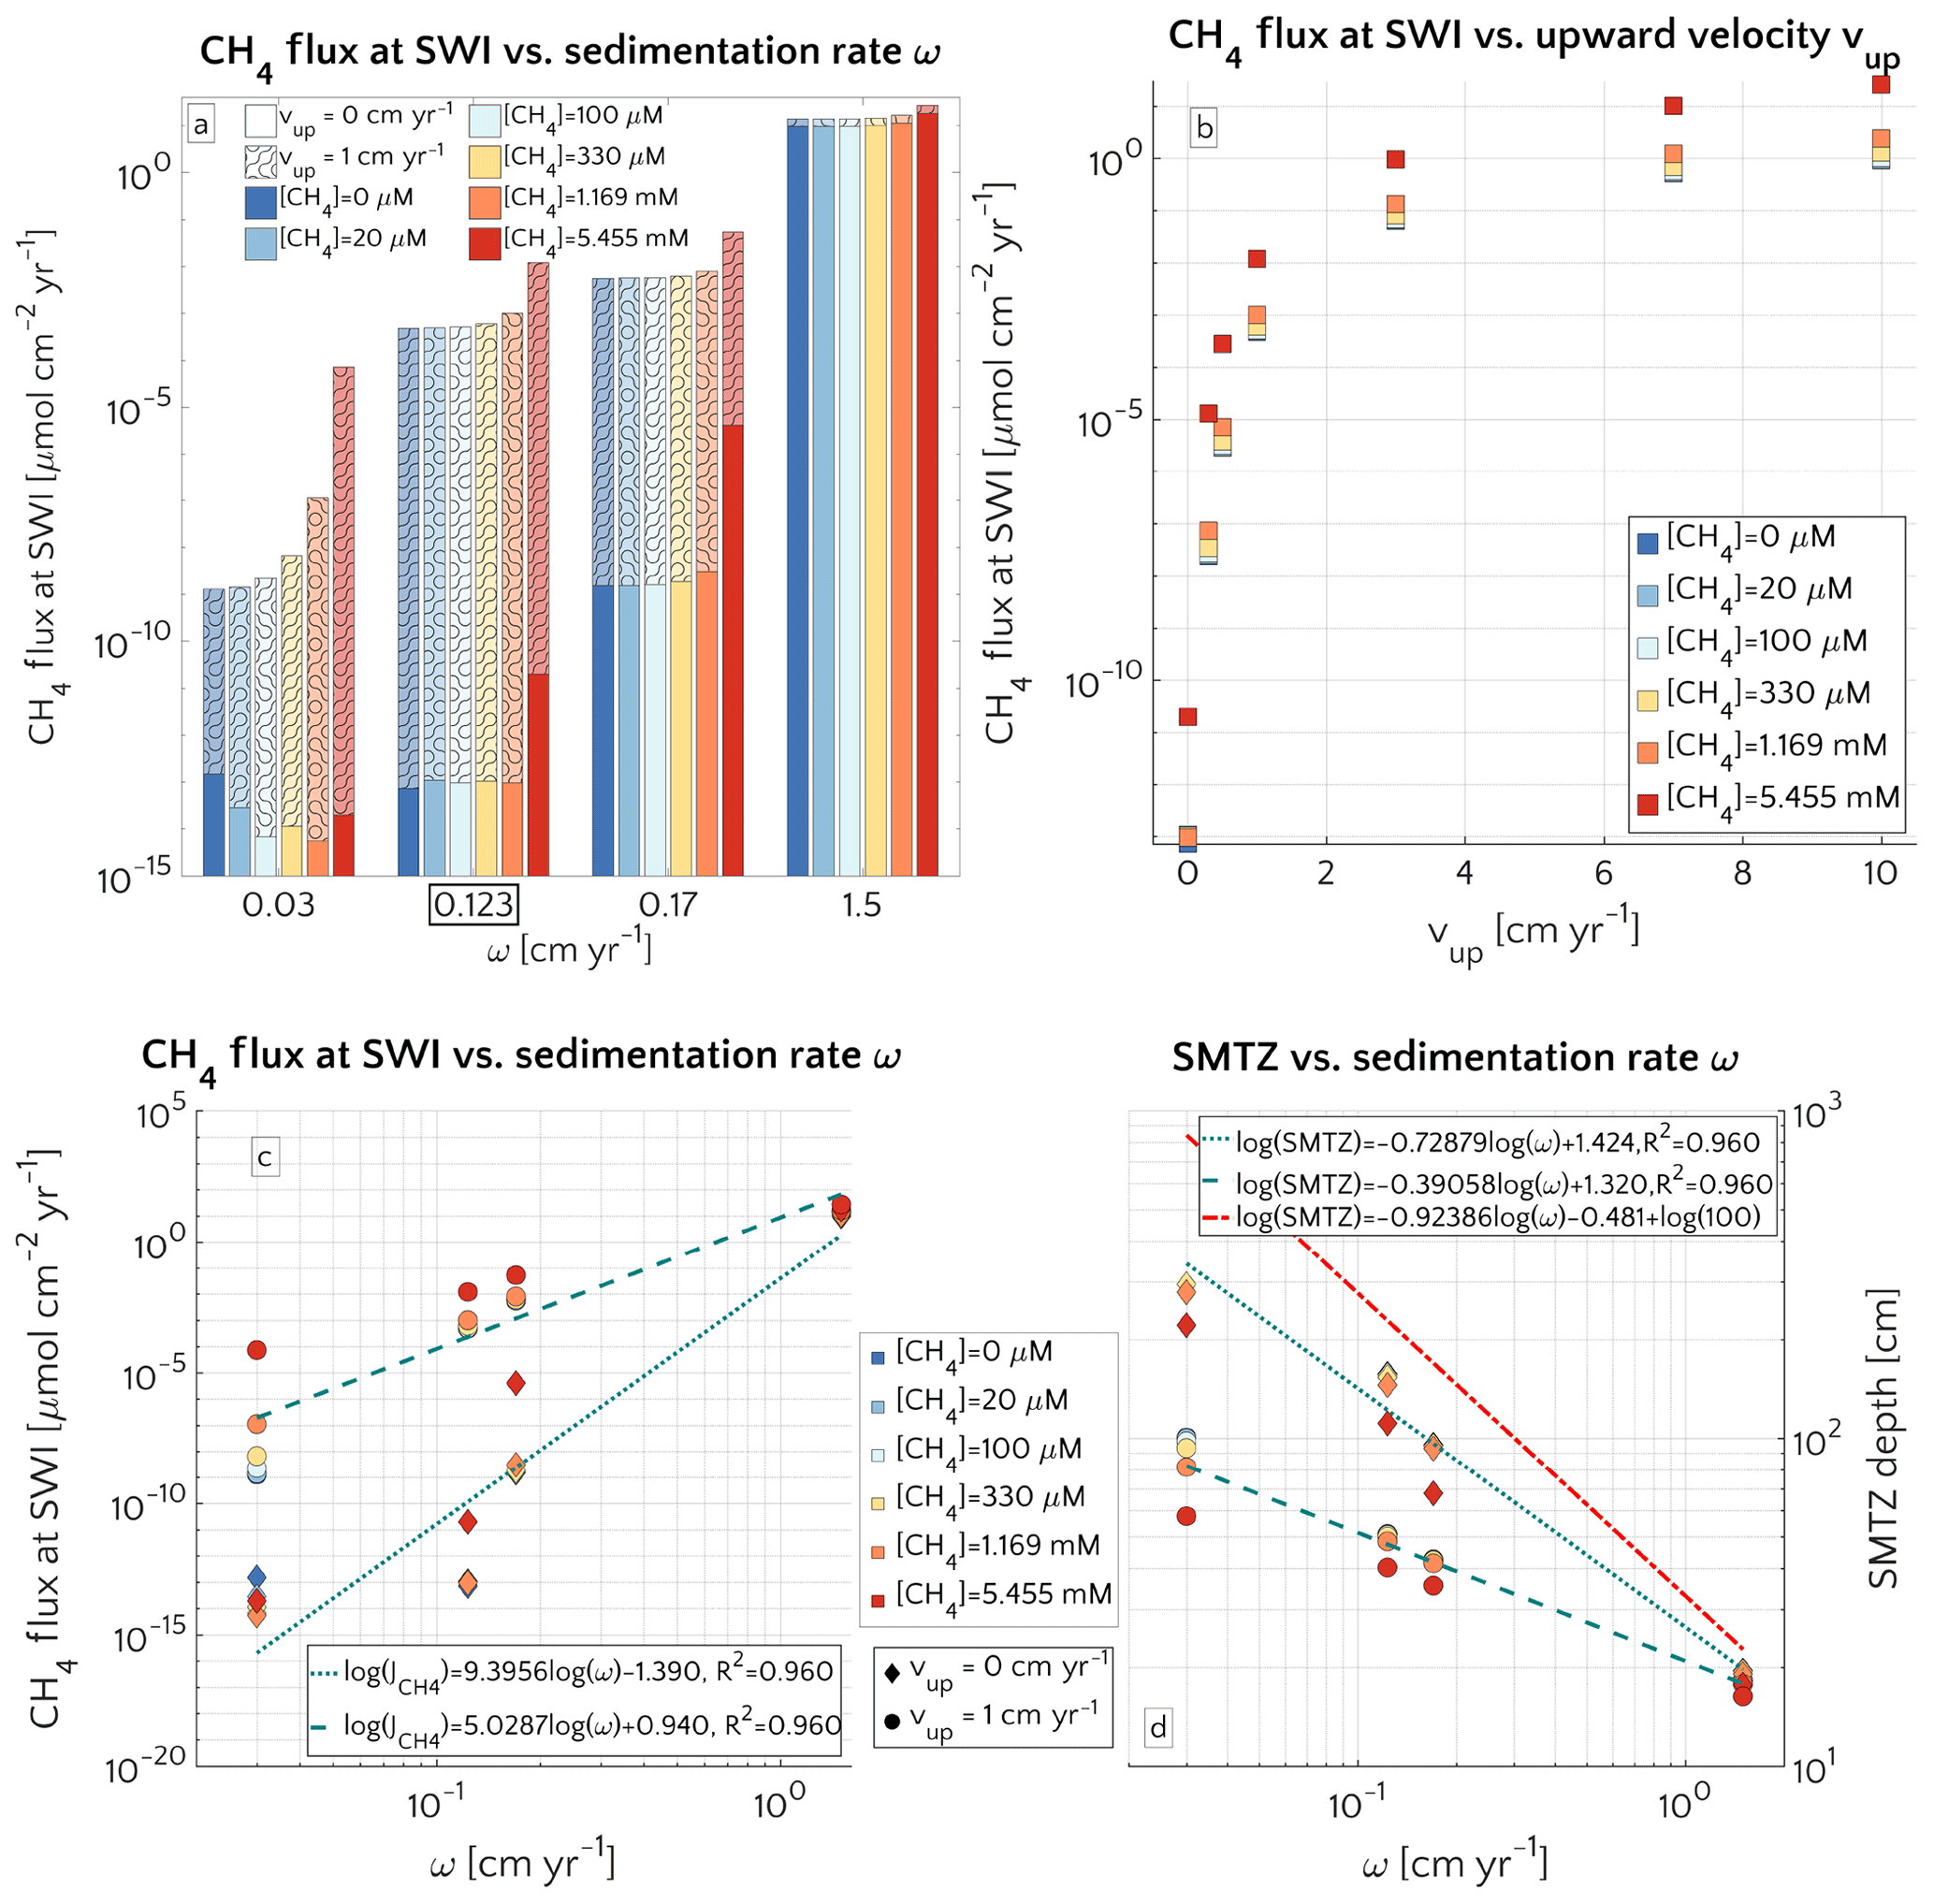
Figure 3(a) Barplot of the methane flux at the SWI versus ω for passive case (plain style) and active case (pattern style) and the [CH4]− reported in the text. The squared value of ω is the reference value. (b) Semilog plot of methane flux at SWI versus vup for the different [CH4]− reported in the text. (c) Log–log plot of methane efflux at SWI versus ω for passive case (diamonds) and active case (circle). The log–log fit is also displayed. (d) Log–log plot of SMTZ depth versus ω for passive case (diamonds) and active case (circle) with log–log fit. The red line is the trend found by Egger et al. (2018) (the term log(100) is to take into account unit conversion).
3.2.3 Role of advective transport
Figure 3a illustrates the effects of sedimentation rate ω on the flux of methane across the SWI. For both active (vup=1 cm yr−1) and passive (vup=0 cm yr−1) settings, simulated CH4 effluxes increase as a power with sedimentation rate (log–log linear; see Fig. 3c) from µmol CH4 cm−2 yr−1 for low sedimentation rates (ω=0.03 cm yr−1) to values as high as 27.5 µmol CH4 cm−2 yr−1 for high sedimentation rates (ω=1.5 cm yr−1). Accordingly AOM acts as an efficient filter for upward diffusing methane (with η∼100 %, see Fig. S4), in slowly accumulating sediments.
In contrast, the efficiency of the AOM biofilter drops to 50 %–0 % for high sedimentation rates. The main driver behind the simulated high CH4 fluxes and low AOM efficiencies in these rapidly accumulating sediments, are enhanced methanogenesis rates. High sedimentation rates not only facilitate the supply of organic matter to the methanogenic zone of the sediment, but also reduce residence times in the upper sediment layer, resulting in a lower OM age (see Eqs. S14 and S16 in the Supplement) or degradation state (see Eq. S12) within the methanogenic zone. The enhanced supply of reactive OM to anoxic sediment layers supports higher methanogenesis rates, resulting in higher methane porewater concentrations and an upward shift of the SMTZ.
In addition, the presence of active fluid flow further enhances methane efflux. The CH4 fluxes from below adds complexity to the overall methane dynamics and this effect is investigated further by contrasting Damköhler numbers for passive and active settings on the shelf. Table S8 shows that for low to intermediate sedimentation rates, DaAOM values significantly decrease with vup, indicating that less and less methane consumption occurs within the typical transport timescale τT, thus leading to a reduction in AOM biofilter efficiency.
Maximum simulated flux differences between active and passive settings can reach up to 10 orders of magnitude. However, flux differences quickly decrease with increasing sedimentation rates. Rapidly accumulating sediments show almost no difference in efflux between active and passive sites (Fig. 3a). In contrast to sedimentation rates, the mechanism behind the control of vup on non-turbulent methane efflux is straightforward and self-evident. Active flow enhances the upward transport of CH4, shifting the SMTZ upwards and, thus, increasing CH4 concentrations at shallow sediment depths (see Fig. 3d). The apparent paradox of the CH4 efflux insensitive to fluid flow in fast accumulating sediments can be resolved by examining the dissolved CH4 depth profiles (Fig. 4). Simulated depth profiles are nearly identical and reveal CH4 concentrations at or near the saturation concentration. In fast accumulating sediments, high methanogenesis rates result in an over-saturation of porewaters directly below the generally shallow SMTZ. High methanogenesis rates thus support the build-up of methane gas. Methane gas formation also explains why, in these cases, integrated methanogenesis exceeds non-turbulent CH4 fluxes by up to 6 times. In rapidly accumulating, active and passive sediments, non-turbulent CH4 fluxes are thus essentially identical. However, active settings will be characterized by the additional build-up of gaseous CH4 and its potential escape through the sediment–water interface – a process not simulated in the present study.
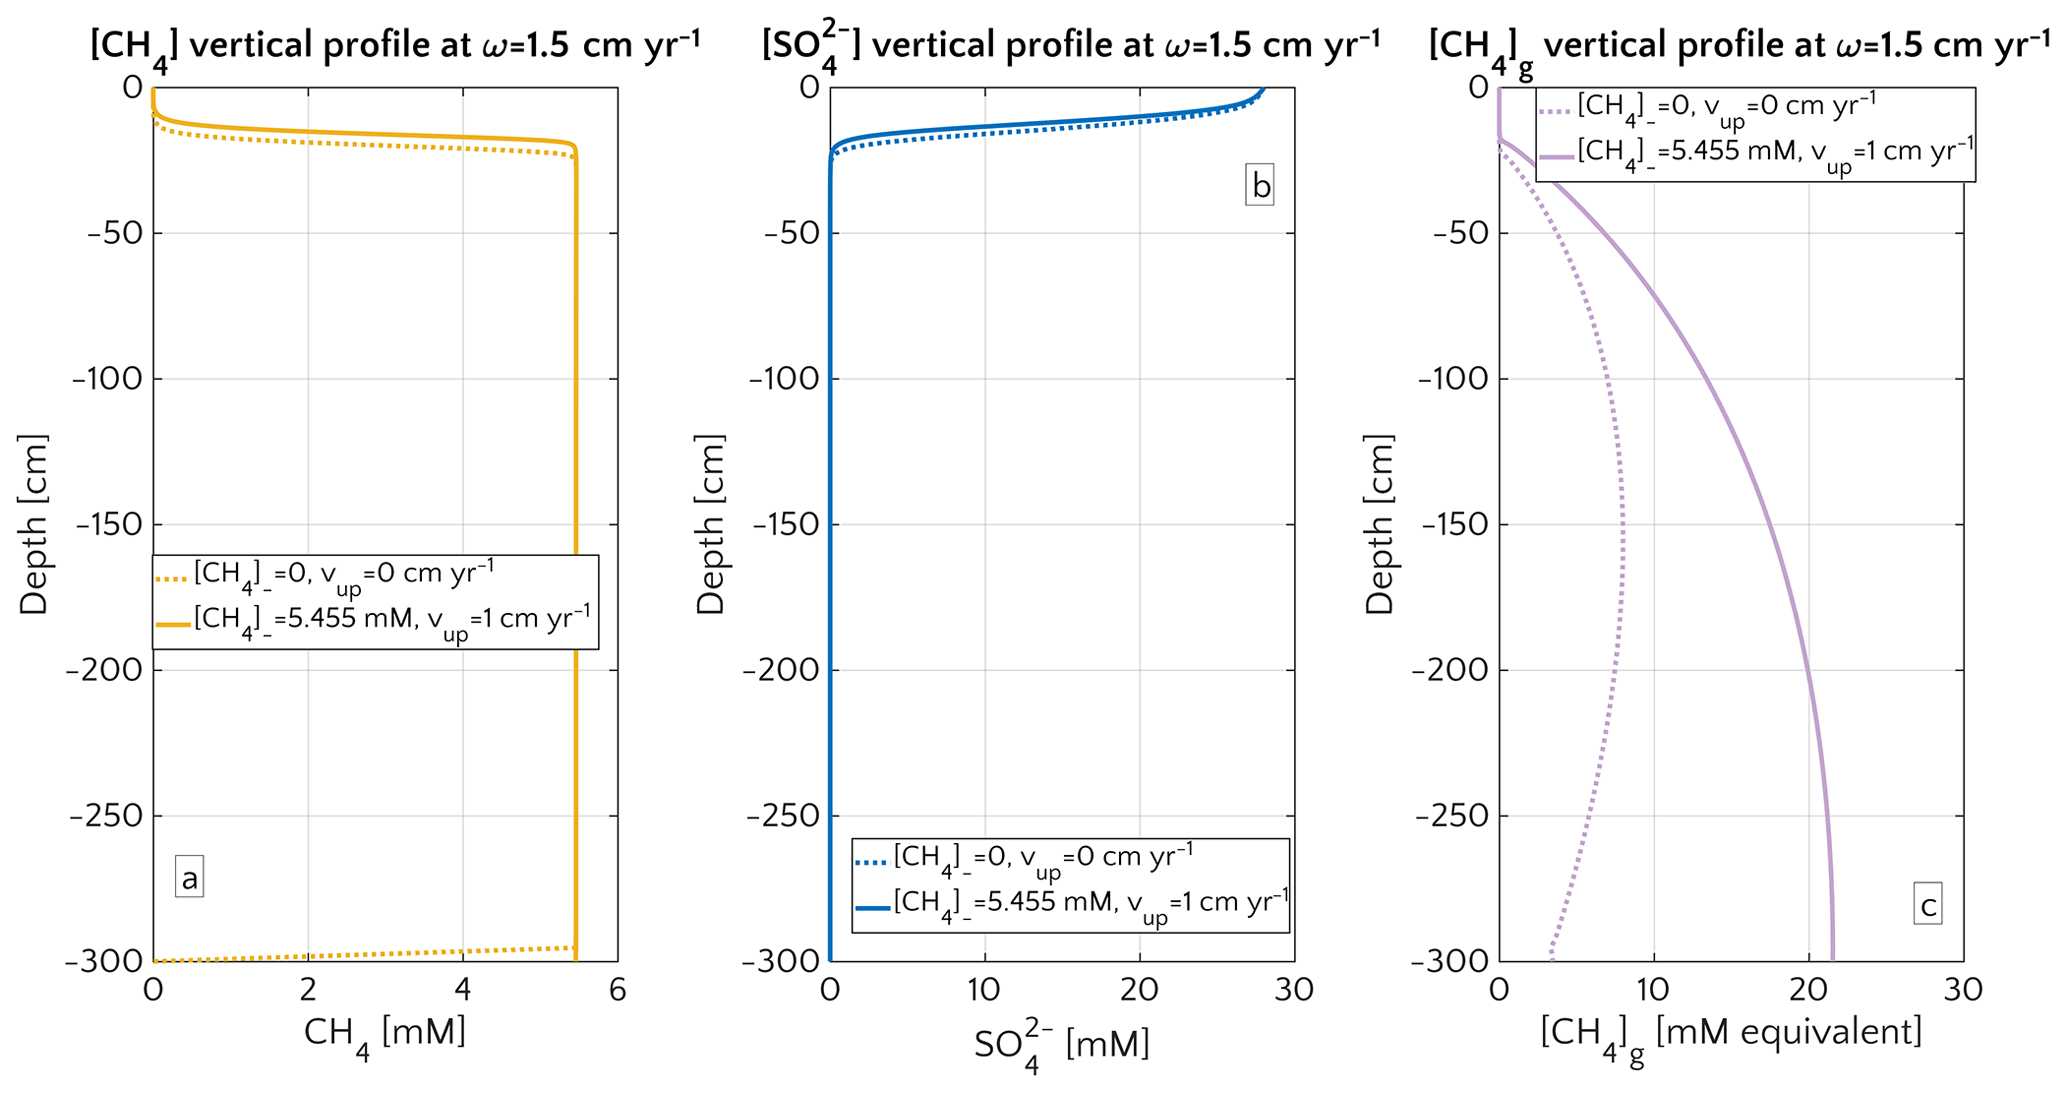
Figure 4Porewater profiles in the case of ω=1.5 cm yr−1 for CH4 (a), (b) and gaseous CH4 (c). Dashed lines are simulation in passive scenario with mM, while continuous lines simulations display active scenario with mM, corresponding to the saturation concentration in the environmental conditions considered for the representative profile.
Model results thus show that the dominant mechanism behind the observed transport-control on non-turbulent CH4 efflux is an overall increase in CH4 concentration and an upward shift of the SMTZ rather than an increasing relative contribution of advective transport processes to the total efflux. In fact, a comparison of the different methane transport processes across the SWI (i.e. molecular diffusion, bioturbation-induced diffusion, bioirrigation and advective transport, as explained in Sect. S1 in the Supplement) shows that the relative contribution of both the advection and molecular diffusion flux to the total flux is small and further decreases with increasing vup (Fig. S3). High non-turbulent methane effluxes in rapidly accumulating and/or active settings are thus largely driven by the non-local irrigation flux (see Sect. 3.2.5 for more details on the role of irrigation). With increasing ω or vup, the SMTZ shifts upwards, resulting in higher methane concentrations at shallow sediment depths and thereby reinforcing the relative contribution of non-local transport for CH4 fluxes, as well as lowering the efficiency of the AOM barrier from η∼100 % to η∼78 %. The important role of the SMTZ location as a key control on CH4 efflux is further confirmed by the observed power-law relationship between the location of the SMTZ and ω (Fig. 3d). This result is qualitatively in agreement with the global compilation of empirical data by Egger et al. (2018), which reveals the same log–log decreasing trend between SMTZ and sedimentation rate. Our results are also consistent with observations from brackish sediments that show that sedimentation rates >10 cm yr−1 give rise to high non-turbulent CH4 fluxes (20–80 µmol CH4 cm−2 yr−1) and a high OM burial efficiency (∼78 %, Egger et al., 2016). Egger and co-workers explained these findings by the slow growth of AOM micro-organisms and the resulting inability of the microbial community to consume all of the CH4 produced. However, our results show that the same pattern can be observed without having to invoke a low AOM efficiency. Our simulations thus indicate that the rapid burial of reactive organic matter to deeper sediment layers in rapidly accumulating sediments is sufficient to explain high CH4 effluxes.
3.2.4 Role of organic matter quality
The quality of organic matter deposited onto the sediment exerts an additional control on CH4 efflux. Figure 5 illustrates the influence of organic matter quality (as a function of OM degradation model parameter a; see Eq. S12) and sedimentation rate ω on non-turbulent methane efflux for both active and passive settings, as well as different methane fluxes from below. Results corroborate the dominant influence of sedimentation rates on methane efflux, while organic matter quality exerts a secondary control. This also means that, in order to assess the main features of possible CH4 efflux in terms of modelling, capturing the details of organic matter quality is not fundamental. Maximum fluxes are generally simulated for rapidly accumulating sediments ω>0.5 cm yr−1 that receive organic matter of intermediate quality (a=10–100 years).

Figure 5Flux of methane at the SWI as dependent on a and ω. For mM (a, c) and mM (b, d), and passive (a, b) and active (c, d) case. The circle with pattern corresponds to the baseline simulation.
These findings are in agreement with previously published studies (Regnier et al., 2011; Meister et al., 2013) and can be explained with the fact that high methanogenesis rates require a supply of reactive OM to the methanogenic zone. If organic matter quality is high (a<10 years), methanogenesis becomes substrate limited due to the rapid degradation of organic matter through energetically more favourable degradation pathways in the shallow sediments. In turn, if organic matter quality is low (a>100 years), methanogenesis becomes reactivity limited. And this is especially true for ESAS sediments at depth. Therefore, the ideal combinations of organic matter reactivity and sedimentation rate that result in maximum methane effluxes correspond to conditions characterized by OM that is (i) sufficiently reactive to support enhanced methanogenesis rates and thus an accumulation of CH4 at depth, but (ii) sufficiently unreactive (in comparison to the burial rate) to escape the complete degradation in non-methanogenic sediments. BRNS outcomes show that the onset of active fluid flow and an enhanced methane supply from below (i.e. higher CH4 concentration at the lower boundary) increase the CH4 efflux through the SWI without altering the overall patterns (see Fig. 5a–b versus 5c–d).
3.2.5 Role of non-local transport
The analysis of the influence of bioirrigation on non-turbulent CH4 efflux from the ESAS (Fig. S12) shows that such a process enhances methane efflux in sediments that are characterized by a shallow SMTZ. However, bioirrigation exerts a limited effect under a range of environmental conditions that favour a deep or shallow SMTZ location, respectively.
In passive settings, changes in bioirrigation coefficient (α0) exert a limited control on CH4 effluxes. For most passive scenarios, the SMTZ is located well below the sediment layer affected by bioirrigation (zirr=3.5 cm, which implies that bioirrigation is strongly suppressed below 15 cm) and, thus, changes in α0 have no effect on methane efflux.
In contrast to passive settings, active settings reveal a rapid increase in methane efflux with the onset of bioirrigation activity. Methane effluxes first increase by up to 5 orders of magnitude from α0=0 yr−1 to α0=5 yr−1, reaching maximum effluxes of ∼0.02 µmol CH4 cm−2 yr−1, before remaining almost constant with a further increase in bioirrigation coefficients (up to 240 yr−1). The simulated increase in methane efflux is a direct effect of the transport process itself, which enhances the upward transport of methane accumulating in the upper sediment layers, including layers below the generally shallow SMTZ.
These results are corroborated by the concomitant analysis of CH4 dynamics over the three-dimensional transport coefficient ω, vup and α0 space shown in Fig. 6.
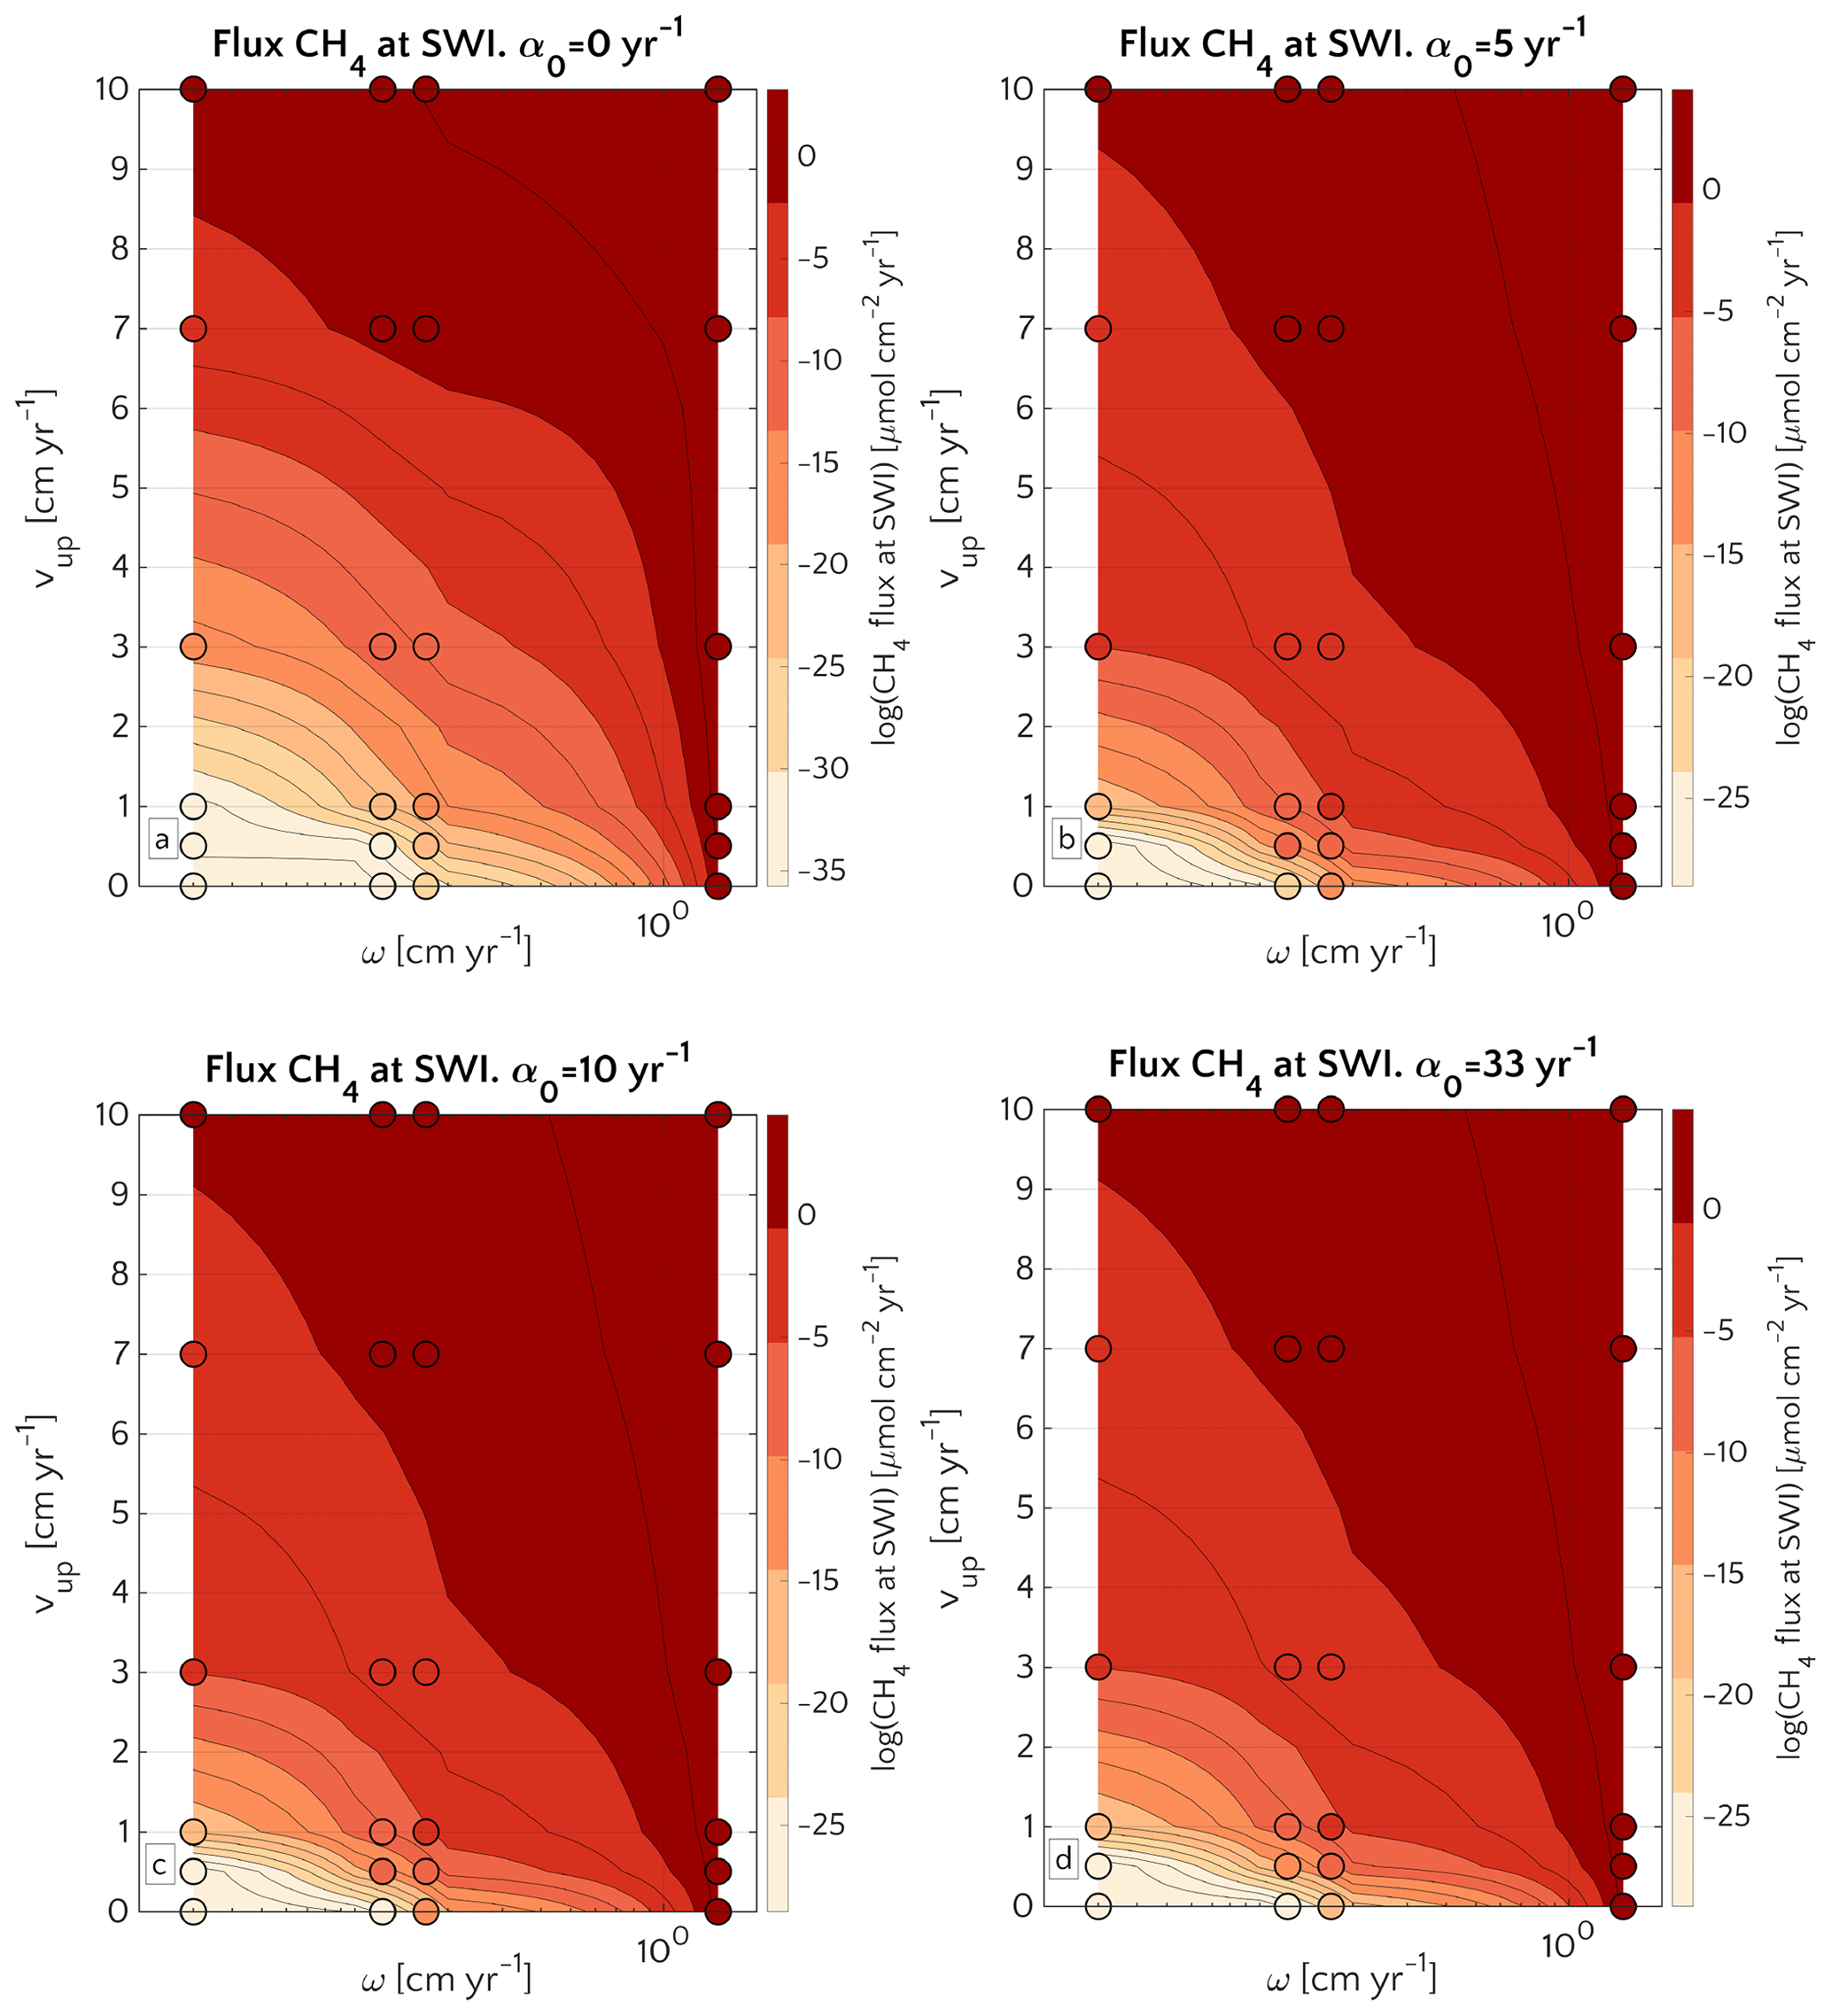
Figure 6Efflux of methane at the SWI as dependent on vup and ω for α0=0 (a), α0=5 (b), α0=10 (c) and α0=33 yr−1 (d). Circles represent simulations outcomes. Results for α0≠0 yr−1 are almost the same. The lower boundary condition for methane is mM. A three-dimensional version of the plot is reported in Fig. S13.
A comparison between simulations with α0=0 yr−1 and α0≠0 yr−1 (α0=5, α0=10 and α0=33 yr−1) shows that irrigation increases the CH4 efflux at low to intermediate sedimentation rates and/or high vup (lower-left corner of the phase space in both plots). However, maximum methane effluxes that are simulated for high sedimentation rates or vup are almost identical between bioirrigated and non-irrigated sites despite the differences in dominant transport mechanism (diffusion when α0=0 yr−1; irrigation when α0≠0 yr−1). Under these conditions (i.e. high vup and/or high ω), the SMTZ is located close to the SWI. In such settings, non-local transport becomes the dominant transport process in bioirrigated sediments (see Sect. 3.2.3 and Fig. S3) because it weakens concentration gradients near the SWI and, thus, contributes to a substantial reduction in the gradient-driven, diffusive transport terms. As a consequence, simulated CH4 efflux at the SWI are broadly similar for all of the investigated α0≠0 yr−1 (Fig. 6b, c, d). It is worth noticing that, independently on the α0, CH4 efflux for ω=0.03 and vup=10 cm yr−1 is ∼1 µmol CH4 cm−2 yr−1 – a value almost identical to the one reported in Luff and Wallmann (2003) – 1.4 µmol CH4 cm−2 yr−1 – for sediments characterized by vup=10 and ω=0.0275 cm yr−1.
3.2.6 AOM rate constant
Given its crucial role in AOM biogeochemistry, one would expect a pronounced influence of the kinetic rates constant, kAOM, on non-turbulent methane effluxes. However, modelling reveals that kAOM only plays a minor role for non-turbulent methane fluxes across the SWI (see Figs. S14, S15). An increase in kAOM can reduce methane effluxes from passive shelf sediments by up to 5 orders of magnitude. Still, its effect remains small compared, for instance, to the response to variations in sedimentation rate, which can change methane efflux by up to 14 orders of magnitude. The most important effect of increasing kAOM is the increasing linearity of the [CH4] and profiles around the SMTZ and the concurrent narrowing and downward movement of the SMTZ, which can result in a reduction in methane efflux. Simulations thus show that the AOM biofilter and, as a consequence, non-turbulent methane effluxes from sediments, are not affected by the exact value of the kinetic rate constant, at least in the range we analysed. This is in disagreement with results by Dale et al. (2008c), which show that, in dynamic settings subject to large methane fluxes, an increase of 3 orders of magnitude in kAOM (from 102 to 105 M−1 yr−1) leads to a reduction in steady-state methane fluxes below 10−2 µmol CH4 cm−2 yr−1. However, this discrepancy might be ascribable to the high water flow velocity employed in their simulation (vup=10 cm yr−1), 10 times higher than the one we considered in our active simulations. Finally, on the shallow ESAS, dissolved methane concentrations are limited by the comparably low gas saturation concentration, resulting in a minor influence of kAOM on methane fluxes (as the AOM rate is proportional to the CH4 concentration). An indirect support to our findings regarding the secondary role of kAOM on the AOM itself comes from Luff and Wallmann (2003). They showed that, as long as it is not null, the actual value of kAOM is unimportant for the precipitation of authigenic carbonate. Since the authigenic carbonate precipitation is largely driven by alkalinity produced during AOM (e.g. Aloisi et al., 2004; Luff et al., 2005; Karaca et al., 2010; Pierre et al., 2012; Crémière et al., 2016b, a; Meister et al., 2018), the observed independence of precipitation rates from kAOM bolsters our conclusion.
3.2.7 Summary of steady-state experiments
The results of the steady-state sensitivity study indicate that, under environmental conditions that are broadly representative for the ESAS, low AOM efficiencies and thus high non-turbulent CH4 effluxes from thawing subsea permafrost and/or dissociating methane gas hydrates (larger than 4 µmol CH4 cm−2 yr−1) are promoted by intense advective transport (sedimentation rate ω>1 cm yr−1, active fluid flow vup>7 cm yr−1). Under these conditions, CH4 efflux can be further enhanced by moderate OM reactivity (a=10–102 years) and intense non-local transport processes, such as bioirrigation (irrigation constant α0>0 yr−1). Overall, non-turbulent benthic escape of CH4 from deep sources appears to be mainly controlled by the concurrent effects of ω, vup and α0. In contrast, maximum AOM rates, kAOM, exert no influence on the AOM filter efficiency.
3.2.8 Geographic pattern and potential for non-turbulent methane emissions from Laptev Sea sediments
One strength of models is that they can provide the explorative means to assess dynamics at spatial/temporal scales that cannot easily be assessed by observations alone. In particular, transfer functions, simple look-up tables and neural networks that are derived from, or trained on, a large ensemble of individual model simulations over a broad range of plausible boundary conditions have been frequently and successfully used to investigate regional and even global dynamics (Gypens et al., 2008; Marquardt et al., 2010; Dale et al., 2015, 2017; Capet et al., 2016; Bowles et al., 2014). Such a quantitative framework for first-order estimates of potential non-turbulent methane escape from ESAS sediments can also be derived from the results of the sensitivity study we ran.
Model results indicate that sedimentation rate exerts the dominant control on benthic escape of methane from thawing subsea permafrost and/or dissociating methane gas hydrates on the ESAS. The functional relationship between sedimentation rate and methane flux across the SWI reported in Fig. 3c thus allows estimation of a potential non-turbulent, benthic methane efflux derived from deep sources for a given sedimentation rate. Thus, if the spatial distributions of these environmental controls on methane efflux are known, a first-order geographical distribution of potential non-turbulent methane escape from the Siberian shelf can be derived. However, the availability of observational data from the Siberian shelf is extremely scarce. Therefore, we here focus on the Laptev Sea – a comparable well-studied part of the Siberian shelf. The Laptev Sea is well known for its subsea permafrost and gas hydrate content and subject to large riverine inputs from the Lena River. To derive a map of sedimentation rates for Laptev Sea shelf sediments, we use published linear sedimentation rates (Table S9) and extrapolate these values to the entire region by applying a simple three-dimensional kriging method (see Fig. 7a), using the International Bathymetric Chart of the Arctic Ocean (IBCAO) (Jakobsson et al., 2012) and employing longitude, latitude and water depth as predictors for ω.
Observations indicate that sedimentation rates are highest (ω=0.45 cm yr−1) close to the mouth of the Lena River and Moustakh Island in the Buor-Khaya Gulf. As a consequence, the vicinity of the river mouth, as well as the area along the shallow bathymetric profile towards the NE of the Lena delta are characterized by comparably high sedimentation rates (ω=0.27–0.42 cm yr−1). The relatively shallow areas (∼10 m deep) around the New Siberian islands reveal intermediate values (ω=0.06–0.12), while minimum sedimentation rates (∼0.002–0.03 cm yr−1) roughly follow the 55 m isobath down to the continental slope at 100 m. Deeper shelf areas are characterized by a more homogeneous distribution of sedimentation rates with values around 0.03–0.06 cm yr−1.
Table 2Estimated flux of CH4 at SWI in mol yr−1 for different depth regions of Laptev Sea in a passive (vup=0 cm yr−1) and active (vup=1 cm yr−1) case.
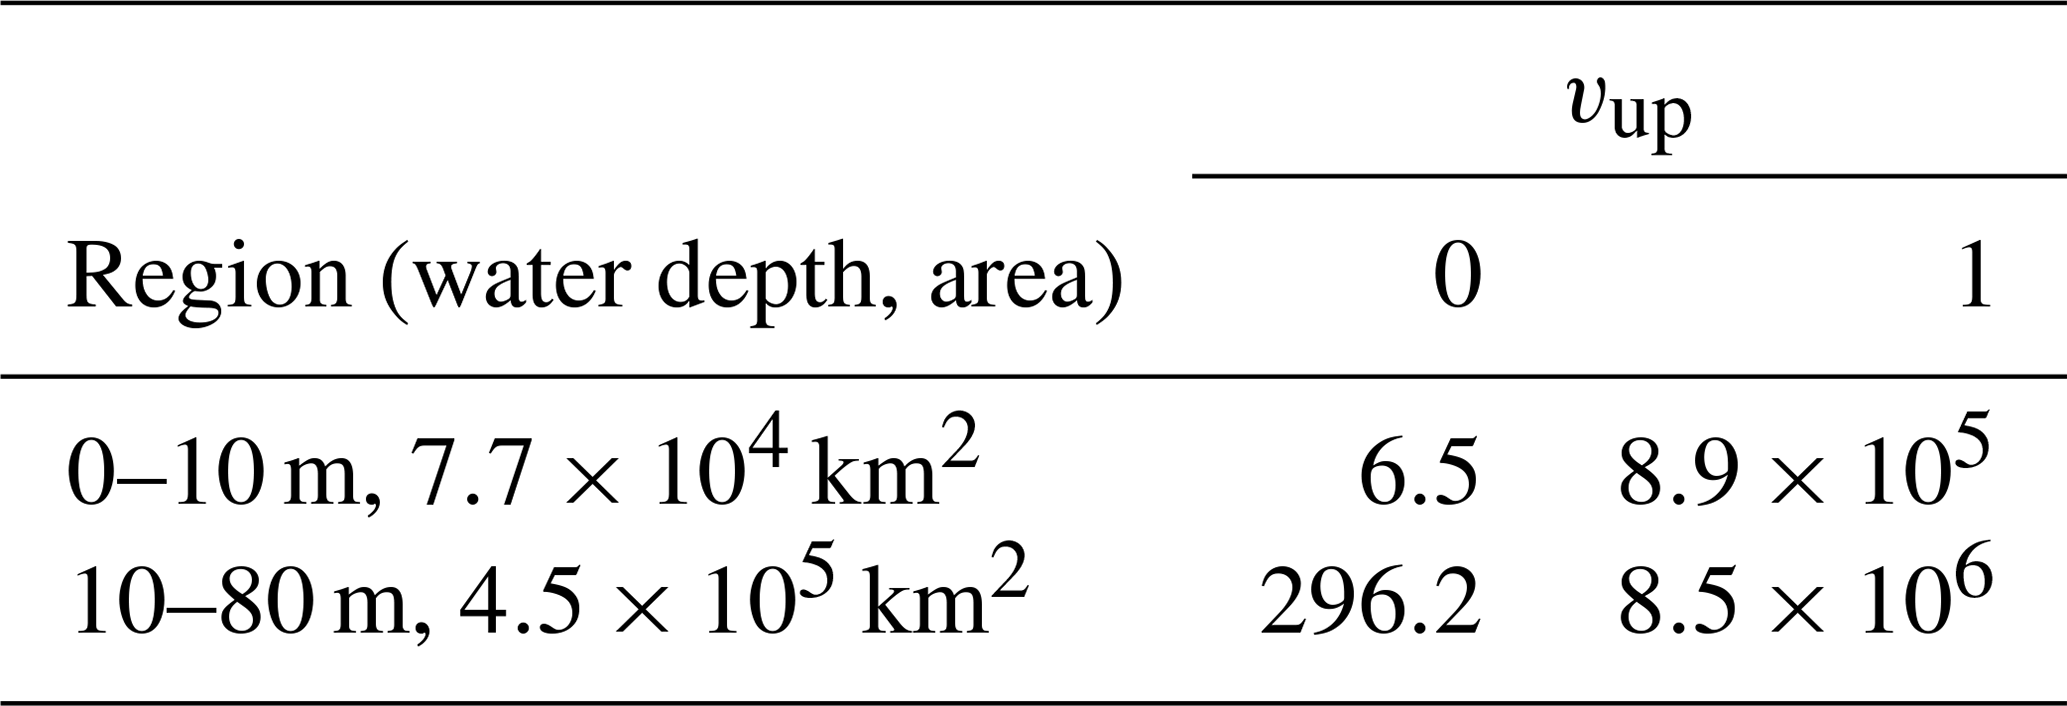

Figure 7(a) Values of the sedimentation rate extrapolated for the whole Laptev Sea via a simple kriging method. The reference values (circles) are the ones reported in Table S9. (b, c) (Log) values of the potential non-turbulent dissolved methane emissions at the SWI considering the relationship presented in Fig. 3c for passive (b) and active (c) cases.
Estimated non-turbulent methane effluxes corresponding to the highest measured sedimentation rates close to the Lena mouth do not exceed µmol CH4 cm−2 yr−1 assuming the presence of active fluid flow and µmol CH4 cm−2 yr−1 for passive settings. These findings are not surprising as steady-state sensitivity results indicate that high CH4 efflux requires sedimentation rates of ω>1 cm yr−1. The regional non-turbulent CH4 efflux budget for different depth sections of the Laptev Sea assuming the absence of active fluid flow in Laptev Sea shelf sediments (see Table 2) thus indicates that non-turbulent CH4 efflux is negligible. Even if we assume the omnipresence of an active fluid flow of vup=1 cm yr−1, the estimated non-turbulent methane efflux merely sums up to 9.39×10⁶ mol CH4 yr−1 (∼0.1 Gg CH4 yr−1) over the entire Laptev Sea area of 527.4×10³ km2. Such small effluxes would most likely be subject to further oxidation in the water column, thus limiting any potential impact on atmospheric methane concentrations and climate.
Higher advective fluid flow velocities, intermediate organic matter reactivity and/or a more intense macrobenthic biological activity could increase these estimates of non-turbulent methane escape from the Laptev Sea shelf. Higher advective fluid flow velocities (i.e. vup>1 cm yr−1), possibly in connection with active seepages, groundwater discharges and fault lines (the latter follow parallel pattern in Laptev Sea (Drachev et al., 1998) on the direction SW–NE from the west of Lena delta up to the little Lyakhovsky and Kotelny islands), could result in methane effluxes of up to 10–101.3 µmol CH4 cm−2 yr−1 (see Figs. 5 and 6). However, such high fluid flow velocities would be only found locally and would thus merely give rise to a number of methane emission hotspots that would not change the overall non-turbulent methane flux budget. In addition, intermediate organic matter reactivity, in particular in the fast accumulating sediments close to the coastline and the Lena River delta that receive more reactive organic matter from thawing terrestrial permafrost (Wild, 2019) could result in a higher estimated non-turbulent methane escape. However, our sensitivity study results show that OM reactivity merely plays a secondary role, suggesting that changes in OM reactivity would only change efflux by less than an order of magnitude assuming both a=100 years or a=1 years. Changes in bioirrigation intensity would exert merely a limited effect on efflux estimates, as bioirrigation has already been included in the estimate calculations. The absence of bioirrigation, which is known to be patchy in Arctic sediments, could act both in the direction of further reducing (limiting the bioirrigated flux from the sediments) or increasing (by limiting the flux of TEAs from the seawater and therefore oxidation) the estimated non-turbulent methane efflux. Additional physical reworking, such as ice scouring or dredging, may also have such an opposite effect: it could reduce the methane efflux (by enhancing the flux of TEAs into the sediments) but it could also intensify it (by removal of the upper sediment layer).
Model results thus show that, under present-day, steady-state environmental conditions, AOM acts as an efficient biofilter for potential non-turbulent methane fluxes in Laptev Sea sediments. The estimated non-turbulent methane escape from Laptev Sea shelf sediments cannot support previously estimated methane outgassing fluxes of few teragrams of CH4 yr−1 (Berchet et al., 2016; Thornton et al., 2020) or even tens of teragrams of CH4 yr−1 (Shakhova et al., 2014). If such outgassing were to be supported by methane efflux from Laptev Sea sediments, it would require the build-up of CH4 gas reservoirs in Laptev Sea sediments of at least similar or larger size than the evaded amount, as well as the preferential and rapid transport of this CH4 gas to the atmosphere. Nevertheless, model results also suggest that projected trends of terrestrial permafrost thawing and coastal permafrost degradation (Vonk et al., 2012) might increase the importance of non-turbulent methane escape for the Arctic's methane budget by potentially increasing sedimentation rates through coastal erosion (vast amount of debris and terrigenous material) and increased riverine inputs (Guo et al., 2007); active fluid flow through permafrost and methane gas hydrate degradation (James et al., 2016; Ruppel and Kessler, 2017); organic matter reactivity through an enhanced delivery of more reactive permafrost organic matter (Wild et al., 2019) and/or an enhanced macrobenthic activity through warming and Atlantification. However, the magnitude of these projected environmental changes and thus their effect on non-turbulent methane escape from ESAS sediments is difficult to assess.
3.3 Methane efflux dynamics in response to seasonal and long-term environmental variability
The steady-state sensitivity results reveal that, under steady-state conditions, AOM represents an efficient biofilter for upward migrating methane from thawing permafrost and/or dissociating methane gas hydrates on the ESAS. However, transient dynamics induced by, for instance, seasonally or climate-change-driven variability in environmental conditions, may weaken the efficiency of the AOM biofilter. Therefore, we additionally explore the potential for non-turbulent methane escape from thawing subsea permafrost and/or dissociating methane gas hydrate in ESAS sediments under transient conditions. Table 3 summarizes the maximum simulated non-turbulent methane fluxes for two kinds of environmental change scenarios: seasonal and long-term. With the former, we explore seasonal changes in deep methane flux and seasonal freshening of bottom waters. With the latter instead, we investigate the impacts of a slow linear increase and a sudden maximum increase in deep methane flux (see Sect. 2.3.2).
Table 3Maximum of methane fluxes (in µmol cm−2 yr−1) at SWI for the four analysed transient scenarios. Values in round parenthesis indicate the year after the beginning of simulation corresponding to the reported maximum.
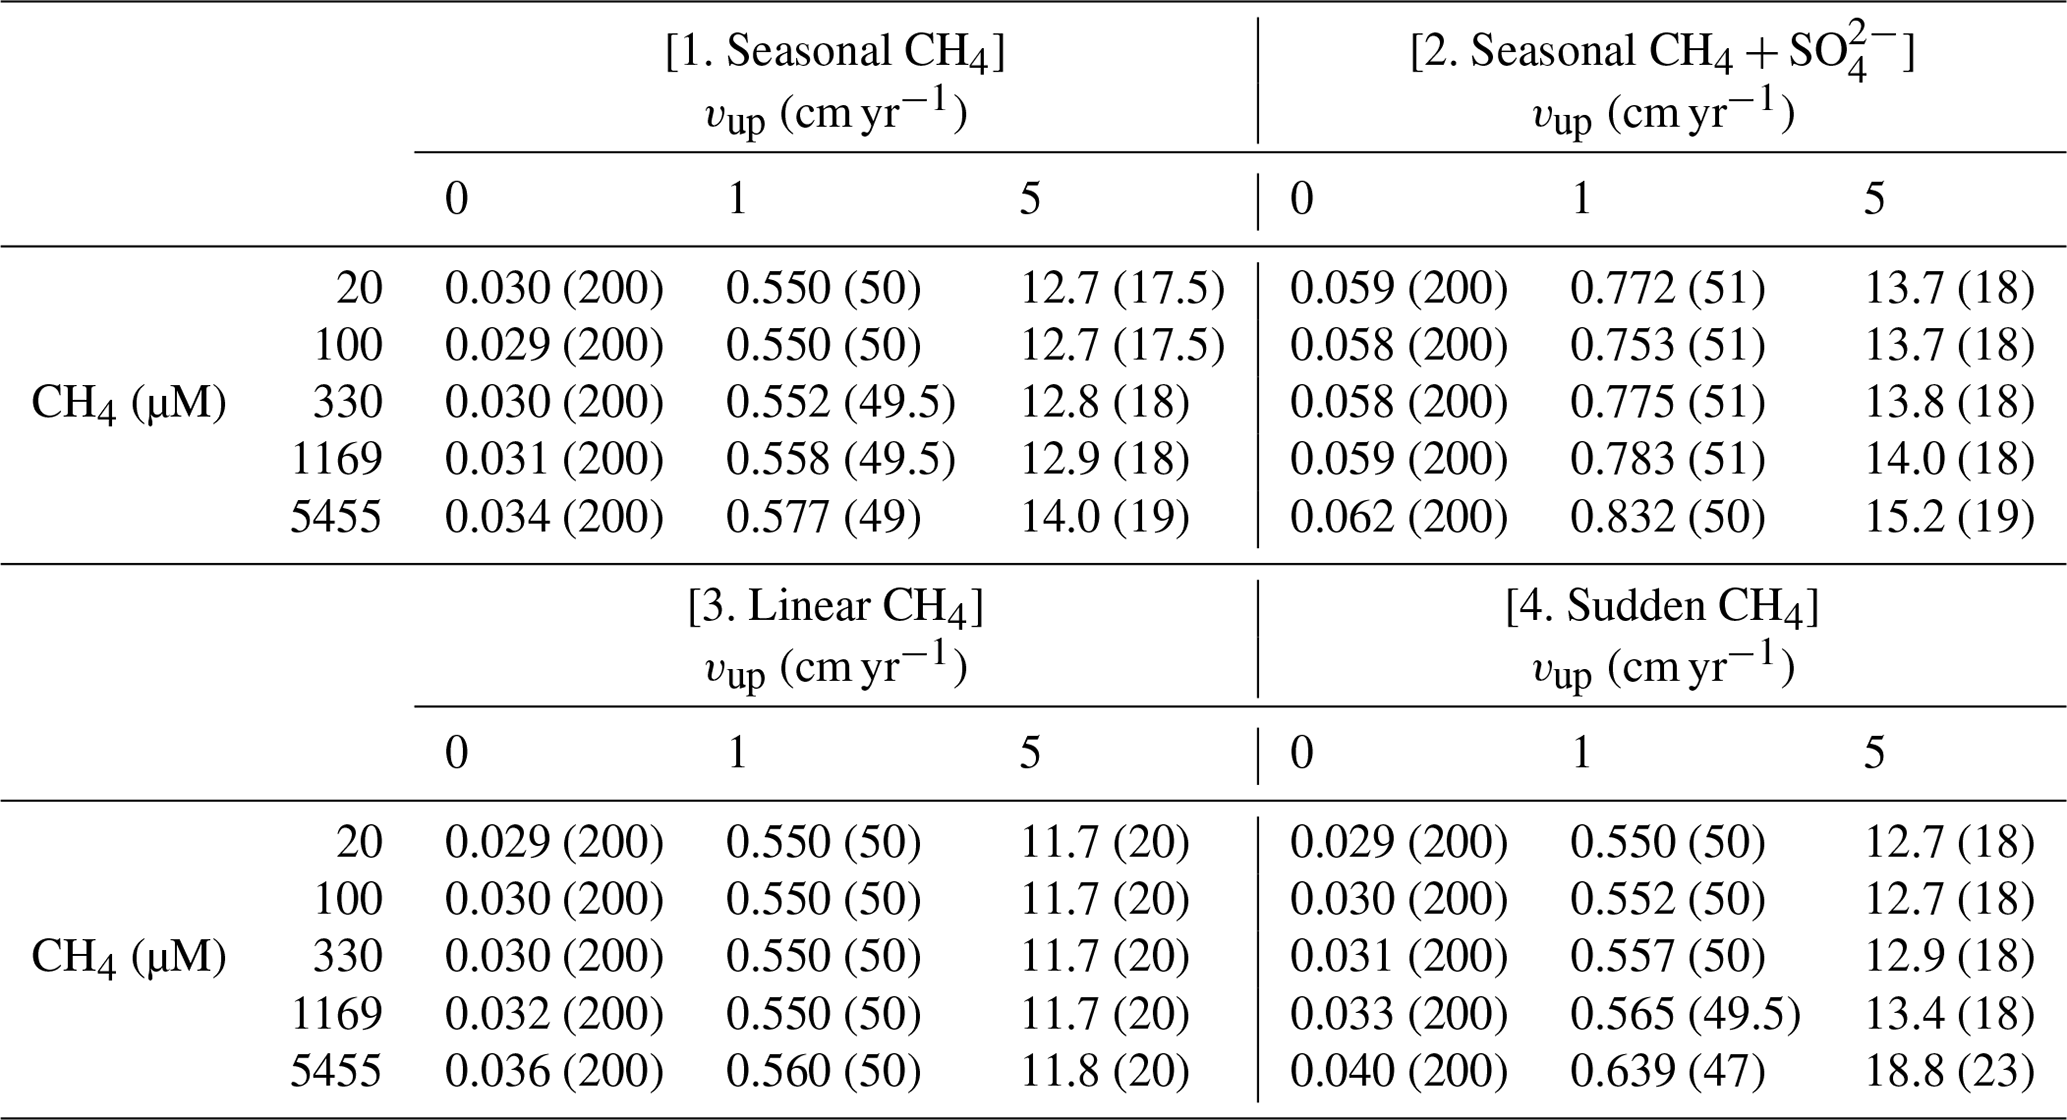
Results reveal that the transient response of simulated non-turbulent methane efflux is similar for all environmental scenarios, but instead significantly differs for passive and active sites. In general, passive settings do not allow for significant methane escape (Fig. S17). Although transient methane efflux monotonously increases over the simulated period, it only reaches a maximum value of 0.03–0.05 µmol CH4 cm−2 yr−1 (Fig. S17). Similarly, the simulated SMTZ depth merely migrates 11.5–29 cm upwards (Fig. S18). Over the simulated 200 years, the integrated non-turbulent methane escape from passive settings for all environmental change scenarios barely reaches 3–4 µmol CH4 cm−2.
In contrast, active settings (i.e. vup=1 cm yr−1) exhibit an initial increase in CH4 fluxes to maxima of 0.55–0.83 µmol CH4 cm−2 yr−1 over the first 50 years. This growth coincides with a rapid upward shift of the SMTZ by 100 cm. Methane escape then temporarily drops by 17 %–20 % until years 70–75, when it begins to increase again until the end of the simulation. During this second phase (i.e. after the first 50 years), the SMTZ remains stationary. Temporally integrated methane efflux (over 200 years) increases with active fluid flow rate from 66–121 µmol CH4 cm−2 for vup=1 cm yr−1 to mmolCH4 cm−2 for vup=5 cm yr−1. A large fraction of these emissions (30 % and 48 %–87 %, respectively) occurs in the first 100 years after the perturbation.
Model results thus indicate that the exact temporal character of environmental changes does not exert an important influence on non-turbulent methane efflux. Conversely, both microbial growth dynamics and the presence/absence of active fluid flow (Table 3) largely control the transient response to environmental change. The reasons for this are 2-fold. First, the response time of the resident AOM community is longer than the characteristic timescales under investigation, thus smoothing out the impact of environmental perturbations. Second, active fluid flow enhances the impact of the perturbation by triggering a significant upward shift of the SMTZ. In particular, the initial movement of the SMTZ prevents the establishment of an efficient AOM community at the SMTZ: this creates a “window of opportunity” for methane escape. In contrast, the comparably slow and limited movements of the SMTZ in passive settings (Fig. S18) enables the establishment of an AOM community that acts as an efficient biofilter for upward-migrating methane.
The following sections explore the factors that control the creation of such a window of opportunity and discusses the mechanisms behind the simulated methane escape. Given the overall similar transient response of non-turbulent methane fluxes to different environmental scenarios (Figs. S17, S18), we will base the following discussion on scenario 4, namely a step-like CH4 forcing with vup=1 cm yr−1 and a specific bottom concentration ( mM). The reason for selecting this scenario is simple. In contrast to the other scenarios, scenario 4 allows for a straightforward definition of the initial and final state, which facilitates the attribution of a typical response timescale for the system.
3.3.1 Window of opportunity
Figure 8 illustrates the temporal evolution of the simulated (a) filter efficiency and AOM rate, (b) CH4 efflux, (c) SMTZ depth and (d) AOM biomass for transient scenario 4 in the case of vup=1 cm yr−1 and mM. The onset of a sudden methane flux from thawing permafrost and/or dissociating methane gas hydrates below the sediment column triggers the rapid movement of the SMTZ. Simulation outputs show that the velocity at which the SMTZ moves upward (vSMTZ) is solely controlled by vup, as evident from the constant vSMTZ∼2.46 cm yr−1 for all the transient scenarios with vup=1 cm yr−1 (Fig. S18). The initial upwards movement of the SMTZ delays the microbial response since the transient dynamics inhibits the establishment of a resident AOM community sufficiently large to consume upward migrating methane. The AOM rate, and thus the filter efficiency, is controlled by the AOM biomass dynamics (Eq. 6), which in turn is determined by the kinetic (FK, Eq. 7) and thermodynamic (FT, Eq. 8) constraints. Figure 10 illustrates the typical depth profiles of the thermodynamic and kinetic terms in the bioenergetic AOM formulation (Eq. 6), as well as their evolution in response to the onset of a sudden methane flux from below. Initially, although kinetically possible (i.e. FK≠0), AOM is inhibited by thermodynamic constraints (i.e. FT=0). For vup=1 cm yr−1 during the first 23 years, AOM biomass thus remains largely constant (Figs. 8d and S21a) and, as a consequence, AOM rate and filter efficiency are zero. In this period, aerobic methane oxidation represents the only barrier to upward diffusing methane. However, this barrier is weak due to the limited availability of oxygen and the competition with aerobic organic matter degradation as well as additional secondary redox reactions that also consume oxygen (see Table S3). As a consequence, CH4 efflux increases. The initial methane efflux is largely supported by in situ methanogenesis since the advective transport of methane (occurring at cm yr−1, corresponding to 20.17 cm in 23 years) is too slow to allow methane from below 3 m to reach the sediment–water interface.
After the first 23 years, thermodynamic constraints ease and AOM begins to efficiently consume upward migrating methane at the SMTZ by 40 % (Fig. 8a). However, as consumption occurs at the SMTZ (for the specific case at a sediment depth of 100.4 cm), it does not immediately affect the methane efflux at the SWI. The time required for the consumption signal to propagate to the SWI with velocity cm yr−1 is therefore years. Consequently, methane efflux further increases. This methane efflux is now also supported from deep sources such as thawing permafrost and/or dissociating methane gas hydrates, which have started to contribute to methane efflux between years 7 and 20 (assuming typical values of vup reported for active marine sediments of 0.5–5 cm yr−1). Methane efflux typically peaks 2–3 decades after the onset of methane supply. Maximum methane efflux increases with vup: from 0.5–0.6 µmol CH4 cm−2 yr−1 for vup=1 cm yr−1 to 11–19 µmol CH4 cm−2 yr−1 for vup=5 cm yr−1. However, the duration of this initial “window of opportunity” for methane escape decreases with increasing vup. In general, simulated maximum methane fluxes fall within the range of previous models applied to different environments (Sommer et al., 2006; Dale et al., 2008c) but do not reach the high values measured in other settings (Linke et al., 2005; Regnier et al., 2011).
After the initial “window of opportunity” (i.e. years), the effect of an efficient methane consumption at the SMTZ starts to reduce the non-turbulent methane efflux at the SWI (Fig. 8b). This reduction lasts until the upward movement of the SMTZ slows down. At this point, the AOM filter efficiency reaches a quasi-stationary level of ∼85 % (as Fig. 8a). Meanwhile, in situ methanogenesis continues to produce methane, which is not entirely consumed by the AOM community that already reached its full capacity. As a consequence, methane fluxes at SWI increase again until a new steady state is reached.
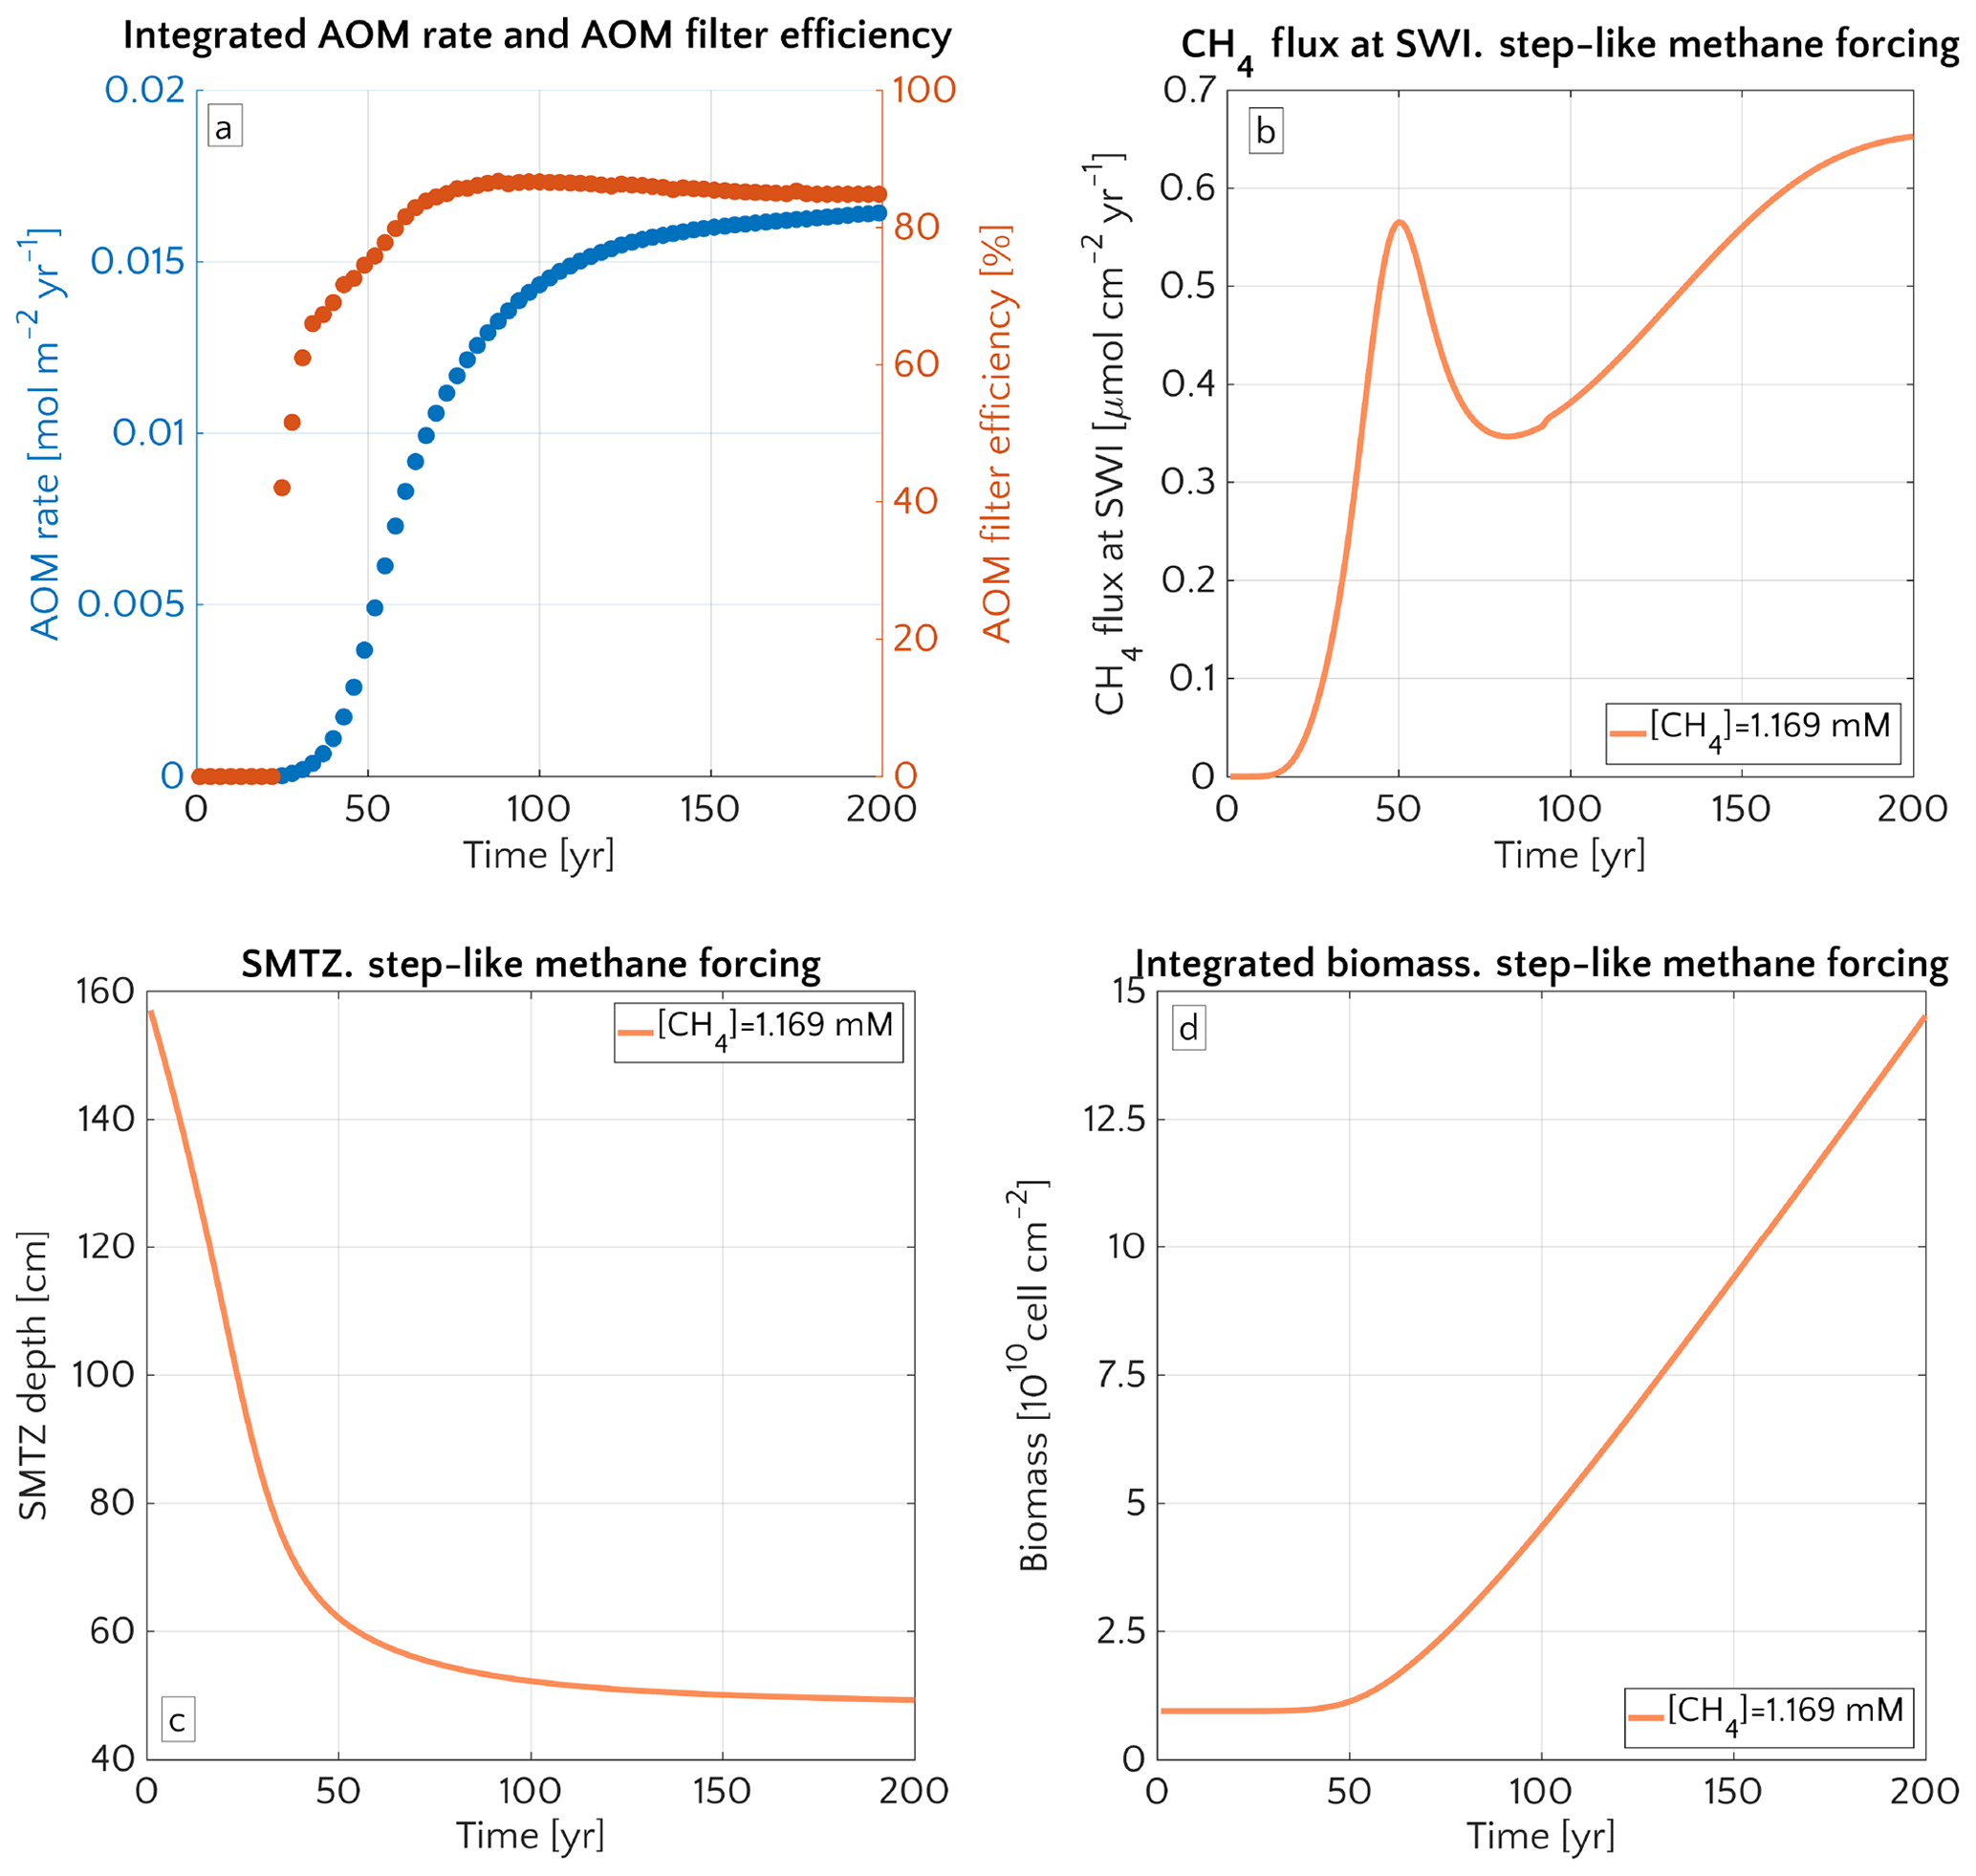
Figure 8Time evolution over 200 years for the case of an active set-up with vup=1 cm yr−1 and a step-like methane forcing from below from 0 to mM. (a) AOM vertically integrated rate (blue) and AOM efficiency (red). (b) CH4 flux at SWI. (c) SMTZ depth. (d) Vertically integrated biomass (number of cells).
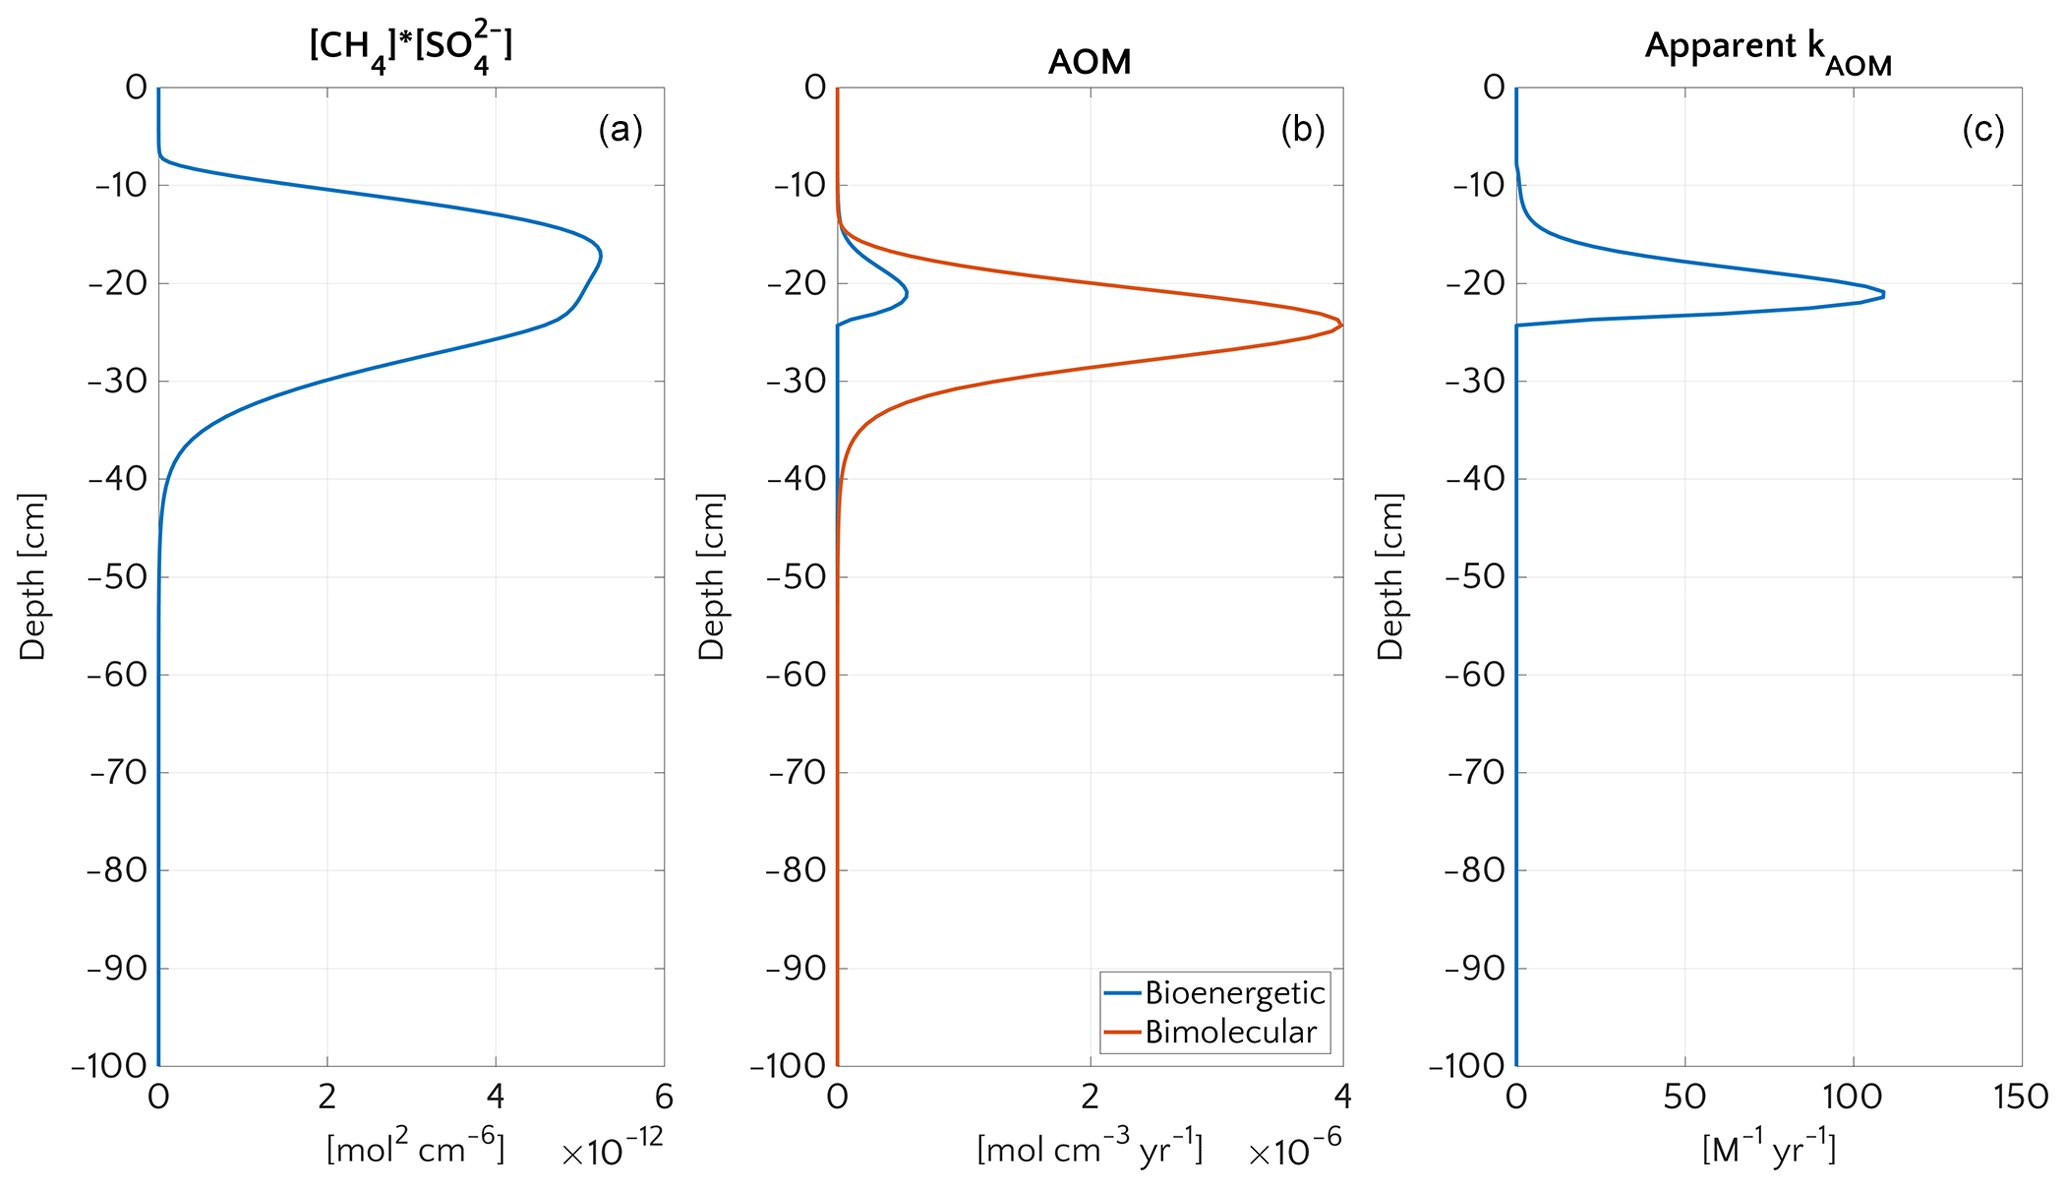
Figure 9Vertical profiles at the end of transient simulation (after 200 years) with bioenergetic AOM formulation for the case mM and vup=5 cm yr−1. (a) Bimolecular product . (b) AOM rate according to the bioenergetic formulation (blue) and, for comparison, according to bimolecular formulation used for the steady-state simulations (red). (c) Apparent kAOM, estimated from Eq. (5).
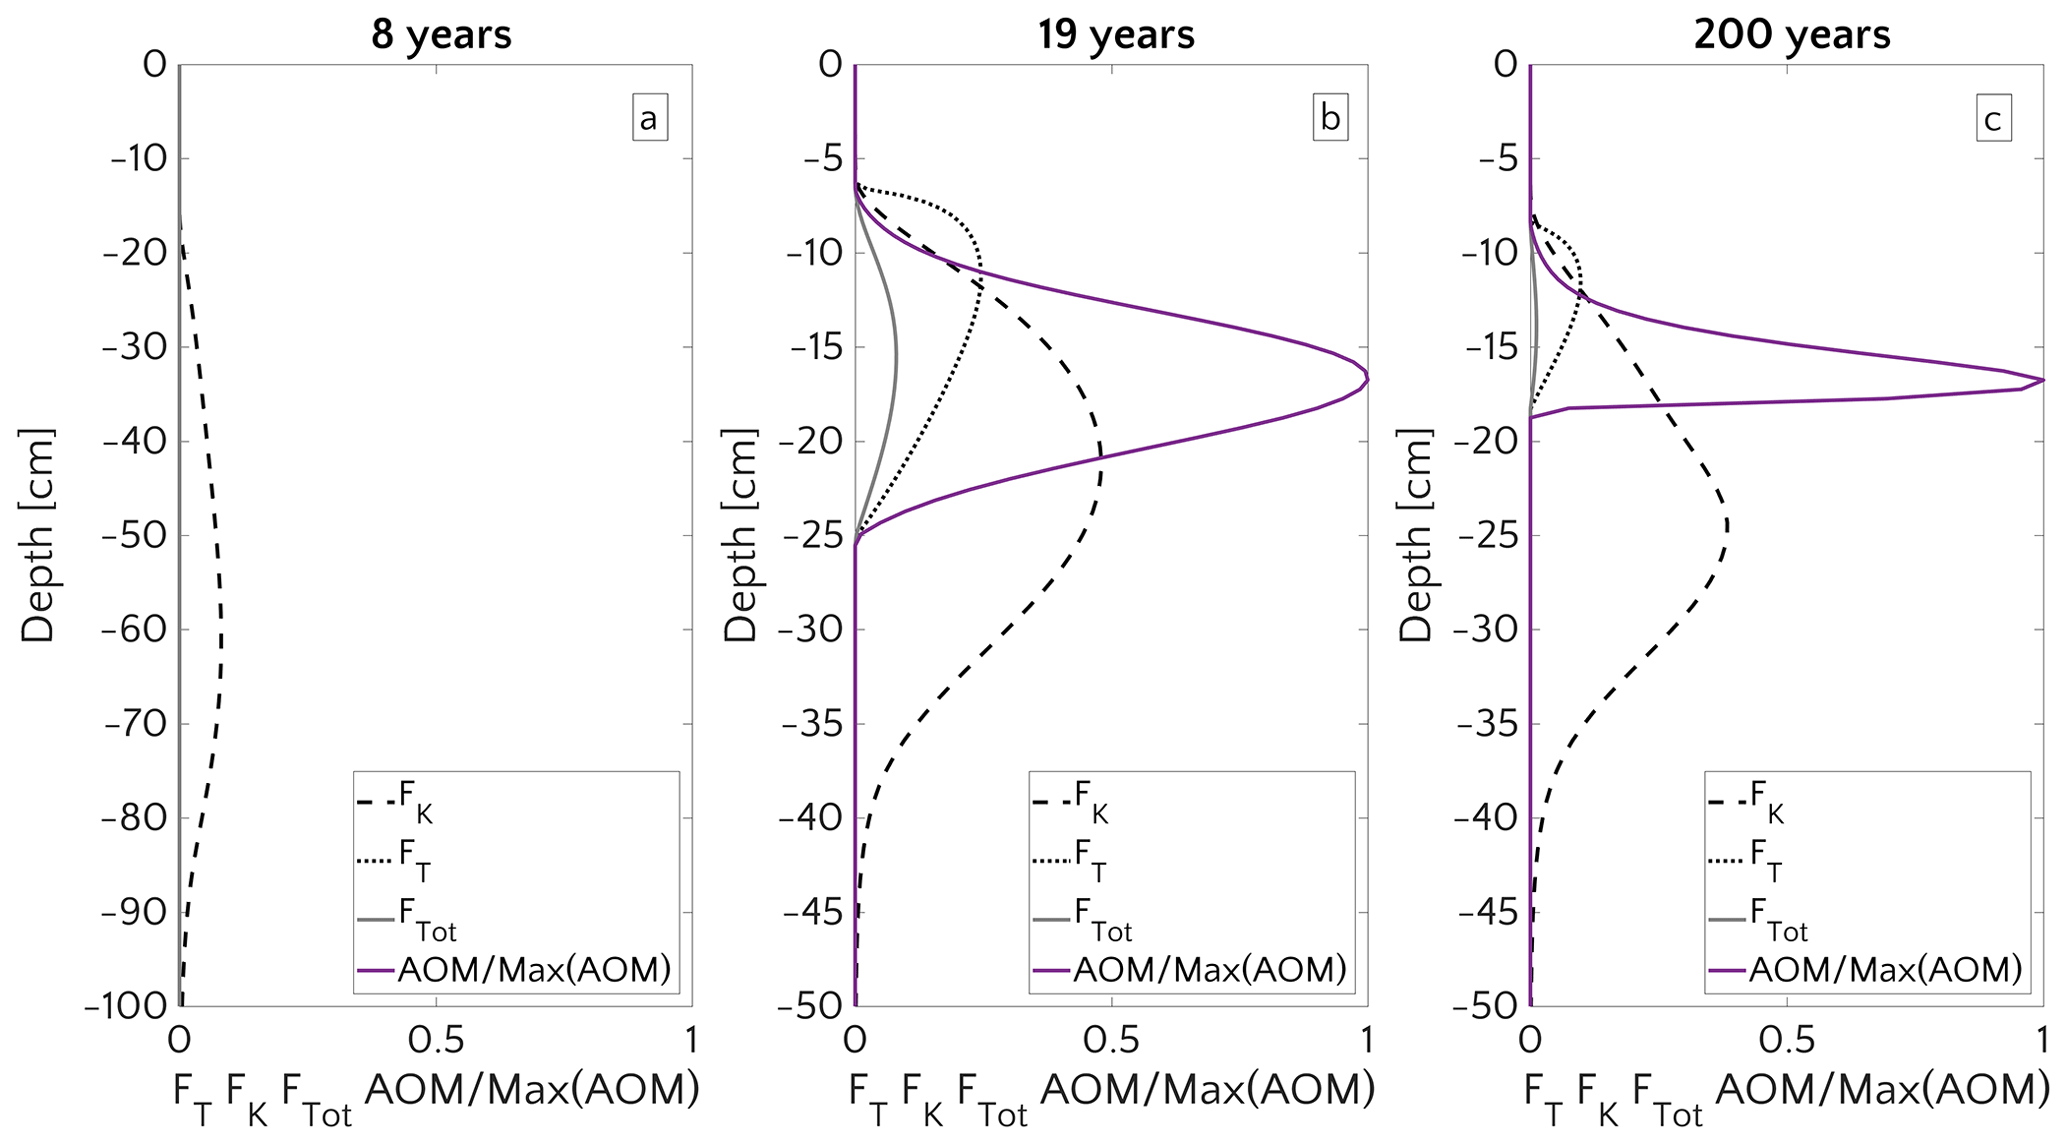
Figure 10Vertical profile of FT, FK, and the AOM (scaled to the maximum) for three instants in time: 8 years (a), 19 years (b) and 200 years (c) of simulation, for the case mM and vup=5 cm yr−1.
3.3.2 Final new steady state
The final new steady-state value of methane efflux (Fig. 8b, S17 and S19) is generally in good agreement with Dale et al. (2008c), who reported an efflux of the same order of magnitude (3 µmol CH4 cm−2 yr−1) for the new steady state at the end of a transient run with vup=10 cm yr−1 and mM. Simulations with vup=5, ω=0.123 cm yr−1 and mM (Fig. S19) offer a better understanding of the model. In this case, the final new steady state is about 2 orders of magnitude larger than the efflux of ∼0.1 µmol CH4 cm−2 yr−1 simulated in the steady-state simulations, with bimolecular rate law, under identical environmental conditions (inferred from Fig. 6).
The reason for this discrepancy can be clarified by plotting the apparent kAOM for transient simulations. Such a value is calculated by computing an apparent bimolecular rate constant kAOM (as in Eq. 5) from the transient bioenergetic simulations for the new final steady state. Results are shown in Fig. 9. Figure 9a illustrates that the concentration product is wider than the AOM rate profile (Fig. 9b, blue curve). Figure 9c also shows that the apparent kAOM is not uniform: it reaches a maximum value of 109 M−1 yr−1, but remains well below 100 M−1 yr−1 at most depths. Compared to the values typically applied for bimolecular rate laws (i.e. kAOM=102–107 M−1 yr−1), these values are rather low and reflect the ongoing thermodynamic limitation of AOM. FT remains the main constraint on AOM throughout the simulation (Fig. 10c). A more uniform sulfide concentration – [HS−] enters in defining FT – in lower sediments combined with the upward movement of the SMTZ pushes the maximum of FT upwards, thus limiting the zone where AOM is thermodynamically favourable (∼13 cm deep).
Integrated biomass ΣB ranges from to 3.5×10¹¹ cells cm−2 (except for simulation with vup=5 cm yr−1 and mM, whose ΣB). These values are comparable with AOM biomass reported in Treude et al. (2003) (1.5–1.8×10¹⁰ cells cm−2) or with values simulated in Dale et al. (2008c) (3.7×10¹¹ cells cm−2 for vup=5 cm yr−1). In addition, the maximum simulated biomass for active settings (0.5–2.5×10¹⁰ cells cm−3) agrees well with previously reported values, ranging from 0.27 to 7.4×10¹⁰ cells cm−3 (Dale et al., 2008c). Integrated AOM rates (ΣAOM) are instead smaller then previously published rates for shallow, active sites above the shelf break (Boetius et al., 2000; Haese et al., 2003; Luff and Wallmann, 2003; Linke et al., 2005; Wallmann et al., 2006b; Dale et al., 2008c), but comparable to those observed in active sites below the shelf break (Aloisi et al., 2004; Wallmann et al., 2006a; Maher et al., 2006) or in passive settings (Borowski et al., 1996; Martens et al., 1998; Fossing et al., 2000; Jørgensen et al., 2001; Dale et al., 2008c). The discrepancy may be due to different environmental conditions encountered at these sites. For instance, Dale et al. (2008c) applied an advective velocity of vup=10 cm yr−1 and mM. While differences in vup affect the ΣAOM, its effect on ΣB is negligible since an efficient AOM microbial filter has to account for at least >1010 cells cm−3 (Lösekann et al., 2007; Knittel and Boetius, 2009).
In this study, we evaluate the potential for non-turbulent, benthic methane escape from thawing subsea permafrost and/or dissociating methane gas hydrates in both passive as well as active settings and under a range of environmental conditions that are broadly representative for conditions encountered on the present and future East Siberian Arctic Shelf (ESAS). We identify the most important biogeochemical and physical controls on non-turbulent methane escape from those sediments under steady-state conditions, as well as in response to environmental variability on seasonal and centennial timescales. Based on model results, we derive a simple transfer function that allows establishment of a first-order regional estimate of (not-turbulent) methane efflux and of potential methane consumption in Laptev Sea sediments.
Model results reveal that AOM is an efficient sink for upward migrating, dissolved methane in ESAS sediments. Simulated non-turbulent methane effluxes are negligible for a broad range of environmental conditions under both steady-state and transient conditions. Since AOM is a transport-limited process, transport parameters exert a dominant control on the efficiency of the AOM biofilter and, ultimately, on the methane efflux at the SWI. Both steady-state and transient model results confirm the key role of advective transport (mainly sedimentation and active fluid flow) in supporting methane escape from Arctic shelf sediments. Under steady-state conditions, high methane effluxes (up to 27.5 µmol cm−2 yr−1) are generally found for sediments that are characterized by high sedimentation rates and/or active fluid flow (sedimentation rate ω>0.7 cm yr−1, active fluid flow vup>6 cm yr−1). Under these conditions, methane efflux can be further enhanced by intermediate organic matter reactivity (RCM model parameter a=10–102 years) even though the control exerted by organic matter is only secondary with respect to the transport parameters. Finally intense local transport processes, such as bioirrigation (irrigation constant α0>1 yr−1), do also contribute to larger methane effluxes. Our results indicate therefore that present methane efflux from ESAS sediments can be supported by methane gas escape and non-turbulent CH4 efflux from rapidly accumulating and/or active sediments (e.g. coastal settings, portions close to river mouths or submarine slumps). In particular, active sites sediments may release methane in response to the onset or increase in permafrost thawing or CH4 gas hydrate destabilization.
High methane escape (up to 11–19 µmol CH4 cm−2 yr−1 corresponding to 2.6–4.5 TgCH4 yr−1 if upscaled to the ESAS) can occur during a transient period following the onset of methane flux from the deep sediments. Under these conditions, substantial methane escape from sediments requires the presence of active fluid flow that supports a significant and rapid upward migration of the SMTZ in response to the onset of CH4 flux from below. Such rapid and pronounced movements create a window of opportunity for non-turbulent methane escape by inhibiting the accumulation of AOM-performing biomass within the SMTZ – mainly through thermodynamic constraints – thereby perturbing the efficiency of the AOM biofilter. The magnitude of methane effluxes, as well as the duration of this window of opportunity, is largely controlled by the active flow velocity. In addition, results of transient scenario runs indicated that the characteristic response time of the AOM biofilter is of the order of few decades (20–30 years), thus exceeding seasonal–interannual variability. Consequently, seasonal variation of bottom methane and seawater sulfates exert a negligible effect on methane escape through the sediment–water interface.
AOM generally acts as an efficient biofilter for upward migrating CH4 under environmental conditions that are representative for the present-day ESAS with potentially important yet unquantified implications for the Arctic ocean's alkalinity budget and, thus, CO2 fluxes. Our results thus suggest that previously published fluxes estimated from ESAS waters to the atmosphere cannot be supported by non-turbulent methane efflux alone.
A regional upscaling of non-turbulent methane efflux for the Laptev Sea shelf using a model-derived transfer function that relates sedimentation rate and methane efflux merely sums up to ∼0.1 GgCH4 yr−1. Nevertheless, it also suggests that the evaluation of methane efflux from Siberian shelf sediments should pay particular attention to the dynamic and rapidly changing Arctic coastal areas close to big river mouths, as well as areas that may favour preferential methane gas release (e.g. rapidly eroding coastlines, fault lines or shallow sea floors, i.e. <30 m). In addition, our findings call for more data concerning sedimentation and active fluid flow rates, as well as the reactivity of depositing organic matter and bioirrigation rates in Arctic shelf sediments.
In conclusion, we argue that the evaluation of projected subsea permafrost thaw and/or hydrate destabilization impacts on the Arctic environment requires models that include an explicit description of (1) methane gas, (2) AOM biomass, as well as (3) the entire network of the most pertinent biogeochemical reactions. Such approaches, valid globally for all the shelves underlain by methane reservoirs (e.g. continental slopes), are even more recommended in order to enable a robust quantification of methane escape from the Arctic shelf to the Arctic ocean, settings even more sensible to the rapidly changing environmental conditions. Finally such refined modelling will also help evaluate the impact of subsea permafrost thaw and methane destabilization on Arctic alkalinity and biogeochemical cycling.
If we identify the SMTZ region as the portion of the sediment column where the rate of AOM is 1 % of the maximum, we can define the efficiency of the AOM filter η as
where is the methane flux at the shallowest point where the AOM rate is 1 % of the maximum (upper dashed line in Fig. A1), and is methane flux at the deepest point where the AOM rate is 1 % of the maximum (lower dashed line in Fig. A1).

Figure A1Typical sediment profile of , [CH4] and AOM rate. Units are mM for concentration and mM yr−1 for rate. The region between the two dashed lines represents the zone where AOM rate is larger than 1 % of it its maximum and defines the sulfate–methane transition zone (SMTZ). The fluxes and are the fluxes used in the definition of η of Eq. (A1).
The Damköhler number Da is a dimensionless quantity which relates timescales typical of transport processes to timescales typical of chemical reactions. It compares the consumption/production rate with the advective transport and is defined as
where τT is the advective timescale and τR is the reaction timescale. τR is defined as 1∕KR where KR is the reaction rate of AOM or methanogenesis. If we call R the reaction rate then KR reads as
where ℒ is the width where the reaction rate is larger than 1 % of the maximum rate. τT is instead defined as
where vup−ω is the effective advective velocity. Da can be the expressed by
Primary data needed to reproduce the analyses presented in this study are archived by the Max Planck Institute for Meteorology are available upon request (publications@mpimet.mpg.de).
The supplement related to this article is available online at: https://doi.org/10.5194/bg-17-3247-2020-supplement.
MP set up and ran the simulations. MP and SA contributed to the analysis. All the co-authors jointly interpreted the results and prepared the manuscript.
The authors declare that they have no conflict of interest.
We would like to thank Volker Brüchert (Department of Geological Sciences at Stockholm University and Bolin Centre for Climate Research) for his constructive criticism during the reviewing process and for having shared the data of Laptev Sea sediment cores.
The research leading to these results received funding from the European Union's Horizon 2020 research and innovation programme under the Marie Skłodowska-Curie grant agreement no. 643052 (C-CASCADES project) and under grant agreement no. 773421 (NUNATARYUK project).
The article processing charges for this open-access publication were covered by the Max Planck Society.
This paper was edited by Alexey V. Eliseev and reviewed by Volker Brüchert and one anonymous referee.
Aguilera, D., Jourabchi, P., Spiteri, C., and Regnier, P.: A knowledge-based reactive transport approach for the simulation of biogeochemical dynamics in Earth systems, Geochem. Geophy. Geosy., 6, Q07012, https://doi.org/10.1029/2004GC000899, 2005. a
Aloisi, G., Wallmann, K., Haese, R., and Saliege, J.-F.: Chemical, biological and hydrological controls on the 14C content of cold seep carbonate crusts: numerical modeling and implications for convection at cold seeps, Chem. Geol., 213, 359–383, 2004. a, b
Aris, R.: Prolegomena to the rational analysis of systems of chemical reactions II. Some addenda, Arch. Ration. Mech. An., 27, 356–364, 1968. a
Arndt, S., Jørgensen, B. B., LaRowe, D. E., Middelburg, J., Pancost, R., and Regnier, P.: Quantifying the degradation of organic matter in marine sediments: a review and synthesis, Earth-Sci. Rev., 123, 53–86, 2013. a, b
Athy, L. F.: Density, porosity, and compaction of sedimentary rocks, AAPG Bull., 14, 1–24, 1930. a
Baker, G. and Osterkamp, T.: Implications of salt fingering processes for salt movement in thawed coarse-grained subsea permafrost, Cold Reg. Sci. Technol., 15, 45–52, 1988. a
Barton, B. I., Lenn, Y.-D., and Lique, C.: Observed Atlantification of the Barents Sea causes the Polar Front to limit the expansion of winter sea ice, J. Phys. Oceanogr., 48, 1849–1866, 2018. a
Bauch, H. A., Mueller-Lupp, T., Taldenkova, E., Spielhagen, R. F., Kassens, H., Grootes, P. M., Thiede, J., Heinemeier, J., and Petryashov, V.: Chronology of the Holocene transgression at the North Siberian margin, Glob. Planet. Change, 31, 125–139, 2001. a, b, c
Bekryaev, R. V., Polyakov, I. V., and Alexeev, V. A.: Role of polar amplification in long-term surface air temperature variations and modern Arctic warming, J. Clim., 23, 3888–3906, 2010. a
Berchet, A., Bousquet, P., Pison, I., Locatelli, R., Chevallier, F., Paris, J.-D., Dlugokencky, E. J., Laurila, T., Hatakka, J., Viisanen, Y., Worthy, D. E. J., Nisbet, E., Fisher, R., France, J., Lowry, D., Ivakhov, V., and Hermansen, O.: Atmospheric constraints on the methane emissions from the East Siberian Shelf, Atmos. Chem. Phys., 16, 4147–4157, https://doi.org/10.5194/acp-16-4147-2016, 2016. a
Berner, R. A.: Early diagenesis: a theoretical approach, 1, Princeton University Press, 1980. a
Biastoch, A., Treude, T., Rüpke, L. H., Riebesell, U., Roth, C., Burwicz, E. B., Park, W., Latif, M., Böning, C. W., Madec, G., and Wallmann, K.: Rising Arctic Ocean temperatures cause gas hydrate destabilization and ocean acidification, Geophys. Res. Lett., 38, L08602, https://doi.org/10.1029/2011GL047222, 2011. a, b
Boetius, A., Ravenschlag, K., Schubert, C. J., Rickert, D., Widdel, F., Gieseke, A., Amann, R., Jørgensen, B. B., Witte, U., and Pfannkuche, O.: A marine microbial consortium apparently mediating anaerobic oxidation of methane, Nature, 407, 623–626, 2000. a, b
Bolshiyanov, D., Makarov, A., and Savelieva, L.: Lena River delta formation during the Holocene, Biogeosciences, 12, 579–593, 2015. a
Borges, A. and Abril, G.: 5.04-Carbon dioxide and methane dynamics in estuaries, Treatise on Estuarine and Coastal Science, Volume 5: Biogeochemistry, Academic Press, 119–161, 2011. a
Borowski, W. S., Paull, C. K., and Ussler III, W.: Marine pore-water sulfate profiles indicate in situ methane flux from underlying gas hydrate, Geology, 24, 655–658, 1996. a
Boudreau, B. P.: Mathematics of tracer mixing in sediments: I. Spatially-dependent, diffusive mixing, Am. J. Sci, 286, 161–198, 1986. a
Boudreau, B. P.: Diagenetic models and their implementation, Vol. 505, Springer Berlin, 1997. a, b, c, d
Boudreau, B. P.: The physics of bubbles in surficial, soft, cohesive sediments, Mar. Petrol. Geol., 38, 1–18, 2012. a
Boudreau, B. P. and Ruddick, B. R.: On a reactive continuum representation of organic matter diagenesis, Am. J. Sci., 291, 507–538, 1991. a
Boudreau, B. P., Algar, C., Johnson, B. D., Croudace, I., Reed, A., Furukawa, Y., Dorgan, K. M., Jumars, P. A., Grader, A. S., and Gardiner, B. S.: Bubble growth and rise in soft sediments, Geology, 33, 517–520, 2005. a
Bowles, M. W., Mogollón, J. M., Kasten, S., Zabel, M., and Hinrichs, K.-U.: Global rates of marine sulfate reduction and implications for sub–sea-floor metabolic activities, Science, 344, 889–891, 2014. a
Bröder, L., Tesi, T., Andersson, A., Eglinton, T. I., Semiletov, I. P., Dudarev, O. V., Roos, P., and Gustafsson, Ö.: Historical records of organic matter supply and degradation status in the East Siberian Sea, Org. Geochem., 91, 16–30, 2016. a
Bruce, E. R. and Perry, L. M.: Environmental biotechnology: principles and applications, New York, Tata McGraw-Hill Education, 2001. a
Brüchert, V.: Unpublished raw data, 2020. a, b, c
Brüchert, V., Bröder, L., Sawicka, J. E., Tesi, T., Joye, S. P., Sun, X., Semiletov, I. P., and Samarkin, V. A.: Carbon mineralization in Laptev and East Siberian sea shelf and slope sediment, Biogeosciences, 15, 471–490, https://doi.org/10.5194/bg-15-471-2018, 2018. a, b
Burwicz, E. B., Rüpke, L., and Wallmann, K.: Estimation of the global amount of submarine gas hydrates formed via microbial methane formation based on numerical reaction-transport modeling and a novel parameterization of Holocene sedimentation, Geochim. Cosmochim. Ac., 75, 4562–4576, 2011. a, b
Capet, A., Meysman, F. J., Akoumianaki, I., Soetaert, K., and Grégoire, M.: Integrating sediment biogeochemistry into 3D oceanic models: a study of benthic-pelagic coupling in the Black Sea, Ocean Model., 101, 83–100, 2016. a
Carmack, E. C., Macdonald, R. W., Perkin, R. G., McLaughlin, F. A., and Pearson, R. J.: Evidence for warming of Atlantic water in the southern Canadian Basin of the Arctic Ocean: Results from the Larsen-93 expedition, Geophys. Res. Lett., 22, 1061–1064, 1995. a
Centler, F., Shao, H., De Biase, C., Park, C.-H., Regnier, P., Kolditz, O., and Thullner, M.: GeoSysBRNS – A flexible multidimensional reactive transport model for simulating biogeochemical subsurface processes, Comput. Geosci., 36, 397–405, 2010. a
Charkin, A. N., Rutgers van der Loeff, M., Shakhova, N. E., Gustafsson, Ö., Dudarev, O. V., Cherepnev, M. S., Salyuk, A. N., Koshurnikov, A. V., Spivak, E. A., Gunar, A. Y., Ruban, A. S., and Semiletov, I. P.: Discovery and characterization of submarine groundwater discharge in the Siberian Arctic seas: a case study in the Buor-Khaya Gulf, Laptev Sea, The Cryosphere, 11, 2305–2327, https://doi.org/10.5194/tc-11-2305-2017, 2017. a
Chatterjee, S., Dickens, G. R., Bhatnagar, G., Chapman, W. G., Dugan, B., Snyder, G. T., and Hirasaki, G. J.: Pore water sulfate, alkalinity, and carbon isotope profiles in shallow sediment above marine gas hydrate systems: A numerical modeling perspective, J. Geophys. Res.-Sol. Ea., 116, B09103, https://doi.org/10.1029/2011JB008290, 2011. a
Christensen, J., Krishna Kumar, K., Aldrian, E., An, S., Cavalcanti, I., de Castro, M., Dong, W., Goswami, A., Hall, A., Kanyanga, J. K., Kitoh, A., Kossin, J., Lau, N.-C., Renwick, J., Stephenson, D. B., Xie, S.-P., and Zhou, T.: Climate change 2013: the physical scientific basis, Contribution of Working Group I to the Fifth Assessment Report of the Intergovernmental Panel on Climate Change, 1217–1308, 2013. a
Clough, L. M., Ambrose Jr, W. G., Cochran, J. K., Barnes, C., Renaud, P. E., and Aller, R. C.: Infaunal density, biomass and bioturbation in the sediments of the Arctic Ocean, Deep-Sea Res. Pt. II, 44, 1683–1704, 1997. a
Crémière, A., Lepland, A., Chand, S., Sahy, D., Condon, D. J., Noble, S. R., Martma, T., Thorsnes, T., Sauer, S., and Brunstad, H.: Timescales of methane seepage on the Norwegian margin following collapse of the Scandinavian Ice Sheet, Nat. Commun., 7, 11509, https://doi.org/10.1038/ncomms11509, 2016a. a
Crémière, A., Lepland, A., Chand, S., Sahy, D., Kirsimäe, K., Bau, M., Whitehouse, M. J., Noble, S. R., Martma, T., Thorsnes, T., and Brunstad, H.: Fluid source and methane-related diagenetic processes recorded in cold seep carbonates from the Alvheim channel, central North Sea, Chem. Geol., 432, 16–33, 2016b. a
Dale, A. W., Regnier, P., and Van Cappellen, P.: Bioenergetic controls on anaerobic oxidation of methane (AOM) in coastal marine sediments: a theoretical analysis, Am. J. Sci., 306, 246–294, 2006. a, b, c, d, e, f, g, h
Dale, A. W., Aguilera, D., Regnier, P., Fossing, H., Knab, N., and Jørgensen, B. B.: Seasonal dynamics of the depth and rate of anaerobic oxidation of methane in Aarhus Bay (Denmark) sediments, J. Mar. Res., 66, 127–155, 2008a. a, b, c, d
Dale, A. W., Regnier, P., Knab, N., Jørgensen, B. B., and Van Cappellen, P.: Anaerobic oxidation of methane (AOM) in marine sediments from the Skagerrak (Denmark): II. Reaction-transport modeling, Geochim. Cosmochim. Ac., 72, 2880–2894, 2008b. a
Dale, A. W., Van Cappellen, P., Aguilera, D., and Regnier, P.: Methane efflux from marine sediments in passive and active margins: Estimations from bioenergetic reaction–transport simulations, Earth Planet. Sc. Lett., 265, 329–344, 2008c. a, b, c, d, e, f, g, h, i, j, k, l, m, n, o
Dale, A. W., Brüchert, V., Alperin, M., and Regnier, P.: An integrated sulfur isotope model for Namibian shelf sediments, Geochim. Cosmochim. Ac., 73, 1924–1944, 2009. a
Dale, A. W., Nickelsen, L., Scholz, F., Hensen, C., Oschlies, A., and Wallmann, K.: A revised global estimate of dissolved iron fluxes from marine sediments, Global Biogeochem. Cy., 29, 691–707, 2015. a
Dale, A. W., Graco, M., and Wallmann, K.: Strong and dynamic benthic-pelagic coupling and feedbacks in a coastal upwelling system (Peruvian shelf), Front. Mar. Sci., 4, 29 pp., https://doi.org/10.3389/fmars.2017.00029, 2017. a
Dean, J. F., Middelburg, J. J., Röckmann, T., Aerts, R., Blauw, L. G., Egger, M., Jetten, M. S., Jong, A. E., Meisel, O. H., Rasigraf, O., Slomp, C. P., in't Zandt, M. H., and Dolman, A. J.: Methane feedbacks to the global climate system in a warmer world, Rev. Geophys., 56, 207–250, 2018. a
Dickson, A. G. and Goyet, C.: Handbook of methods for the analysis of the various parameters of the carbon dioxide system in sea water, Version 2, Tech. rep., Oak Ridge National Lab., TN, USA, 1994. a
Dmitrenko, I. A., Kirillov, S. A., Tremblay, L. B., Kassens, H., Anisimov, O. A., Lavrov, S. A., Razumov, S. O., and Grigoriev, M. N.: Recent changes in shelf hydrography in the Siberian Arctic: Potential for subsea permafrost instability, J. Geophys. Res.-Ocean., 116, C10027, https://doi.org/10.1029/2011JC007218, 2011. a, b, c
Drachev, S. S., Savostin, L. A., Groshev, V. G., and Bruni, I. E.: Structure and geology of the continental shelf of the Laptev Sea, Eastern Russian Arctic, Tectonophysics, 298, 357–393, 1998. a
Drake, T. W., Wickland, K. P., Spencer, R. G., McKnight, D. M., and Striegl, R. G.: Ancient low–molecular-weight organic acids in permafrost fuel rapid carbon dioxide production upon thaw, P. Natl. Acad. Sci. USA, 112, 13946–13951, 2015. a
Duan, Z., Møller, N., Greenberg, J., and Weare, J. H.: The prediction of methane solubility in natural waters to high ionic strength from 0 to 250 C and from 0 to 1600 bar, Geochim. Cosmochim. Ac., 56, 1451–1460, 1992. a
Egger, M., Lenstra, W., Jong, D., Meysman, F. J., Sapart, C. J., van der Veen, C., Röckmann, T., Gonzalez, S., and Slomp, C. P.: Rapid sediment accumulation results in high methane effluxes from coastal sediments, PloS One, 11, e0161609, https://doi.org/10.1371/journal.pone.0161609, 2016. a, b, c, d
Egger, M., Riedinger, N., Mogollón, J. M., and Jørgensen, B. B.: Global diffusive fluxes of methane in marine sediments, Nat. Geosci., 11, 421–425, 2018. a, b, c, d, e
Fairbanks, R. G.: A 17,000-year glacio-eustatic sea level record: influence of glacial melting rates on the Younger Dryas event and deep-ocean circulation, Nature, 342, 637–642, 1989. a
Fossing, H., Ferdelman, T. G., and Berg, P.: Sulfate reduction and methane oxidation in continental margin sediments influenced by irrigation (South-East Atlantic off Namibia), Geochim. Cosmochim. Ac., 64, 897–910, 2000. a
Gramberg, I. S., Kulakov, Y. N., Pogrebitsky, Y. E., and Sorokov, D. S.: Arctic oil and gas super basin, Petroleum Geology: A digest of Russian literature on Petroleum Geology, 22, 158–161, 1983. a
Graves, C. A., James, R. H., Sapart, C. J., Stott, A. W., Wright, I. C., Berndt, C., Westbrook, G. K., and Connelly, D. P.: Methane in shallow subsurface sediments at the landward limit of the gas hydrate stability zone offshore western Svalbard, Geochim. Cosmochim. Ac., 198, 419–438, 2017. a
Guo, L., Ping, C.-L., and Macdonald, R. W.: Mobilization pathways of organic carbon from permafrost to arctic rivers in a changing climate, Geophys. Res. Lett., 34, L13603, https://doi.org/10.1029/2007GL030689, 2007. a
Gypens, N., Lancelot, C., and Soetaert, K.: Simple parameterisations for describing N and P diagenetic processes: Application in the North Sea, Prog. Oceanogr., 76, 89–110, 2008. a
Haeckel, M., Suess, E., Wallmann, K., and Rickert, D.: Rising methane gas bubbles form massive hydrate layers at the seafloor, Geochim. Cosmochim. Ac., 68, 4335–4345, 2004. a
Haese, R. R., Meile, C., Van Cappellen, P., and De Lange, G. J.: Carbon geochemistry of cold seeps: methane fluxes and transformation in sediments from Kazan mud volcano, eastern Mediterranean Sea, Earth Planet. Sc. Lett., 212, 361–375, 2003. a
Hensen, C. and Wallmann, K.: Methane formation at Costa Rica continental margin–constraints for gas hydrate inventories and cross-décollement fluid flow, Earth Planet. Sc. Lett., 236, 41–60, 2005. a
Hinrichs, K.-U. and Boetius, A.: The anaerobic oxidation of methane: new insights in microbial ecology and biogeochemistry, in: Ocean margin systems, Springer, 457–477, 2002. a, b, c
Ho, T. and Aris, R.: On apparent second-order kinetics, AIChE J., 33, 1050–1051, 1987. a
Hunter, S., Goldobin, D., Haywood, A., Ridgwell, A., and Rees, J.: Sensitivity of the global submarine hydrate inventory to scenarios of future climate change, Earth Planet. Sc. Lett., 367, 105–115, 2013. a
Iversen, N. and Jorgensen, B. B.: Anaerobic methane oxidation rates at the sulfate-methane transition in marine sediments from Kattegat and Skagerrak (Denmark) 1, Limnol. Oceanogr., 30, 944–955, 1985. a
Jakobsson, M., Mayer, L., Coakley, B. et al.: The international bathymetric chart of the Arctic Ocean (IBCAO) version 3.0, Geophys. Res. Lett., 39, L12609, https://doi.org/10.1029/2012GL052219, 2012. a
James, R. H., Bousquet, P., Bussmann, I., Haeckel, M., Kipfer, R., Leifer, I., Niemann, H., Ostrovsky, I., Piskozub, J., Rehder, G., Treude, T., Vielstädte, L., and Greinert, J.: Effects of climate change on methane emissions from seafloor sediments in the Arctic Ocean: A review, Limnol. Oceanogr., 61, S283–S299, 2016. a, b, c, d, e
Janout, M., Hölemann, J., Juhls, B., Krumpen, T., Rabe, B., Bauch, D., Wegner, C., Kassens, H., and Timokhov, L.: Episodic warming of near-bottom waters under the Arctic sea ice on the central Laptev Sea shelf, Geophys. Res. Lett., 43, 264–272, 2016. a
Jeffries, M. and Richter-Menge, J.: State of the climate in 2011: The Arctic, Bull. Am. Meteorol. Soc, 93, S127–S148, 2012. a
Jin, Q. and Bethke, C. M.: Predicting the rate of microbial respiration in geochemical environments, Geochim. Cosmochim. Ac., 69, 1133–1143, 2005. a
Jørgensen, B. B., Weber, A., and Zopfi, J.: Sulfate reduction and anaerobic methane oxidation in Black Sea sediments, Deep-Sea Res. Pt. I, 48, 2097–2120, 2001. a, b
Jourabchi, P., Van Cappellen, P., and Regnier, P.: Quantitative interpretation of pH distributions in aquatic sediments: A reaction-transport modeling approach, Am. J. Sci., 305, 919–956, 2005. a
Judd, A. and Hovland, M.: Seabed fluid flow: the impact on geology, biology and the marine environment, Cambridge University Press, 2009. a
Karaca, D., Hensen, C., and Wallmann, K.: Controls on authigenic carbonate precipitation at cold seeps along the convergent margin off Costa Rica, Geochem. Geophy. Geosy., 11, Q08S27, https://doi.org/10.1029/2010GC003062, 2010. a
Knab, N. J., Cragg, B. A., Hornibrook, E. R. C., Holmkvist, L., Pancost, R. D., Borowski, C., Parkes, R. J., and Jørgensen, B. B.: Regulation of anaerobic methane oxidation in sediments of the Black Sea, Biogeosciences, 6, 1505–1518, https://doi.org/10.5194/bg-6-1505-2009, 2009. a
Knittel, K. and Boetius, A.: Anaerobic oxidation of methane: progress with an unknown process, Annu. Rev. Microbiol., 63, 311–334, 2009. a, b
Kretschmer, K., Biastoch, A., Rüpke, L., and Burwicz, E.: Modeling the fate of methane hydrates under global warming, Global Biogeochem. Cy., 29, 610–625, 2015. a
Krüger, M., Meyerdierks, A., Glöckner, F. O., Amann, R., Widdel, F., Kube, M., Reinhardt, R., Kahnt, J., Böcher, R., Thauer, R. K., and Shima, S.: A conspicuous nickel protein in microbial mats that oxidize methane anaerobically, Nature, 426, 878–881, 2003. a
LaRowe, D. E., Burwicz, E., Arndt, S., Dale, A. W., and Amend, J. P.: Temperature and volume of global marine sediments, Geology, 45, 275–278, 2017. a, b
Leifer, I., Chernykh, D., Shakhova, N., and Semiletov, I.: Sonar gas flux estimation by bubble insonification: application to methane bubble flux from seep areas in the outer Laptev Sea, The Cryosphere, 11, 1333–1350, https://doi.org/10.5194/tc-11-1333-2017, 2017. a, b
Levitan, M. A. and Lavrushin, Y. A.: Sedimentation history in the Arctic Ocean and Subarctic Seas for the last 130 kyr, Vol. 118, Springer Science & Business Media, 2009. a
Linke, P., Wallmann, K., Suess, E., Hensen, C., and Rehder, G.: In situ benthic fluxes from an intermittently active mud volcano at the Costa Rica convergent margin, Earth Planet. Sc. Lett., 235, 79–95, 2005. a, b
Lösekann, T., Knittel, K., Nadalig, T., Fuchs, B., Niemann, H., Boetius, A., and Amann, R.: Diversity and abundance of aerobic and anaerobic methane oxidizers at the Haakon Mosby Mud Volcano, Barents Sea, Appl. Environ. Microbiol., 73, 3348–3362, 2007. a
Luff, R. and Wallmann, K.: Fluid flow, methane fluxes, carbonate precipitation and biogeochemical turnover in gas hydrate-bearing sediments at Hydrate Ridge, Cascadia Margin: numerical modeling and mass balances, Geochim. Cosmochim. Ac., 67, 3403–3421, 2003. a, b, c
Luff, R., Greinert, J., Wallmann, K., Klaucke, I., and Suess, E.: Simulation of long-term feedbacks from authigenic carbonate crust formation at cold vent sites, Chem. Geol., 216, 157–174, 2005. a
Maher, K., Steefel, C. I., DePaolo, D. J., and Viani, B. E.: The mineral dissolution rate conundrum: Insights from reactive transport modeling of U isotopes and pore fluid chemistry in marine sediments, Geochim. Cosmochim. Ac., 70, 337–363, 2006. a
Marquardt, M., Hensen, C., Piñero, E., Wallmann, K., and Haeckel, M.: A transfer function for the prediction of gas hydrate inventories in marine sediments, Biogeosciences, 7, 2925–2941, https://doi.org/10.5194/bg-7-2925-2010, 2010. a
Martens, C. S., Albert, D. B., and Alperin, M. J.: Biogeochemical processes controlling methane in gassy coastal sediments – Part 1. A model coupling organic matter flux to gas production, oxidation and transport, Cont. Shelf Res., 18, 1741–1770, 1998. a
Masson-Delmotte, V., Zhai, P., Pörtner, H. O., Roberts, D., Skea, J., Shukla, P., Pirani, A., Moufouma-Okia, W., Péan, C., Pidcock, R., Connors, S., Matthews, J. B. R., Chen, Y., Zhou, X., Gomis, M. I., Lonnoy, E., Maycock, T., Tignor, M., and Waterfield, T.: IPCC, 2018: Global warming of 1.5 ∘C, An IPCC Special Report on the impacts of global warming of 1.5 ∘C above pre-industrial levels and related global greenhouse gas emission pathways, in the context of strengthening the global response to the threat of climate change, sustainable development, and efforts to eradicate poverty, Tech. Rep., 2018. a
McGlynn, S. E., Chadwick, G. L., Kempes, C. P., and Orphan, V. J.: Single cell activity reveals direct electron transfer in methanotrophic consortia, Nature, 526, 531–535, 2015. a
McGuire, A. D., Anderson, L. G., Christensen, T. R., Dallimore, S., Guo, L., Hayes, D. J., Heimann, M., Lorenson, T. D., Macdonald, R. W., and Roulet, N.: Sensitivity of the carbon cycle in the Arctic to climate change, Ecol. Monogr., 79, 523–555, 2009. a
Meister, P., Liu, B., Ferdelman, T. G., Jørgensen, B. B., and Khalili, A.: Control of sulphate and methane distributions in marine sediments by organic matter reactivity, Geochim. Cosmochim. Ac., 104, 183–193, 2013. a, b, c, d
Meister, P., Wiedling, J., Lott, C., Bach, W., Kuhfuß, H., Wegener, G., Böttcher, M. E., Deusner, C., Lichtschlag, A., Bernasconi, S. M., and Weber, M.: Anaerobic methane oxidation inducing carbonate precipitation at abiogenic methane seeps in the Tuscan archipelago (Italy), PloS One, 13, 1–34, 2018. a
Middelburg, J. J., Soetaert, K., and Herman, P. M.: Empirical relationships for use in global diagenetic models, Deep-Sea Res. Pt. I, 44, 327–344, 1997. a
Miller, C. M., Dickens, G. R., Jakobsson, M., Johansson, C., Koshurnikov, A., O’Regan, M., Muschitiello, F., Stranne, C., and Mörth, C.-M.: Pore water geochemistry along continental slopes north of the East Siberian Sea: inference of low methane concentrations, Biogeosciences, 14, 2929–2953, 2017. a
Milucka, J., Ferdelman, T. G., Polerecky, L., Franzke, D., Wegener, G., Schmid, M., Lieberwirth, I., Wagner, M., Widdel, F., and Kuypers, M. M.: Zero-valent sulphur is a key intermediate in marine methane oxidation, Nature, 491, 541–546, 2012. a
Mogollón, J. M., L'Heureux, I., Dale, A. W., and Regnier, P.: Methane gas-phase dynamics in marine sediments: A model study, Am. J. Sci., 309, 189–220, 2009. a
Nauhaus, K., Albrecht, M., Elvert, M., Boetius, A., and Widdel, F.: In vitro cell growth of marine archaeal-bacterial consortia during anaerobic oxidation of methane with sulfate, Environ. Microbiol., 9, 187–196, 2007. a
Niemann, H., Duarte, J., Hensen, C., Omoregie, E., Magalhaes, V., Elvert, M., Pinheiro, L., Kopf, A., and Boetius, A.: Microbial methane turnover at mud volcanoes of the Gulf of Cadiz, Geochim. Cosmochim. Ac., 70, 5336–5355, 2006a. a
Niemann, H., Lösekann, T., De Beer, D., Elvert, M., Nadalig, T., Knittel, K., Amann, R., Sauter, E. J., Schlüter, M., Klages, M., Foucher, J. P., and Boetius, A.: Novel microbial communities of the Haakon Mosby mud volcano and their role as a methane sink, Nature, 443, 854–858, 2006b. a
O'Connor, F. M., Boucher, O., Gedney, N., Jones, C., Folberth, G., Coppell, R., Friedlingstein, P., Collins, W., Chappellaz, J., Ridley, J., and Johnson, C. E.: Possible role of wetlands, permafrost, and methane hydrates in the methane cycle under future climate change: A review, Rev. Geophys., 48, RG4005, https://doi.org/10.1029/2010RG000326, 2010. a
Overduin, P. P., Wetterich, S., Günther, F., Grigoriev, M. N., Grosse, G., Schirrmeister, L., Hubberten, H.-W., and Makarov, A.: Coastal dynamics and submarine permafrost in shallow water of the central Laptev Sea, East Siberia, The Cryosphere, 10, 1449–1462, https://doi.org/10.5194/tc-10-1449-2016, 2016. a
Overduin, P. P., Liebner, S., Knoblauch, C., Günther, F., Wetterich, S., Schirrmeister, L., Hubberten, H.-W., and Grigoriev, M. N.: Methane oxidation following submarine permafrost degradation: Measurements from a central Laptev Sea shelf borehole, J. Geophys. Res.-Biogeo., 120, 965–978, 2015. a, b, c
Piechura, J. and Walczowski, W.: The Arctic Front: structure and dynamics, Oceanologia, 37, 47–73, 1995. a
Pierre, C., Blanc-Valleron, M.-M., Demange, J., Boudouma, O., Foucher, J.-P., Pape, T., Himmler, T., Fekete, N., and Spiess, V.: Authigenic carbonates from active methane seeps offshore southwest Africa, Geo-Mar. Lett., 32, 501–513, 2012. a
Piker, L., Schmaljohann, R., and Imhoff, J. F.: Dissimilatory sulfate reduction and methane production in Gotland Deep sediments (Baltic Sea) during a transition period from oxic to anoxic bottom water (1993–1996), Aquat. Microb. Ecol., 14, 183–193, 1998. a
Polyakov, I. V., Pnyushkov, A. V., Alkire, M. B., Ashik, I. M., Baumann, T. M., Carmack, E. C., Goszczko, I., Guthrie, J., Ivanov, V. V., Kanzow, T., Kroshfield, R., Kwok, R., Sundfjord, A., Morison, J., Rembert, R., and Yulin, A.: Greater role for Atlantic inflows on sea-ice loss in the Eurasian Basin of the Arctic Ocean, Science, 356, 285–291, 2017. a
Reagan, M. T. and Moridis, G. J.: Large-scale simulation of methane hydrate dissociation along the West Spitsbergen Margin, Geophys. Res. Lett., 36, L23612, https://doi.org/10.1029/2009GL041332, 2009. a
Reeburgh, W. S.: Oceanic methane biogeochemistry, Chem. Rev., 107, 486–513, 2007. a, b
Regnier, P., O'kane, J., Steefel, C., and Vanderborght, J.-P.: Modeling complex multi-component reactive-transport systems: towards a simulation environment based on the concept of a Knowledge Base, Appl. Math. Model., 26, 913–927, 2002. a
Regnier, P., Dale, A. W., Arndt, S., LaRowe, D., Mogollón, J., and Van Cappellen, P.: Quantitative analysis of anaerobic oxidation of methane (AOM) in marine sediments: a modeling perspective, Earth-Sci. Rev., 106, 105–130, 2011. a, b, c, d, e, f, g, h, i, j, k, l
Rittmann, B. and VanBriesen, J. M.: Microbiological processes in reactive modeling, in: Reactive Transport in Porous Media, Walter de Gruyter GmbH, 311–334, 2019. a
Rittmann, B. E. and McCarty, P. L.: Environmental biotechnology: principles and applications, Tata McGraw-Hill Education, 2012. a
Romanovskii, N., Hubberten, H.-W., Gavrilov, A., Tumskoy, V., and Kholodov, A.: Permafrost of the east Siberian Arctic shelf and coastal lowlands, Quaternary Sci. Rev., 23, 1359–1369, 2004. a
Romanovskii, N., Hubberten, H.-W., Gavrilov, A., Eliseeva, A., and Tipenko, G.: Offshore permafrost and gas hydrate stability zone on the shelf of East Siberian Seas, Geo-Mar. Lett., 25, 167–182, 2005. a, b, c
Romanovskii, N. N. and Hubberten, H.-W.: Results of permafrost modelling of the lowlands and shelf of the Laptev Sea region, Russia, Permafrost Periglac., 12, 191–202, 2001. a
Ruppel, C. D. and Kessler, J. D.: The interaction of climate change and methane hydrates, Rev. Geophys., 55, 126–168, 2017. a, b, c, d, e, f
Sales de Freitas, F.: Deciphering the relationships between reactivity and sources of organic matter in marine sediments: a coupled large-scale model and lipid biomarker analysis, Ph.D. thesis, School on Earth Sciences, University of Bristol, 2018. a
Sapart, C. J., Shakhova, N., Semiletov, I., Jansen, J., Szidat, S., Kosmach, D., Dudarev, O., van der Veen, C., Egger, M., Sergienko, V., Salyuk, A., Tumskoy, V., Tison, J.-L., and Röckmann, T.: The origin of methane in the East Siberian Arctic Shelf unraveled with triple isotope analysis, Biogeosciences, 14, 2283–2292, https://doi.org/10.5194/bg-14-2283-2017, 2017. a
Saunois, M., Bousquet, P., Poulter, B., Peregon, A., Ciais, P., Canadell, J. G., Dlugokencky, E. J., Etiope, G., Bastviken, D., Houweling, S., Janssens-Maenhout, G., Tubiello, F. N., Castaldi, S., Jackson, R. B., Alexe, M., Arora, V. K., Beerling, D. J., Bergamaschi, P., Blake, D. R., Brailsford, G., Brovkin, V., Bruhwiler, L., Crevoisier, C., Crill, P., Covey, K., Curry, C., Frankenberg, C., Gedney, N., Höglund-Isaksson, L., Ishizawa, M., Ito, A., Joos, F., Kim, H.-S., Kleinen, T., Krummel, P., Lamarque, J.-F., Langenfelds, R., Locatelli, R., Machida, T., Maksyutov, S., McDonald, K. C., Marshall, J., Melton, J. R., Morino, I., Naik, V., O'Doherty, S., Parmentier, F.-J. W., Patra, P. K., Peng, C., Peng, S., Peters, G. P., Pison, I., Prigent, C., Prinn, R., Ramonet, M., Riley, W. J., Saito, M., Santini, M., Schroeder, R., Simpson, I. J., Spahni, R., Steele, P., Takizawa, A., Thornton, B. F., Tian, H., Tohjima, Y., Viovy, N., Voulgarakis, A., van Weele, M., van der Werf, G. R., Weiss, R., Wiedinmyer, C., Wilton, D. J., Wiltshire, A., Worthy, D., Wunch, D., Xu, X., Yoshida, Y., Zhang, B., Zhang, Z., and Zhu, Q.: The global methane budget 2000–2012, Earth Syst. Sci. Data, 8, 697–751, https://doi.org/10.5194/essd-8-697-2016, 2016. a, b
Semenov, P., Portnov, A., Krylov, A., Egorov, A., and Vanshtein, B.: Geochemical evidence for seabed fluid flow linked to the subsea permafrost outer border in the South Kara Sea, Geochemistry, 2019. a
Shakhova, N., Semiletov, I., Leifer, I., Salyuk, A., Rekant, P., and Kosmach, D.: Geochemical and geophysical evidence of methane release over the East Siberian Arctic Shelf, J. Geophys. Res.-Ocean., 115, C08007, https://doi.org/10.1029/2009JC005602, 2010a. a, b, c
Shakhova, N., Semiletov, I., Salyuk, A., Yusupov, V., Kosmach, D., and Gustafsson, Ö.: Extensive methane venting to the atmosphere from sediments of the East Siberian Arctic Shelf, Science, 327, 1246–1250, 2010b. a
Shakhova, N., Semiletov, I., Leifer, I., Sergienko, V., Salyuk, A., Kosmach, D., Chernykh, D., Stubbs, C., Nicolsky, D., Tumskoy, V., and Gustaffson, Ö.: Ebullition and storm-induced methane release from the East Siberian Arctic Shelf, Nat. Geosci., 7, 64–70, 2014. a, b, c, d
Shakhova, N., Semiletov, I., Sergienko, V., Lobkovsky, L., Yusupov, V., Salyuk, A., Salomatin, A., Chernykh, D., Kosmach, D., Panteleev, G., Nicolsky, D., Samarkin, V., Joye, S., Charkin, A., Dudarev, O., Meluzov, A., and Gustafsson, O.: The East Siberian Arctic Shelf: towards further assessment of permafrost-related methane fluxes and role of sea ice, Philos. T. R. Soc. A, 373, 20140451, https://doi.org/10.1098/rsta.2014.0451, 2015. a
Shakhova, N., Semiletov, I., Gustafsson, O., Sergienko, V., Lobkovsky, L., Dudarev, O., Tumskoy, V., Grigoriev, M., Mazurov, A., Salyuk, A., Ananiev, R., Koshurnikov, A., Kosmach, D., Charkin, A., Dmitrevsky, N., Karnaukh, V., Gunar, A., Meluzov, A., and Chernykh, D.: Current rates and mechanisms of subsea permafrost degradation in the East Siberian Arctic Shelf, Nat. Commun., 8, 15872, https://doi.org/10.1038/ncomms15872, 2017. a, b, c, d
Shakhova, N., Semiletov, I., and Chuvilin, E.: Understanding the permafrost–hydrate system and associated methane releases in the east Siberian Arctic Shelf, Geosciences, 9, 251, https://doi.org/10.3390/geosciences9060251, 2019. a
Sloan Jr., E. D. and Koh, C.: Clathrate hydrates of natural gases, CRC press, 2007. a, b
Sommer, S., Pfannkuche, O., Linke, P., Luff, R., Greinert, J., Drews, M., Gubsch, S., Pieper, M., Poser, M., and Viergutz, T.: Efficiency of the benthic filter: Biological control of the emission of dissolved methane from sediments containing shallow gas hydrates at Hydrate Ridge, Global Biogeochem. Cy., 20, GB2019, https://doi.org/10.1029/2004GB002389, 2006. a
Sparrow, K. J., Kessler, J. D., Southon, J. R., Garcia-Tigreros, F., Schreiner, K. M., Ruppel, C. D., Miller, J. B., Lehman, S. J., and Xu, X.: Limited contribution of ancient methane to surface waters of the US Beaufort Sea shelf, Sci. Adv., 4, eaao4842, https://doi.org/10.1126/sciadv.aao4842, 2018. a
Stein, R., Boucsein, B., Fahl, K., de Oteyza, T. G., Knies, J., and Niessen, F.: Accumulation of particulate organic carbon at the Eurasian continental margin during late Quaternary times: controlling mechanisms and paleoenvironmental significance, Glob. Planet. Change, 31, 87–104, 2001. a
Stranne, C., O'Regan, M., Jakobsson, M., Brüchert, V., and Ketzer, M.: Can anaerobic oxidation of methane prevent seafloor gas escape in a warming climate?, Solid Earth, 10, 1541–1554, https://doi.org/10.5194/se-10-1541-2019, 2019. a
Teal, L., Bulling, M. T., Parker, E., and Solan, M.: Global patterns of bioturbation intensity and mixed depth of marine soft sediments, Aquat. Biol., 2, 207–218, 2008. a
Tesi, T., Semiletov, I., Hugelius, G., Dudarev, O., Kuhry, P., and Gustafsson, Ö.: Composition and fate of terrigenous organic matter along the Arctic land–ocean continuum in East Siberia: Insights from biomarkers and carbon isotopes, Geochim. Cosmochim. Ac., 133, 235–256, 2014. a
Thang, N. M., Brüchert, V., Formolo, M., Wegener, G., Ginters, L., Jørgensen, B. B., and Ferdelman, T. G.: The impact of sediment and carbon fluxes on the biogeochemistry of methane and sulfur in littoral Baltic Sea sediments (Himmerfjärden, Sweden), Estuar. Coast., 36, 98–115, 2013. a
Thornton, B. F., Geibel, M. C., Crill, P. M., Humborg, C., and Mörth, C.-M.: Methane fluxes from the sea to the atmosphere across the Siberian shelf seas, Geophys. Res. Lett., 43, 5869–5877, 2016. a
Thornton, B. F., Prytherch, J., Andersson, K., Brooks, I. M., Salisbury, D., Tjernström, M., and Crill, P. M.: Shipborne eddy covariance observations of methane fluxes constrain Arctic sea emissions, Sci. Adv., 6, eaay7934, https://doi.org/10.1126/sciadv.aay7934, 2020. a
Thullner, M., Van Cappellen, P., and Regnier, P.: Modeling the impact of microbial activity on redox dynamics in porous media, Geochim. Cosmochim. Ac., 69, 5005–5019, 2005. a
Thullner, M., Dale, A. W., and Regnier, P.: Global-scale quantification of mineralization pathways in marine sediments: A reaction-transport modeling approach, Geochem. Geophy. Geosy., 10, Q10012, https://doi.org/10.1029/2009GC002484, 2009. a, b, c, d
Tishchenko, P., Hensen, C., Wallmann, K., and Wong, C. S.: Calculation of the stability and solubility of methane hydrate in seawater, Chem. Geol., 219, 37–52, 2005. a
Trenberth, K., Jones, P., Ambenje, P., Bojariu, R., Easterling, D., Klein Tank, A., Parker, D., Rahimzadeh, F., Renwick, J., Rusticucci, M., Soden, B., and Zhai, P.: Observations: surface and atmospheric climate change, chap. 3, Climate Change, 235–336, 2007. a
Treude, T., Boetius, A., Knittel, K., Wallmann, K., and Jørgensen, B. B.: Anaerobic oxidation of methane above gas hydrates at Hydrate Ridge, NE Pacific Ocean, Mar. Ecol. Prog. Ser., 264, 1–14, 2003. a
Treude, T., Krüger, M., Boetius, A., and Jørgensen, B. B.: Environmental control on anaerobic oxidation of methane in the gassy sediments of Eckernförde Bay (German Baltic), Limnol. Oceanogr., 50, 1771–1786, 2005. a
Vonk, J. E., Sánchez-García, L., Van Dongen, B., Alling, V., Kosmach, D., Charkin, A., Semiletov, I. P., Dudarev, O. V., Shakhova, N., Roos, P., Eglinton, T. I., Andersson, A., and Gustafsson, Ö.: Activation of old carbon by erosion of coastal and subsea permafrost in Arctic Siberia, Nature, 489, 137–140, 2012. a
Wallmann, K., Aloisi, G., Haeckel, M., Obzhirov, A., Pavlova, G., and Tishchenko, P.: Kinetics of organic matter degradation, microbial methane generation, and gas hydrate formation in anoxic marine sediments, Geochim. Cosmochim. Ac., 70, 3905–3927, 2006a. a
Wallmann, K., Drews, M., Aloisi, G., and Bohrmann, G.: Methane discharge into the Black Sea and the global ocean via fluid flow through submarine mud volcanoes, Earth Planet. Sc. Lett., 248, 545–560, 2006b. a
Wang, Y. and Van Cappellen, P.: A multicomponent reactive transport model of early diagenesis: Application to redox cycling in coastal marine sediments, Geochim. Cosmochim. Ac., 60, 2993–3014, 1996. a
Wegener, G., Krukenberg, V., Riedel, D., Tegetmeyer, H. E., and Boetius, A.: Intercellular wiring enables electron transfer between methanotrophic archaea and bacteria, Nature, 526, 587–590, 2015. a, b
Wegner, C., Bennett, K. E., de Vernal, A., Forwick, M., Fritz, M., Heikkilä, M., Łącka, M., Lantuit, H., Laska, M., Moskalik, M., O'Regan, M., Pawłowska, J., Promińska, A., Rachold, V., Vonk, J. E., and Werner, K.: Variability in transport of terrigenous material on the shelves and the deep Arctic Ocean during the Holocene, Pol. Res., 34, 24964, https://doi.org/10.3402/polar.v34.24964, 2015. a
Westbrook, G. K., Thatcher, K. E., Rohling, E. J., Piotrowski, A. M., Pälike, H., Osborne, A. H., Nisbet, E. G., Minshull, T. A., Lanoisellé, M., James, R. H., Hühnerbach, V., Green, D., Fisher, R. E., Crocker, A. J., Chabert, A., Bolton, C., Beszczynska-Möller, A., Berndt, C., and Aquilina, A.: Escape of methane gas from the seabed along the West Spitsbergen continental margin, Geophys. Res. Lett., 36, L15608, https://doi.org/10.1029/2009GL039191, 2009. a
Wild, B., Andersson, A., Bröder, L., Vonk, J., Hugelius, G., McClelland, J. W., Song, W., Raymond, P. A., and Gustafsson, Ö.: Rivers across the Siberian Arctic unearth the patterns of carbon release from thawing permafrost, P. Natl. Acad. Sci. USA, 116, 10280–10285, 2019. a
Winkel, M., Mitzscherling, J., Overduin, P. P., Horn, F., Winterfeld, M., Rijkers, R., Grigoriev, M. N., Knoblauch, C., Mangelsdorf, K., Wagner, D., and Liebner, S.: Anaerobic methanotrophic communities thrive in deep submarine permafrost, Sci. Rep., 8, 1291, https://doi.org/10.1038/s41598-018-19505-9, 2018. a
Wright, J., Taylor, A., and Dallimore, S.: Thermal Impact of Holocene Lakes on a Permafrost Landscape, Mackenzie Delta, Canada, in: Proceedings of the Ninth international conference on Permafrost, Fairbanks, AK, 2008. a
Yakushev, V. S.: Gas hydrates in cryolithozone, Sov. Geol. Geophys., 11, 100–105, 1989. a
Yao, H., Hong, W.-L., Panieri, G., Sauer, S., Torres, M. E., Lehmann, M. F., Gründger, F., and Niemann, H.: Fracture-controlled fluid transport supports microbial methane-oxidizing communities at Vestnesa Ridge, Biogeosciences, 16, 2221–2232, https://doi.org/10.5194/bg-16-2221-2019, 2019. a
Zhang, J., Rothrock, D. A., and Steele, M.: Warming of the Arctic Ocean by a strengthened Atlantic inflow: Model results, Geophys. Res. Lett., 25, 1745–1748, 1998. a