the Creative Commons Attribution 4.0 License.
the Creative Commons Attribution 4.0 License.
 | 02 Jul 2020
Profiling float observation of thermohaline staircases in the western Mediterranean Sea and impact on nutrient fluxes
Vincent Taillandier
Louis Prieur
Fabrizio D'Ortenzio
Maurizio Ribera d'Alcalà
Elvira Pulido-Villena
In the western Mediterranean Sea, Levantine intermediate waters (LIW), which circulate below the surface productive zone, progressively accumulate nutrients along their pathway from the Tyrrhenian Sea to the Algerian Basin. This study addresses the role played by diffusion in the nutrient enrichment of the LIW, a process particularly relevant inside step-layer structures extending down to deep waters – structures known as thermohaline staircases. Profiling float observations confirmed that staircases develop over epicentral regions confined in large-scale circulation features and maintained by saltier LIW inflows on the periphery. Thanks to a high profiling frequency over the 4-year period 2013–2017, float observations reveal the temporal continuity of the layering patterns encountered during the cruise PEACETIME and document the evolution of layer properties by about +0.06 ∘C in temperature and +0.02 in salinity. In the Algerian Basin, the analysis of in situ lateral density ratios untangled double-diffusive convection as a driver of thermohaline changes inside epicentral regions and isopycnal diffusion as a driver of heat and salt exchanges with the surrounding sources. In the Tyrrhenian Sea, the nitrate flux across thermohaline staircases, as opposed to the downward salt flux, contributes up to 25 % of the total nitrate pool supplied to the LIW by vertical transfer. Overall, however, the nutrient enrichment of the LIW is driven mostly by other sources, coastal or atmospheric, as well as by inputs advected from the Algerian Basin.
- Article
(8194 KB) - Full-text XML
- BibTeX
- EndNote


The Mediterranean Sea is an ultraoligotrophic basin where primary production is generally weak because nutrient fluxes into the sunlit surface layers are very low during most of the year. Apart from dense water formation zones where spring phytoplankton blooms are observed (D'Ortenzio and Ribera d'Alcalà, 2009), nutrient fluxes and phytoplankton uptake occur mostly at the thermocline (Pasqueron de Fommervault et al., 2015), maintaining a subsurface chlorophyll maximum layer (Lavigne et al., 2013; Barbieux et al., 2019).
Similarly to the global ocean (Williams and Follows, 2003), the Mediterranean nutrient stocks below the thermocline are determined by large-scale hydrodynamical transport, following three distinct thermohaline circulation cells (Wüst, 1961). In the western Mediterranean, deep waters (hereinafter DW) result from winter convection in the Provençal Basin and in the Ligurian Sea (Medoc Group, 1970; Prieur et al., 1983). Likewise, the eastern Mediterranean DW are formed in the southern Adriatic Sea and intermittently in the Aegean Sea (Lascaratos et al., 1999; Roether et al., 2007). Levantine intermediate waters (hereinafter LIW) originate mostly through shallow convection in different sites of the Levantine Basin (Nittis and Lascaratos, 1999; The LIWEX Group, 2003). The thermohaline circulation cells involving DW are distinct in the eastern and the western Mediterranean basins, whereas the one driven by LIW encompasses the whole Mediterranean. They regionally distribute nutrient stocks, through DW that spread from the Liguro-Provençal Basin and from the Adriatic–Aegean seas or through LIW from the eastern Mediterranean (Ribera d'Alcalà et al., 2003; Kress et al., 2003).
Interestingly, the preformed nutrient concentrations in LIW are very low (Pasqueron de Fommervault et al., 2015); they are thought to be accumulated along the path, becoming a relevant source of nutrients in the western Mediterranean with nitrate concentration of around 5 µmol kg−1 in the Strait of Sicily. These values are already quite high compared to the intermediate concentrations of the eastern Mediterranean but correspond to half the concentration measured in the western Algerian Basin (Pujo-Pay et al., 2011). In order to reach such concentrations in the Ionian water inflows, LIW should export the major part of atmospheric and terrestrial inputs from the eastern Mediterranean (Ribera d'Alcalà et al., 2003). Conversely, the mechanisms of LIW enrichment (i.e., accumulation of nutrients in the LIW) inside the western Mediterranean are not so clear. External sources (river and coastal runoffs or atmospheric deposition) are larger than in the eastern Mediterranean, but the remineralization of organic matter settling from the surface layer becomes a major contributor there (Béthoux et al., 1998). It is worthwhile noting that the LIW enrichment in the Tyrrhenian Sea is comparable to that which occurs in the Provençal Basin, as documented by the cruise PEACETIME (Fig. 1). This observation has raised our interest in the contribution of alternative processes that could explain such regional modifications in nutrient stocks.
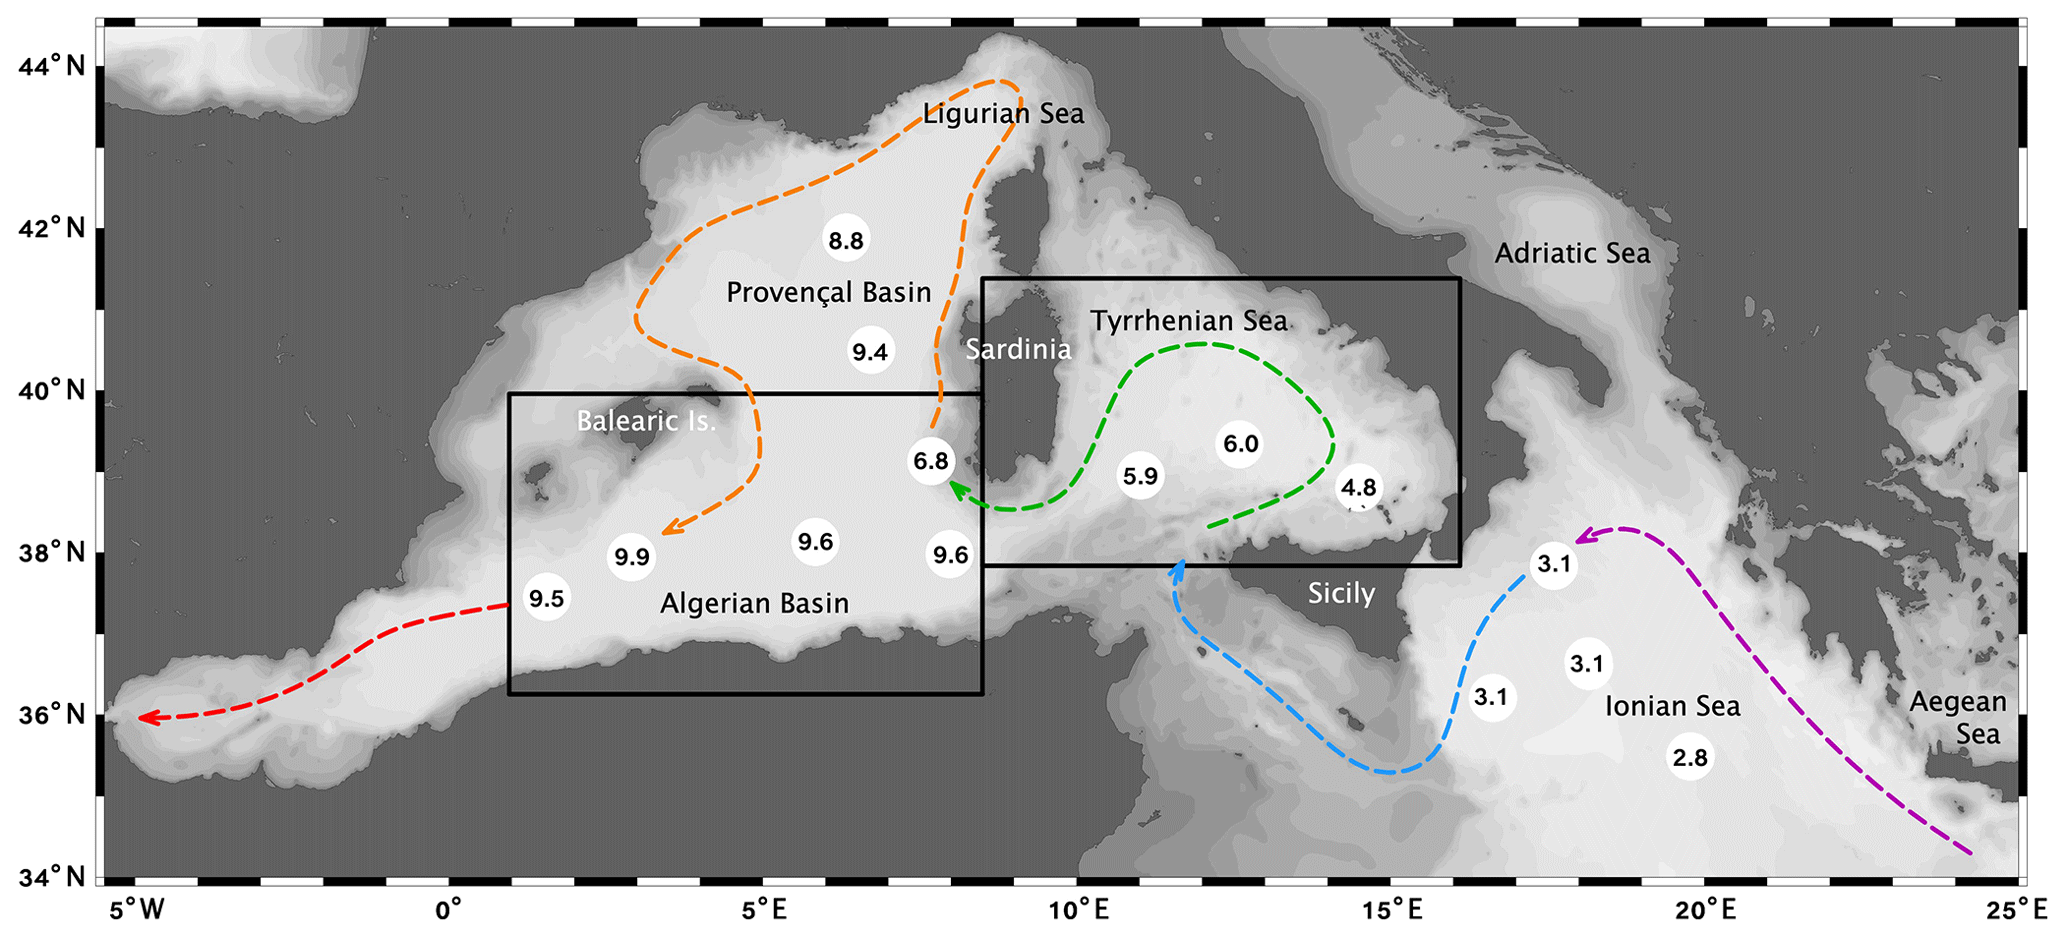
Figure 1Pathway of LIW in the western Mediterranean (dashed line), crossing the two geographical areas under study (black boxes). Numbers in white circles correspond to the nitrate concentrations (µmol kg−1) in LIW (at the salinity maximum) measured during the cruise PEACETIME.
Although the overall distribution of nutrients is driven by large-scale circulation, internal processes acting on the vertical scale modify the layout of inorganic matter. This is the case of diapycnal diffusion, which can be particularly efficient when it is enhanced by vertical mixing processes due to salt fingering (Hamilton et al., 1989; Fernandez-Castro et al., 2015). Under appropriate conditions reviewed by Schmitt (1994), salt fingering tends to organize the water column into series of mixed layers separated by sharp temperature and salinity gradients, ultimately leading to the formation of thermohaline staircases. Since this natural phenomenon was elucidated (Stern, 1960; Stern and Turner, 1969), the western Mediterranean Sea has become one of the world's focus points for the in situ characterization of the resulting step-layer structures. Molcard and Tait (1977) reported the presence of persistent staircases in the central Tyrrhenian Sea, composed of 10 homogeneous layers between 600 and 1500 m, with constant seawater properties over 3 years of observation. Later, Zodiatis and Gasparini (1996) described the areal extent of the structure, covering large distances from the central area and progressively weakening and disappearing near the coasts. Krahmann (1997) reported the first synoptic observations of thermohaline staircases in the Algerian Basin, confirmed by Bryden et al. (2014) from biannual surveys across this region. More recently, Buffett et al. (2017) revealed their remarkable spatial continuity from very high resolution synoptic observations.
Staircases are thought to be sites of thermohaline changes among well-organized homogeneous layers, in which such singular structures are maintained over long terms. Changes can take the form of either intrusions of heat and salt spreading horizontally inside layers (McDougall, 1985; Merryfield, 2000) or slow temporal trends induced by the downward flux of heat and salt between layers (Schmitt, 1994; Radko and Smith, 2012). In order to untangle the two processes, an accurate measurement of thermohaline changes requires temporal continuity of layers, which is the most challenging aspect for observations. Indeed, because thermohaline staircases occur far from the coastal zones and develop at depth, data acquisition is often limited to high-resolution but short-term records (e.g., Buffett et al., 2017) or coarse temporal resolution but long-term records (e.g., Falco et al., 2016; Durante et al., 2019). Moreover, most of the existing studies have not considered the role of thermohaline staircases in nutrient distribution, because pertinent observations of biogeochemical parameters were hard to obtain in the water column at relevant temporal and spatial scales. Profiling floats provide, however, valuable data that can include biogeochemical parameters, allowing for the suitable exploration of the characteristic scales of these features (Biogeochemical-Argo Planning Group, 2016).
In the present study, we focus on the role played by diapycnal diffusion in the distribution of nutrients in the western Mediterranean Sea considering nutrient fluxes between DW, LIW and surface waters, given the regional characteristics of mixing processes. We use the dataset acquired during the cruise PEACETIME (Guieu et al., 2020), which carried out a large-scale survey of the western Mediterranean Sea in May–June 2017, although data of earlier cruises are also considered. Shipboard data are combined with observations collected by a unique array of Biogeochemical Argo floats deployed in the western Mediterranean Sea (D'Ortenzio et al., 2020). The aims of this study are (i) to provide a fine characterization of the staircases recorded by shipboard data, (ii) to infer their spatial extension and temporal persistence using profiling float observations, (iii) to confirm the occurrence of salt fingering, and (iv) to assess the contribution of this mixing process in the progressive nutrient enrichment of LIW.
2.1 CTD profiles
During the cruise PEACETIME in May–June 2017 (Guieu and Desboeufs, 2017; Guieu et al., 2020), pressure, in situ temperature and conductivity of seawater were measured using SBE911+ CTD from the surface to the bottom. This instrumental package provides continuous acquisitions at 24 scans per second. The depth of each scan is given as a pressure value (bar). Raw data are processed into quality-controlled profiles of salinity expressed in practical salinity units and of potential temperature referenced to the surface (0 dbar), at the vertical resolution of 1 dbar (about 1 m). For the sake of simplification in the present study, salinity corresponds to practical salinity (no dimension) and temperature corresponds to the derived parameter potential temperature (∘C). The accuracy of measurement of the CTD unit is about 1 dbar in pressure, 0.001 ∘C in temperature and 0.003 in salinity. The PEACETIME shipboard dataset is complemented with CTD profiles collected during three earlier cruises with the same instrumental package, MedSeA (Ziveri and Grelaud, 2015) in May 2013, SOMBA-GE (Mortier et al., 2014; Keraghel et al., 2020) in August 2014 and BioArgoMed (Taillandier et al., 2018) in May 2015.
Another CTD dataset has been collected by profiling floats, autonomous platforms that drift in the interior ocean and evenly surface for positioning and data transmission. The profiling floats considered in this study belonged to the Mediterranean Biogeochemical (BGC) Argo array (D'Ortenzio et al., 2020). The sampling strategy of this array is better suited for observations of thermohaline staircases than is the MedArgo array (Poulain et al., 2007) because the BGC-Argo profiles are deeper, 1000 dbar instead of 700 dbar, and remain longer within the deployment basin thanks to a parking depth of 1000 dbar, instead of 350 dbar for the MedArgo array. Furthermore, BGC-Argo floats have higher vertical resolution between 250 and 1000 dbar, 10 dbar instead of 25 dbar for MedArgo array. These floats are equipped with SBE-41CP-pumped CTDs, sensors of high stability adapted from mooring applications that provide continuous acquisition at 0.5 Hz with an instrumental precision of 0.01 for salinity, 0.002 ∘C for temperature and 2.4 dbar for pressure (Wong et al., 2019). CTD profiles are collected during ascent from the parking depth to the surface, lasting about 3 h, with a nominal vertical speed of 0.1 m s−1. In the layer between 250 and 1000 dbar, each record is an average of temperature and salinity in 10 dbar bins (about 200 scans), which reduces the noise of raw acquisitions.
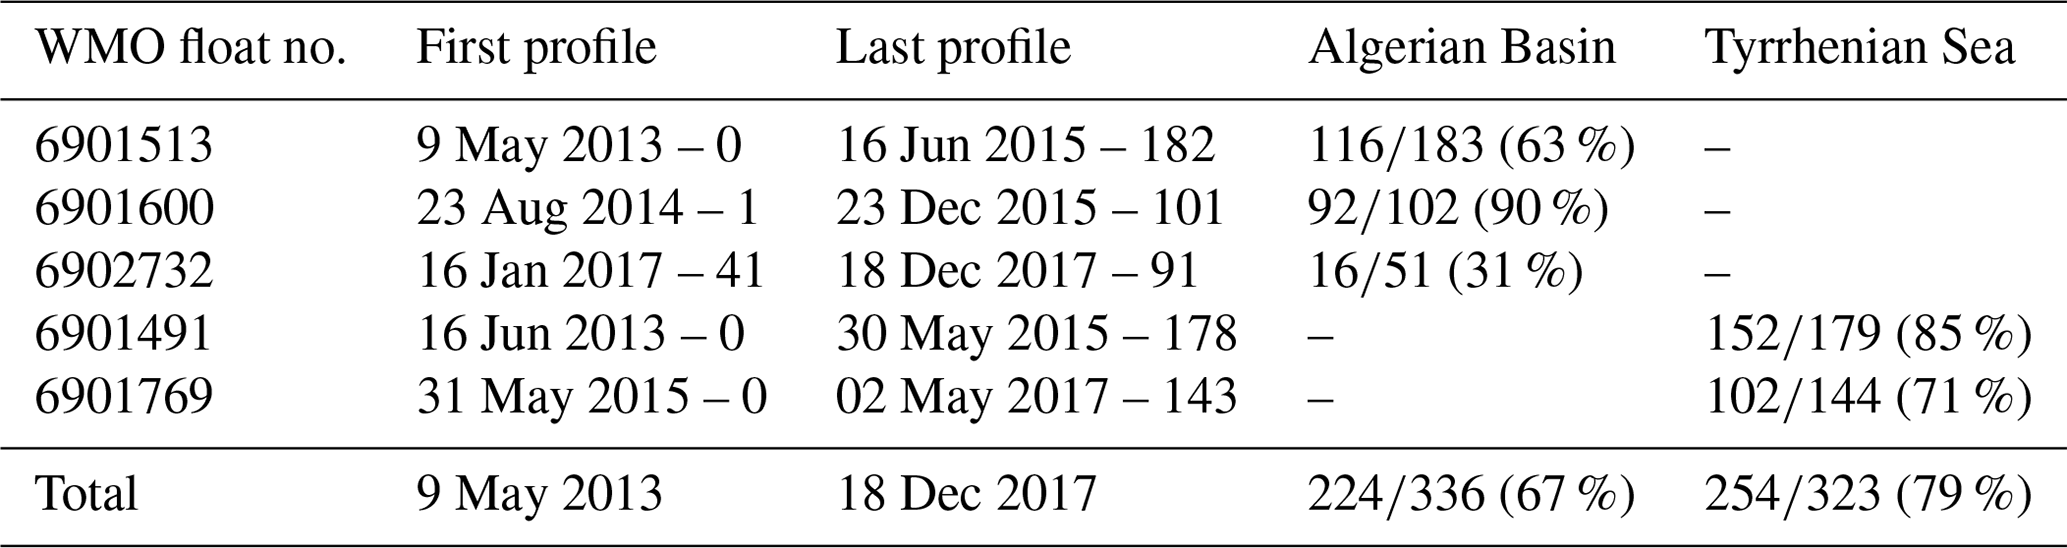
The selected BGC-Argo profiles were collected in two regions: (38–42∘ N, 8–16∘ E) in the Tyrrhenian Sea and 36–40∘ N, 2–9∘ E in the Algerian Basin (Fig. 1). The resulting time series of CTD profiles covered 4 years between May 2013 and May 2017 (date of the cruise PEACETIME) in the first region; it lasted 4.5 years between May 2013 and December 2017 in the second region (Table 1). The time series have a nominal temporal resolution of 7 d that can increase up to 1 d. In the Tyrrhenian Sea, 323 CTD profiles were collected by two float deployments. The first float 6901491 was deployed in June 2013 during the cruise VENUS2 and was recovered while still active 2 years later in the southwest sector of the basin during the cruise BioArgoMed. The second float 6901769 was deployed immediately (same time and location) following the recovery of float 6901491; it drifted across the Sardinian Channel for 2 years afterwards and was lost in January 2018. In the Algerian Basin, 336 profiles were collected by three consecutive float deployments. The first float 6901513 was deployed in May 2013 during the cruise MedSeA, leaving the Algerian Basin more than 2 years later, and was recovered in June 2016 in the Provençal Basin during the cruise MOOSE-GE (Testor et al., 2010). The second float 6902732 was refitted following its previous deployment in the Tyrrhenian Sea and deployed at the date and location of the float 6901513 recovery; it entered the Algerian Basin offshore Minorca in January 2017 and left the basin 1 year later. The third float 6901600 was deployed during the cruise SOMBA-GE in August 2014 and was lost in the western part of the basin after more than 1 year of operation.
Table 1Selection of CTD profiles collected by five floats in the Algerian Basin and in the Tyrrhenian Sea. Each deployment is labeled using the World Meteorological Organization (WMO) float number. Left columns: date and cycle number of the first and the last profiles of this selection. Right columns: number of profiles with staircase detection/total number of profiles (fraction of profiles with staircase detection).
Overall, this study encompasses a dataset of about 700 profiles, acquired by BGC-Argo floats at a 10 dbar vertical resolution and the shipboard CTD package at a 1 dbar vertical resolution, with a metrological harmonization at the precision of the BGC-Argo standards (0.002 ∘C in temperature and 0.01 in salinity). The systematic metrological verification of BGC-Argo CTD sensors, comparing their first profile at deployment with the concomitant shipboard CTD profile, confirmed the absence of an initial calibration shift for the five floats. This metrological verification has also been carried out for the recovered floats (6901513, 6901491), which confirmed the absence of temporal drift larger than the nominal uncertainties in CTD measurements.
2.2 Nitrate concentrations
During the cruise PEACETIME, dissolved inorganic nitrate was determined in seawater samples collected by Niskin bottles at discrete depth levels in conjunction with the shipboard CTD profiles. Two distinct sets were processed (Guieu et al., 2020): one analyzed within the surface mixed layer at nanomolar concentration levels and one analyzed below at submicromolar concentration levels, the latter of which is considered in the present study. For this latter set, concentrations were measured on board by the standard automated colorimetric method (Aminot and Kerouel, 2007), using a SEAL Analytical continuous flow analyzer, AutoAnalyzer 3 (AA3). The profiles have a vertical resolution of 10 m in the surface layer (0–100 dbar), 50 m in the intermediate layer (100–500 dbar) and 500 m in the deep layer (below 500 dbar depth down to the sea bottom). Note that the sampling of the surface layer was performed more than once during two long stations in the western Algerian Basin (10 times) and in the central Tyrrhenian Sea (4 times). For the latter station only, the vertical resolution was increased to 100 m in the upper part of the deep layer (500–1000 dbar).
Another dataset of nitrate concentrations has been collected by the BGC-Argo float 6901769 (Table 1). The float was equipped with a Satlantic SUNA (Submersible Ultraviolet Nitrate Analyzer) sensor, a miniaturized ultraviolet spectrophotometer with which nitrate concentrations can be retrieved from absorbance spectra (Johnson and Coletti, 2002). To do so, a version of the algorithm developed by Sakamoto et al. (2009) has been adapted to the specificity of the Mediterranean Sea (Pasqueron de Fomervault et al., 2015). The SUNA sensor underwent offset and gain calibration corrected by reference measurements at deployment (detailed in Taillandier et al., 2018); its temporal drift was adjusted to a climatological value at 1000 dbar. Overall, a collection of 144 profiles was acquired in the Tyrrhenian Sea, every 5 to 7 d during a period of 2 years, with a vertical nominal resolution of 10 m in the upper layer (0–250 dbar) and 25 m in the lower layer (250–1000 dbar).
2.3 Thermohaline staircases
For the sake of clarity, the terminology used in the text is illustrated in Fig. 2. Thermohaline staircases are observed where large-scale temperature and salinity fields decrease with depth in a manner that favors the mixing process of salt fingering (Schmitt, 1994). This natural process has been predicted by theoretical models and reproduced by laboratory experiments and numerical simulations (Schmitt, 1994; Stern and Turner, 1969; Merryfield, 2000; Radko et al., 2014). Salt fingers take the form of tiny cells (some centimeters wide, some tens of centimeters tall) across which the rising and sinking fluids mostly exchange heat, as thermal molecular diffusivity is larger than that of salt by 2 orders of magnitude. In the vertical extension of the cells, sinking (conversely rising) fluids find themselves saltier (conversely fresher) than, but with the same temperature as, waters at the same depth. The resulting buoyancy instability drives convection in the adjoining mixed layers. When salt fingering is active, the whole transition zone between the warm and salty waters and the cold and fresh waters will be reorganized into mixed layers separated by thin stratified interfaces, until an equilibrium of well-developed staircases is reached (Radko, 2005). The relative stability of this arrangement, whether across a single interface (local) or considering the whole transition zone (bulk), can be expressed in terms of the density ratio:
which relates the stabilizing vertical temperature (θ) gradient and the destabilizing vertical salinity (S) gradient. α and β are the thermal expansion and haline contraction coefficients of seawater referenced to the same pressure as potential temperature:
where ρ is the potential density derived from pressure, temperature and salinity using the equation of the state of seawater. Based on field observations, low values of the density ratio (between 1 and 1.7) are conditional for staircase formation (Schmitt et al., 1987). In the Tyrrhenian Sea and the Algerian Basin, the probability distribution of local density ratios fits the low conditional values (1–1.7) for staircase formation under the LIW core (Onken and Brembilla, 2003).
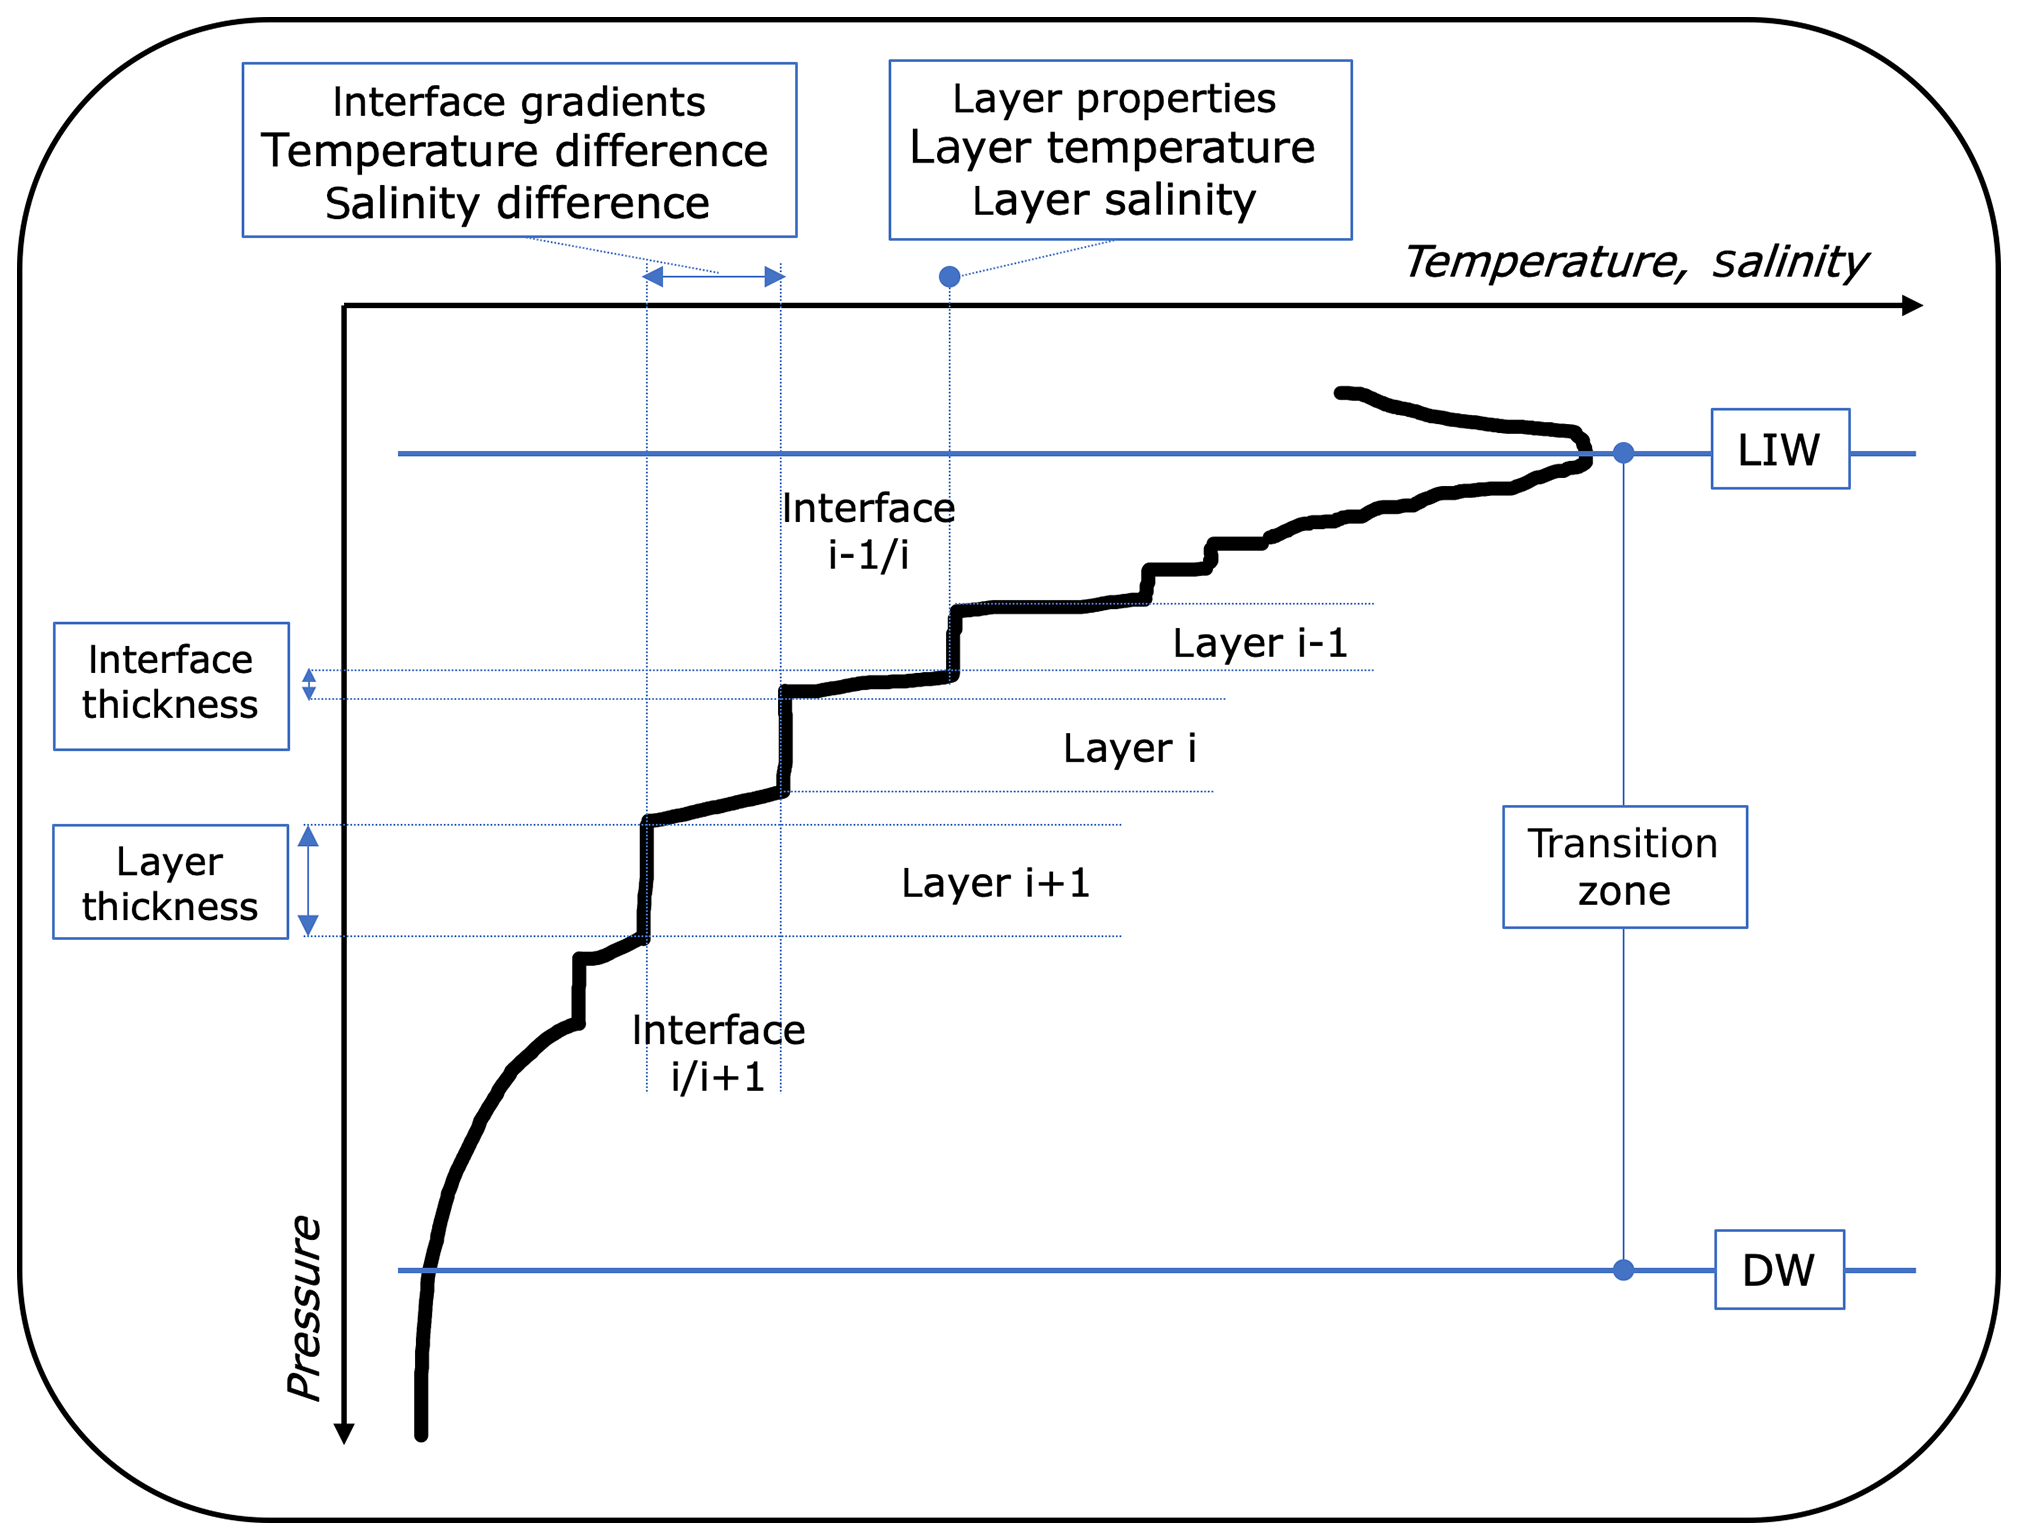
Figure 2Terminology used to characterize the vertical structure of typical thermohaline staircases in the study area. The layer number (i) and the interface number (i/i+1) increase downward.
The detection of thermohaline staircases in the CTD dataset (Sect. 2.1) is carried out by extracting the depth range of the transition zone for each profile from the salinity maximum (LIW) and the salinity minimum (DW) underneath 250 dbar. The bulk vertical gradients of temperature and salinity are derived from water properties at the top and at the bottom of the transition zone. The resulting bulk density ratio (Rρ; Eq. 1) is checked to see if it is in the range of 1–1.7. Following that, the distribution of pairs (salinity, temperature) that belong to the transition zone is evaluated by a rapid hierarchical classification algorithm in order to detect concentration points representative of mixed layers (Jambu, 1981). A concentration point is identified as a set of successive scans in which temperature does not vary by 0.005 ∘C and salinity does not vary by 0.005. In addition, this set of scans must be composed of at least 3 scans for BGC-Argo profiles and 15 scans for shipboard profiles, limiting the detection to layers thicker than 30 and 15 m, respectively. The scans belonging to the concentration points are superimposed onto the full profile, and the vertical alternation of interfaces and layers is checked by a visual inspection. After this final step, the profile is reported as an observation of staircases.
Several diagnostics are run on the set of profiles with staircase detection. The fine-structure characterization includes layer properties (i.e., seawater temperature and salinity at every validated concentration point), interlayer differences in temperature and salinity, associated interlayer density ratios, layer thickness (i.e., number of concentration points times vertical resolution of profiles), and interface thickness (i.e., depth interval between two adjacent layers). The occurrence of staircases is estimated among the BGC-Argo dataset by the percent of profiles with at least one concentration point per profile (reported in Table 1). The continuity of layers is displayed among the shipboard and BGC-Argo datasets by the persistence of some layer properties. Layers are conventionally numbered using the fine-structure characteristics of the profiles collected during the cruise PEACETIME. Changes in temperature (Δθi) and salinity (ΔSi) within every indexed layer (i) are examined among the BGC-Argo dataset in terms of lateral density ratio:
is determined by least-squares fits of layer distributions in a temperature–salinity diagram normalized by β∕α.
2.4 Vertical fluxes of nitrate
The vertical transfer of nitrate is parameterized as a diffusive flux and written as the product of the vertical diffusivity of salts (K) with the vertical gradient in nitrate concentration (C):
Fluxes of nitrate are mostly driven by turbulent diffusion, but in the presence of thermohaline staircases, the diffusivities of nitrate are enhanced by salt fingering in the same manner as those of salinity (Hamilton et al., 1989). Of consequence for the present study, the two mixing processes are considered separately, turbulent diffusion above LIW and salt fingering below LIW, which implies the utilization of alternative formulations for vertical diffusivities.
Above LIW across the nitracline, K is equal to the vertical eddy diffusivity of density, which can be expressed by the buoyancy frequency (N),
and the turbulent kinetic energy dissipation rate (ε), using the Osborn relationship (Osborn, 1980), as
where g is the gravitational constant, Γ is the mixing efficiency and ρo the reference density of seawater. A constant mixing efficiency Γ= 0.2 is applied under the assumption that the buoyancy Reynolds number,
with kinematic viscosity m2 s−1, remains in the range 8.5–400 (Bouffard and Boegman, 2013; Ferron et al., 2017). Substituting Eq. (6) in Eq. (4), the vertical flux of nitrate is expressed across isopycnals as the product of ε and the diapycnal gradient of nitrate concentration:
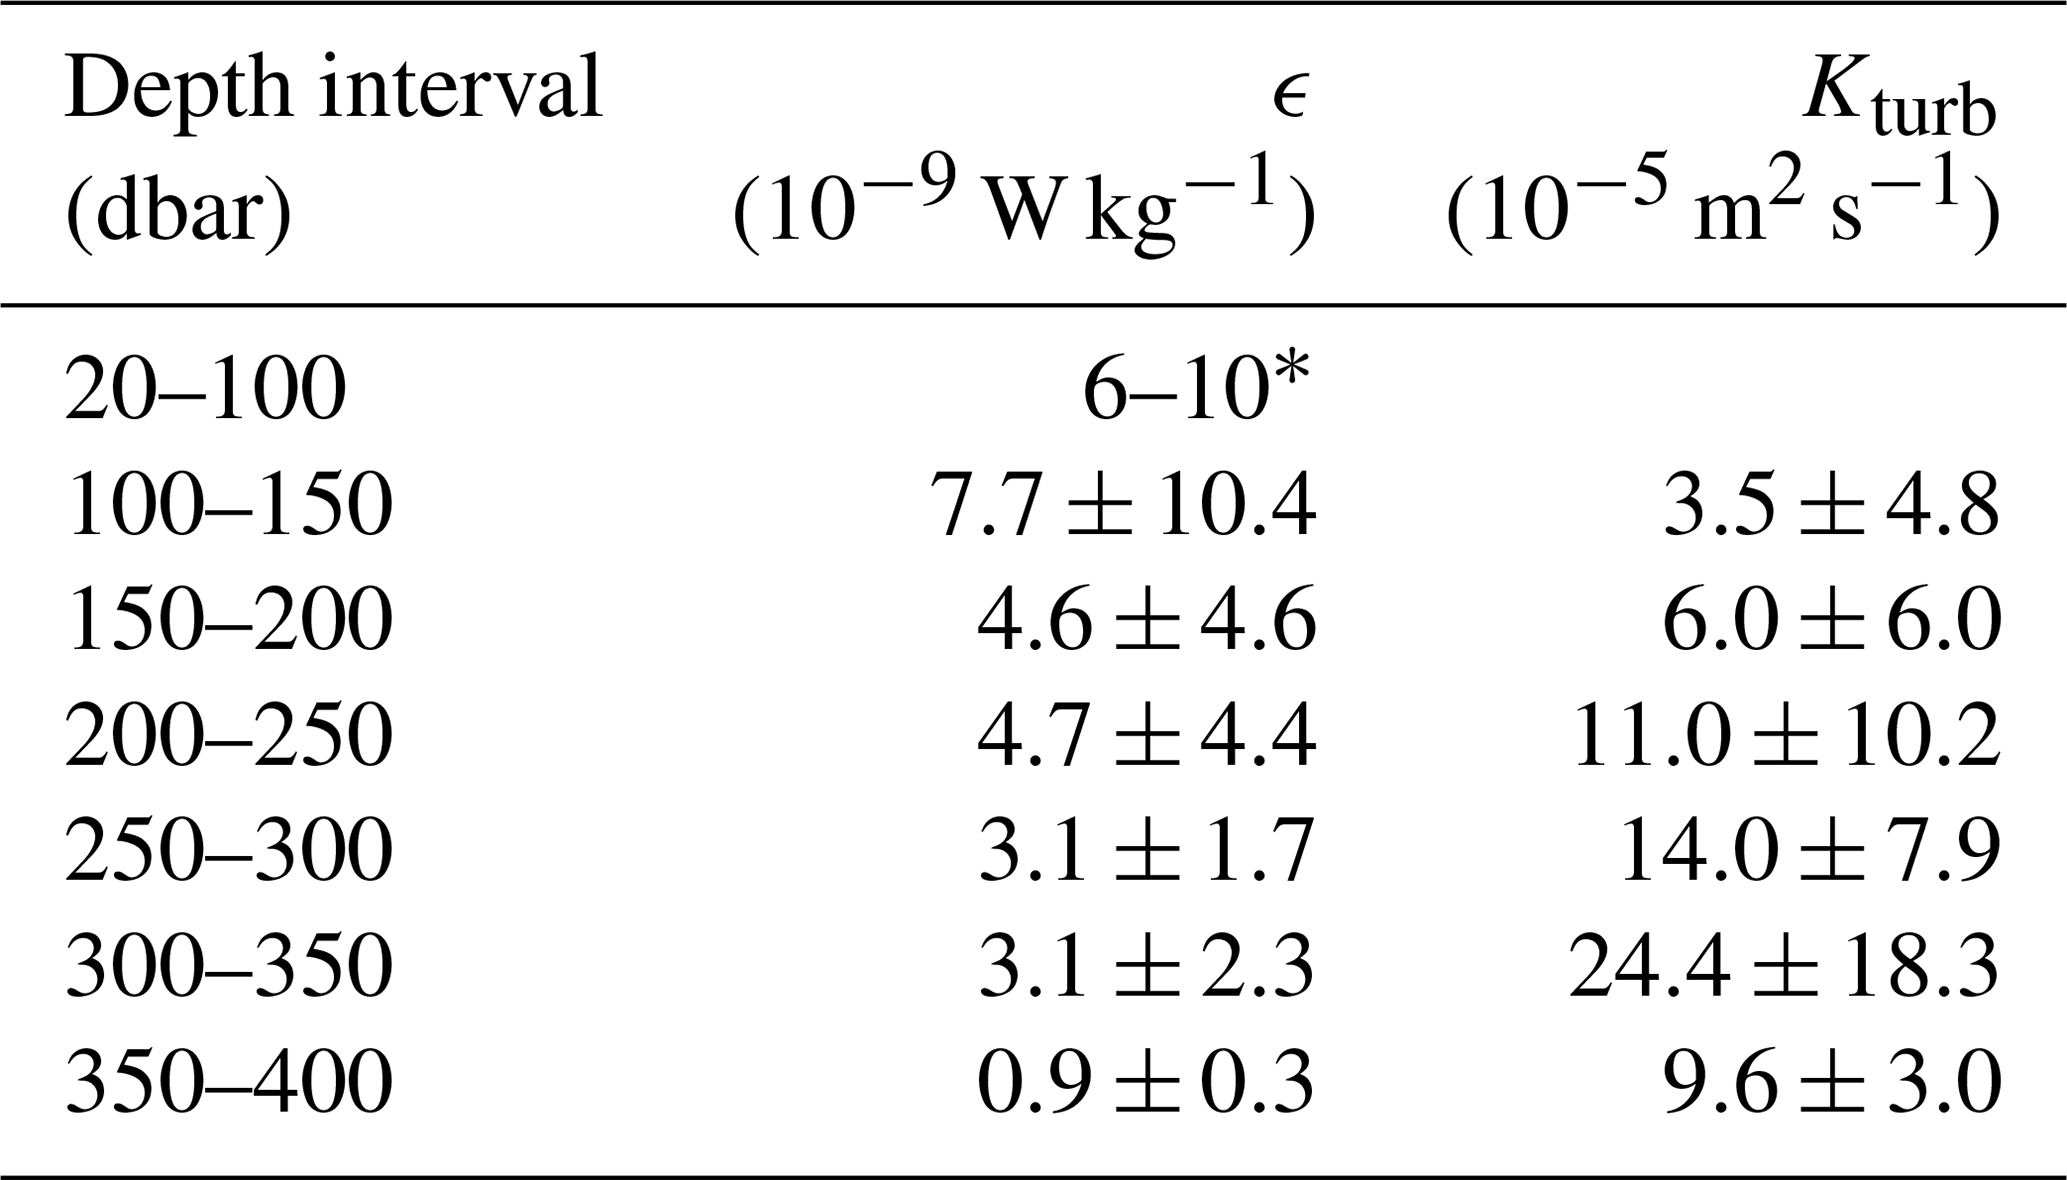
This formulation is preferred to the one of Eq. (4) because the temporal consistency in the density–nitrate relationship is stronger than in the depth–nitrate relationship (Omand and Mahadevan, 2015). There were no direct measurements of dissipation rates during the cruise PEACETIME, so we rely on estimates from a Thorpe-scale-based parameterization to infer ε values from vertical overturns of density (Dillon, 1982). Following Park et al. (2014), the full-resolution CTD records collected in the Tyrrhenian Sea and the Algerian Basin (13 casts) have been reprocessed in order to identify density overturns in the depth interval above LIW, compute the associated Thorpe scales and reconstruct ε profiles. A lookup table composed of ε values averaged over the 13 profiles by 50 dbar vertical intervals is reported in Table 2. The values inside the surface stratified layer (0–100 dbar) were too inconsistent to be considered, but the next bin (100–150 dbar) was kept even though its average value still contains important uncertainties; in the other bins, ε values decrease with depth by 1 order of magnitude with standard deviations comparable to the average. Combined with a mean N profile, there is an increasing turbulent diffusivity Kturb down to the LIW depths where its maximum value is reached. For the surface layer (20–100 dbar), the lookup table is complemented with ε values in the range of [6, 10] W kg−1, as reported by Cuypers et al. (2012) in the same geographical area. The amplitudes used in the lookup table are in agreement with microstructure observations collected over several cruises from 2012 to 2014 in the same locations (Ferron et al., 2017). These direct measurements documented sharply decreasing ε profiles from values of about W kg−1 at 100 m down to W kg−1 at 300 dbar. It has to be noted that the assumption of constant mixing efficiency (Γ=0.2) is checked with Reb values of about 90 at 100 dbar and about 80 at 300 dbar.
Table 2Lookup table for turbulent kinetic energy dissipation rates and vertical eddy diffusivity derived from a Thorpe-scale-based parameterization and applied to the full-resolution CTD profiles of the cruise PEACETIME collected in the Algerian Basin and in the central Tyrrhenian Sea. The methodological approach described by Park et al. (2014) has been strictly followed, by averaging in 50 m bins over the 13 profiles represented in Figs. 3 and 7. For surface values (*), the range of estimation proposed by Cuypers et al. (2012) is used.
Regarding the transition zone below LIW, several formulations of diffusivities across the interfaces of thermohaline staircases have been proposed in the literature, considering different Rρ-dependent parameterizations inferred by laboratory or numerical experimentations. In the present study, the salt-fingering diffusivity of nitrates Ksf is parameterized considering the fine characteristics of the step-layer structures observed during the cruise PEACETIME, following three different formulations. Although they have been extensively reviewed and compared with each other, the motivation here is to provide uncertainties in Ksf values. First, the formulation of salt-fingering buoyancy flux proposed by Schmitt (1981) can be expressed in terms of diffusivity using Eq. (4) as
where m2 s−1 is the molecular diffusivity of heat, δS the maximum value of interface salinity differences, () the mean vertical salinity gradient across the transition layer and Rρ the bulk density ratio given by Eq. (1). The second formulation was proposed by Radko and Smith (2012):
The third formulation comes from the model of K-profile parameterized diffusivities (Large et al., 1994)
3.1 Observation of staircases in the Tyrrhenian Sea
During the cruise PEACETIME, repeated casts were carried out at a station located in the central Tyrrhenian Sea, a well-characterized deep area where intense thermohaline staircases are confined (Molcard and Tait, 1977; Zodiatis and Gasparini, 1996; Falco et al., 2016; Durante et al., 2019). The profiles from the surface to the bottom were collected every day during 4 d, showing well-ordered thermohaline staircases (Fig. 3). Observations at this short timescale show strong reproducibility of the vertical structure. LIW properties remain stable at 14.34 ∘C and 38.82, although with a slight uplift of the salinity maximum (470 dbar at cast A, 400 dbar at cast D). DW properties remain equally stable at 12.98 ∘C and 38.50 below 2500 dbar. The bulk temperature and salinity gradients are similar for all the casts, i.e. 0.00065∘C m−1 and 0.00015 m−1, respectively. The bulk density ratio Rρ is equal to 1.32, which is lower than 1.7, the upper threshold for the development of thermohaline staircases (Sect. 2.3). The transition zone is occupied by mixed layers of homogeneous properties (variance close to the instrumental precision) and of thickness ranging from a few meters to some hundreds of meters at the metric resolution of the profiles. Interface salinity gradients can be sharp or gradually smoothed by small transient layers that split and merge during the 4 d of observation. For example, between cast C and cast D (Fig. 3), the transient layers disappeared from the interface at 1250 dbar and appeared in the interface at 1700 dbar; meanwhile the layer in between was lifted by about 20 dbar.

Figure 3Sequence of daily salinity profiles observed in the central Tyrrhenian Sea during the cruise PEACETIME over the whole water column. The salinity scale is correct for profile A, and each subsequent profile is offset by 0.04. The layer numbering in Table 3 is indicated by grey boxes at average layer depths.
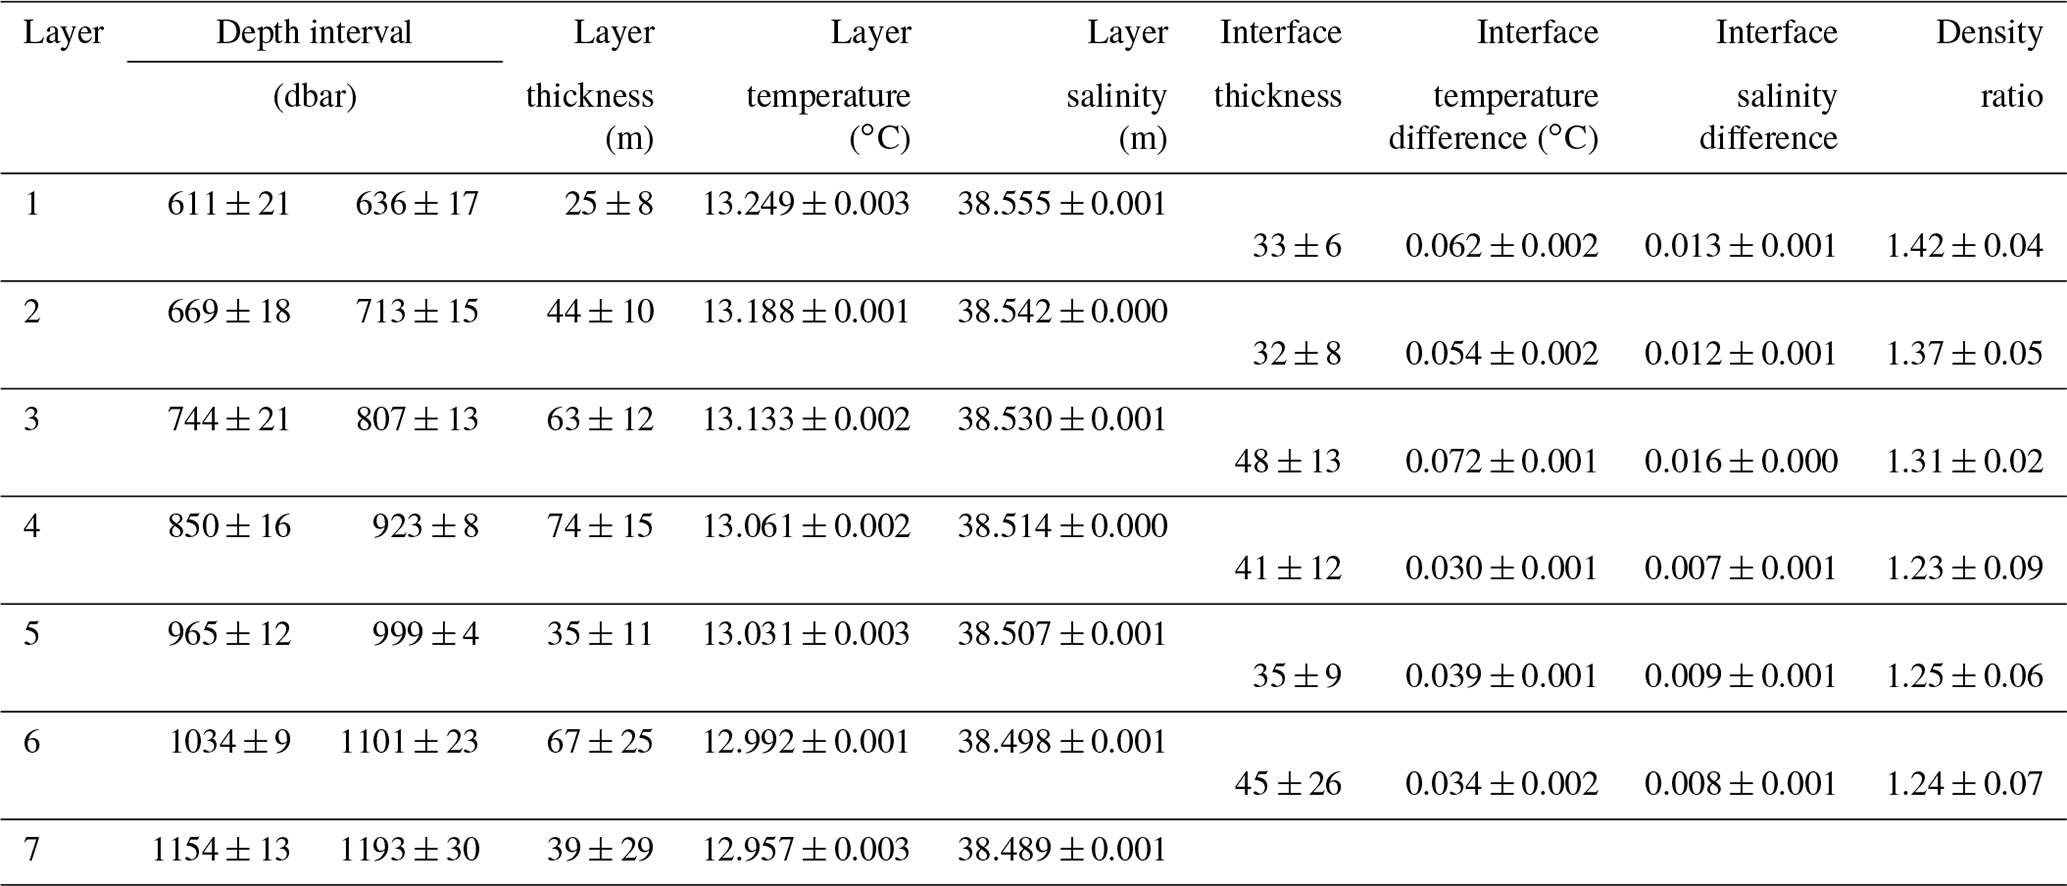
As reported in Table 3, the layer and interface thickness could fluctuate by up to 17 m during the 4 d of observation (a sign of active convection), while the temperature–salinity characteristics remained stable. The amplitude of the interface temperature–salinity differences increased with depth until reaching 956 dbar (interface 4/5) and then decreased progressively. The three main layers (5, 6, 7) were located between 983 and 1871 dbar, with thicknesses ranging between 184 and 332 m. They were associated with large interface temperature–salinity differences: 0.06–0.19 ∘C and 0.02–0.05.
Table 3Characteristics of the staircases in the Tyrrhenian Sea, extracted from the four casts carried out during the PEACETIME cruise (Fig. 3). The selected layers are thicker than 15 m. The layer numbering increases with depth. Parameters are presented as the average value and standard deviation over the four casts A–D.

The spatiotemporal extensions of observations can be inferred from two BGC-Argo deployments that preceded the cruise PEACETIME. This dataset provides continuous observations of the vertical structure in the upper 1000 dbar with a resolution of 1 to 7 d from June 2013 until May 2017 (Sect. 2.1, Table 1). Temperature and salinity in the depth range of 300 to 1000 dbar show three stripes with roughly constant properties (Fig. 4). The stripes correspond to a high density of scans indicating well-mixed layers, while lower densities of scans in between the stripes correspond to interfaces. The temperature and salinity values along these stripes are diagnosed by the detection method (Sect. 2.3) and analyzed together with the layer properties of the central station (Table 3). The quantification of layer and interface thicknesses can be inaccurate on BGC-Argo profiles because of the limited vertical resolution and the limitation of profiling depth (1000 dbar) that may truncate the lowest detected layer. Thus, only the temporal evolution of the layer properties (temperature, salinity) should be considered from the BGC-Argo dataset.
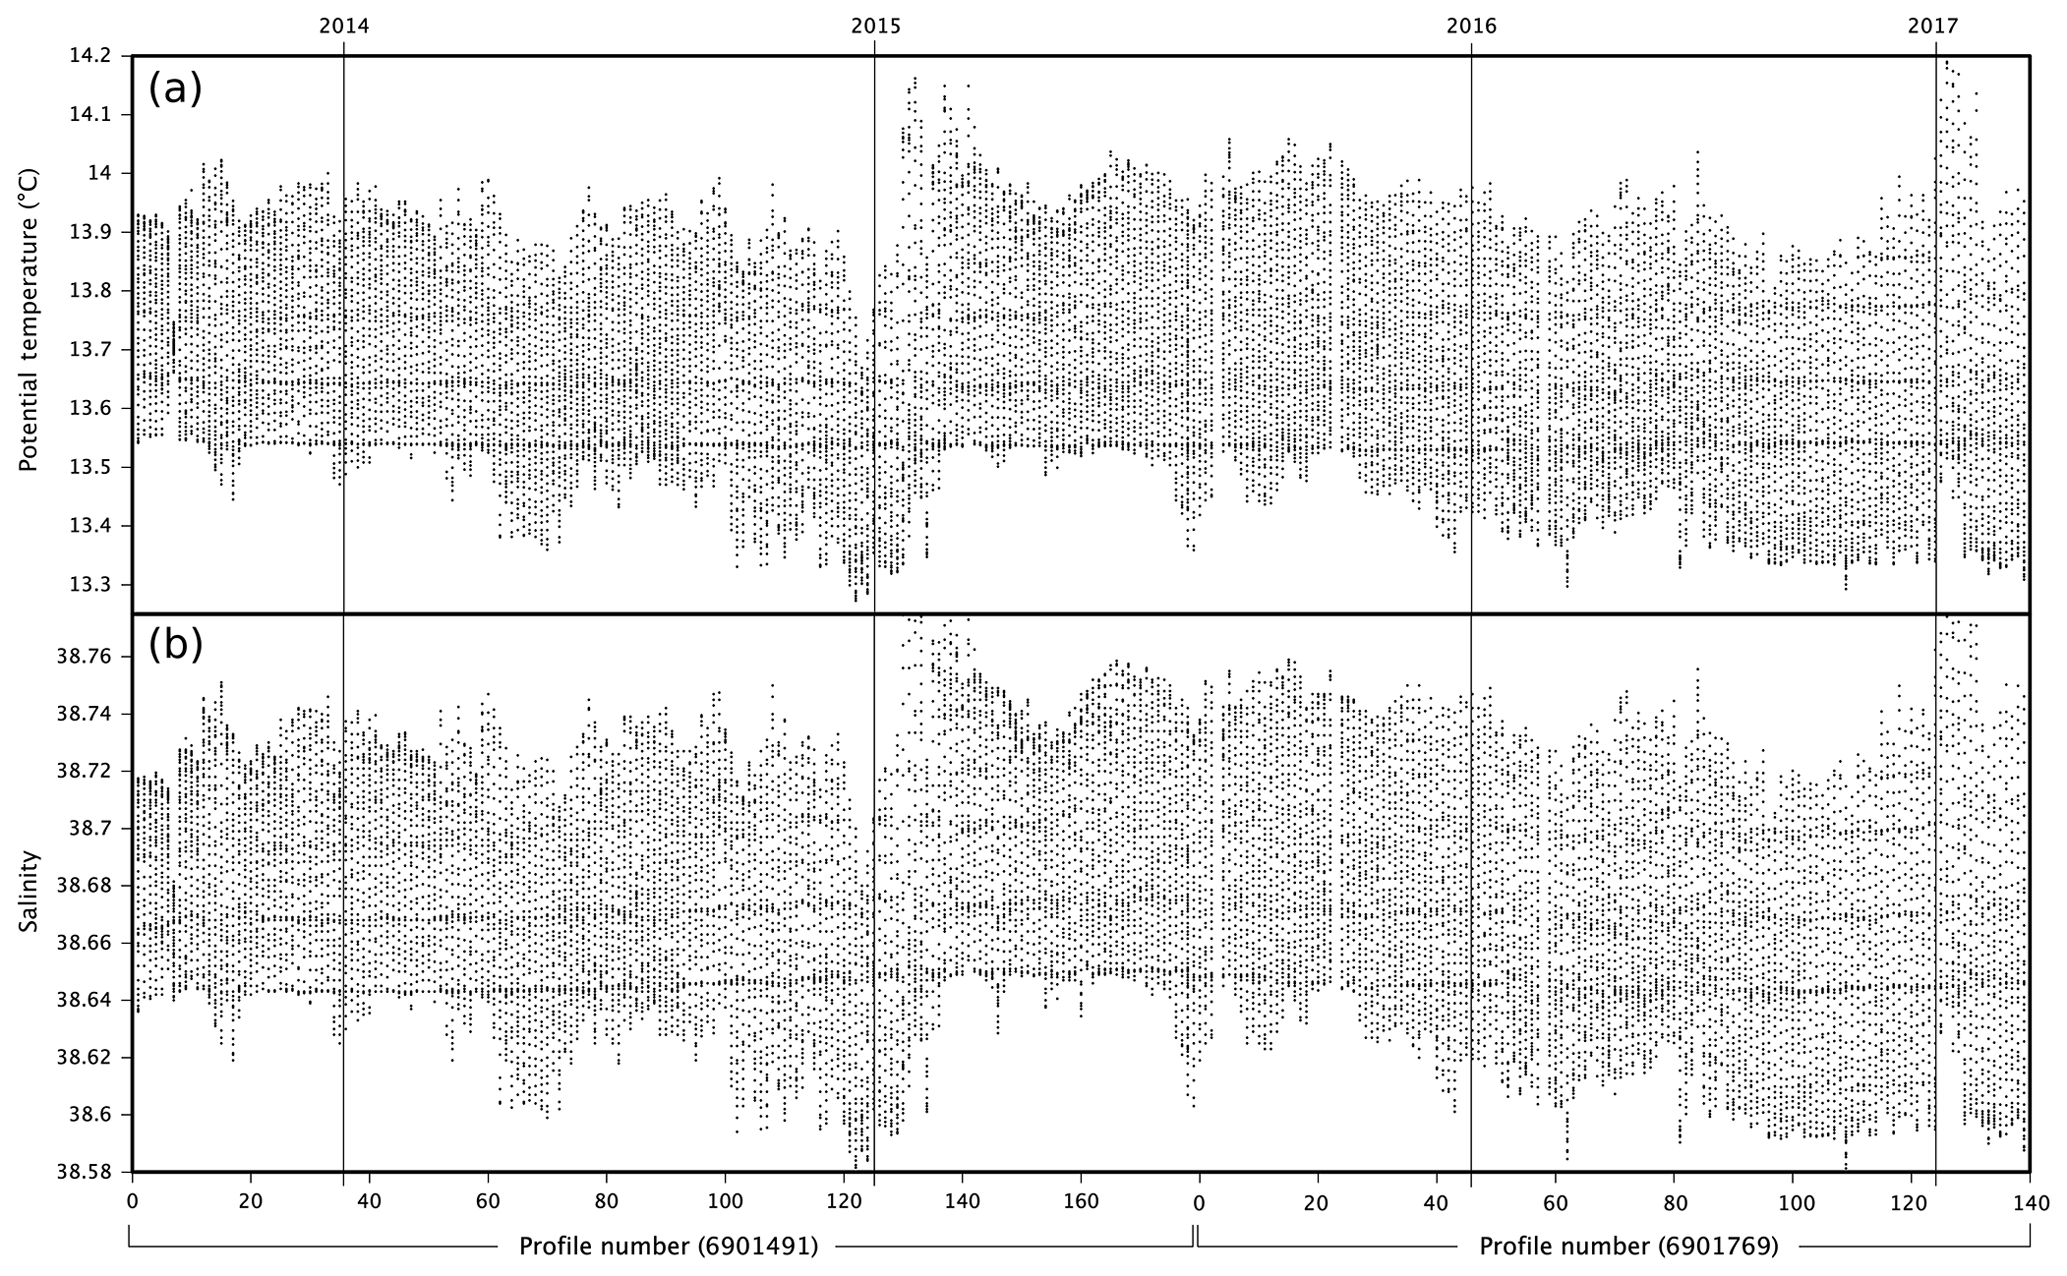
Figure 4Temperature (a) and salinity (b) recorded between 300 and 1000 dbar at a vertical resolution of 10 dbar, by the consecutive deployments of floats 6901491 and 6901769 in the Tyrrhenian Sea. On the x axis, the number of successive profiles for each float with a resolution of 1 to 7 d is indicated. The years of deployment are indicated by the vertical lines.
As shown in Fig. 4, thermohaline staircases were observed almost continuously during the 4-year period of BGC-Argo deployments. The proportion of staircase detection within this collection reaches 79 % (Table 1). This observation extends over the southwest sector of the Tyrrhenian Sea up to the Sardinian Channel (Fig. 5a), suggesting a unique structure spreading from the central area up to the southwest border. The obtained vertical structure is in agreement with the shipboard profiles collected at the station PEACETIME and at the float deployment locations 2 and 4 years before (Fig. 5b, upper plot). Two layers appear quasi-persistent with steady properties (Fig. 5b, lower plots). The first one at 13.65 ∘C and 38.67 corresponds to layer 3 of the station PEACETIME (Table 3); the second one at 13.55 ∘C and 38.65 corresponds to layer 4. The temperature and salinity gradients at interface 3/4 are of similar amplitude. In addition to the above-mentioned structure, layer 2 was detected twice for periods of about 1 year, layer 1 during a period of 6 months and layer 5 during a short period of 3 months. As a result, changes on the top of the transition zone can reduce the number of layers, when LIW are fresher and cooler (second half of 2015), or increase the number of layers, when LIW become warmer and saltier (second half of 2016). Changes in the average depth of a layer similarly modulate the number of layers, due to vertical shifts of the whole structure (Fig. 5b).
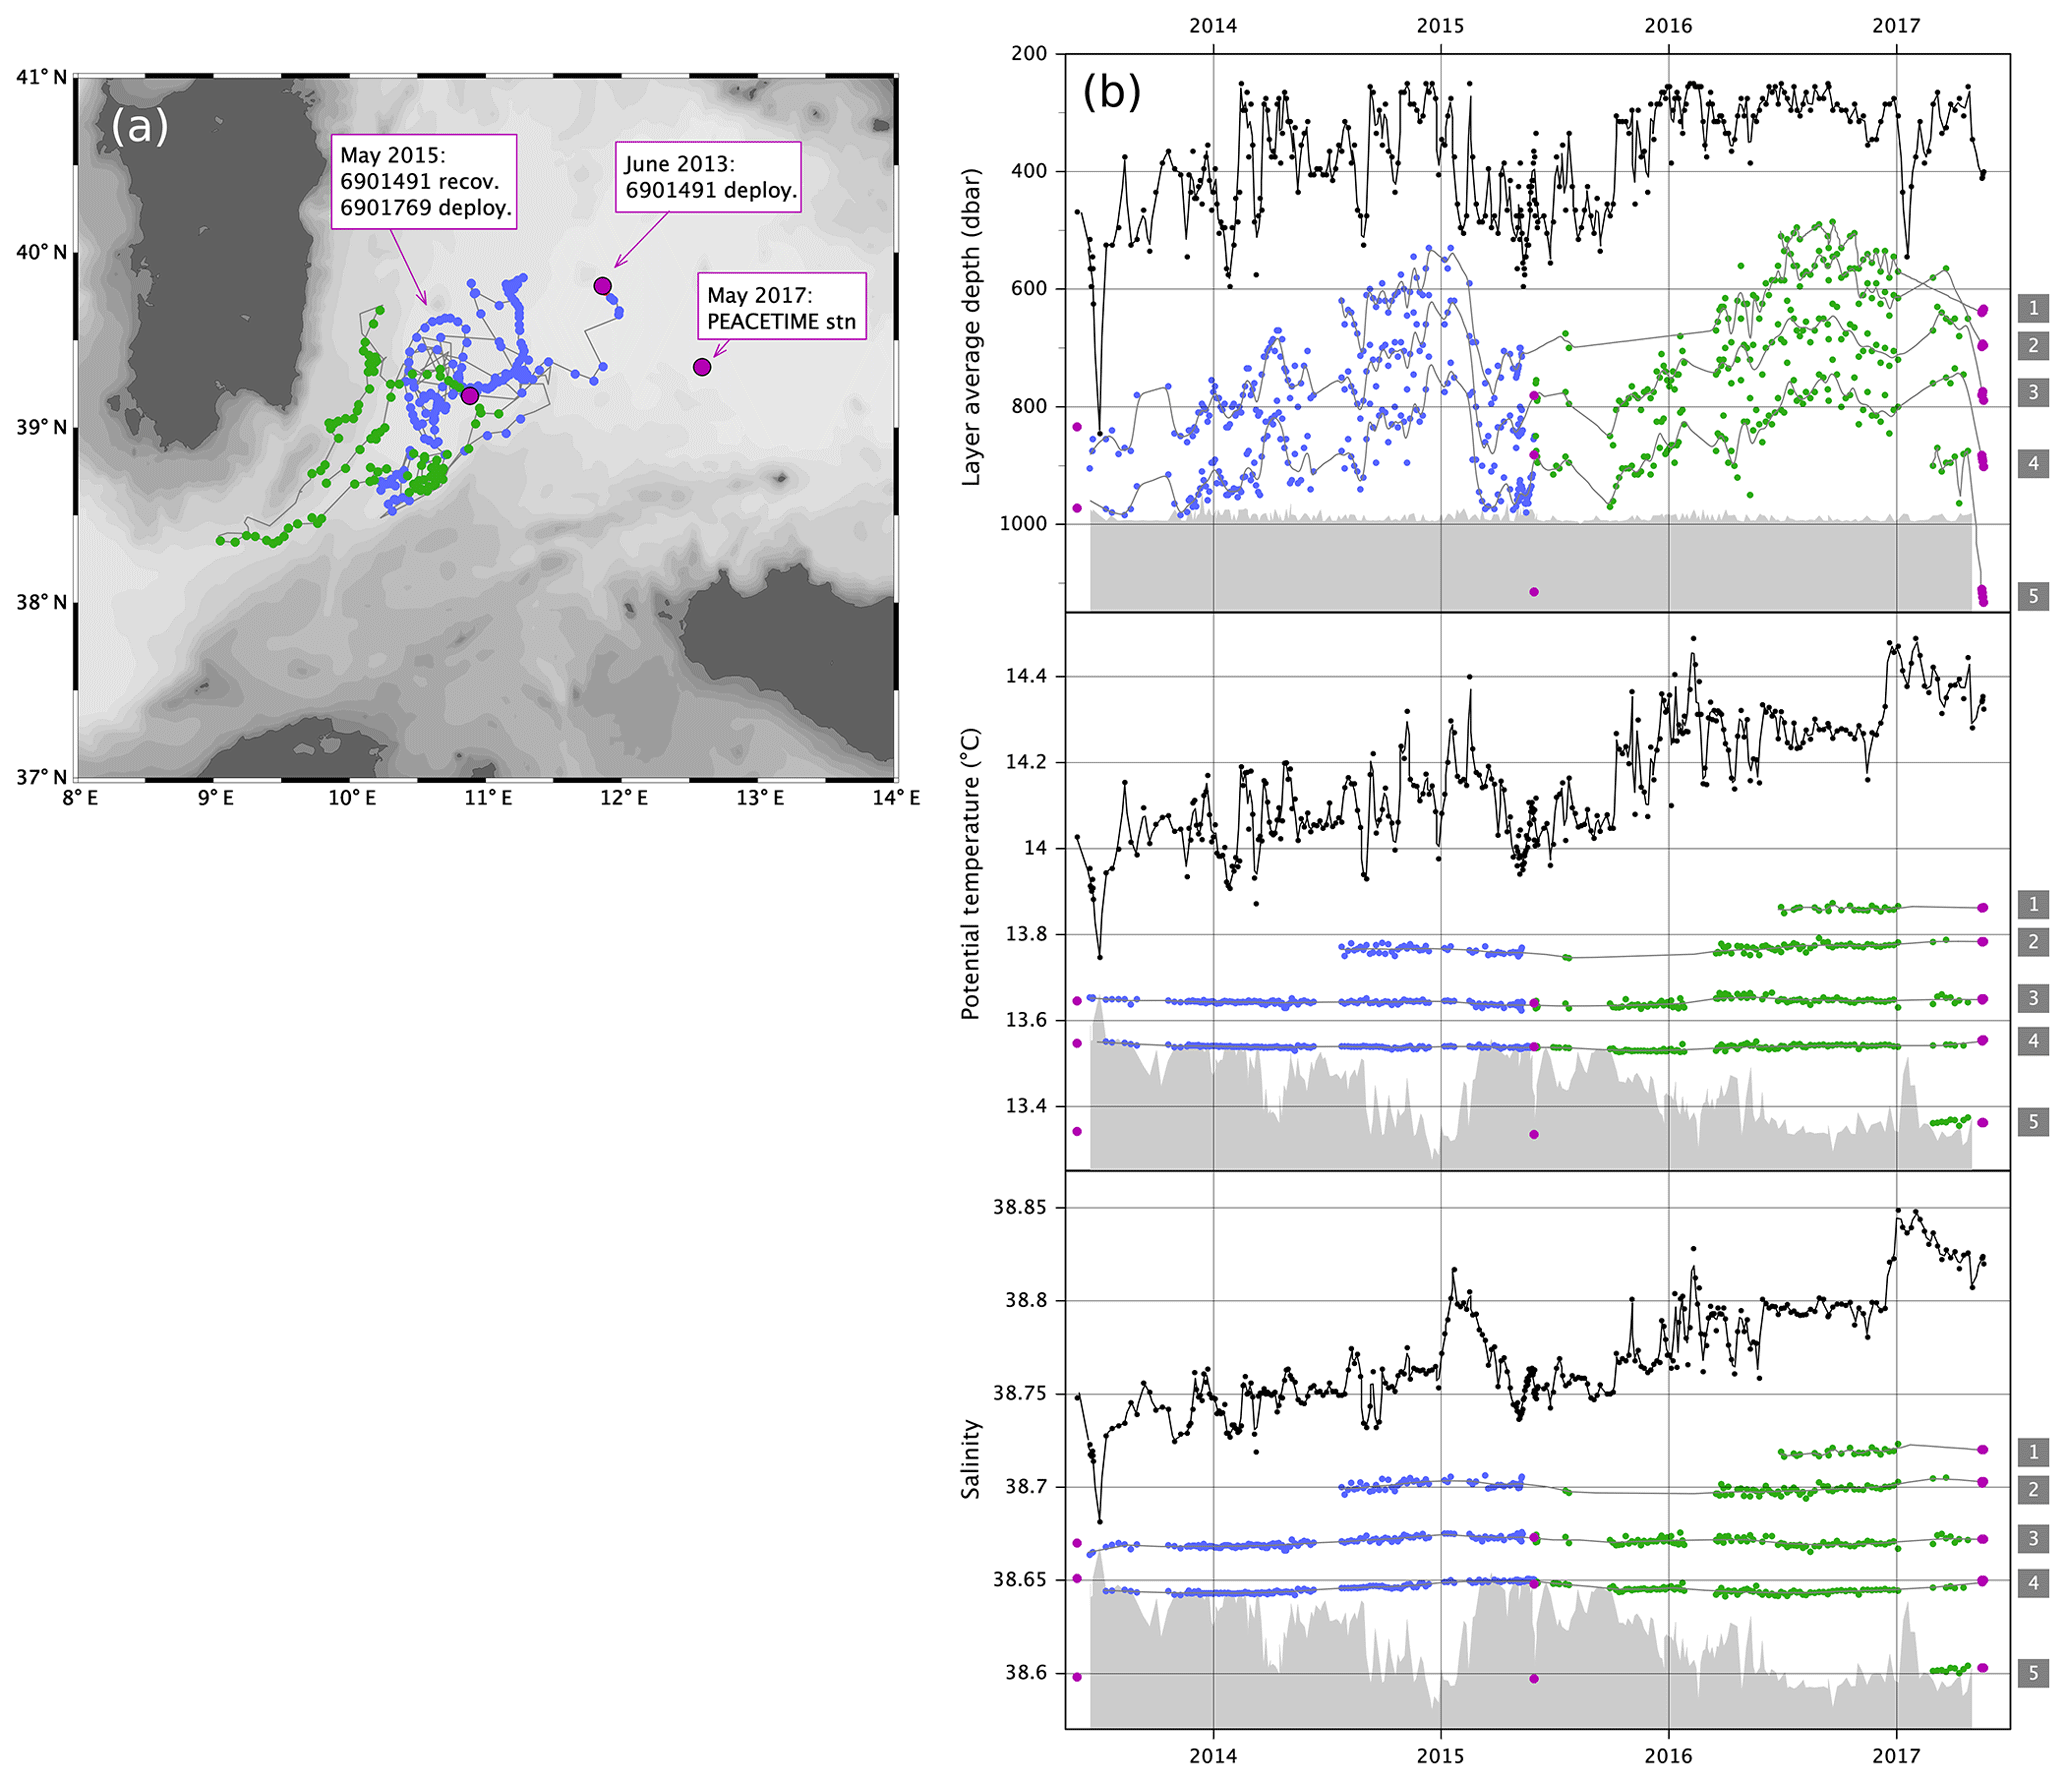
Figure 5(a) Location of staircase detected along the trajectory of the consecutive floats deployed in June 2013 and May 2015. (b) Time series of layer properties and depth (colored dots) of shipboard and float profiles with staircases. LIW properties and depth are indicated in black lines. Grey shadows indicate the depth ranges below 1000 dbar. The layer numbering of the station PEACETIME (Table 3) is indicated inside the grey boxes. In all panels, station locations and layer properties are indicated in purple for shipboard profiles, blue for float 6901491 and green for float 6901769.
3.2 Observation of staircases in the Algerian Basin
The CTD dataset in the Algerian Basin (Fig. 6) covers most of the abyssal plain where thermohaline staircases are able to develop (Krahmann, 1997; Bryden et al., 2014). It is composed of a zonal transect of coarse spatial resolution between 1 and 8∘ E and three BGC-Argo float deployments inside the central basin with an average speed of 4 km d−1 (with a maximum at 10 km d−1), twice as fast as the floats in the Tyrrhenian Sea. Such large drifts at 1000 dbar can be attributed to a vigorous basin-scale barotropic circulation, characterized by two permanent cyclonic gyres and delineated by closed f∕H contours (Testor et al., 2005). The area of staircase detection (67 % of the profiles; Table 1) seems to be shaped by the barotropic circulation leading to staircase formation primarily inside the so-called Algerian gyres – more precisely inside the box 37∘20' N–38∘ N, 4–6∘ E – whereas staircases were more sporadic everywhere else.

Figure 6Locations of the CTD profiles in the Algerian Basin. The large dots mark the positions where staircases were detected. Float 6901513 deployment is indicated in blue, 6901600 in green and 6902732 in red. Shipboard stations during float deployments and the cruise PEACETIME are indicated in purple. Thin black lines: contours f∕H normalized by fo at 37∘45′ N and Ho=2800 m.
During the PEACETIME cruise, four stations were carried out along the 38∘ N parallel with nine casts, including six daily casts repeated at one station (Fig. 7). Thermohaline staircases were observed at every station, in the transition zone from the LIW (300–500 dbar) down to the DW (1400 dbar). They exhibited well-ordered steps and layers in the middle of the transect (casts B–H), with saltier LIW in cast H, while the profiles at the edges show no readily apparent pattern. In the latter casts (A and I), temperature and salinity profiles within the layers are inverted, indicating lateral intrusions of heat and salt along isopycnals. At the station with repeated casts (B–G), the largest steps were gradually smoothed by small transient layers that split and merged during the first days of observation. The structure was eroded in the last days (casts F–G), probably due to the growing influence of a mesoscale eddy sampled at the westernmost station (deeper LIW in cast A) progressively moving eastwards at that time.
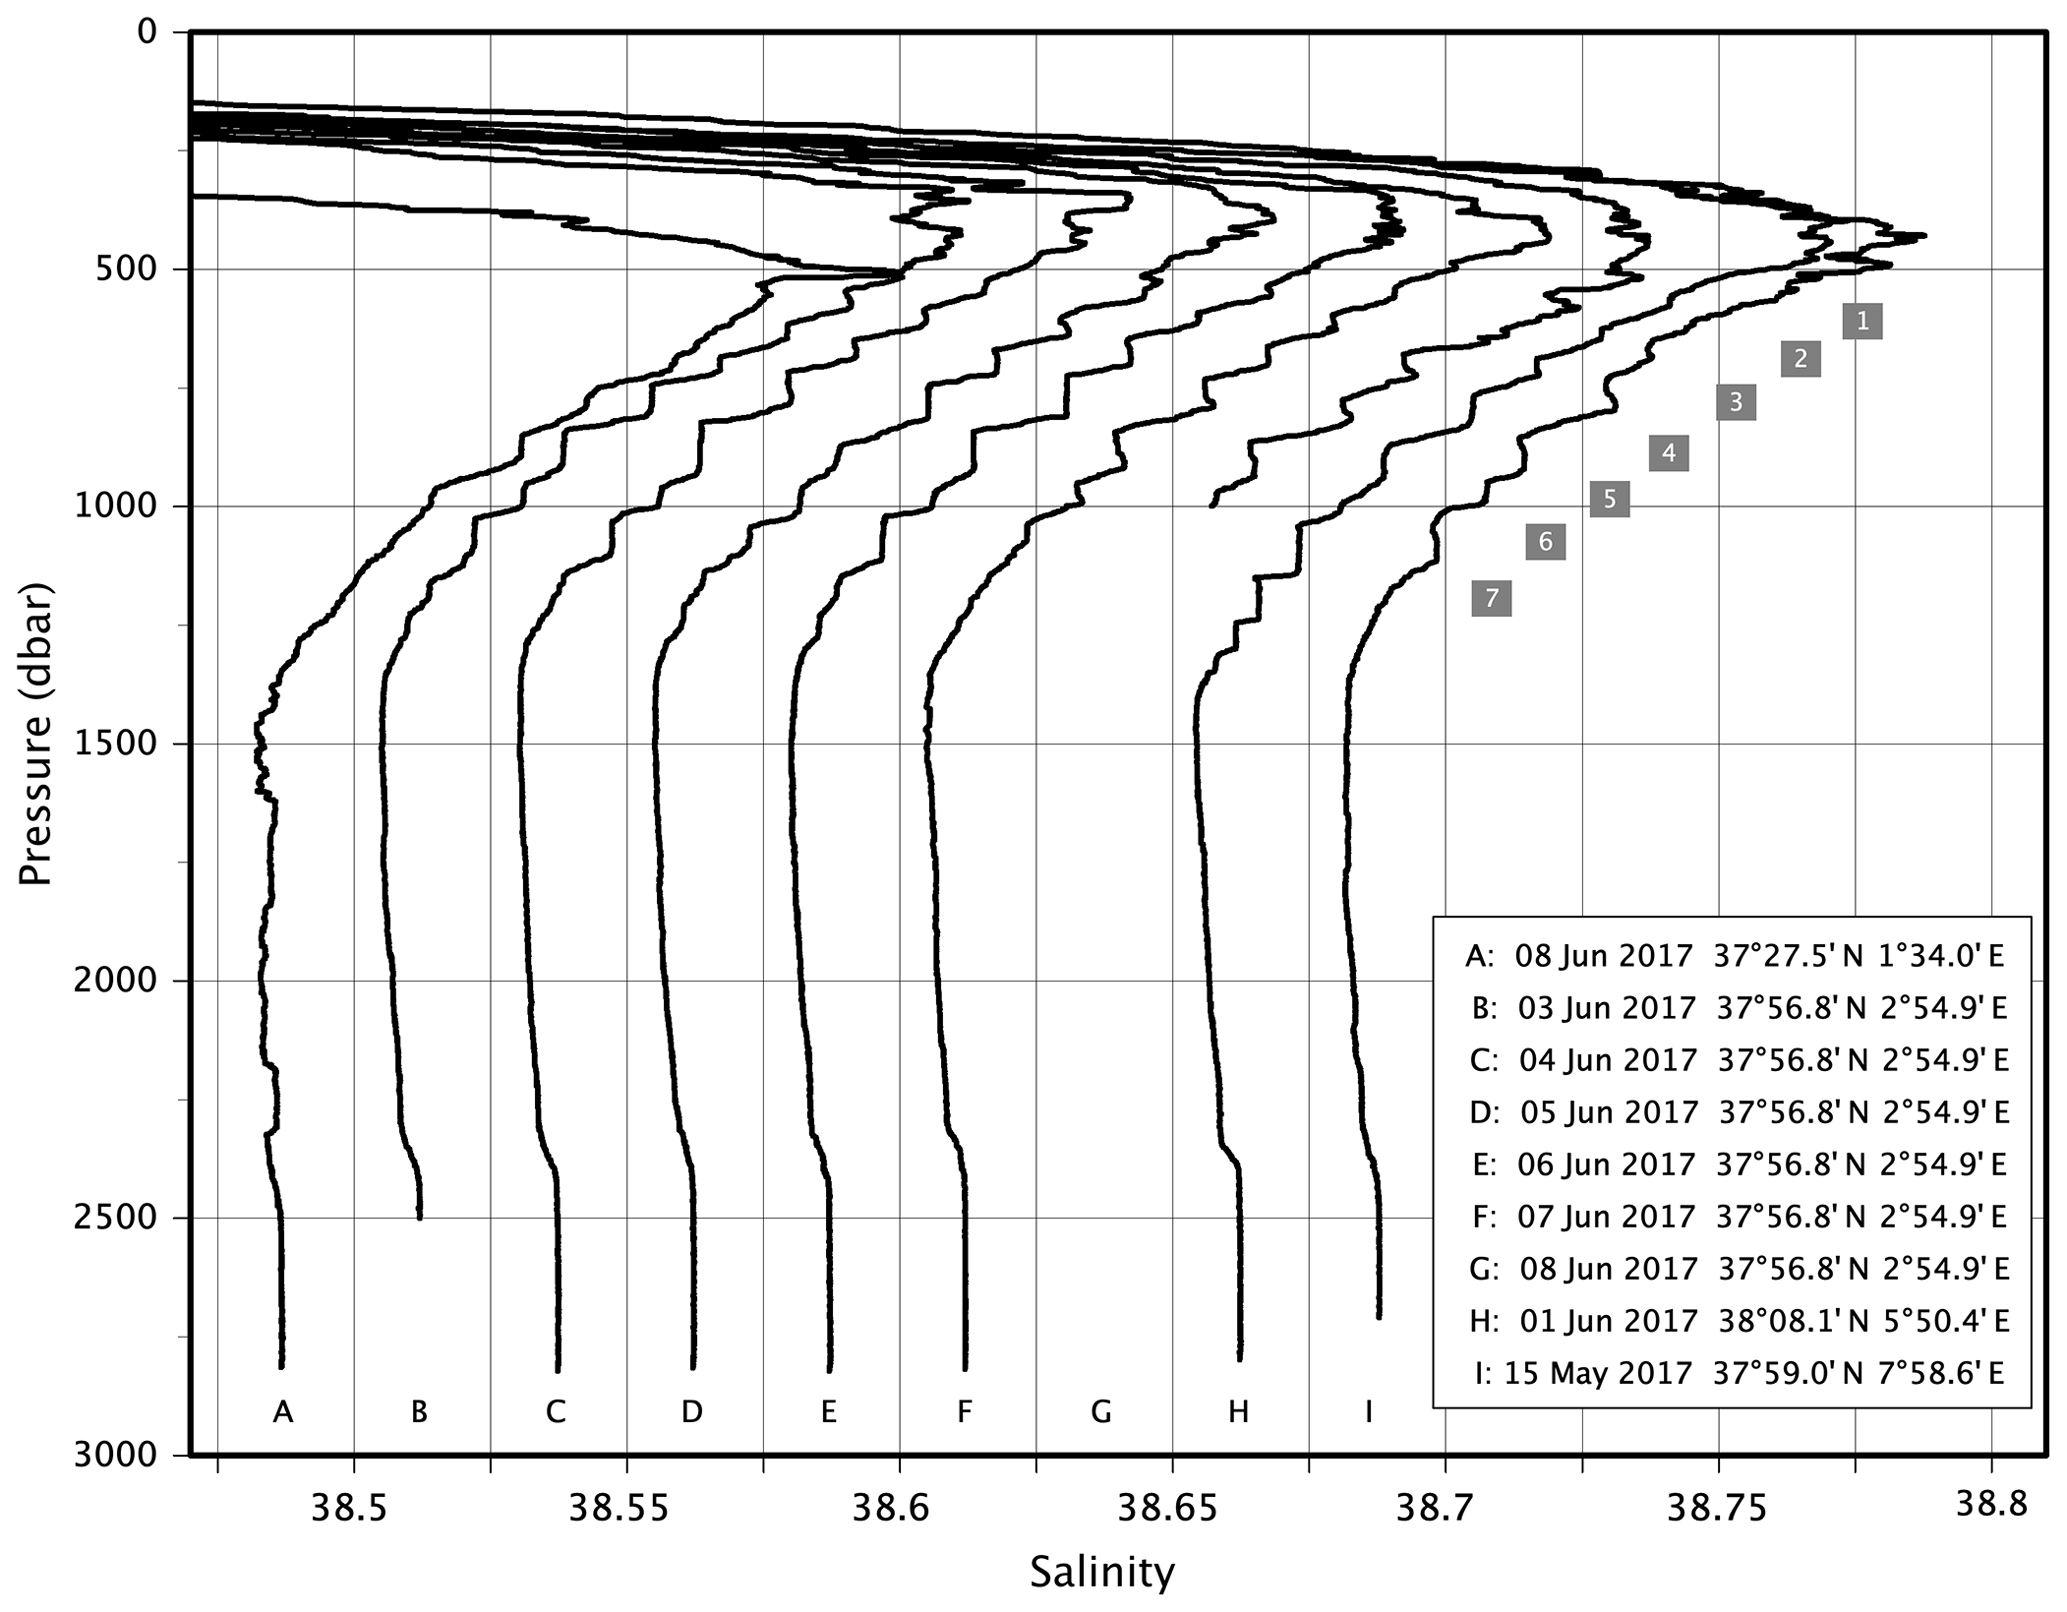
Figure 7Sequence of salinity profiles along a zonal transect with four stations across the Algerian Basin during the PEACETIME cruise. The second station was repeated six times (casts B–G). The casts were performed from the surface to the bottom, except cast B (down to 2500 dbar) and cast G (down to 1000 dbar). The salinity scale is correct for profile A, and each subsequent profile is offset by 0.025. The layer numbering of Table 4 is indicated by grey boxes at the average layer depths.
Despite the spatial and short-scale temporal fluctuations, the bulk temperature and salinity gradients remained similar for all the central casts, 0.00060∘C m−1 and 0.00013 m−1, respectively, as did the bulk density ratio Rρ (equal to 1.38). The transition zone was layered quasi-evenly, with six interfaces of about 0.05 ∘C in temperature and 0.01 in salinity (Table 4). The largest interface 3/4 separated the two thickest layers (both about 70 m). Interlayer density ratios decrease from 1.4 to 1.25, with a major variation at the interface 3/4.
Table 4Characteristics of the staircases in the Algerian Basin, extracted from the nine casts carried out during the PEACETIME cruise (Fig. 7). The selected layers are thicker than 15 m. The layer numbering increases with depth. Parameters are presented as the average value and standard deviation over the nine casts A–I.
The spatiotemporal extensions of this observation were inferred from three BGC-Argo deployments that preceded the cruise (Sect. 2.1). Two separate periods were sampled: from May 2013 to January 2016 and again during the whole of 2017 (Table 1). The temperature and salinity scans in the depth range of 300 to 1000 dbar show clear stripes over several periods lasting some months (Fig. 8). In other periods of a similar duration, steps were less marked, with a denser concentration of scans between stripes. The continuity of the layers (stripes) is less clear than in the Tyrrhenian Sea, and the sharpness of the steps is more variable (depicted in Fig. 8 by different densities of scan concentration between stripes).
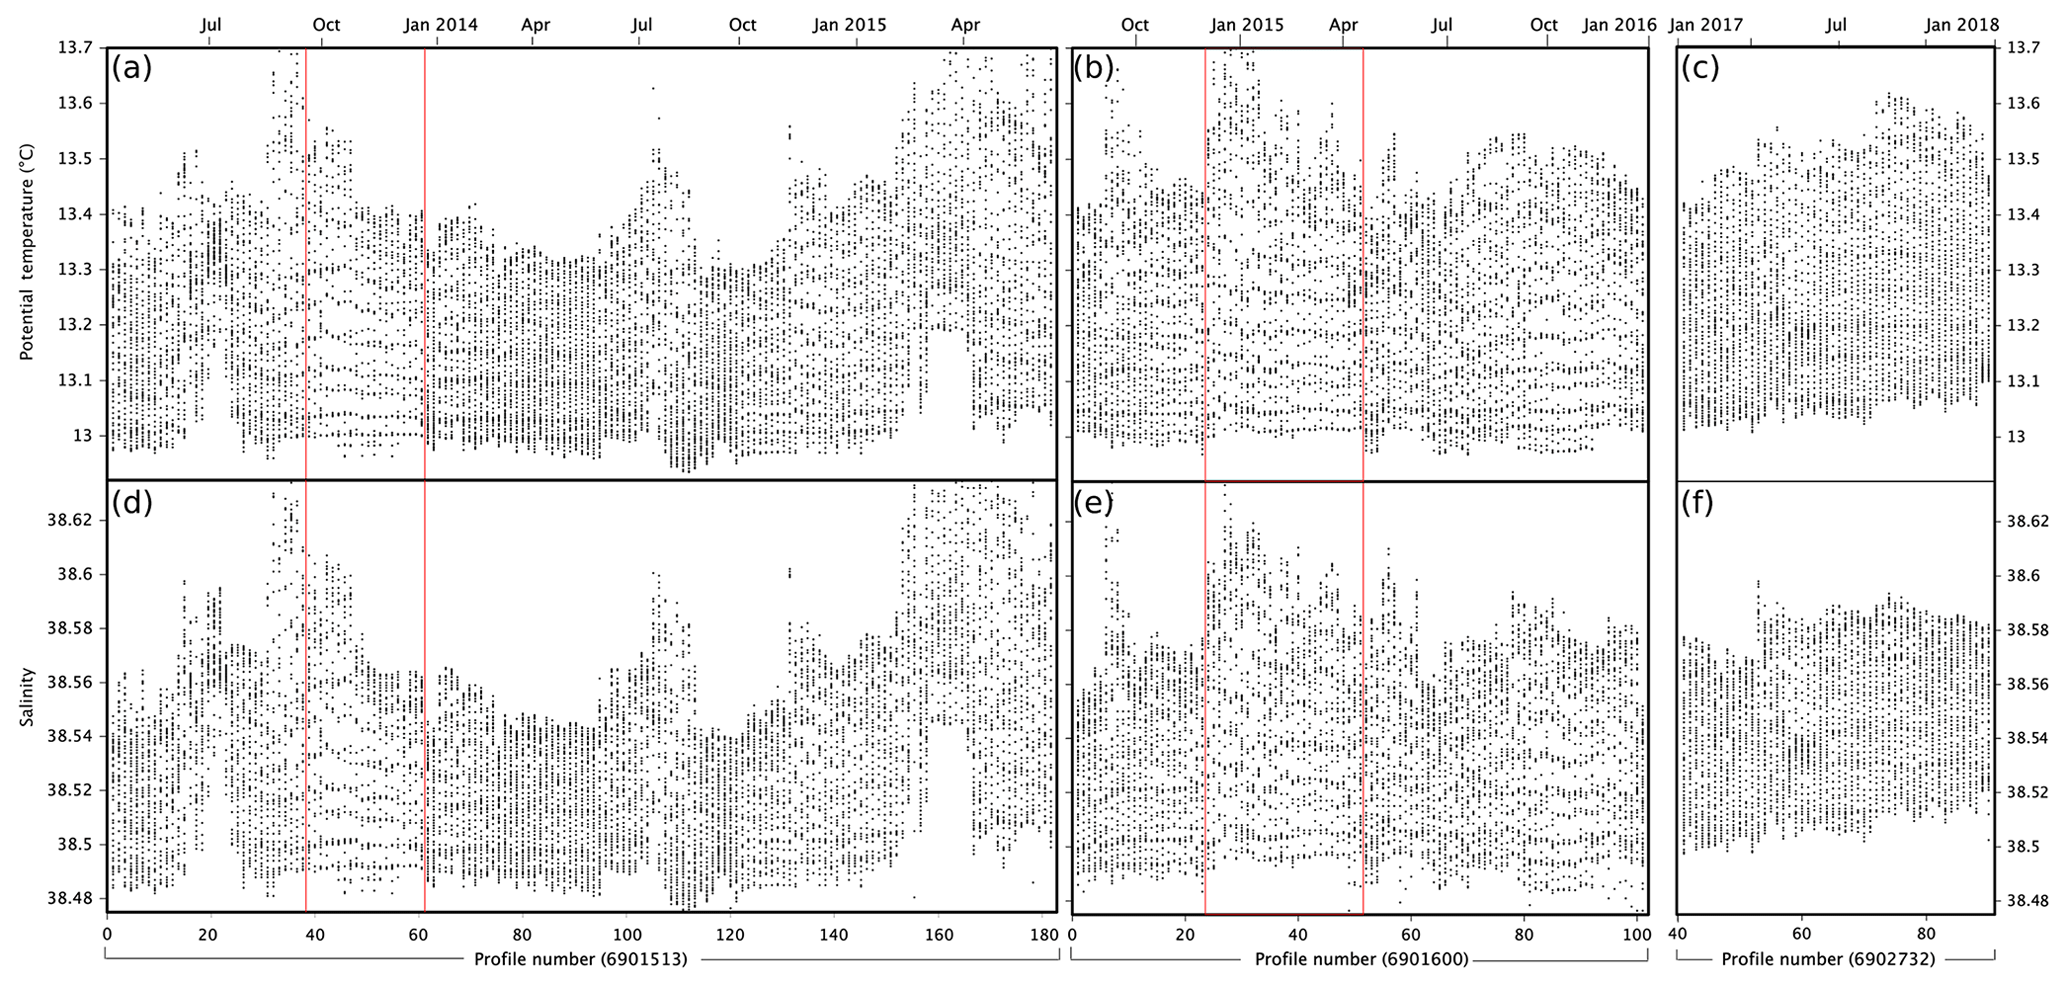
Figure 8Temperature (a–c) and salinity (d–f) recorded between 300 and 1000 dbar with a vertical resolution of 10 dbar, by the three floats 6901513 (a, d), 6901600 (b, e) and 6902732 (c, f) deployed in the Algerian Basin. Values on the x axis correspond to the number of the successive profiles with a temporal resolution of 1 to 7 d. The timeframe (in trimesters) is superimposed on top of the x axis. The two episodes described in the text (Sect. 3.2) are delimited by red vertical lines.
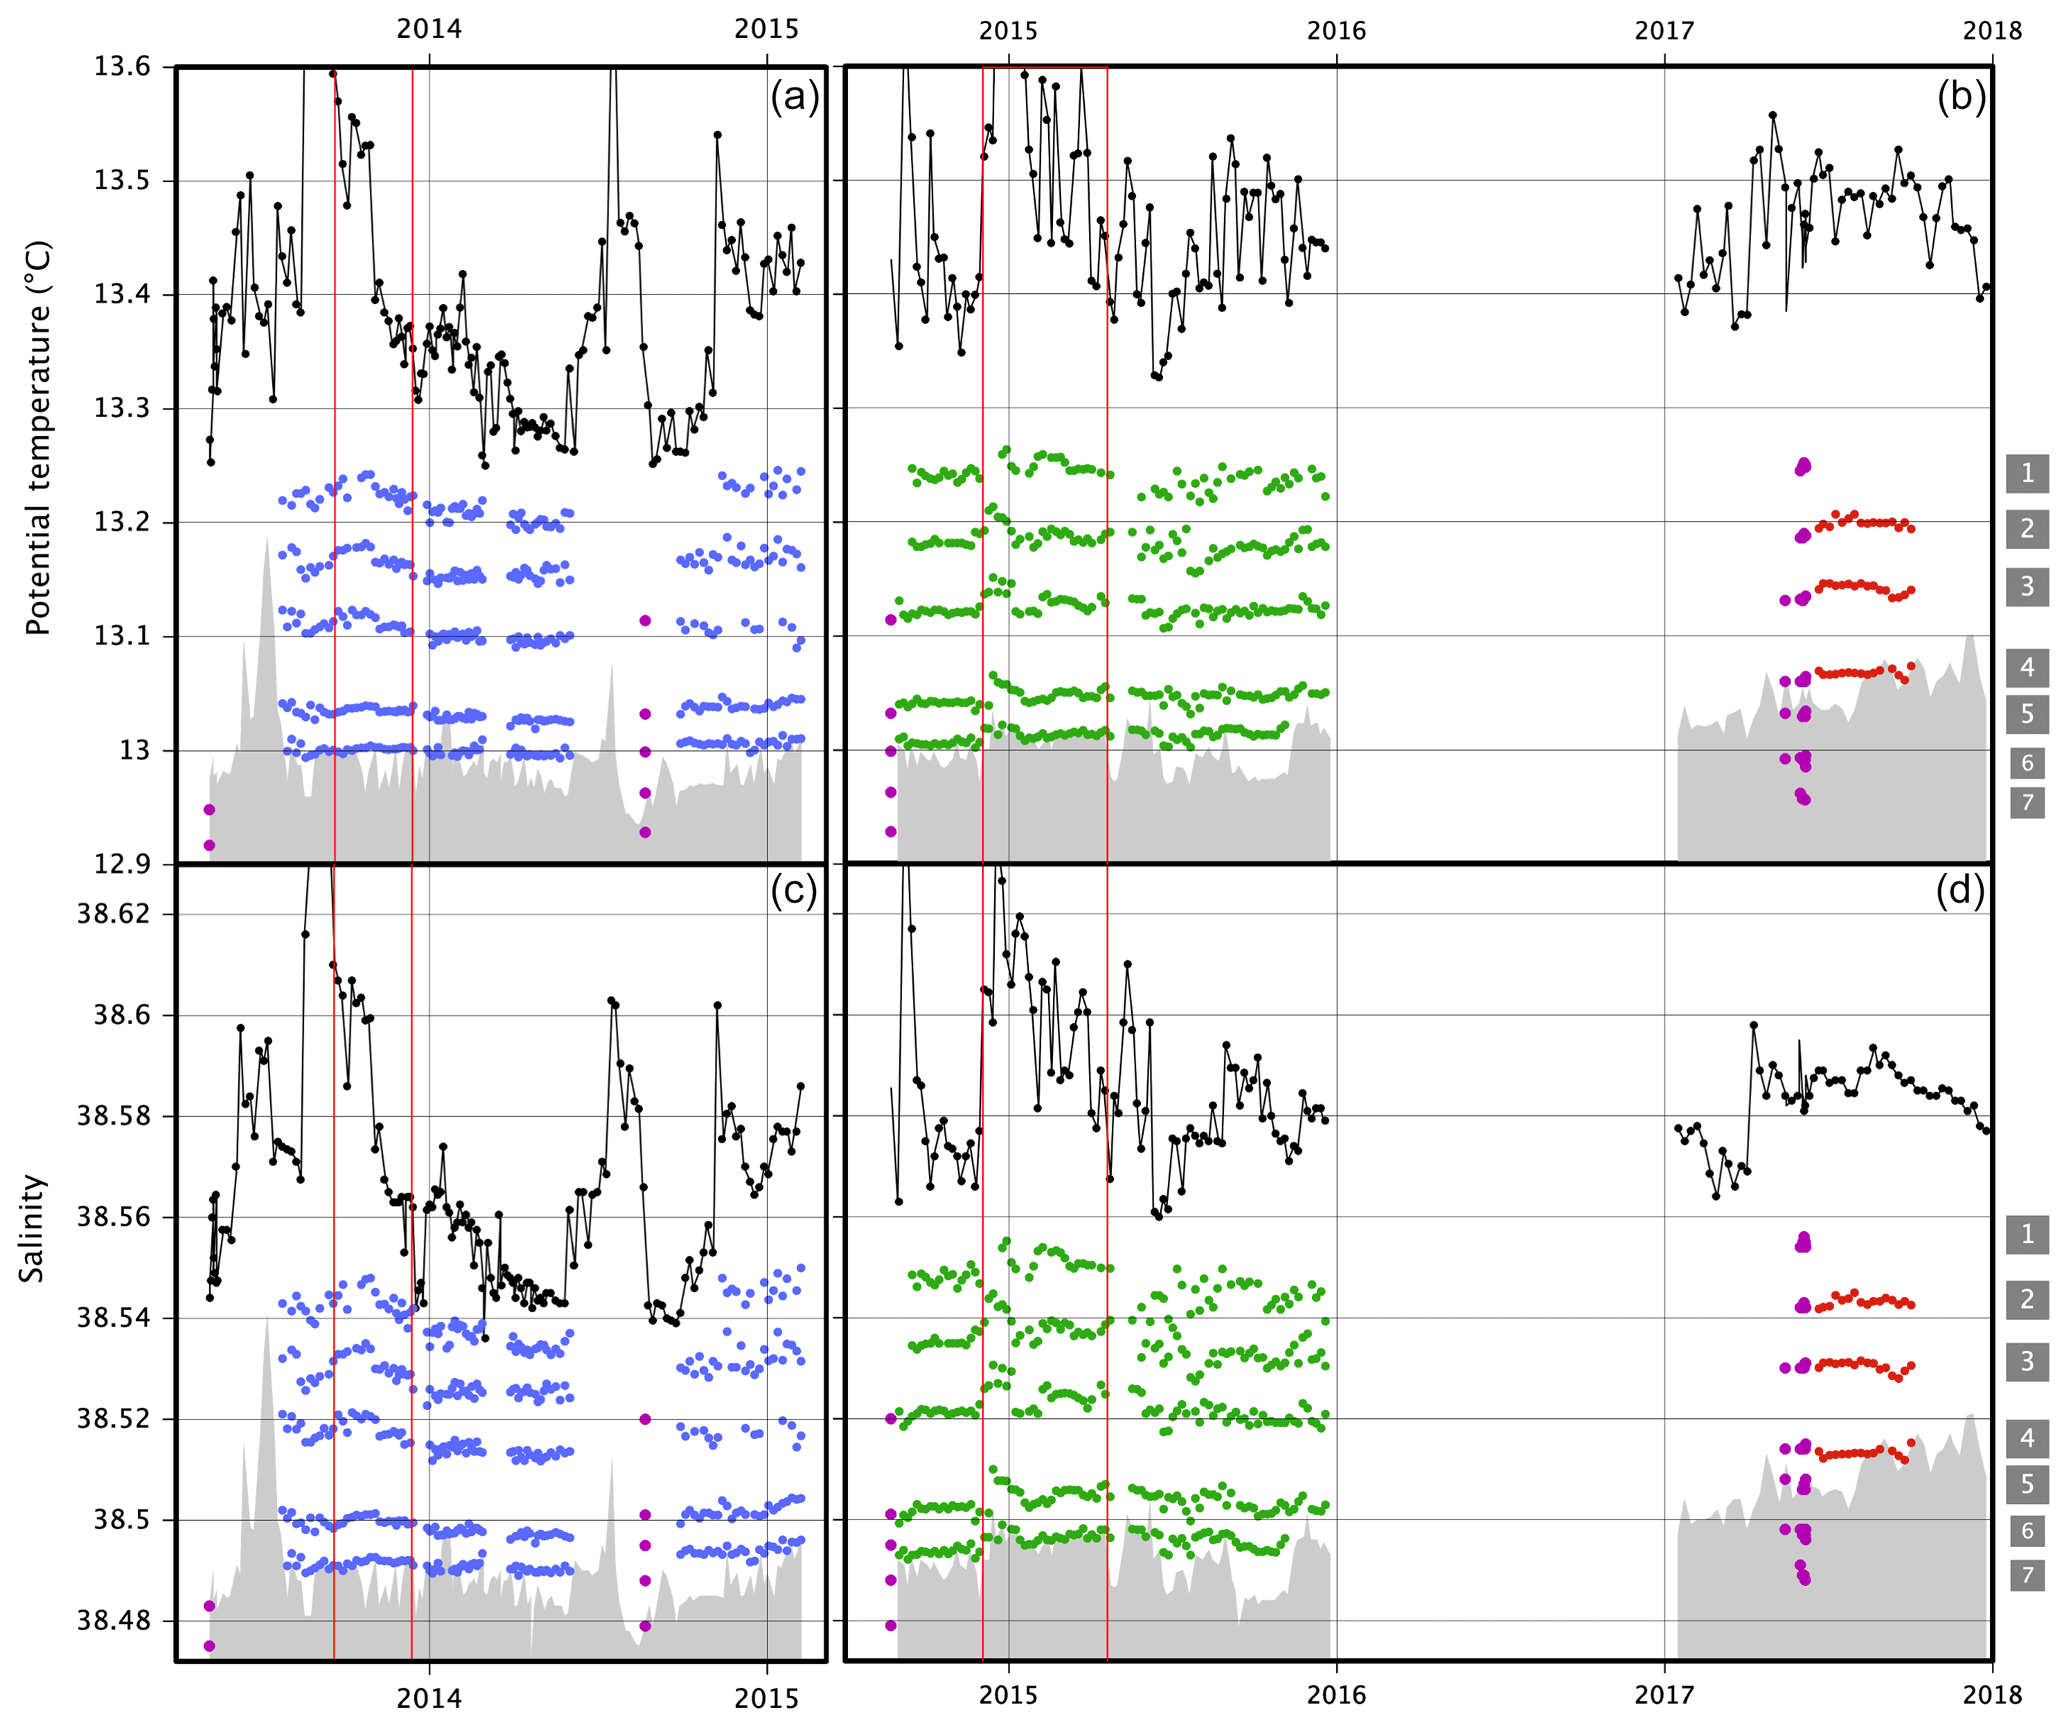
Figure 9Time series of properties (colored dots) of shipboard and float profiles for detected staircase layers. Temperature is shown in panels (a–b) and salinity in panels (c–d). LIW properties are indicated by the black lines. The shipboard CTD profiles are indicated in purple and the float CTD profiles in blue (float 6901513), green (float 6901600) and red (float 6902732). Grey shadows indicate the depth ranges below 1000 dbar. Time series of floats 6901513 (a, c) and 6901600 (b, d) are represented in different panels to avoid overlapping. The layer numbering for the stations PEACETIME (Table 4) is indicated inside the grey boxes on the right. The two episodes described in the text (Sect. 3.2) are delimited by red vertical lines.
The layer properties have been diagnosed by the staircase detection method (Sect. 2.3). Their evolution is depicted considering the shipboard CTD and BGC-Argo datasets (Fig. 9). The profiles collected by the floats, although limited to 1000 dbar, can provide an observation of most of the vertical structure (the first five layers of the seven reported in Table 4). They reveal the reproducibility of the layering pattern over years, in continuity with the patterns documented in their vicinity by ship surveys. Moreover, gradients at the largest interface 3/4 are in agreement with the values from PEACETIME stations (Table 4), about 0.07 ∘C in temperature and 0.02 in salinity. Layer properties changed as temperature and salinity of LIW increased, as suggested by the two episodes delimited by the red lines in Figs. 8 and 9.
During the first episode lasting 3 months, float 6901513 drifted eastwards profiling every 20 km, along a 250 km zonal transect around the 37∘30′ N parallel (Fig. 10a). In contrast with the middle of the transect, the profiles appear jumbled at the eastern and western edges (Fig. 10b), indicating a disruption of the layers as consequence of lateral intrusions. These local inversions among layers reflect the changes in layer properties reported above (Fig. 9). Changes in layer and interface thicknesses can be more clearly seen from profiles aligned at the depth of the interface 3/4 (Fig. 10c). Staircases appear well developed in the middle of the transect: steps are sharper and layers are thicker than at the edges, showing a small transient layer splitting the interface 3/4. This observation suggests well-ordered thermohaline staircases confined inside an epicentral region between 4∘15′ and 5∘30′ E meridians.
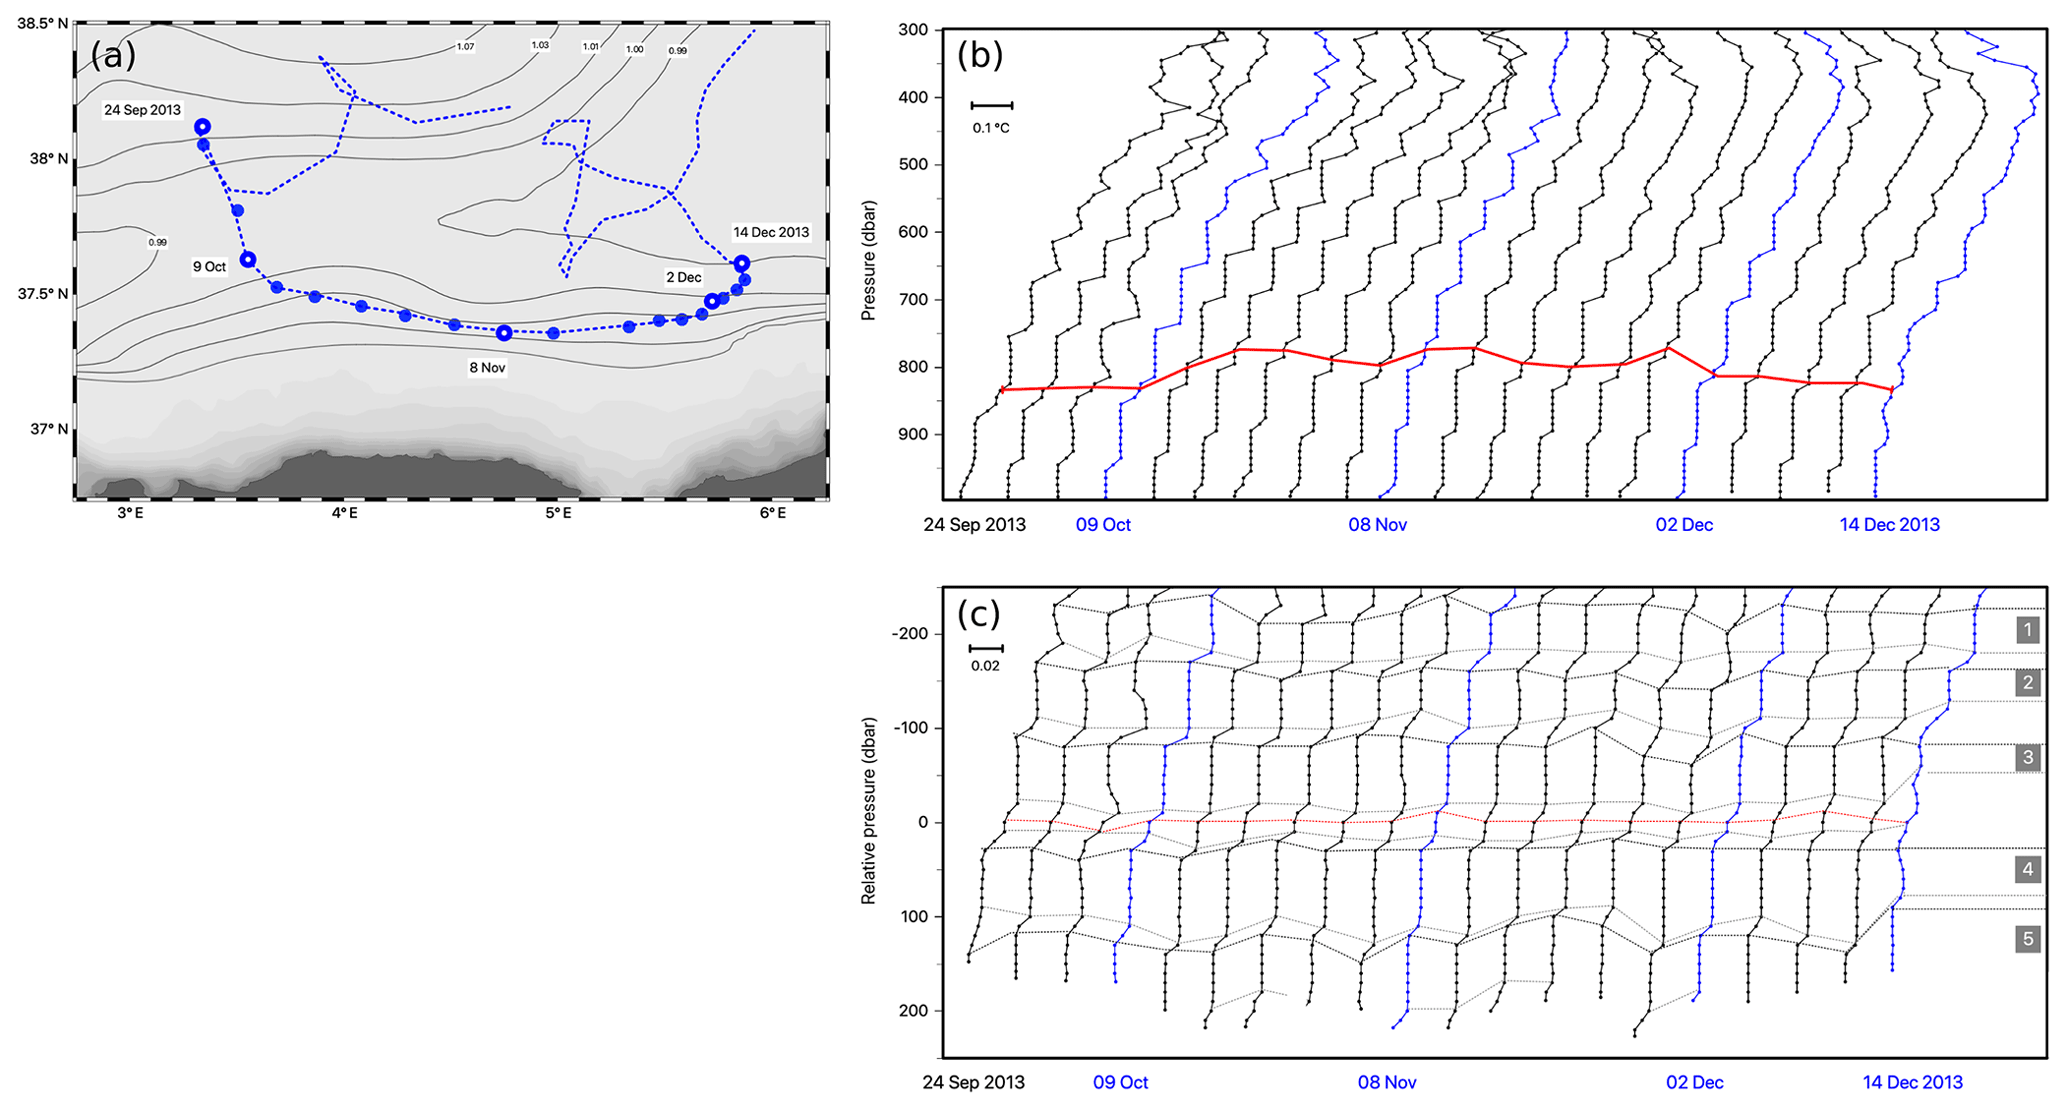
Figure 10Drift trajectory (a) and successive profiles of temperature (b) and salinity (c) collected by float 6901513 between 24 September 2013 and 14 December 2013, with a vertical resolution of 10 dbar. Temperature profiles are shifted by 0.1 ∘C, salinity profiles by 0.02. Values on the y axis correspond to the pressure referenced to the surface (b) or to the relative pressure referenced to the interface 3/4 indicated by the red line (c).
During the second episode lasting 4 months, float 6901600 completed a cyclonic gyration, profiling every 10 km along a path of a 60 km radius inside the eastern Algerian gyre (Fig. 11a). Lateral intrusions were found in most of the area surveyed by the float until 22 February 2015 (Fig. 11b), covering the sector north of 38∘10′ N and east of 5∘40′ E. In contrast, the layering is well defined in profiles collected in the neighborhood of the position 37∘45′ N, 5∘20′ E. As mentioned earlier, local inversions within layers are associated with changes in layer properties (Fig. 9b, d) that intensify with distance to the position 37∘45′ N, 5∘20′ E, documenting the development of lateral intrusions in the surrounding area.
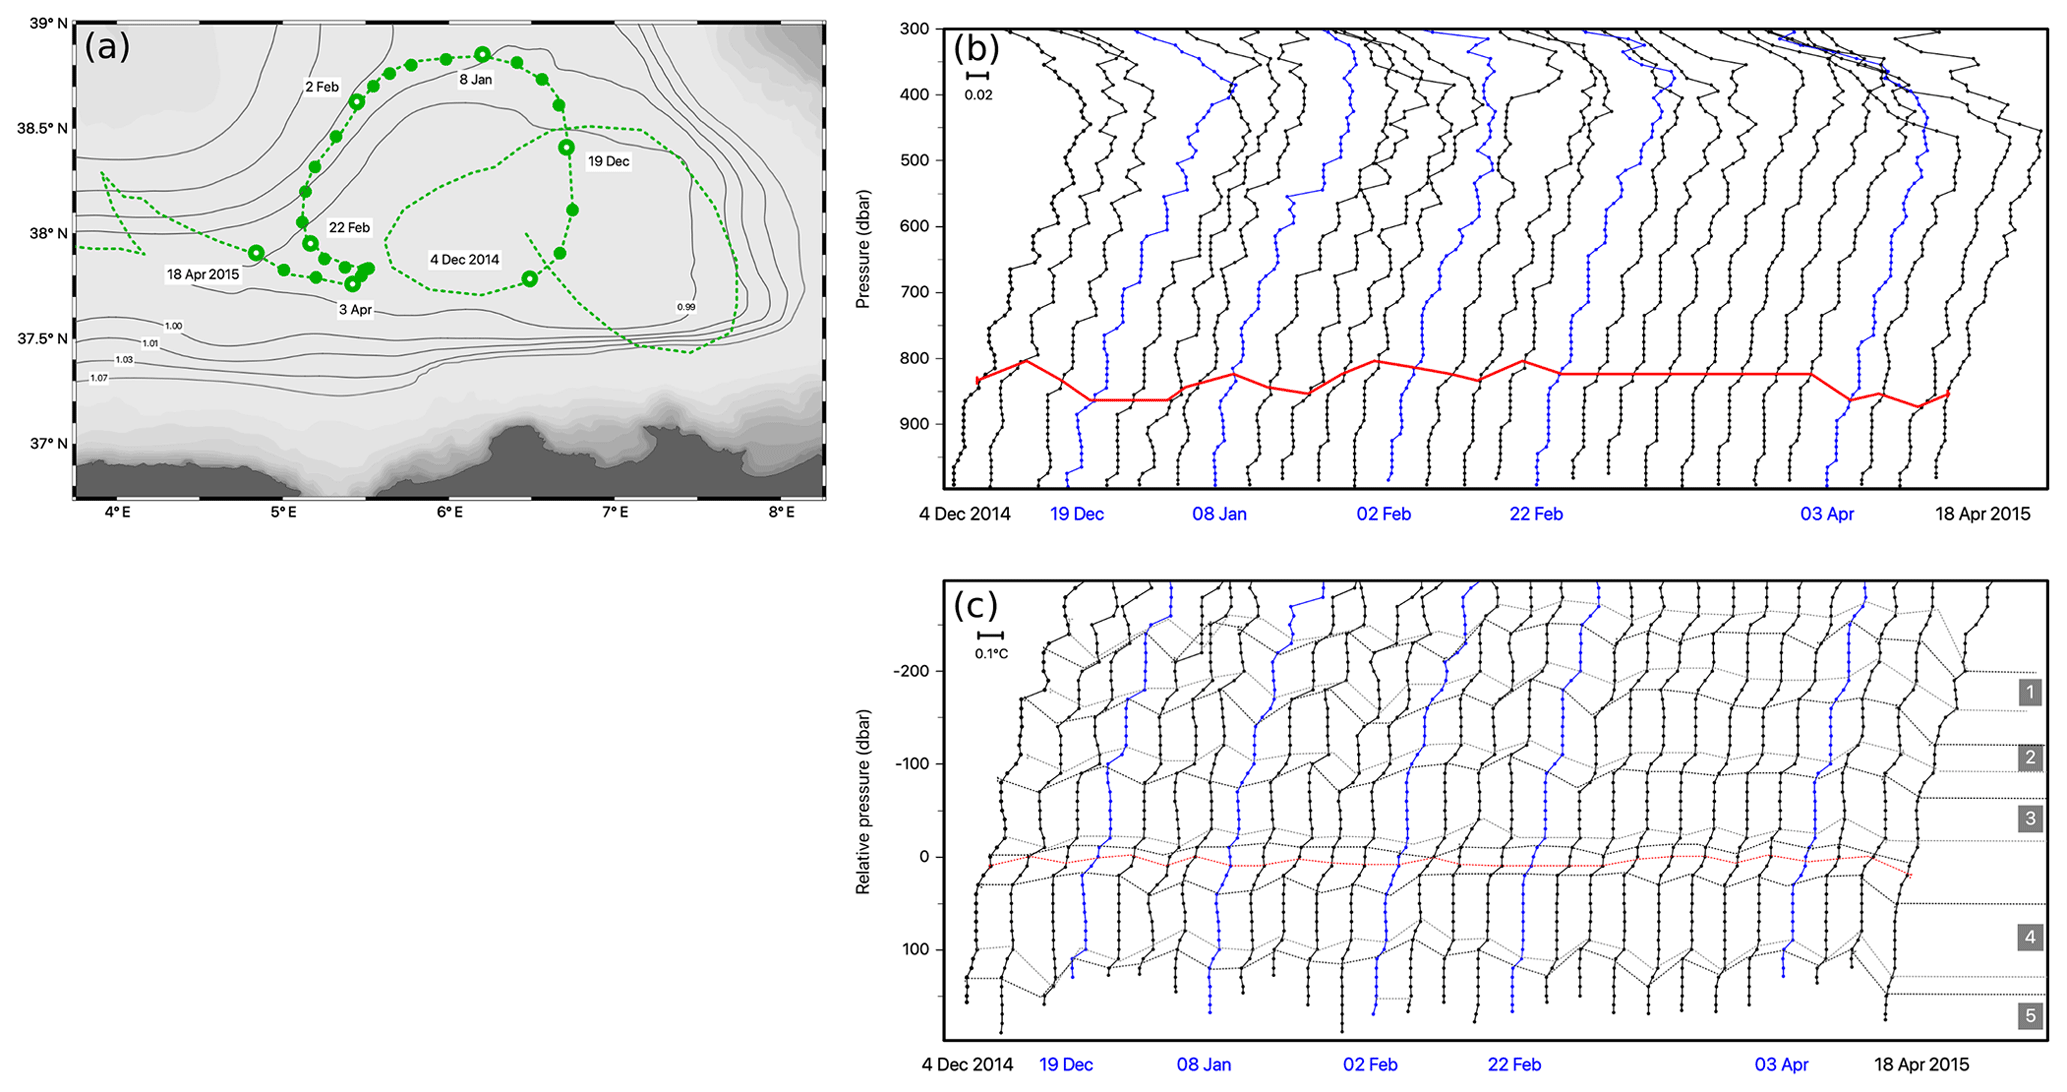
Figure 11Drift trajectory (a) and successive profiles of temperature (b) and salinity (c) collected by float 6901600 between 4 December 2014 and 18 April 2015, with a vertical resolution of 10 dbar. Temperature profiles are shifted by 0.1 ∘C, salinity profiles by 0.02. Values on the y axis correspond to the pressure referenced to the surface (b) or to the relative pressure referenced to the interface 3/4 indicated by the red line (c).
The two episodes detailed the spatial extension sketched out in Fig. 6, with active well-ordered thermohaline staircases confined inside the eastern Algerian gyre and their progressive erosion all around. Moreover, these episodes confirmed the connection between layers of fluctuating properties and their continuity over the whole period of observation (suggested in Figs. 8 and 9). The layer properties in a temperature–salinity diagram are aggregated by layer along separate lines (Fig. 12a). Floats and cruises records are distributed from the oldest to the newest along these lines, with the temporal succession starting with float 6901513 (blue), followed by SOMBA-GE (purple triangles), float 6901600 (green), PEACETIME (purple dots) and float 6902732 (red). As a result, these lines document interannual trends, as the five connected layers become warmer (by about 0.06 ∘C) and saltier (by about 0.02) during the 4 years of observation.
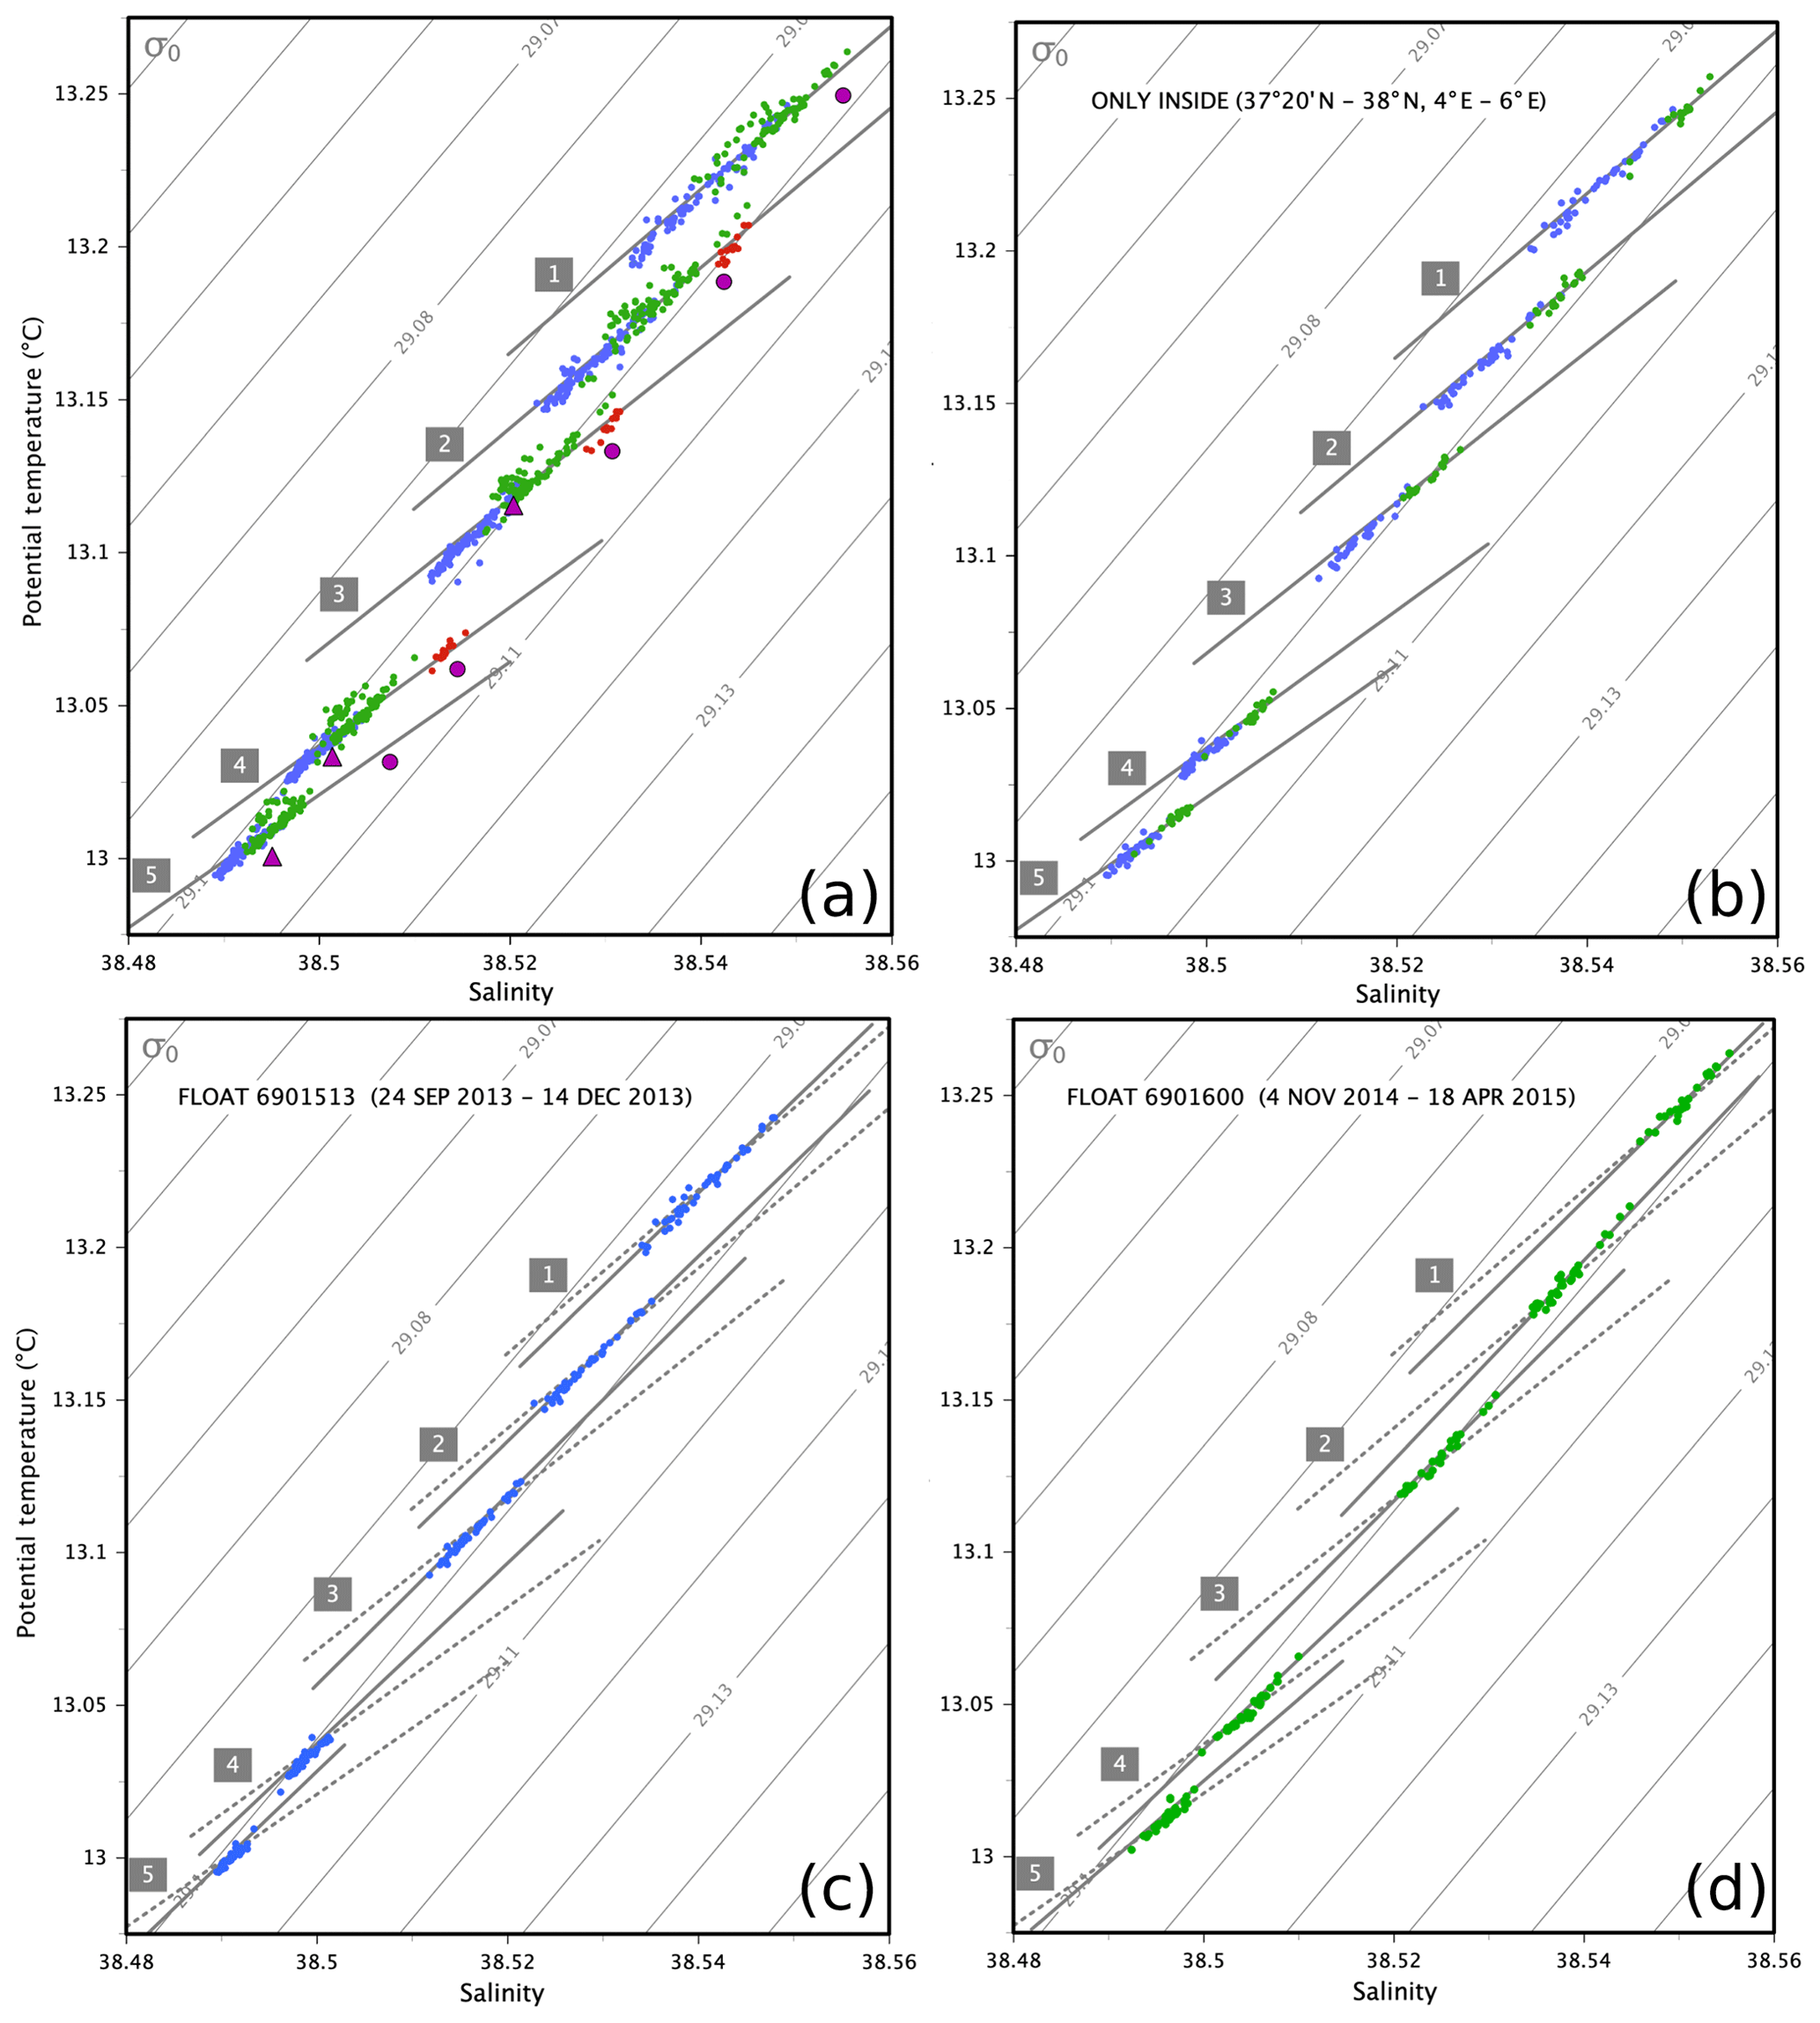
Figure 12Temperature–salinity diagram of the layers. Colored dots correspond to the different floats in blue (6901513), green (6901600) and red (6902732); stations PEACETIME in 2017 are given by the purple circles, station SOMBA-GE in 2014 by the purple triangles. Layer numbers are similar to those in Table 4. The least-squares fit for each layer is indicated by the grey lines. Whole dataset (a), selection inside the box (37∘20′–38∘′ N, 4∘–6∘ E) (b), and the two episodes (c, d). The least-squares fit in (a) is reported in (c) and (d) with the dotted lines.
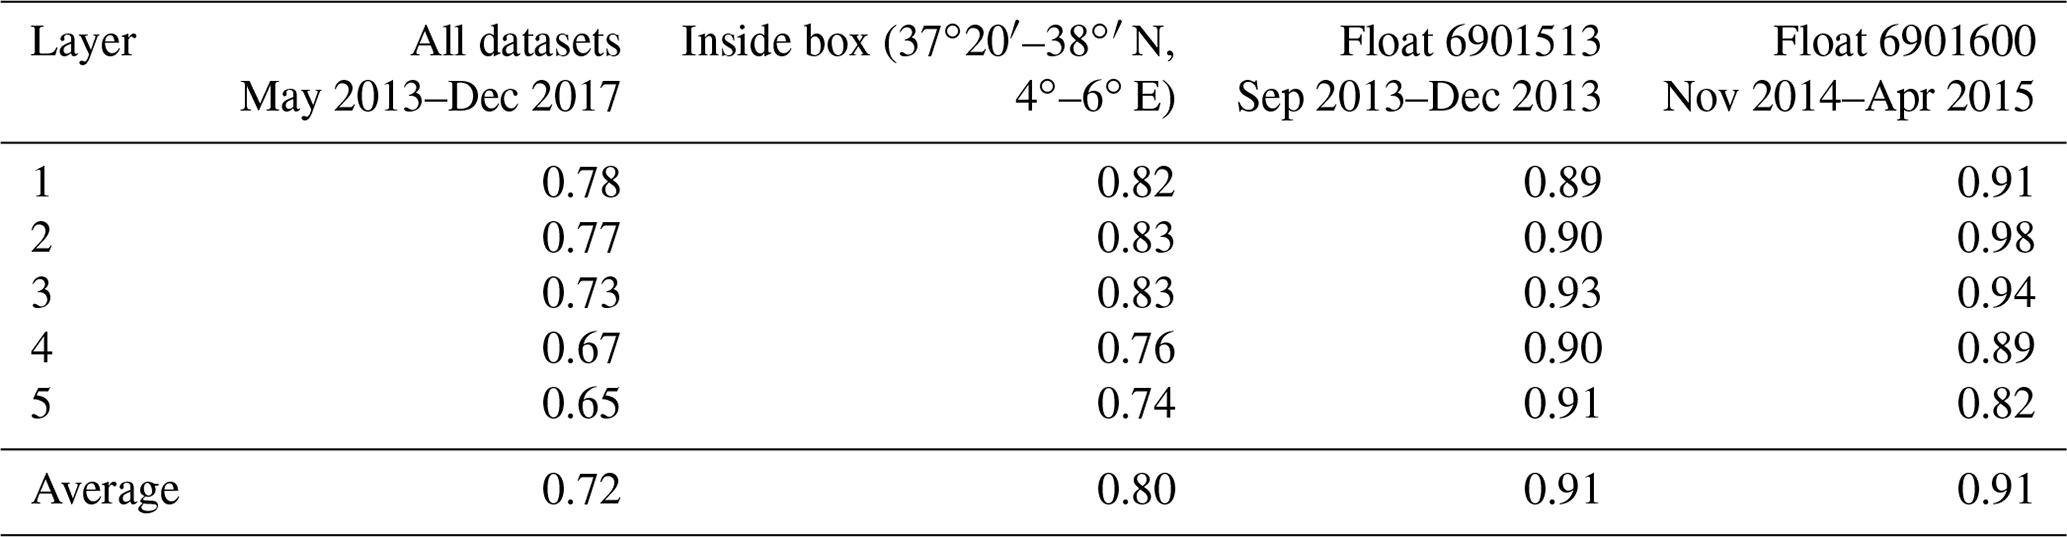
The changes in layer properties in terms of the lateral density ratio as expressed in Eq. (3) and estimated from the slope of layer distributions in the temperature–salinity diagrams (Sect. 2.3) are reported in Table 5. Considering the whole period, each layer is distributed along a line crossing isopycnals as a composite of segments nearly parallel to isopycnals (Fig. 12a). The gross lateral density ratio associated with this distribution is in the range of 0.65–0.78, with an average of 0.72. In each episode considered separately, the distribution of layer properties is encapsulated in single segments with slopes closer to isopycnals (Fig. 12c, d). Lateral density ratios are in the range of 0.89 to 0.93 for the first episode and 0.82 to 0.98 for the second episode, with an average of 0.91 in both episodes. Given the short timescale of each episode (3–4 months), these ratios are inferred by changes in layer properties attributed to spatial variations, in agreement with the previous descriptions of the episodes. In the epicentral region, the distribution extends along lines crossing isopycnals (Fig. 12b). Lateral density ratios are in the range of 0.74 to 0.83, with an average of 0.80. This ratio is the result of the interannual trend in the relative changes between layer temperature and layer salinity. As detailed further in Sect. 4.3, these estimations of lateral density ratios assume water mass conversion within thermohaline staircases driven by two distinct processes, one acting at large spatial scales and the other at large temporal scales.
Table 5Lateral density ratios (; Eq. 3) defined by the changes in temperature and salinity within each layer (i). Ratios computed considering the whole dataset (Fig. 12a), the selection inside the box (37∘20–38∘′ N, 4–6∘ E; Fig. 12b) and the two episodes (Fig. 12c and d). Average values over the five layers also reported.
3.3 Estimation of nitrate fluxes in presence of thermohaline staircases
The large-scale nutrient distribution in the LIW, based on nitrate profiles collected during the PEACETIME cruise in May–June 2017, shows a progressive increase along its pathway from the Ionian Sea to the Algerian Basin (Fig. 1). The LIW enrichment is particularly significant in the Tyrrhenian Sea, with an increase of 2 µmol kg−1 in nitrate concentration between the eastern Tyrrhenian station and the southwestern Sardinian station. This observation is analyzed using five contrasted stations selected along the LIW pathway (Fig. 13). Saltier LIW are found in the Ionian station (higher than 38.9) at 200 dbar depth, whereas fresher LIW are found in the Algerian station (salinity 38.6 at 450 dbar). The three intermediate stations have transitional properties, reaching 38.7 in salinity southwest of Sardinia. Nitrate concentrations follow an inverse trend as compared to salinity: profiles at the five stations are clearly differentiated below 250 dbar, showing inflow of low-nutrient waters from the Ionian Sea to the eastern Tyrrhenian (same nitrate values at 450 dbar) and their progressive enrichment until reaching the Algerian Basin.
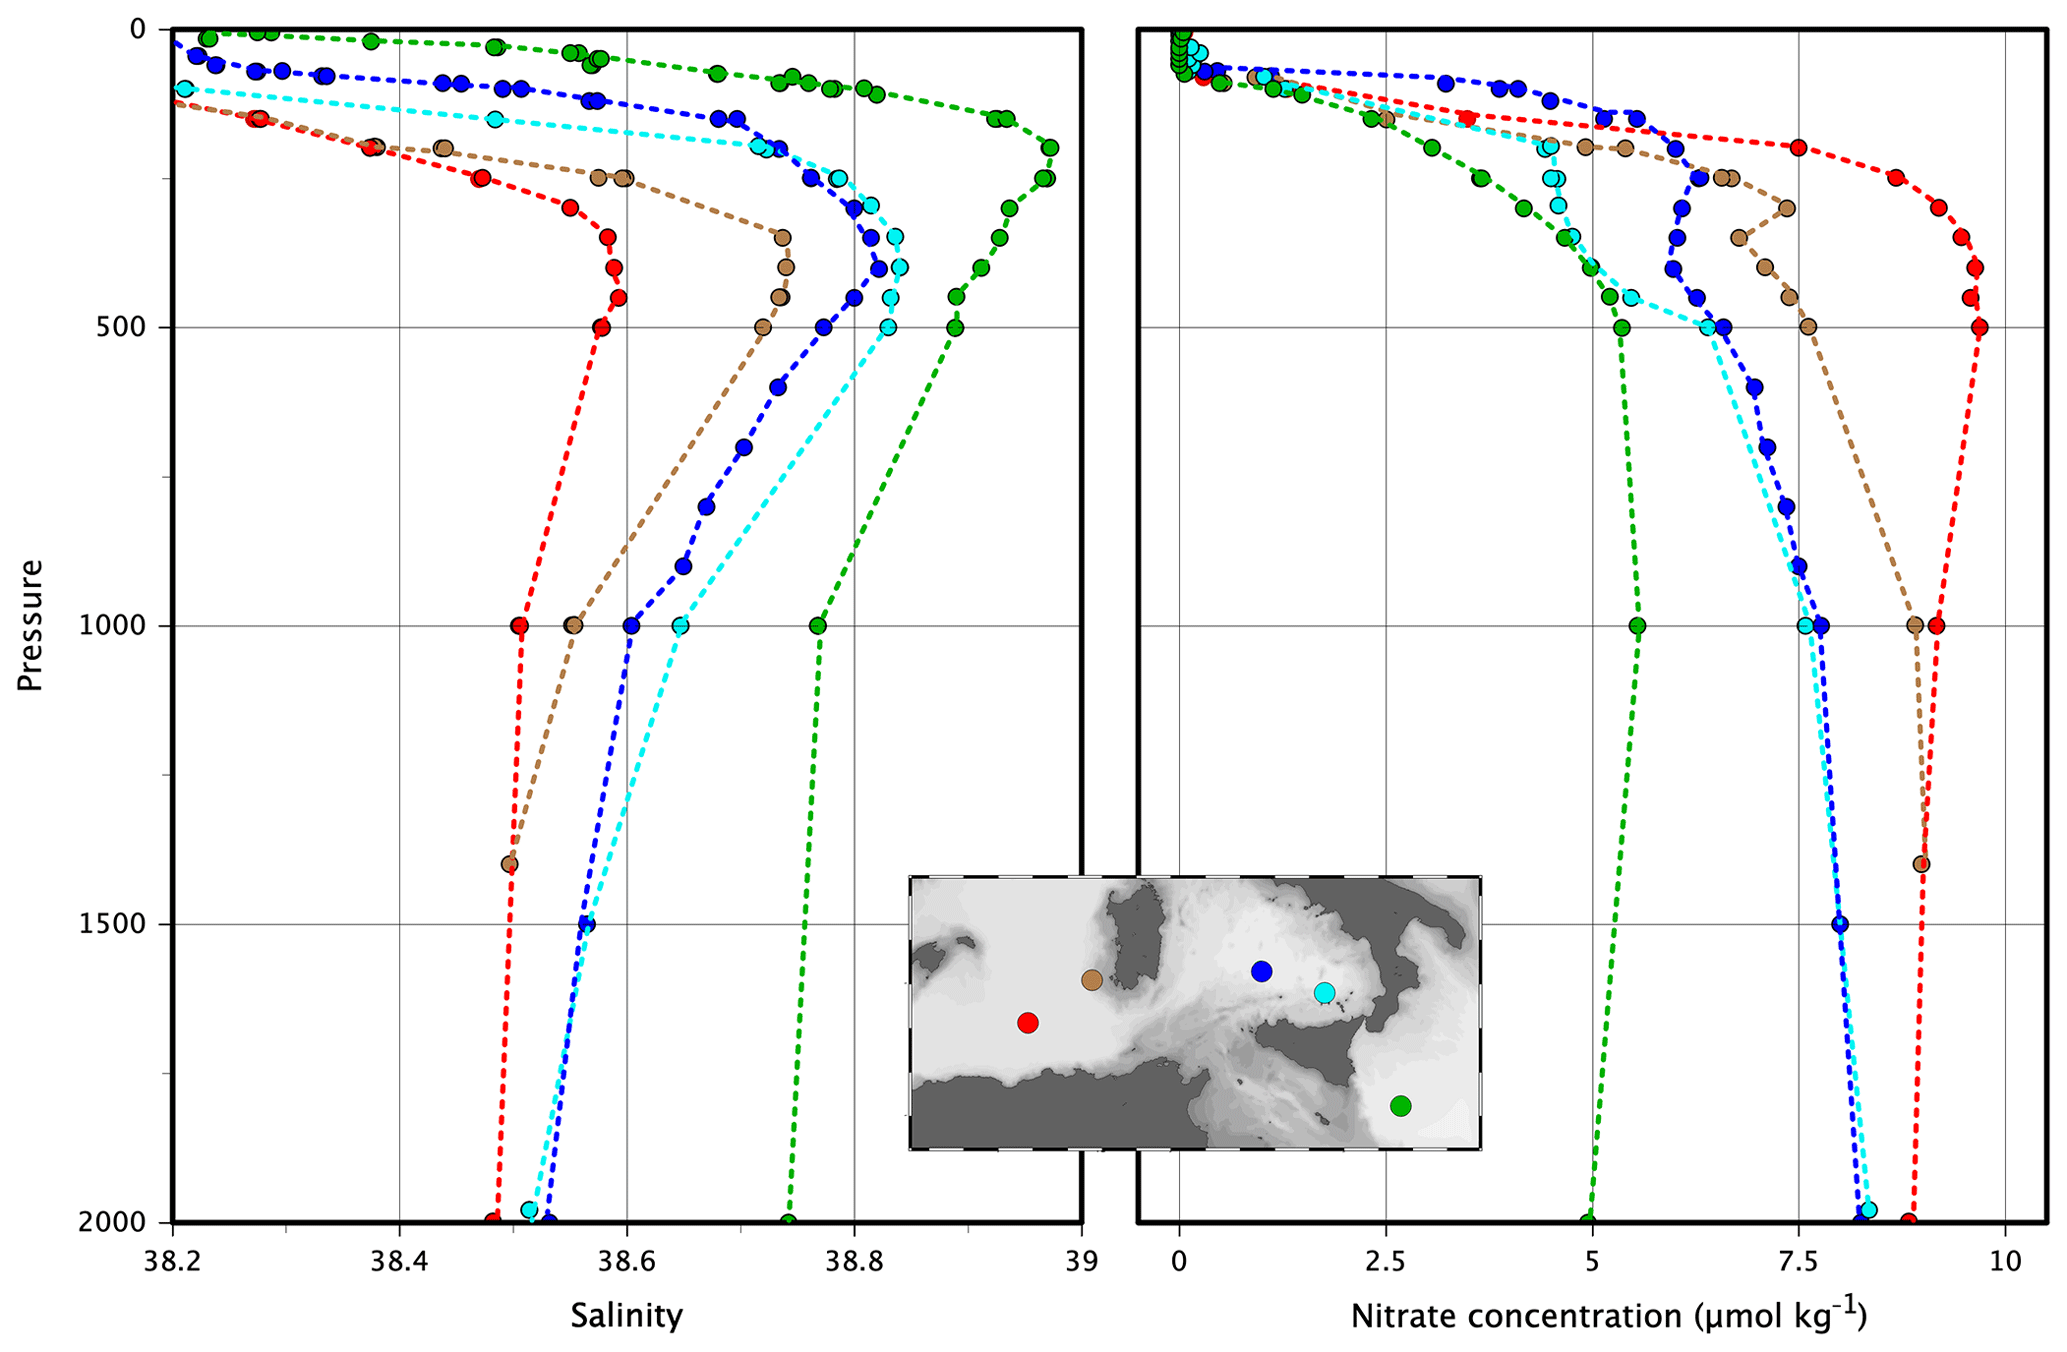
Figure 13Discrete profiles of salinity and nitrate (µmol kg−1) measured during the cruise PEACETIME. The station in the central Tyrrhenian Sea (dark blue dots) corresponds to cast A reported in Fig. 3. The station in the Algerian Basin (red dots) corresponds to cast H reported in Fig. 7.
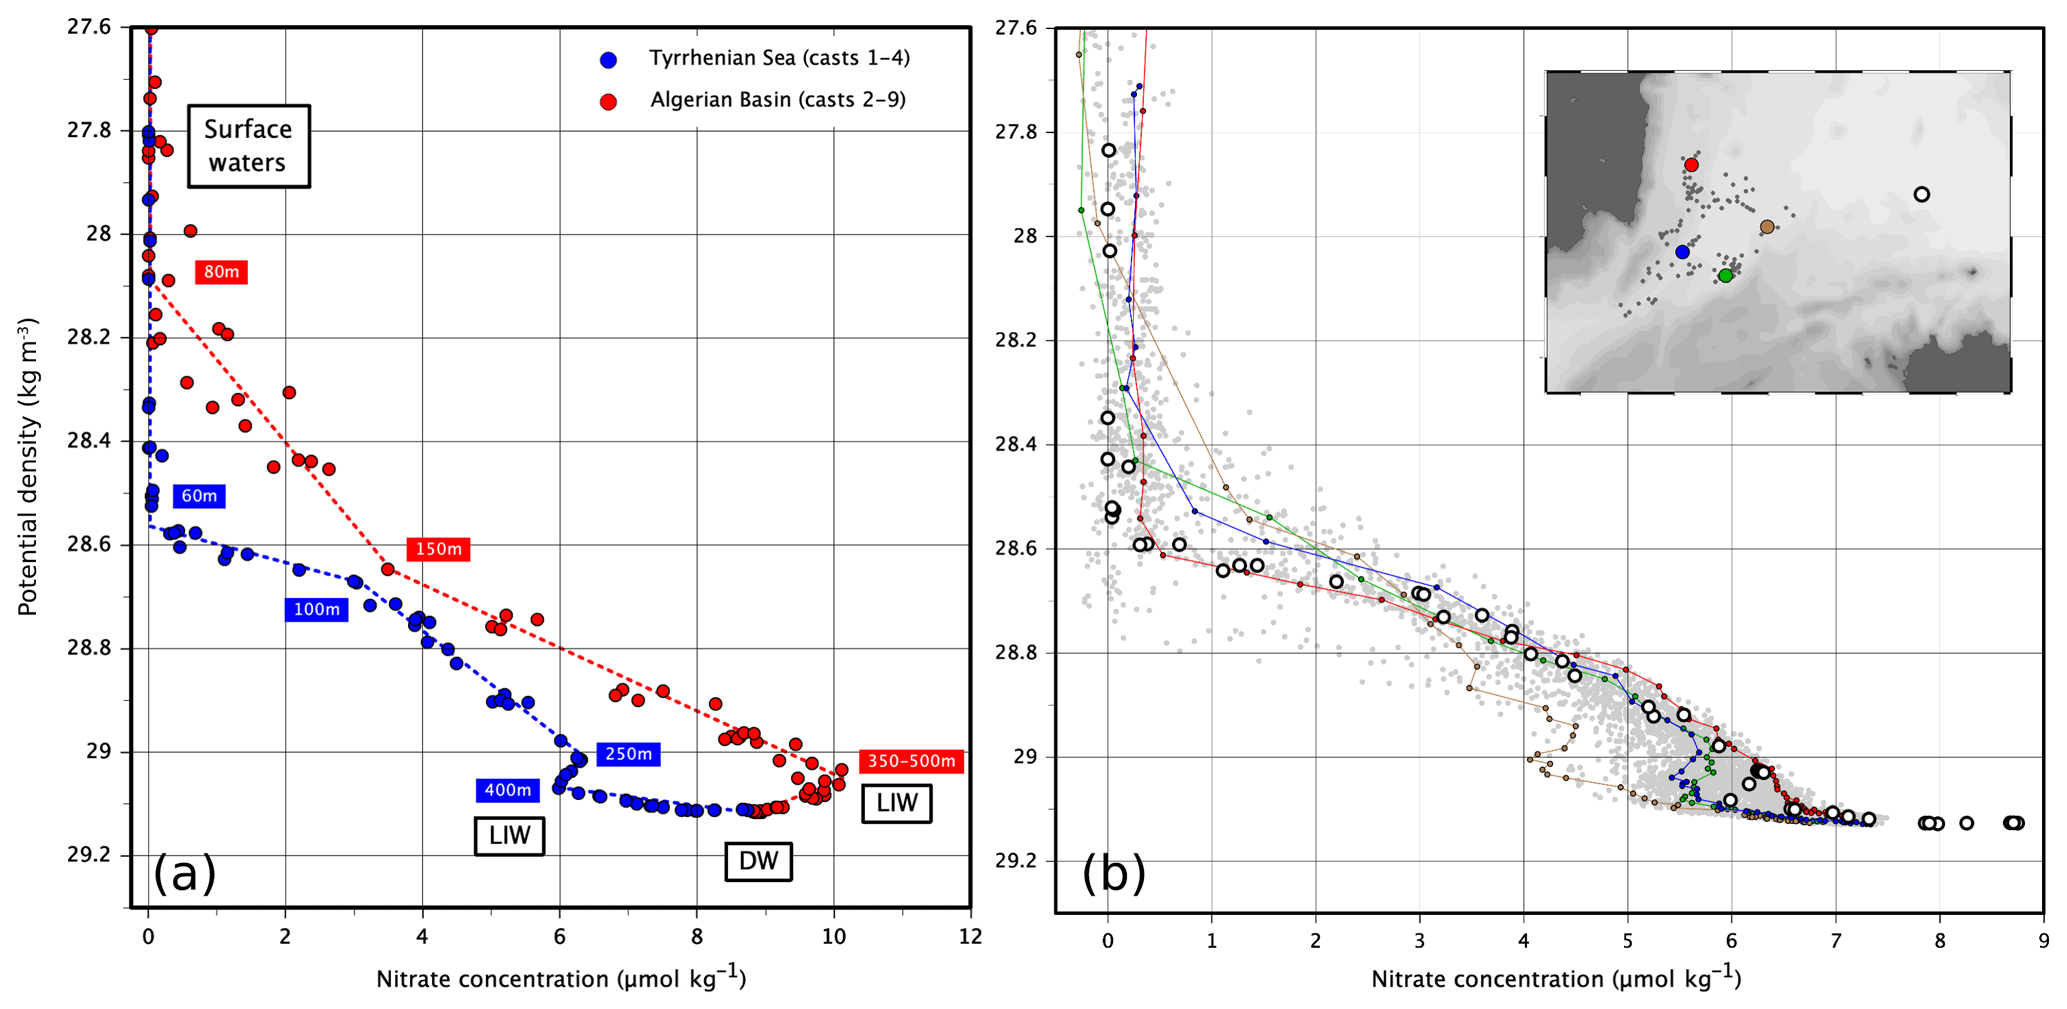
Figure 14Potential density versus nitrate concentrations (µmol kg−1). (a) Data from water samples collected during the PEACETIME cruise. Blue dots: casts A–D in the Tyrrhenian Sea (locations indicated in Fig. 3). Red dots: casts B–I in the Algerian Basin (locations indicated in Fig. 7). (b) Cruise data (open circles) and data from float 6901769 (grey dots) as well as float profiles of the 3 October 2015 (red), 29 November 2016 (green), 27 December 2016 (brown) and 11 April 2017 (blue).
In the central Tyrrhenian Sea and Algerian Basin where thermohaline staircases occur (Fig. 14a), the sunlit surface layers were equally depleted at this time of the year, while the nutrient stocks were similar in the DW with nitrate concentrations of about 8.7 µmol kg−1. Differences occur in the transition zone: in the Algerian Basin, nitrate concentrations slightly decrease by 0.7 µmol kg−1 over a depth range of 500–1500 dbar towards their DW concentrations, while in the Tyrrhenian Sea nitrate concentrations increase by 2.3 µmol kg−1 over a depth range of 500 to 2000 dbar. Another major difference between the two basins appears in the depth extension of the nitracline. In the Algerian Basin, the base of the nitracline is within the LIW (350–500 dbar), where nitrate concentrations reach their maximum value, followed by a decrease towards DW values. In the Tyrrhenian Sea, the nitracline instead extends to 250 dbar, nitrate concentrations reach a local maximum above the LIW, and they slightly decrease inside the LIW core where the salinity maximum is found at 400 dbar.
The S-shape delineated by the nitrate profile between LIW and the nitracline marks the isopycnal inflow inside the Tyrrhenian Sea of the nutrient-poor waters from the Ionian Sea. Float 6901769 documented this feature during the 2 years preceding the cruise (Fig. 14b). The S-shape appears as a persistent feature in the southwest sector of the basin, with variable amplitude depending on the location. It is pronounced in the southeasternmost profiles of the distribution, with a decrease in nitrate concentrations down to 4 µmol kg−1 along the isopycnal 29. Moving west towards the Sardinian Channel, the minimum reaches 5.6 µmol kg−1. In the central Tyrrhenian Sea, the minimum increases to 6 µmol kg−1. Along the eastern Sardinian coast, the nitrate profile shows only a slight inflexion at 6.5 µmol kg−1. In summary, the Ionian water inflow gradually impacts the nutrient distribution above LIW. This will be further discussed in connection to the LIW circulation pathway in Sect. 4.4.
In order to quantify the roles played by thermohaline staircases or Ionian–Algerian inflows on LIW nutrient distribution, the vertical transfers of nitrate were estimated on three distinct approaches and locations: (i) the central Tyrrhenian station of the cruise PEACETIME, with four casts at the same location providing a snapshot of density and nitrate concentrations, each measured with high accuracy; (ii) the Algerian stations of the cruise, in which spatial and temporal inhomogeneities are found which affect only the surface layer; (iii) using data collected by float 6901769, with a broader range (see Fig. 5) but less accurate nitrate measurements (Sect. 2.2). In the two first cases, diapycnal nitrate fluxes are computed using parameterizations detailed in Sect. 2.4; stages of computation and results are reported in Table 6. In the case of float data, only diapycnal fluxes above the LIW were estimated using a similar procedure as for the other estimates (Table 6). An average nitrate flux has been estimated using 98 % of the float-based profiles, yielding 241±93 µmol m−2 d−1 upward through the nitracline, and µmol m−2 d−1 downward from the base of the nitracline into the LIW.
Table 6Estimates of nitrate fluxes in the central Tyrrhenian Sea and the Algerian Basin in the presence of thermohaline staircases. Above LIW, the depth, density and nitrate intervals have been chosen to characterize well-defined segments from the nitrate dataset collected during the cruise PEACETIME (Fig. 14a). The dissipation rates were extracted from the lookup table, Table 2. A linear regression was used to account for the fluctuations in the nitracline depth in the Algerian stations. Below LIW, the three formulations of the salt finger diffusivities in the transition zone have been applied with density ratios of 1.38 in the Algerian Basin and 1.32 in the Tyrrhenian Sea.
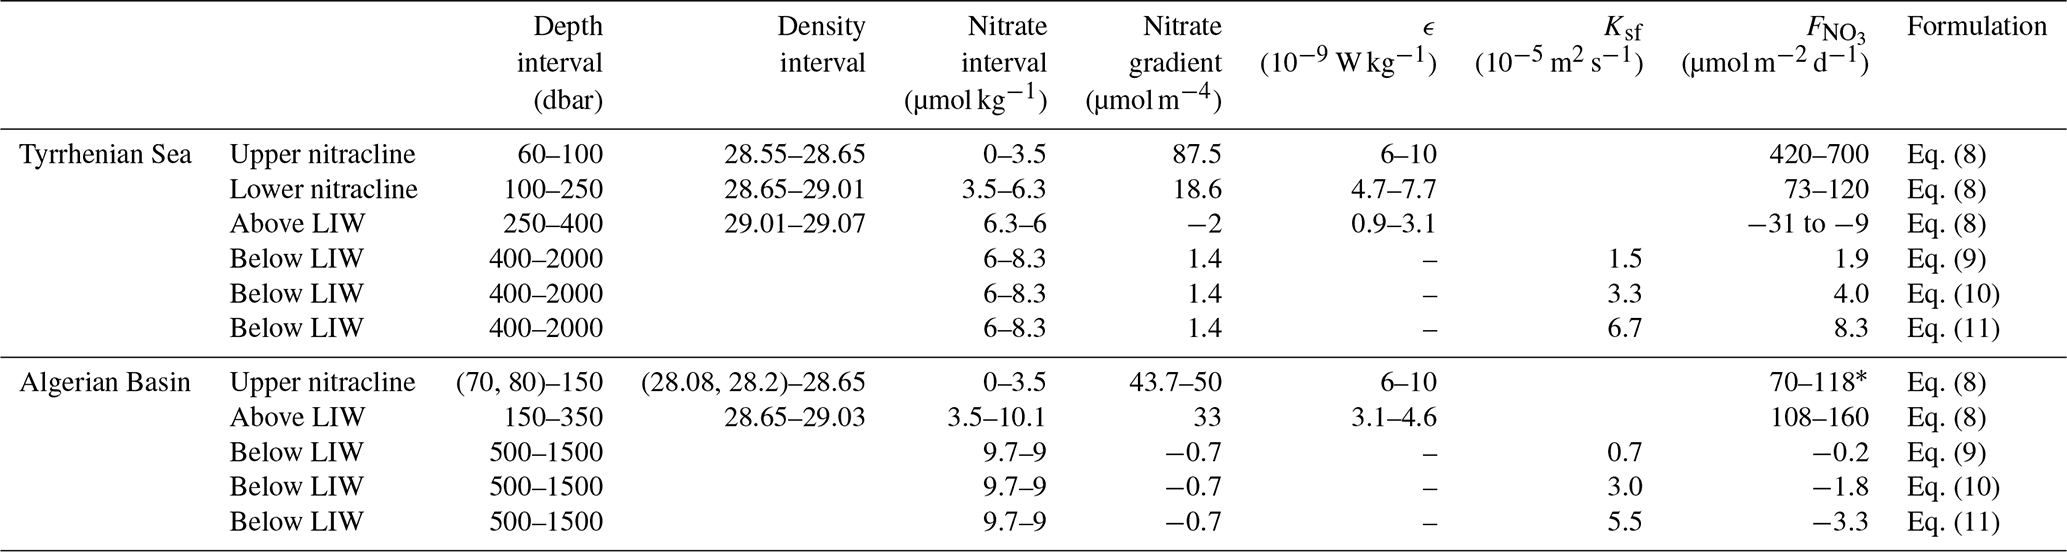
* Using computed by a linear regression of the nitrate–density diagram within the density interval.
The overall nitrate transfers along a zonal transect crossing the southwestern Mediterranean are displayed in Fig. 15. It appears that the largest fluxes correspond to the nutrient supply in the surface productive waters. In the Algerian Basin, there was a net loss of LIW nitrate, mostly towards the surface layer, whereas in the Tyrrhenian Sea, a net augmentation of LIW nitrate was found. The contribution from the DW reservoir through thermohaline staircases represents one-fourth of that supply. Considering that they also receive nitrates from above during their transit through the Tyrrhenian Sea, LIW are a net exporter of nutrients from the basin. The implications will be further discussed in comparison with other processes in Sect. 4.4.

Figure 15Vertical fluxes of nitrate (µmol m−2 d−1) in the presence of thermohaline staircases. Range of estimations reported from Table 6 for the stations collected during the PEACETIME cruise (in black) or computed from float 6901769 (in green), with positive diffusive flux oriented upward. Proposed isopycnal advection is indicated by the red arrows.
4.1 Different vertical structures
In the Tyrrhenian Sea, thermohaline staircases are the predominant feature in the water column (Fig. 3), spreading from 600 to 2275 dbar and made up of 10 layers that can reach an unusual thickness of 330 m. Only the upper part of these structures has been observed by the BGC-Argo floats because their profiling depth was limited to 1000 dbar. In contrast, the thermohaline staircases of the Algerian Basin are well documented by the BGC-Argo collection as they extend between a 600 and 1200 dbar depth (Fig. 7), with seven layers 30 to 75 m thick. Structural differences between the two basins are due in part to the inflow of newly formed DW in the Algerian Basin located from the seafloor up to 2300 dbar (Fig. 7), which uplift the older DW (Zunino et al., 2012; Send and Testor, 2017). Consequently, the DW pool presents a temperature–salinity minimum at 1400 dbar that intrinsically limits the vertical extension of the structure. In the Tyrrhenian Sea, the transition zone is not bounded, so staircases can extend over larger depths. Moreover, Tyrrhenian LIW are warmer and saltier than Algerian LIW, leading to lower density ratios which drive the preferential development of thicker layers (further detailed below).
The thermohaline staircases observed during the cruise PEACETIME have similar characteristics to those previously reported in the same basins. The vertical structure in the Tyrrhenian Sea is very close to those structures observed in 2007–2010 (Falco et al., 2016) and, more interestingly, to the one observed 44 years earlier in May 1973 (Molcard and Tait, 1977). Meanwhile, Zodiatis and Gasparini (1996) observed a lower number of layers inside the same depth range (only 6 in 1991, just 5 in 1992), together with larger individual thicknesses (up to 543 m). Notably, the DW properties were modified during this period as an effect of the eastern Mediterranean transient (Gasparini et al., 2005): the observed injection of heat and salt in the deep Tyrrhenian Sea would have favored the deepest layers merging. Moreover, Durante et al. (2019) documented an upward lift of the vertical structure by several hundred meters after 2010, and the presence of smaller steps below the deepest thick step, which is likely due to the ingression of a new denser water mass from the large production of anomalous DW in the Liguro-Provençal basin during the winters of 2005 and 2006. In the Algerian Basin, the present vertical structure is similar to those structures observed in 1994 (Krahmann, 1997): the vertical structure extended between 500 and 1300 dbar, with seven layers ranging between 28 and 67 m in average thickness. From biannual surveys carried out between 2006 and 2010, Bryden et al. (2014) report that the transition zone extended in depth, bounded by a temperature–salinity minimum at 1600 dbar, with eight layers averaging 93 m in thickness and a bulk density ratio of 1.28. In comparison with the present observation, an uplift of the old DW by 200 dbar and an increase in the density ratio to 1.38 could explain such structural differences.
As discussed above, layers tend to be thicker when bulk density ratios decrease. The theoretical model of Radko (2005) describes the macroscopic formation of thermohaline staircases by salt fingering as a series of merging events that make thin and unsteady layers grow into an equilibrated vertical structure. At the ultimate stage, layer thicknesses reach a critical value determined by the bulk density ratio (see Fig. 3 of Radko, 2005). The model predicts critical layer thickness will decrease with increasing bulk density ratios, to about 200 m for the bulk density ratios of the Tyrrhenian Sea (1.32) and about 80 m for those of the Algerian Basin (1.38). According to the present observations (Tables 3 and 4), the critical layer thicknesses in the middle of the structures are in good agreement with the model predictions. Moreover, following Radko et al. (2014), there is a tendency for unsteady layers to merge if the thickness of the adjoining layers is lower than their critical value; the preferential merging scenario, denominated “B-merger”, should occur in a manner that maintains the temperature–salinity differences between broad layers. This mechanism of adjustment has been found in the present study. The daily profiles at long stations in the Tyrrhenian Sea (casts A–D; Fig. 3) and in the Algerian Basin (casts B–G; Fig. 7) documented the occurrence of small transient layers at the interface between layers that have likely reached their critical thickness, without any change in layer properties. In addition, the two sequences of BGC-Argo profiles in the Algerian Basin (Figs. 10 and 11) also documented the occurrence of a small transient layer that either splits the main interface 3/4 when the adjacent layers are broad or merges when the adjacent layers decrease in width, while the interlayer temperature–salinity gradients remain equal.
4.2 Areal extents delineated by large-scale circulation features
In the Tyrrhenian Sea, the present analysis suggests a unique structure spreading from the central area up to the southwest border (Fig. 5). According to Zodiatis and Gasparini (1996), who studied a set of shore-to-shore transects all around the basin, thermohaline staircases cover large distances from the central part, becoming progressively weaker and finally disappearing near the borders. The authors reported an extension in the southwestern sector of the basin, documented along two transects southeast of Sardinia, which is in agreement with the present case (Fig. 5a). Sparnocchia et al. (1999) confirmed such extension northwest of Sicily. More recently, high-resolution synoptic observations of staircases by seismic data have been reported along three zonal transects north of the 40∘ N parallel (Buffett et al., 2017). The staircases are depicted as continuous stripes, well-ordered in the central part of the basin and weakening close to the continental slope, with remarkable spatial continuity. These independent observations confirm the hypothesis of a unique structure extending over large parts of the Tyrrhenian Sea, with an epicentral region located in its deep central area, as proposed by Molcard and Tait (1977).
Such a configuration, with active salt fingering (see Sect. 4.3) and well-developed staircases that progressively erode with distance from the center, can also apply to the Algerian Basin. The basin-scale survey by BGC-Argo floats pointed out a region of systematic staircase detection around the position 37∘45′ N, 5∘20′ E, extending west to the 4∘ E meridian and south to the 37∘20′ N parallel. In addition, the zonal transect of the cruise PEACETIME, although of coarse resolution, showed a well-developed vertical structure in this region (cast H; Fig. 7). Thermohaline staircases have been previously observed along the same zonal transect (Bryden et al., 2014). Thanks to biannual surveys at a higher spatial resolution, the authors reported the different layering aspects: well-ordered vertical structures around 4∘ E progressively eroded westwards and jumbled profiles in the eastern stations. More recently, glider surveys along 3 and 4∘ E have provided high-resolution synoptic observations of thermohaline staircases with a remarkable structural spatial continuity between the two layering aspects (Cotroneo et al., 2019). These reports are in agreement with the regionalization by staircase regimes proposed by Krahmann (1997): a region of inverted layers close to Sardinia where LIW enter the basin and flow northwards along the continental slope, farther west a region of well-ordered layering and then a westernmost region with “diffusively reduced” layers.
If DW play a role in the vertical extension (Sect. 4.1), the areal extent of thermohaline staircases appears to be controlled by LIW circulation features. In other terms, locally high LIW properties, originating either in the southeastern or in the southwestern Sardinian sectors, would drive a similar configuration for the two staircase regions to that organized around epicentral regions. Warmer and saltier LIW are brought by the eastern Mediterranean outflow into the Tyrrhenian Sea through the Strait of Sicily. Following Sparnocchia et al. (1999), the flow is made up of LIW at a 200–800 dbar depth and transitional DW down to a 1850 m depth. The authors argued that the mixing by a salt-fingering process acts when the bottom slope does not influence the flow anymore. On the other side of the Sardinian Channel, LIW flowing inside the Algerian Basin are warmer and saltier than the central Algerian waters. The saltier LIW circulate northwards along the continental slope, resulting in a density front from which interleaving layers are formed (Krahmann, 1997).
The influence of saltier LIW intrusions inside the adjoining basins can extend over large distances. In the case of the Tyrrhenian Sea, the deep circulation is weak enough that saltier LIW, progressively entrained cyclonically along the continental slope, affect the central basin through lateral intrusions (Zodiatis and Gasparini, 1996). In the case of the Algerian Basin, the eastern Algerian gyre, a component of the basin-scale barotropic cyclonic circulation (Testor et al., 2005), plays a stabilizing role for interleaving layers to take the form of thermohaline staircases and extend westwards up to the epicentral region. It is interesting to note that warmer and saltier LIW are found in the western part of the gyre (between 4 and 6∘ E) even though this area is farther from the inflow of Tyrrhenian LIW (Mallil et al., 2016). The anomaly is also present during the PEACETIME transect: cast H located in the western part of the gyre presents saltier LIW than cast I located in its eastern part (Fig. 7). This patch matches with the epicentral region where staircases become active and well-developed (Fig. 6). The origin of this patch can be inferred from specific mesoscale structures: the Sardinian eddies (anticyclones with a deep LIW core around a 600 dbar depth) that detach from the continental slope and evolve at the periphery of the eastern Algerian gyre (Testor and Gascard, 2005). As a result, saltier LIW transported by Sardinian eddies likely end up confined in the western part of the gyre with slightly modified properties. Float 6901513 was trapped three times inside Sardinian eddies. This is evidenced by the high anomalies of LIW properties (Fig. 9), and deeper LIW cores as profiles, truncated by the 1000 dbar profiling depth, show narrower temperature–salinity ranges (see Fig. 8). Two of these events (July 2013 and July 2014) were located in the northern part of the western Algerian gyre (39∘ N, 5–6∘ E); the third event (March–April 2015) was located along the eastern border of the basin.
4.3 Temporal continuity and water mass conversion
The temporal continuity of thermohaline staircases is the most challenging aspect to assess from observations. In the present study, the large time series collected by the BGC-Argo floats with a resolution of some days revealed the continuity of the layering pattern over months and years (Figs. 4, 8). As a result, adjustments of the vertical structures, or even their decay, have been documented at short timescales (some days) in response to changes in LIW properties (Figs. 5, 9). In the case of the Algerian Basin, these changes have been analyzed under the caveat of rapid float motions leading to spatial variations that may insert distortions (Figs. 10, 11). Thanks to the BGC-Argo deployments, thermohaline staircases are found to be long-lived in the Tyrrhenian Sea, in agreement with the early estimate of Molcard and Tait (1977), as well as in the Algerian Basin.
Quasi-permanent staircases are thought to be sites of thermohaline changes among continuous mixed layers, characterized according to two specific regimes and identified by lateral density ratios (RL; Eq. 3). In a first type of regime, thermohaline changes can take the form of intrusions of heat and salt spreading horizontally inside layers. This spatial regime is triggered and sustained by isopycnal stirring from a steady interleaving state (McDougall, 1985; Merryfield, 2000), which would lead to lateral density ratios close to 1 (Schmitt, 1994). Alternatively, thermohaline changes can take the form of slow temporal trends induced by the downward flux of heat and salt. In this type of regime, the lateral density ratio is identifiable by the convergence flux ratio that relates heat and salt fluxes across salt fingers (Schmitt, 1994). Observations often reveal a mixture of the two regimes (Schmitt et al., 1987); regardless, relative changes in layer properties can be documented either spatially with synoptic surveys or temporally with long-term records at fixed locations. Lateral density ratios derived from observations can be compared to theoretical models in order to identify whether isopycnal stirring or salt fingering is active. As shown in Sect. 3.2, the present estimations of lateral density ratios can be characteristic of one of the two regimes specifically, depending on the spatial or temporal limitations of the considered distributions.
To the best of our knowledge, the present BGC-Argo collection provides the first measurements for the western Mediterranean of lateral density ratios at interannual scales, with a temporal resolution ensuring the continuity of the layers. Lateral density ratios have been evaluated in the Tyrrhenian Sea (Zodiatis and Gasparini, 1996) as well as in the Algerian Basin (Krahmann, 1997) from synoptic field surveys. Their results are in agreement with the theoretical prediction of the spatial regime with values close to 1. An attempt to evaluate long-term trends using historical data has been proposed by Zodiatis and Gasparini (1996), but the fluctuations encountered in the vertical structure (Sect. 4.1) did not lead to reliable estimates of lateral density ratios within single and continuous layers. Falco et al. (2016) provided interannual trends of vertically averaged properties, which could also not give access to any estimate of lateral density ratios.
Layer temperature and salinity changes have been analyzed on both spatial and temporal scales using the BGC-Argo data. In the Tyrrhenian Sea, both floats drifted slowly in the southwest sector, moving progressively away from the epicentral region. An estimate of long-term trends would be affected by such slow motion, making it difficult to untangle them from spatial variations. Moreover, the upper vertical structure sampled by the floats (to 1000 dbar) is more likely affected by adjustments and inversions among layers because the eastern Mediterranean flow is preferentially injected in that depth range (Sparnocchia et al., 1999). As a result, the fluctuations are within the range of instrumental precision (0.01 in salinity); hence lateral density ratios have not been reported for the Tyrrhenian Sea in the present study.
The present study provided extensive and synoptic surveys of the Algerian Basin, with several pathways across the eastern Algerian gyre. In particular, the temporal coverage of the BGC-Argo deployments allowed the assessment of variations in layer properties, about 0.02 in salinity during the 4 years of acquisition, larger than the instrumental precision limit. The collection enabled the characterization of the main layers (3 and 4) and the largest steps (temperature–salinity interface differences larger than instrumental precision) of the vertical structure. The resulting distributions can be laid out in a temperature–salinity diagram as a superimposition of episodes marked by distinct segments with an overall trend, where the two regimes of water mass conversion appear untangled (Fig. 12). Lateral density ratios of 0.91 have been estimated from distributions limited to short episodes. This is in agreement with theoretical results of thermohaline changes driven by isopycnal intrusions (McDougall, 1985; Merryfield, 2000). In the western sector of the eastern Algerian gyre (epicentral region), the lateral density ratios dropped down to values in the range of 0.74 to 0.83 depending on layers. The gross lateral density ratio reaches an average value of 0.72 if the whole dataset is considered. These estimates compared to the theoretical flux ratios, equal to 1 for the isopycnal-stirring process and dropping down to 0.5–0.7 when salt fingering is active (Schmitt et al., 1987). The flux ratio predicted by the model of Radko and Smith (2012) is 0.60 using the bulk density ratio from the Algerian Basin (1.38). This result supports layering patterns by active salt fingering in the western sector of the eastern Algerian gyre.
4.4 Nitrate enrichment of LIW across the Tyrrhenian Sea
The nutrient pool below the surface productive zone is interconnected over the whole Mediterranean by its thermohaline circulation. LIW are thought to act as a conveyor belt that progressively accumulates nutrients from the eastern to the western basins of the Mediterranean Sea. During the cruise PEACETIME, LIW enrichment has been observed in particular across the Tyrrhenian Sea: nitrate concentrations increased by 2 µmol kg−1 within a 100 m thick layer (Figs. 1 and 13). Vertical transfer of nutrients through diffusion likely contributes to this enrichment: as a consequence of the presence of thermohaline staircases, the salt-fingering diffusivity is estimated to be about 3 times larger than the turbulent diffusivity reported by Ferron et al. (2017) in the depth range of 1000–2000 m, which is in agreement with the theoretical prediction of Hamilton et al. (1989). In addition, low-nutrient Ionian LIW flowing inside the Tyrrhenian Sea lead to a reversal and accentuation of the vertical gradient with DW (Fig. 13). As a result, based on the analysis of the PEACETIME dataset, the nitrate flux between DW and LIW is opposite to salt fluxes and contributes one-fourth of the nitrate supply inside LIW, while three-fourths of that nitrate supply is transferred from above LIW (Fig. 15). However, the cumulated vertical nutrient fluxes, reaching values of 10.9–39.3 µmol m−2 d−1 nitrate, are not sufficient to explain the observed increase in LIW nutrient concentrations in the Tyrrhenian Sea: the time necessary for vertical nitrate fluxes to balance the 2 µmol kg−1 increase is in the range of 14–60 years. This is not consistent with LIW residence times in the Tyrrhenian Sea, estimated to be a few years based on trajectories of MedArgo floats drifting at a 350 dbar depth (Poulain et al., 2007).
In addition to vertical diffusion, horizontal advection by large-scale circulation could also contribute to the observed modifications in nutrient content in the Tyrrhenian Sea. The Ionian inflow through the Strait of Sicily is bounded at a 200 dbar depth by the modified Atlantic water outflow. The depth of the sill at 480 m delineates its lower limit. As a consequence, the surface layer (above 200 dbar) is not influenced by the Ionian inflow; the deeper layer (below 500 dbar) is quickly and locally affected by the cascading of the dense Ionian waters that are modified by turbulent mixing with DW until they reach their level of equilibrium (between 500 and 1400 dbar; Sparnocchia et al., 1999). As evidenced in Figs. 13 and 14, only the layer between 200 and 500 dbar gradually changes in terms of large-scale properties with an increase in nutrient concentrations over the whole Tyrrhenian Sea. In this depth range, there is an overall agreement between the signature of Ionian LIW (the S-shape in the nitrate profiles; Fig. 14) and the pathway of LIW circulation (Krivosheya and Ovchinnikov, 1973; Astraldi and Gasparini, 1994). The strongest perturbations in nitrate concentrations are found in the southwestern sector (brown, red and blue circles; Fig. 14) corresponding to the branch of circulation between the Strait of Sicily and the Sardinian Channel. This pattern is eroded along the eastern Sardinian coast (red circles; Fig. 14) that corresponds to the LIW outflow. Note that the regional circulation scheme of Krivosheya and Ovchinnikov (1973) also reports inflow of Algerian waters in the surface layer along the southern border of the basin; the presence of this nutrient-rich water mass above LIW accentuates the contrast with nutrient-poor Ionian waters and the changes in nitrate concentrations reported in the southwestern sector of the Tyrrhenian Sea (Fig. 14b). An additional physical process that might contribute to LIW nutrient enrichment is the contribution of terrestrial inputs by isopycnal diffusion on the LIW horizons (400–500 dbar). These inputs might be transferred to the intermediate layer by the biological pump acting along the Tyrrhenian shelves, followed by advection through lateral intrusions that occur along the continental slope and feed the thermohaline staircase in the central part of the basin (Zodiatis and Gasparini, 1996; Sparnocchia et al., 1999).
The upward flux of nitrate to the surface layer estimated in the present study (420–700 µmol m2− d−1; Fig. 15) has the same order of magnitude as that measured during spring in the northwestern Mediterranean (Mouriño-Carballido et al., 2016); it corresponds to 11–20 gC m−2 yr−1 of new production. A rough estimate based on the increase in LIW nitrate concentrations of 2 µmol kg−1 in its passage through the southern Tyrrhenian Sea would lead to ∼30 gC m−2 yr−1 of new production, assuming a LIW transport of 1 Sv and a southern Tyrrhenian surface of 150 000 km2. These independent estimates are close to the 10 gC m−2 yr−1 of new production calculated from the phosphorus budget in the Tyrrhenian Sea (Béthoux, 1989). Annual carbon fixation rates, equivalent to total production, were estimated at 87 gC m−2 yr−1 from ocean color imagery in the Tyrrhenian Sea (Morel and André, 1991). To support the observed total production, nitrogen in LIW should turnover 5.4 times in the productive layer with a hypothetical f ratio of 0.18, in agreement with f-ratio values of other oligotrophic areas.
All this depicts a more complex scenario. Contrary to what one would expect based on the strong nutrient gradient between LIW and DW at the southeastern entrance of the basin, the nutrient pool accumulated by LIW is not the main fertilizer of the Tyrrhenian Sea. Instead primary production is supported by other sources, coastal or atmospheric, and possibly by inputs from the Algerian Basin. The latter are likely contributed by organic matter sinking from the layer above 100 dbar (Santinelli et al., 2018), given that existing data do not show significant inorganic nutrient concentrations in the surface along the Sardinian Channel (e.g., Astraldi et al., 2002). An additional source could be through entrainment from Algerian waters below the surface. These nutrients utilized within the basin are transferred to depths by the biological pump into the LIW and exported to the Algero-Provençal Basin, thereby compensating for the surface and deep inputs from the latter basin. Overall, the Tyrrhenian Sea acts as a remineralization basin and as a source of nutrients for the Algero-Provençal Basin rather than as a sink for nutrients originating in the eastern Mediterranean.
In this study, we report long-term observations of thermohaline staircases in two sites of the western Mediterranean, the Tyrrhenian Sea and the Algerian Basin, in association with their fine characterization carried out during the cruise PEACETIME. The staircases develop in the transition zone between LIW and DW, organized around epicentral regions. The epicentral regions are located inside large-scale circulation features that stabilize the influence of interleaving layers triggered by saltier LIW inflows. As observed in the Algerian Basin, epicentral regions are sites of active mixing, with changes in seawater properties of about +0.06 ∘C in temperature and +0.02 in salinity during the 4 years of observation. The dataset collected by profiling floats allowed for the measurement of in situ lateral density ratios over interannual scales, with a resolution ensuring the continuity of the layers among the vertical structure. These lateral density ratios have been analyzed in the view of theoretical predictions to identify and untangle salt fingering as a driver for water mass conversion and isopycnal diffusion as a driver for heat and salt transfers from the surrounding sources.
Thermohaline staircases constitute regimes of enhanced diapycnal diffusivity for inorganic nutrients. In addition to large-scale advection and isopycnal stirring, they actively contribute to the enrichment in nitrate of LIW across the Tyrrhenian Sea, in conjunction with the remineralization of particulate biogenic material produced at the surface or dissolved organic matter advected from the Algerian Basin and Tyrrhenian coastal areas. The respective role of these sources and processes in the nitrate enrichment of LIW has been first guessed at in the present study and dedicated studies would be required to address, in particular, nitrate accumulation in conjunction with apparent oxygen utilization along the LIW pathway and their agreement with the Redfield ratio. A more detailed picture of the long-term evolution of Tyrrhenian staircases and their interplay with nutrients will undoubtedly emerge with ongoing deployments of BGC-Argo floats carrying both nitrate and oxygen sensors.
As part of the International Argo Program and the CORIOLIS operational oceanography center, the floats data are freely and publicly available (https://doi.org/10.17882/42182, Argo, 2020).
VT, LP and FDO contributed to the experimental setup, data analysis and writing of the manuscript. MRA and EPV contribute to the analysis of nutrient data and review of the manuscript.
The authors declare that they have no conflict of interest.
This article is part of the special issue “Atmospheric deposition in the low-nutrient–low-chlorophyll (LNLC) ocean: effects on marine life today and in the future (ACP/BG inter-journal SI)”. It is not associated with a conference.
This study is a contribution to the PEACETIME project (http://peacetime-project.org, last access: 25 June 2020), a joint initiative of the MERMEX and CHARMEX components supported by CNRS-INSU, IFREMER, CEA and Météo-France as part of the program MISTRALS coordinated by INSU (https://doi.org/10.17600/17000300). Part of the dataset was acquired during the PEACETIME oceanographic expedition on board R/V Pourquoi Pas? in May–June 2017. We thank Sandra Helias Nunige, Joris Guittonneau and Patrick Raimbault for the sampling, analysis and inventory of nutrients during the cruise PEACETIME. We thank the principal investigators (PIs) of cruises MOOSE- GE, Laurent Coppola and Pierre Testor; the PI of the cruise VENUS2, Katrin Schroeder; and the PI of the cruise MedSeA, Patrizia Ziveri for allowing the deployment and recovery of the BGC-Argo floats. The captains and crew of R/V Tethys II (CNRS-INSU), R/V Pourquoi Pas? (Ifremer), R/V Angeles Alvariño (IEO) and R/V Urania (CNR) who participated in the deployments of the floats are also thanked. We are grateful to the two anonymous reviewers and Christine Klaas for their constructive and pertinent comments.
This study is a contribution to the following research projects: NAOS (funded by the Agence Nationale de la Recherche in the frame of the French Equipement d'Avenir program; grant no. ANR J11R107-F), remOcean (funded by the European Research Council; grant no. 246777) and BGC-Argo France (funded by CNES-TOSCA and LEFE-GMMC).
This paper was edited by Christine Klaas and reviewed by two anonymous referees.
Aminot, A. and Kerouel, R.: Dosage automatique des nutriments dans les eaux marines méthodes en flux continu, in: Méthodes d'analyse en milieu marin, Ifremer Editions, 25, Quae, 2007.
Argo: Argo float data and metadata from Global Data Assembly Centre (Argo GDAC), SEANOE, https://doi.org/10.17882/42182, 2020.
Astraldi, M. and Gasparini, G. P.: The seasonal characteristics of the circulation in the Tyrrhenian Sea, in: The seasonal and interannual variability of the western Mediterranean Sea, edited by: La Violette, P. E., Coastal and Estuarine Studies, Agu, Washington, 46, 115–134, 1994.
Astraldi, M., Conversano, F., Civitarese, G., Gasparini, G. P., Ribera d'Alcalà, M., and Vetrano, A.: Water mass properties and chemical signatures in the central Mediterranean region, J. Marine Syst., 33, 155–177, 2002.
Barbieux, M., Uitz, J., Gentili, B., Pasqueron de Fommervault, O., Mignot, A., Poteau, A., Schmechtig, C., Taillandier, V., Leymarie, E., Penkerc'h, C., D'Ortenzio, F., Claustre, H., and Bricaud, A.: Bio-optical characterization of subsurface chlorophyll maxima in the Mediterranean Sea from a Biogeochemical-Argo float database, Biogeosciences, 16, 1321–1342, https://doi.org/10.5194/bg-16-1321-2019, 2019.
Béthoux, J.-P.: Oxygen consumption, new production, vertical advection and environmental evolution in the Mediterranean Sea, Deep-Sea Res., 36, 769–781, 1989.
Béthoux, J. P., Morin, P., Chaumery, C., Connan, O., Gentili, B., and Ruiz-Pino, D.: Nutrients in the Mediterranean Sea, mass balance and statistical analysis of concentrations with respect to environmental change, Mar. Chem., 63, 155–169, 1998.
Biogeochemical-Argo Planning Group: The Scientific Rationale, Design and Implementation Plan for a Biogeochemical-Argo Float Array (Report), Issy-les-Moulineaux, Ifremer, 2016.
Bouffard, D. and Boegman, L: A diapycnal diffusivity model for stratified environmental flows, Dynam. Atmos. Oceans, 61–62, 14–34, 2013.
Bryden, H., Schroeder, K., Sparnocchia, S., Borghini, M., and Vetrano, A.: Thermohaline staircases in the western Mediterranean Sea, J. Mar. Res., 72, 1–18, 2014.
Buffett, G. G., Krahmann, G., Klaeschen, D., Schroeder, K., Sallarès, V., Papenberg, C., Ranero, C. R., and Zitellini, N.: Seismic oceanography in the Tyrrhenian Sea: thermohaline staircases, eddies, and internal waves, J. Geophys. Res., 122, 8503–8523, https://doi.org/10.1002/2017JC012726, 2017.
Cotroneo, Y., Aulicino, G., Ruiz, S., Sánchez Román, A., Torner Tomàs, M., Pascual, A., Fusco, G., Heslop, E., Tintoré, J., and Budillon, G.: Glider data collected during the Algerian Basin Circulation Unmanned Survey, Earth Syst. Sci. Data, 11, 147–161, https://doi.org/10.5194/essd-11-147-2019, 2019.
Cuypers, Y., Bouruet-Aubertot, P., Marec, C., and Fuda, J.-L.: Characterization of turbulence from a fine-scale parameterization and microstructure measurements in the Mediterranean Sea during the BOUM experiment, Biogeosciences, 9, 3131–3149, https://doi.org/10.5194/bg-9-3131-2012, 2012.
Dillon, T. M.: Vertical overturns: a comparison of Thorpe and Ozmidov length scales, J. Geophys. Res., 87, 9601–9613, 1982.
D'Ortenzio, F. and Ribera d'Alcalà, M.: On the trophic regimes of the Mediterranean Sea: a satellite analysis, Biogeosciences, 6, 139–148, https://doi.org/10.5194/bg-6-139-2009, 2009.
D'Ortenzio F., Taillandier, V., Claustre, H., Prieur, L., Leymarie, E., Mignot, A., Poteau, A., Penkerc'h, C., and Schmechtig, C.: Biogeochemical Argo: the test case of the NAOS Mediterranean array, Front. Mar. Sci., 7, 120, https://doi.org/10.3389/fmars.2020.00120, 2020.
Durante, S., Schroeder, K., Mazzei, L., Pierini, S., Borghini, M., and Sparnocchia, S.: Permanent thermohaline staircases in the Tyrrhenian Sea, Geophys. Res. Lett., 46, 1562–1570, 2019.
Falco, P., Trani, M., and Zambianchi, E.: Water mass structure and deep mixing processes in the Tyrrhenian Sea: results from the VECTOR project, Deep-Sea Res. Pt. I, 113, 7–21, 2016.
Fernandez-Castro, B., Mourino-Carballido, B., Maranon, E., Choucino, P., Gago, J., Ramirez, T., Vidal, M., Bode, A., Blasco, D., Royer, S. J., Estrada, M., and Simo, R.: Importance of salt fingering for new nitrogen supply in the oligotrophic ocean, Nat. Commun., 6, 8002, https://doi.org/10.1038/ncomms9002, 2015.
Ferron, B., Bouruet Aubertot, P., Cuypers, Y., Schroeder, K., and Borghini, M.: How important are diapycnal mixing and geothermal heating for the deep circulation of the Western Mediterranean?, Geophys. Res. Lett., 44, 7845–7854, 2017.
Gasparini, G. P., Ortona, A., Budillon, G., Astraldi, M., and Sansone, E.: The effect of the Eastern Mediterranean Transient on the hydrographic characteristics in the strait of Sicily and in the Tyrrhenian Sea, Deep-Sea Res. Pt. I, 52, 915–935, 2005.
Guieu, C. and Desboeufs, K.: PEACETIME cruise, RV Pourquoi Pas?, LEFE CYBER Database (PROOF/DataBase/CS), https://doi.org/10.17600/17000300, 2017.
Guieu, C., D'Ortenzio, F., Dulac, F., Taillandier, V., Doglioli, A., Petrenko, A., Barrillon, S., Mallet, M., Nabat, P., and Desboeufs, K.: Process studies at the air-sea interface after atmospheric deposition in the Mediterranean Sea: objectives and strategy of the PEACETIME oceanographic campaign (May–June 2017), Biogeosciences Discuss., https://doi.org/10.5194/bg-2020-44, in review, 2020.
Hamilton, J. M., Lewis, M. R., and Ruddick, B. R.: Vertical fluxes of nitrate associated with salt fingers in the world's oceans, J. Geophys. Res., 94, 2137–2145, 1989.
Jambu, M.: Fortran IV computer program for rapid hierarchical classification of large data sets, Comput. Geosci., 7, 297–310, 1981.
Johnson, K. S. and Coletti, L. J.: In situ ultraviolet spectrophotometry for high resolution and long-term monitoring of nitrate, bromide and bisulfide in the ocean, Deep-Sea Res. Pt. I, 49, 1291–1305, 2002.
Keraghel, M., Louanchi, F., Zerrouki, M., Ait Kaci, M., Aït-Ameur, N., Labaste, M., Legoff, H., Taillandier, V., Harid, R., and Mortier, L.: Carbonate system properties and anthropogenic carbon inventory in the Algerian Basin during SOMBA cruise (2014): acidification rate estimate, Mar. Chem., 221, 103783, https://doi.org/10.1016/j.marchem.2020.103783, 2020.
Krahmann, G.: Horizontal variability of thermohaline staircases in the western Mediterranean, Double-Diffusive Processes, 1996 Summer Study Program in: Geophysical Fluid Dynamics, edited by: Meacham, S. and Tucholke, D., Woods Hole Oceanographic Institution, Technical Report WHOI-97-10, 331–347, 1997.
Kress, N., Manca, B. B., Klein, B., and Deponte, D.: Continuing influence of the changed thermohaline circulation in the eastern Mediterranean on the distribution of dissolved oxygen and nutrients: Physical and chemical characterization of the water masses, J. Geophys. Res.-Oceans, 108, 8109, https://doi.org/10.1029/2002JC001397, 2003.
Krivosheya, V. G. and Ovchinnikov, I. M.: Pecularities in the geostrophic circulation of the waters of the Tyrrhenian Sea, Oceanology, 13, 822–827, 1973.
Large, W. G., McWilliams, J. C., and Doney, S. C.: Oceanic vertical mixing: a review and a model with a nonlocal boundary layer parameterization, Rev. Geophys., 32, 363–403, 1994.
Lascaratos, A., Roether, W., Nittis, K., and Klein, B.: Recent changes in deep water formation and spreading in the eastern Mediterranean Sea: a review, Prog. Oceanogr., 44, 5–36, 1999.
Lavigne, H., D'Ortenzio, F., Migon, C., Claustre, H., Testor, P., Ribera d'Alcalà, M., Lavezza, R., Houpert, L., and Prieur, L.: Enhancing the comprehension of mixed layer depth control on the Mediterranean phytoplankton phenology, J. Geophys. Res., 118, 3416–3430, 2013.
Mallil, K., Testor, P., Le Goff, H., Mortier, L., Taillandier, V., Ait Ameur, N., Louanchi, F., and Labaste, M.: Hydrologie et circulation océanique dans le gyre est et ouest du bassin Algérien, Rapport de la Commission Internationale de la Mer Méditerranée, 41, 86, 2016.
McDougall, T. J.: Double-diffusive interleaving. Part II: finite amplitude, steady state interleaving, J. Phys. Oceanogr., 15, 1542–1556, 1985.
MEDOC Group: Observation of Formation of Deep Water in the Mediterranean Sea, 1969, Nature, 227, 1037, https://doi.org/10.1038/2271037a0, 1970.
Merryfield, W. J.: Origin of thermohaline staircases, J. Phys. Oceanogr., 30, 1046–1068, 2000.
Molcard, R. and Tait, R. I.: The steady state of the step structure in the Tyrrhenian Sea, In: A voyage of discovery: George Deacon seventieth anniversary volume, edited by: Angel, M., Pergamon Press, New York, 221–233, 1977.
Morel, A. and André, J. M.: Pigment distribution and primary production in the western Mediterranean as derived and modeled from coastal zone color scanner observations, J. Geophys. Res.-Oceans, 96, 12685–12698, 1991.
Mortier, L., Aït Ameur, N., and Taillandier, V.: SOMBA-GE-2014 cruise, RV Téthys II, https://doi.org/10.17600/14007500, 2014.
Mouriño-Carballido, B., Hojas, E., Cermeño, P., Chouciño, P., Fernández-Castro, B., Latasa, M., Marañón, E., Morán, X. A. G., and Vidal, M.: Nutrient supply controls picoplankton community structure during three contrasting seasons in the northwestern Mediterranean Sea, Mar. Ecol.-Prog. Ser., 543, 1–19, 2016.
Nittis, K. and Lascaratos, A.: Intermediate water formation in the Levantine Sea: the response to interannual variability of atmospheric forcing, in: The eastern Mediterranean as a laboratory basin for the assessment of contrasting ecosystems, Springer, Dordrecht, 441–446, 1999.
Omand, M. M. and Mahadevan, A.: The shape of the oceanic nitracline, Biogeosciences, 12, 3273–3287, https://doi.org/10.5194/bg-12-3273-2015, 2015.
Onken, R. and Brembilla E.: Double diffusion in the Mediterranean Sea: observation and parameterization of salt finger convection, J. Geophys. Res., 108, 8124, https://doi.org/10.1029/2002JC001349, 2003.
Osborn, T. R.: Estimates of local rate of vertical diffusion from dissipation measurements, J. Phys. Oceanogr., 10, 83–89, 1980.
Park, Y.-H., Lee, J.-H., Durand, I., and Hong, C.-S.: Validation of Thorpe-scale-derived vertical diffusivities against microstructure measurements in the Kerguelen region, Biogeosciences, 11, 6927–6937, https://doi.org/10.5194/bg-11-6927-2014, 2014.
Pasqueron de Fommervault, O., D'Ortenzio, F., Mangin, M., Serra, R., Migon, C., Claustre, H., Lavigne, H., Ribera d'Alcalà, M., Prieur, L., Taillandier, V., Schmechtig, C., Poteau, A., Leymarie, E., Besson, F., and Obolensky, G.: Seasonal variability of nutrient concentrations in the Mediterranean Sea: Contribution of Bio-Argo floats, J. Geophys. Res.-Oceans, 120, https://doi.org/10.1002/2015JC011103, 2015.
Poulain, P.-M., Barbanti, R., Font, J., Cruzado, A., Millot, C., Gertman, I., Griffa, A., Molcard, A., Rupolo, V., Le Bras, S., and Petit de la Villeon, L.: MedArgo: a drifting profiler program in the Mediterranean Sea, Ocean Sci., 3, 379–395, https://doi.org/10.5194/os-3-379-2007, 2007.
Prieur, L., Béthoux, J. P., Bong, J. H., and Taillez, D.: Particularités hydrologiques et formation d'eau profonde dans le bassin Liguro-Provençal en 1981–1982, Rapport de la Commission Internationale de la Mer Méditerranée, 28, 51–53, 1983.
Pujo-Pay, M., Conan, P., Oriol, L., Cornet-Barthaux, V., Falco, C., Ghiglione, J.-F., Goyet, C., Moutin, T., and Prieur, L.: Integrated survey of elemental stoichiometry (C, N, P) from the western to eastern Mediterranean Sea, Biogeosciences, 8, 883–899, https://doi.org/10.5194/bg-8-883-2011, 2011.
Radko, T.: What determines the thickness of layers in a thermohaline staircase?, J. Fluid Mech., 523, 79–98, 2005.
Radko, T. and Smith, D. P.: Equilibrium transport in double-diffusive convection, J. Fluid Mech., 692, 5–27, 2012.
Radko, T., Flanagan, J. D., Stellmach, S., and Timmermans, M. L.: Double-diffusive recipes. Part 2: Layer-merging events, J. Phys. Oceanogr., 44, 1285–1305, 2014.
Ribera d'Alcalà, M., Civitarese, G., Conversano, F., and Lavezza, R.: Nutrient ratios and fluxes hint at overlooked processes in the Mediterranean Sea, J. Geophys. Res.-Oceans, 108, 8106, https://doi.org/10.1029/2002JC001650, 2003.
Roether, W., Klein, B., Manca, B. B., Theocharis, A., and Kioroglou, S.: Transient Eastern Mediterranean deep waters in response to the massive dense-water output of the Aegean Sea in the 1990s, Prog. Oceanogr., 74, 540–571, 2007.
Sakamoto, C. M., Johnson, K. S., and Coletti, L. J.: Improved algorithm for the computation of nitrate concentrations in sea- water using an in situ ultraviolet spectrophotometer, Limnol. Oceanogr.-Meth., 7, 132–143, 2009.
Santinelli, C., Iacono, R., Napolitano, E., and Ribera d'Alcalá, M.: Surface transport of DOC acts as a trophic link among Mediterranean sub-basins, Biogeosciences Discuss., https://doi.org/10.5194/bg-2018-418, 2018.
Schmitt, R. W.: Form of the temperature-salinity relationship in the Central Water: evidence for double-diffusive mixing, J. Phys. Oceanogr., 11, 1015–1026, 1981.
Schmitt, R. W.: Double diffusion in oceanography, Annu. Rev. Fluid Mech., 26, 255–285, 1994.
Schmitt, R. W., Perkins, H., Boyd, J. D., and Stalcup, C.: C-SALT: an investigation of the thermohaline staircase in the western tropical North Atlantic, Deep-Sea Res., 34, 1655–1665, 1987.
Send, U. and Testor, P.: Direct observations reveal the deep circulation of the western Mediterranean Sea, J. Geophys. Res.-Oceans, 122, 10091–10098, https://doi.org/10.1002/2016JC012679, 2017.
Sparnocchia, S., Gasparini, G. P., Astraldi, M., Borghini, M., and Pistek, P.: Dynamics and mixing of the Eastern Mediterranean outflow in the Tyrrhenian basin, J. Mar. Syst., 20, 301–317, 1999.
Stern, M. E.: The “Salt-Fountain” and Thermohaline Convection, Tellus, 12, 172–175, 1960.
Stern, M. E. and Turner, J. S.: Salt fingers and convecting layers, Deep-Sea Res., 16, 497–511, 1969.
Taillandier, V., Wagener, T., D'Ortenzio, F., Mayot, N., Legoff, H., Ras, J., Coppola, L., Pasqueron de Fommervault, O., Schmechtig, C., Diamond, E., Bittig, H., Lefevre, D., Leymarie, E., Poteau, A., and Prieur, L.: Hydrography and biogeochemistry dedicated to the Mediterranean BGC-Argo network during a cruise with RV Tethys 2 in May 2015, Earth Syst. Sci. Data, 10, 627–641, https://doi.org/10.5194/essd-10-627-2018, 2018.
Testor, P. and Gascard, J. C.: Large scale flow separation and mesoscale eddy formation in the Algerian Basin, Prog. Oceanogr., 66, 211–230, 2005.
Testor, P., Send, U., Gascard, J. C., Millot, C., Taupier-Letage, I., and Beranger, K.: The mean circulation of the southwestern Mediterranean Sea: Algerian Gyres, J. Geophys. Res., 110, C110017, https://doi.org/10.1029/2004JC002861, 2005.
Testor, P., Le Goff, H., Labaste, M., Coppola, L., Mortier, L., Taillandier, V., Dausse, D., Kunesch, S., Diamond-Riquier, E., Garcia, N., Durrieu de Madron, X., and Raimbault, P.: MOOSE-GE, https://doi.org/10.18142/235, 2010.
The LIWEX Group: Levantine basin – A laboratory for multiple water mass formation processes, J. Geophys. Res., 108, 8101, https://doi.org/10.1029/2002JC001643, 2003.
Williams, R. G. and Follows, M. J.: Physical transport of nutrients and the maintenance of biological production, in: Ocean Biogeochemistry, edited by: Fasham, M. J. R., Global Change – The IGBP Series, Springer, Berlin, Heidelberg, 2003.
Wong, A., Keeley, R., Carval, T., and the Argo Data Management Team: Argo Quality Control Manual for CTD and Trajectory Data, https://doi.org/10.13155/33951, 2019.
Wüst, G.: On the vertical circulation of the Mediterranean Sea, J. Geophys. Res., 66, 3261–3271, 1961.
Ziveri, P. and Grelaud, M.: Physical oceanography during Ángeles Alvariño cruise MedSeA2013, Universitat Autònoma de Barcelona, PANGAEA, https://doi.org/10.1594/PANGAEA.846067, 2015.
Zodiatis, G. and Gasparini, G. P.: Thermohaline staircase formations in the Tyrrhenian Sea, Deep-Sea Res. Pt. I, 43, 655–678, 1996.
Zunino, P., Schroeder, K., Vargas-Yáñez, M., Gasparini, G. P., Coppola, L., García-Martínez, M. C., and Moya-Ruiz, F.: Effects of the Western Mediterranean Transition on the resident water masses: pure warming, pure freshening and pure heaving, J. Mar. Syst., 96–97, 15–23, 2012.