the Creative Commons Attribution 4.0 License.
the Creative Commons Attribution 4.0 License.
 | 23 Jul 2020
Organic carbon characteristics in ice-rich permafrost in alas and Yedoma deposits, central Yakutia, Siberia
Guido Grosse
Mathias Ulrich
Lutz Schirrmeister
Alexander N. Fedorov
Pavel Y. Konstantinov
Matthias Fuchs
Loeka L. Jongejans
Juliane Wolter
Thomas Opel
Jens Strauss
Permafrost ground is one of the largest repositories of terrestrial organic carbon and might become or already is a carbon source in response to ongoing global warming. With this study of syngenetically frozen, ice-rich and organic carbon (OC)-bearing Yedoma and associated alas deposits in central Yakutia (Republic of Sakha), we aimed to assess the local sediment deposition regime and its impact on permafrost carbon storage. For this purpose, we investigated the Yukechi alas area (61.76495∘ N, 130.46664∘ E), which is a thermokarst landscape degrading into Yedoma in central Yakutia. We retrieved two sediment cores (Yedoma upland, 22.35 m deep, and alas basin, 19.80 m deep) in 2015 and analyzed the biogeochemistry, sedimentology, radiocarbon dates and stable isotope geochemistry. The laboratory analyses of both cores revealed very low total OC (TOC) contents (<0.1 wt %) for a 12 m section in each core, whereas the remaining sections ranged from 0.1 wt % to 2.4 wt % TOC. The core sections holding very little to no detectable OC consisted of coarser sandy material were estimated to be between 39 000 and 18 000 BP (years before present) in age. For this period, we assume the deposition of organic-poor material. Pore water stable isotope data from the Yedoma core indicated a continuously frozen state except for the surface sample, thereby ruling out Holocene reworking. In consequence, we see evidence that no strong organic matter (OM) decomposition took place in the sediments of the Yedoma core until today. The alas core from an adjacent thermokarst basin was strongly disturbed by lake development and permafrost thaw. Similar to the Yedoma core, some sections of the alas core were also OC poor (<0.1 wt %) in 17 out of 28 samples. The Yedoma deposition was likely influenced by fluvial regimes in nearby streams and the Lena River shifting with climate. With its coarse sediments with low OC content (OC mean of 5.27 kg m−3), the Yedoma deposits in the Yukechi area differ from other Yedoma sites in North Yakutia that were generally characterized by silty sediments with higher OC contents (OC mean of 19 kg m−3 for the non-ice wedge sediment). Therefore, we conclude that sedimentary composition and deposition regimes of Yedoma may differ considerably within the Yedoma domain. The resulting heterogeneity should be taken into account for future upscaling approaches on the Yedoma carbon stock. The alas core, strongly affected by extensive thawing processes during the Holocene, indicates a possible future pathway of ground subsidence and further OC decomposition for thawing central Yakutian Yedoma deposits.
- Article
(17403 KB) - Full-text XML
-
Supplement
(8992 KB) - BibTeX
- EndNote


Permafrost deposits represent one of the largest terrestrial carbon reservoirs. Perennial freezing largely prevents decomposition and preserves organic material. These permafrost soil conditions are found in the ground of approximately one-quarter of the Northern Hemisphere's land surface (Zhang et al., 1999). The estimated amount of frozen and unfrozen carbon stored in the terrestrial permafrost region is 1330 to 1580 Gt (Hugelius et al., 2014; Schuur et al., 2015), which is approximately 45 % more than what is currently present in the atmosphere (∼864 Gt, based on 407 ppm CO2 measured in 2018; Ballantyne et al., 2012; Friedlingstein et al., 2019). Permafrost aggregation and conservation is highly dependent on long-term climatic conditions, both directly via air temperature and indirectly by the presence or absence of insulating vegetation and snow cover (Johansson et al., 2013). Currently, these permafrost conditions are under threat from rapidly increasing global and in particular Arctic air temperatures that have resulted in widespread permafrost warming in recent years (Biskaborn et al., 2019). Gradual permafrost losses of up to 70 % are expected in the uppermost 3 m by 2100 in a business-as-usual climate scenario (Chadburn et al., 2017; IPCC, 2019) or at even greater depths if deep thermokarst-induced rapid thaw is taken into account (Nitzbon et al., 2020), while rapid permafrost thaw is not considered at all (Turetsky et al., 2020).
A special type of permafrost is the Yedoma ice complex deposit (in the following referred to as Yedoma), which is formed syngenetically by late Pleistocene deposition of fine-grained sediments with large volumes of ground ice. Yedoma is ice-rich (50–90 vol %, volume percent, ice) and usually has organic carbon contents of 2–4 wt % (weight percent) with an estimated deposit thickness of up to 40 m (Schirrmeister et al., 2013; Strauss et al., 2013). In central Yakutia, the cryostratigraphic characteristics of these syngenetic Late Pleistocene deposits have been previously studied by various researchers (Soloviev, 1959; Katasonov and Ivanov, 1973; Katasonov, 1975; Péwé et al., 1977; Péwé and Journaux, 1983). In the context of global climate change, such a high ice content, with intrasedimental ice and syngenetic ice wedges, renders Yedoma deposits highly vulnerable to thaw-induced landscape changes (Schirrmeister et al., 2013) and ground volume loss causing surface subsidence. Thawing leads to ground subsidence which is often associated with thaw lake development (Grosse et al., 2013). Thaw lake development, surface subsidence, lake drainage and refreezing of the sediments result in a thermokarst basin landform called alas in central Yakutia (Soloviev, 1973). During these thermokarst processes, the organic material stored within the permafrost becomes exposed to decomposition in the thaw bulbs (taliks) underneath the thermokarst lakes. It is subsequently released into the atmosphere as a result of microbial activity in unfrozen and aquatic conditions in the form of gases such as carbon dioxide or methane, amplifying global climate change (Schuur et al., 2008). After a lake drainage event, the resulting thermokarst deposits in the alas basins refreeze, and the remaining Pleistocene soil carbon, as well as carbon from new plant biomass forming in thermokarst lakes and basins, becomes protected from decomposition again. The occurrence of these draining and refreezing processes can usually be determined by the higher carbon content compared with the adjacent deposits (Strauss et al., 2013).
The resulting landscape patterns of Yedoma uplands and alas basins form a heterogeneous landscape mosaic (Morgenstern et al., 2011). The heterogeneity and carbon characteristics within these deposit types, especially below 3 m, are still poorly studied, as only very few studies examining long Siberian permafrost cores have been conducted (Zimov et al., 2006; Strauss et al., 2013; Shmelev et al., 2017). Studies from this area mostly examine natural Yedoma exposures such as the Batagay mega thaw slump (Ashastina et al., 2017). In central Yakutia, several permafrost studies have been conducted, especially on thermokarst processes, related surface dynamics and temperature changes (Fedorov and Konstantinov, 2003; Ulrich et al., 2017a, b, 2019). Other studies have shown a direct relation between dense vegetation cover and low permafrost carbon storage due to warmer permafrost conditions as a result of ground insulation (Siewert et al., 2015). Hugelius et al. (2014) estimate the carbon stock in the circumpolar permafrost region to be approximately 822 Gt of carbon. However, despite the still high vulnerability of deeper deposits to thaw by thermokarst and thermo-erosion (Turetsky et al., 2019), very few studies have reported organic carbon characteristics for permafrost deposits deeper than 3 m. This lack of data results in very high uncertainties regarding the impact of deep thaw in ice-rich permafrost regions and the consequences for the carbon cycle (Kuhry et al., 2020).
By investigating deeper permafrost sediments in the continuous permafrost region of central Yakutia, we aimed to understand the processes involved in organic carbon deposition and reworking in the Yedoma and thermokarst deposits of this fast changing permafrost landscape (Nitze et al., 2018).
Our main research questions were as follows:
-
What sedimentological processes have influenced the carbon stocks found in the Yedoma and alas deposits of the Yukechi area?
-
How did the sedimentological processes affect the local carbon storage?
The Yukechi alas landscape (61.76495∘ N; 130.46664∘ E) covers an area of approximately 1.4 km2 and is located on the Abalakh Terrace (∼200 m above sea level) in the Lena–Aldan interfluve of central Yakutia (Fig. 1a; Ulrich et al., 2019). It is characterized by Yedoma uplands and drained alas basins, indicating active thermokarst processes (Fedorov and Konstantinov, 2003). Yedoma deposits cover 66.4 % of the area. The lakes cover about 13.0 % of the Yukechi alas landscape, and approximately 20.6 % of the area consists of basins covered by grasslands, which contain alas deposits (Fig. S1 in the Supplement).
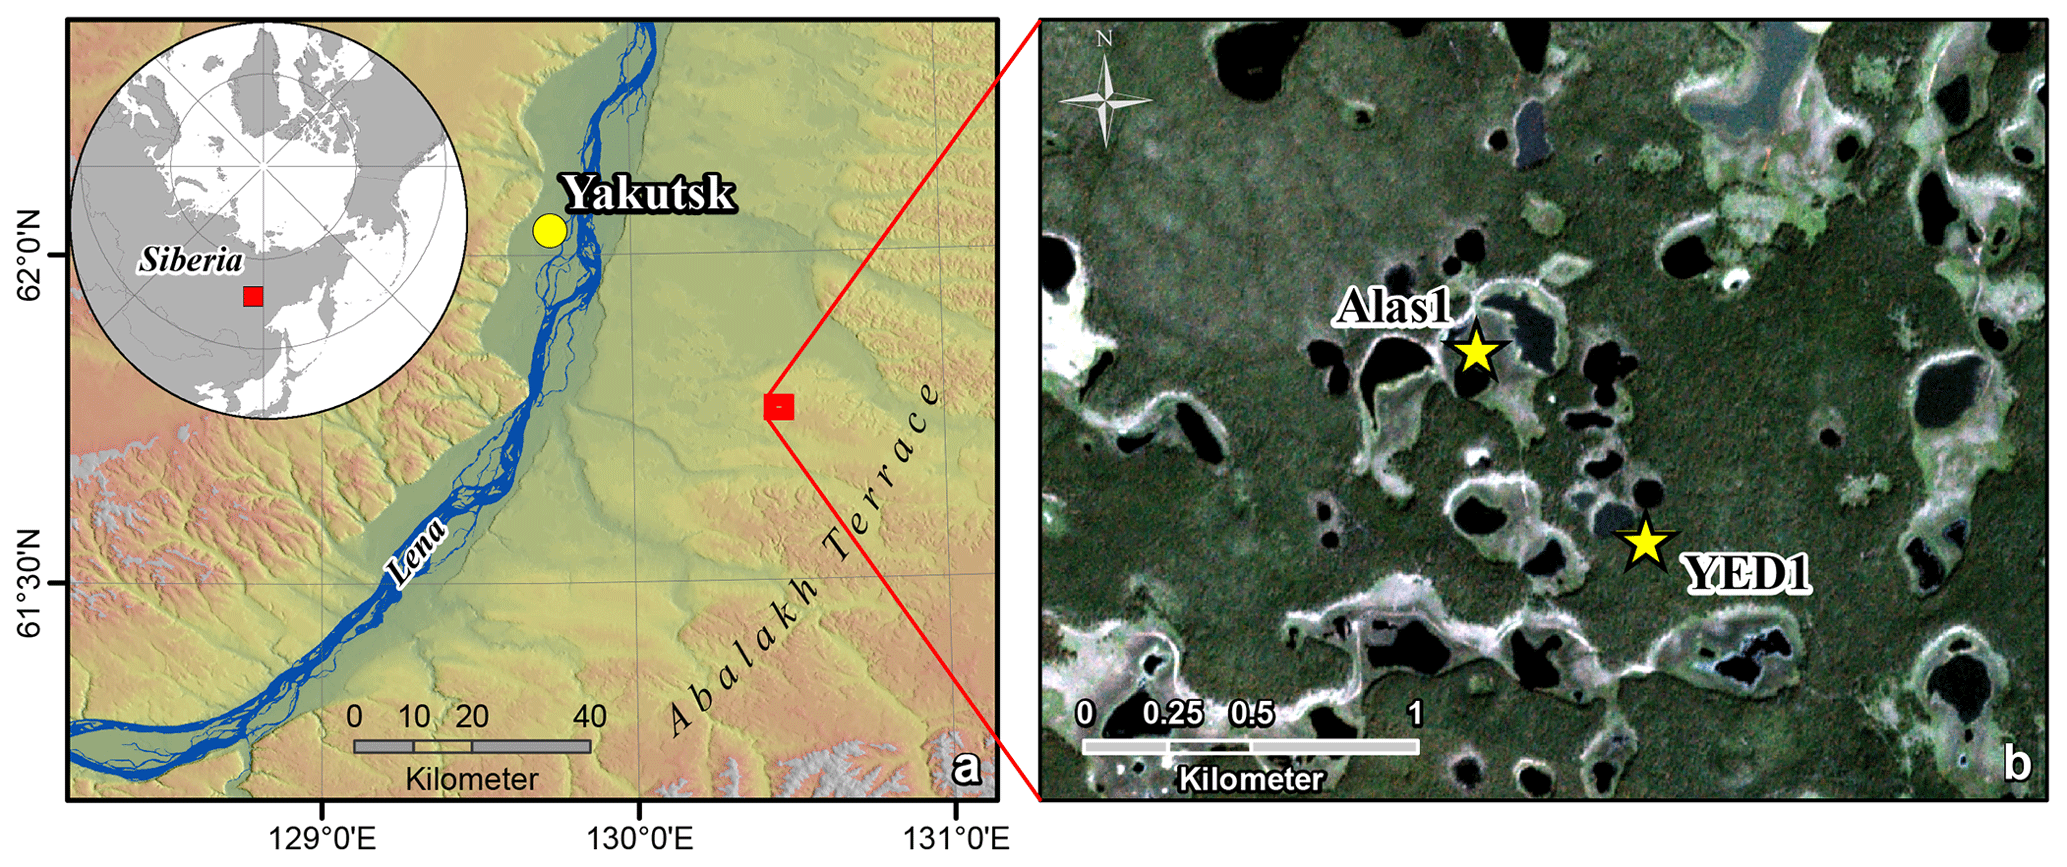
Figure 1Study site overview: (a) location of the Yukechi alas study site in central Yakutia on the edge of the Abalakh Terrace (circumpolar digital elevation model, Santoro and Strozzi, 2012); (b) locations of the Alas1 and the YED1 coring sites within the Yukechi alas landscape (Planet Ortho Tile, acquisition date: 7 July 2018; Planet Team, 2017).
Today, central Yakutia is characterized by an extreme continental subpolar climate regime with very low winter air temperatures down to minima of −63 ∘C in January (Nazarova et al., 2013). Holocene summer climate reconstructions indicate climate settings with slightly colder conditions (TJuly for 10 000–8000 BP and 4800–0 BP is 15.6±0.7 ∘C) compared with modern climate (TJuly is 16.6–17.5 ∘C) and a mid–Holocene warming phase between about 6000 and 4500 BP (TJuly∼1.5 ∘C higher than the present) (Nazarova et al., 2013; Ulrich et al., 2017b). The contemporary mean annual air temperature in central Yakutia (measured at Yakutsk Meteorological Station) is −9.7 ∘C. The modern active layer thickness in central Yakutia is approximately 1.5 m, but it can be thicker in grasslands, such as within alas basins (about 2 m or more), and thinner below the taiga forest (less than 1 m) (Fedorov, 2006). For the Yukechi alas deposits, the active layer depth can be estimated at around 2 m and, therefore, reaches down into an observed talik, following Fedorov (2006). Taliks form because of a recent or already drained lake that prevented winter freezing or due to an incomplete refreezing of the active layer.
The Yedoma deposits in this region can be more than 30 m thick, as has already been shown by older Russian works (Soloviev, 1959, 1973). Lakes are found in partially drained basins as well as on the surrounding Yedoma uplands (Fig. 1b). The land surface within the alas basins is covered by grasslands, whereas the boreal forest found on the Yedoma uplands mainly consists of Larix cajanderi with several Pinus sylvestris communities (Kuznetsova et al., 2010; Ulrich et al., 2017b). Central Yakutian alas landscapes are characterized by extensive land use, which mainly consists of horse and cattle herding and hay farming (Crate et al., 2017).
Lake dynamics have been monitored at the Yukechi alas study site for several decades by the Melnikov Permafrost Institute in Yakutsk (Bosikov, 1998; Fedorov and Konstantinov, 2003; Ulrich et al., 2017a) and have been partially linked to local land use (Crate et al., 2017).
3.1 Field work
Field work took place in March 2015 during a joint Russian–German drilling expedition. Two long permafrost sediment cores were obtained: one from Yedoma deposits and one from the adjacent drained Yukechi alas basin (Fig. 1b). The surface of the alas sample site (61.76490∘ N, 130.46503∘ E; h=209 m above sea level) is located approximately 9 m lower than the surface of the sampled Yedoma site (61.75967∘ N, 130.47438∘ E; h=218 m above sea level) (Fig. 2). The distance between the two coring locations is 765 m. Both cores were drilled from dry land surface, kept frozen and sent to Potsdam, Germany, for laboratory analysis. The Yedoma core (YED1) reached a depth of 2235 cm b.s. and includes an ice wedge section from approximately 700 to 950 cm b.s. A talik section, due to an incompletely refrozen active layer, was identified between 100 and 200 cm b.s. The alas core (Alas1) reached 1980 cm b.s. A talik section was found in the alas core reaching from approximately 160 down to 750 cm b.s.
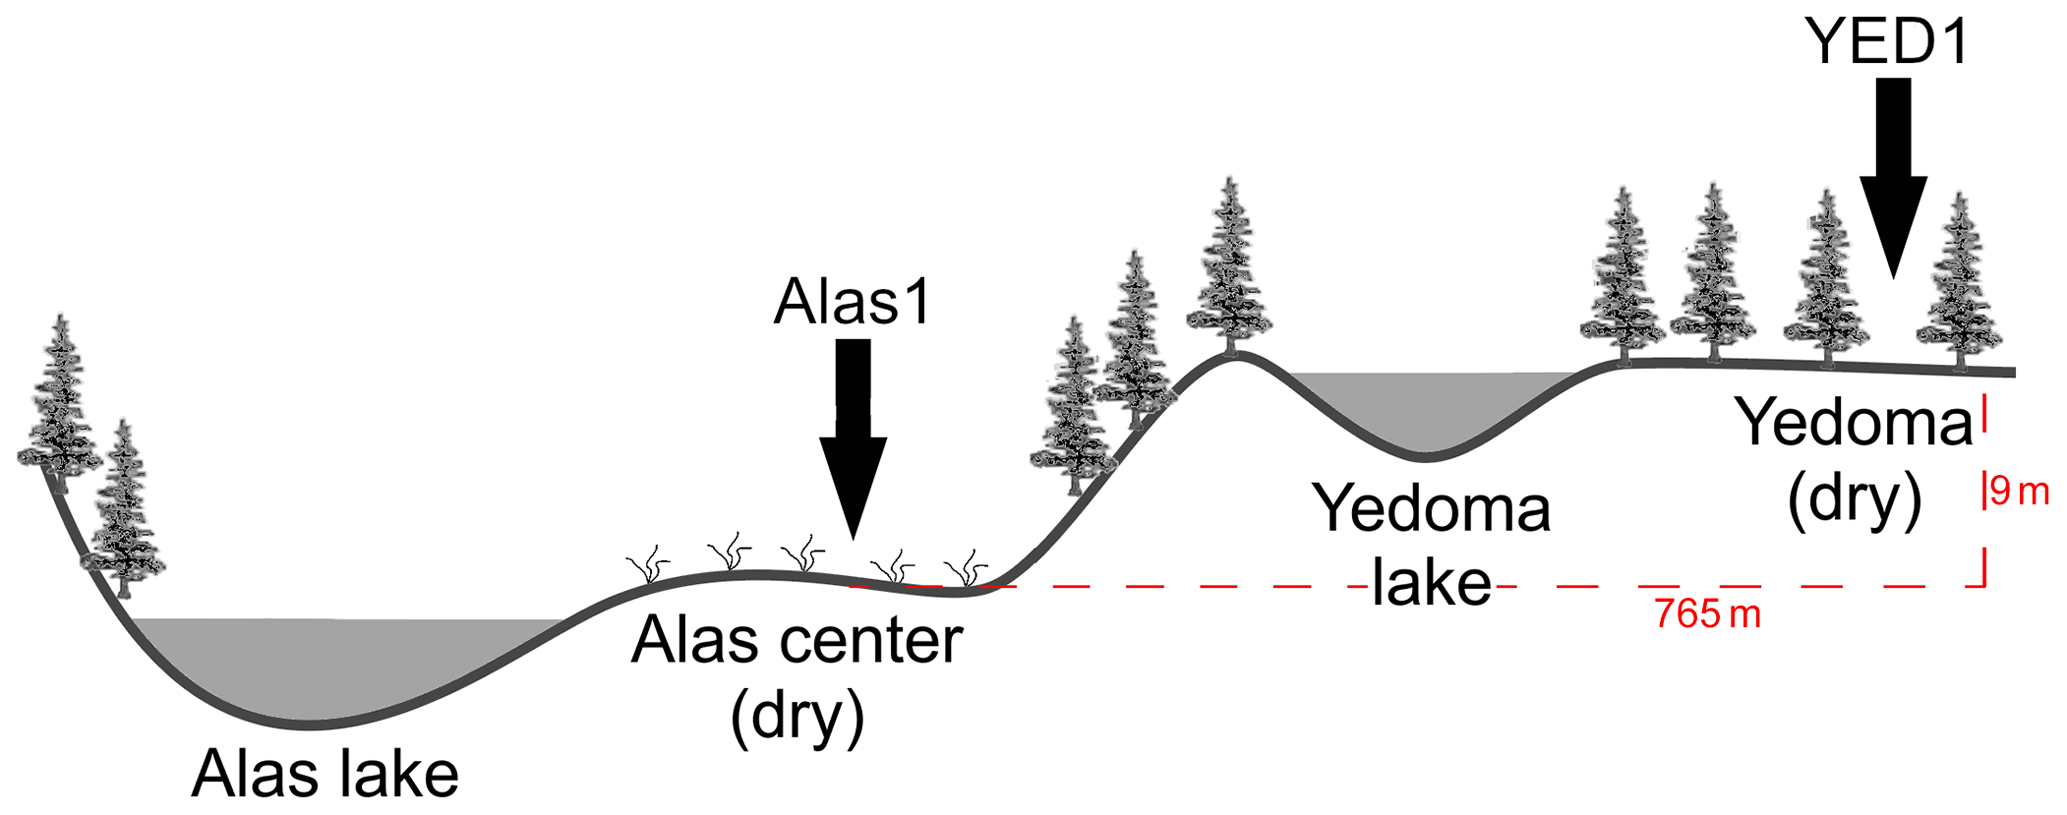
Figure 2Setting of the drilling locations for the Alas1 and YED1 cores showing the distance and height difference between the locations (vertical scale exaggerated). The terms “alas lake” and “Yedoma lake” are chosen following Ulrich et al. (2017a) in accordance with the deposit type in which the thermokarst lakes are located; the Yedoma lake can also be called “dyede” due to its development stage following Crate et al. (2017).
3.2 Laboratory analyses
The frozen cores were split lengthwise using a band saw and were subsequently subsampled. Each subsample consisted of approximately 5 cm of core material. Subsamples were equally distributed along the cores. According to visual changes, we covered all visible stratigraphic layers, and we sampled at least every 50 cm in order to capture specific sediment properties. The samples were weighed and thawed. Intrasedimental ice or, if the sediment was unfrozen during drilling, intrasedimental water was extracted using artificial plant roots (Rhizones) consisting of porous material with a pore size of 0.15 µm and applied vacuum. In order to avoid evaporation, the samples were thawed at 4 ∘C inside their sample bags and sealed tightly after inserting the Rhizones. These water samples were then analyzed for stable oxygen and hydrogen isotopes (see Sect. 3.2.5). The ice wedge ice was subsampled using a saw for the analysis of stable oxygen and hydrogen isotopes.
3.2.1 Ice content, bulk density and subsampling
The weighed sediment samples were freeze-dried and weighed again afterwards for the determination of the absolute ice content in weight percent. We decided to use the absolute ice content, as the gravimetric ice content, normalized with the dry sample weight, was not suitable for further calculations. Ice content within talik areas represents the water content, which subsequently froze after drilling. Bulk density was calculated from the absolute ice content, assuming an ice density of 0.9127 g cm−3 at 0 ∘C and a mineral density of 2.65 g cm−3 (Strauss et al., 2012).
3.2.2 Elemental analyses
Subsamples used for elemental analyses were homogenized using a planetary mill (Fritsch PULVERISETTE 5). Subsamples were then weighed into tin capsules and steel crucibles for the elemental analyses. Total carbon (TC), total nitrogen (TN) and total organic carbon (TOC) content were measured through combustion and the analyses of the resulting gases using a vario EL III and a varioMAX C element analyzer. Results give the carbon and nitrogen amounts in relation to the sample mass used for analysis in weight percent (wt %). The carbon to nitrogen ratio (C∕N) was calculated from the TN and TOC content. Besides showing an input signal, we used this ratio as a rough indicator of the state of degradation or source of organic matter. Assuming a constant source, a higher ratio indicates more well-preserved organic matter (Stevenson, 1994; Strauss et al., 2015).
3.2.3 Magnetic susceptibility and grain size analysis
Subsamples taken for grain size analysis were first measured for mass specific magnetic susceptibility using a Bartington MS2 magnetic susceptibility meter and a frequency of 0.465 kHz. This allowed us to differentiate between different mineral compositions (Butler, 1992; Dearing, 1999).
For grain size analysis, the samples were treated with hydrogen peroxide and put on a shaker for 28 d to remove organic material. The pH was kept at a reaction-supporting level between 6 and 8. Subsequently, the samples were centrifuged and freeze-dried. A total of 1 g of each sample was mixed with tetra-sodium pyrophosphate 10-hydrate (Na4P2O7⋅10H2O) (dispersing agent) and dispersed in an ammonia solution. The grain size distribution and proportions were determined using a Malvern Mastersizer 3000 equipped with a Malvern Hydro LV wet sample dispersion unit. Statistics of the grain size measurements were calculated using GRADISTAT 8.0 (Blott and Pye, 2001). The results are used to identify different stratigraphic layers via material composition and to deduce sedimentary processes.
3.2.4 Radiocarbon dating
Radiocarbon dating was done for nine samples using the Mini Carbon Dating System (MICADAS) at AWI Bremerhaven. We used bulk sediment samples for dating due to a lack of macro-organic remains within the deposits. The results were calibrated with Calib 7.1 software (Stuiver et al., 2018) using the IntCal13 calibration curve (Reimer et al., 2013). Results are given in calibrated years before present (cal BP). The age–depth model was developed using the “Bacon” package in the R environment (Blaauw and Christen, 2011; Fig. S2).
3.2.5 Stable isotopes
Besides showing a source signal (Meyers, 1997), stable carbon isotopes can be used as a proxy for the degree of decomposition of organic material; this is due to the fact that 12C is lost during decomposition and mineralization, resulting in a higher share of 13C and, hence, a higher δ13C ratio (Fig. S3; Diochon and Kellman, 2008).
A total of 23 subsamples were ground for δ13C analysis, and carbonates were removed by treating the samples with hydrochloric acid for 3 h at 97.7 ∘C. The samples were then vacuum-filtered, dried and weighed into tin capsules for analysis. The stable carbon isotopes were measured using a DELTA V Advantage isotope ratio mass spectrometer supplement equipped with a Flash 2000 organic elemental analyzer. The results are compared to the Vienna Pee Dee Belemnite (VPDB) standard and given in per mill (‰) (Coplen et al., 2006) with an analytical accuracy of ≤0.15 ‰.
Stable hydrogen and oxygen isotopes can be used as a temperature proxy. Lower δ2H and δ18O values indicate lower temperatures during precipitation. Samples taken from the ice wedges generally yield a winter temperature signal (Opel et al., 2018), whereas pore ice and pore water signals are a mix of different seasons with a higher uncertainty due to alteration and fractionation during deposition and multiple freeze–thaw cycles as well as evaporation (Meyer et al., 2000).
Our δ2H and δ18O samples were measured at AWI Potsdam Stable Isotope Laboratory using a Finnigan MAT Delta-S mass spectrometer with the equilibration technique following Horita et al. (1989). In total, 29 samples were measured, of which 16 originated from YED1 pore ice, 8 originated from YED1 wedge ice, and 5 originated from Alas1 pore ice or pore water. The results are given in per mill related to Standard Mean Ocean Water (‰ vs. SMOW). The analytical accuracy for δ2H was ≤0.8 ‰ and it was ≤0.1 ‰ for δ18O (Meyer et al., 2000). The deuterium excess (d excess; ) was also calculated from these values.
3.2.6 Statistics and the bootstrapping approach for carbon budget estimations
For the mean grain size, the mean of each core unit, consisting of several samples' mean values, is given. We estimated the carbon budget of the Yukechi alas area following Eq. (1), using a bootstrapping approach. Bootstrapping is a statistical method to estimate the sample distribution using resampling and replacement (Crawley, 2015). Resampling consists of drawing randomly selected samples from the dataset (i.e., bulk density, BD, and TOC) repeatedly (10 000 iterations), after which those values are fed into the formula. Replacement refers to the fact that the drawn samples in each iteration are available for all following iterations. We used combined BD and TOC values, as they are not independent. In addition, we corrected for irregular sampling by value replication according to depth interval so that values spanning larger intervals had a higher chance of being drawn. We calculated the mean and standard deviation of all iterations.
where the deposit thickness is in meters, the coverage is in meters squared, the wedge-ice volume (WIV) is in volume percent, BD is in thousands of kilograms per cubic meter and TOC is in weight percent. For all TOC values below the detection limit (0.1 wt %), a value of 0.05 wt % was set. Missing bulk density values, resulting from low ice contents (<20 wt %) and, therefore, not fully ice-saturated sediments (Strauss et al., 2012), were calculated following Eq. (2), which describes the relation between TOC and BD in the examined cores. This had to be done for 9 samples in YED1 and 12 samples in Alas1 (see also Windirsch et al., 2019).
The core length of the examined cores was assumed to represent the different ground types, resulting in a deposit thickness of 22 m for Yedoma deposits and 20 m for alas deposits. A mean wedge-ice volume of 46.3 % for the central Yakutian Yedoma deposits and 7 % for the alas deposits of central Yakutia was assumed following Ulrich et al. (2014), who determined average wedge-ice volumes for several deposit types in multiple locations in Siberia. We estimated the deposit coverage of Yedoma and alas deposits using satellite imagery, as shown in Fig. S1. The wedge-ice in YED1 was excluded in the bootstrapping.
Bootstrapping calculations were carried out following Jongejans and Strauss (2020) for the upper 3 m, for the different core units and for the complete cores (Table 2) using the “boot” package in the R environment. Bootstrapping included 10 000 iterations of random sampling with replacement. We used combined BD and TOC values, as they are not independent, and we corrected for irregular sampling by value replication according to depth interval. We calculated the mean and standard deviation of all iterations.
4.1 Characteristics of the Yedoma deposits
The Yedoma core YED1 visually appears rather heterogeneous (Fig. 3a) with material varying from fine gray material (Fig. 3b.1) to sandy grayish-brown material (Fig. 3b.3) (Windirsch et al., 2020b). Between 2235 and 1920 cm b.s. and between 691 and 0 cm b.s., brown to black dots up to 2 cm in diameter may indicate organic-rich material. Cryostructures include structureless to micro-lenticular ice and larger ice veins and bands. The core penetrated an ice wedge between 1005 and 691 cm b.s. and contained an unfrozen layer close to the surface between approximately 200 and 100 cm b.s., representing a thin initiating talik layer underneath the 100 cm thick frozen active layer (Fig. 3a, red). All laboratory results are listed in detail in the PANGAEA repository (Windirsch et al., 2019).
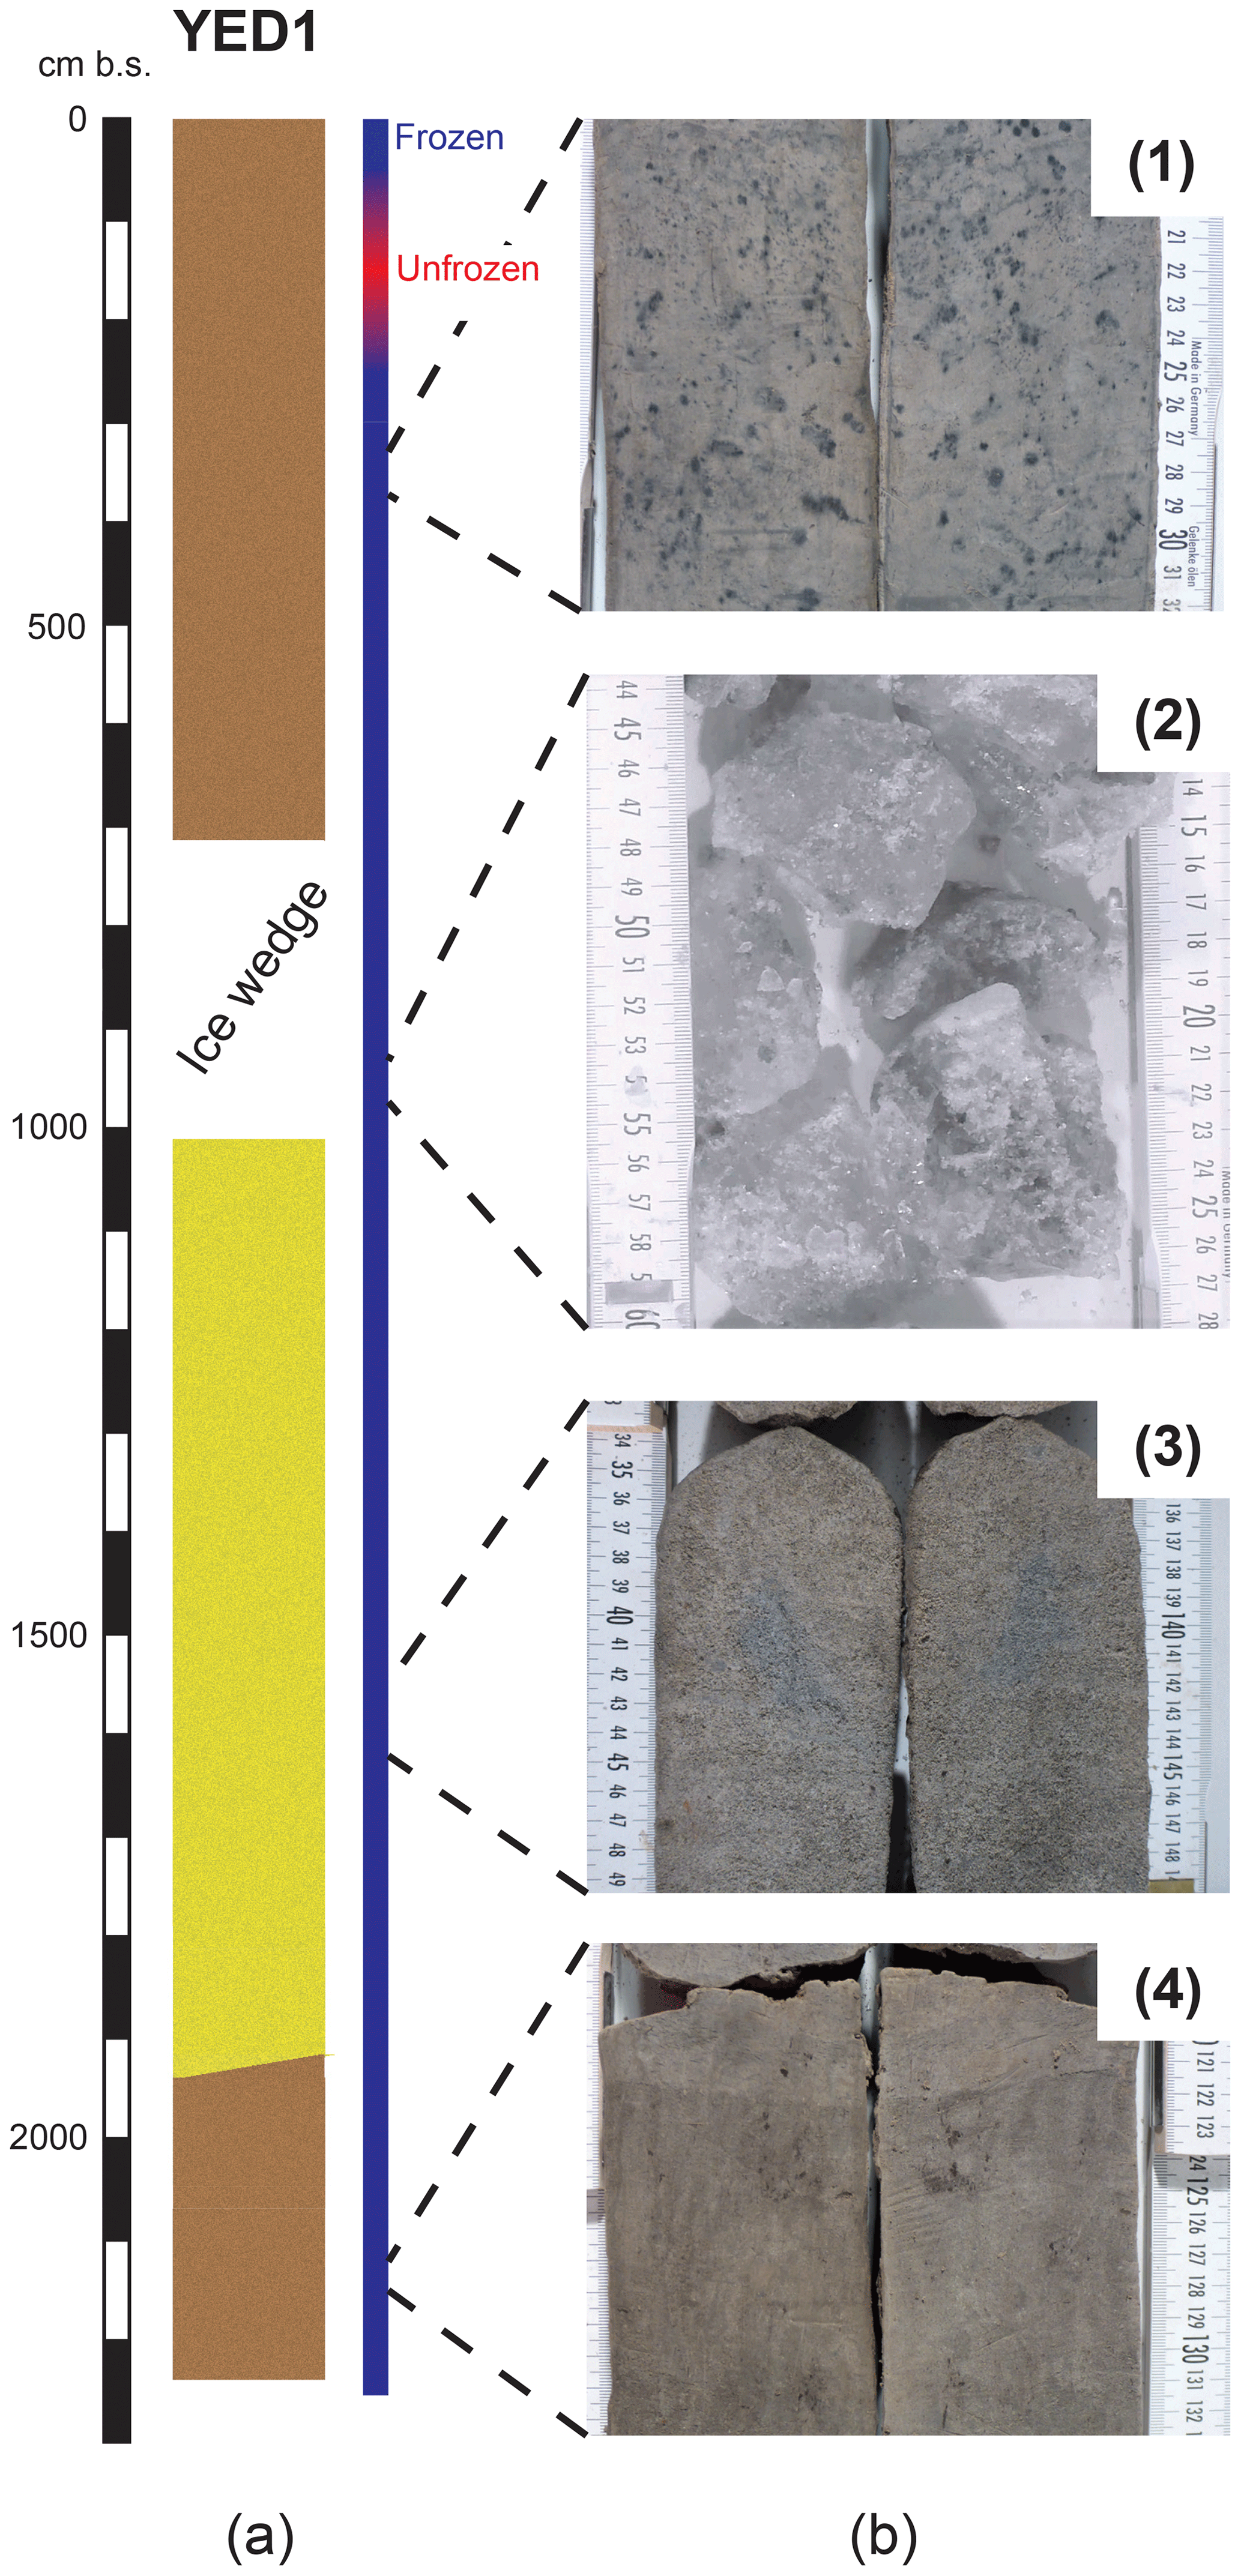
Figure 3(a) Overview of the Yedoma core. The depth is given in centimeters below the surface (cm b.s.); the state after core retrieval is given using colors (blue – frozen; red – unfrozen); the location of the ice wedge is labeled; brown illustrates silty sediments and yellow represents sandy sediments. (b) Detailed pictures of the YED1 core: (1) 332–317 cm b.s. – picture of unit Y1 showing black organic-rich inclusions within the gray silty matrix; (2) 960–944 cm b.s. – picture of the wedge ice in Y2; (3) 1549–1532 cm b.s. – picture of Y3 showing a coarse sandy material with no visible cryostructures or organic material; (4) 2133–2117 cm b.s. – picture of Y4 showing a gray silty matrix with some dark organic dots.
We divided the Yedoma core into four main Yedoma units (Y; Fig. 4). Y4 is the lowest (2235 to 1920 cm b.s.) and oldest (radiocarbon age of 49 323 cal BP) stratigraphic unit. The absolute ice content slightly increased towards the surface (35.8 wt % to 36.6 wt % with a peak value of 53.6 wt % in between). Magnetic susceptibility (MS) also increased from 60.7 to m3 kg−1. The grain size was rather consistent with a mean value of 24.3±3 µm, and the soil texture varied between sand and silt (Figs. S4, S5). We found TOC contents of up to 1.7 wt % (mean of 1.3 wt %). The C∕N ratios within this unit varied between 9.2 and 10.6, and δ13C values ranged between −25.27 and −24.66 ‰ vs. VPDB (Fig. S3). TN values only reached the detection limit of 0.1 wt % in 9 out of 36 samples in the whole YED1 core. As just these nine samples exceeded the detection limit (highest value of 0.16 wt % at 2036 cm b.s.), only they were used for C∕N calculations.
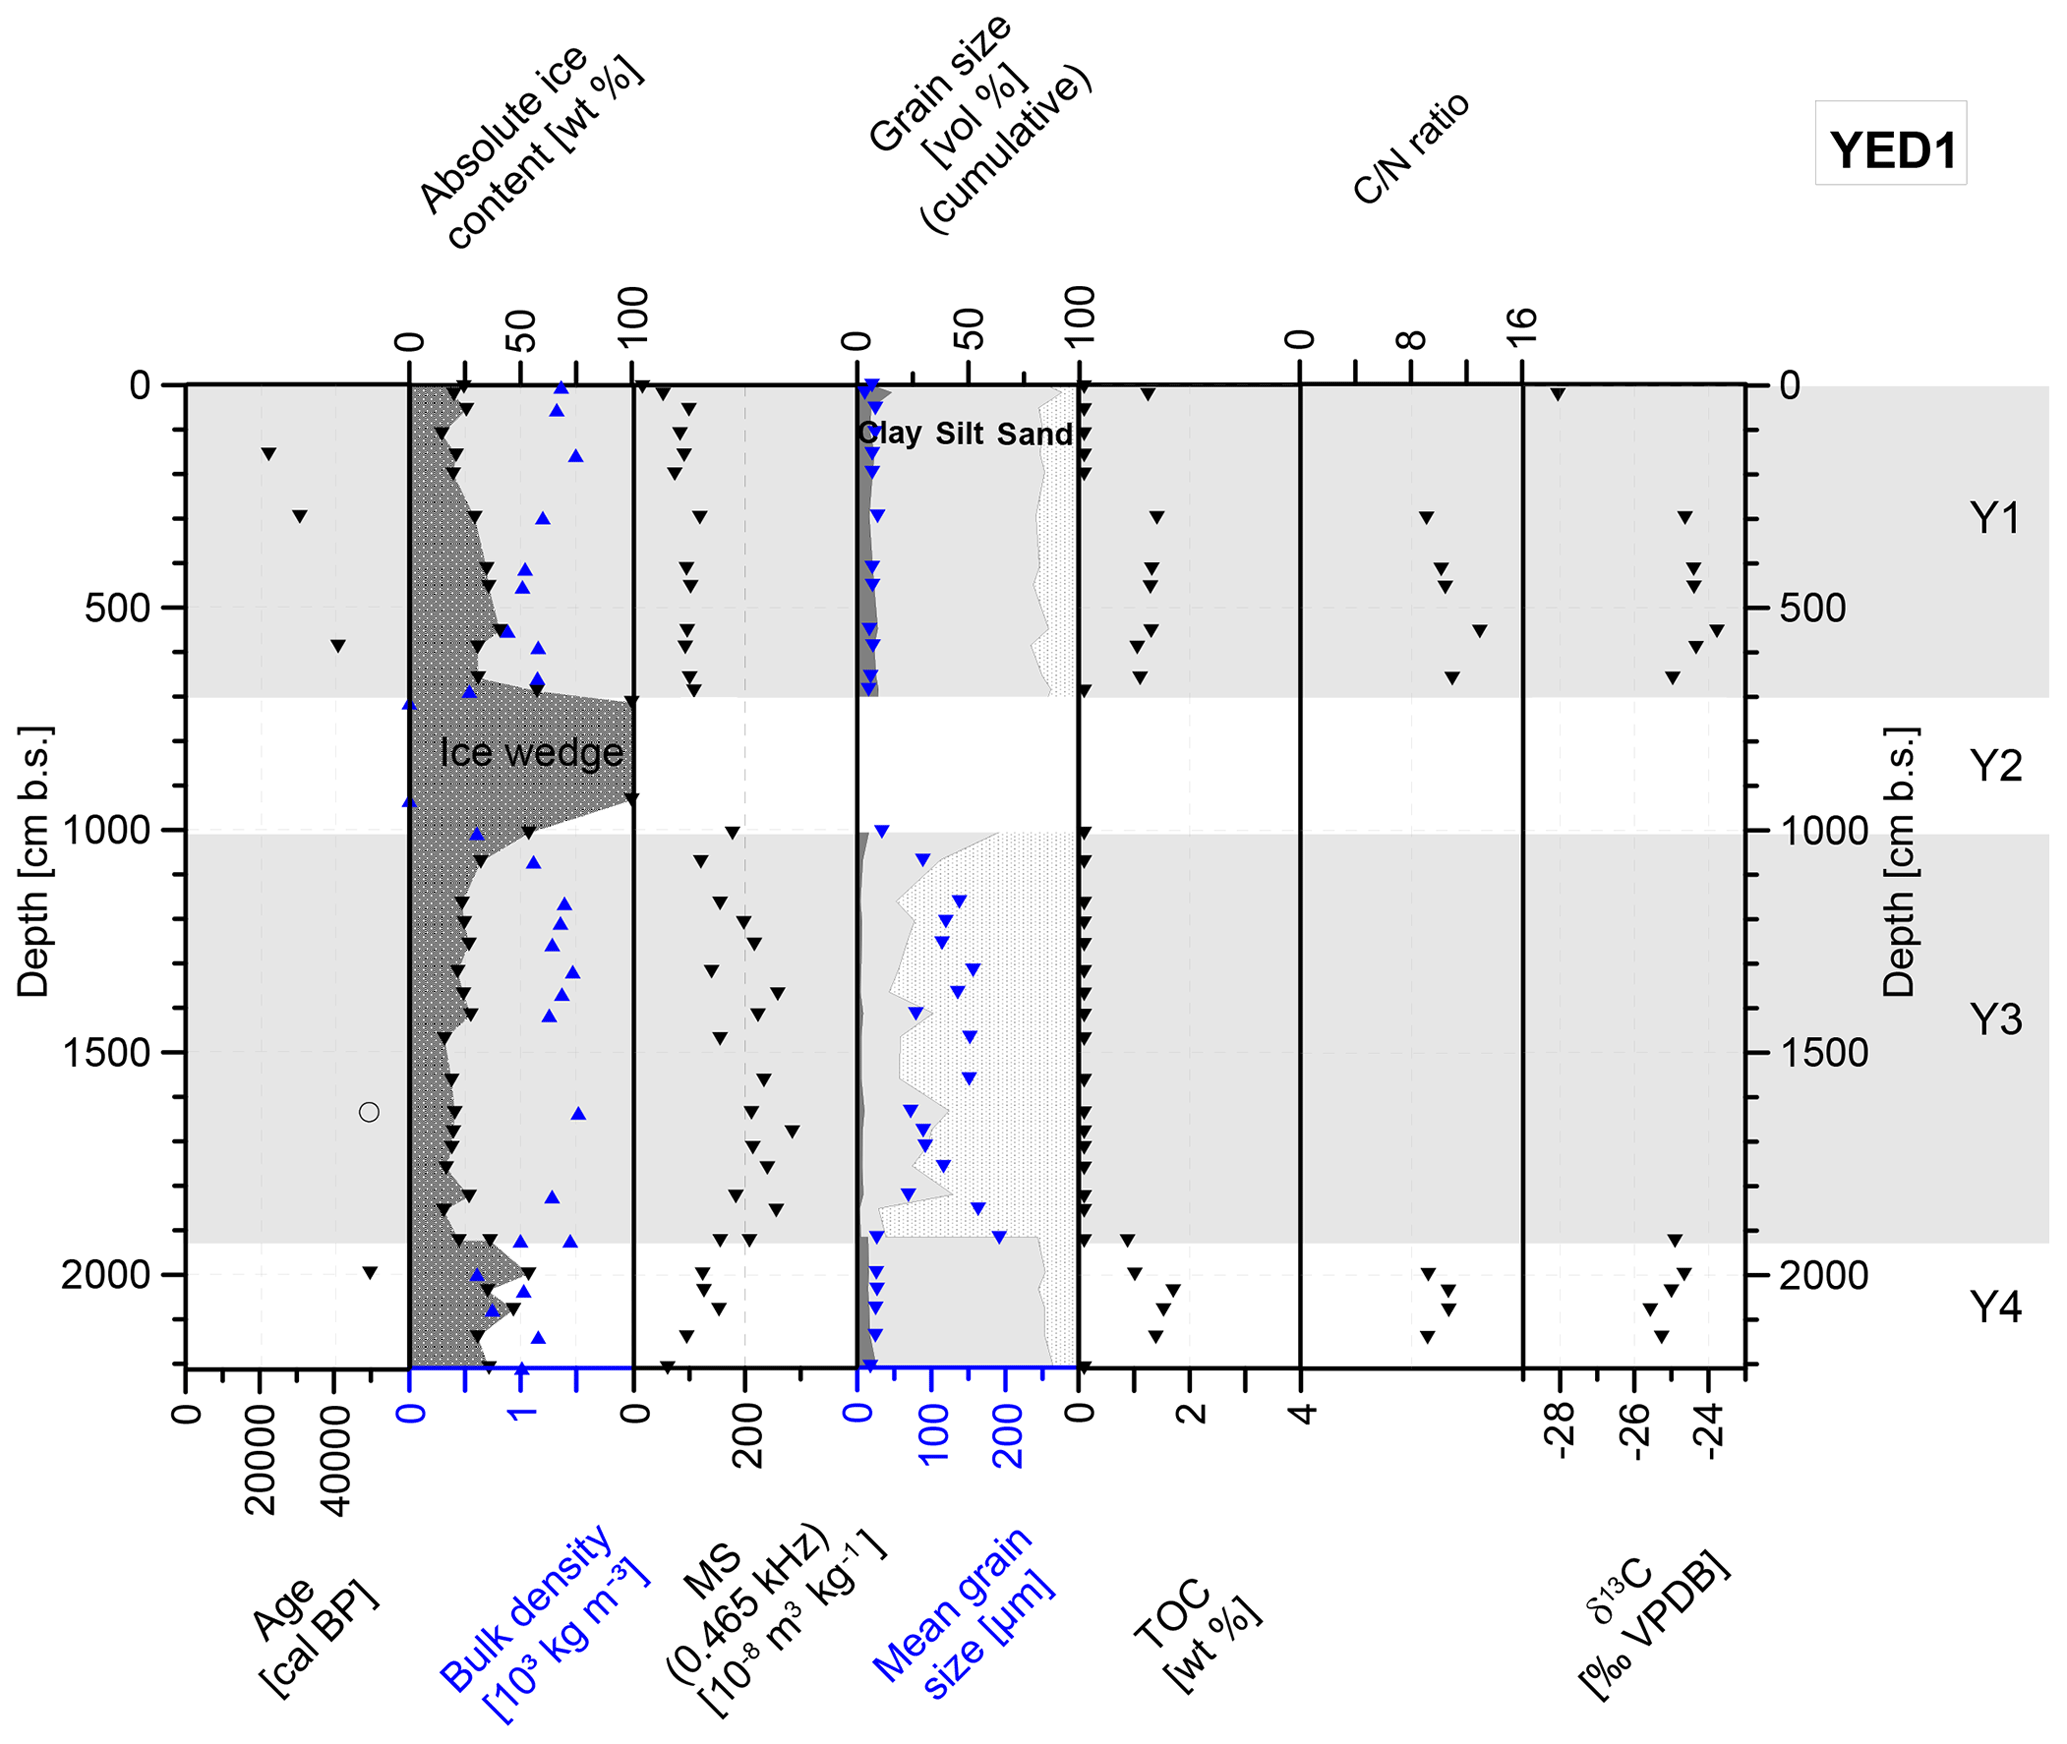
Figure 4Characteristics of the Yedoma core YED 1: radiocarbon ages, absolute ice content, bulk density, magnetic susceptibility (MS), grain size composition, mean grain size, total organic carbon (TOC) content, carbon / nitrogen (C∕N) ratio and stable carbon isotope (δ13C) ratio. The hollow circle indicates an infinite radiocarbon (dead) age, and gray and white areas mark the different stratigraphic units (Y1 to Y4).
The radiocarbon sample age of Y3 (between 1927 and 1010 cm b.s.) yielded an infinite age (> 49 000 BP) with 14C below the detection limit. There is a transition zone between Y4 and Y3 represented by a diagonal sediment boundary in the core between 1927 and 1920 cm b.s. (see Fig. 3a). Y3 showed distinctly lower absolute ice contents (<32.1 wt %). MS varied between 120.5 and m3 kg−1. Higher sand contents (>56.9 vol %) led to an increase in grain size (72.1 to 191.6 µm) with a mean grain size of 120.5±35.5 µm. Grain size decreased down to 33.3 µm in the uppermost sample of Y3, and no detectable TOC was found in this unit.
Y2 (1010 to 714 cm b.s.) consisted of massive wedge ice, which contained very few sediment inclusions (Fig. 3b.2). Thus, only water isotopes (δ2H and δ18O) could be measured and analyzed. The results are described in Sect. 4.3.
Y1 (714 to 0 cm b.s.) is the uppermost and youngest unit with carbon ages ranging between 40 608 (589.5 cm b.s.) and 21 890 cal BP (157.5 cm b.s.). The ice content decreased from the ice wedge towards the surface ranging from 14.6 wt % (110 cm b.s.) to 57.4 wt % (688 cm b.s.). MS decreased towards the surface from 108.1 to m3 kg−1 in the uppermost sample, with a maximum of m3 kg−1 at 298 cm b.s. This unit consisted of fine sediment with a mean grain size of 19.9±4.2 µm. It contained up to 1.4 wt % TOC (298 cm b.s.). C∕N values were in the range of 9.1 to 12.9. The lowest δ13C value was found at 21 cm b.s. with −28.07 ‰ vs. VPDB; the lower part of this section showed a mean value of ‰ vs. VPDB.
The grain size distributions (Fig. S5) illustrate the differences between the core units. Silt is the dominant grain size class in Y4 and Y1, whereas unit Y3 is dominated by sand.
The calibrated radiocarbon ages of the Yedoma deposits are listed in Table 1 and assigned to the different core units. Our age–depth model (Fig. S2a) indicates a steep age–depth relationship from approximately 1200 to 2235 cm b.s. and a rather well-defined, gradual age–depth relationship from 1200 cm b.s. towards the surface (Fig. S2a).
Table 1Radiocarbon measurement data and calibrated ages for the YED1 and Alas1 bulk organic material samples.
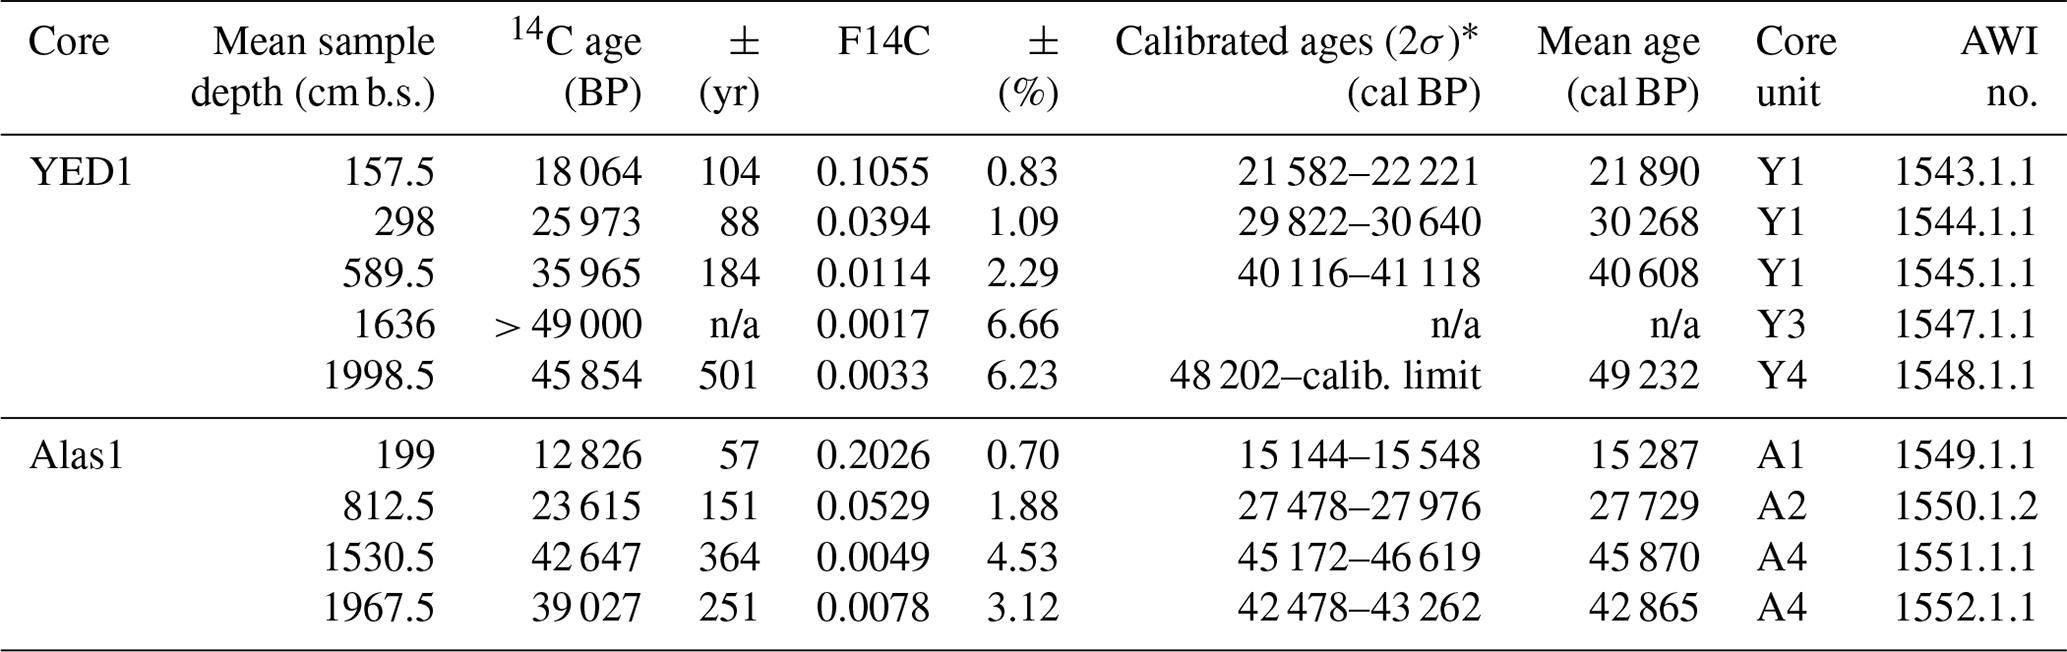
* Calibrated using Calib 7.1 (Stuiver et al., 2018) equipped with IntCal 13 (Reimer et al., 2013). n/a – not applicable.
The bootstrapping approach resulted in a mean soil organic carbon (SOC) estimation of 4.48±1.43 kg m−3 for the top 3 m of the YED1 core and a mean of 5.27±1.42 kg m−3 for the entire core (Table 2). We calculated a carbon inventory of 56.8±15.2 kt for the Yukechi Yedoma deposits by upscaling the carbon storage to the complete Yedoma coverage in the Yukechi alas landscape (66.4 %, ∼ 917 000 m2; Fig. S1).
Table 2SOC contents for the individual core units, based on the bootstrapping results; calculations were carried out for 1 m2. The measurement data used in the bootstrapping approach (bulk density and TOC density) are provided in the data sheet in the PANGAEA repository. * refers to samples with a TOC content <0.1 wt %. For the organic carbon pool calculations, we assumed a TOC of 0.05 wt % for these samples. Note: we excluded unit Y2 from the calculations.

4.2 Characteristics of the alas deposits
The Alas1 core contains a large proportion of unfrozen sediment (i.e., talik; ∼750 to 160 cm b.s.; Fig. 5a, red), which led to the loss of some core sections during drilling. The absolute ice content given for samples retrieved from this zone represents absolute water content; samples were frozen directly after core recovery and field description. The core's visual appearance was more homogeneous than YED1 regarding color (grayish brown) and material (clayish silt, Fig. 5b.2, to sandy silt, Fig. 5b.4) (Windirsch et al., 2020a). Cryostructures of the frozen core below 750 cm b.s. included horizontal ice lenses up to 5 cm thickness and structureless non-visible ice. Blackish dots and lenses (up to 1 cm in diameter) hint that organic material is included in the sediments. The frozen sediment of the uppermost 160 cm b.s. represents the seasonally freezing layer.
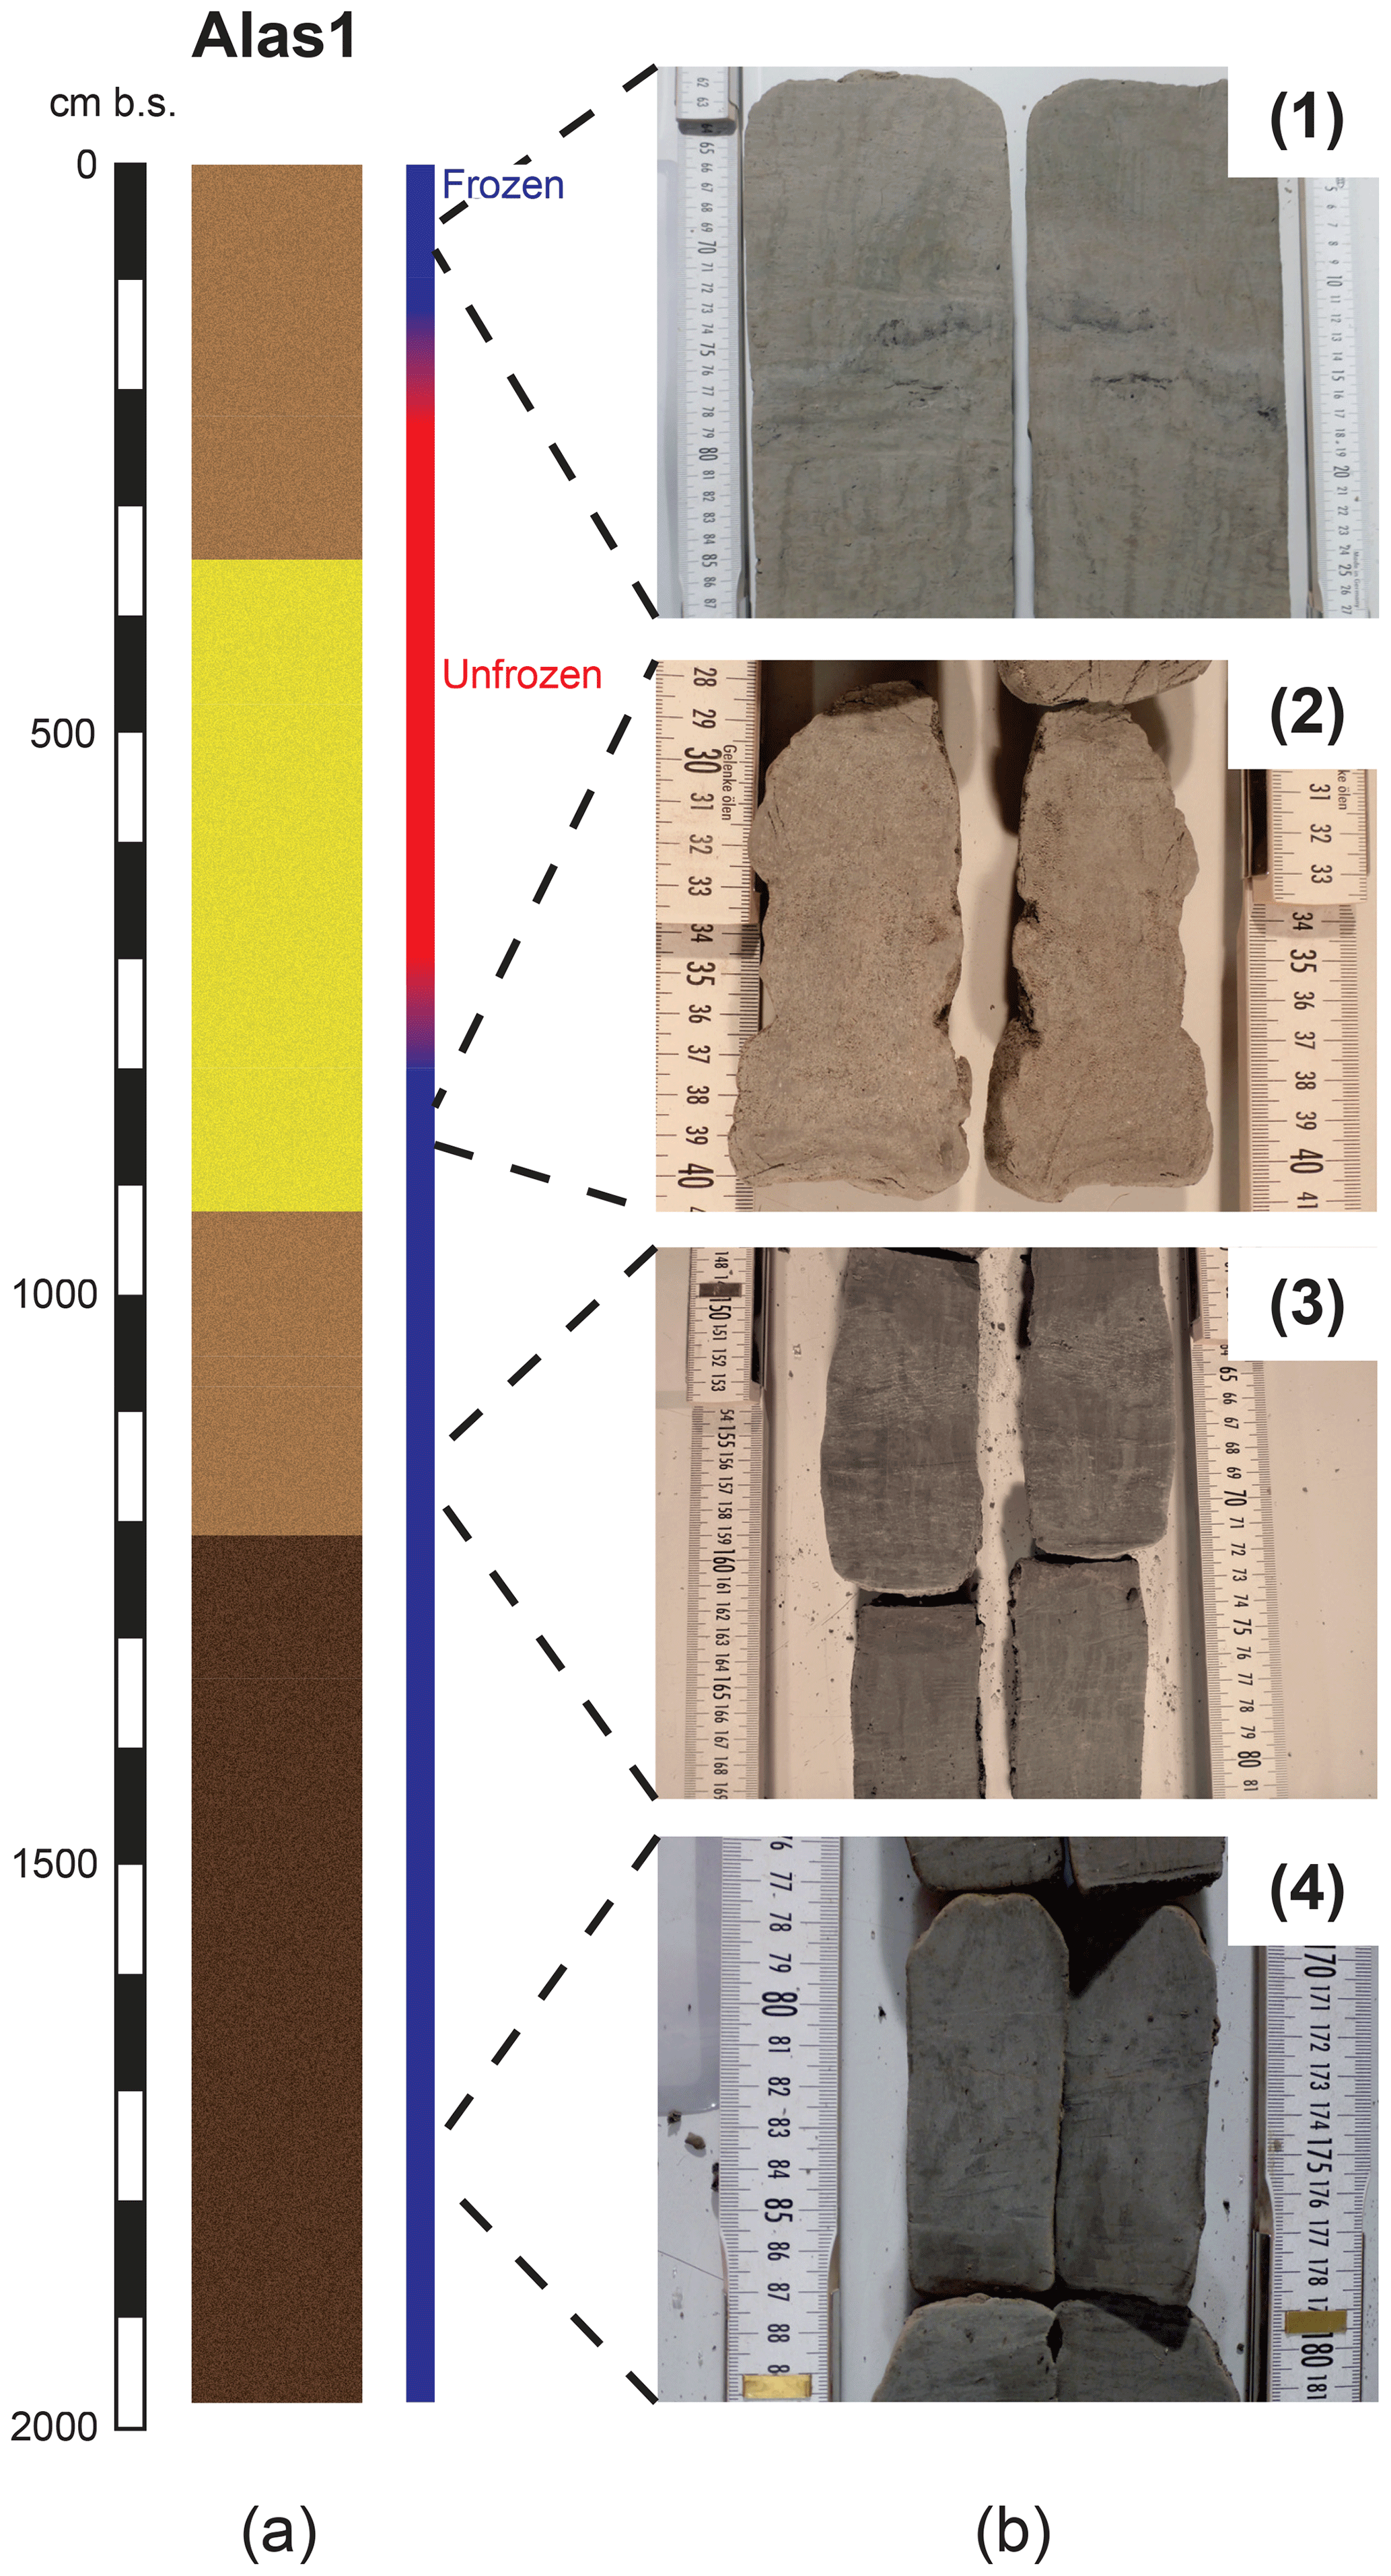
Figure 5(a) Overview of the Alas1 core. The depth is given in centimeters below the surface (cm b.s.); the state after core retrieval is given using colors (blue – frozen; red – unfrozen); light brown marks silty material, yellow marks sandy material and dark brown marks silty material containing more organic material. (b) Detailed pictures of the Alas1 core: (1) 88–64 cm b.s. – picture of A1 showing the silty gray matrix including dark organic structures; (2) 840–828 cm b.s. – picture of the sandy A2 unit; (3) 1169–1148 cm b.s. – picture of A3 showing a silty gray matrix with some darker organic dots; (4) 1781–1767 cm b.s. – picture of the fine-grained silt-dominated A4 unit including black organic-rich inclusions.
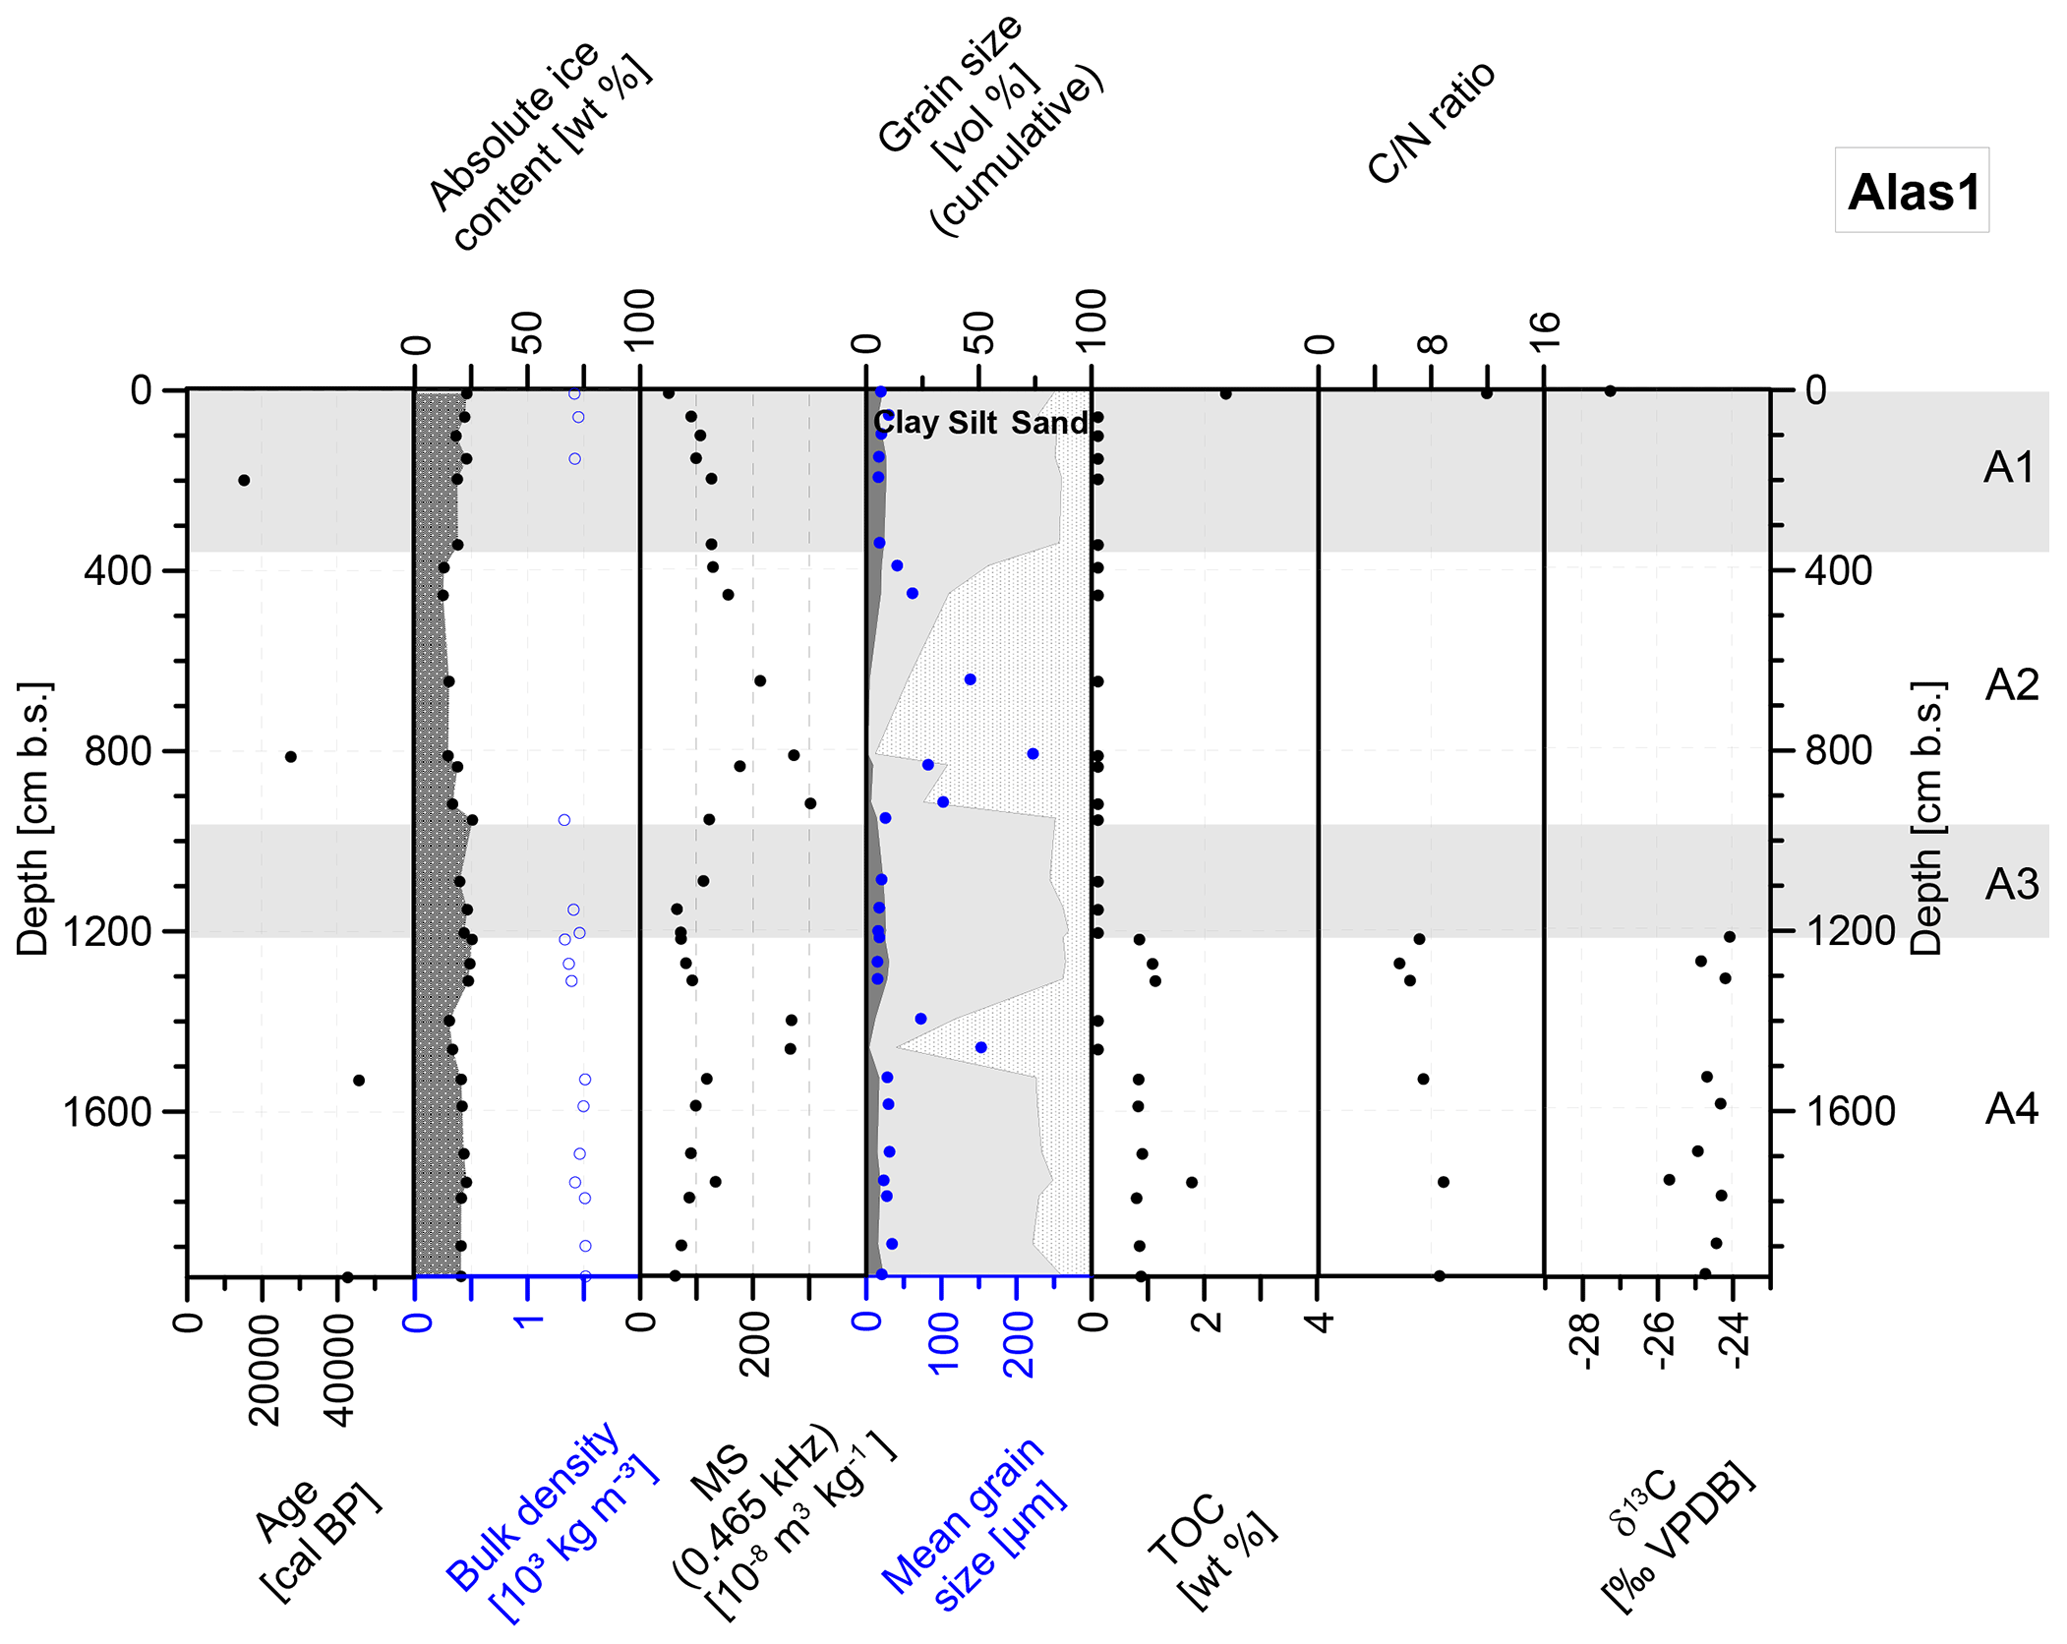
Figure 6Characteristics of the Alas1 core: radiocarbon ages, absolute ice content, bulk density, magnetic susceptibility (MS), grain size composition, mean grain size, total organic carbon (TOC) content, carbon / nitrogen (C∕N) ratio and stable carbon isotope (δ13C) ratio. The gray and white areas mark the different stratigraphic units (A1 to A4).
We divided the Alas1 core into four stratigraphic units (A1 to A4), according to soil texture and, if applicable, carbon content (Fig. 6). The oldest unit is A4 (1980 to 1210 cm b.s.) with radiocarbon ages of 42 865 cal BP (1967.5 cm b.s.) and 45 870 cal BP (1530.5 cm b.s.). An age inversion was detected here. The absolute ice content did not show a specific trend and ranged from 15.3 wt % at 1400.5 cm b.s. to 25.4 wt % at 1220 cm b.s. MS ranged between 62.1 (1967.5 cm b.s.) and m3 kg−1 (1759 cm b.s.) with much higher values in a sand intrusion found between 1530.5 and 1312 cm b.s. ( m3 kg−1 at 1464 cm b.s. and m3 kg−1 at 1400.5 cm b.s.). The mean grain size was constant (35.9±36 µm) except for the sandy intrusion (152.9 µm at 1464 cm b.s., 72.6 µm at 1400.5 cm b.s.), leading to a high standard deviation (Figs. S4, S6). While TOC values were below the detection limit within this sandy material, the other parts of A4 held TOC amounts of up to 1.8 wt % (1759 cm b.s.). The C∕N ratio ranged between 5.8 (1274 cm b.s.) and 8.9 (1759 cm b.s.) with a mean value of 7.4 (Fig. S2). The δ13C values showed a range of −25.67 ‰ to −24.06 ‰ vs. VPDB (Fig. S3). Only the TN values that exceeded the detection limit, which was the case in 8 out of 28 samples in the entire Alas1 core, were used for C∕N ratio calculations.
A3 ranged from 1210 to 925 cm b.s. The absolute ice content was stable around 22.7±2.9 wt %. MS increased towards the surface from m3 kg−1 (1205.5 cm b.s.) to m3 kg−1 (955 cm b.s.). A3 was characterized by less coarse material compared with A4 (Fig. S6), with a mean grain size of 19.7±3.7 µm. All TOC values were below the detection limit, so no C∕N could be calculated and no δ13C could be measured.
The characteristics of A2 (925 to 349 cm b.s.) were similar to those of the sand intrusion found in A4. A radiocarbon age of 27 729 cal BP was measured at 812.5 cm b.s. The absolute ice content had a mean of 15.2 wt % and decreased from 16.7 wt % at 919.5 cm b.s. to 12.9 wt % at 395 cm b.s. MS decreased upwards from 302.3 to m3 kg−1. The mean grain size at the bottom of this unit was 102.3 µm (919.5 cm b.s.); this increased to 221.9 µm at 812.15 cm b.s. towards the surface and reached the lowest value of 41.2 µm at the upper boundary of A2 (Fig. S6) with an overall mean of 108.0±59.5 µm. All TOC values were below the detection limit.
The uppermost stratigraphic unit A1 starts at 349 cm b.s. It is the youngest unit of the Alas1 material with a radiocarbon sample at 199 cm b.s. dated to 15 287 cal BP. The absolute ice content slightly increased from 19.1 wt % (344.5 cm b.s.) to 23.1 wt % (9 cm b.s.) throughout this unit. MS decreased towards the surface, starting at m3 kg−1 (344.5 cm b.s.) and reaching m3 kg−1 at 9 cm b.s. The mean grain size decreased again, compared with A2, representing silty material with values of µm. The mean grain size for this unit was 20.0±4.6 µm. TOC was only detectable in the uppermost sample with a value of 2.4 wt % (9 cm b.s.). The C∕N ratio for this sample was 12.0, and the δ13C was −27.24 ‰ vs. VPDB.
The radiocarbon ages are listed in Table 1. The age–depth model (Fig. S2b) shows a rather continuous slope for all of the calibrated ages of Alas1.
Bootstrapping resulted in a mean SOC value of 6.93±2.90 kg m−3 for the top 3 m of the Alas1 core (Table 2). The calculation for the whole core resulted in a mean value of 6.07±1.80 kg m−3 carbon. For the whole alas area within the Yukechi alas landscape (20.6 %, ∼ 284 000 m2; Fig. S1, green), we calculated a total organic carbon stock of 32.0±9.6 kt using an estimated deposit thickness of 19.8 m.
4.3 Water isotope analysis of the YED1 and Alas1 core
Stable hydrogen and oxygen isotope results are shown in Fig. 7. We found clear downward trends for δ18O and δ2H with values becoming more negative between 1000 and 400 cm b.s. in the YED1 core (Fig. 7b). Below 1000 cm b.s., both δ2H and δ18O become less negative with increasing depth. δ18O ranged between −25.16 ‰ at the lowermost sample and −30.70 ‰ at 1071.5 cm b.s. with a much less negative value of −15.53 ‰ closest to the surface. While the uppermost Yedoma sample had a δ2H value of −120.8 ‰, all of the other Yedoma samples showed much more negative values between −181.3 ‰ (2209.5 cm b.s.) and −221.6 ‰ (1071.5 cm b.s.). Values almost aligned with the Global Meteoric Water Line (GMWL) but also partly with the local evaporation line (LEL) of central Yakutia (Wetterich et al., 2008), except for the ice wedge samples of YED1 (Fig. 7a). The isotope data obtained from the ice wedge samples had more negative values for both δ2H (−220.6 ‰ to −228.6 ‰) and δ18O (−29.58 ‰ to −30.55 ‰) compared with the remaining YED1 core. The d-excess values are lowest in the YED1 ice wedge (lowest value of 9.3). Other values reach 3.5 in the uppermost sample (as an outlier), although they generally range between 14.7 and 29.5 with no clear trend visible.
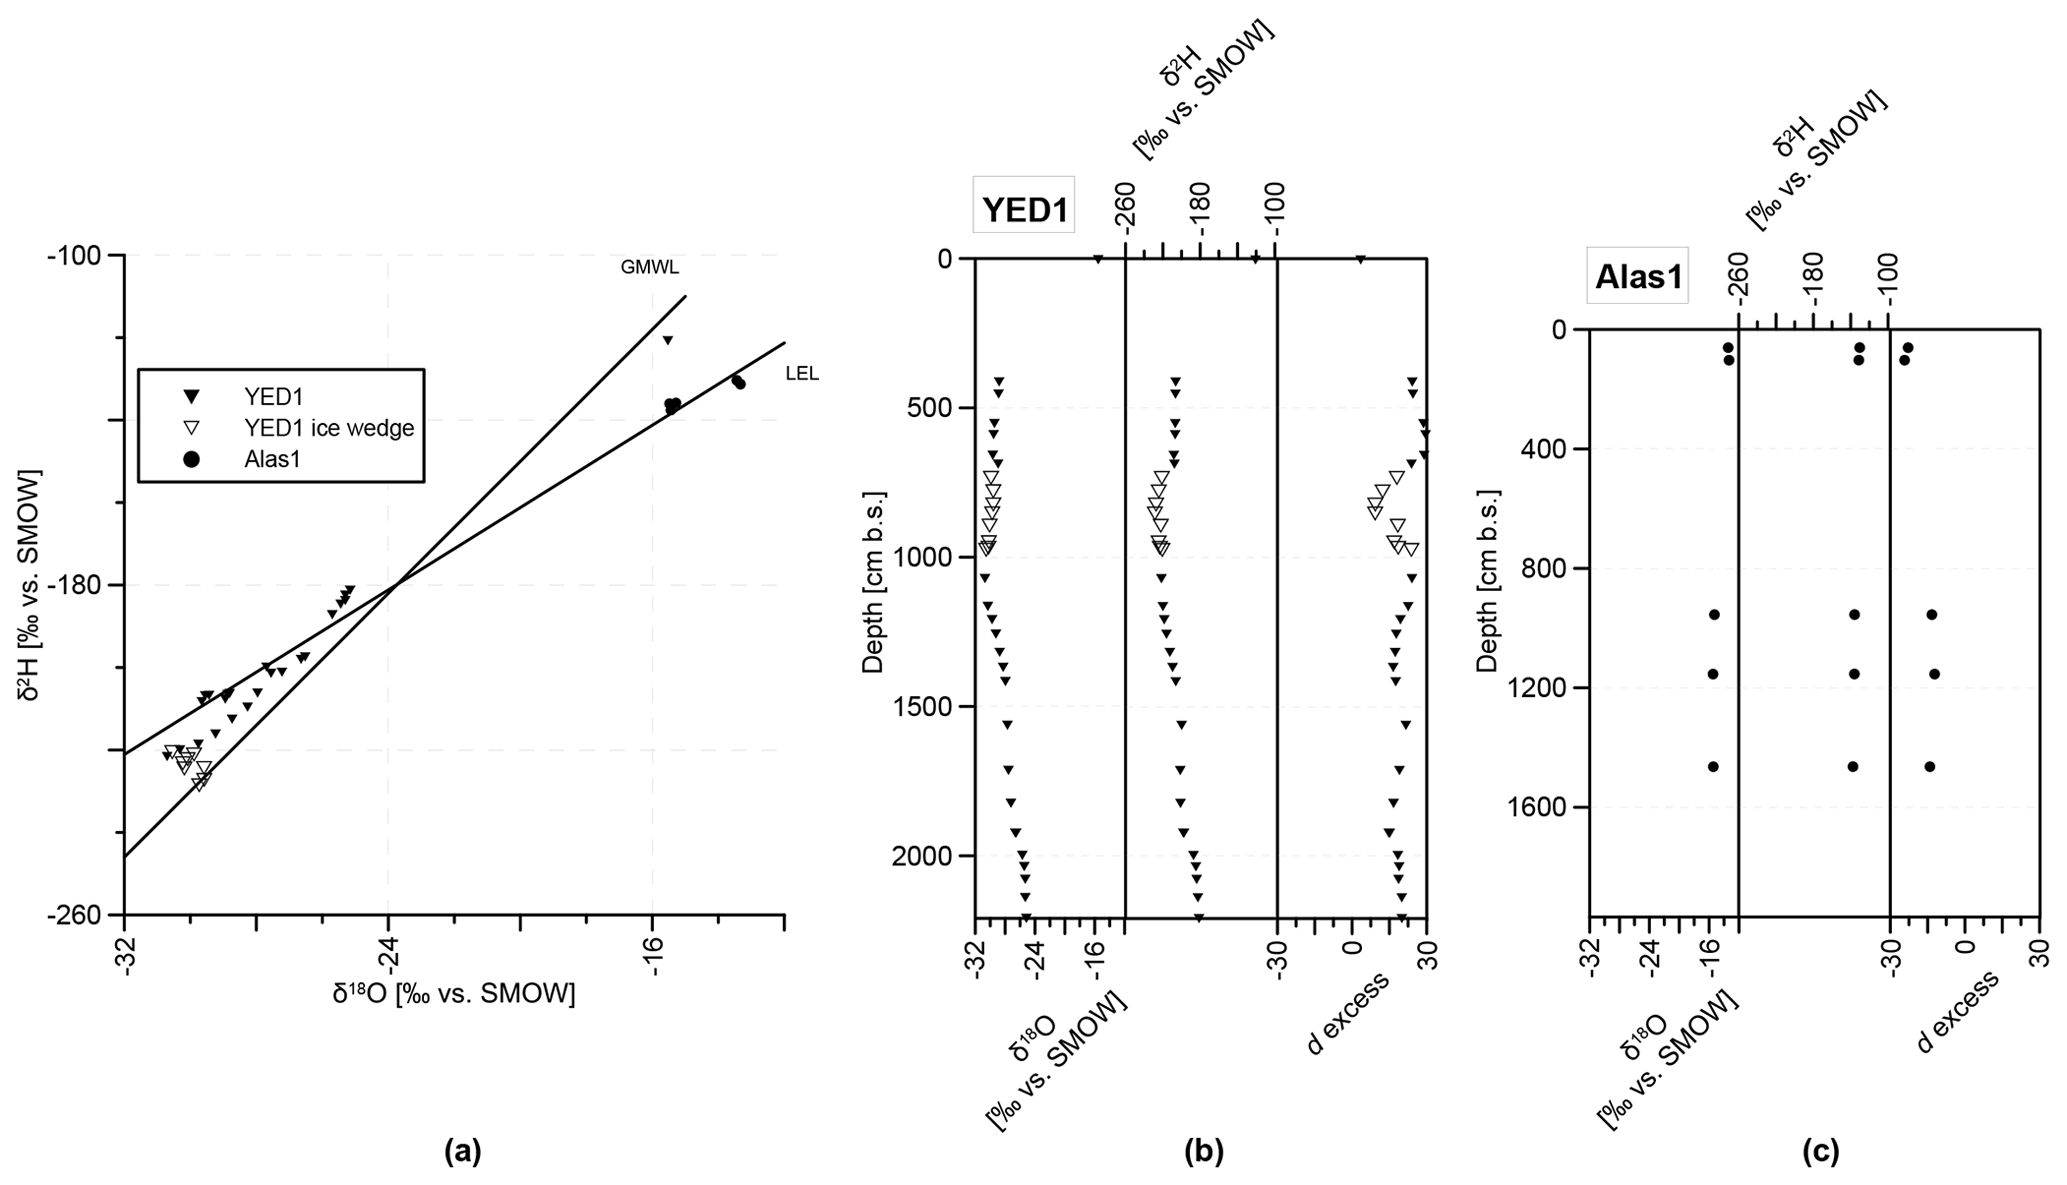
Figure 7The characteristics of water stable isotopes in the studied sediment cores. (a) Stable hydrogen (δ2H) and oxygen (δ18O) isotope ratios of YED1 pore ice (black triangles), YED1 ice wedge ice (hollow triangles), and Alas1 pore ice and pore water (black dots; ‰ vs. SMOW). Global Meteoric Water Line (GMWL): δ2H = 8⋅δ18O + 10; local evaporation line (LEL) of central Yakutia (based on data compiled until 2005 following Wetterich et al., 2008). (b) Oxygen isotopes, hydrogen isotopes and d-excess values of YED1 plotted over depth. (c) Oxygen isotopes, hydrogen isotopes and d-excess values of Alas1 plotted over depth.
Most of the alas samples were too dry to extract pore water for water isotope analysis, resulting in a low number of water samples for this core (Fig. 7c). These Alas1 samples showed little variance in δ2H and δ18O data, ranging from −13.33 ‰ (103 cm b.s.) to −15.48 ‰ (1154 cm b.s.) for δ18O and from −130.4 ‰ (61 cm b.s.) to −137.6 ‰ (1464 cm b.s.) for δ2H. d-excess values are lower towards the surface (−22.8 at 61 cm b.s. and −24.3 at 103 cm b.s.) and range from −14.1 to −12.2 in the lower core section.
5.1 Carbon accumulation and loss at the Yukechi study site
We found surprisingly low TOC values in certain core sections of the Yedoma and alas deposits. These low values appear in core sections with coarser sediments (fine sand), whereas the rather fine sediment layers (silt and sandy silt) store more TOC. The similarities in sediment structure and composition of the two cores, in particular between units Y1, Y4 and A4 in terms of grain size composition and OC content, and the increased accumulation rates towards the core bottoms (Fig. S2) indicate that the sedimentary sources' regime was the same for both cores until approximately 35 000 cal BP (Figs. 4, 6).
On the one hand, the low TOC content could result from strong organic matter decomposition during accumulation or during a thawed state, especially in thermokarst deposits. On the other hand, it could reflect low carbon inputs. A suitable explanation for a low-input scenario is a change in the sedimentary regime due to fluvial transportation processes, as is explained in more detail in Sect. 5.2. The low stable carbon isotope data of our cores (between −24.06 ‰ and −27.24 ‰) are comparable to other studied sites from the Yedoma domain (Schirrmeister et al., 2013; Strauss et al., 2013; Jongejans et al., 2018). Our C∕N data suggest a fairly homogeneous source signal of the organic material. Both cores show the lowest δ13C values closest to the surface as the organic material is the most recent and, therefore, the least decomposed. In deeper sections of the cores, δ13C is higher (less negative) with no general trend over depth in the alas and Yedoma deposits. This indicates that the present material was already further decomposed when it became frozen. We see that decomposition ceased once the deposits froze; therefore, δ13C values do not show a clear trend at depth. The C∕N ratios in both cores support this hypothesis and are in line with the results found by Strauss et al. (2015) and Weiss et al. (2016) for other Yedoma and alas sites in Siberia. In comparison to the mean C∕N ratio of 10 in YED1, the mean C∕N ratio of 8 for Alas1 indicates that the alas deposits are slightly more affected by decomposition due to their temporary thawed state during the lake phase. As the carbon was freeze-locked in the YED1 core from the time it was frozen, it did not decomposed after deposition. The Yukechi C∕N ratios are on the lower end of C∕N ratios known from other Yedoma deposits, e.g., from the Bykovsky Peninsula (Schirrmeister et al., 2013) and Duvanny Yar (Strauss et al., 2012). The hypothesis of an input of organic-poor and already pre-decomposed material is supported by the fact that both cores, Alas1 and YED1, show low C∕N ratios. The carbon characteristics indicate that the low carbon content results from low carbon input rather than decomposition in both cores, as no evidence for conditions favoring high decomposition rates is found. Therefore, the low carbon content is likely not the result of strong decomposition during aquatic conditions of a lake-covered state but is a legacy of the source material. For a “decomposition during lake phase” scenario, organic carbon parameters would differ largely in carbon content and isotope signature from those of the still frozen Yedoma (Walter Anthony et al., 2014).
We found age inversions in both cores with a similar age and depth (YED1 49 232 cal BP, 1998.5 cm b.s.; Alas1 42 865 cal BP, 1967.5 cm b.s.) (Figs. 4, 6 and S2) which is typical for many Yedoma sites (Schirrmeister et al., 2002). While cryoturbation might seem like an obvious explanation, we suggest that this process did not play a major role here due to the long-term frozen state of YED1. Rather, we assume that the age inversions indicate a temporary shift in sediment input at approximately 35 000 cal BP. This could have caused some in-deposit reworking in the watershed and the incorporation of older material into younger sediments. In addition, the dating of bulk sediments very close to the maximum datable age of approximately 50 000 BP may cause a high uncertainty in the absolute ages of sediment layers (Reimer et al., 2013). Therefore, the rather small age inversions (> 49 000 to 49 232 cal BP in YED1, and 45 870 to 42 865 cal BP in Alas1) could be a result of material mixture in dated bulk samples. The radiocarbon ages above this age inversion align well with a simulated sedimentation rate, as shown in Fig. S2.
5.2 Yedoma and alas development
The differences in ice content between both cores and the homogeneous ice content throughout the whole Alas1 core indicate that thaw processes influenced the alas deposit. As described above, this is supported by the water isotope signals, which are quite homogeneous throughout Alas1. This is the quantitative evidence that these deposits have been previously thawed under thermokarst influence. The homogeneity in water isotopes is an outcome of percolating surface water during a thawed state. Subsequent talik refreezing in sandy sediments led to the formation of structureless pore ice, forming a taberal deposit (Wetterich et al., 2009). Refreezing, in our case, started from the surrounding frozen ground rather than from the surface, as a talik is still present in the upper core part. This allowed for the formation of structureless, invisible to micro-lenticular ice structures in the sandy material providing relatively large pore spaces (French and Shur, 2010). Due to the formation of those small ice structures, no sediment mobilization by the formation of, for example, large ice bands occurred in this core, resulting in an unmixed and clearly layered sediment. This also excludes cryoturbational processes as an explanation for the age inversions that we found.
The perennially frozen conditions since the incorporation of the Yedoma deposits into permafrost at YED1 are supported by the water isotope signals (Fig. 7) with much lower δ18O values for the Yedoma pore ice in comparison with the uppermost sample (4 cm b.s. in YED1). The latter shows a water isotope signal reflecting very recent climate and freezing, thawing and evaporation processes in the active layer. If the Yedoma core had been thawed at some point, intruding water would have led to a more homogeneous oxygen isotope signal throughout the core, as is obvious in the alas core. Also, the intact ice wedge provides evidence of a perennially frozen state throughout the depositional history at YED1. The stable isotope ratio values of wedge ice (mean δ18O of −30 ‰ and mean δ2H of −224 ‰) reflect winter precipitation and fit well into the regional pattern for Marine Isotope Stage (MIS) 3 ice wedges in central and interior Yakutia (Popp et al., 2006; Opel et al., 2019), whereas the d excess shows a much elevated value (16 ‰) compared with the regional pattern (Popp et al., 2006; Opel et al., 2019). The d-excess values from the middle part of the ice wedge correspond well to the regional values from Mamontova Gora, Tanda and Batagay (Opel et al., 2019), whereas the others resemble those of the host sediments and are potentially overprinted by exchange processes between wedge ice and pore ice (Meyer et al., 2010). Due to the low number of data points, no meaningful co-isotopic regression was calculated. The stable isotope composition of pore ice shows a co-isotopic regression of δ2H = 6.61 δ18O − 18.0 (R2=0.97, n=23), which is typical for Yedoma intrasedimental ice (Wetterich et al., 2011, 2014, 2016). The isotope values plot well above the regional Local Meteoric Water Line of the cold season (Papina et al., 2017), suggesting a substantial proportion of (early) winter precipitation – usually characterized by high d-excess values – for the pore ice, which is also evident for some units of the Batagay megaslump (Opel et al., 2019). The decreasing trend in pore ice isotopic δ values from the bottom to the top indicates a general cooling in central Yakutia during the time span covered by our study. However, as it is accompanied by an opposite increasing trend in d excess, these values may be overprinted by secondary freeze–thaw processes in the active layer and rather reflect the intensity of these fractionation processes (Wetterich et al., 2014).
The age–depth models of both cores show steep curves and higher sedimentation rates at the bottom of the cores, which slow down towards the surface (Figs. 4, 6 and S2). This indicates that the depositional environment at Alas1 was the same as at YED1 during the early phase of the sediment accumulation (∼ 45 000 to 35 000 cal BP). The steepness of the age–depth model suggests an upward decrease in the accumulation rate or can be interpreted as an increase in surface erosion towards the top of the YED1 core (Fig. S3a). Especially the sandy core part (Y3) accumulated rapidly, as indicated by the radiocarbon sample below dated to 49 232 cal BP (71.5 cm below the bottom of Y3) and the next radiocarbon sample above dated to 40 608 cal BP (420 cm above the top of Y3). Therefore, these 917 cm of Y3 accumulated in less than 8600 years, whereas the accumulation of 714 cm in Y1 took more than 18 700 years (40 608 cal BP at 589.5 cm b.s. and 21 890 cal BP at 157.5 cm b.s.; Table 1). The continuous steepness of the age–depth model of Alas1 (Fig. S2b) suggests a rather constant accumulation rate throughout the deposition of these sediments.
Due to the alternation of coarse and carbon-poor material (i.e., Y3 and A2, see Figs. 4 and 6) with fine carbon-rich material (i.e., Y1 and Y4 in Fig. 4 and A4 in Fig. 6), we suggest shifts in the sedimentary regime at the Yukechi study site (Soloviev, 1973; Ulrich et al., 2017a, b). This hypothesis is supported by the MS results, which give higher values for sandy core parts, hinting at a different material source, compared with the silty and carbon-bearing core units. Due to the great thickness of those sandy layers (core units 1 to 4 in Figs. 4 and 6), the most suitable explanation is material transport by tributaries on top of the (former) Yedoma uplands of the Abalakh Terrace. This indicates that the sandy material in the studied cores was deposited during the river-connected flooding phases at our study site. Moreover, fluvial transport gives a suitable explanation for low carbon content, as organic matter decomposition is often much higher under aquatic conditions (Cole et al., 2001). Furthermore, high flow velocity allows larger particles to be deposited, but it keeps lighter particles, like organic material, in suspension (Anderson et al., 1991; Wilcock and Crowe, 2003; Reineck and Singh, 2012).
Another explanation for the occurrence of these carbon-poor sandy layers is shifts in wind direction and wind speed and, therefore, the sediment carrying capacity of the wind (Pye, 1995). A shift in the eastern Siberian climate during the beginning of the Kargin interstadial (MIS 3, ∼ 50 000 BP) resulted in higher winter temperatures (Diekmann et al., 2017) and, therefore, higher pressure gradients within the atmosphere, leading to greater wind speeds. This, in turn, resulted in a higher sediment carrying capacity of the wind which provides a suitable explanation for the sediment differences. Also, sand dunes of the Lena River valley (Huh et al., 1998) could have provided sufficient sandy material throughout the formation of the sand layers found in the Yukechi deposits (Y3 and A2 in Figs. 4 and 6). The radiocarbon ages of these coarser core segments (Y3 and A2 in Figs. 4 and 6) dated between 39 000 and 18 000 cal BP match the timing of these climatic changes. Increased wind speeds at the beginning of a warmer interstadial phase during the MIS 3 (Karginian climate optimum from 50 000 to 30 000 BP) and a subsequent decrease in wind speed during the colder stadial MIS 2 are a suitable explanation (Diekmann et al., 2017). Those increased wind speeds could have led to further transport of the coarser material from the source area, enabling these materials to reach our study area (Anderson et al., 1991).
From our data we see that the sandy layers were deposited in approximately 7000 years (radiocarbon dates below and above these layers). As the sediments are rather coarse (115.3 µm mean grain size), a fluvial deposition is more likely than an aeolian deposition (Strauss et al., 2012). Moreover, the lack of organic material makes fluvial deposition the more plausible process. Thus, we think that periodic flooding events of Lena River tributaries near our study area are a more likely source of the sediments. The original Yedoma deposits of the Yukechi area were most likely formed by deposition of silty sediments and fine organic material during seasonal alluvial flooding. The climatic changes (Diekmann et al., 2017; Murton et al., 2017) and the resulting higher water availability during the deposition period of the sandy layers may have caused changes in fluvial patterns on the Abalakh Terrace. More water could cause higher flow velocities under warmer climatic conditions and, therefore, increased erosive power, leading to the formation of new flow channels (Reineck and Singh, 1980).
With a climatic backshift to colder conditions during MIS 2, water availability decreased and silty organic-bearing material was again deposited by seasonal flooding on top of the sandy layers. This likely led to lake initiation on top of the Yedoma deposits. The underlying ground began to thaw and subside, forming the Yukechi alas basin. During this process, ice was lost from the sediment and the ground subsided by at least 9 m (height difference of 9 m between YED1 and Alas1 surface). Surface or lake water was able to percolate through the unfrozen sediments. This is revealed by the homogeneous water isotope signal that is similar to the YED1 surface sample (Fig. 7). Under the unfrozen aquatic conditions in the sediment, microbial activity started, resulting in the decomposition of the already small amount of organic material (Cole et al., 2001). When the lake drained, the sediments started to refreeze both upward from the underlying permafrost and downward from the surface, leaving a talik in between (Fig. 5). The subsided ground indicates that core unit A4 (Fig. 6) lay beneath the lowest unit of the Yedoma core, Y4 (Fig. 4), while units A1 to A3 shrank due to thawing from approximately 2200 to 1200 cm in length. The presence of large ice wedges in the area supports this theory of ground subsidence during thaw, as it hints at the large excess ice contents of the ground (Fig. S7; Soloviev, 1959). These subsidence processes might represent the future path of the Yukechi Yedoma deposits, as an initiating talik of approximately 150 cm thickness has already been found at the YED1 site (Fig. 3a). This is caused by ground temperature warming which itself is affected by snow layer thickness and air temperatures among other factors and could lead to alas development (Ulrich et al., 2017a).
5.3 Central Yakutian Yedoma deposits in a circumpolar and regional context
Strauss et al. (2017) reported a mean organic carbon density for the upper 3 m of Yedoma deposits in the Lena–Aldan interfluve of 25 to 33 kg m−3 based on the data of Romanovskii (1993) and Hugelius et al. (2014). Using a bootstrapping approach (Jongejans and Strauss, 2020) we found a much lower organic carbon density of 4.48±1.43 kg m−3 for the top 3 m of the YED1 core. For Alas1, an organic carbon density of 6.93±2.90 kg m−3 was calculated for the top 3 m. Taking both the area covered by each deposit type within the Yukechi alas landscape and the ice wedge volumes estimated by Ulrich et al. (2014; see Sect. 2 and Fig. S2) into account, we find a mean organic carbon density of only 4.40 kg m−3 for the top 3 m of dry soil at the Yukechi study site. This landscape-scale carbon stock density includes the entire study area (1.4 km2), as well as all water bodies (approximately 0.18 km2), which we assumed to contain no soil carbon. This means that both the average Yukechi site carbon density and our individual cores' carbon densities are substantially below the range (25 to 33 kg m−3) reported by Strauss et al. (2017). This strong difference between previously published information and our new data from the same region can only be explained by the high depositional heterogeneity of the central Yakutian permafrost landscapes which was not represented in sufficient detail in the earlier dataset of Strauss et al. (2017). Geographically, the Yukechi area is located in one of the southernmost Yedoma areas in the Yedoma domain, which could be a reason for the differences from previously studied Arctic deposits (Schirrmeister et al., 2013; Strauss et al., 2013; Jongejans et al., 2018). The results of Siewert et al. (2015) for the Spasskaya Pad/Neleger site in a similar setting also differ greatly from our findings at the Yukechi site, showing carbon densities of approximately 19.3 kg m−3 for the top 2 m of larch forest-covered Yedoma deposits and approximately 21.9 kg m−3 for the top 2 m of grassland-covered alas deposits in a setting similar to the Yukechi site.
In general, Yedoma deposits are estimated to hold kg m−3 for the whole column within the Pleistocene Yedoma deposits (approximate depth of 25 m; Strauss et al., 2013). Jongejans et al. (2018) calculated a larger organic carbon stock of 15.3±1.6 kg m−3 for Yedoma deposits found on the Baldwin Peninsula in Alaska. Another study by Shmelev et al. (2017) reported a Yedoma carbon stock of 14.0±23.5 kg m−3 for a study region in northeastern Siberia between the Indigirka River and the Kolyma River.
Assessing the carbon inventory of the full-length central Yakutian cores examined in this study, we estimated an organic carbon density of 5.27±1.42 kg m−3 for the sediments of the YED1 core down to a depth of 22.12 m b.s., excluding the ice wedge. The organic carbon density within the Yukechi Yedoma is approximately 2–3 times lower than estimated in previous studies of deep Yedoma deposits (Strauss et al., 2013; Shmelev et al., 2017; Jongejans et al., 2018). Even when including roughly 10 m of organic carbon-free material, the higher carbon densities for the whole cores (compared with the carbon densities of the first 3 m) show that large portions of organic carbon are stored below 3 m. The Alas1 core contains slightly more organic carbon with a mean value of 6.07±1.80 kg m−3 organic carbon for the whole core (19.72 m), which is about 20 % of the mean thermokarst deposit carbon content of kg m−3 stated by Strauss et al. (2017). Within the alas core, organic carbon storage is slightly higher in the top 3 m (approximately 14 % more than below). This is likely a result of former lake coverage that led to an accumulation of the organically richer lake sediments found in the upper section of Alas1. Most likely there was enhanced growth of aquatic plants along with a reduction in the decomposition of the input organic material due to anaerobic conditions during the lake phase.
We conclude that the low organic carbon contents encountered in sections of both cores are not caused by the decomposition of originally high organic matter contents but are rather a legacy of the accumulation of organic-poor material during the late Pleistocene MIS 3 and MIS 2 periods. The most likely landscape scenario causing the differences in sediment and organic carbon characteristics during the Pleistocene deposition is the temporary existence of tributary rivers on the Abalakh Terrace with varying flow velocities and alternating paths as a result of climatic changes or local landscape dynamics. While the sedimentation on the Yedoma upland ceased with the onset of the Holocene, the alas was affected by thaw, subsidence and lake formation processes, resulting in a compaction of sediments in situ as well as causing higher carbon inputs under lacustrine conditions in the upper parts of the sediments.
We further show that the Yedoma deposits at this site down to a depth of 22 m are characterized by rather low organic carbon contents, often less than 1 wt % TOC, resulting in a mean carbon density of only ∼5 kg m−3.
Hence, the studied Yukechi Yedoma deposits store less carbon than other, comparable Yedoma ice complex deposits in the central Yakutian area. However, there have been comparatively few studies on this so far. Therefore, the biogeochemical impact of permafrost thawing in the Yukechi area might be smaller than generally assumed for Yedoma deposits, as this area does not feature the high carbon stock estimates and high ice contents of other previously studied localities in central Yakutia and elsewhere in the Arctic.
The permafrost characteristics found in the alas core reveal that its composition and stratigraphy before lake formation and disappearance was very similar to the Yedoma core material. Its past development including thaw, the loss of old ice and surface subsidence and sediment compaction, shows a possible pathway for the central Yakutian Yedoma deposits under the influence of global climate change.
The measurement data and laboratory results are available via PANGAEA at https://doi.org/10.1594/PANGAEA.898754 (Windirsch et al., 2019). A detailed core log is available for YED1 at https://doi.org/10.1594/PANGAEA.914874 and for Alas1 at https://doi.org/10.1594/PANGAEA.914876 (Windirsch et al., 2020a, b).
The supplement related to this article is available online at: https://doi.org/10.5194/bg-17-3797-2020-supplement.
JS designed the study concept. TW conducted the laboratory work, analyzed the laboratory results, prepared the graphics and led the writing of this paper. GG and ANF led the drilling expedition in 2015. JS, MU and PYK participated in the drilling fieldwork. GG and JS supervised the data analyses and provided expertise on thermokarst processes and cryostratigraphy. LS provided expertise on grain-size characteristics and central Yakutian permafrost genesis. MF designed the maps and provided expertise on Yedoma and thermokarst-affected carbon. LLJ developed the bootstrapping routine and provided expertise on carbon stock upscaling. JW developed the age–depth models and worked on age calibration and contextualization. TO interpreted the water isotope results and provided context for the isotope data. JS took part in the laboratory work and provided expertise on permafrost carbon processes. All authors commented on and edited the paper.
The authors declare that they have no conflict of interest.
This study is based on a joint field campaign of the ERC PETA-CARB project (starting grant no. 338335) and the DFG (grant no. UL426/1-1) and was carried out in cooperation with the Melnikov Permafrost Institute, Siberian Branch of Russian Academy of Sciences. Torben Windirsch was funded by the Potsdam Graduate School, and Loeka L. Jongejans was funded by the Deutsche Bundesstiftung Umwelt. The field campaign was supported by Avksentry P. Kondakov. We thank Dyke Scheidemann (Carbon and Nitrogen Lab, CarLa) as well as Mikaela Weiner and Hanno Meyer (Stable Isotope Lab) from the Alfred Wegener Institute for assistance in the laboratory. Planet data were provided freely through Planet's Education and Research program. We thank Candace O'Connor for language correction.
This research has been supported by the European Research Council (PETA-CARB; grant no. 338335) and the Deutsche Forschungsgemeinschaft (grant no. UL426/1-1).
The article processing charges for this open-access
publication were covered by a Research
Centre of the Helmholtz Association.
This paper was edited by Tyler Cyronak and reviewed by Go Iwahana and one anonymous referee.
Anderson, R. S., Sørensen, M., and Willetts, B. B.: A review of recent progress in our understanding of aeolian sediment transport, Aeolian Grain Transport, 1, 1–19, 1991.
Ashastina, K., Schirrmeister, L., Fuchs, M., and Kienast, F.: Palaeoclimate characteristics in interior Siberia of MIS 6–2: first insights from the Batagay permafrost mega-thaw slump in the Yana Highlands, Clim. Past, 13, 795–818, https://doi.org/10.5194/cp-13-795-2017, 2017.
Ballantyne, A. P., Alden, C. B., Miller, J. B., Tans, P. P., and White, J. W. C.: Increase in observed net carbon dioxide uptake by land and oceans during the past 50 years, Nature, 488, 70–72, https://doi.org/10.1038/nature11299, 2012.
Biskaborn, B. K., Smith, S. L., Noetzli, J., Matthes, H., Vieira, G., Streletskiy, D. A., Schoeneich, P., Romanovsky, V. E., Lewkowicz, A. G., Abramov, A., Allard, M., Boike, J., Cable, W. L., Christiansen, H. H., Delaloye, R., Diekmann, B., Drozdov, D., Etzelmüller, B., Grosse, G., Guglielmin, M., Ingeman-Nielsen, T., Isaksen, K., Ishikawa, M., Johansson, M., Johannsson, H., Joo, A., Kaverin, D., Kholodov, A., Konstantinov, P., Kröger, T., Lambiel, C., Lanckman, J.-P., Luo, D., Malkova, G., Meiklejohn, I., Moskalenko, N., Oliva, M., Phillips, M., Ramos, M., Sannel, A. B. K., Sergeev, D., Seybold, C., Skryabin, P., Vasiliev, A., Wu, Q., Yoshikawa, K., Zheleznyak, M., and Lantuit, H.: Permafrost is warming at a global scale, Nat. Commun., 10, 264, https://doi.org/10.1038/s41467-018-08240-4, 2019.
Blaauw, M. and Christen, J. A.: Flexible paleoclimate age-depth models using an autoregressive gamma process, Bayesian Anal., 6, 457–474, https://doi.org/10.1214/11-BA618, 2011.
Blott, S. J. and Pye, K.: GRADISTAT: a grain size distribution and statistics package for the analysis of unconsolidated sediments, Earth Surf. Proc. Land., 26, 1237–1248, https://doi.org/10.1002/esp.261, 2001.
Bosikov, N.: Wetness variability and dynamics of thermokarst processes in Central Yakutia, Proceedings of the 7th International Permafrost Conference, 1998, 71–74, 1998.
Butler, R. F.: Paleomagnetism: magnetic domains to geologic terranes, Blackwell Scientific Publications, Boston, 1992.
Chadburn, S. E., Burke, E. J., Cox, P. M., Friedlingstein, P., Hugelius, G., and Westermann, S.: An observation-based constraint on permafrost loss as a function of global warming, Nat. Clim. Change, 7, 340–344, https://doi.org/10.1038/nclimate3262, 2017.
Cole, J. J., Cole, J. J., Caraco, N. F., and Caraco, N. F.: Carbon in catchments: connecting terrestrial carbon losses with aquatic metabolism, Mar. Freshwater Res., 52, 101–110, https://doi.org/10.1071/MF00084, 2001.
Coplen, T. B., Brand, W. A., Gehre, M., Gröning, M., Meijer, H. A. J., Toman, B., and Verkouteren, R. M.: New Guidelines for δ13C Measurements, Anal. Chem., 78, 2439–2441, https://doi.org/10.1021/ac052027c, 2006.
Crate, S., Ulrich, M., Habeck, J. O., Desyatkin, A. R., Desyatkin, R. V., Fedorov, A. N., Hiyama, T., Iijima, Y., Ksenofontov, S., Mészáros, C., and Takakura, H.: Permafrost livelihoods: A transdisciplinary review and analysis of thermokarst-based systems of indigenous land use, Anthropocene, 18, 89–104, https://doi.org/10.1016/j.ancene.2017.06.001, 2017.
Crawley, M.: Statistics. An Introduction using R, 2nd Edn., Wiley, 2015.
Dearing, J.: Magnetic susceptibility, Environmental magnetism: A practical guide, 6, 35–62, 1999.
Diekmann, B., Pestryakova, L., Nazarova, L., Subetto, D., Tarasov, P. E., Stauch, G., Thiemann, A., Lehmkuhl, F., Biskaborn, B., and Kuhn, G. J. P.: Late Quaternary lake dynamics in the Verkhoyansk Mountains of Eastern Siberia: implications for climate and glaciation history, Polarforschung, 86, 97–110, https://doi.org/10.2312/polarforschung.86.2.97, 2017.
Diochon, A. and Kellman, L.: Natural abundance measurements of 13C indicate increased deep soil carbon mineralization after forest disturbance, Geophys. Res. Lett., 35, L14402, https://doi.org/10.1029/2008GL034795, 2008.
Fedorov, A. N.: Present post-disturbance dynamics of permafrost in Central Yakutia, Symptom of Environmental Change in Siberian Permafrost Region, Hokkaido University Press, Sapporo, 225–231, 2006.
Fedorov, A. and Konstantinov, P.: Observations of surface dynamics with thermokarst initiation, Yukechi site, Central Yakutia, Proceedings of the 8th International Conference on Permafrost, 21–25 July 2003, Zurich, Switzerland, 239–243, 2003.
French, H. and Shur, Y.: The principles of cryostratigraphy, Earth-Sci. Rev., 101, 190–206, https://doi.org/10.1016/j.earscirev.2010.04.002, 2010.
Friedlingstein, P., Jones, M. W., O'Sullivan, M., Andrew, R. M., Hauck, J., Peters, G. P., Peters, W., Pongratz, J., Sitch, S., Le Quéré, C., Bakker, D. C. E., Canadell, J. G., Ciais, P., Jackson, R. B., Anthoni, P., Barbero, L., Bastos, A., Bastrikov, V., Becker, M., Bopp, L., Buitenhuis, E., Chandra, N., Chevallier, F., Chini, L. P., Currie, K. I., Feely, R. A., Gehlen, M., Gilfillan, D., Gkritzalis, T., Goll, D. S., Gruber, N., Gutekunst, S., Harris, I., Haverd, V., Houghton, R. A., Hurtt, G., Ilyina, T., Jain, A. K., Joetzjer, E., Kaplan, J. O., Kato, E., Klein Goldewijk, K., Korsbakken, J. I., Landschützer, P., Lauvset, S. K., Lefèvre, N., Lenton, A., Lienert, S., Lombardozzi, D., Marland, G., McGuire, P. C., Melton, J. R., Metzl, N., Munro, D. R., Nabel, J. E. M. S., Nakaoka, S.-I., Neill, C., Omar, A. M., Ono, T., Peregon, A., Pierrot, D., Poulter, B., Rehder, G., Resplandy, L., Robertson, E., Rödenbeck, C., Séférian, R., Schwinger, J., Smith, N., Tans, P. P., Tian, H., Tilbrook, B., Tubiello, F. N., van der Werf, G. R., Wiltshire, A. J., and Zaehle, S.: Global Carbon Budget 2019, Earth Syst. Sci. Data, 11, 1783–1838, https://doi.org/10.5194/essd-11-1783-2019, 2019.
Grosse, G., Jones, B., and Arp, C.: 8.21 Thermokarst Lakes, Drainage, and Drained Basins, in: Treatise on Geomorphology, edited by: Shroder, J. F., Academic Press, San Diego, 325–353, 2013.
Horita, J., Ueda, A., Mizukami, K., and Takatori, I.: Automatic δD and δ18O analyses of multi-water samples using H2- and CO2-water equilibration methods with a common equilibration set-up, International Journal of Radiation Applications and Instrumentation. Part A. Applied Radiation and Isotopes, 40, 801–805, https://doi.org/10.1016/0883-2889(89)90100-7, 1989.
Hugelius, G., Strauss, J., Zubrzycki, S., Harden, J. W., Schuur, E. A. G., Ping, C.-L., Schirrmeister, L., Grosse, G., Michaelson, G. J., Koven, C. D., O'Donnell, J. A., Elberling, B., Mishra, U., Camill, P., Yu, Z., Palmtag, J., and Kuhry, P.: Estimated stocks of circumpolar permafrost carbon with quantified uncertainty ranges and identified data gaps, Biogeosciences, 11, 6573–6593, https://doi.org/10.5194/bg-11-6573-2014, 2014.
Huh, Y., Tsoi, M.-Y., Zaitsev, A., and Edmond, J. M.: The fluvial geochemistry of the rivers of Eastern Siberia: I. tributaries of the Lena River draining the sedimentary platform of the Siberian Craton, Geochim. Cosmochim. Ac., 62, 1657–1676, https://doi.org/10.1016/S0016-7037(98)00107-0, 1998.
IPCC: Summary for Policymakers, IPCC Special Report on the Ocean and Cryosphere in a Changing Climate, edited by: Pörtner, H.-O., Roberts, D. C., Masson-Delmotte, V., Zhai, P., Tignor, M., Poloczanska, E., Mintenbeck, K., Nicolai, M., Okem, A., Petzold, J., Rama, B., and Weyer, N., in press, 2019.
Johansson, M., Callaghan, T. V., Bosiö, J., Åkerman, H. J., Jackowicz-Korczynski, M., and Christensen, T. R.: Rapid responses of permafrost and vegetation to experimentally increased snow cover in sub-arctic Sweden, Environ. Res. Lett., 8, 035025, https://doi.org/10.1088/1748-9326/8/3/035025, 2013.
Jongejans, L. L. and Strauss, J.: Bootstrapping approach for permafrost organic carbon pool estimation, Zenodo, https://doi.org/10.5281/zenodo.3734247, 2020.
Jongejans, L. L., Strauss, J., Lenz, J., Peterse, F., Mangelsdorf, K., Fuchs, M., and Grosse, G.: Organic matter characteristics in yedoma and thermokarst deposits on Baldwin Peninsula, west Alaska, Biogeosciences, 15, 6033–6048, https://doi.org/10.5194/bg-15-6033-2018, 2018.
Katasonov, E. M. and Ivanov, M. S.: Cryolothology of central Yakutia (excursion on the Lena and Aldan Rivers), in: Guidebook, Second International Conference on Permafrost, U.S.S.R. Academy of Sciences, Yakutsk, 1973.
Katasonov, E. M.: Frozen-ground and facial analysis of Pleistocene deposits and paleogeography of Central Yakutia, Biuletyn Peryglacjalny, 24, 33–40, 1975.
Kuhry, P., Bárta, J., Blok, D., Elberling, B., Faucherre, S., Hugelius, G., Jørgensen, C. J., Richter, A., Šantrůčková, H., and Weiss, N.: Lability classification of soil organic matter in the northern permafrost region, Biogeosciences, 17, 361–379, https://doi.org/10.5194/bg-17-361-2020, 2020.
Kuznetsova, L. V., Zakharova, V. I., Sosina, N. K., Nikolin, E. G., Ivanova, E. I., Sofronova, E. V., Poryadina, L. N., Mikhalyova, L. G., Vasilyeva, I. I., Remigailo, P. A., Gabyshev, V. A., Ivanova, A. P., and Kopyrina, L. I.: Flora of Yakutia: Composition and Ecological Structure, in: The Far North: Plant Biodiversity and Ecology of Yakutia, edited by: Troeva, E. I., Isaev, A. P., Cherosov, M. M., and Karpov, N. S., Springer Netherlands, Dordrecht, 24–140, 2010.
Meyer, H., Schönicke, L., Wand, U., Hubberten, H. W., and Friedrichsen, H.: Isotope studies of hydrogen and oxygen in ground ice-experiences with the equilibration technique, Isot. Environ. Healt. S., 133–149, https://doi.org/10.1080/10256010008032939, 2000.
Meyer, H., Schirrmeister, L., Andreev, A., Wagner, D., Hubberten, H.-W., Yoshikawa, K., Bobrov, A., Wetterich, S., Opel, T., Kandiano, E., and Brown, J.: Lateglacial and Holocene isotopic and environmental history of northern coastal Alaska – Results from a buried ice-wedge system at Barrow, Quaternary Sci. Rev., 29, 3720–3735, https://doi.org/10.1016/j.quascirev.2010.08.005, 2010.
Meyers, P. A.: Organic geochemical proxies of paleoceanographic, paleolimnologic, and paleoclimatic processes, Org. Geochem., 27, 213–250, https://doi.org/10.1016/S0146-6380(97)00049-1, 1997.
Morgenstern, A., Grosse, G., Günther, F., Fedorova, I., and Schirrmeister, L.: Spatial analyses of thermokarst lakes and basins in Yedoma landscapes of the Lena Delta, The Cryosphere, 5, 849–867, https://doi.org/10.5194/tc-5-849-2011, 2011.
Murton, J. B., Edwards, M. E., Lozhkin, A. V., Anderson, P. M., Savvinov, G. N., Bakulina, N., Bondarenko, O. V., Cherepanova, M. V., Danilov, P. P., Boeskorov, V., Goslar, T., Grigoriev, S., Gubin, S. V., Korzun, J. A., Lupachev, A. V., Tikhonov, A., Tsygankova, V. I., Vasilieva, G. V., and Zanina, O. G.: Preliminary paleoenvironmental analysis of permafrost deposits at Batagaika megaslump, Yana Uplands, northeast Siberia, Quaternary Res., 87, 314–330, https://doi.org/10.1017/qua.2016.15, 2017.
Nazarova, L., Lüpfert, H., Subetto, D., Pestryakova, L., and Diekmann, B.: Holocene climate conditions in central Yakutia (Eastern Siberia) inferred from sediment composition and fossil chironomids of Lake Temje, Quaternary Int., 290–291, 264–274, https://doi.org/10.1016/j.quaint.2012.11.006, 2013.
Nitzbon, J., Westermann, S., Langer, M., Martin, L., Strauss, J., Laboor, S., and Boike, J.: Fast response of cold ice-rich permafrost in northeast Siberia to a warming climate, Nat Commun., 11, 2201, https://doi.org/10.1038/s41467-020-15725-8, 2020.
Nitze, I., Grosse, G., Jones, B. M., Romanovsky, V. E., and Boike, J.: Remote sensing quantifies widespread abundance of permafrost region disturbances across the Arctic and Subarctic, Nat. Commun., 9, 1–11, https://doi.org/10.1038/s41467-018-07663-3, 2018.
Opel, T., Meyer, H., Wetterich, S., Laepple, T., Dereviagin, A., and Murton, J.: Ice wedges as archives of winter paleoclimate: A review, Permafrost and Periglacial Processes, 29, 199–209, https://doi.org/10.1002/ppp.1980, 2018.
Opel, T., Murton, J. B., Wetterich, S., Meyer, H., Ashastina, K., Günther, F., Grotheer, H., Mollenhauer, G., Danilov, P. P., Boeskorov, V., Savvinov, G. N., and Schirrmeister, L.: Past climate and continentality inferred from ice wedges at Batagay megaslump in the Northern Hemisphere's most continental region, Yana Highlands, interior Yakutia, Clim. Past, 15, 1443–1461, https://doi.org/10.5194/cp-15-1443-2019, 2019.
Papina, T., Malygina, N., Eirikh, A., Galanin, A., and Zheleznyak, M.: Isotopic composition and sources of atmospheric precipitation in Central Yakutia, Earth's Cryosphere, 21, 52–61, https://doi.org/10.21782/EC2541-9994-2017-1(52-61), 2017.
Péwé, T. L. and Journaux, A.: Origin and character of loesslike silt in unglaciated south-central Yakutia, Siberia, USSR, USGPO, Professional Paper 2330-7102, 1983.
Péwé, T. L., Journaux, A., and Stuckenrath, R.: Radiocarbon Dates and Late-Quaternary Stratigraphy from Mamontova Gora, Unglaciated Central Yakutia, Siberia, U.S.S.R, Quaternary Res., 8, 51–63, https://doi.org/10.1016/0033-5894(77)90056-4, 1977.
Planet Team: Planet Application Program Interface: In Space for Life on Earth, San Francisco, CA, available at: https://api.planet.com (last access: 7 November 2019), 2017.
Popp, S., Diekmann, B., Meyer, H., Siegert, C., Syromyatnikov, I., and Hubberten, H.-W.: Palaeoclimate signals as inferred from stable-isotope composition of ground ice in the Verkhoyansk foreland, Central Yakutia, Permafrost and Periglacial Processes, 17, 119–132, https://doi.org/10.1002/ppp.556, 2006.
Pye, K.: The nature, origin and accumulation of loess, Quaternary Sci. Rev., 14, 653–667, https://doi.org/10.1016/0277-3791(95)00047-X, 1995.
Reimer, P. J., Bard, E., Bayliss, A., Beck, J. W., Blackwell, P. G., Ramsey, C. B., Buck, C. E., Cheng, H., Edwards, R. L., Friedrich, M., Grootes, P. M., Guilderson, T. P., Haflidason, H., Hajdas, I., Hatté, C., Heaton, T. J., Hoffmann, D. L., Hogg, A. G., Hughen, K. A., Kaiser, K. F., Kromer, B., Manning, S. W., Niu, M., Reimer, R. W., Richards, D. A., Scott, E. M., Southon, J. R., Staff, R. A., Turney, C. S. M., and Plicht, J. v. d.: IntCal13 and Marine13 Radiocarbon Age Calibration Curves 0–50,000 Years cal BP, Radiocarbon, 55, 1869–1887, https://doi.org/10.2458/azu_js_rc.55.16947, 2013.
Reineck, H.-E. and Singh, I. B.: Depositional sedimentary environments, 2nd Edn., Springer-Verlag, New York Berlin Heidelberg, 1980.
Reineck, H. E. and Singh, I. B.: Depositional Sedimentary Environments: With Reference to Terrigenous Clastics, Springer Science & Business Media, Berlin/Heidelberg, 566 pp., 2012.
Romanovskii, N.: Fundamentals of cryogenesis of lithosphere, Moscow University Press, Moscow, 1993.
Santoro, M. and Strozzi, T.: Circumpolar digital elevation models >55∘ N with links to geotiff images, ESA data user element – permafrost, PANGAEA, https://doi.org/10.1594/PANGAEA.779748, 2012.
Schirrmeister, L., Siegert, C., Kuznetsova, T., Kuzmina, S., Andreev, A., Kienast, F., Meyer, H., and Bobrov, A.: Paleoenvironmental and paleoclimatic records from permafrost deposits in the Arctic region of Northern Siberia, Quaternary Int., 89, 97–118, https://doi.org/10.1016/S1040-6182(01)00083-0, 2002.
Schirrmeister, L., Froese, D., Tumskoy, V., Grosse, G., and Wetterich, S.: Yedoma: Late Pleistocene ice-rich syngenetic permafrost of Beringia, in: Encyclopedia of Quaternary Science, 2nd Edn., Elsevier, Amsterdam, 542–552, 2013.
Schuur, E. A. G., Bockheim, J., Canadell, J. G., Euskirchen, E., Field, C. B., Goryachkin, S. V., Hagemann, S., Kuhry, P., Lafleur, P. M., Lee, H., Mazhitova, G., Nelson, F. E., Rinke, A., Romanovsky, V. E., Shiklomanov, N., Tarnocai, C., Venevsky, S., Vogel, J. G., and Zimov, S. A.: Vulnerability of Permafrost Carbon to Climate Change: Implications for the Global Carbon Cycle, BioScience, 58, 701–714, https://doi.org/10.1641/B580807, 2008.
Schuur, E. A. G., McGuire, A. D., Schädel, C., Grosse, G., Harden, J. W., Hayes, D. J., Hugelius, G., Koven, C. D., Kuhry, P., Lawrence, D. M., Natali, S. M., Olefeldt, D., Romanovsky, V. E., Schaefer, K., Turetsky, M. R., Treat, C. C., and Vonk, J. E.: Climate change and the permafrost carbon feedback, Nature, 520, 171, https://doi.org/10.1038/nature14338, 2015.
Shmelev, D., Veremeeva, A., Kraev, G., Kholodov, A., Spencer, R. G. M., Walker, W. S., and Rivkina, E.: Estimation and Sensitivity of Carbon Storage in Permafrost of North-Eastern Yakutia, Permafrost and Periglacial Processes, 28, 379–390, https://doi.org/10.1002/ppp.1933, 2017.
Siewert, M. B., Hanisch, J., Weiss, N., Kuhry, P., Maximov, T. C., and Hugelius, G.: Comparing carbon storage of Siberian tundra and taiga permafrost ecosystems at very high spatial resolution, J. Geophys. Res.-Biogeo., 120, 1973–1994, https://doi.org/10.1002/2015JG002999, 2015.
Soloviev, P.: Guidebook: alass thermokarst relief of central Yakutia, Second International Conference on Permafrost, 1973, USSR Academy of Sciences, Section of Earth's Sciences, Siberian Division, Yakutsk, 13–28, 1973.
Soloviev, P. A.: Cryolithic Zone of the Northern Part of Lena-Amga Interfluve, Academy of Sciences of the USSR press, Moscow, 144 pp., 1959.
Stevenson, F. J.: Humus chemistry: genesis, composition, reactions, John Wiley & Sons, Hoboken, New Jersey, 1994.
Strauss, J., Schirrmeister, L., Wetterich, S., Borchers, A., and Davydov, S. P.: Grain-size properties and organic-carbon stock of Yedoma Ice Complex permafrost from the Kolyma lowland, northeastern Siberia, Global Biogeochem. Cy., 26, GB3003, https://doi.org/10.1029/2011GB004104, 2012.
Strauss, J., Schirrmeister, L., Grosse, G., Wetterich, S., Ulrich, M., Herzschuh, U., and Hubberten, H.-W.: The deep permafrost carbon pool of the Yedoma region in Siberia and Alaska, Geophys. Res. Lett., 40, 6165–6170, https://doi.org/10.1002/2013GL058088, 2013.
Strauss, J., Schirrmeister, L., Mangelsdorf, K., Eichhorn, L., Wetterich, S., and Herzschuh, U.: Organic-matter quality of deep permafrost carbon – a study from Arctic Siberia, Biogeosciences, 12, 2227–2245, https://doi.org/10.5194/bg-12-2227-2015, 2015.
Strauss, J., Schirrmeister, L., Grosse, G., Fortier, D., Hugelius, G., Knoblauch, C., Romanovsky, V., Schädel, C., Schneider von Deimling, T., Schuur, E. A. G., Shmelev, D., and Veremeeva, A.: Deep Yedoma permafrost: A synthesis of depositional characteristics and carbon vulnerability, Earth-Sci. Rev., 172, 75–86, https://doi.org/10.1016/j.earscirev.2017.07.007, 2017.
Stuiver, M., Reimer, P. J., and Reimer, R. W.: CALIB 7.1 [WWW program], available at: http://calib.org (last access: 9 July 2020), 2018.
Turetsky, M. R., Abbott, B. W., Jones, M. C., Walter Anthony, K., Olefeldt, D., Schuur, E. A. G., Koven, C., McGuire, A. D., Grosse, G., Kuhry, P., Hugelius, G., Lawrence, D. M., Gibson, C., and Sannel, A. B. K.: Permafrost collapse is accelerating carbon release, Nature, 569, 32–34, https://doi.org/10.1038/d41586-019-01313-4, 2019.
Turetsky, M. R., Abbott, B. W., Jones, M. C., Walter Anthony, K., Olefeldt, D., Schuur, E. A. G., Grosse, G., Kuhry, P., Hugelius, G., Koven, C., Lawrence, D. M., Gibson, C., Sannel, A. B. K., and McGuire, A. D.: Carbon release through abrupt permafrost thaw, Nat. Geosci., 13, 138–143, https://doi.org/10.1038/s41561-019-0526-0, 2020.
Ulrich, M., Grosse, G., Strauss, J., and Schirrmeister, L.: Quantifying Wedge-Ice Volumes in Yedoma and Thermokarst Basin Deposits, Permafrost and Periglacial Processes, 25, 151–161, https://doi.org/10.1002/ppp.1810, 2014.
Ulrich, M., Matthes, H., Schirrmeister, L., Schütze, J., Park, H., Iijima, Y., and Fedorov, A. N.: Differences in behaviour and distribution of permafrost-related lakes in Central Yakutia and their response to climatic drivers, Water Resour. Res., 1167–1188, https://doi.org/10.1002/2016WR019267, 2017a.
Ulrich, M., Wetterich, S., Rudaya, N., Frolova, L., Schmidt, J., Siegert, C., Fedorov, A. N., and Zielhofer, C.: Rapid thermokarst evolution during the mid-Holocene in Central Yakutia, Russia, Holocene, 27, 1899–1913, https://doi.org/10.1177/0959683617708454, 2017b.
Ulrich, M., Matthes, H., Schmidt, J., Fedorov, A. N., Schirrmeister, L., Siegert, C., Schneider, B., Strauss, J., and Zielhofer, C.: Holocene thermokarst dynamics in Central Yakutia – A multi-core and robust grain-size endmember modeling approach, Quaternary Sci. Rev., 218, 10–33, https://doi.org/10.1016/j.quascirev.2019.06.010, 2019.
Walter Anthony, K. M., Zimov, S. A., Grosse, G., Jones, M. C., Anthony, P. M., Iii, F. S. C., Finlay, J. C., Mack, M. C., Davydov, S., Frenzel, P., and Frolking, S.: A shift of thermokarst lakes from carbon sources to sinks during the Holocene epoch, Nature, 511, 452–456, https://doi.org/10.1038/nature13560, 2014.
Weiss, N., Blok, D., Elberling, B., Hugelius, G., Jørgensen, C. J., Siewert, M. B., and Kuhry, P.: Thermokarst dynamics and soil organic matter characteristics controlling initial carbon release from permafrost soils in the Siberian Yedoma region, Sediment. Geol., 340, 38–48, https://doi.org/10.1016/j.sedgeo.2015.12.004, 2016.
Wetterich, S., Herzschuh, U., Meyer, H., Pestryakova, L., Plessen, B., Lopez, C. M. L., and Schirrmeister, L.: Evaporation effects as reflected in freshwater and ostracod calcite from modern environments in Central and Northeast Yakutia (East Siberia, Russia), Hydrobiologia, 614, 171–195, https://doi.org/10.1007/s10750-008-9505-y, 2008.
Wetterich, S., Schirrmeister, L., Andreev, A. A., Pudenz, M., Plessen, B., Meyer, H., and Kunitsky, V. V.: Eemian and Late Glacial/Holocene palaeoenvironmental records from permafrost sequences at the Dmitry Laptev Strait (NE Siberia, Russia), Palaeogeogr. Palaeocl., 279, 73–95, https://doi.org/10.1016/j.palaeo.2009.05.002, 2009.
Wetterich, S., Rudaya, N., Tumskoy, V., Andreev, A. A., Opel, T., Schirrmeister, L., and Meyer, H.: Last Glacial Maximum records in permafrost of the East Siberian Arctic, Quaternary Sci. Rev., 30, 3139–3151, https://doi.org/10.1016/j.quascirev.2011.07.020, 2011.
Wetterich, S., Tumskoy, V., Rudaya, N., Andreev, A. A., Opel, T., Meyer, H., Schirrmeister, L., and Hüls, M.: Ice Complex formation in arctic East Siberia during the MIS3 Interstadial, Quaternary Sci. Rev., 84, 39–55, https://doi.org/10.1016/j.quascirev.2013.11.009, 2014.
Wetterich, S., Tumskoy, V., Rudaya, N., Kuznetsov, V., Maksimov, F., Opel, T., Meyer, H., Andreev, A. A., and Schirrmeister, L.: Ice Complex permafrost of MIS5 age in the Dmitry Laptev Strait coastal region (East Siberian Arctic), Quaternary Sci. Rev., 147, 298–311, https://doi.org/10.1016/j.quascirev.2015.11.016, 2016.
Wilcock, P. R. and Crowe, J. C.: Surface-based Transport Model for Mixed-Size Sediment, J. Hydraul. Eng., 129, 120–128, https://doi.org/10.1061/(ASCE)0733-9429(2003)129:2(120), 2003.
Windirsch, T., Grosse, G., Ulrich, M., Schirrmeister, L., Fedorov, A. N., Konstantinov, P., Fuchs, M., and Strauss, J.: Organic material, sediment and ice characteristics of two permafrost cores from Yukechi Alas, Central Yakutia, PANGAEA, https://doi.org/10.1594/PANGAEA.898754, 2019.
Windirsch, T., Grosse, G., Ulrich, M., Schirrmeister, L., Fedorov, A. N., Konstantinov, P., Fuchs, M., Jongejans, L. L., Wolter, J., Opel, T., and Strauss, J.: Detailed core log of deep permafrost core YUK15-Alas1, PANGAEA, https://doi.org/10.1594/PANGAEA.914876, 2020a.
Windirsch, T., Grosse, G., Ulrich, M., Schirrmeister, L., Fedorov, A. N., Konstantinov, P., Fuchs, M., Jongejans, L. L., Wolter, J., Opel, T., and Strauss, J.: Detailed core log of deep permafrost core YUK15-YED1, PANGAEA, https://doi.org/10.1594/PANGAEA.914874, 2020b.
Zhang, T., Barry, R. G., Knowles, K., Heginbottom, J. A., and Brown, J.: Statistics and characteristics of permafrost and ground-ice distribution in the Northern Hemisphere, Polar Geogr., 23, 132–154, https://doi.org/10.1080/10889379909377670, 1999.
Zimov, S. A., Davydov, S. P., Zimova, G. M., Davydova, A. I., Schuur, E. A. G., Dutta, K., and Chapin, F. S.: Permafrost carbon: Stock and decomposability of a globally significant carbon pool, Geophys. Res. Lett., 33, L20502, https://doi.org/10.1029/2006GL027484, 2006.