the Creative Commons Attribution 4.0 License.
the Creative Commons Attribution 4.0 License.
 | 31 Jul 2020
The stable carbon isotope signature of methane produced by saprotrophic fungi
Moritz Schroll
Frank Keppler
Markus Greule
Christian Eckhardt
Holger Zorn
Katharina Lenhart
Methane (CH4) is the most abundant organic compound in the atmosphere and is emitted from many biotic and abiotic sources. Recent studies have shown that CH4 production occurs under aerobic conditions in eukaryotes, such as plants, animals, algae, and saprotrophic fungi. Saprotrophic fungi play an important role in nutrient recycling in terrestrial ecosystems via the decomposition of plant litter. Although CH4 production by saprotrophic fungi has been reported, no data on the stable carbon isotope values of the emitted CH4 (δ13C-CH4 values) are currently available. In this study, we measured the δ13C values of CH4 and carbon dioxide (δ13C-CO2 values) emitted by two saprotrophic fungi, Pleurotus sapidus (oyster mushroom) and Laetiporus sulphureus (sulphur shelf), cultivated on three different substrates, pine wood (Pinus sylvestris), grass (mixture of Lolium perenne, Poa pratensis, and Festuca rubra), and corn (Zea mays), which reflect both C3 and C4 plants with distinguished bulk δ13C values. Applying Keeling plots, we found that the δ13C source values of CH4 emitted from fungi cover a wide range from −40 to −69 mUr depending on the growth substrate and fungal species. Whilst little apparent carbon isotopic fractionation (in the range from −0.3 to 4.6 mUr) was calculated for the δ13C values of CO2 released from P. sapidus and L. sulphureus relative to the bulk δ13C values of the growth substrates, much larger carbon isotopic fractionations (ranging from −22 to −42 mUr) were observed for the formation of CH4. Although the two fungal species showed similar δ13CH4 source values when grown on pine wood, δ13CH4 source values differed substantially between the two fungal species when they were grown on grass or corn. We found that the source values of δ13CH4 emitted by saprotrophic fungi are highly dependent on the fungal species and the metabolized substrate. The source values of δ13CH4 cover a broad range and overlap with values reported for methanogenic archaea, the thermogenic degradation of organic matter, and other eukaryotes.
- Article
(640 KB) - Full-text XML
-
Supplement
(218 KB) - BibTeX
- EndNote


Methane (CH4) is an important greenhouse gas that is emitted by several abiotic sources (e.g. fossil fuel, biomass burning, and geological processes) and biotic sources (e.g. wetlands, agriculture and waste, and fresh waters) to the atmosphere (Kirschke et al., 2013; Saunois et al., 2016, 2020). In the past, biotic CH4 production has been attributed exclusively to strictly anaerobic microorganisms, such as methanogens, that are ubiquitous in wetlands, rice paddies, landfills, and the intestines of termites and ruminants (Kirschke et al., 2013). The discovery of CH4 emissions from dead and living plants under oxic conditions (Keppler et al., 2006, 2009) paved the way for the search for new biogenic CH4 sources. Since then, several previously unknown CH4 sources have been discovered, including the endothelial cells of rat liver (Boros and Keppler, 2019; Ghyczy et al., 2008), plant cell cultures (Wishkerman et al., 2011), marine algae (Klintzsch et al., 2019; Lenhart et al., 2016), marine and terrestrial cyanobacteria (Bižić et al., 2020), humans (Keppler et al., 2016), and saprotrophic fungi (Lenhart et al., 2012).
Fungi play a central role in ecosystems by decomposing organic matter, thereby recycling formerly bound carbon and nutrients (Grinhut et al., 2007). This process is especially important in forests where fungi are essential for wood decay and have a great impact on the carbon and nitrogen cycles (Ralph and Catcheside, 2002). White rot fungi (e.g. Trametes versicolor or Pleurotus ostreatus) are able to decompose the chemically complex structural component lignin, whereas brown rot fungi (e.g. Serpula lacrymans or Gloeophyllum trabeum) mainly metabolize cellulose and hemicellulose (Ten Have and Teunissen, 2001; Leonowicz et al., 1999; Valášková and Baldrian, 2006). Fungi have already been determined to be involved in the synthesis of CH4 during wood decay (Beckmann et al., 2011; Mukhin and Voronin, 2007, 2008) via the breakdown of large macromolecules to smaller molecules, thereby providing bacteria and archaea with essential substrate. Elevated levels of CH4 were found in fungus-infected wood stems with oxygen concentrations ranging from 1 % to 14 % (Hietala et al., 2015). Here, CH4 production was associated with anoxic microsites in the xylem, indicating that at least part of the CH4 was produced by methanogenic archaea. Nevertheless, Lenhart et al., 2012 demonstrated that basidiomycetes are able to produce CH4 under aerobic conditions without the presence of methanogenic archaea. Therefore, fungi might be an underestimated source of CH4 in the global CH4 cycle.
Stable carbon isotopes (expressed as δ13C values) have often been used to investigate sources and sinks of CH4 on the global scale (Whiticar, 1993). As different CH4 sources have characteristic δ13C values, δ13C-CH4 values might be used to quantify the individual contributions of various sources regionally and/or globally (Dlugokencky et al., 2011; Hein et al., 1997; Nisbet et al., 2016; Quay et al., 1999; Tyler, 1986; Whiticar, 1999). The short lifetime of CH4 in the atmosphere (from 9.7±1.5 to 11.2±1.3 years; Naik et al., 2013; Prather et al., 2012; Voulgarakis et al., 2013) assures that global isotopic δ13C-CH4 patterns represent the average of recent inputs by various sources and allows for the quantification of respective source strengths (Mikaloff Fletcher et al., 2004a, b).
Additionally, stable isotopes provide information about the formation processes of CH4. Traditionally, three formation categories of δ13C-CH4 values have been identified: biogenic, with typical δ13C-CH4 values ranging from to −70 mUr; thermogenic, with typical δ13C-CH4 values ranging from to −55 mUr; and pyrogenic, with typical δ13C-CH4 values ranging from to −25 mUr (Kirschke et al., 2013). However, stable isotope values of recently identified CH4 sources, i.e. human CH4 emissions (−56 to −95 mUr; Keppler et al., 2016), plant-derived CH4 (−52 to −69 mUr; Keppler et al., 2006), and abiotic UV-induced CH4 formation by plants (−52 to −67 mUr; Vigano et al., 2009) also need to be considered.
In this study, we investigated the stable carbon isotope source signatures of CH4 and CO2 released by the two basidiomycetes Pleurotus sapidus (white rot fungus) and Laetiporus sulphureus (brown rot fungus). Both fungi were cultivated under sterile conditions on three different substrates (pine wood, grass, and corn) with varying bulk δ13C values. We examined the influence of fungal species and growth substrate on δ13C-CH4 and δ13C-CO2 values and compared the δ13C-CH4 values from the two fungal species with those of other known sources reported in the literature.
2.1 Selected fungi
P. sapidus (Pleurotaceae, DSMZ 8266) and L. sulphureus (Polyporacaeae, DSMZ 1014) were chosen for this experiment because of their capability to emit CH4 (Lenhart et al., 2012), their ecological and physiological characteristics (P. sapidus is a white rot fungus and L. sulphureus is a brown rot fungus), and their well-established practical handling under laboratory conditions.
2.2 Cultivation of fungi and incubation experiments
Pine wood (Pinus sylvestris), grass (mixture of Lolium perenne, Poa pratensis, and Festuca rubra) and corn (Zea mays) were selected as growth substrates. Pine wood was chosen to investigate if white rot and brown rot fungi differ with respect to the δ13C-CH4 and δ13C-CO2 values released during wood decay. Therefore, dead pine wood branches were collected from the forest floor and shredded to small wood chips with a length of about 5 cm (Natura 1800L; Gloria, Witten, Germany). The wood chips were dried at 60 ∘C for 48 h and stored in a flask (WECK GmbH, Hanau, Germany). Grass (C3 plant) and corn (C4 plant) were selected because of their different stable isotope values. As the metabolic pathway for carbon fixation is biochemically different in C3 and C4 plants, plant biomass differs with respect to δ13C values, which, in turn, might lead to different δ13C values of CH4 and CO2 released by fungi. Therefore, typical garden lawn was manually cut, dried at 70 ∘C, and stored in a flask. The corn substrate consisted of conventional corn flour.
The substrates were autoclaved, filled into 2.7 L flasks (WECK GmbH, Hanau, Germany), and inoculated with pure fungal submerged cultures under sterile conditions following Lenhart et al. (2012). After the addition of the fungi, the flasks were closed with lids and a rubber band sealing. To allow gas exchange during the fungal growth period (about 2 weeks), a hole in the centre of every lid was fitted with a cotton stopper. Before the start of the incubation experiments, the flasks were aerated under sterile conditions in order to start the incubation at atmospheric CH4 mixing ratios. Additionally, to create an airtight seal, the flask's cotton stoppers were replaced by sterile silicone stoppers (Saint-Gobain Performance Plastics, Charny, France).
For the incubation experiments, P. sapidus and L. sulphureus were incubated on the three substrates, while uninoculated substrates were also incubated as control treatments. Before the incubation experiments, the substrates were sterilized by autoclaving at 121 ∘C and 2 bar pressure for 20 min. The incubation experiments were conducted using three replicates per treatment. The duration of the incubation accounted for up to 40 h. All incubations were conducted at room temperature (23±1.5 ∘C). At every sampling point, 40 mL of air was taken from the flasks for gas concentration measurements and an additional 40 mL was taken for δ13C-CH4 stable isotope ratio mass spectrometry (IRMS) analysis. The gas samples were taken with airtight 60 mL PE syringes (Plastipak, BD, Franklin Lakes, USA) and transferred into 12 mL evacuated Exetainer vials (Labco, High Wycombe, UK). Subsequently, a volume of atmospheric air equivalent to the volume of the removed sample was added into each flask directly after sampling. Mixing ratios and stable isotope values of CH4 were corrected according to the dilution.
When calculating the fungal CH4 and CO2 production rates, we subtracted substrate-derived CH4 and CO2 production rates (determined using the control treatments) from the respective fungi-containing samples. Additionally, only sample points showing a linear increase in CH4 and CO2 were considered in the calculation of the fungal production rates.
To account for differences in the metabolic activity of the fungi, we additionally measured respiration rates, assuming that metabolic activity correlates with respiration and, therefore, the CO2 emissions of the fungi. Hence, we related fungus-derived CH4 emissions to respiration by calculating the CH4:CO2 emission ratio.
2.3 Analysis of CH4 and CO2 via gas chromatography
Samples were analysed using a gas chromatograph (GC, Bruker Greenhouse Gas Analyser 450-GC) equipped with a flame ionization detector (FID) and an electron capture detector (ECD) for the detection of CH4 and CO2 respectively. The detector temperatures were set at 300 ∘C (FID) and 350 ∘C (ECD). Five reference gases (Deuste Steininger GmbH) were used to calibrate the GC system. The reference gases were in the range from 1 ppmv (parts per million by volume) to 21 and from 304 to 40 000 ppmv for CH4 and CO2 respectively. Gas peaks were integrated using Galaxie software (Varian Inc., Palo Alto, CA, USA).
2.4 Definition of δ values and isotope apparent fractionation
In this paper, all stable carbon isotope ratios are expressed in the conventional “delta” (δ) notation, meaning the relative difference of the isotope ratio of a substance from the standard substance Vienna Peedee Belemnite (V-PDB):
The apparent fractionation (εapp) between fungal δ13C-CH4 or δ13C-CO2 values and the δ13C values of the substrates was calculated according to Eq. (2):
We follow the proposal of Brand and Coplen (2012) and use the term “urey” (Ur) as the isotope delta unit, in order to conform with the guidelines for the International System of Units (SI). Hence, isotope delta values that were formerly given as −70 ‰ are expressed as −70 mUr.
2.5 Measurements of δ13CH4 and δ13CO2 values
Stable carbon isotope values of CH4 and CO2 were measured using a continuous flow isotope mass spectrometry system (CF-IRMS). A HP 6890N GC (Agilent, Santa Clara, USA) was linked to a pre-concentration unit for CH4 measurements and an A200S autosampler (CTC Analytics, Zwingen, Switzerland) for CO2 analysis. The GC was equipped with a CP-PoraPLOT Q capillary column (27.5 m×0.25 mm i.d., film thickness 8 µm; Varian, Palo Alto, USA). The GC was operated with an injector temperature of 200 ∘C, an isothermal oven temperature of 30 ∘C, split injection (10:1), and a constant carrier gas flow of 1.8 mL min−1 (methane-free helium). The GC was coupled to a DeltaPLUSXL isotope ratio mass spectrometer (ThermoQuest Finnigan, Bremen, Germany) via an oxidation reactor and a GC Combustion III interface (ThermoQuest Finnigan, Bremen, Germany). The oxidation reactor was employed with the following properties: a ceramic tube (Al2O3; length 320 mm, 1.0 mm i.d.) with Ni∕Pt wires inside activated by oxygen and a reactor temperature of 960 ∘C.
For CH4 measurements with the pre-concentration unit, headspace gas samples were transferred to an evacuated 40 mL sample loop. Methane was trapped on HayeSep D, separated from other compounds by the GC, and then introduced into the IRMS system via an open split. The monitor gas was carbon dioxide of high purity (carbon dioxide 4.5, Messer Griesheim, Frankfurt, Germany) with a known δ13C value of −23.6 mUr (calibrated at the Max Planck Institute for Biogeochemistry in Jena, Germany). All δ13C values were corrected using two CH4 reference standards (Isometric instruments, Victoria, Canada) with δ13C values of and mUr that were calibrated against International Atomic Energy Agency (IAEA) and National Institute of Standards and Technology (NIST) reference substances. The normalization of the sample values was carried out according to Paul et al. (2007).
2.6 Bulk isotope analysis of fungal substrates
Stable carbon isotope values of the bulk substrate were measured using an FlashEA 1112 elemental analyser (Thermo Fisher Scientific, Germany) coupled to a Delta V IRMS (Thermo Fisher Scientific, Germany). Therefore, 0.06 mg of the substrate was put into a tin cup and combusted in the elemental analyser. The resulting gases were separated in a GC by a CP-PoraPLOT Q capillary column (27.5 m×0.25 mm i.d., film thickness 8 µm; Varian, Palo Alto, USA) and then reached the Delta V IRMS via a Conflo IV universal continuous flow interface (Thermo Fisher Scientific, Germany). Isotope values were corrected using USGS 40 and USGS 41 standards.
2.7 Determination of isotopic source signature of CH4 and CO2 applying Keeling plots
For the determination of δ13C source values of CH4 and CO2, the Keeling plot method was used (Keeling, 1958; Pataki et al., 2003):
where ca is the mixing ratio of CH4∕CO2 in the headspace, δ13Ca is the δ13C value of CH4∕CO2 in the headspace, cb is the mixing ratio of background CH4∕CO2, δ13Cb is the δ13C value of background CH4∕CO2, and δ13Cs is the δ13C source value of the CH4∕CO2. For a more detailed description of the application of Keeling plots for the determination of the CH4 source signature, we refer to the study by Keppler et al. (2016).
δ13C-CH4 source signatures were calculated following the Keeling plot method for each flask. Results of the Keeling plots are then given as the arithmetic mean of the three individual flasks per treatment with their standard deviations (n=3).
The δ13C-CH4 source signatures of each flask of P. sapidus and L. sulphureus grown on pine were corrected for CH4 emissions and δ13C-CH4 values of the “pine” control samples using the following mass balance approach:
where P(CH4)fungi/pine wood is the CH4 emitted by the fungi or pine wood, and δ13Cfungi/pinewood is the δ13C-CH4 source signature of the fungi or pine wood derived from the Keeling plots. Corrected δ13C-CH4 source values for P. sapidus and L. sulphureus are given as the arithmetic mean of the three individual flasks per treatment with their standard deviations (n=3).
The determination coefficient (R2) of the Keeling plots showed values higher than 0.93 except for P. sapidus grown on grass (R2=0.51). The lower R2 value for P. sapidus grown on grass is probably a result of the marginal changes in the δ13C-CH4 values due to the small increase in the CH4 mixing ratio compared with the background CH4 mixing ratio. Therefore, the low R2 does not necessarily indicate a weaker relationship between the CH4 mixing ratio and the δ13C-CH4 value.
2.8 Statistics
Mixing ratios and production rates of CH4, CO2, δ13C-CH4 values, and δ13C-CO2 values as well as δ13C source values are presented as the arithmetic mean of three independent replicates with their standard deviations (n=3). Linear regression analysis, the arithmetic means, and their standard deviations were calculated using Microsoft Excel (Microsoft Excel for Office 365 MSO). Two-way analysis of variance (ANOVA) tests (SigmaPlot 12.2.0.45, USA) were carried out to test for species- and substrate-related effects on the δ13C-CH4 and δ13C-CO2 source values for each treatment. Differences at the p<0.05 level were referred to as significant.
In this section, we firstly present the results of CH4 and CO2 production from the two fungal species grown on the three different substrates. This includes emission rates of CH4 and CO2 from the control treatments of pine wood, grass, and corn as well as the molar ratio of CH4 and CO2. Secondly, we then present the respective stable isotope values measured for CH4 and CO2 during the incubation experiments and calculate the stable isotope source values of CH4 and CO2 released by the fungi applying Keeling plots. We then compare these values with stable carbon isotope values of the bulk organic matter by calculating the apparent fractionation. Finally, we compare δ13C source values of fungus-derived CH4 with known values for other CH4 sources from the literature.
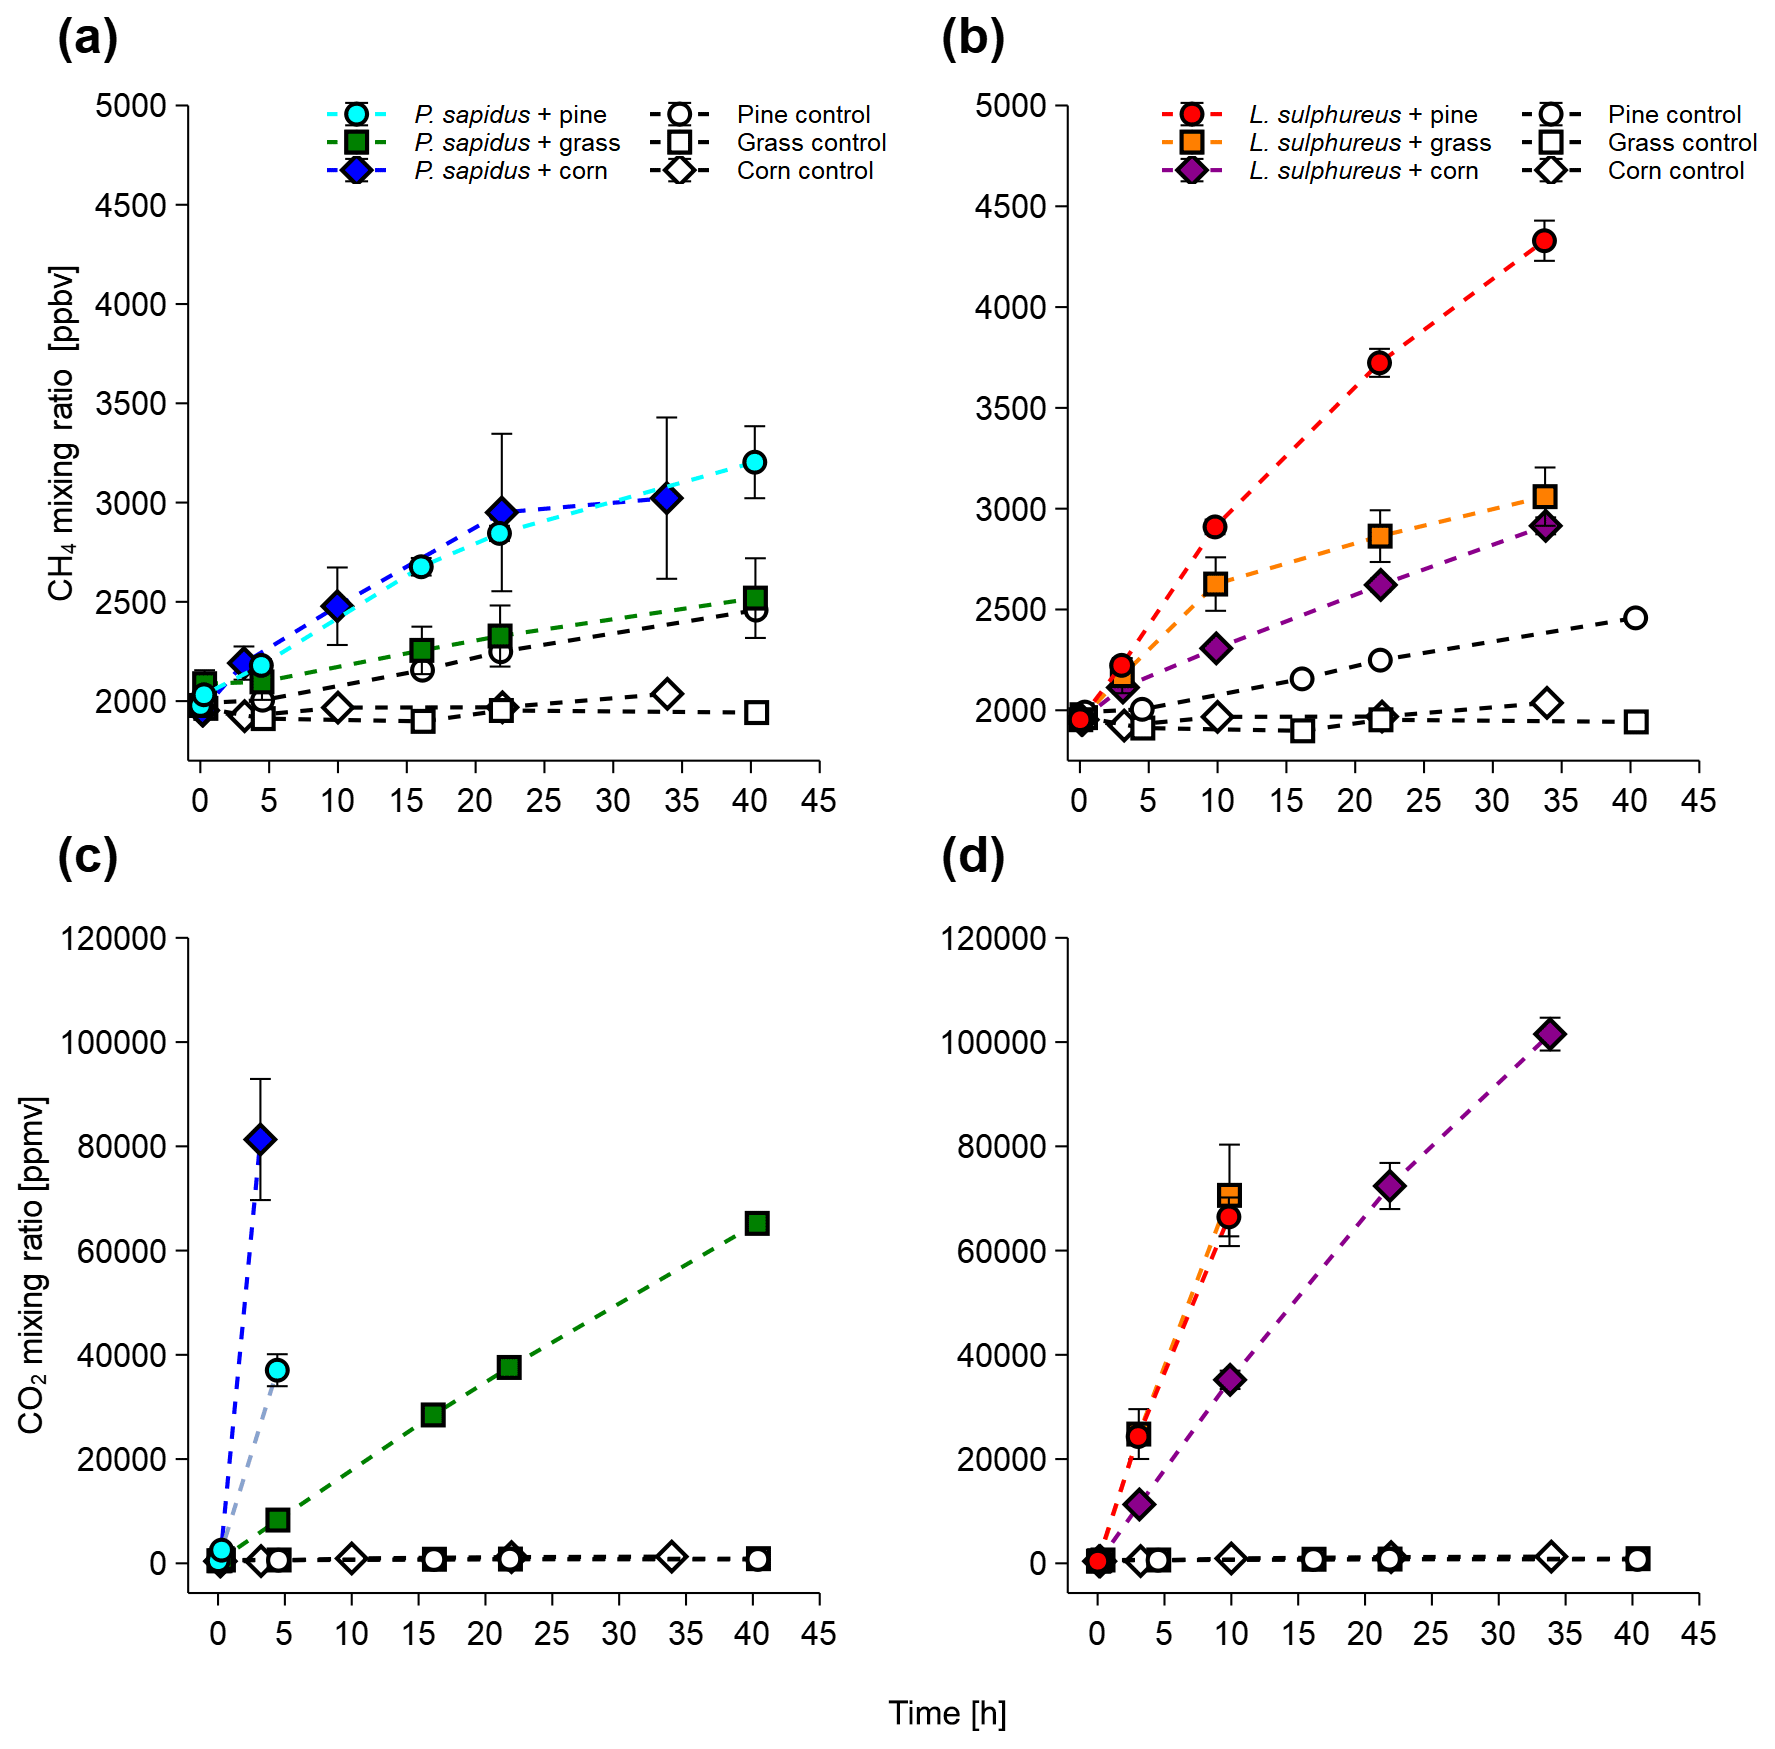
Figure 1Mixing ratios of CH4 and CO2 of P. sapidus (a, c) and L. sulphureus (b, d) grown on pine wood, grass, and corn. Mixing ratios are presented as mean values with their standard deviation (n=3).
3.1 Release of CH4 and CO2 from P. sapidus and L. sulphureus
All incubation experiments in which fungi were grown on different substrates showed a significant increase in CH4 compared with the respective substrate control (Fig. 1a, c). Calculated emission rates for CH4 and CO2 are presented in Table 1. L. sulphureus grown on grass (7.5±1.3 nmol h−1) showed the highest emission rate of CH4, followed by L. sulphureus grown on pine (6.2±0.3 nmol h−1), P. sapidus grown on corn (4.4±1.9 nmol h−1), L. sulphureus grown on corn (2.6±0.1 nmol h−1), P. sapidus grown on pine (2.5±0.2 nmol h−1), and P. sapidus grown on grass (1.4±0.5 nmol h−1). Please note that CH4 and CO2 emission rates are not related to fungal biomass. Therefore, differences in the emission rates might be due to varying fungal biomass of the subsamples. Instead, CH4 production was related to CO2 production by determining the molar emission ratio between CH4 and CO2 (µmol CH4 : mol CO2). Thus, CO2 production reflects the amount of fungal biomass and is also an indicator of the metabolic activity of the fungi.
The control flasks did not show significant changes in their CH4 and CO2 mixing ratios over time, except for CH4 in pine wood controls (1.3±0.1 nmol h−1). However, small CH4 emission rates of 0.25±0.01 nmol h−1 were observed in the control flasks of corn, and the CH4 mixing ratio slightly decreased over time in the grass control ( nmol h−1). Whilst the pine wood and corn control flasks showed a small increase in the CH4 mixing ratio, they did not show an increase in the CO2 mixing ratios. These data rule out contamination by microbial heterotrophs, as this would cause a measurable CO2 increase within the flasks. The CH4 increase in the substrate controls might be attributed to CH4 release by dead plant material, as was already shown by Keppler et al. (2006) and Vigano et al. (2009). Within the scope of these experiments, no analytic test for microbial contamination was conducted. Nevertheless, using three different methods (fluorescence in situ hybridization, FISH; confocal laser scanning microscopy, CLSM; and quantitative real-time polymerase chain reaction), Lenhart et al. (2012) clearly showed that no methanogenic archaea were present in the same method of cultivation of fungi and incubation experiments that were performed in this study. Furthermore, CH4 and CO2 release and the CH4:CO2 emission ratios in our incubations are similar to the experiments of Lenhart et al. (2012) and do not indicate microbial contamination. Therefore, we assume that no contamination with bacteria or methanogenic archaea was present in our investigations.
For P. sapidus grown on corn and L. sulphureus grown on grass, no further linear increase in CH4 was observed after 22 and 10 h respectively. This might be due to the reduced decay of organic matter and slower fungal metabolism owing to higher CO2 and lower O2 mixing ratios.
A drastic increase in CO2 mixing ratios relative to the controls was observed in all flasks containing fungi (Fig. 1b, d). The CO2 emission rates are shown in Table 1. CO2 production rates ranged from 176±4 to 2910±410 µmol h−1 for P. sapidus grown on grass and P. sapidus grown on corn respectively. These highly variable CO2 production rates might reflect different fungal biomass and metabolic activity (mineralization of organic matter). In the control treatments, tiny increases in the CO2 mixing ratio were detected ranging from 0.64±0.12 to 0.91±0.14 µmol h−1. Only one flask (corn control) showed a somewhat higher increase in CO2 (7.76 µmol h−1), which was most likely caused by microbial contamination of the flask. However, no increase in the CH4 mixing ratio was detected (see Supplement). Therefore, this control flask was excluded from further calculations.
Mean CH4 and CO2 emission rates and CH4:CO2 emission ratios of all treatments are presented in Table 1. Higher ratios indicate a higher CH4 production during decay of the substrates. Therefore, both fungal species and substrate affect the CH4:CO2 emission ratio (p<0.001). For P. sapidus, CH4:CO2 emission ratios are more variable (1.4 to 8.0 µmol CH4/mol CO2) compared with L. sulphureus (6.7–9.6 µmol CH4/mol CO2). This variation might be due to differences in the fungi's enzyme sets required for organic matter decay, as P. sapidus is a white rot fungus and L. sulphureus is a brown rot fungus. At present, the biochemical pathways that lead to CH4 are still unknown, although compounds such as the sulfur-bound methyl-group of methionine and glucose have been identified to act as carbon precursors of fungus-derived CH4 (Lenhart et al., 2012).
Lenhart et al., 2012 found CH4 : CO2 ratios of fungi that ranged between 8 µmol CH4/mol CO2 and 17 µmol CH4/mol CO2, which is in the same order of magnitude as the CH4:CO2 ratios determined in this study. It should be noted that, for better comparability, the CH4:CO2 ratios of Lenhart et al. (2012; given in ppbv CH4 : % CO2) were converted to fit the CH4:CO2 ratio units used in this study (µmol CH4 : mol CO2).
Table 1CH4 and CO2 production rates and molar CH4:CO2 emission ratios of the fungi incubated on different substrates. Values are presented as mean values of three independent replicates with their standard deviation (n=3), except for the control “corn” (n=2).
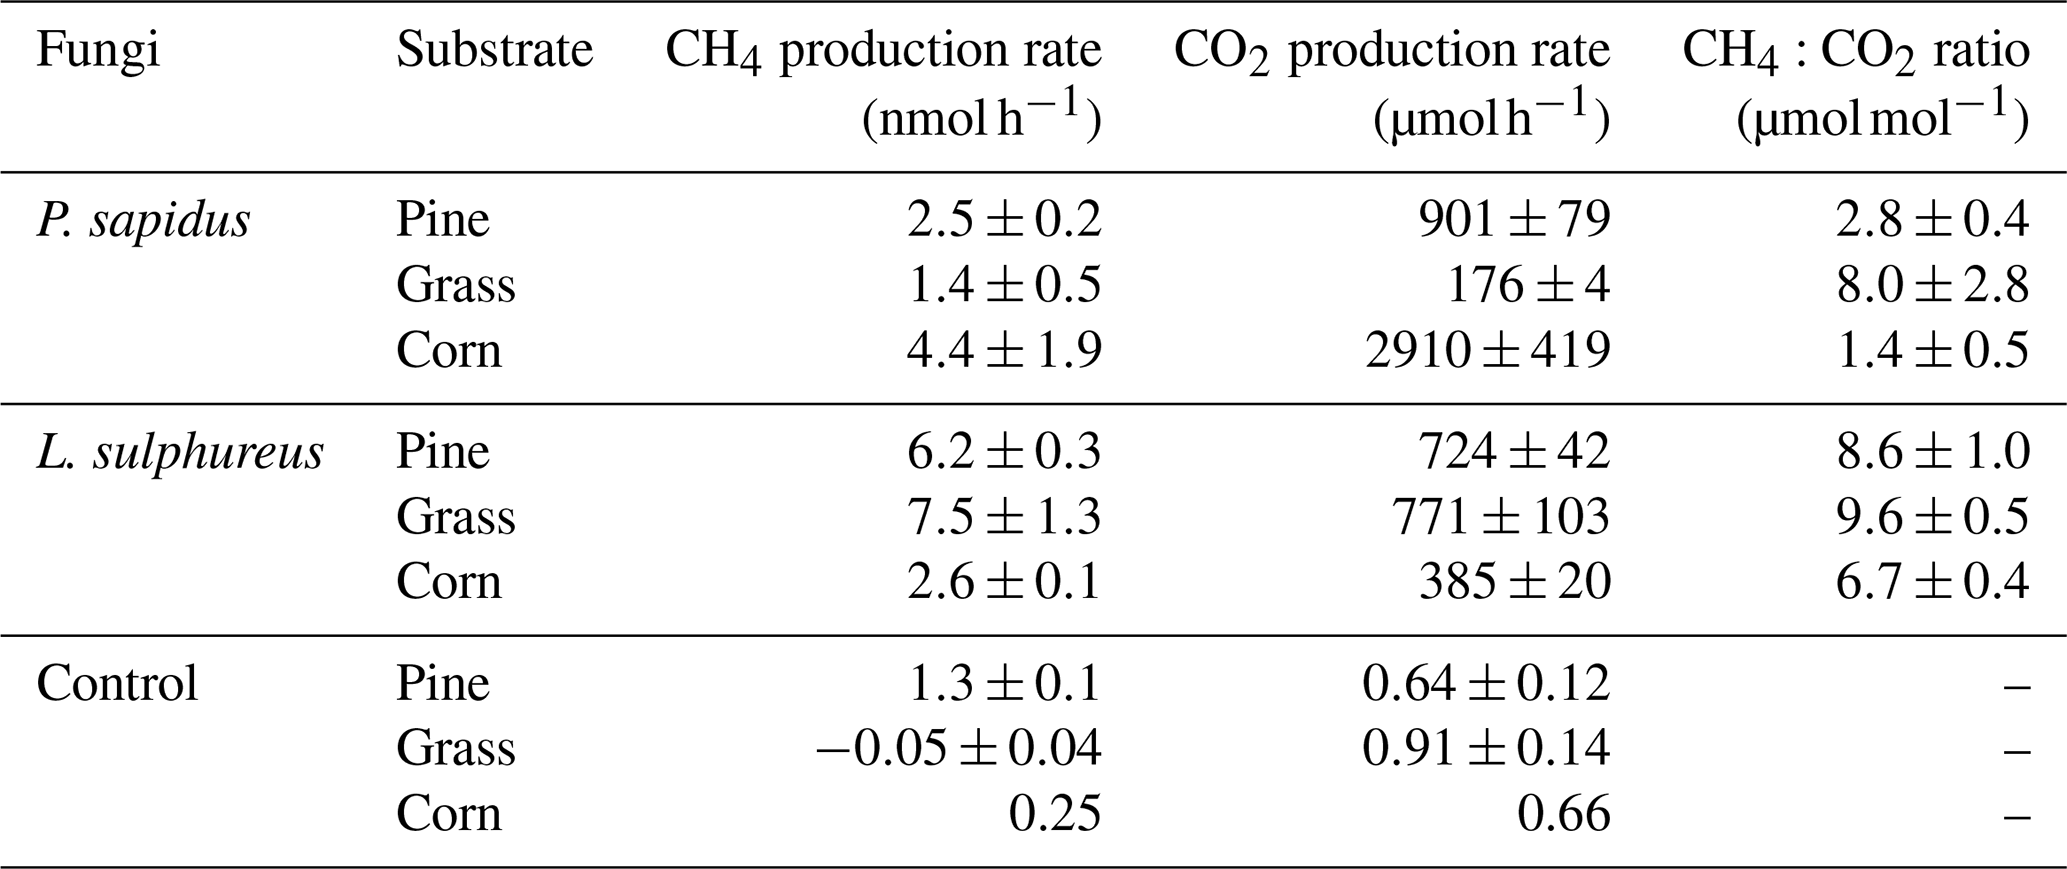
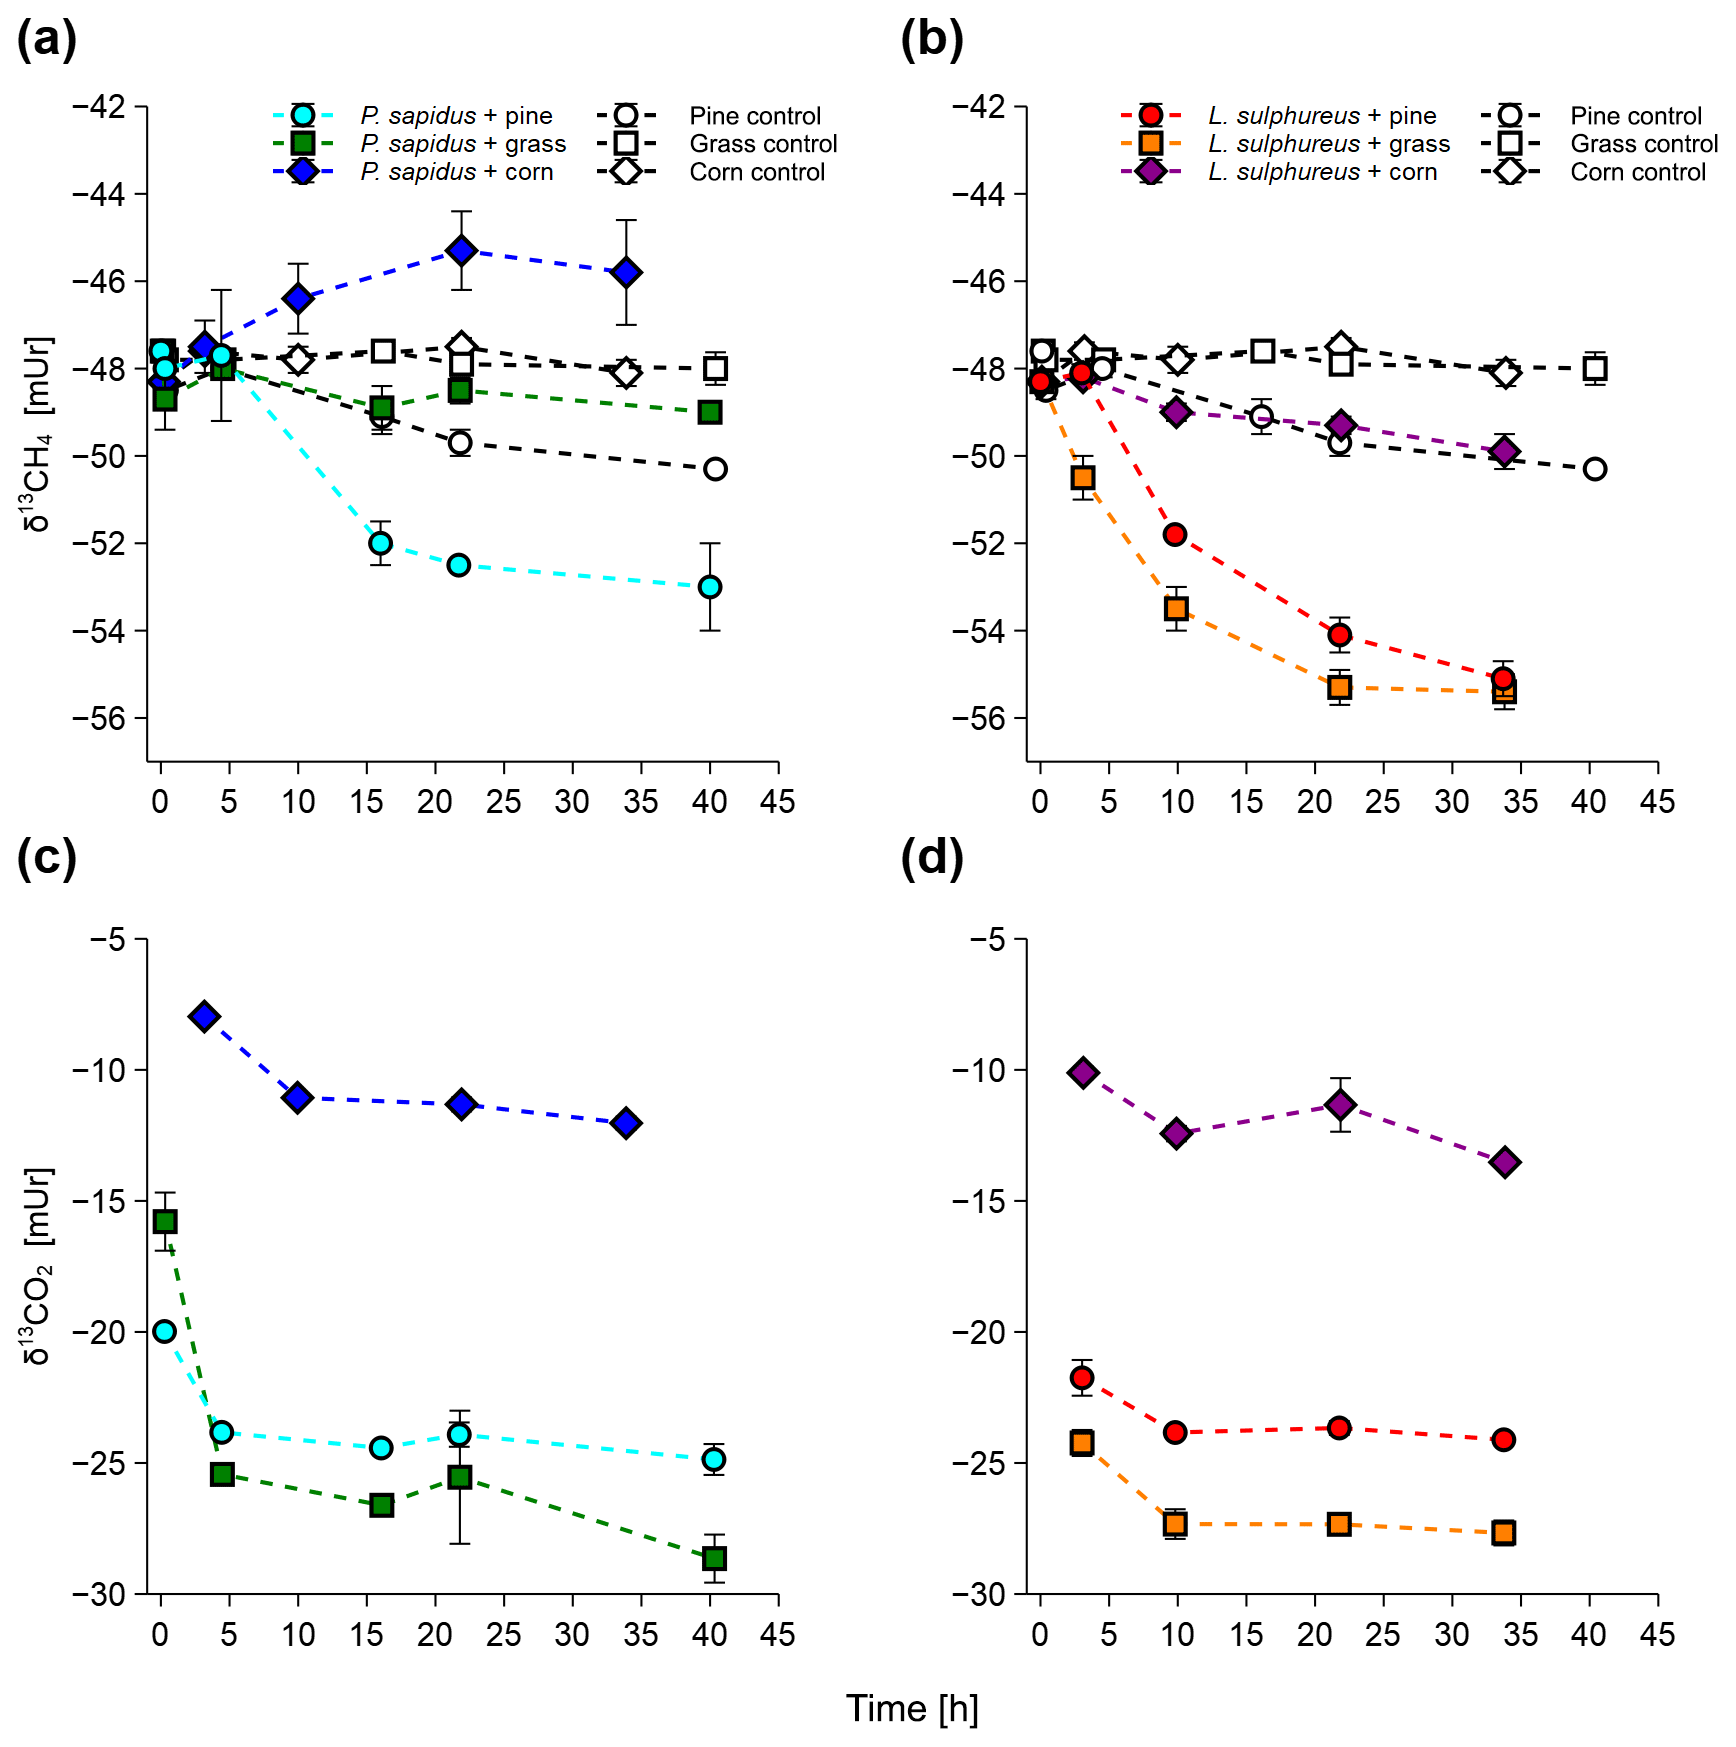
Figure 2Stable carbon isotope values of CH4 and CO2 of P. sapidus (a, c) and L. sulphureus (b, d) grown on pine, grass, and corn. Values are presented as mean values with their standard deviation (n=3), except for δ13CO2 values of L. sulphureus grown on corn (n=2).
3.2 Stable carbon isotope values of CH4 and CO2
Stable carbon isotope values of CH4 and CO2 measured from the incubation experiments are presented in Fig. 2. All incubations show a trend towards more negative δ13C-CH4 values (less 13C) with time except for P. sapidus grown on corn, where a tendency towards more positive δ13C-CH4 values was observed (Fig. 2a, b). During the incubation, δ13C-CH4 values changed from mUr (for the incubation of P. sapidus grown on pine/grass) and mUr (for the incubation of P. sapidus grown on corn and L. sulphureus grown on pine/grass/corn) to mUr (for P. sapidus grown on pine), mUr (for P. sapidus grown on grass), mUr (for P. sapidus grown on corn), mUr (for L. sulphureus grown on pine), mUr (for L. sulphureus grown on grass), and mUr (for L. sulphureus grown on corn). The controls showed no significant shift in δ13C-CH4 values except for the pine control, where an increase in the CH4 mixing ratio along with more negative values of δ13C-CH4 values occurred over time. This was accounted for when calculating the δ13C-CH4 source signatures for P. sapidus grown on pine and L. sulphureus grown on pine (see Sect. 2.7).
The δ13C-CO2 values showed a trend towards more negative values within the first 3–4 h of incubation (Fig. 2c, d). After this time, only minor changes in the δ13C-CO2 values occurred. Final δ13C-CO2 values of the incubation were mUr (for P. sapidus grown on pine), mUr (for P. sapidus grown on grass), mUr (for P. sapidus grown on corn), mUr (for L. sulphureus grown on pine), mUr (for L. sulphureus grown on grass), and mUr (for L. sulphureus grown on corn).
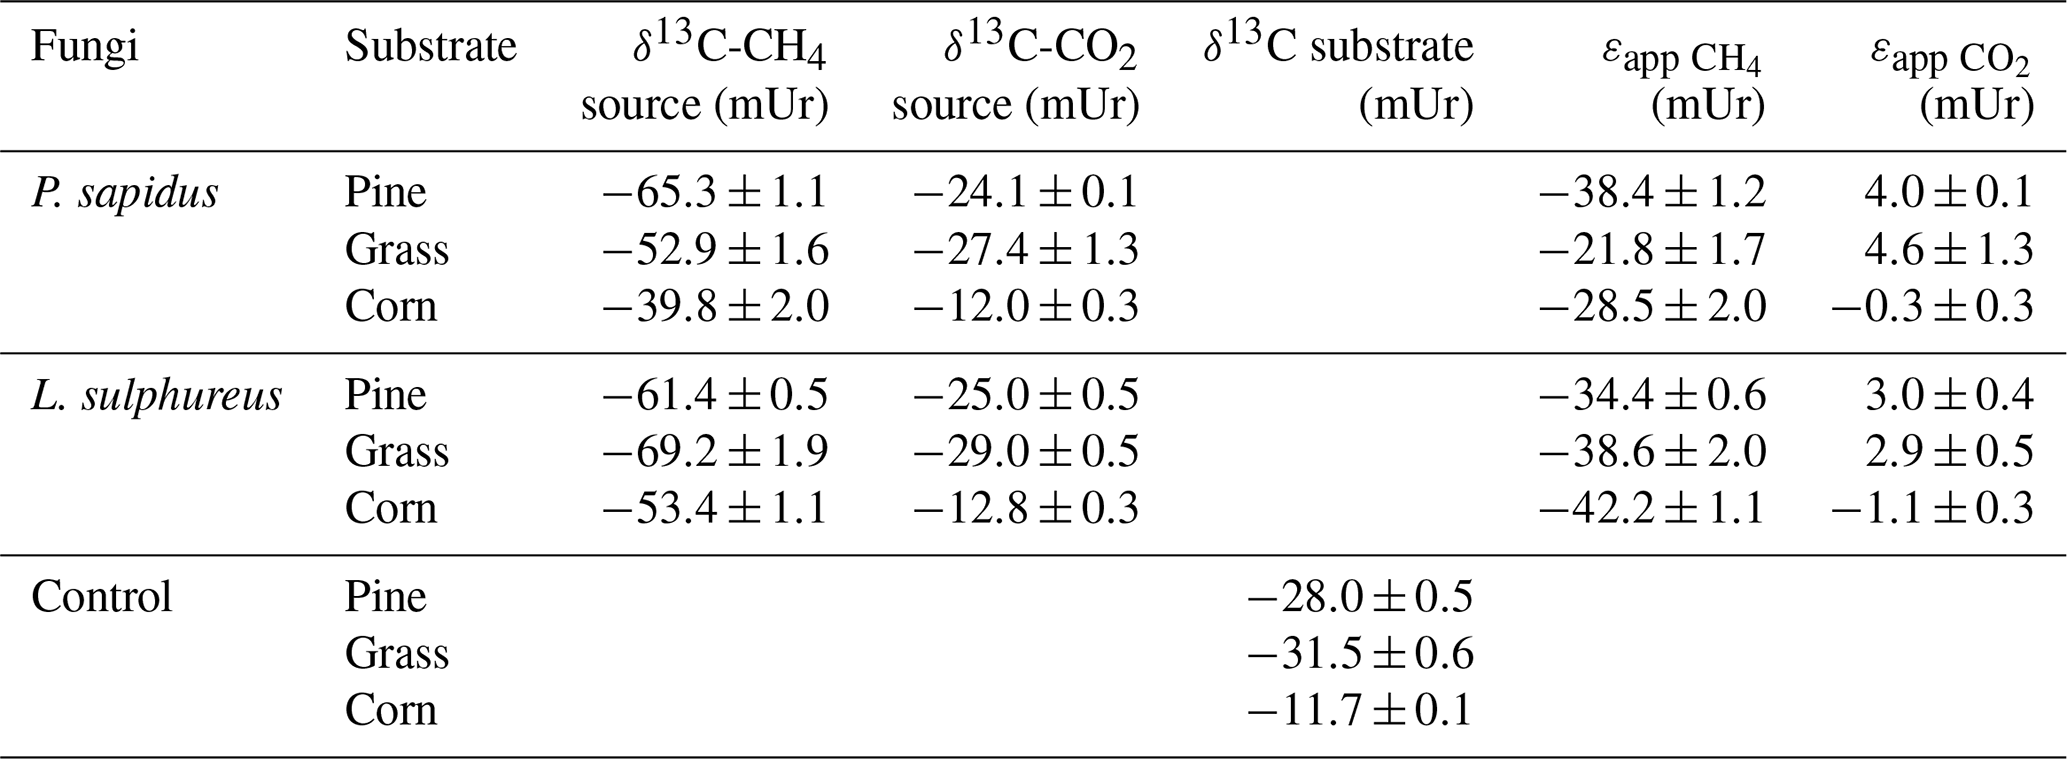
Table 2Calculated δ13C-CH4 and δ13C-CO2 source signatures, δ13C values of the substrates, and and . Values are presented as mean values with their standard deviation (n=3).
3.3 δ13C-CH4 and δ13C-CO2 source signatures of fungi
The δ13C-CH4 source signatures determined via a Keeling plot analysis (Fig. 3) that ranged from mUr (for L. sulphureus grown on grass) to mUr (for P. sapidus grown on corn) are presented in Table 2. Average δ13C-CH4 source signatures for each fungal species, considering all three substrates, are −52.6 mUr for P. sapidus and −61.3 mUr for L. sulphureus. These results suggest that the fungal species significantly influence the isotopic values of the emitted CH4 (p<0.001). A possible explanation for this observation could be the different enzyme sets of both fungi that decompose different components of the growth substrates, as P. sapidus belongs to white rot fungi and L. sulphureus is a brown rot fungus. However, detailed investigations of the metabolic pathways leading to CH4 formation were beyond the scope of this study.
Furthermore, a significant effect of the growth substrate on δ13C-CH4 source signatures was observed (p<0.001). δ13C-CH4 source signatures from P. sapidus were more positive compared with those of L. sulphureus when grown on grass (Δ=16.3 mUr) and corn (Δ=13.6 mUr) (Fig. 4). When grown on pine wood, δ13C-CH4 source signatures were similar, with P. sapidus showing slightly more negative values ( mUr). Methane emitted by both fungi grown on corn was generally more enriched in 13C (less negative δ13C-CH4 source values) compared with the fungi grown on pine wood and grass. This might be easily explained by the δ13C values of the corn growth substrates (−11.7 mUr, which is typical for C4 plants) being roughly 20 mUr less negative in their δ13C values compared with the C3 plants, pine wood (−28.0 mUr) and grass (−31.5 mUr).
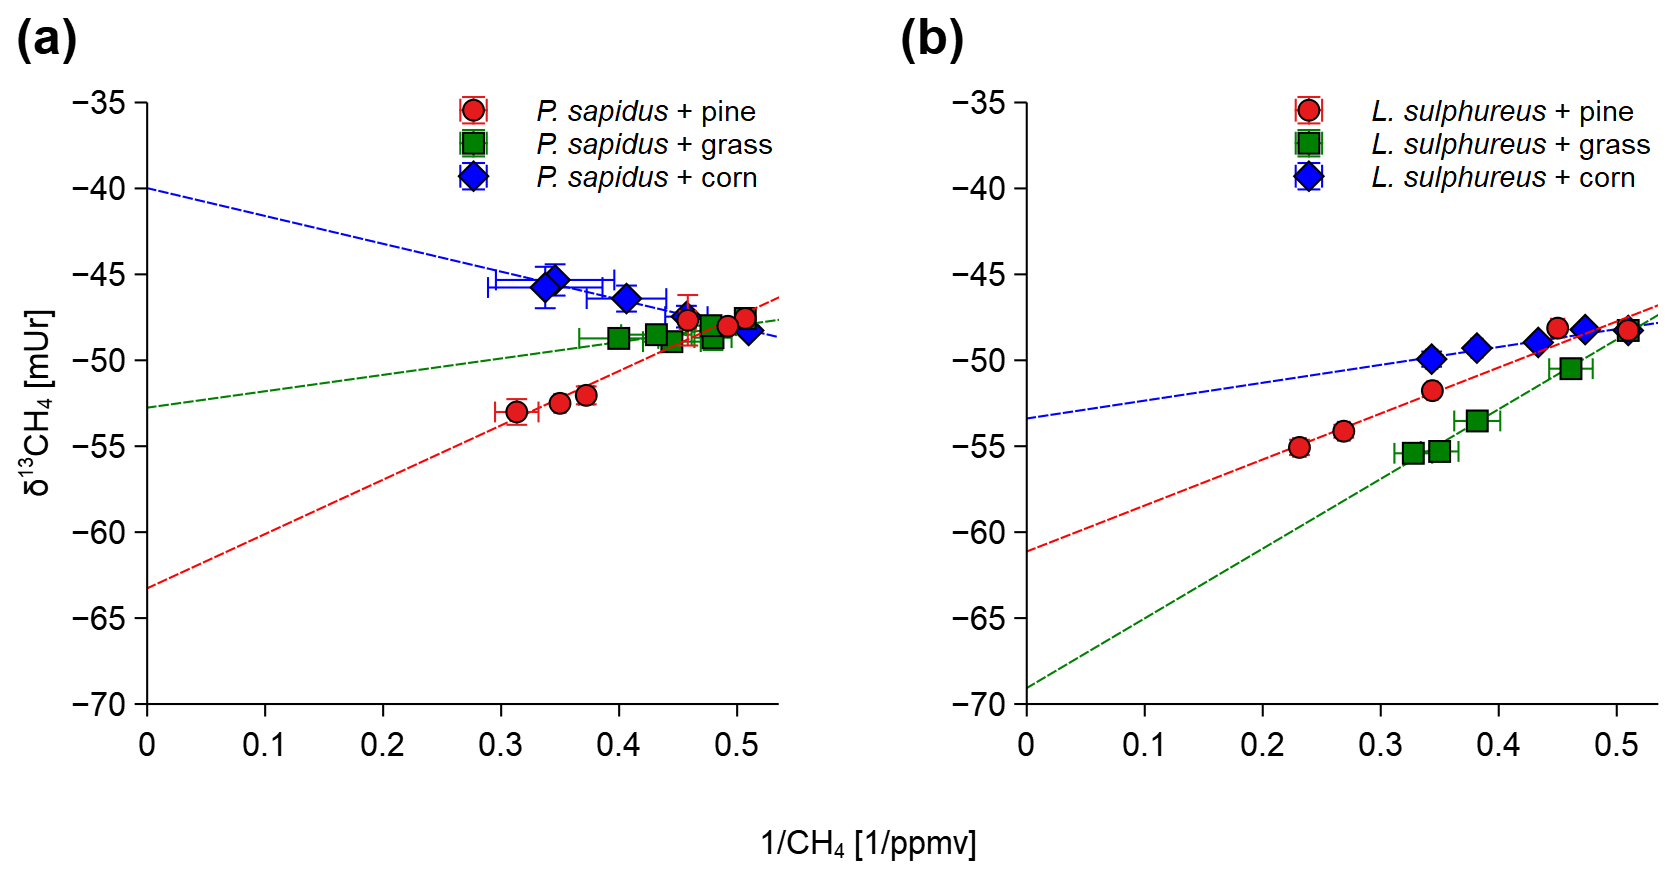
Figure 3Keeling plots shown for P. sapidus (a) and L. sulphureus (b) grown on the three substrates. Sample points in the graphs are given as the arithmetic mean of the δ13C-CH4 or δ13C-CO2 values with their standard deviation (n=3) on the y axis and the arithmetic mean of the inverted mixing ratio of CH4 or CO2 with their standard deviation (n=3) on the x axis.
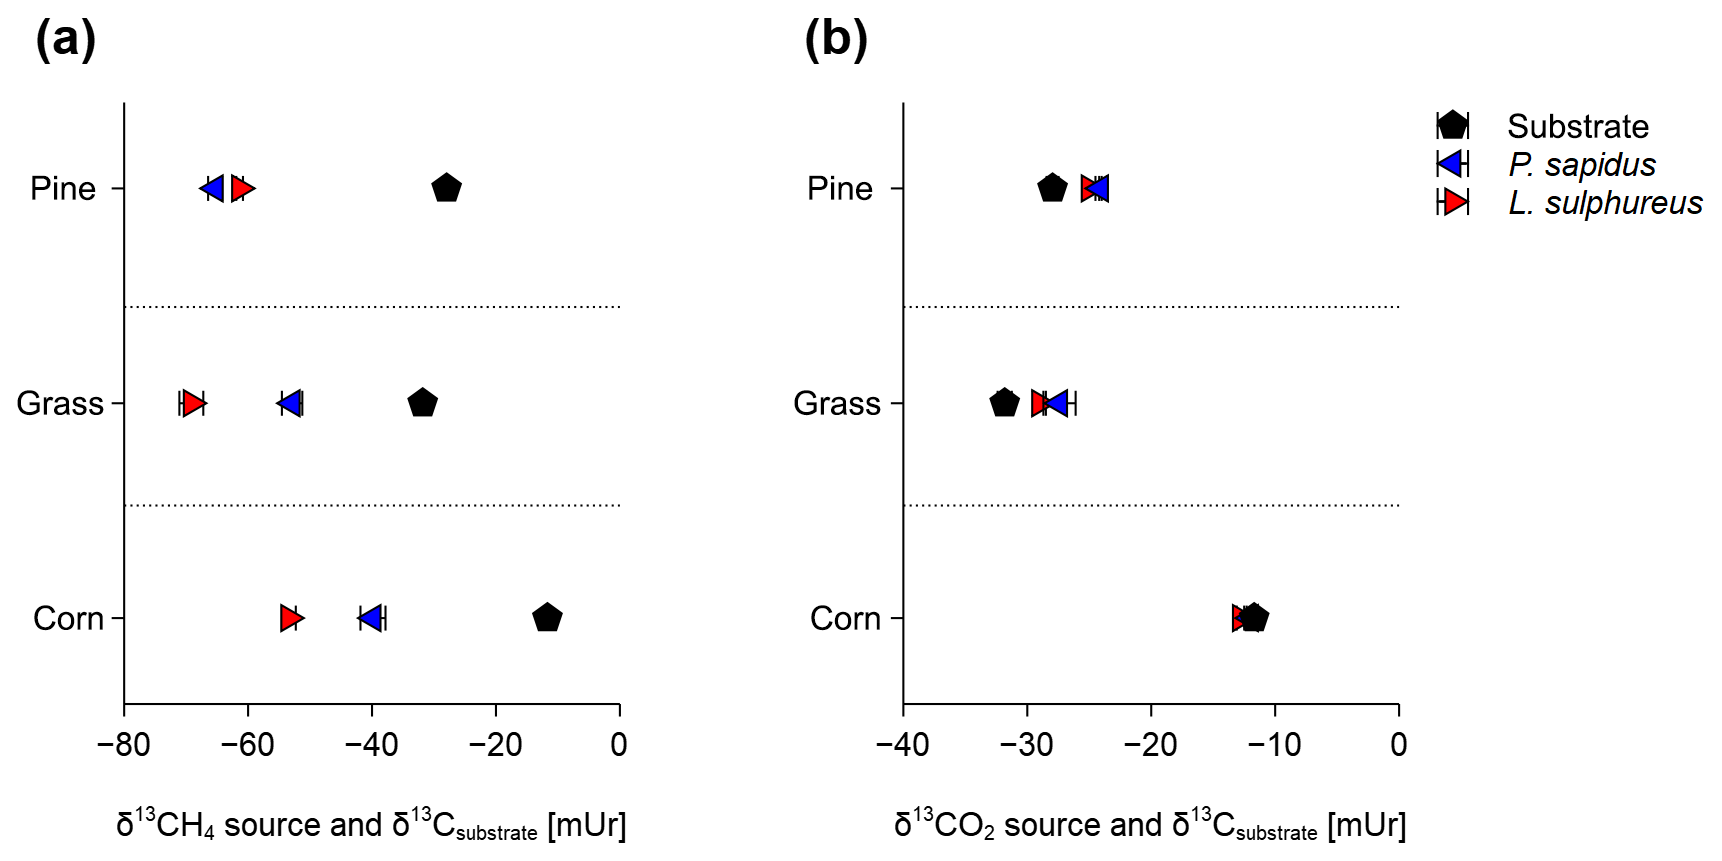
Figure 4Calculated source signatures of δ13C-CH4 values (a) and δ13C-CO2 values (b) from P. sapidus, L. sulphureus as well as the δ13C values of the substrate. The data points represent the mean values of the individual Keeling plots with their standard deviation (n=3).
The comparison of calculated δ13C-CH4 source signatures with measured bulk δ13C values of the substrates shows that CH4 emitted by both fungi is generally depleted in 13C compared with the respective substrates (Fig. 4a). Based on these data, we further calculated the apparent fractionation () between the δ13C-CH4 source signatures and the bulk δ13C values of the growth substrates. The apparent fractionation was calculated as no metabolic pathway for the formation of CH4 in fungi is presently known; therefore, only the initial δ13C signatures of the substrates and the calculated δ13C-CH4 source signatures of the fungi can currently be compared. The values of that range from −21.8 mUr (for P. sapidus grown on grass) to −42.2 mUr (for L. sulphureus grown on corn) are presented in Table 2. When grown on pine wood, values are similar for P. sapidus ( mUr) and L. sulphureus ( mUr). The differences in values between both fungal species are distinct when grown on grass (P. sapidus: mUr; L. sulphureus: mUr) and corn (P. sapidus: mUr; L. sulphureus: mUr).
The calculated δ13C-CO2 source signatures of both fungi (Table 2) range from mUr (for L. sulphureus grown on grass) to mUr (for P. sapidus grown on corn). δ13C-CO2 source signatures are in a similar range for both fungi for all three substrates. However, CO2 emitted by L. sulphureus is slightly more depleted in 13C for all three substrates compared with P. sapidus. Hence, the effect of fungal species on the stable carbon isotope values of CO2 is significant (p=0.008). Moreover, the substrates used were found to influence δ13C-CO2 values significantly (p<0.001).
The δ13C-CO2 source signatures of the fungi show only small deviations from the bulk δ13C values of the respective substrates (Fig. 4b). However, for both fungi grown on pine wood and grass, δ13C-CO2 values are slightly less negative (a few mUr) compared with the bulk substrate. This observation is rather unexpected, as δ13C-CO2 values are usually more negative with respect to δ13C values of growth substrates due to fractionation during metabolism (Bowling et al., 2008). However, when grown on corn δ13C-CO2 source signatures from both fungi are more negative compared with the substrate, and calculated values (Table 2) are mUr and mUr for L. sulphureus grown on corn and P. sapidus grown on grass respectively.
The results of the incubation experiments show that there are distinct differences in the δ13C-CH4 and δ13C-CO2 values released by both fungi. While the δ13C-CO2 source signatures are similar to the δ13C values of the substrate (with values of up to 4.6 mUr), the δ13C-CH4 source signatures deviate strongly from the respective substrate, with values of up to −42.2 mUr. This either indicates that metabolic pathways leading to the formation of CH4 and CO2 have different fractionation and/or that fungal CH4 and CO2 are derived from different precursor compounds of the respective substrate. The growth substrates used for this study (pine wood, grass, and corn) contain distinct amounts of cellulose, hemicellulose, lignin, and other compounds in different proportions (in contrast to only using pure glucose or cellulose as the growth substrate). Hence, the δ13C-CH4 and δ13C-CO2 source signatures depend on the specific metabolic pathways used by the fungal species as well as the chemical composition of the growth substrate. The selected fungi and the growth substrates used provide a first solid basis for the potential range of δ13C-CH4 values that might occur in nature.
3.4 Fungal δ13C-CH4 values compared with known CH4 sources
Figure 5 compares the δ13C-CH4 values emitted by fungi in relation to other known CH4 sources in the environment that have been reported in the literature. The red bars indicate typical biogenic (formerly only considered to be produced by archaea) CH4 sources with emissions from wetlands, ruminants, landfills, and rice paddies where δ13C-CH4 values usually range from −85 to −40 mUr. Abiotic CH4 sources (including thermogenic or pyrolytic processes) stemming from natural gas, coal mining, and biomass burning are characterized by less negative δ13C values usually ranging from −55 to −20 mUr. In addition, gas hydrates, which might be formed by both microbial and abiotic processes, cover a wide range of δ13C values (−29 to −73 mUr) depending on their formation mechanisms (Kvenvolden, 1995). The δ13C source signatures of plant-derived CH4 have been reported to be in the range of −72 to −45 mUr (Keppler et al., 2006; Vigano et al., 2009) depending on their photosynthetic pathways (C3, C4, or CAM). Furthermore, there was a tendency towards more negative δ13C-CH4 values when the respective plant was treated with UV radiation (Vigano et al., 2009). δ13C-CH4 source signatures of humans, which might include formation by microbes in the gut as well as formation by cellular processes, show a rather wide range with values between −95 and −56 mUr (Keppler et al., 2016). The results of our experiments conducted with two fungal species and three different growth substrates provide a range of δ13C-CH4 source values from −69 to −40 mUr. This range overlaps with other eukaryotic sources, most microbial CH4 sources, and even some abiotic CH4 sources such as natural gas or emissions from coal mining.

Figure 5The range of δ13C-CH4 values of microbial CH4 sources (red), abiotic CH4 sources (grey), eukaryotic CH4 sources (green), atmospheric CH4 (blue), and fungal CH4 from this study (orange). The red and grey dashed bar indicates a mixture of microbial and abiotic CH4 formation processes for gas hydrates (Kvenvolden, 1995). Data were taken from Brownlow et al. (2017), Keppler et al. (2006, 2016), Kvenvolden (1995), Nisbet et al. (2016), Quay et al. (1999), and Vigano et al. (2009).
This study provided the first analysis of stable carbon isotope values of CH4 emitted by two saprotrophic fungi that were grown on three different substrates. δ13C-CH4 and δ13C-CO2 source values were found to be dependent on the fungal species as well as the substrates decomposed by the fungi. δ13C-CH4 source values of the fungi were found to be in the range of −69 to −40 mUr and, therefore, overlap with δ13C-CH4 values reported for other CH4 sources such as methanogenic archaea, eukaryotes, and from abiotic CH4 sources (e.g. natural gas and coal mining). Stable carbon isotope values of CH4 in combination with flux measurements are often applied for a better understanding of regional and global CH4 cycling. However, in recent years it has become clear that many biogenic CH4 sources include complex CH4 formation processes, resulting in different isotopic fractionation patterns depending on several biochemical and abiotic factors. Thus, studying ecosystems in which more than one major CH4 source has to be expected (e.g. methanogenic archaea, fungi, cyanobacteria, or plants) becomes increasingly complicated, as distinguishing between each individual source based solely on stable carbon isotope values might be highly challenging. Therefore, additional tools are needed to better identify the sources but also to disentangle sources and sinks. In future research, stable hydrogen isotopic values of CH4 (δ2H-CH4 values) or even applications of clumped isotopes might prove to be suitable tools to better distinguish between different CH4 sources and, thus, to better constrain the global CH4 budget.
The data used in this study are available from heiDATA, which is an institutional repository for research data of the Heidelberg University (https://doi.org/10.11588/data/DQYPMC, Schroll et al., 2020).
The supplement related to this article is available online at: https://doi.org/10.5194/bg-17-3891-2020-supplement.
MS, KL, and FK conceived the study and designed the experiments. HZ provided fungal cultures. MS performed the experiments under the supervision of FK and KL. CE helped with gas measurements. MG measured stable isotope values of greenhouse gases. MS, FK, and KL analysed the data. MS, FK, HZ, MG, and KL discussed the results, and MS, KL and FK wrote the paper.
The authors declare that they have no conflict of interest.
We thank Anette Giesemann for analytical measurements of stable carbon isotope values of the bulk substrates. We are grateful to Bianka Daubertshäuser for technical support with the cultivation of the fungi and to Lukas Kohl for encouraging us to perform this study. We acknowledge financial support from the German Research Foundation (Deutsche Forschungsgemeinschaft).
This research has been supported by the German Research Foundation (DFG grant nos. KE 884/8-2, KE 884/16-2 and LE3381/1-1).
This paper was edited by Tina Treude and reviewed by Lukas Kohl and one anonymous referee.
Beckmann, S., Krüger, M., Engelen, B., Gorbushina, A. A., and Cypionka, H.: Role of bacteria, archaea and fungi involved in methane release in abandoned coal mines, Geomicrobiol. J., 28, 347–358, https://doi.org/10.1080/01490451.2010.503258, 2011.
Bižić, M., Klintzsch, T., Ionescu, D., Hindiyeh, M. Y., Günthel, M., Muro-Pastor, A. M., Eckert, W., Urich, T., Keppler, F., and Grossart, H. P.: Aquatic and terrestrial cyanobacteria produce methane, Sci. Adv., 6, eaax5343, https://doi.org/10.1126/sciadv.aax5343, 2020.
Boros, M. and Keppler, F.: Methane production and bioactivity-A link to oxido-reductive stress, Front. Physiol., 10, 1244, https://doi.org/10.3389/fphys.2019.01244, 2019.
Bowling, D. R., Pataki, D. E., and Randerson, J. T.: Carbon isotopes in terrestrial ecosystem pools and CO2 fluxes, New Phytol., 178, 24–40, https://doi.org/10.1111/j.1469-8137.2007.02342.x, 2008.
Brand, W. A. and Coplen, T. B.: Stable isotope deltas: Tiny, yet robust signatures in nature, Isotopes Environ. Health Stud., 48, 393–409, https://doi.org/10.1080/10256016.2012.666977, 2012.
Brownlow, R., Lowry, D., Fisher, R. E., France, J. L., Lanoisellé, M., White, B., Wooster, M. J., Zhang, T., and Nisbet, E. G.: Isotopic Ratios of Tropical Methane Emissions by Atmospheric Measurement, Global Biogeochem. Cy., 31, 1408–1419, https://doi.org/10.1002/2017GB005689, 2017.
Dlugokencky, E. J., Nisbet, E. G., Fisher, R., and Lowry, D.: Global atmospheric methane: Budget, changes and dangers, Philos. T. R. Soc. A, 369, 2058–2072, https://doi.org/10.1098/rsta.2010.0341, 2011.
Ghyczy, M., Torday, C., Kaszaki, J., Szabó, A., Czóbel, M., and Boros, M.: Hypoxia-induced generation of methane in mitochondria and eukaryotic cells – An alternative approach to methanogenesis, Cell. Physiol. Biochem., 21, 251–258, https://doi.org/10.1159/000113766, 2008.
Grinhut, T., Hadar, Y., and Chen, Y.: Degradation and transformation of humic substances by saprotrophic fungi: processes and mechanisms, Fungal Biol. Rev., 21, 179–189, https://doi.org/10.1016/j.fbr.2007.09.003, 2007.
Hein, R., Crutzen, P. J., and Heimann, M.: An inverse modeling approach to investigate the global atmospheric methane cycle, Global Biogeochem. Cy., 11, 43–76, https://doi.org/10.1029/96GB03043, 1997.
Hietala, A. M., Dörsch, P., Kvaalen, H., and Solheim, H.: Carbon dioxide and methane formation in norway spruce stems infected by white-rot fungi, Forests, 6, 3304–3325, https://doi.org/10.3390/f6093304, 2015.
Keeling, C. D.: The concentration and isotopic abundances of atmospheric carbon dioxide in rural areas, Geochim. Cosmochim. Ac., 13, 322–334, https://doi.org/10.1016/0016-7037(58)90033-4, 1958.
Keppler, F., Hamilton, J. T. G., Braß, M., and Röckmann, T.: Methane emissions from terrestrial plants under aerobic conditions, Nature, 439, 187–191, https://doi.org/10.1038/nature04420, 2006.
Keppler, F., Boros, M., Frankenberg, C., Lelieveld, J., McLeod, A., Pirttilä, A. M., Röckmann, T., and Schnitzler, J. P.: Methane formation in aerobic environments, Environ. Chem., 6, 459–465, https://doi.org/10.1071/EN09137, 2009.
Keppler, F., Schiller, A., Ehehalt, R., Greule, M., Hartmann, J., and Polag, D.: Stable isotope and high precision concentration measurements confirm that all humans produce and exhale methane, J. Breath Res., 10, https://doi.org/10.1088/1752-7155/10/1/016003, 2016.
Kirschke, S., Bousquet, P., Ciais, P., Saunois, M., Canadell, J. G., Dlugokencky, E. J., Bergamaschi, P., Bergmann, D., Blake, D. R., Bruhwiler, L., Cameron-Smith, P., Castaldi, S., Chevallier, F., Feng, L., Fraser, A., Heimann, M., Hodson, E. L., Houweling, S., Josse, B., Fraser, P. J., Krummel, P. B., Lamarque, J. F., Langenfelds, R. L., Le Quéré, C., Naik, V., O'doherty, S., Palmer, P. I., Pison, I., Plummer, D., Poulter, B., Prinn, R. G., Rigby, M., Ringeval, B., Santini, M., Schmidt, M., Shindell, D. T., Simpson, I. J., Spahni, R., Steele, L. P., Strode, S. A., Sudo, K., Szopa, S., Van Der Werf, G. R., Voulgarakis, A., Van Weele, M., Weiss, R. F., Williams, J. E., and Zeng, G.: Three decades of global methane sources and sinks, Nat. Geosci., 6, 813–823, https://doi.org/10.1038/ngeo1955, 2013.
Klintzsch, T., Langer, G., Nehrke, G., Wieland, A., Lenhart, K., and Keppler, F.: Methane production by three widespread marine phytoplankton species: release rates, precursor compounds, and potential relevance for the environment, Biogeosciences, 16, 4129–4144, https://doi.org/10.5194/bg-16-4129-2019, 2019.
Kvenvolden, K. A.: A review of the geochemistry of methane in natural gas hydrate, Org. Geochem., 23, 997–1008, https://doi.org/10.1016/0146-6380(96)00002-2, 1995.
Lenhart, K., Bunge, M., Ratering, S., Neu, T. R., Schüttmann, I., Greule, M., Kammann, C., Schnell, S., Müller, C., Zorn, H., and Keppler, F.: Evidence for methane production by saprotrophic fungi, Nat. Commun., 3, https://doi.org/10.1038/ncomms2049, 2012.
Lenhart, K., Klintzsch, T., Langer, G., Nehrke, G., Bunge, M., Schnell, S., and Keppler, F.: Evidence for methane production by the marine algae Emiliania huxleyi, Biogeosciences, 13, 3163–3174, https://doi.org/10.5194/bg-13-3163-2016, 2016.
Leonowicz, A., Matuszewska, A., Luterek, J., Ziegenhagen, D., Wojtaś-Wasilewska, M., Cho, N. S., Hofrichter, M., and Rogalski, J.: Biodegradation of lignin by white rot fungi, Fungal Genet. Biol., 27, 175–185, https://doi.org/10.1006/fgbi.1999.1150, 1999.
Mikaloff Fletcher, S. E., Tans, P. P., Bruhwiler, L. M., Miller, J. B., and Heimann, M.: CH4 sources estimated from atmospheric observations of CH4 and its 13C∕12C isotopic ratios: 1. Inverse modeling of source processes, Global Biogeochem. Cy., 18, 1–17, https://doi.org/10.1029/2004GB002223, 2004a.
Mikaloff Fletcher, S. E., Tans, P. P., Bruhwiler, L. M., Miller, J. B., and Heimann, M.: CH4 sources estimated from atmospheric observations of CH4 and its 13C∕12C isotopic ratios: 2. Inverse modeling of CH4 fluxes from geographical regions, Global Biogeochem. Cy., 18, 1–15, https://doi.org/10.1029/2004GB002224, 2004b.
Mukhin, V. A. and Voronin, P. Y.: Methane emission during wood fungal decomposition, Dokl. Biol. Sci., 413, 159–160, https://doi.org/10.1134/S0012496607020202, 2007.
Mukhin, V. A. and Voronin, P. Y.: A new source of methane in boreal forests, Appl. Biochem. Microbiol., 44, 297–299, https://doi.org/10.1134/S0003683808030125, 2008.
Naik, V., Voulgarakis, A., Fiore, A. M., Horowitz, L. W., Lamarque, J.-F., Lin, M., Prather, M. J., Young, P. J., Bergmann, D., Cameron-Smith, P. J., Cionni, I., Collins, W. J., Dalsøren, S. B., Doherty, R., Eyring, V., Faluvegi, G., Folberth, G. A., Josse, B., Lee, Y. H., MacKenzie, I. A., Nagashima, T., van Noije, T. P. C., Plummer, D. A., Righi, M., Rumbold, S. T., Skeie, R., Shindell, D. T., Stevenson, D. S., Strode, S., Sudo, K., Szopa, S., and Zeng, G.: Preindustrial to present-day changes in tropospheric hydroxyl radical and methane lifetime from the Atmospheric Chemistry and Climate Model Intercomparison Project (ACCMIP), Atmos. Chem. Phys., 13, 5277–5298, https://doi.org/10.5194/acp-13-5277-2013, 2013.
Nisbet, E. G., Dlugokencky, E. J., Manning, M. R., Lowry, D., Fisher, R. E., France, J. L., Michel, S. E., Miller, J. B., White, J. W. C., Vaughn, B., Bousquet, P., Pyle, J. A., Warwick, N. J., Cain, M., Brownlow, R., Zazzeri, G., Lanoisellé, M., Manning, A. C., Gloor, E., Worthy, D. E. J., Brunke, E. G., Labuschagne, C., Wolff, E. W., and Ganesan, A. L.: Rising atmospheric methane: 2007–2014 growth and isotopic shift, Global Biogeochem. Cy., 30, 1356–1370, https://doi.org/10.1002/2016GB005406, 2016.
Pataki, D. E., Ehleringer, J. R., Flanagan, L. B., Yakir, D., Bowling, D. R., Still, C. J., Buchmann, N., Kaplan, J. O., and Berry, J. A.: The application and interpretation of Keeling plots in terrestrial carbon cycle research, Global Biogeochem. Cy., 17, 1022, https://doi.org/10.1029/2001GB001850, 2003.
Paul, D., Skrzypek, G., and Fórizs, I.: Normalization of measured stable isotopic compositions to isotope reference scales – a review, Rapid Commun. Mass Spectrom., 21, 3006–3014, https://doi.org/10.1002/rcm.3185, 2007.
Prather, M. J., Holmes, C. D., and Hsu, J.: Reactive greenhouse gas scenarios: Systematic exploration of uncertainties and the role of atmospheric chemistry, Geophys. Res. Lett., 39, L09803, https://doi.org/10.1029/2012GL051440, 2012.
Quay, P., Stutsman, J., Wilbur, D., Snover, A., Dlugokencky, E., and Brown, T.: The isotopic composition of atmospheric methane, Global Biogeochem. Cy., 13, 445–461, https://doi.org/10.1029/1998GB900006, 1999.
Ralph, J. P. and Catcheside, D. E. A.: Biodegradation by White-Rot Fungi, in: Industrial Applications, Springer Berlin Heidelberg, 303–326, 2002.
Saunois, M., Bousquet, P., Poulter, B., Peregon, A., Ciais, P., Canadell, J. G., Dlugokencky, E. J., Etiope, G., Bastviken, D., Houweling, S., Janssens-Maenhout, G., Tubiello, F. N., Castaldi, S., Jackson, R. B., Alexe, M., Arora, V. K., Beerling, D. J., Bergamaschi, P., Blake, D. R., Brailsford, G., Brovkin, V., Bruhwiler, L., Crevoisier, C., Crill, P., Covey, K., Curry, C., Frankenberg, C., Gedney, N., Höglund-Isaksson, L., Ishizawa, M., Ito, A., Joos, F., Kim, H.-S., Kleinen, T., Krummel, P., Lamarque, J.-F., Langenfelds, R., Locatelli, R., Machida, T., Maksyutov, S., McDonald, K. C., Marshall, J., Melton, J. R., Morino, I., Naik, V., O'Doherty, S., Parmentier, F.-J. W., Patra, P. K., Peng, C., Peng, S., Peters, G. P., Pison, I., Prigent, C., Prinn, R., Ramonet, M., Riley, W. J., Saito, M., Santini, M., Schroeder, R., Simpson, I. J., Spahni, R., Steele, P., Takizawa, A., Thornton, B. F., Tian, H., Tohjima, Y., Viovy, N., Voulgarakis, A., van Weele, M., van der Werf, G. R., Weiss, R., Wiedinmyer, C., Wilton, D. J., Wiltshire, A., Worthy, D., Wunch, D., Xu, X., Yoshida, Y., Zhang, B., Zhang, Z., and Zhu, Q.: The global methane budget 2000–2012, Earth Syst. Sci. Data, 8, 697–751, https://doi.org/10.5194/essd-8-697-2016, 2016.
Saunois, M., Stavert, A. R., Poulter, B., Bousquet, P., Canadell, J. G., Jackson, R. B., Raymond, P. A., Dlugokencky, E. J., Houweling, S., Patra, P. K., Ciais, P., Arora, V. K., Bastviken, D., Bergamaschi, P., Blake, D. R., Brailsford, G., Bruhwiler, L., Carlson, K. M., Carrol, M., Castaldi, S., Chandra, N., Crevoisier, C., Crill, P. M., Covey, K., Curry, C. L., Etiope, G., Frankenberg, C., Gedney, N., Hegglin, M. I., Höglund-Isaksson, L., Hugelius, G., Ishizawa, M., Ito, A., Janssens-Maenhout, G., Jensen, K. M., Joos, F., Kleinen, T., Krummel, P. B., Langenfelds, R. L., Laruelle, G. G., Liu, L., Machida, T., Maksyutov, S., McDonald, K. C., McNorton, J., Miller, P. A., Melton, J. R., Morino, I., Müller, J., Murguia-Flores, F., Naik, V., Niwa, Y., Noce, S., O'Doherty, S., Parker, R. J., Peng, C., Peng, S., Peters, G. P., Prigent, C., Prinn, R., Ramonet, M., Regnier, P., Riley, W. J., Rosentreter, J. A., Segers, A., Simpson, I. J., Shi, H., Smith, S. J., Steele, L. P., Thornton, B. F., Tian, H., Tohjima, Y., Tubiello, F. N., Tsuruta, A., Viovy, N., Voulgarakis, A., Weber, T. S., van Weele, M., van der Werf, G. R., Weiss, R. F., Worthy, D., Wunch, D., Yin, Y., Yoshida, Y., Zhang, W., Zhang, Z., Zhao, Y., Zheng, B., Zhu, Q., Zhu, Q., and Zhuang, Q.: The Global Methane Budget 2000–2017, Earth Syst. Sci. Data, 12, 1561–1623, https://doi.org/10.5194/essd-12-1561-2020, 2020.
Schroll, M., Keppler, F., Greule, M., Eckhardt, C., Zorn, H., and Lenhart, K.: The stable carbon isotope signature of methane produced by saprotrophic fungi [Dataset], https://doi.org/10.11588/data/DQYPMC, 2020.
Ten Have, R. and Teunissen, P. J. M.: Oxidative mechanisms involved in lignin degradation by white-rot fungi, Chem. Rev., 101, 3397–3413, https://doi.org/10.1021/cr000115l, 2001.
Tyler, S. C.: Stable carbon isotope ratios in atmospheric methane and some of its sources, J. Geophys. Res., 91, 13232, https://doi.org/10.1029/jd091id12p13232, 1986.
Valášková, V. and Baldrian, P.: Degradation of cellulose and hemicelluloses by the brown rot fungus Piptoporus betulinus – Production of extracellular enzymes and characterization of the major cellulases, Microbiology, 152, 3613–3622, https://doi.org/10.1099/mic.0.29149-0, 2006.
Vigano, I., Röckmann, T., Holzinger, R., van Dijk, A., Keppler, F., Greule, M., Brand, W. A., Geilmann, H., and van Weelden, H.: The stable isotope signature of methane emitted from plant material under UV irradiation, Atmos. Environ., 43, 5637–5646, https://doi.org/10.1016/j.atmosenv.2009.07.046, 2009.
Voulgarakis, A., Naik, V., Lamarque, J.-F., Shindell, D. T., Young, P. J., Prather, M. J., Wild, O., Field, R. D., Bergmann, D., Cameron-Smith, P., Cionni, I., Collins, W. J., Dalsøren, S. B., Doherty, R. M., Eyring, V., Faluvegi, G., Folberth, G. A., Horowitz, L. W., Josse, B., MacKenzie, I. A., Nagashima, T., Plummer, D. A., Righi, M., Rumbold, S. T., Stevenson, D. S., Strode, S. A., Sudo, K., Szopa, S., and Zeng, G.: Analysis of present day and future OH and methane lifetime in the ACCMIP simulations, Atmos. Chem. Phys., 13, 2563–2587, https://doi.org/10.5194/acp-13-2563-2013, 2013.
Whiticar, M. J.: Stable Isotopes and Global Budgets, in: Atmospheric Methane: Sources, Sinks, and Role in Global Change, Springer Berlin Heidelberg, 138–167, 1993.
Whiticar, M. J.: Carbon and hydrogen isotope systematics of bacterial formation and oxidation of methane, Chem. Geol., 161, 291–314, https://doi.org/10.1016/S0009-2541(99)00092-3, 1999.
Wishkerman, A., Greiner, S., Ghyczy, M., Boros, M., Rausch, T., Lenhart, K., and Keppler, F.: Enhanced formation of methane in plant cell cultures by inhibition of cytochrome c oxidase, Plant Cell Environ., 34, 457–464, https://doi.org/10.1111/j.1365-3040.2010.02255.x, 2011.