the Creative Commons Attribution 4.0 License.
the Creative Commons Attribution 4.0 License.
 | 31 Jul 2020
The recent state and variability of the carbonate system of the Canadian Arctic Archipelago and adjacent basins in the context of ocean acidification
Alexis Beaupré-Laperrière
Alfonso Mucci
Helmuth Thomas
Ocean acidification driven by the uptake of anthropogenic CO2 by the surface oceans constitutes a potential threat to the health of marine ecosystems around the globe. The Arctic Ocean is particularly vulnerable to acidification and thus is an ideal region to study the progression and effects of acidification before they become globally widespread. The appearance of undersaturated surface waters with respect to the carbonate mineral aragonite (ΩA<1), an important threshold beyond which the calcification and growth of some marine organisms might be hindered, has recently been documented in the Canada Basin and adjacent Canadian Arctic Archipelago (CAA), a dynamic region with an inherently strong variability in biogeochemical processes. Nonetheless, few of these observations were made in the last 5 years and the spatial coverage in the latter region is poor. We use a dataset of carbonate system parameters measured in the CAA and its adjacent basins (Canada Basin and Baffin Bay) from 2003 to 2016 to describe the recent state of these parameters across the Canadian Arctic and investigate the amplitude and sources of the system's variability over more than a decade. Our findings reveal that, in the summers of 2014 to 2016, the ocean surface across our study area served as a net CO2 sink and was partly undersaturated with respect to aragonite in the Canada Basin and the Queen Maud Gulf, the latter region exhibiting undersaturation over its entire water column at some locations. We estimate, using measurements made across several years, that approximately a third of the interannual variability in surface dissolved inorganic carbon (DIC) concentrations in the CAA results from fluctuations in biological activity. In consideration of the system's variability resulting from these fluctuations, we derive times of emergence of the anthropogenic ocean acidification signal for carbonate system parameters in the study area.
- Article
(6942 KB) - Full-text XML
- BibTeX
- EndNote


Ocean acidification and its repercussions on marine ecosystems constitute an important consequence of the ongoing rise in atmospheric carbon dioxide (CO2) concentrations. The world's oceans absorbed approximately one-third of the anthropogenic CO2 released to the atmosphere over the last two centuries of industrial activity (Sabine et al., 2004) and are currently a sink for ∼24 % of global annual anthropogenic carbon emissions (Le Quéré et al., 2018). Atmospheric carbon dioxide uptake by the surface oceans has well-defined impacts on seawater chemistry, including a decrease of pH resulting from the dissociation of carbonic acid (H2CO3), the product of the reaction between water and dissolved CO2. A large fraction of the hydrogen ions released by this reaction is neutralized by carbonate ions (), leading to a decrease of their concentration and, concomitantly, the saturation state of seawater with respect to the carbonate minerals calcite and aragonite. The saturation state is defined by
where square brackets denote concentrations and is the stoichiometric solubility product of calcite or aragonite, the two most common marine CaCO3 polymorphs, at a given temperature, pressure and salinity.
The combination of these chemical reactions is most often referred to as ocean acidification (OA). As it proceeds, the dissolved inorganic carbon (DIC) concentration (the sum of [], [] and []) in the surface ocean is expected to increase relative to the total alkalinity (TA; the capacity of a solution to neutralize protons), as the latter is nearly conservative in the surface ocean (Wolf-Gladrow et al., 2007). The global mean surface ocean pH currently sits ∼0.1 units below its pre-industrial value (Orr et al., 2005) and, according to Earth System models, under the Intergovernmental Panel on Climate Change's “business as usual” RCP8.5 emission scenario, is predicted to decrease by an additional 0.3 units by the end of this century (Bopp et al., 2013).
Marine calcifying organisms, many of which are important primary producers (e.g., coccolithophores), extract the constituents of their calcitic or aragonitic tests (shells) from seawater. In most cases, their ability to do so is directly dependent on the saturation state of the surrounding water. Supersaturated seawater (Ω>1) will favour carbonate precipitation, whereas undersaturated seawater (Ω<1) favours carbonate dissolution. The majority of calcifying organisms, including planktonic foraminifera and coccolithophores, undergo dissolution or exhibit substantially hindered growth when exposed to undersaturated seawater (e.g., Mostofa et al., 2016). Calcifying organisms found in the Arctic Ocean are subject to rapid environmental changes, as this polar ocean is warming more rapidly than others (Serreze and Barry, 2011) and is particularly vulnerable to acidification due to the low alkalinity and correspondingly weak buffer capacity of its cold waters (Shadwick et al., 2013). Atmospheric CO2 uptake by Arctic surface waters is further promoted by the rapidly melting seasonal ice cover (e.g., Stroeve et al., 2012), which exposes a gradually larger area of the ocean to gas exchange with the atmosphere and whose meltwater dilutes calcium concentrations, alkalinity and carbonate ion concentrations, further decreasing Ω.
The Canadian Arctic Archipelago (CAA) and its adjacent deep basins, the Canada Basin (CB) and Baffin Bay (BB, Fig. 1), are part of the region projected to undergo the largest reduction in ice cover and, consequently, the largest decrease in surface pH (∼0.6) and Ω (1 and 0.7 for ΩC and ΩA, respectively) over the 21st century (Popova et al., 2014). Recent observations (e.g., Yamamoto-Kawai et al., 2009b; Robbins et al., 2013; Qi et al., 2017) hint at a significant decrease of the aragonite saturation state of surface waters, notably near the continental shelves (Chierici and Fransson, 2009; Bates et al., 2009), as well as a rapid expansion of the undersaturated area in the Canada Basin. Aragonite saturation states in surface waters remain above saturation but relatively low (ΩA=1.5–2.5) in the eastern CAA and Baffin Bay (Azetsu-Scott et al., 2010). Most of the time series describing carbonate mineral saturation states predate 2010 and/or do not extend geographically to the CAA and Baffin Bay.
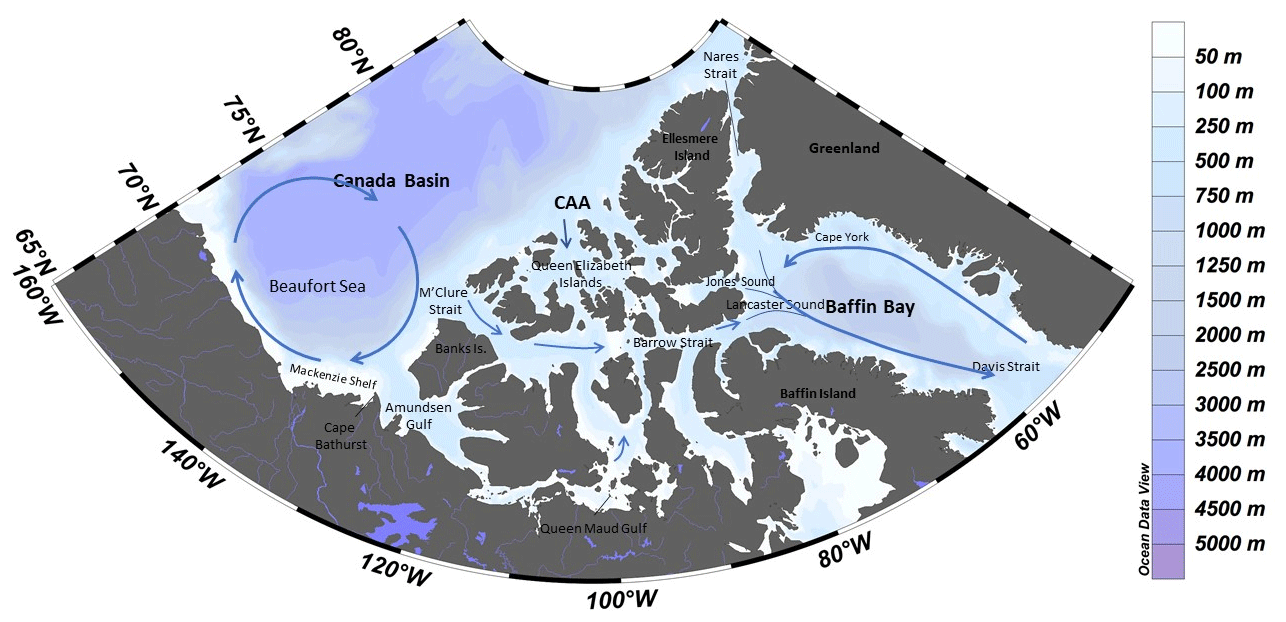
Figure 1Map of the study area with dominant surface circulation flow paths (following McLaughlin et al., 2004, and Proshutinsky et al., 2009). CAA stands for Canadian Arctic Archipelago. Created using Ocean Data View (Schlizter, 2016).
In this study, we use a large observational dataset for this part of the Arctic to (1) describe the recent state of the carbonate chemistry and its spatial variability in the Canadian Arctic Archipelago and adjacent basins, (2) investigate the interannual variability in carbonate system parameters and identify detectable temporal trends using time series spanning from 2003 to 2016, and (3) estimate the contribution of the temporal change in biological activity to the observed variability of surface DIC.
2.1 Canada Basin
The Canada Basin (CB), Canadian Arctic Archipelago and Baffin Bay accommodate the flow of surface waters from the North Pacific to the North Atlantic (Stigebrandt, 1984), as well as circulation of Atlantic waters at greater depths. The water mass structure of the southern Canada Basin is representative of these broad circulation patterns and can be summarized as follows (Carmack et al., 1989; MacDonald et al., 1989; Lansard et al., 2012): a relatively cold and fresh surface layer that contains significant fractions of meteoric water (river discharge and precipitation) and sea ice melt in the summer and becomes homogeneous in winter; an intermediate layer (∼50–200 m) of advected Pacific waters, often divided into summer and winter varieties, the latter being distinctively rich in nutrients and metabolic CO2 and recognizable by a temperature minimum in the upper halocline; a layer of warm (∼0.5 ∘C) and saline (SP>34) Atlantic water; and a cold bottom layer with practical salinities (SP) reaching 34.85. The main surface circulation feature in this area, the clockwise Beaufort Gyre, is the largest freshwater reservoir in the northern oceans, formed through Ekman pumping (Proshutinsky et al., 2009). This feature is reversed at depth. The main source of freshwater to the Beaufort Sea (the southwest portion of the Canada Basin) is the Mackenzie River (Carmack and MacDonald, 2002), although the contribution of sea ice melt is increasing significantly given the accelerating reduction in ice cover (Yamamoto-Kawai et al., 2009a). The supply of freshwater at the surface, combined with the advection of pre-acidified waters from the Pacific (100–200 m) and the Atlantic (below 400 m; Luo et al., 2016) oceans result in the presence of three distinct and expanding ΩA undersaturation horizons in the Canada Basin (Wynn et al., 2016).
2.2 Canadian Arctic Archipelago
The CAA is a series of islands on the Canadian continental shelf, through which complex circulation patterns unfold in narrow and relatively shallow channels (<500 m); see McLaughlin et al. (2004) for a detailed description of the circulation and water mass processes in this area. The prominent pathway for the eastward flow of Canada Basin water masses into Baffin Bay extends along the 74th parallel from M'Clure Strait to Lancaster Sound. A shallow 125 m sill at Barrow Strait, located centrally in the archipelago, inhibits the eastward flow of Atlantic waters, so that only surface and Pacific-origin waters reach Baffin Bay (Bidleman et al., 2007). The properties of these water masses are substantially modified during this transit (McLaughlin et al., 2004). East of Barrow Strait, Atlantic waters originating from the Labrador Sea penetrate the archipelago through Baffin Bay. Smaller inflows of water from the deep Arctic Ocean into the archipelago occur through the Queen Elizabeth Islands (northeast) and Nares Strait; minor outflows occur through Jones Sound and into Hudson Bay via Foxe Basin. Notwithstanding the Mackenzie River, whose discharge is limited to the Beaufort Sea and Amundsen Gulf, the southern portion of the CAA receives a considerable amount of freshwater from other large North American rivers (e.g., Coppermine, Burnside, Black).
2.3 Baffin Bay
The oceanographic regime of Baffin Bay is distinct from that of the CAA and CB, as it receives multiple inputs from both the Arctic and Atlantic oceans. Cold and relatively fresh Arctic- and Pacific-derived waters enter this 2300 m deep semi-enclosed basin through the Nares Strait and the Jones and Lancaster sounds (Muench, 1971; Jones et al., 1998, 2003). Warmer and more saline Atlantic Ocean waters are transported from the Labrador Sea by the West Greenland Current (WGC) into Baffin Bay through the eastern side of Davis Strait and circulate cyclonically, i.e., in an anti-clockwise direction, before joining the southward Baffin Island Current (BIC), which exits Baffin Bay through the western Davis Strait (Bourke et al., 1989; Münchow et al., 2015). Atlantic Ocean waters are modified as they mix with Arctic inflows in northern Baffin Bay, near the North Water Polynya (Melling et al., 2001). The resulting water mass structure is described by Tang et al. (2004) as follows: (1) a cold (T<0 ∘C) and relatively fresh (SP<33.7) surface layer, representing the mixed Arctic inputs; (2) a warm (T>0 ∘C) and saline (SP>34) Atlantic Ocean water layer found at depths of ∼300 to 800 m; and (3) a deeper layer of nearly constant salinity (SP=34.5).
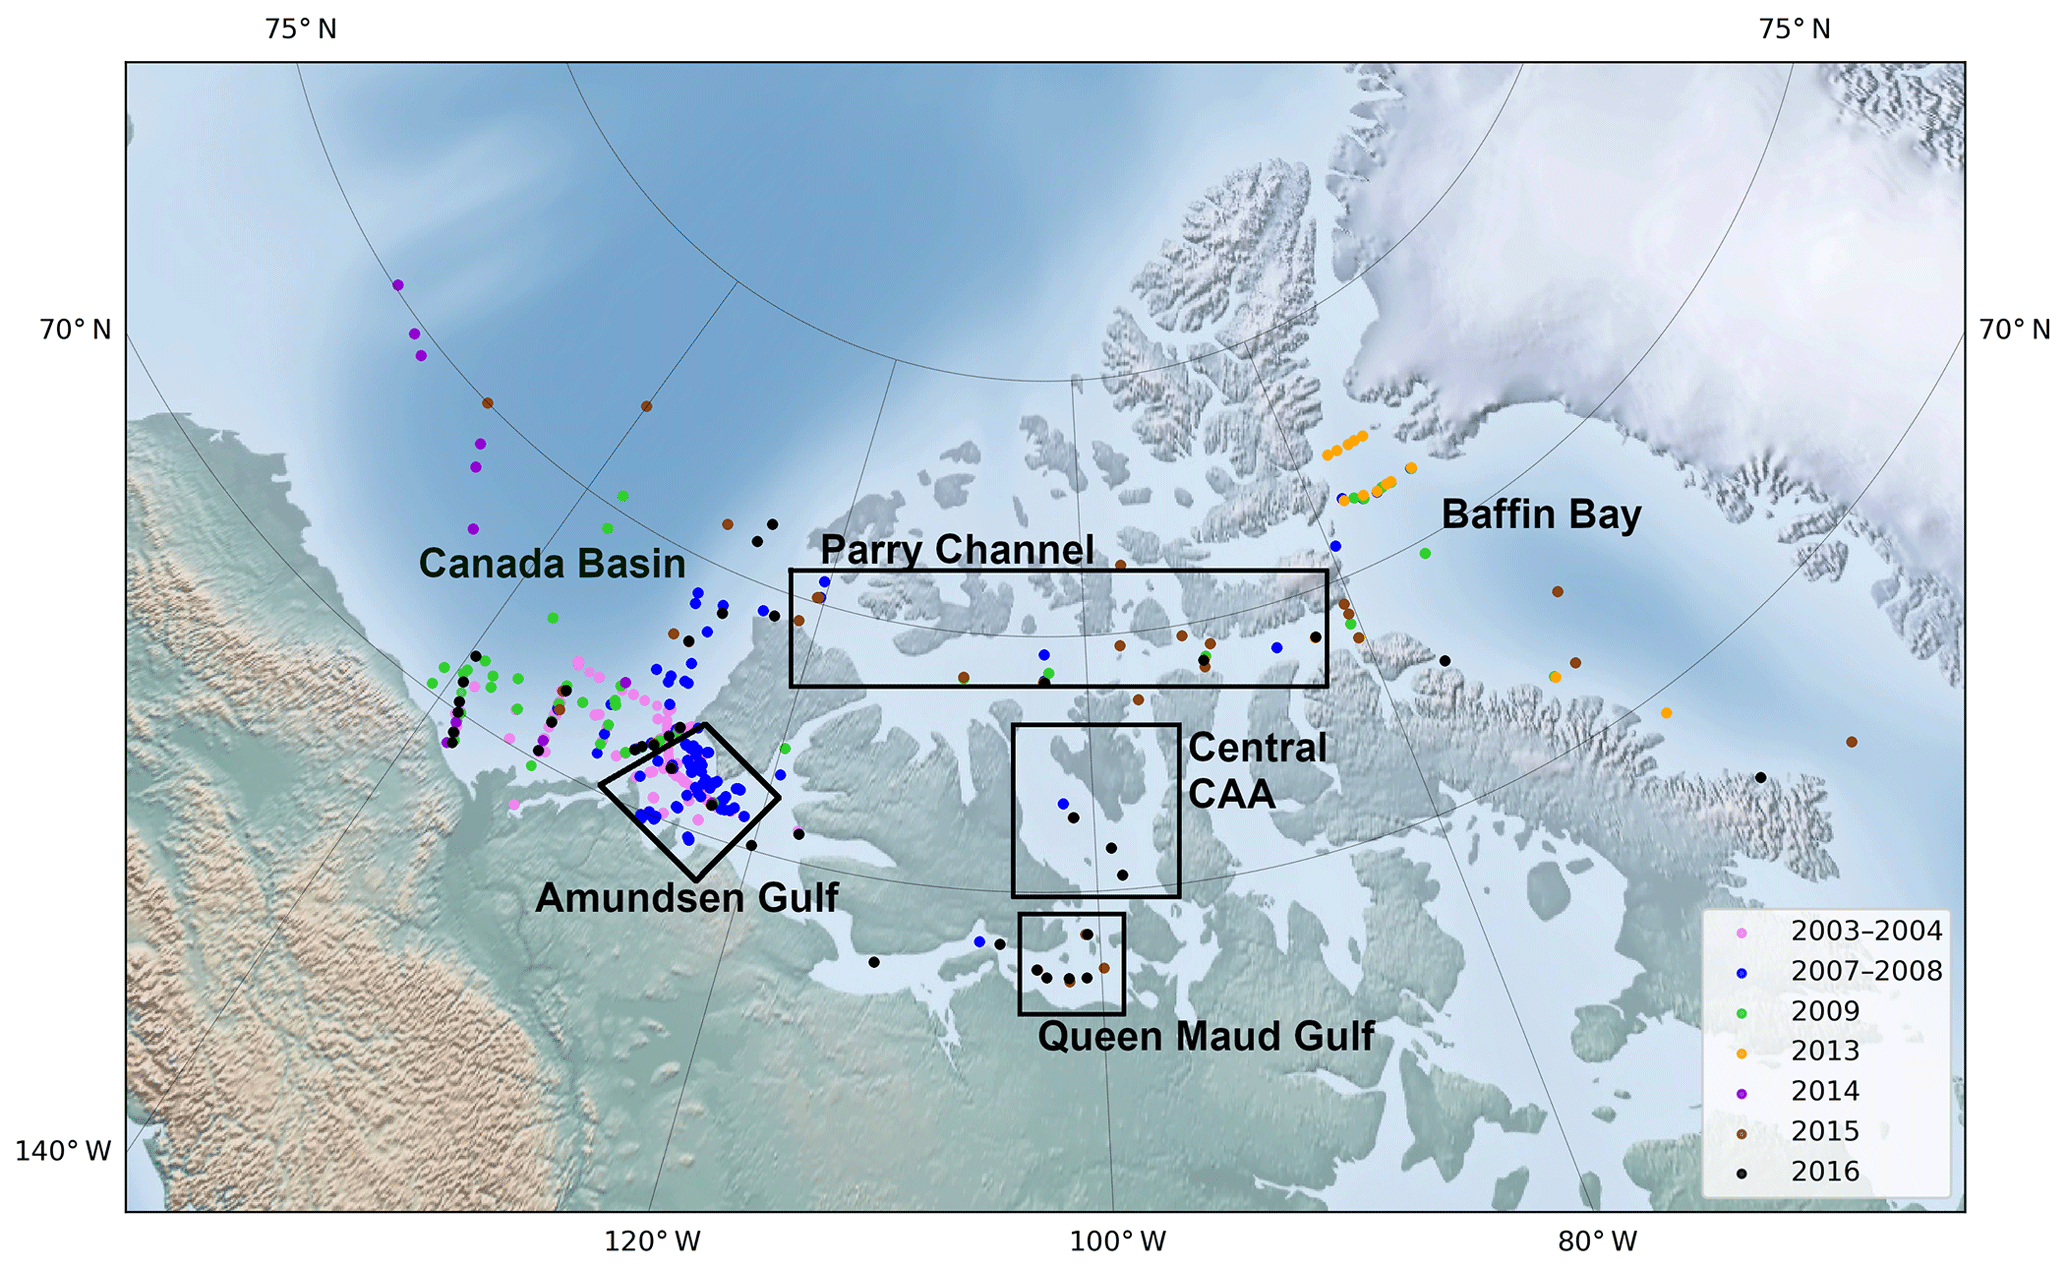
Figure 2Geographical location of the oceanographic stations covered by the dataset, colour-coded according to the year of sampling, with the approximate boundaries of the main areas mentioned in the text.
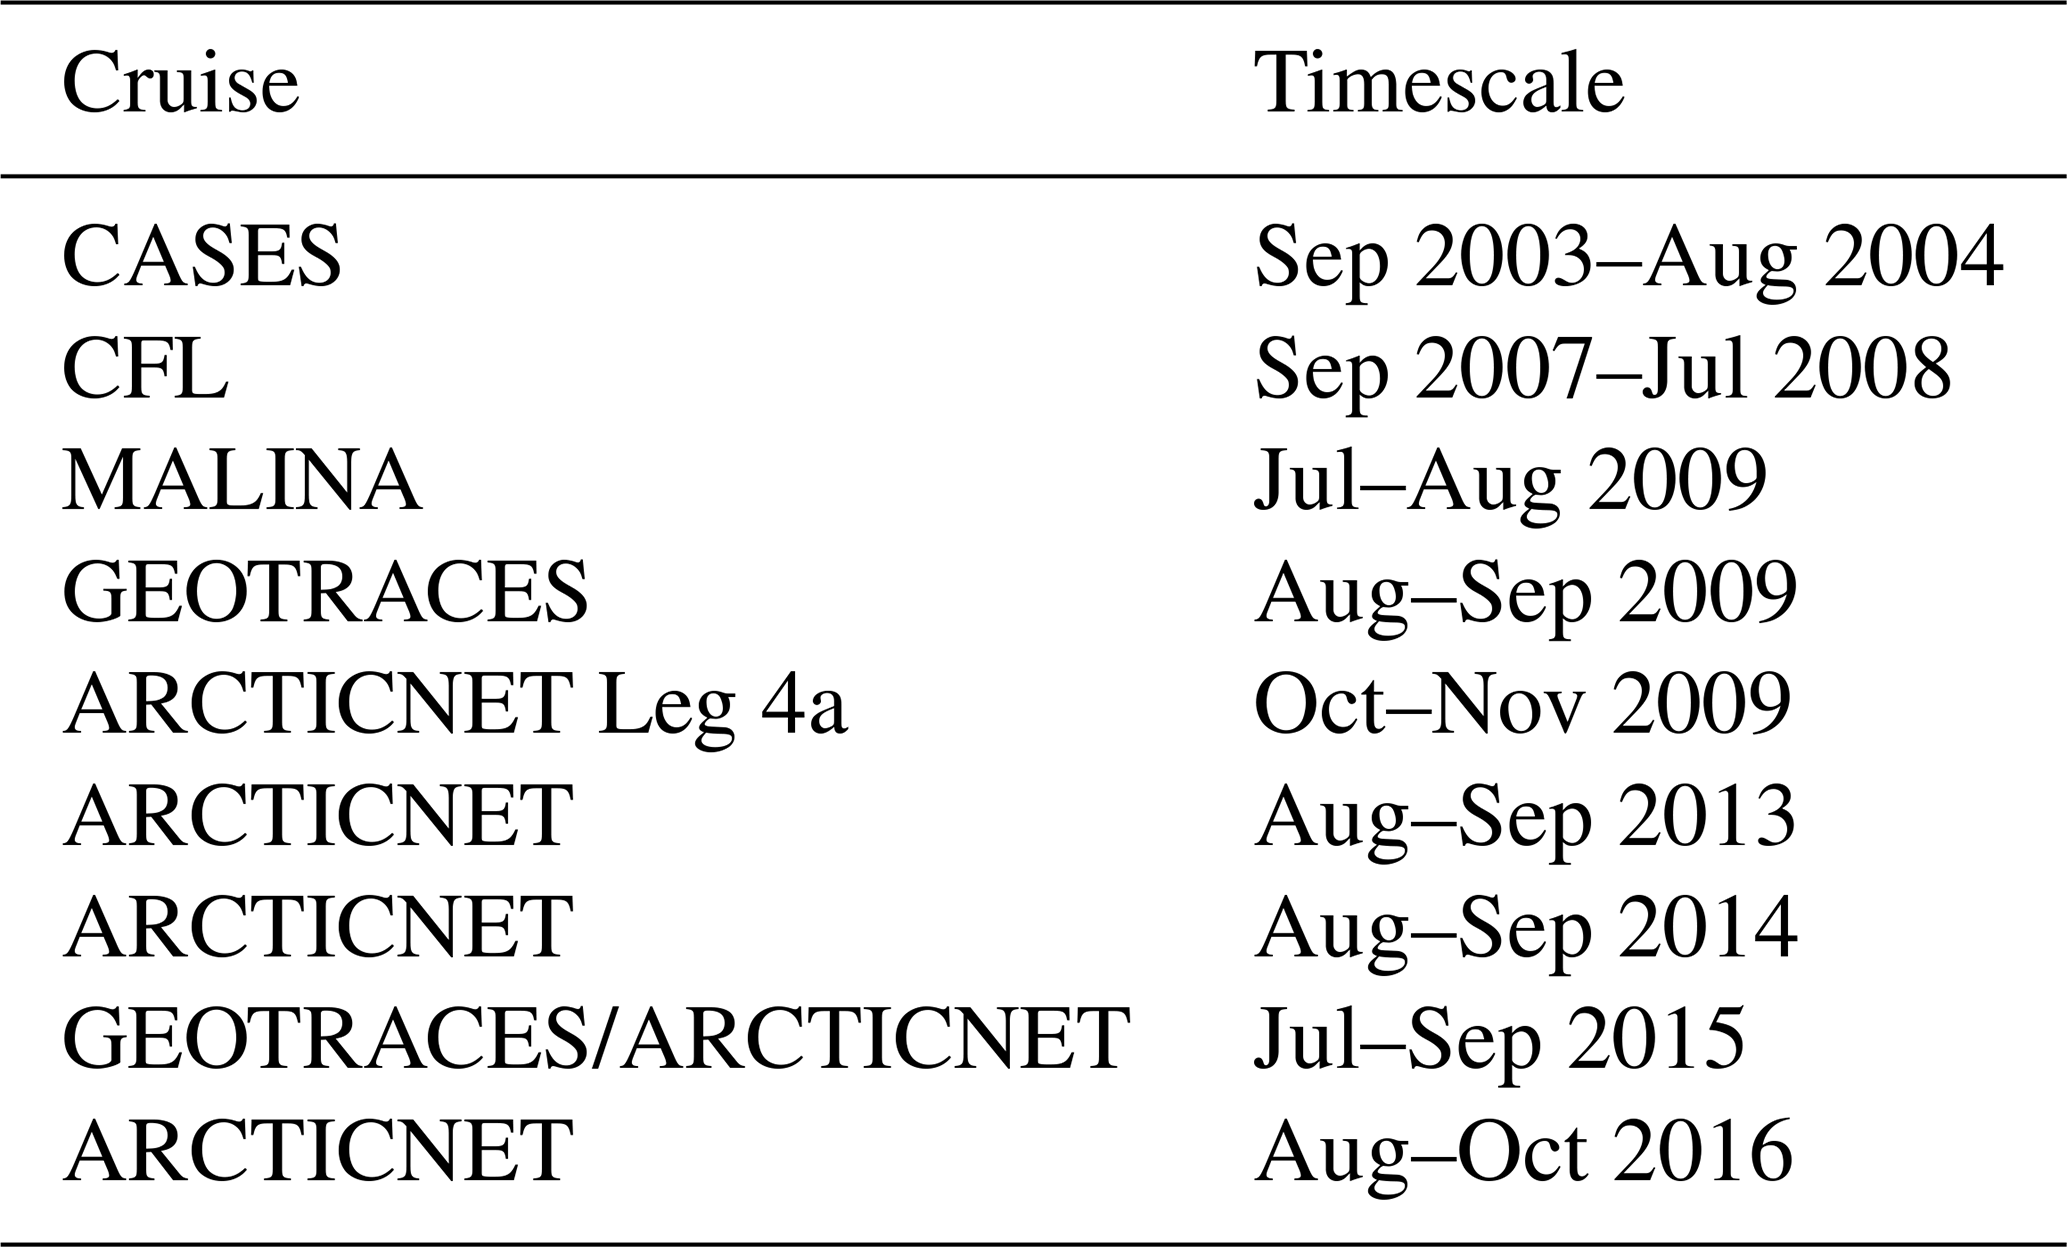
The dataset used in this study comprises data from 420 stations visited during various research cruises carried out aboard the Canadian Coast Guard Ship (CCGS) Amundsen between 2003 and 2016. Table 1 summarizes the time frame and relevant data acquired during each cruise; Fig. 2 shows the position of each sampling station. Although ice conditions restricted most observations to the summer months, two winter time series, acquired in 2003–2004 (CASES; Miller et al., 2011) and 2007–2008 (CFL; Shadwick et al., 2011) are included in the dataset.
Table 1Research cruises carried out by the CCGS Amundsen from which the dataset was constructed.
3.1 Sampling and measurements
Seawater was sampled separately for each measured parameter from Niskin bottles mounted on a Rosette system equipped with a Seabird SBE 911plus conductivity–temperature–depth (CTD) sensor, which recorded in situ practical salinity (SP) and temperature data throughout the water column. The conductivity and salinity probe was calibrated post-cruise against measurements carried out on discrete seawater samples using a Guildline Autosal 8400 salinometer (accuracy of ±0.002 or less), itself calibrated with IAPSO standard seawater. Samples used for pH determination were drawn directly from the Niskin bottles into 125 mL low-density polyethylene (LDPE) bottles with no headspace to avoid gas exchange with surrounding air and left to thermally equilibrate in a temperature bath set at 25.0 (±0.1) ∘C. The pH, on the total proton scale (pHT), was then measured spectrophotometrically on a Hewlett-Packard 8453 UV-visible diode array spectrophotometer using m-Cresol purple (Clayton and Byrne, 1993) and Phenol red (Robert-Baldo et al., 1985) indicators at 434 and 578 nm or 433 and 558 nm, respectively, in a 5 cm quartz cell. Daily calibrations were performed with TRIS buffer solutions at practical salinities of 25 and/or 35, depending on the salinity range of the samples. The reproducibility was found to be ±0.005 pH units or better, based on duplicate measurements of the same samples with the same or both indicators. Samples destined for total alkalinity (TA) and dissolved inorganic carbon (DIC) analyses were drawn directly from the Niskin bottles into 250 or 500 mL glass bottles with ground-glass stoppers, poisoned with solid mercuric chloride (HgCl2) to halt biological activity, and sealed with Apiezon M grease.
TA and DIC from the GEOTRACES 2009 and all post-2010 cruises were measured onboard or at Dalhousie University on a Marianda VINDTA 3C instrument, following the protocol described by Dickson et al. (2007) and calibrated with certified reference materials (CRM) provided by Andrew G. Dickson (Scripps Institute of Oceanography). The precision of the instrument was found to be ±2–3 µmol kg−1 based on repeated CRM analyses. The remaining DIC and TA analyses were performed, respectively, on a SOMMA instrument (Johnson et al., 1993) fitted to a UIC 5011 coulometer and by potentiometric titration using a Radiometer Titrilab 865 (see Mucci et al., 2010, for details) calibrated against the same CRMs used with the VINDTA.
In situ pHT, DIC (ArcticNet 2009 only), pCO2, ΩC and ΩA were calculated from TA and pHT (25 ∘C) or TA and DIC (for 548 out of 4730 data points) with the Excel 2.1 version of the CO2SYS software (Lewis and Wallace, 1998), using the carbonic acid dissociation constants determined by Mehrbach et al. (1973) and refit by Dickson and Millero (1987), the dissociation constants of Dickson (1990), and the total boron concentration (BT) from Uppström (1974). pCO2 was normalized using CO2SYS to the mean temperature of the top 100 m of the water column (−0.4 ∘C). The resulting ∂ln(pCO2) values range between 0.033 and 0.051 ∘C−1, with a mean of 0.046 ∘C−1, in good agreement with values obtained by Jiang et al. (2008; 0.027–0.042 ∘C−1) and Takahashi et al. (1993; 0.0423 ∘C−1).
3.2 Quality control
In order to assess the robustness of the computed DIC values, we calculated DIC from TA and pHT (25 ∘C) and compared the results with the measured DIC values. The resulting coefficient of determination of the linear fit to the measured and calculated DIC values, R2, is 0.989, while the mean difference between calculated and measured DIC values is ∼2 µmol kg−1. We excluded 30 measurements that differed from the calculated values by more than 50 µmol kg−1 (2.5 % of the mean DIC).
Questionable TA measurements, excluded from the dataset, were identified as those outside a range of 3 standard deviations from the mean salinity-normalized TA for individual regions (CB, CAA, BB) characterized by internally consistent water mass assemblages. TA measurements obtained from the two instrumental methods (VINDTA and Radiometer Titrilab 865) used in 2015 and 2016 were also compared to ensure that data originating from both methods could be used interchangeably in the calculation of additional parameters and conjointly in time series. The resulting coefficient of determination between both datasets (R2) is 0.988, the mean of the non-systematic discrepancy between values is 6 µmol kg−1 and its maximum is 36 µmol kg−1, respectively, corresponding to 0.3 % and 1.7 % of the mean TA. The degree to which the results of this test are representative of the entire dataset is uncertain, but they constitute the best possible estimate of the uncertainty associated with the use of the two analytical methods used to measure TA. When TA measurements obtained from both methods deviated significantly (>10 µmol kg−1), specific alkalinity (TA∕SP), which should remain relatively constant in a given water mass of uniform salinity (Millero, 2005; p. 268), was used to determine which data to discard. The deviation from TA values calculated from DIC and pHT (25 ∘C) was used to complement the first method, especially at the surface, although the validity of DIC measurements was previously assessed using TA.
3.3 Error estimation
In order to quantify the error associated with the calculated carbonate system parameters reported in this study, we used the CO2SYS program modified by Orr et al. (2018), which applies error propagation to instrumental and constant-related uncertainties. For simplicity, we report the mean uncertainty for each parameter (see Table 2), as the variance is minimal within our dataset. We found the additional uncertainty associated with the unavailability of nutrient concentrations (P and Si) as input parameters in CO2SYS to be negligible (up to 0.0006 pH units, 1.5 µatm pCO2 and 0.006Ω units, as determined using nutrient data where available).
Table 2Mean uncertainties of parameters computed in CO2SYS, their standard deviations and their relative weight with respect to the mean value of each parameter, for different carbonate parameter input pairs.
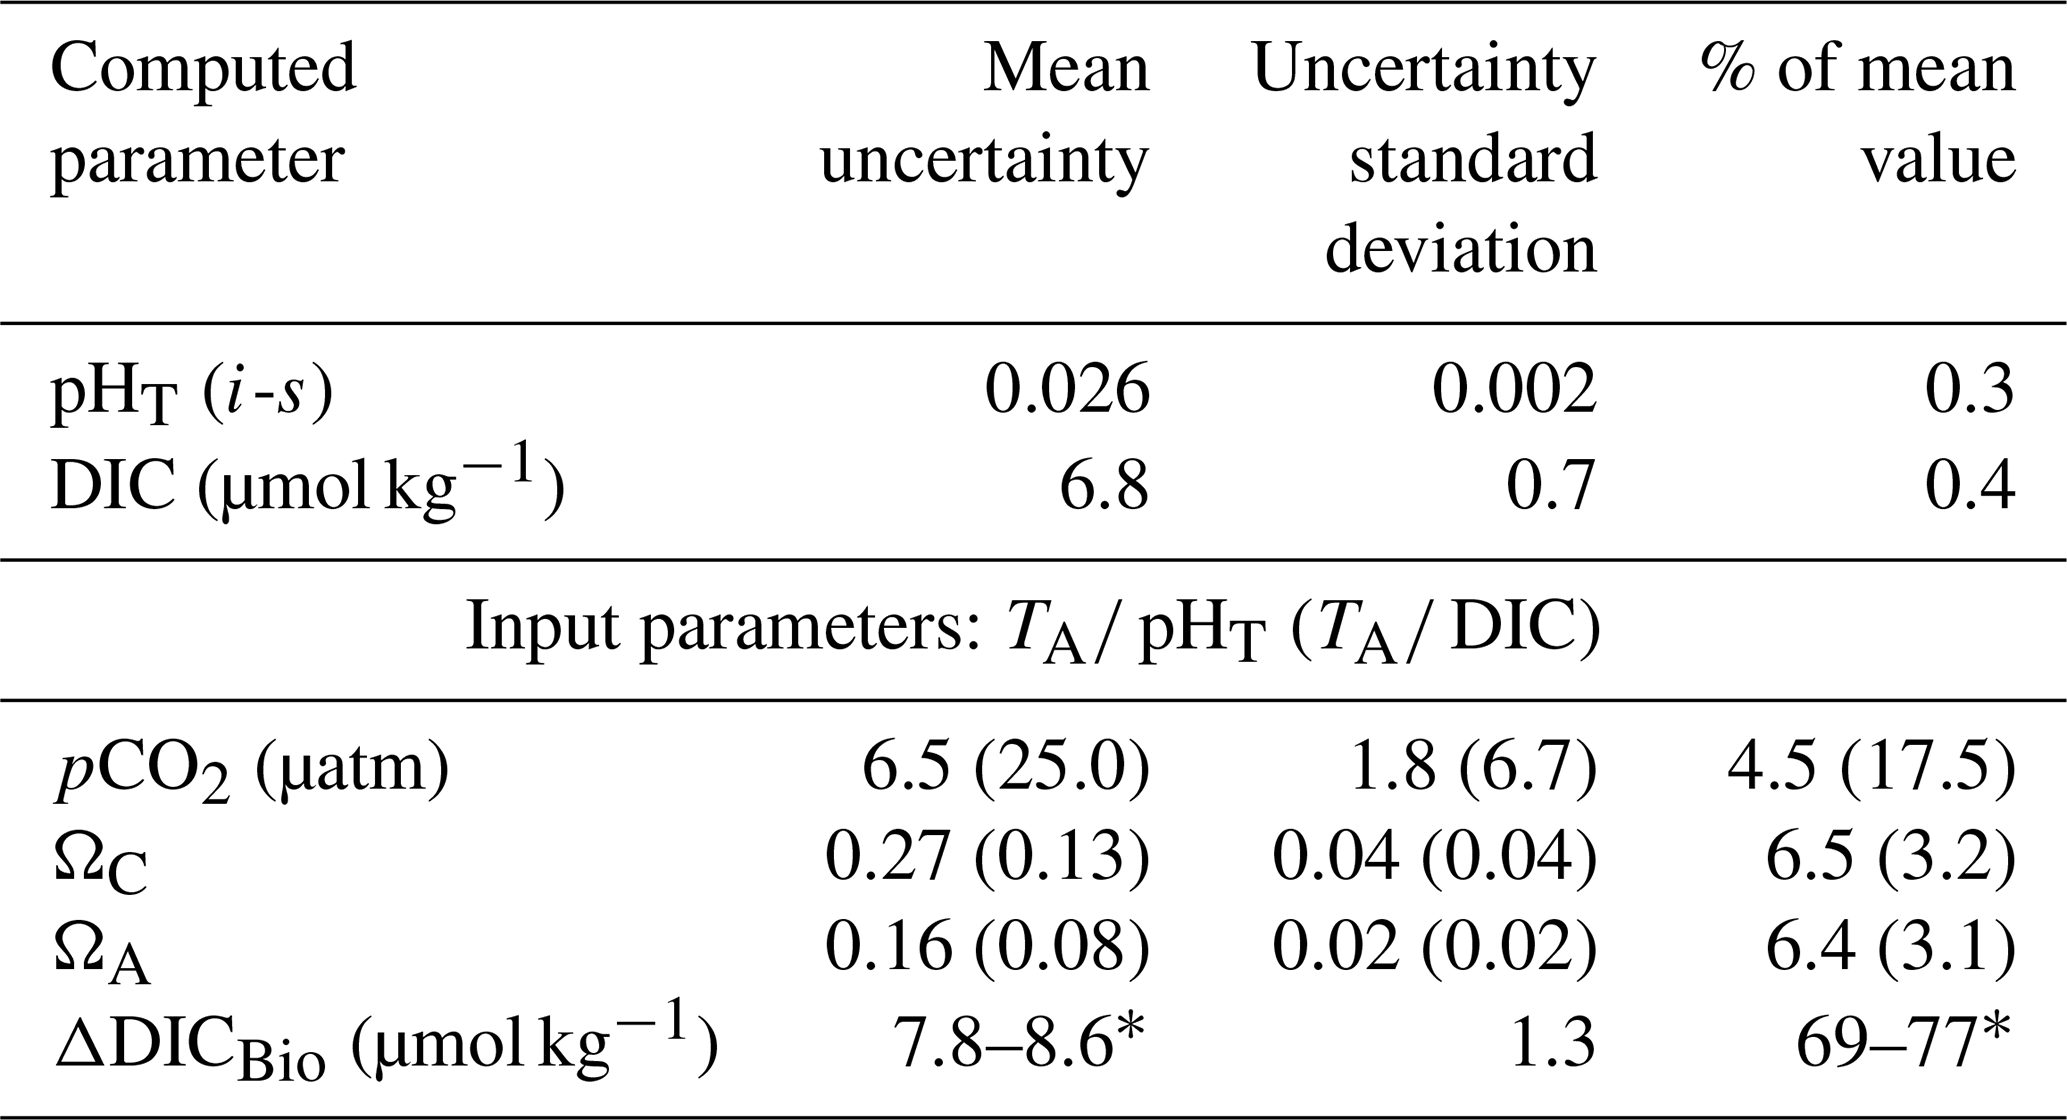
* The δDICBio uncertainty depends on whether DICObserved was measured or computed.
4.1 Recent observations (2014–2016)
4.1.1 Surface observations
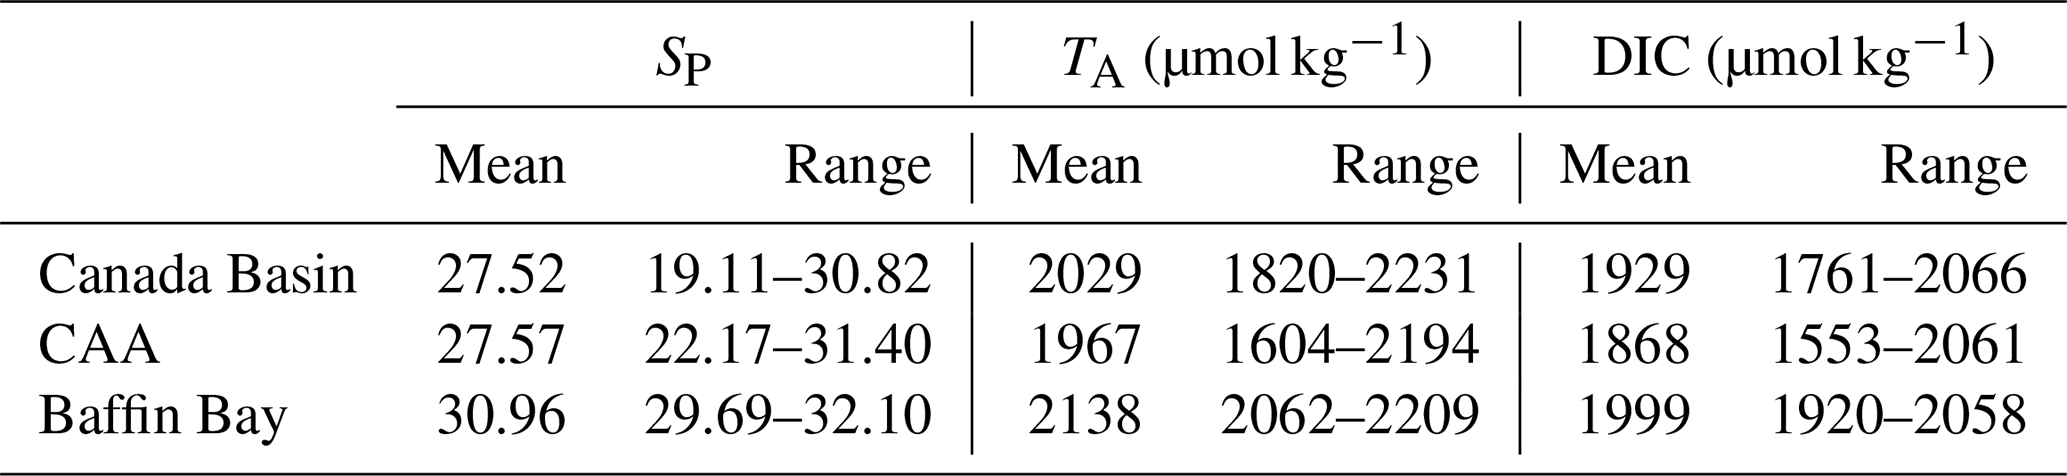
To characterize the recent state of seawater carbonate chemistry in the study area, we use data obtained in the late summers (August–September) of 2014, 2015 and 2016. Uncertainties for each parameter can be found in the Methods (Sect. 3.3). The mean 2014–2016 surface (<10 m) practical salinity (SP), TA and DIC values in the Canada Basin (CB), Canadian Arctic Archipelago (CAA) and Baffin Bay (BB) are presented in Table 3. It is important to note that the mean regional values we report for the Canada Basin may be skewed by the higher density of stations located along the Mackenzie Shelf and that our sample size for Baffin Bay consists of only six stations. Practical salinities considerably below 25 were mostly observed near the mouth of the Mackenzie River, with some in the Queen Maud Gulf (QMG). The discrepancy between SP and TA values observed at the surface and in most of the water column of the CB, CAA and BB clearly illustrates the change in water mass regime west of Lancaster Sound (see Sect. 2), while DIC, which is strongly affected by biological activity, shows a less prominent spatial pattern. In all regions, surface water pCO2, of which we only consider data acquired over the top 5 m of the water column in order to render it more indicative of gas exchange potential, was largely undersaturated with respect to the atmosphere, by as much as 150 µatm (Fig. 3). This suggests that the region as a whole acts as a net CO2 sink during the summer, as Geilfus et al. (2018) observed in 2011. Ahmed et al. (2019) came to a similar conclusion based on underway pCO2 measurements carried out in the CAA between 2010 and 2016 but reported consistent temporal fluctuations of summer sea surface pCO2 and ΔpCO2 driven by sea ice processes. The handful of locations exhibiting a positive ΔpCO2 (pCO2SW–pCO2air; outgassing to the atmosphere) are located in the QMG and the transect between Banks Island and Cape Bathurst (Fig. 4), where the episodic upwelling of upper halocline water is well documented (Mucci et al., 2010; Tremblay et al., 2011).
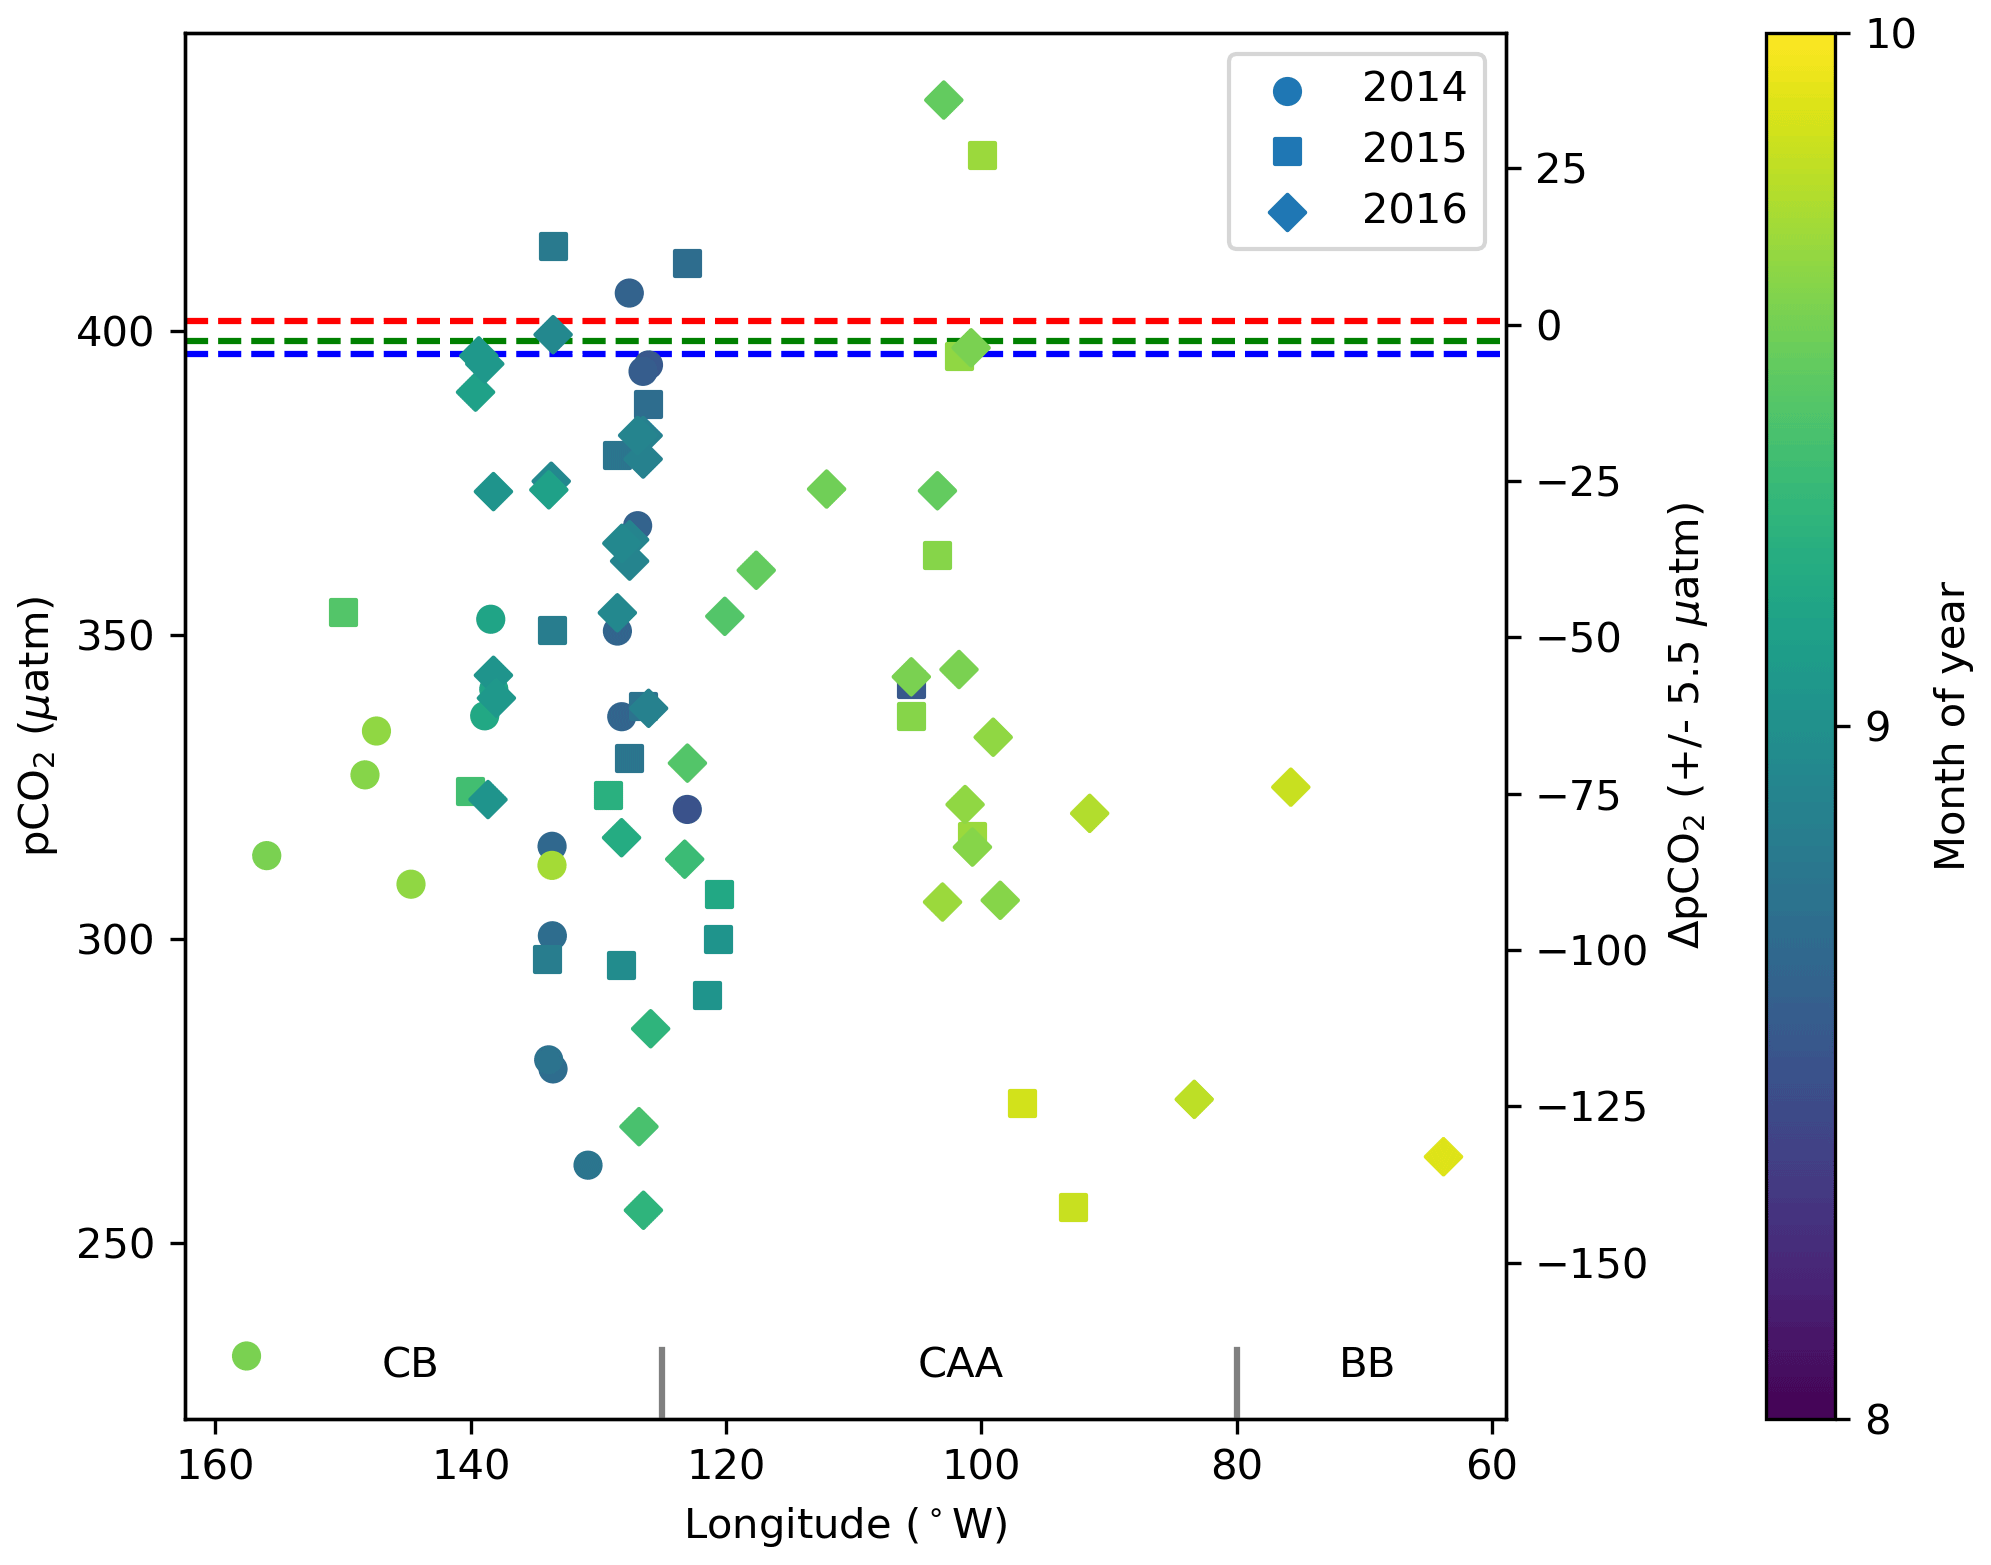
Figure 3Surface water (<5 m) pCO2 and ΔpCO2 (pCO2SW–pCO2air) from 2014, 2015 and 2016 in the Canada Basin (CB), Canadian Arctic Archipelago (CAA) and Baffin Bay (BB). The dashed blue, green and red lines represent the average of the global mean monthly atmospheric pCO2 values for August and September 2014, 2015 and 2016, respectively (data from Dlugokencky and Tans, NOAA/ESRL, https://www.esrl.noaa.gov/gmd/ccgg/trends/ last access: 28 March 2019). The ΔpCO2 axis shifts in accordance with the atmospheric value used for each year, such that points may be offset from their true position by up to 5.5 µatm.
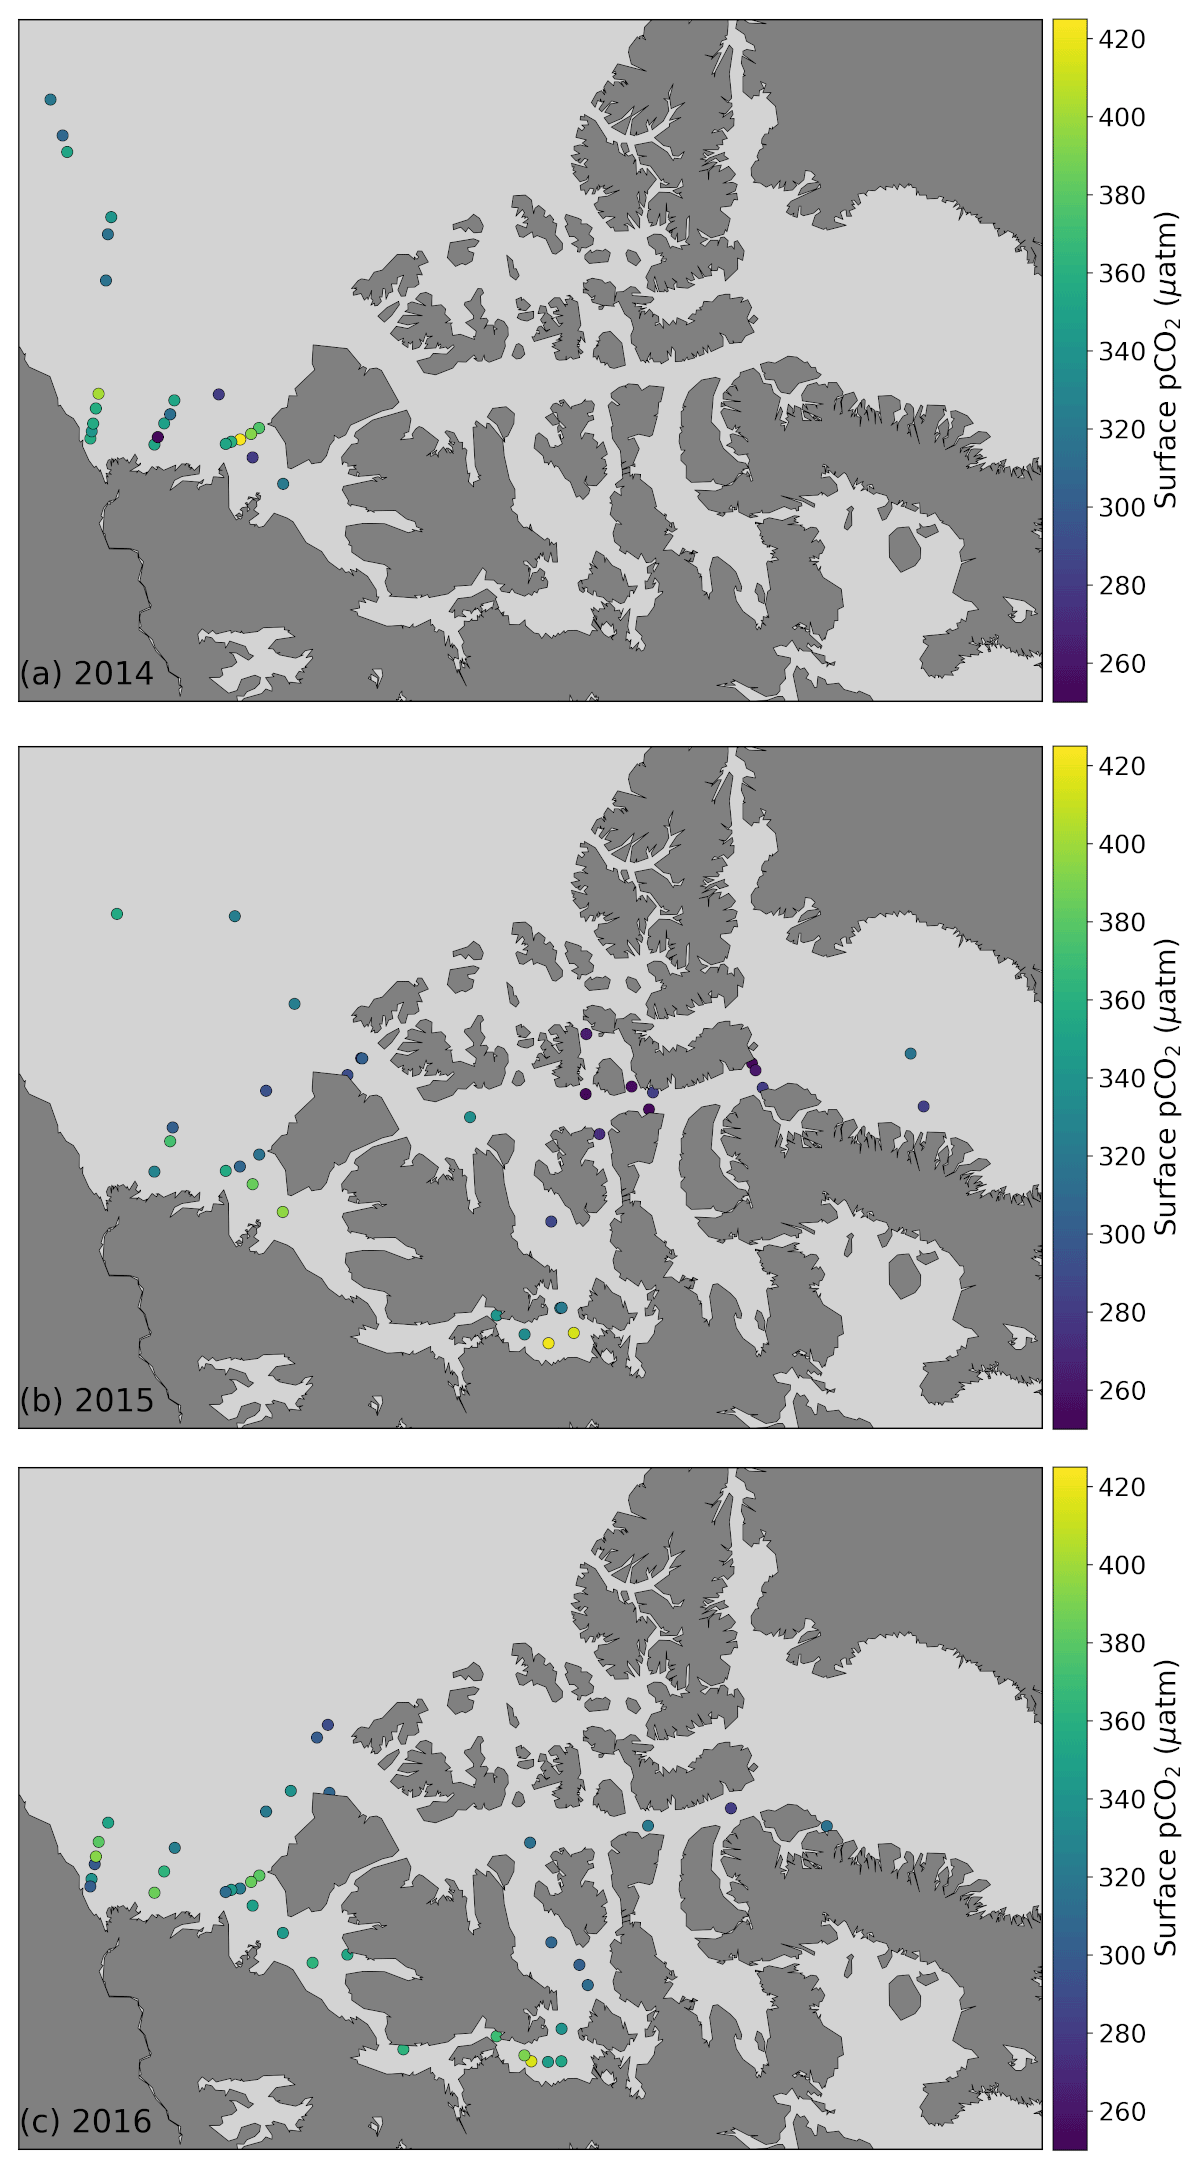
Figure 4Surface water (<5 m) pCO2 in 2014 (a), 2015 (b) and 2016 (c) in the study area.
Table 3Mean surface water (<10 m) practical salinity (SP), total alkalinity (TA), dissolved organic carbon (DIC) and associated ranges in the three subregions of the study area in 2014, 2015 and 2016.
The saturation state of surface waters (<10 m) with respect to aragonite (ΩA, Fig. 5) ranges from 0.82 to 2.03 (mean 1.26), 0.73 to 2.01 (mean 1.22) and 1.47 to 1.69 (mean 1.57), respectively, in the CB, CAA and BB. ΩA correlates well with SP (r=0.79; Fig. 6), although the surface samples with the highest salinities (SP∼32), collected in Baffin Bay, were not the most supersaturated. Recurrent undersaturated conditions (ΩA<1), potentially deleterious to calcifying organisms, are found at the surface in two areas: the central Canada Basin and the Queen Maud Gulf. Such conditions have been well documented in the former (e.g., Robbins et al., 2013) and attributed mostly to the input of sea ice melt, which lowers ΩA by diluting surface waters and promotes CO2 uptake (Yamamoto-Kawai et al., 2011). As of 2016, surface undersaturation with respect to aragonite was limited to the central Canada Basin and did not extend to its bordering continental shelf, where ΩA remains near saturation (1–1.25).

Figure 5Surface water (<10 m) ΩA (a, b, c) and ΩC (d, e, f) in 2014 (a, d), 2015 (b, e) and 2016 (c, f). Note the different colour scales for ΩA and ΩC, for which the diverging value for the former is 1 and is 2 for the latter.
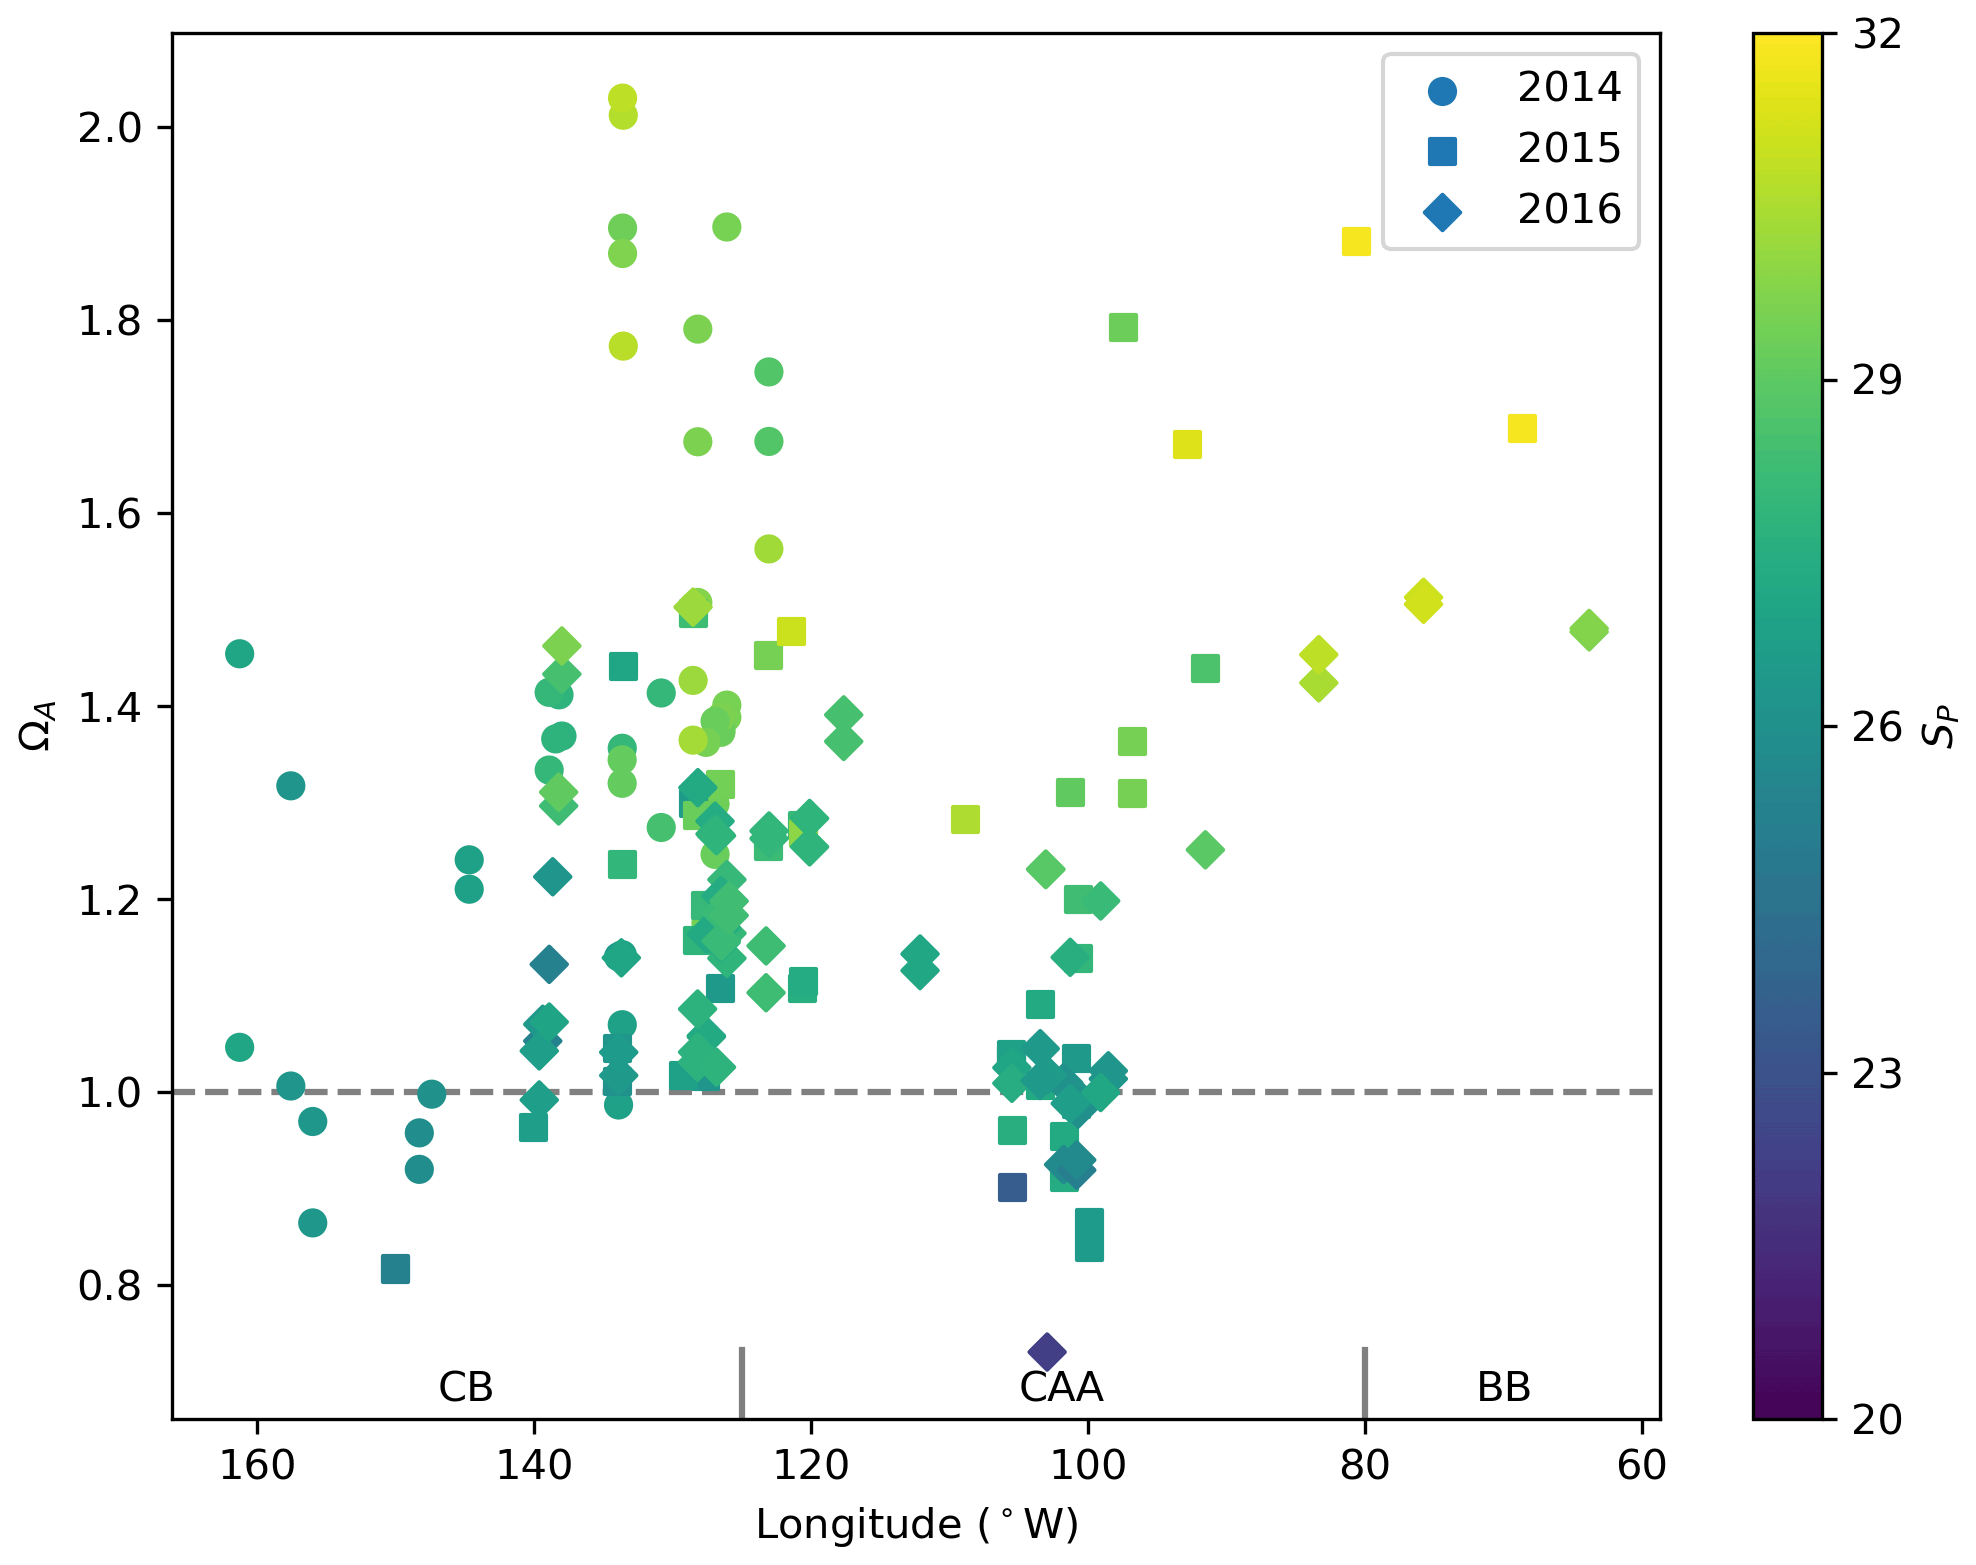
Figure 6Surface water (<10 m) ΩA and associated practical salinities (SP, colour scale) in 2014, 2015 and 2016 in the Canada Basin (CB), Canadian Arctic Archipelago (CAA) and Baffin Bay (BB). The horizontal line at ΩA=1 represents saturation with respect to aragonite.
In the Queen Maud Gulf, surface ΩA values as low as 0.84 and 0.73 (±0.16) were observed in 2015 and 2016, respectively (most visible as the two minima in Figs. 6 and 7k). Most of the surrounding samples were slightly undersaturated (ΩA∼0.90–1.05). Both minima were associated with locally higher pCO2 values (429 and 438±6 µatm) and practical salinities of 26.54 and 22.17. Two mechanisms, namely the decrease in the calcium (Ca2+) ion concentration and alkalinity via dilution by freshwater and the decrease of the concentration concomitant with a decrease in pH, explain these saturation minima. The former process is self-explanatory and results from the documented increase in freshwater inputs by melting of sea ice (Yamamoto-Kawai et al., 2009b) and increased river discharge (Déry et al., 2016). We estimate, based on a linear regression of surface δ18O data against SP, that upwards of 95 % of the freshwater at the surface of the QMG in 2015 was of riverine origin (Appendix B). Our dataset does not allow us to directly differentiate the contributions of air–sea gas exchange and biological activity (respiration) to the high pCO2 observed at these locations. Nonetheless, the depth of these samples (<5 m) implies some degree of equilibration with the atmosphere. Although the diurnal cycle of biological activity may play a role in the development of peaks in Ω, we rule out diurnal fluctuations in pCO2 as the principal explanation for the ΩA minima discussed above, as the 0.73 minimum of 2016, was observed in the early afternoon. Although the ΩA minima represent significant undersaturation, the uncertainty in ΩA computations (0.08 or 0.16 depending on the parameters used in the calculation; see Sect. 3) blurs the saturation threshold in such a way that ΩA values marginally below 1 might in reality represent supersaturated conditions, and vice versa. It is important to note that, even without the influence of climate change, areas of high riverine discharge naturally harbour lower carbonate mineral saturation states. Thus, undersaturated conditions in the QMG and elsewhere do not solely result from the recent increase of freshwater inputs described above or air–sea gas exchange. Nonetheless, changes in the amount of freshwater-driven dilution and atmospheric CO2 uptake affect the degree of this undersaturation, as well as its spatial and temporal extent.
Surface waters throughout the study area are supersaturated with respect to calcite, with ΩC ranges (mean) of 1.34 to 3.25 (2.04), 1.21 to 3.29 (1.97) and 2.38 to 2.70 (2.52) in the CB, CAA and BB, respectively. Uncertainties in ΩC values are on the order of 0.25–0.30, almost twice as large as those of ΩA, due to the larger uncertainty of the calcite stoichiometric solubility product (Mucci, 1983).
4.1.2 Water column observations
Depth profiles of pHT, pCO2 and ΩA grouped by region (equivalent to water mass regime) are presented in Fig. 7. We divided the broad Canadian Arctic Archipelago region into four subregions (see Fig. 2): the Parry Channel, the east–west channel extending from M'Clure Strait to Lancaster Sound, the Amundsen Gulf, and the Queen Maud Gulf and the central CAA, which connects the QMG to the Parry Channel. The water mass structures are essentially the same as those described in Sect. 2.

Figure 7Depth profiles of pHT (left), pCO2 (middle) and ΩA (right) at representative stations of the Canada Basin (CB; top), Baffin Bay (BB; bottom) and the Canadian Arctic Archipelago (CAA). The latter is divided into four subregions (shown on Fig. 2): Parry Channel, Amundsen Gulf, Central Archipelago and Queen Maud Gulf (QMG).
The most prominent feature in profiles of carbonate system parameters in the Canada Basin is the Upper Halocline Layer (UHL), a layer of water originating from the Pacific Ocean with a relatively low pH due to its high metabolic CO2 content (Shadwick et al., 2011). In 2014–2016, the UHL was characterized by a pHT minimum of 7.82±0.03, a pCO2 maximum of µatm (both calculated at in situ temperature) and a ΩA minimum of 0.75±0.16 in the central CB. This pHT minimum migrates upwards from ∼180 to ∼140 m as the UHL encounters the continental shelf west of M'Clure Strait but maintains its amplitude. The presence of such an acidified layer exacerbates the vulnerability of the planktonic communities in this area, as, in addition to the aragonite undersaturation found at the surface, ΩA drops below one at depths of 100 to 125 m or even shallower in waters in the Canada Basin. As CO2 naturally diffuses or mixes from the UHL to the overlying waters and the combination of gas exchange and freshening continues to generate undersaturated conditions at the surface, the entire photic zone (where ΩA<1.5) may acidify and become undersaturated with respect to aragonite at a much faster rate than that of other oceans. The shallowest subsurface aragonite saturation horizon we observe in the central Canada Basin was found at ∼85 m in 2014. Our data do not corroborate the interpretation of Wynn et al. (2016) that the upper boundary of the UHL is migrating downwards due to an expansion of the overlying Polar Mixed Layer (PML), at least not during the period of our observations. The ΩA crosses the saturation threshold back to supersaturation between 200 and 250 m, where Atlantic waters become predominant, as evidenced by a +0.8 ∘C temperature maximum at depths of 400 to 500 m (in contrast to a temperature minimum of −1.5 ∘C in the UHL). ΩA and pHT remain, respectively, above 1.3 and 8.05 in this layer, with respective maxima of 1.74 (±0.16) and 8.17 (±0.03) found within the depth range of the temperature maximum mentioned previously. The profiles presented in Fig. 7a, e, and i do not extend to the bottom of the basin, but deep waters become undersaturated with respect to aragonite below ∼2100 m (data from 2009).
The Amundsen Gulf and the western portion of the Parry Channel (Fig. 7b, f, j) exhibit a similar water mass structure and carbonate system chemistry as the Canada Basin, as the dominant circulation pattern pushes water eastward from the CB to the CAA. Undersaturation with respect to aragonite does not occur at the surface in these areas, owing to higher salinities. Although the amplitudes of the ΩA, pHT and pCO2 excursions are slightly smaller than those found in the CB, the UHL is considerably shallower in the western CAA. Consequently, ΩA falls below 1 at depths of 50 to 70 m, and the upper portion of the water column in those parts of the CAA might become undersaturated with respect to aragonite even more rapidly than in the CB. As reflected by the blue lines in Fig. 7b, f and j, the UHL becomes progressively less discernable on depth profiles as it undergoes modification and mixing during its transit from the CB to Lancaster Sound. Atlantic waters are found at the bottom of the water column in the Amundsen Gulf and Parry Channel. The saturation maxima at ∼400 m (ΩA∼1.1 to 1.4) are significantly lower in these areas than at similar depths in the CB.
The shallow bathymetry of the central CAA restricts the eastern flow originating from the CB to the layer of Pacific water (UHL) and the overlying surface water. ΩA is close to 1 at the surface and reaches a maximum of ∼1.45 (±0.16) at ∼30 m, before dipping back below 1 between 50 and 75 m, like in other parts of the CAA. With the exception of one profile that exhibits a strong pCO2 maximum of 685 (±6.49) µatm as well as pHT and ΩA minima of 7.80 (±0.03) and 0.76 (±0.16), respectively, at a depth 125 m, this UHL feature becomes less prominent in the central CAA. Degradation of settling organic matter (remineralization) might explain the greater amplitude of this peak than those observed in the Canada Basin at Station 310 in September 2016. Stratification becomes significantly weaker in the shallow waters (20–100 m) of the Queen Maud Gulf (Fig. 7c, g, k), despite freshwater addition theoretically strengthening stratification, as it is one of the areas with the strongest tidal mixing in the CAA (McLaughlin et al., 2004). Practical salinity profiles in this area do not show values exceeding 30 at the bottom of the water column, significantly lower than the values above 32 observed at the same depths in the central CAA. The residence time of waters in this area might also be relatively high, due to its geographical isolation from the main channels of the CAA, possibly allowing more mixing to take place. The combined effects of low salinities from freshwater accumulation (mostly from river discharge) and the efficient redistribution of CO2 through mixing result in low carbonate mineral saturation states throughout the water column. The QMG is the only region in our study area where, at some locations, the entire water column is undersaturated with respect to aragonite, making it an ideal location to study the effects of such conditions on aragonitic organisms.
East of Barrow Strait, where a sill restricts the eastward flow to the upper 125 m of the water column (Bidleman et al., 2007), the water mass regime changes. With the exception of one profile that captures the Pacific outflow through the western portion of Lancaster Sound at station 301 (Fig. 7d, h, l, blue line), this change is clearly visible in profiles of carbonate system parameters in Lancaster Sound and Baffin Bay, where the upper 500 m of the water column is supersaturated with respect to aragonite at each of the visited stations. Although surface waters in Northern Baffin Bay are a mixture of multiple inputs from the CAA and the Arctic Ocean through Nares Strait, the warm and saline Atlantic water inflow from the Labrador Sea dominates the water mass structure in the region and accounts for the high alkalinity of these waters relative to the CB and CAA (Münchow et al., 2015). In Baffin Bay, waters become undersaturated with respect to aragonite and calcite at depths of ∼600 and ∼1400 m, respectively. The pCO2 and pHT increase and decrease proportionally to each other with depth.
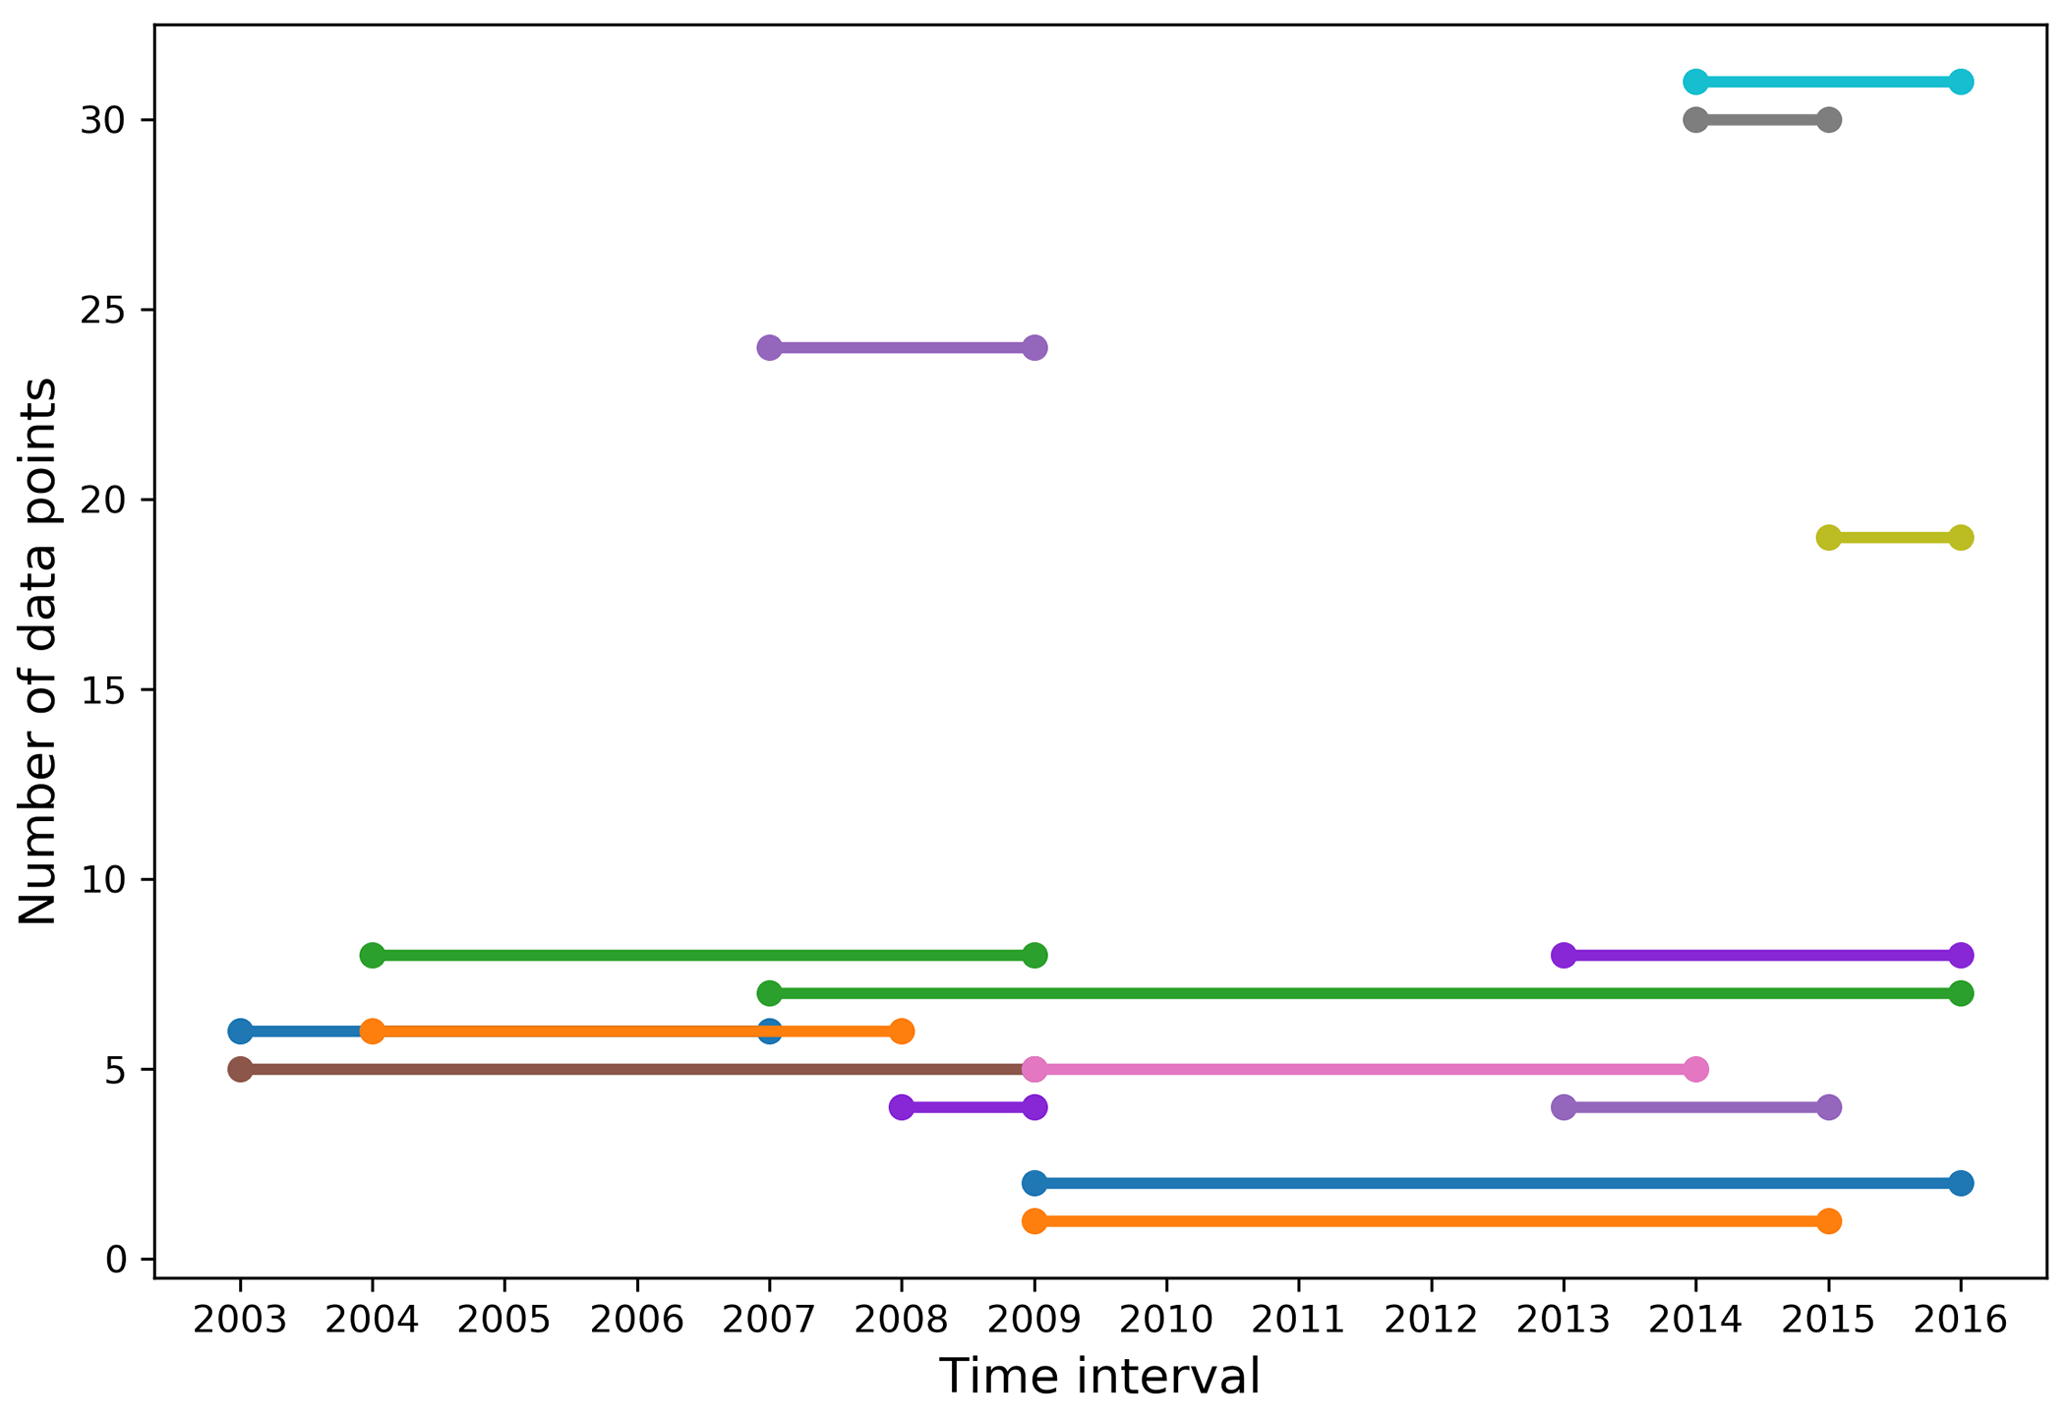
Figure 8Number of comparable data points in the top 100 m of the water column, obtained from measurements made at the same station and within set depth intervals (of 3.5 m at the surface, increasing progressively to 15 m to a depth of 100 m), between each year of the dataset.
4.2 Time series
Of the 420 stations that make up our dataset, 24 were visited in at least 2 different years and match our comparability criteria for time series. These criteria are (1) the stations were sampled within 31 calendar days of each other (this criterion is not ideal since seasonality is highly variable and driven by complex sea ice processes, including ice break-up) and (2) the stations are located within a 5 km radius. The mean time difference and distance between comparable stations are 12 calendar days and 1.81 km, respectively. Eight were visited three times, the remainder were visited twice. With the exception of one site in northern Baffin Bay, all recurrently sampled stations are located within or on the outskirts of the CAA. A total of 16 of the 24 time series span 3 years or less. Within all comparable stations, we identified the measurements made at similar depths in the top 100 m of the water column (Fig. 8). The 2014–2015 and 2014–2016 intervals have the largest number of comparable data points (∼30), followed by the 2007–2009 and 2015–2016 intervals. The remaining year combinations have less than 10 comparable data points. The small data pool applicable to time series and the generally short and inconsistent time intervals between comparable data points highlight the poor suitability of our dataset to the identification of temporal trends of ocean acidification. The strong interannual variability of carbonate system parameters in the CAA strengthens this conclusion. Nonetheless, we use data from the seven stations visited over a time interval of at least 5 years (Fig. 9) to identify some trends in carbonate system parameters. The resulting depth profiles are shown in Figs. 10 and 11.
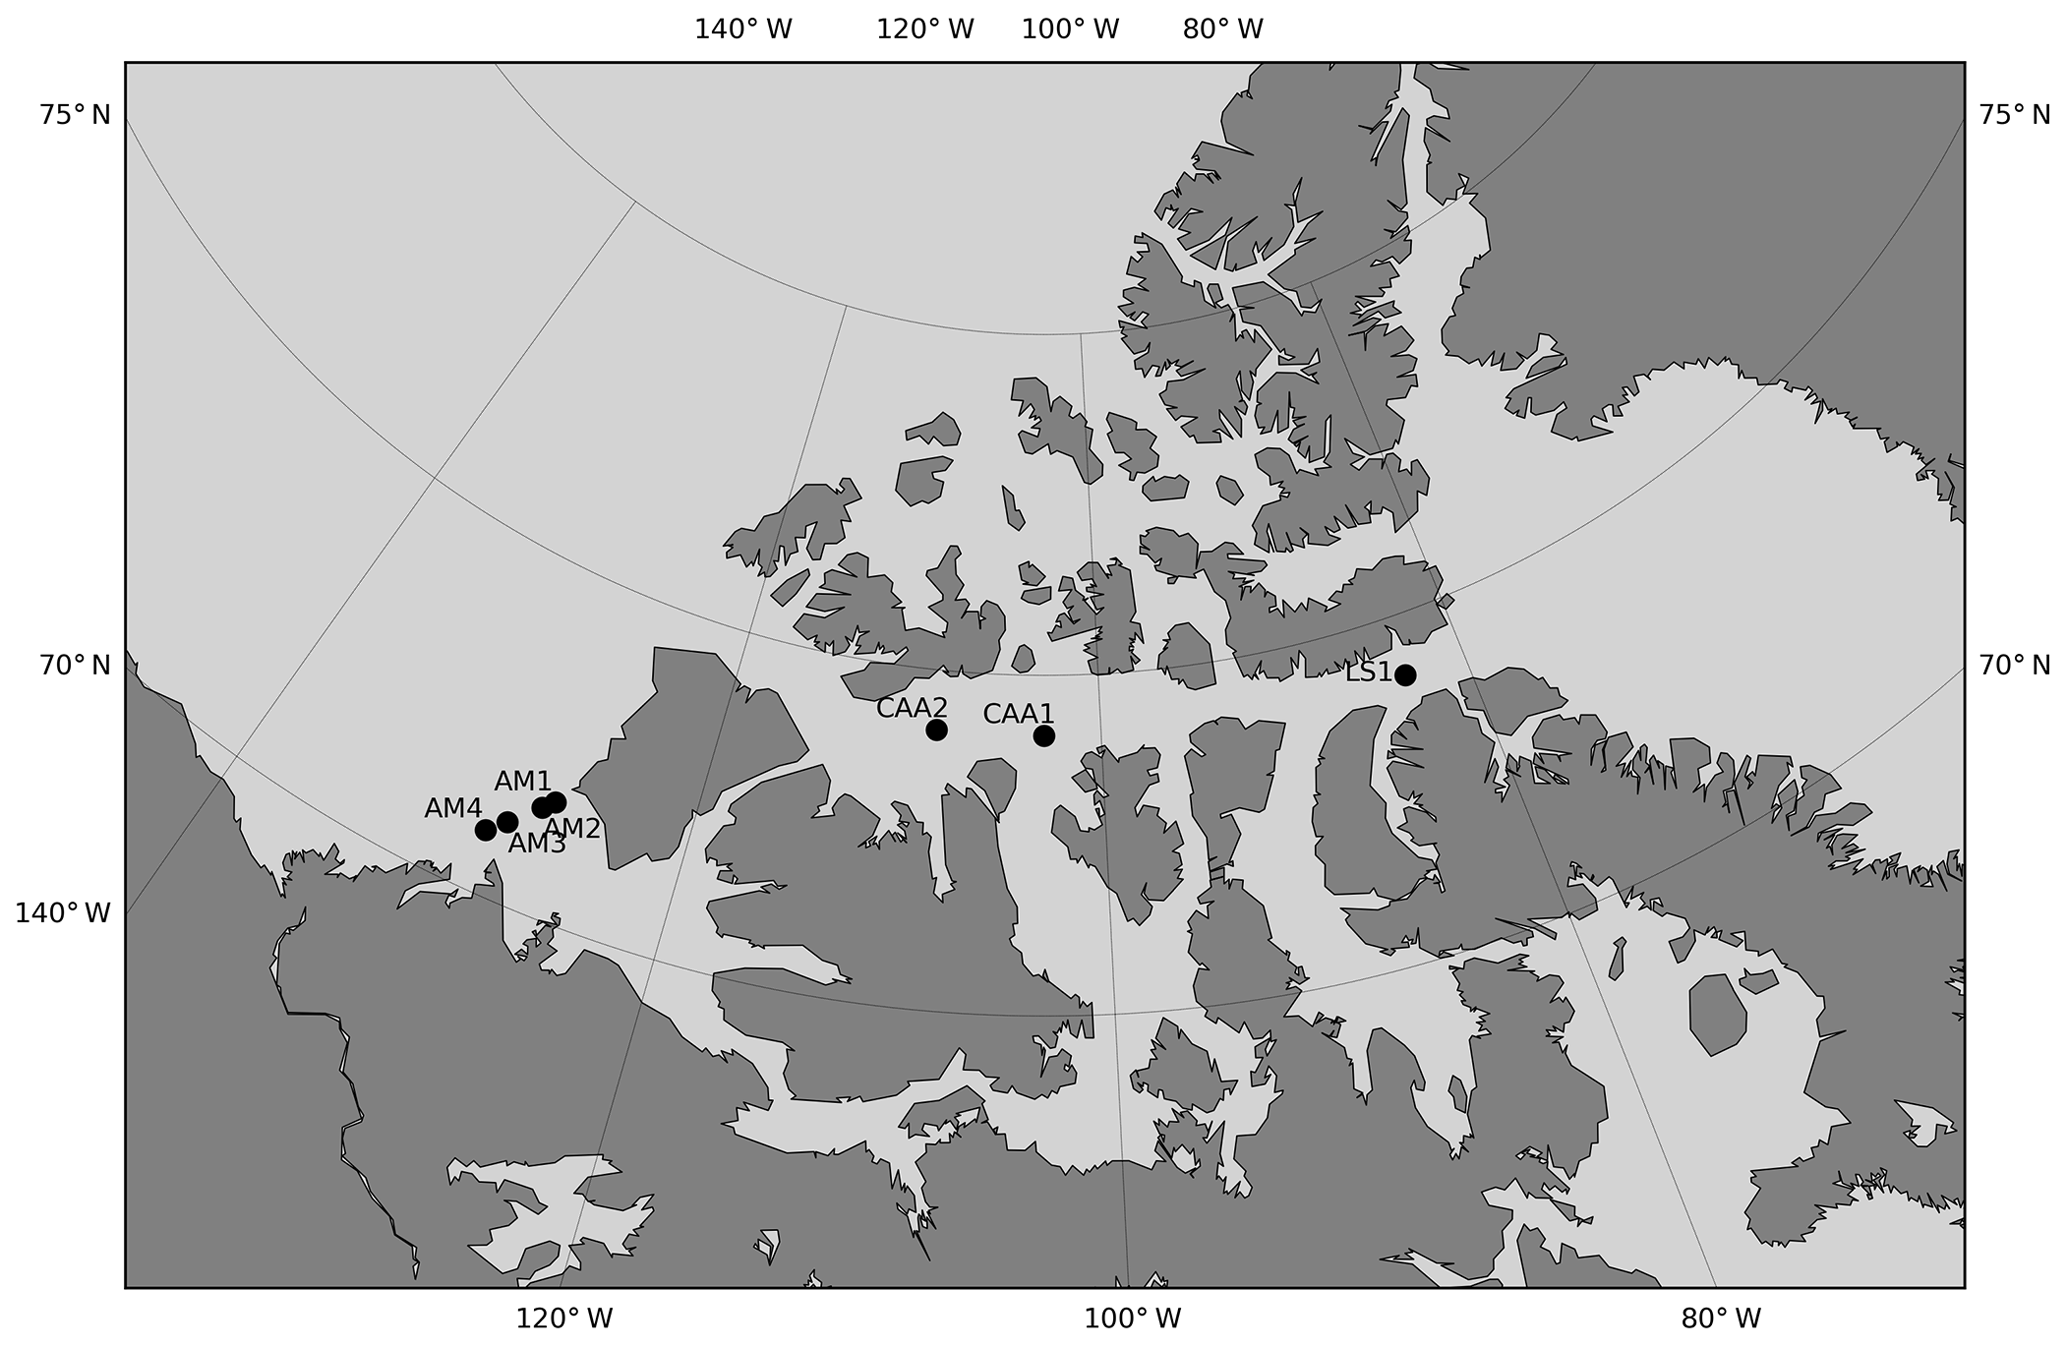
Figure 9Location of the stations visited over an interval of 5 years or more. Stations are designated by area-related acronyms (LS is Lancaster Sound, CAA is Canadian Arctic Archipelago, AM is Amundsen Gulf) that are not the station identifiers used during the expeditions.

Figure 10Depth profiles of pCO2, pHT, DIC, DIC ∕TA and ΩA across time at one location in Lancaster Sound (LS1) and two locations in the Canadian Arctic Archipelago (CAA1, CAA2).
To quantify near-surface change, we averaged data from the top 25 m of the water column. Across this depth interval, between 2007 and 2016, the temperature-normalized pCO2, DIC and DIC ∕TA at site LS1 rose by 36±9 µatm, 37±10 µmol kg−1 and 0.008±0.005, while pHT and ΩA decreased by 0.042±0.037 and 0.12±0.23, respectively. Given its uncertainty, the change in ΩA is insignificant. The same trend is visible between the same years at station CAA1, at a greater magnitude (+78 µatm pCO2, −0.088 pHT unit, −0.37 ΩA unit), except for a DIC decrease of 58 µmol kg−1 caused by a decrease in salinity of 1.76. The DIC ∕TA, which effectively normalizes DIC against salinity, shows an increase of 0.021, proportional to the change in the other parameters. Data from the nearby station CAA2 also displays a similar trend between 2009 and 2015 (+29 µatm pCO2, −0.041 pHT unit, +0.001 DIC ∕TA), albeit a strong positive change in salinity (+1.81) contributed to an increase of 0.06ΩA unit (again insignificant given its uncertainty of 0.23).
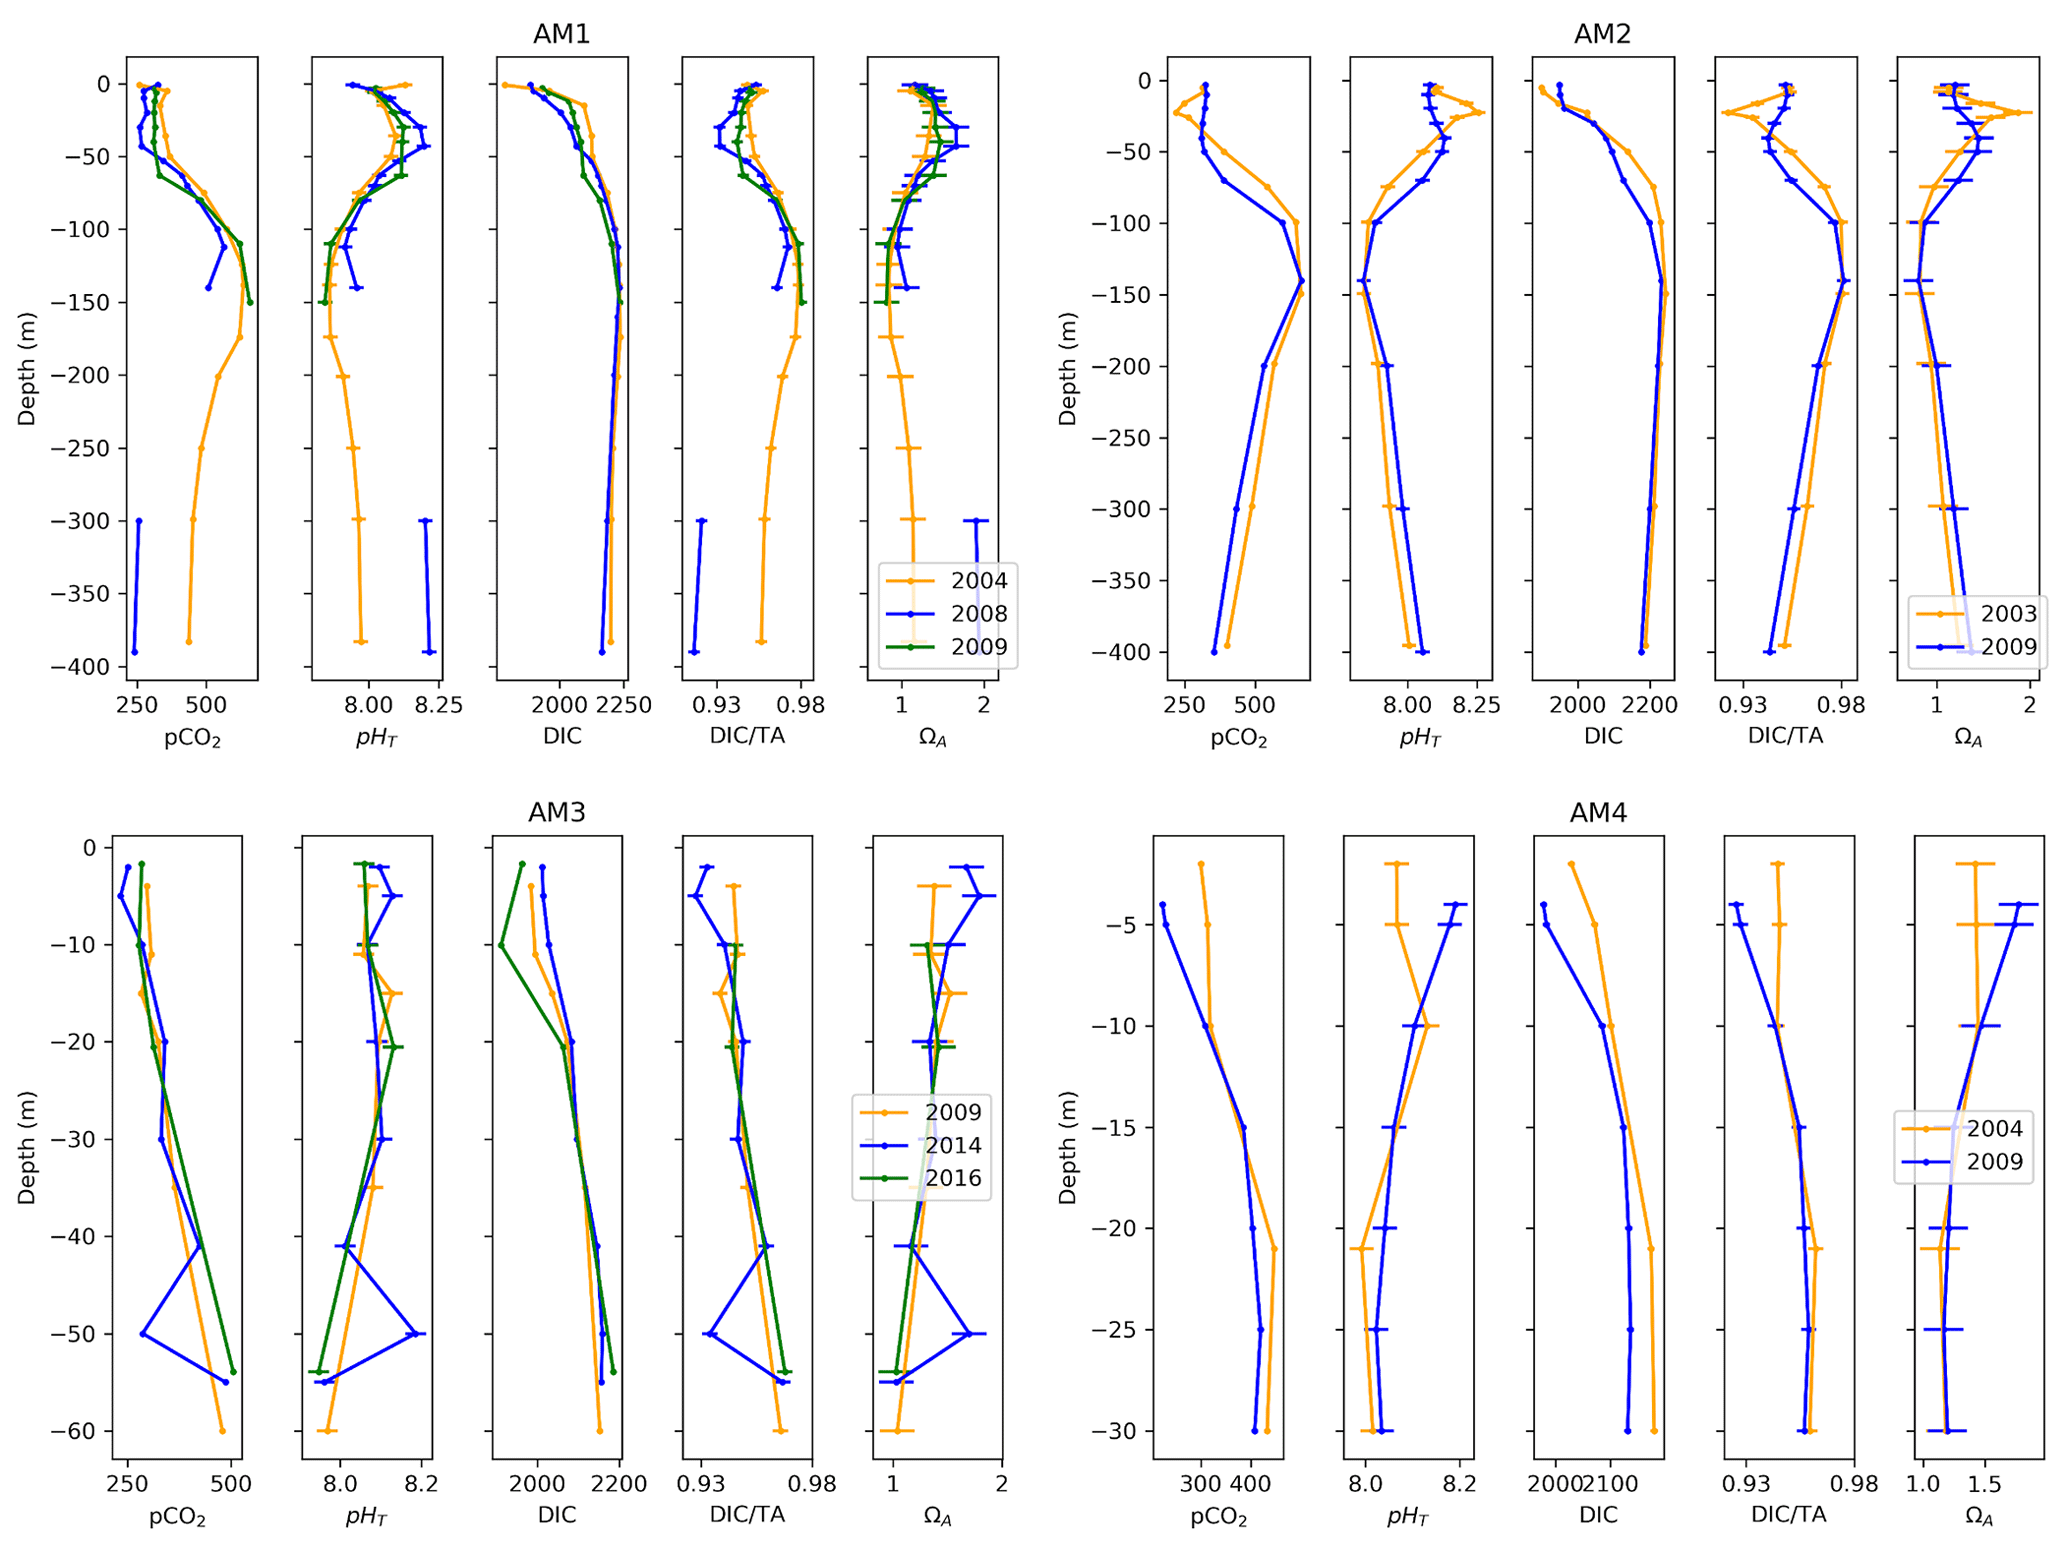
Figure 11Depth profiles of pCO2, pHT, DIC, DIC ∕TA and ΩA and uncertainties across time at four locations at the western limit of the Amundsen Gulf (AM1, 2, 3, 4).
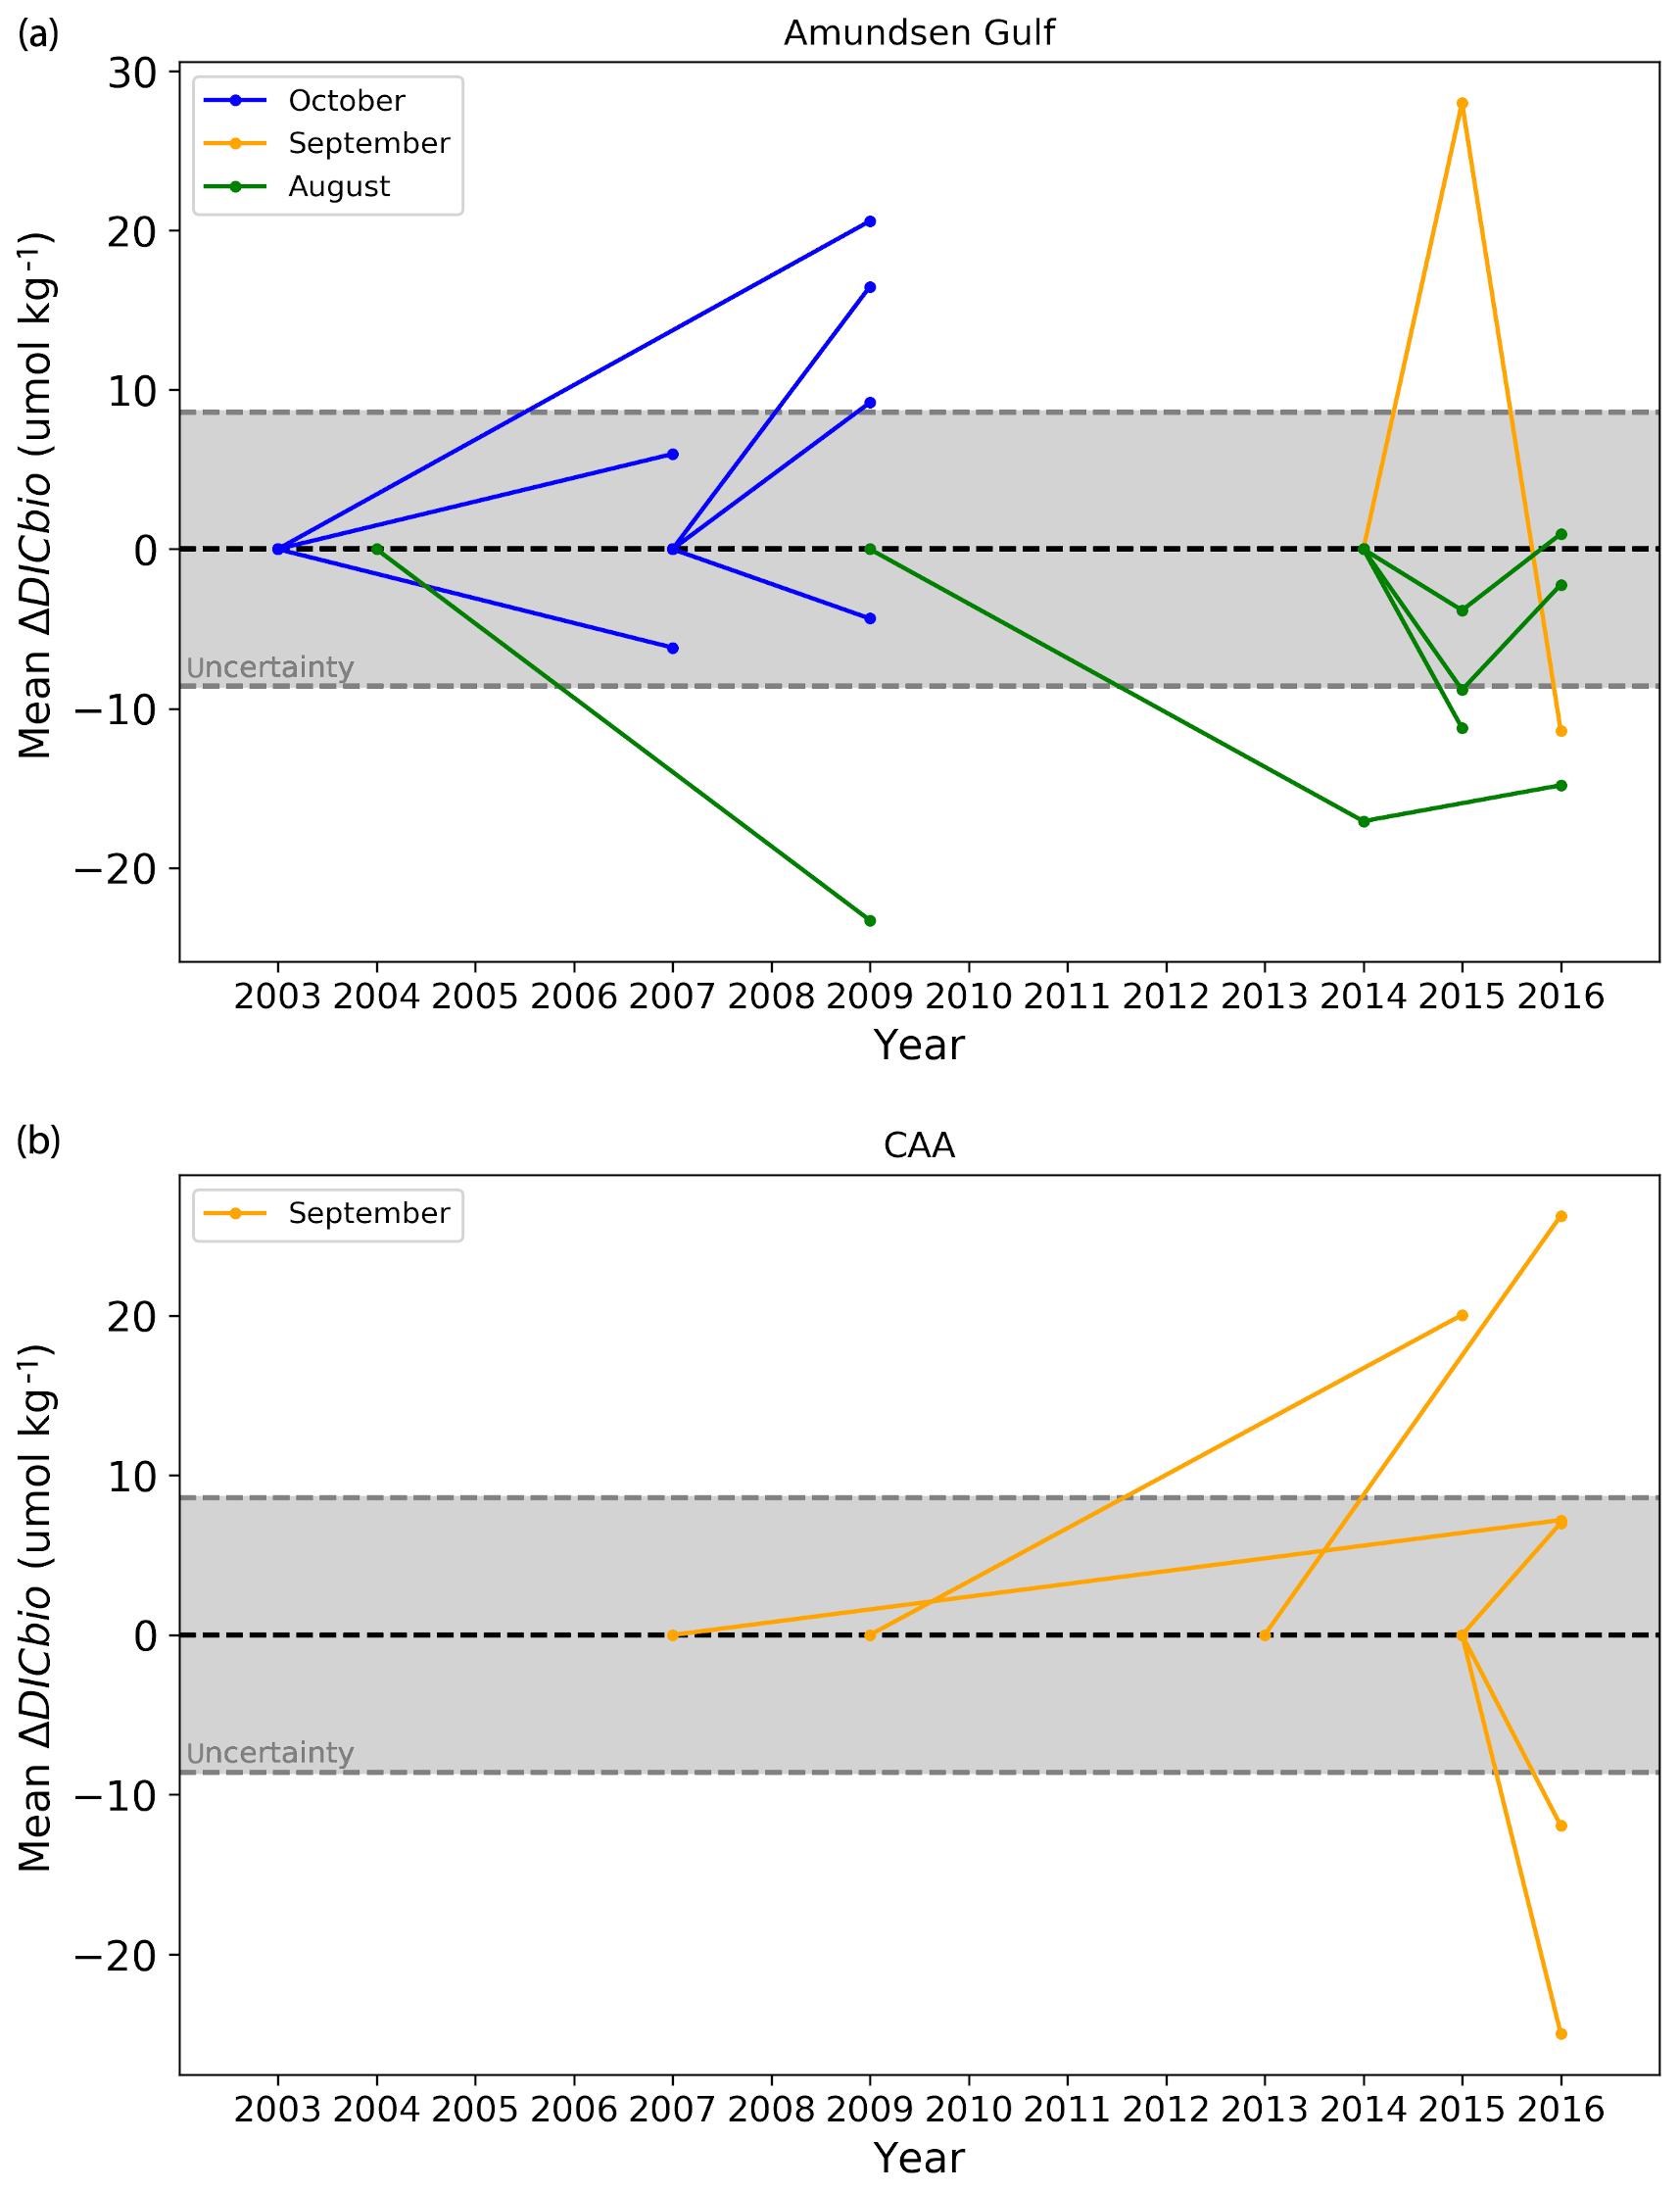
Figure 12Mean ΔDICBio (top 25 m of the water column) at stations of the Amundsen Gulf (a) and Canadian Arctic Archipelago (b). The central dashed line (0) is the reference state, in relation to which ΔDICBio is expressed (i.e. the point at the right extremity of a line indicates the ΔDICBio relative to the year at which this line intersects the central dashed line). The grey-shaded area represents the range of uncertainty.
Four stations located on the transect extending from Cape Bathurst to Banks Island complete the seven time series (Fig. 11). Three of these time series (AM1, AM2, AM4) span 2003–2009 or 2004–2009. Thus, given their spatial and temporal proximity, we expect a certain consistency in the trends they exhibit. Surprisingly, salinity increased at each of the stations over the study period, by 1.46, 0.70 and 0.13, respectively. Despite the consistent salinity trend, stations AM2 and AM4 show opposite trends in carbonate system parameters, the former exhibiting a positive change in pCO2 ( µatm) and DIC ∕TA () and a negative change in pHT () and ΩA (), while the latter displays negative but somewhat smaller changes in pCO2 ( µatm) and DIC ∕TA () and a positive change in pHT () and ΩA (), mostly apparent near the surface (<10 m). The two profiles recorded at site AM2 exhibit a clear difference in stratification; a sharp peak in carbonate system parameters (associated with a temperature maximum) appears at ∼25 m in 2003, while the top 50 m were fairly uniform in terms of pCO2, pHT and DIC ∕TA in 2009. The magnitude of change in the carbonate system parameters at stations AM1 (2004–2009) and AM3 (2009–2016) is below their respective uncertainties. A relatively large change of −1.90 in near-surface salinity is observable at station AM3. The depth profiles at sites AM1 and AM3 (Fig. 11), both of which include measurements from 3 separate years, highlight the non-linearity of change (i.e., the variation between the earliest and the intermediate year evolves in the opposite direction of the variation between the earliest and latest years). Although this observation is limited to two groups of profiles, it constitutes a caveat to conclusions drawn from only two points in time.
Below 25 m depth, variations in atmospheric conditions and biological activity become decreasingly influential on carbonate system parameters, relative to changes in water mass properties resulting from mixing. The largest change in our time series occurs at Station LS1, where pCO2, DIC, and DIC ∕TA increased by 265 µatm, 95 µmol kg−1, and 0.040 and pHT and ΩA decreased by 0.140 and 0.38, respectively, over the 25–100 m depth interval, between 2007 and 2016. This drastic change reflects the varying proportions of Pacific Ocean and Atlantic Ocean waters that reach Lancaster Sound, the latter water mass intruding episodically into the CAA (Prinsenberg and Bennett, 1987). An increase in the abundance (or a change in the properties) of Pacific Ocean water between 2007 and 2016 is likely the cause of this feature, as a similar trend is visible at station CAA1, located east of Barrow Strait, where the intrusion of Atlantic Ocean water is halted by a 125 m sill. This is supported by the absence of a strong increase in salinity in Lancaster Sound in 2007, which could be interpreted as a pulse of intruding Atlantic Ocean water. This feature is reversed at station CAA2 between 2009 and 2015, highlighting the interannual variability in the properties of the UHL. Below this layer, water properties are relatively uniform in time at stations CAA1, CAA2, LS1 and AM2, except for pCO2 variations on the order of 20 to 30 µatm. Station AM1 exhibits a strong change in deepwater (300 to 400 m) properties between 2004 and 2008, for which the mechanism is unclear, the latter year displaying considerably less acidic conditions (+0.25 pHT unit), while salinity and temperature profiles are nearly identical for the 2 years, suggesting no change in water masses. Total alkalinity measurements at this depth range in 2008 are substantially higher than those made in 2004, for similar salinities, but neither of these datasets appear disputable.
As previously stated, these time series are snapshots in time and cannot be assumed to represent the continuous evolution of the carbonate chemistry in the Canadian Arctic. Nonetheless, even with a small sample size, we can confidently state that the temporal evolution of carbonate system parameters in the region does not display a systematic trend on sub-decadal timescales. Moreover, most of the significant changes that our time series exhibit are associated with variations in the physical oceanography of the region (water mass distribution and circulation) or surface processes (melting of sea ice). Given the well-documented rapid melting of the sea ice cover in the region (e.g., Tivy et al., 2011), we did not expect to observe increases in summer surface salinity over time intervals of 5 to 9 years. Our time series, therefore, offer proof of the strong interannual variability of this highly dynamic system. Discerning the ocean acidification signal amid the various physical and biological sources of change would require continuous time series over a longer period of time. We estimated this period to be 23 to 35 years for pH, 25 to 37 years for pCO2, 31 to 46 for ΩA, and 118 to 177 years for DIC using calculations of time of emergence, or the time required for the effects of a process to emerge from the natural variability of a system (see Appendix A). Time of emergence calculations are usually performed with large, continuous datasets from climate models; we therefore do not consider these results to be statistically robust. Nonetheless, this exercise shows the relative variabilities of the carbonate system parameters and highlights the particularly strong variability of DIC, which is the object of the next section. Its results also imply that without accurate measurements of the effects of biological activity and sea ice processes (both major drivers of natural variability), direct detection of the ocean acidification signal will require at least 20–25 years of observations. Gathering data in the CAA in the next few years is therefore critical, as regular ship-based observational campaigns in the region started in the early 2000s (Giesbrecht et al., 2014).
4.3 The biological contribution to interannual DIC variations: ΔDICBio
We define ΔDICBio as the temporal change in the contribution of in situ biological activity (photosynthesis and respiration) to the DIC of a parcel of water over a given period of time. ΔDICBio is calculated for each sampled depth at recurrently visited stations according to
where DICRef is computed in CO2SYS using the temperature-normalized seawater pCO2 calculated at a reference time, adjusted to the time of interest assuming a constant air–sea pCO2 gradient, and the TA measured at this time of interest. The change in global mean atmospheric CO2 concentrations between the reference year and the year of interest is used to correct pCO2 to account for gas exchange (data from Dlugokencky and Tans, NOAA/ESRL, https://www.esrl.noaa.gov/gmd/ccgg/trends/, last access: 28 March 2019). This approximation rests on the assumption that the yearly increase in surface water pCO2 follows that of the atmosphere (given stable biological production), as observations from global monitoring stations demonstrate (e.g., González-Dávila et al., 2010), although the validity of this claim is weakened on short spatial and temporal (sub-decadal) scales (Fay et al., 2013; Wanninkhof et al., 2013). This also restricts our calculations to the upper portion of the water column (25 m) that is in direct contact with the atmosphere. Under the additional assumptions that DIC is only affected by gas exchange, biological activity, and mixing and that TA is not significantly affected by biological activity (Zeebe and Wolf-Gladrow, 2001), DICRef represents the DIC of a parcel of water if its in situ biological component remained unchanged relative to a reference year (i.e., identical contribution, negative or positive, from the balance between photosynthesis and respiration). Because the reference pCO2 is calculated in part from TA, changes in water masses should not affect the results of this analysis, given the salinity range of the data subset used in the calculation of ΔDICBio (25.6<SP<33.7). Thus, ΔDICBio can provide insights into the interannual variability of biological activity in the Canadian Arctic, without direct measurements of parameters such as chlorophyll or biomass. The uncertainty in ΔDICBio was calculated by applying standard error propagation to the procedure described above. It is important to note that this calculated uncertainty is purely mathematical and does not include the uncertainty associated with the assumptions made to calculate ΔDICBio, such as the constancy of the air–sea ΔpCO2, which could be considerably affected by processes like changes in sea ice cover.
Figure 12 shows ΔDICBio, averaged over the top 25 m of the water column, at the 18 stations where comparable data were available, all located in the Amundsen Gulf and CAA. The magnitude of the calculated ΔDICBio is beyond its mathematical uncertainty, which varies from 6.4 to 14.3 µmol kg−1 (mean of ±8.6 µmol kg−1) at 11 locations out of 18. All significant results from the month of October (2003–2009 and 2007–2009) in the Amundsen Gulf show a positive mean ΔDICBio (a decrease in biological DIC uptake and/or an increase in DIC production) of up to 20.6±10.5 µmol kg−1. Conversely, the ΔDICBio calculated for the month of August (2004–2009, 2009–2016 and 2014–2015) is generally negative and of a similar magnitude. Data for September are variable in direction and show the greatest change over consecutive years: relative to 2014, in the Amundsen Gulf, the mean ΔDICBio fluctuated in 2015 and 2016 by to µmol kg−1 over the 0–25 m depth interval.
It is unlikely that the consistent directions of change we observe for the months of August and October represent actual trends, given the small data pool and inconsistent reference states used to make those observations. Nevertheless, we can use this analysis to constrain the contribution of fluctuations in biological activity to the interannual variability of the DIC. In the top 25 m of the water column, the maximum amplitude of ΔDICBio is 45.9±11.5 µmol kg−1, observed in the Amundsen Gulf between 2014 and 2015. This maximum is not visible on Fig. 12, which only shows mean values. The Pearson correlation coefficient (r) between ΔDICBio and ΔDIC (the change in DIC over the same time interval) is 0.52 and the associated coefficient of determination (R2) is 0.27, suggesting that 27 % of the interannual variability in surface DIC in the Canadian Arctic Archipelago is a direct result of the variability in biological activity. This has important implications with respect to the interpretation of DIC time series in the region and explains, in part, the long time of emergence of DIC as a proxy for acidification, compared to other carbonate system parameters, as hypothesized in Sect. 4.2.
The extremely weak (r=0.08) correlation between ΔDICBio and the time interval over which it applies provides additional evidence of the absence of a trend in the balance between photosynthesis and respiration in the surface waters of the Canadian Arctic. The variability in this balance is driven by many interconnected, often localized processes. For instance, short-lived episodes of upwelling of halocline waters not only directly change the chemical properties at the surface but also provide nutrients that stimulate biological activity (Tremblay et al., 2011). Primary production in the Arctic is also closely linked to the seasonal cycle of sea ice (e.g., Arrigo et al., 2008). Beyond its natural fluctuations, ongoing disruptions to this cycle and other physical properties (stratification, temperature, etc.) forced by climate change are known to affect phytoplankton communities and their productivity (Ardyna et al., 2014; Blais et al., 2017), possibly increasing their imprint on the variability of DIC and other carbonate system parameters. As previously mentioned, variations in water mass composition cannot directly explain variations in ΔDICBio. Nonetheless, mixing is likely accompanied by changing nutrient concentrations, which influence the balance of photosynthesis and respiration (Tremblay et al., 2015).
Field observations of carbonate system parameters made between 2014 and 2016 in the Canadian Arctic reveal that surface waters of the region serve as a net CO2 sink in the summer and are generally close to saturation with respect to aragonite (1<ΩA<1.5). Surface undersaturation (ΩA<1.0) is found predominantly in the central Canada Basin, as documented in previous years (Yamamoto-Kawai et al., 2011; Robbins et al., 2013), and in the freshwater-influenced Queen Maud Gulf, the only area of the Canadian Arctic where, in some locations, the entire water column is undersaturated with respect to aragonite. The CO2-rich Upper Halocline Layer is the locus of a shallow aragonite undersaturation horizon at depths of 85 to 125 m in the Canada Basin and 50 to 70 m in the Canadian Arctic Archipelago, further fostering undersaturation near the surface and potentially threatening marine calcifying organisms living in this portion of the water column.
Time series of carbonate system parameters, although relatively short (<10 years) and incomplete, illustrate the strong interannual variability of the region, due in part to complex circulation patterns and varied water mass assemblages. Our estimates of ΔDICBIO, the change in the contribution of biological activity to DIC, suggest that variations in biological activity (the balance between photosynthesis and respiration) account for approximately a third of the interannual variability of DIC measurements. Additional work must also be carried out to extend this estimate to other carbonate system parameters (pH, pCO2, Ω). In order to test the validity of the ΔDICBIO concept and its underlying assumptions, our results should be compared to direct measurements of biological productivity (e.g., biomass, chlorophyll a) made during the same time period. Without the latter, the quantification of the progression of ocean acidification in the surface waters of the Canadian Arctic will require longer and more continuous time series, the length of which can be estimated using the concept of time of emergence. Future work on ocean acidification in this region should focus on obtaining continuous time series of carbonate system parameters, especially in areas where surface waters might soon become undersaturated with respect to aragonite, as well as bridging the gap between observations of carbonate mineral saturation and markers of ecosystem health.
The time of emergence (ToE) of a process affecting a natural system is the time required for the measurable effects of this process to emerge from the natural variability of the system. The concept is predominantly applied in global climate change modelling studies, for which the results are either “years of emergence” based on a pre-industrial steady state (e.g., Friedrich et al., 2012) or time intervals over which observations must be made in order to distinguish an anthropogenic signal from its natural variability. Few of these studies have used observations (e.g., Sutton et al., 2016), and, to our knowledge, none of them have focused specifically on the Arctic.
We define the time of emergence according to the following equation:
in which N is the natural variability, defined (following Hawkins and Sutton, 2012) as the standard deviation of the annual means of one of four parameters (DIC, T-normalized pCO2, ΩA, pHT), across 7 years from 2003 to 2016. S is the slope (in units per year) of the theoretical acidification curve, constructed by calculating the evolution of a given parameter in CO2SYS at a constant alkalinity (2000 µmol kg−1), practical salinity (30), and temperature (0 ∘C) and assuming that the surface ocean pCO2 increases at the same mean rate as the atmospheric pCO2 between 2003 and 2016 (data from Dlugokencky and Tans, NOAA/ESRL, https://www.esrl.noaa.gov/gmd/ccgg/trends/, last access: 28 March 2019). Our computed rates of acidification (Table A1) are in general agreement with the values reported by Bates et al. (2014). C is a constant that sets the threshold of emergence at either 2 or 3 standard deviations (N), i.e., when the acidification signal becomes significant beyond natural variability as it emerges from 95 % or 99.7 % of the observed annual mean values, assuming the data (or the naturally occurring values of the parameter they represent) are normally distributed. Only data collected from June to October (inclusively) are used to minimize the effect of seasonal variability.
Although the assumption of relative equilibration with atmospheric pCO2 might be less applicable at these depths, we applied the same technique using data from depths of 100 and 300 m in order to estimate the time of emergence below the surface, where the interannual variability should be smaller than at the surface, if no important changes in water masses occur. Significant acidification at these depths might be due in large part to advection (e.g., Luo et al., 2016) rather than gas exchange.
The results of this analysis are presented in Table A2. At the surface, pHT and pCO2 have very similar times of emergence of 23–35 years and 25–37 years for C values of 2 and 3, respectively. The ΩA signal emerges after a slightly longer time, 31–46 years. The ToE of DIC is considerably longer than that of the three other parameters, at 118–177 years. The discrepancy between DIC and the other parameters is largely due to chemical considerations, as the high Revelle factors (15–20) in the region imply that the change in pCO2 caused by the uptake of atmospheric CO2 will be 15 to 20 times larger than that of DIC, relative to their initial concentrations.
Table A1Values of natural variability (N; the standard deviation of the annual means of each parameter) and theoretical acidification rate (S; the slope of the theoretical acidification curve) used in the time of emergence calculations.
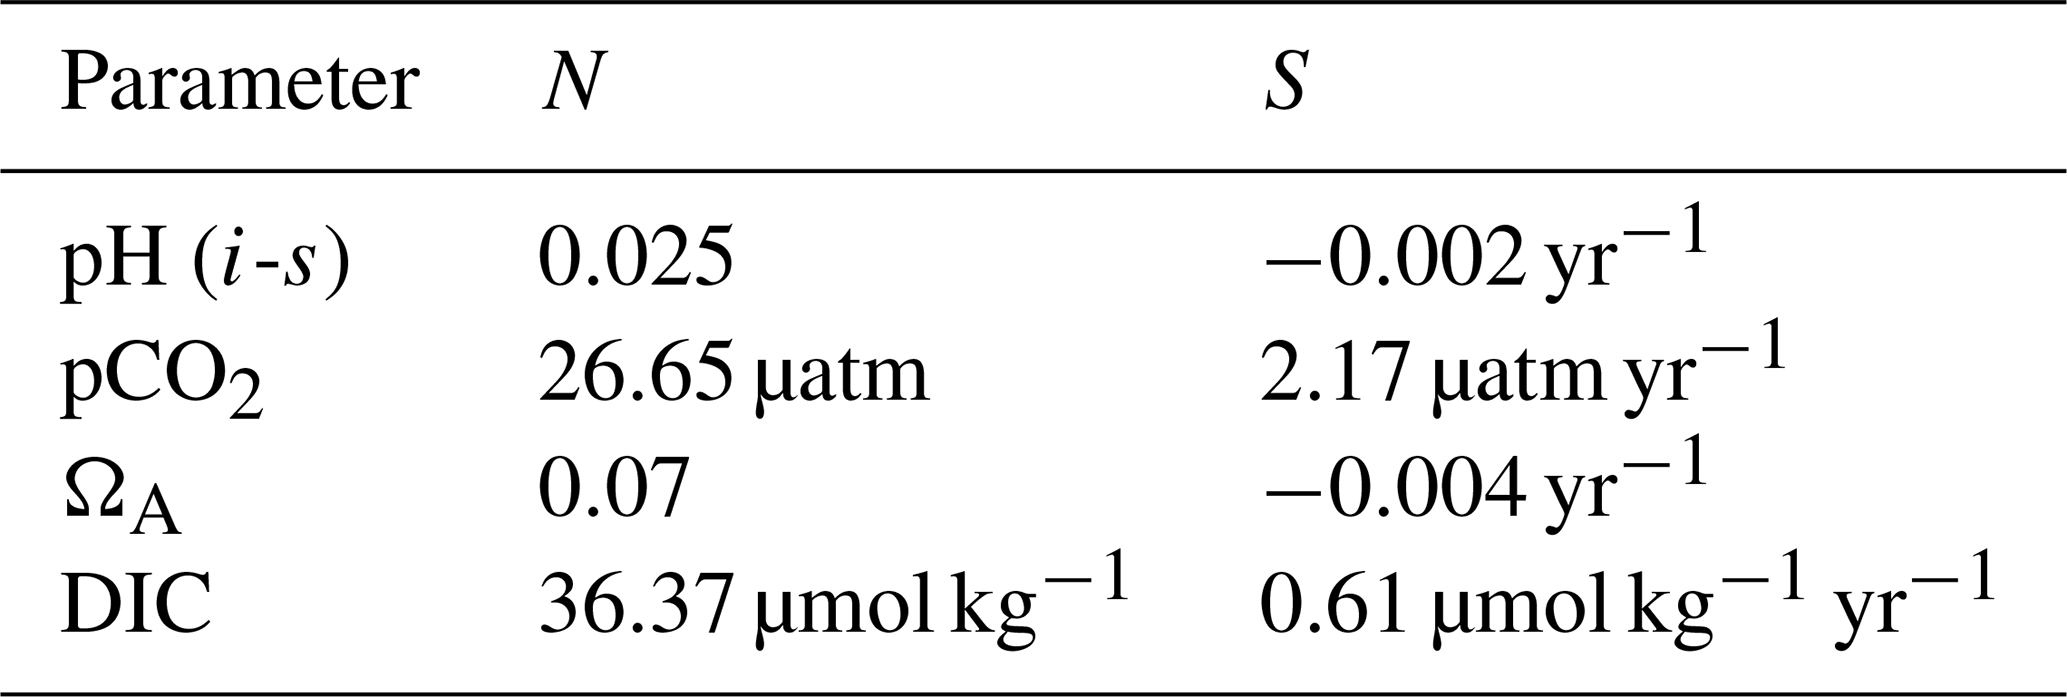
Table A2Calculated times of emergence of carbonate system parameters at various depths, rounded to the closest year. The C value represents the threshold used (2 or 3 standard deviations of annual means).
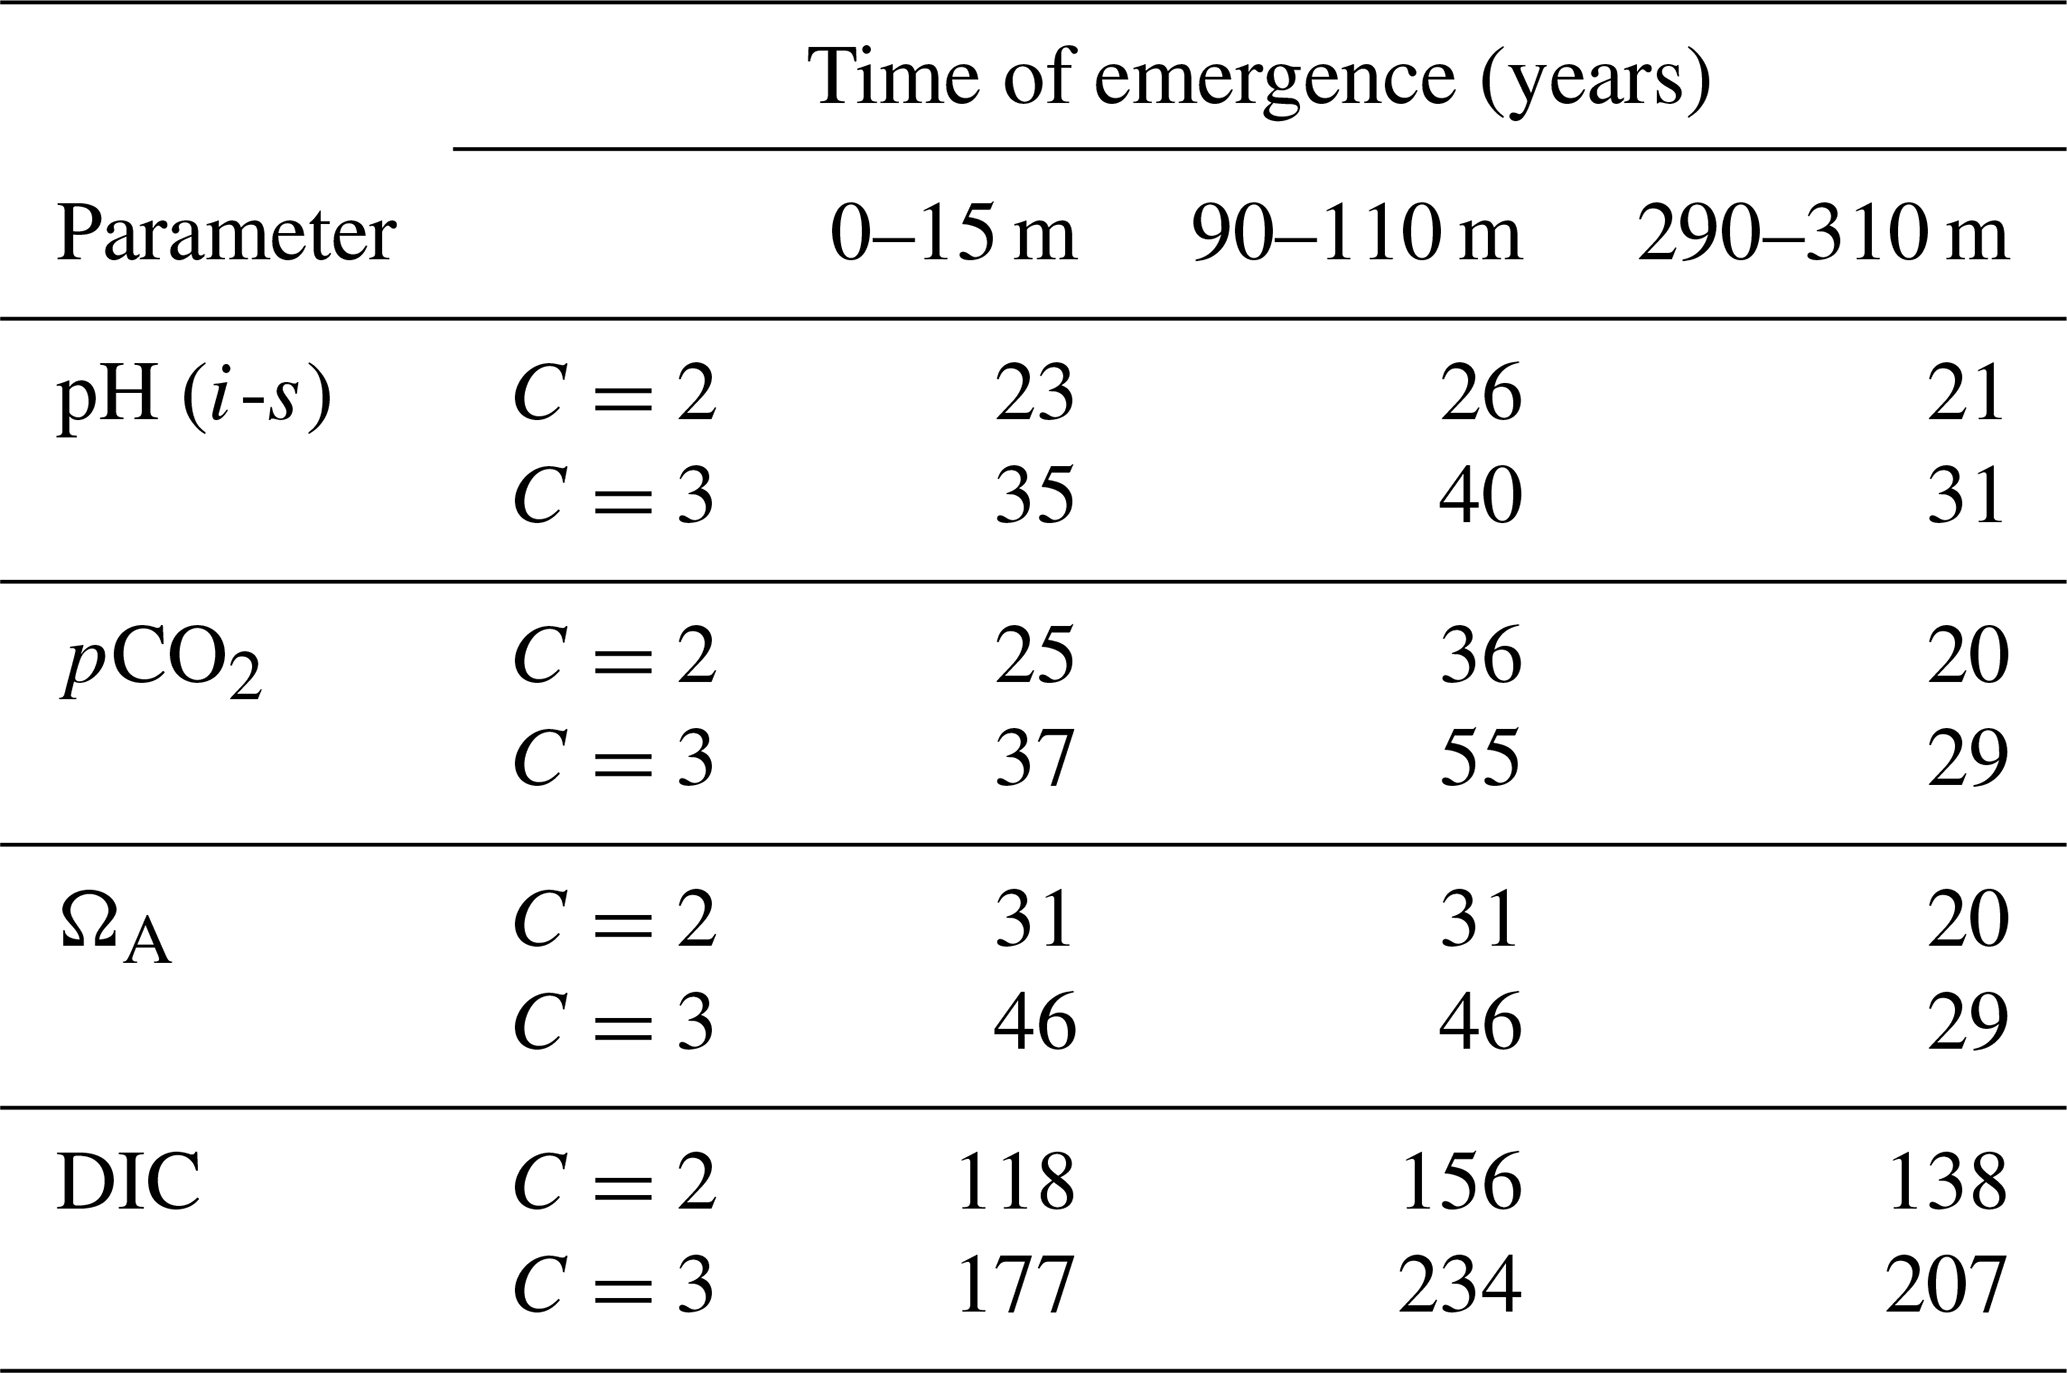
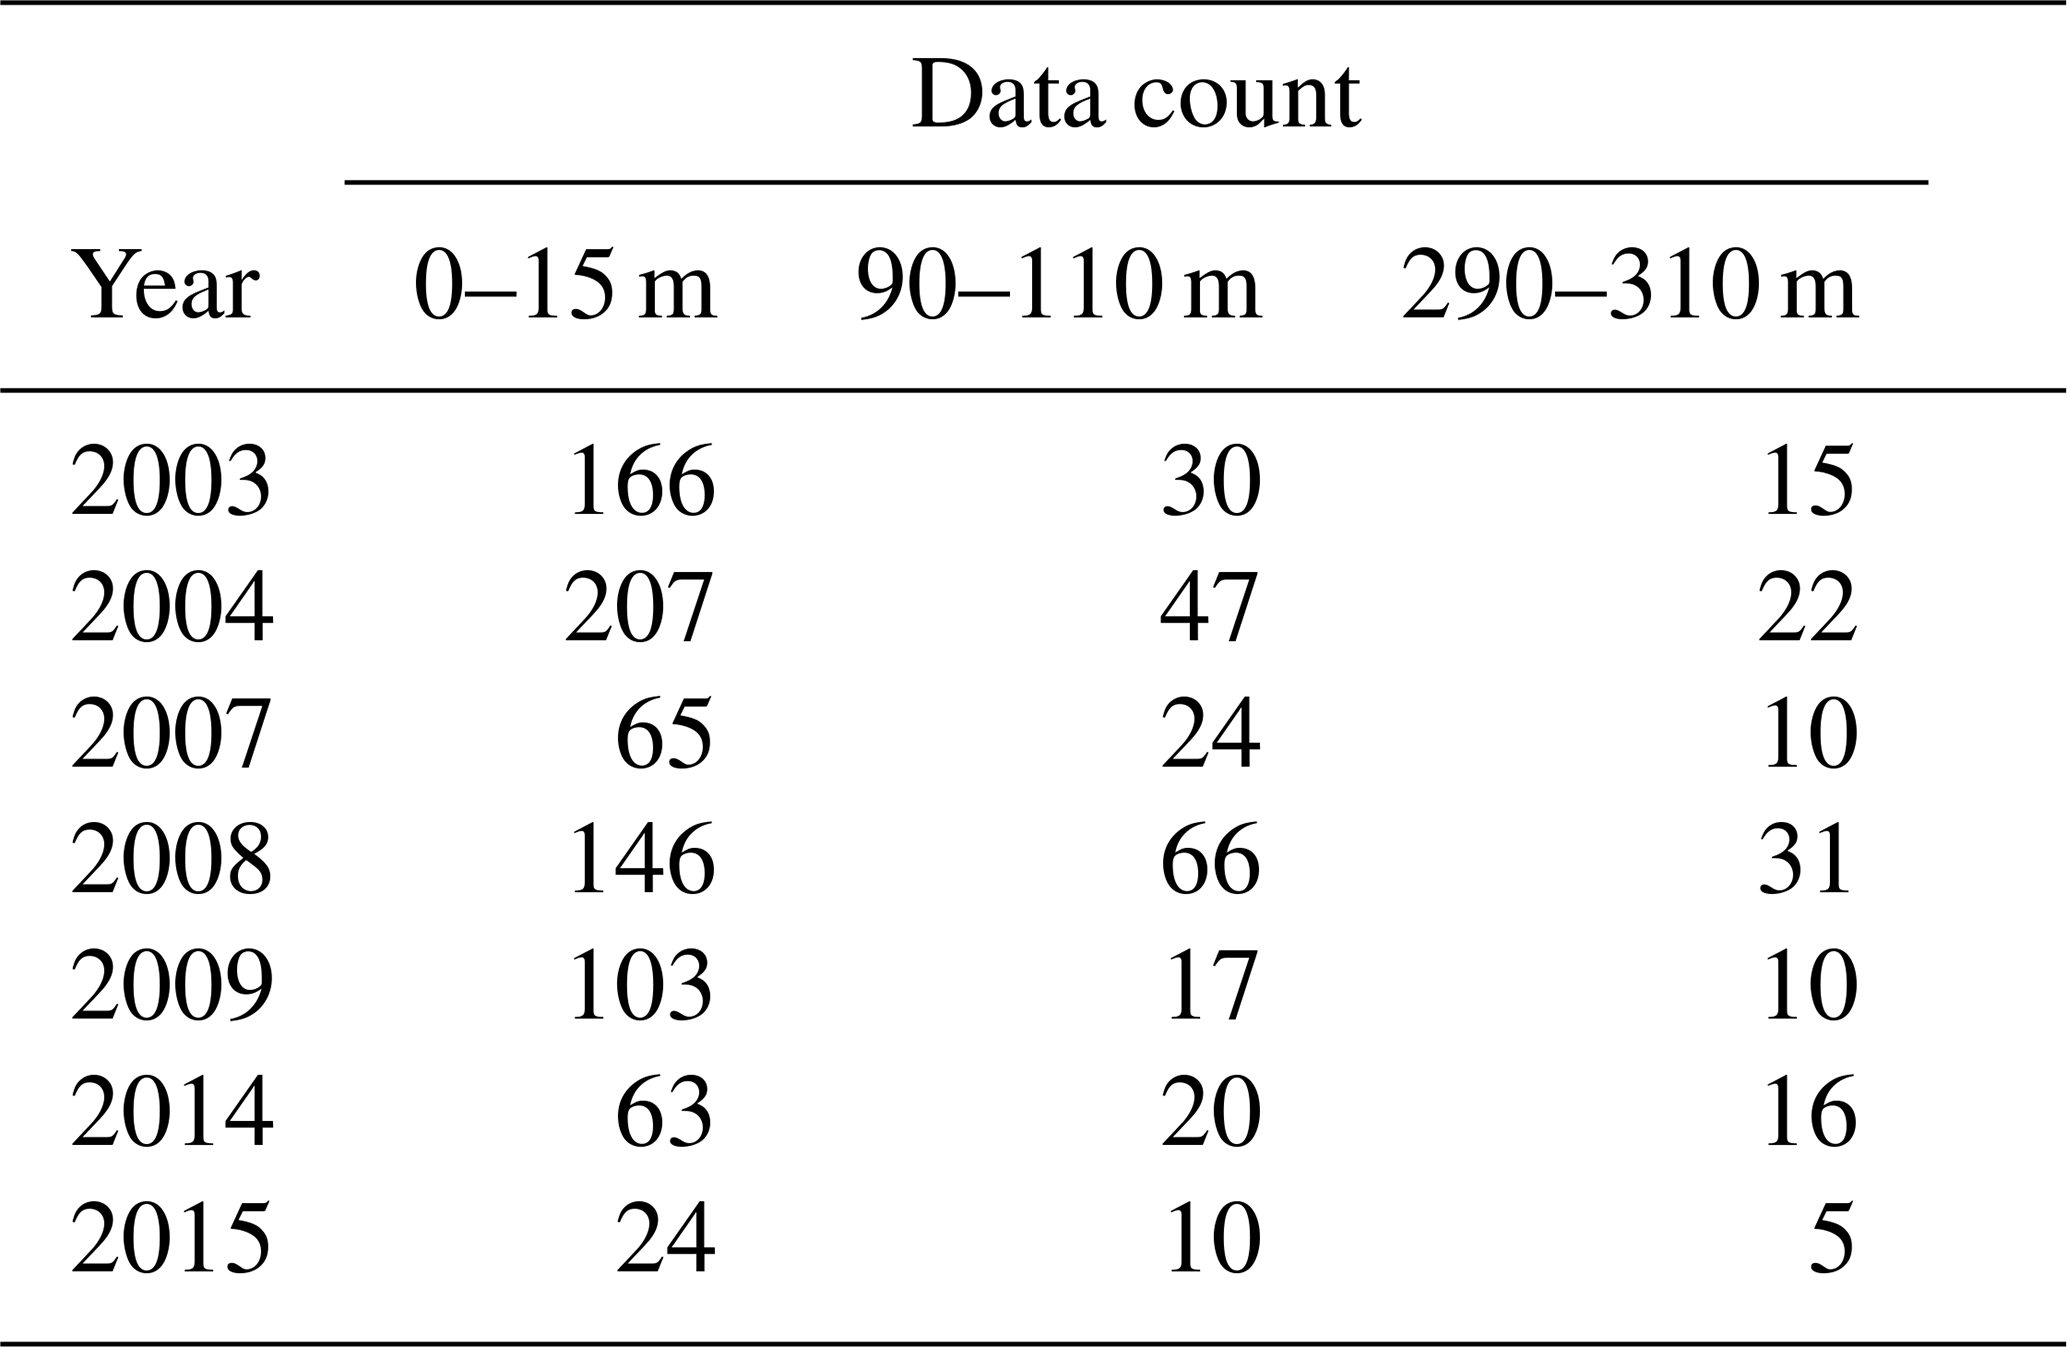
Our results show a slight increase of ToE values from the surface to the 90–110 m depth interval (except for ΩA that remains identical), followed by a decrease below surface values at the 290–310 m depth interval (except for DIC). We attribute the relatively strong variability of the ToE in the 90–110 m depth interval to a periodical vertical migration of the upper boundary of the metabolic CO2-rich (low pHT, ΩA, high pCO2, DIC) Upper Halocline Layer (UHL) that is found at depths of ∼100–200 m throughout most of the study area. The results are also likely affected by the decreasing number of data with depth (Table A3), which could lead to less accurate annual means and explain the increase of the DIC ToE from the surface to the 290–310 m interval.
Table A3Number of data points included in the annual means used in the time of emergence calculations.
Despite their similarity, our calculated times of emergence are consistently longer than those reported in modelling studies (Keller et al., 2014; Rodgers et al., 2015). This is consistent with the fact that coastal waters, that comprise a large portion of our dataset, exhibit a much higher variability in pH (and other carbonate system parameters) than open oceans (Duarte et al., 2013). Furthermore, direct observations are likely to integrate variability on temporal and spatial scales that are too small to be resolved by models. It is also important to note that distinct measurement techniques and their associated uncertainties create an analytical bias between different parameters, a bias that is not present in the same form in modelling studies. The relative uncertainties of in situ pHT (0.3 %) measurements and computed pCO2 (4.5 %) and ΩA (6.4 %) values are strongly correlated with their increasing times of emergence in the 0–25 m depth interval (r=0.88). Although this correlation becomes significantly weaker (r=0.49) when DIC and its relative uncertainty (0.4 %) are included in the analysis, it suggests the presence of an analytical bias in our ToE estimates. Nonetheless, the similarity between the ToE of pHT and pCO2 and the large ToE of DIC are consistent with the findings of Keller et al. (2014).
The validity of these conclusions depends on a methodology that differs considerably from its modelling equivalent, even if the results from both approaches are consistent with each other. In addition to the instrumental bias mentioned previously, our observations are subject to a sampling bias, since we only use data gathered in the summer months. Consequently, the natural variability used in our ToE calculations does not encompass the entire annual cycle. Nevertheless, because we define the natural variability of the system in terms of interannual rather than seasonal changes, the former should not change, assuming the amplitude of the seasonal cycle is constant through time. The other form of sampling bias possibly affecting our results is spatial, as cruise tracks and durations varied every summer.
In order to estimate the relative fractions of sea ice melt and meteoric water (mostly river water) in the Queen Maud Gulf, we use δ18O and practical salinity (SP) data collected in the area in 2015 to perform a linear regression analysis. The methods of analysis of the oxygen isotopes, reported on the δ18O notation (V-SMOW), are described in detail in Lansard et al. (2012) for the samples collected during the CASES expedition (2003–2004) and in Mucci et al. (2018) for the remainder of the samples.
Using the intercept of the trend line equation (δ18O = 0.5282SP–18.552) to extrapolate δ18O to SP=0, we find the mean δ18O of the freshwater found in the Queen Maud Gulf in 2015 to be −18.55 ‰. Based on the δ18O values of meteoric water ( ‰) and sea ice melt ( ‰) used by Lansard et al. (2012), the fractions of meteoric (river) water and sea ice melt would be, respectively, 98 % and 2 %. A potential source of error affecting this estimate is the use of the δ18O of Mackenzie River water as the riverine endmember, which might differ significantly from the oxygen isotope signature of the rivers discharging in the Queen Maud Gulf.
The raw data collected as a part of the ArcticNet program, on which most of the observations presented in this paper are based, can be accessed through the Polar Data Catalogue (Mucci, 2017). Complementary datasets, some of which are part of larger databases, are also available on various online repositories (François et al., 2012; Chierici et al., 2013; Giesbrecht et al., 2014; Papakyriakou et al., 2017).
AM and ABL conceived the project. AM and HT acquired much of the data prior to 2016. ABL carried out the data analysis and wrote the first draft of the paper, whereas AM and HT provided editorial and scientific recommendations. HT provided results of alkalinity and dissolved inorganic carbon analyses and scientific recommendations.
The authors declare that they have no conflict of interest.
We would like to thank the captains and crew of the CCGS Amundsen without whom, over the years, this project would not have been possible. This project was funded through ArcticNet, itself funded by the Natural Sciences and Engineering Research Council of Canada (NSERC), the Canadian Foundation for Innovation (CFI), and the IPY-NSERC, CCAR-NSERC, and French MALINA programs. Additional funding came from a Regroupement Stratégique grant from the Fonds Québécois de Recherche Nature et Technologies (FQRNT) to GEOTOP, as well as NSERC Discovery and Marine Environmental Observation, Prediction and Response Network (MEOPAR; Canadian Ocean Acidification Research partnership) grants to Alfonso Mucci and Helmuth Thomas. We would like to thank Jean-François Hélie at GEOTOP-UQAM for carrying out the δ18O(H2O) analyses, as well as Constance Guignard for cruise preparation and support in the laboratory and at sea. Finally, Alexis Beaupré-Laperrière wishes to thank MEOPAR and the Department of Earth and Planetary Sciences at McGill for financial support in the form of stipends, scholarships (e.g., Mountjoy Scholarship) and assistantships. Figure 1 in this study was created with the Ocean Data View Software (Schlitzer, 2016).
This research has been supported by the Network of Centers of Excellence-Tri-Council (grant no. 3.8 ArcticNet/Manitoba), NSERC Discovery grants (grant no. RGPIN/39679-2013), and the NSERC-MEOPAR (Marine Environmental Observation, Prediction and Response Network) (project no. 13: Canadian Ocean Acidification Research Partnership).
This paper was edited by Jean-Pierre Gattuso and reviewed by Leif Anderson and one anonymous referee.
Ahmed, M., Else, B. G. T., Burgers, T. M., and Papakyriakou, T.: Variability of surface water pCO2 in the Canadian Arctic Archipelago from 2010 to 2016, J. Geophys. Res.-Ocean., 124, 1876–1896, doi:10.1029/2018JC014639, 2019.
Ardyna, M., Babin, M., Gosselin, M., Devred, E., Rainville, L., and Tremblay, J.: Recent Arctic Ocean sea ice loss triggers novel fall phytoplankton blooms, Geophys. Res. Lett., 41, 6207–6212, doi:10.1002/2014GL061047, 2014.
Arrigo, K. R., van Dijken, G., and Pabi, S.: Impact of a shrinking Arctic ice cover on marine primary production, Geophys. Res. Lett., 35, L19603, doi:10.1029/2008GL035028, 2008.
Azetsu‐Scott, K., A. Clarke, K. Falkner, J. Hamilton, E. P. Jones, C. Lee, B. Petrie, S. Prinsenberg, M. Starr, and P. Yeats, Calcium carbonate saturation states in the waters of the Canadian Arctic Archipelago and the Labrador Sea, J. Geophys. Res., 115, C11021, doi:10.1029/2009JC005917, 2010.
Bates, N. R., Mathis, J. T., and Cooper, L. W.: Ocean acidification and biologically induced seasonality of carbonate mineral saturation states in the western Arctic Ocean, J. Geophys. Res.-Ocean., 114, C11007, doi:10.1029/2008JC004862, 2009.
Bates, N. R., Astor, Y. M., Church, M. J., Currie, K., Dore, J. E., Gonzalez-Davila, M., Lorenzoni, L., Muller-Karger, F., Olafsson, J., and Santana-Casiano, J. M.: A time-series view of changing surface ocean chemistry due to ocean uptake of anthropogenic CO2 and ocean acidification, Oceanography, 27, 126–141, doi:10.5670/oceanog.2014.16, 2014.
Bidleman, T. F., Kylin, H., Jantunen, L. M., Helm, P. A., and MacDonald, R. W.: Hexachlorocyclohexanes in the Canadian archipelago, 1. Spatial distribution and pathways of α-, β- and γ-HCHs in surface water, Environ. Sci. Technol., 41, 2688–2695, 2007.
Blais, M., Ardyna, M., Gosselin, M., Dumont, D., Belanger, S., Tremblay, J., Gratton, Y., Marchese, C., and Poulin, M.: Contrasting interannual changes in phytoplankton productivity and community structure in the coastal Canadian Arctic Ocean, Limnol. Oceanogr., 62, 2480–2497, doi:10.1002/lno.10581, 2017.
Bopp, L., Resplandy, L., Orr, J. C., Doney, S. C., Dunne, J. P., Gehlen, M., Halloran, P., Heinze, C., Ilyina, T., Séférian, R., Tjiputra, J., and Vichi, M.: Multiple stressors of ocean ecosystems in the 21st century: projections with CMIP5 models, Biogeosciences, 10, 6225–6245, https://doi.org/10.5194/bg-10-6225-2013, 2013.
Bourke, R., Addison, V., and Paquette, R.: Oceanography of Nares Strait and Northern Baffin-Bay in 1986 with emphasis on deep and bottom water formation, J. Geophys. Res.-Ocean., 94, 8289–8302, doi:10.1029/JC094iC06p08289, 1989.
Carmack, E. C. and MacDonald, R.: Oceanography of the Canadian shelf of the Beaufort Sea: A setting for marine life, Arctic, 55, 29–45, 2002.
Carmack, E. C., Macdonald, R., and Papadakis, J.: Water mass structure and boundaries in the Mackenzie Shelf estuary, J. Geophys. Res.-Ocean., 94, 18043–18055, 1989.
Chierici, M. and Fransson, A.: Calcium carbonate saturation in the surface water of the Arctic Ocean: undersaturation in freshwater influenced shelves, Biogeosciences, 6, 2421–2431, https://doi.org/10.5194/bg-6-2421-2009, 2009.
Chierici, M. and Thomas, H.: CO2 system data during the Circumpolar Flaw Lead, Polar Data Catalogue, available at: https://www.polardata.ca/pdcsearch/PDCSearchDOI.jsp?doi_id=10900 (last access: 28 July 2020), 2013.
Clayton, T. and Byrne, R.: Spectrophotometric seawater pH measurements - total hydrogen-ion concentration scale calibration of M-Cresol Purple and at-sea results, Deep-Sea Res. Pt. I., 40, 2115–2129, doi:10.1016/0967-0637(93)90048-8, 1993.
Déry, S. J., Stadnyk, T. A., MacDonald, M. K., and Gauli-Sharma, B.: Recent trends and variability in river discharge across northern Canada, Hydrol. Earth Syst. Sci., 20, 4801–4818, https://doi.org/10.5194/hess-20-4801-2016, 2016.
Dickson, A. G.: Standard potential of the reaction – AgCl(s) +1/2H2(g) = Ag(s) + HCl(aq) and the standard acidity constant of the ion HSO in synthetic sea-water from 273.15K to 318.15K, J. Chem. Thermodyn., 22, 113–127, doi:10.1016/0021-9614(90)90074-Z, 1990.
Dickson, A. G. and Millero, F.: A comparison of the equilibrium-constants for the dissociation of carbonic-acid in seawater media, Deep-Sea Res., 34, 1733–1743, doi:10.1016/0198-0149(87)90021-5, 1987.
Dickson, A. G., Sabine, C. L., and Christian, J. R.: Guide to best practices for ocean CO2 measurements, PICES Special Publications, Sidney, BC, Canada, 191 pp., 2007.
Dlugokencky, E. and Tans, P.: Trends in atmospheric carbon dioxide, National Oceanic & Atmospheric Administration, Earth System Research Laboratory (NOAA/ESRL), available at: http://www.esrl.noaa.gov/gmd/ccgg/trends/global.html, last access: 28 March 2019.
Duarte, C. M., Hendriks, I. E., Moore, T. S., Olsen, Y. S., Steckbauer, A., Ramajo, L., Carstensen, J., Trotter, J. A., and McCulloch, M.: Is ocean acidification an open-ocean syndrome? Understanding anthropogenic impacts on seawater pH, Estuar. Coast., 36, 221–236, doi:10.1007/s12237-013-9594-3, 2013.
Fay, A. R. and McKinley, G. A.: Global trends in surface ocean pCO2 from in situ data, Global Biogeochem. Cy., 27, 541–557, doi:10.1002/gbc.20051, 2013.
François, R., Mucci, A., Holmden, C., Varela D., Cullen, J., Orians, K., Maldonado, M., Tortell, P., Rivkin, R., Kienast, M., Thomas, H., Hale, M., Miller, L., Smith, J.N., Sigman, D., Brzezinski, M., Weis, D., Fones, G., Saito, M., Allen, A., and Williamson, S.: GEOTRACES: Multi-tracer investigation of the effect of climate change on nutrient and carbon cycles in the Arctic Ocean, Canadian Cryospheric Information Network (CCIN), doi:10.5443/11458, 2012.
Friedrich, T., Timmermann, A., Abe-Ouchi, A., Bates, N. R., Chikamoto, M. O., Church, M. J., Dore, J. E., Gledhill, D. K., Gonzalez-Davila, M., Heinemann, M., Ilyina, T., Jungclaus, J. H., McLeod, E., Mouchet, A., and Santana-Casiano, J. M.: Detecting regional anthropogenic trends in ocean acidification against natural variability, Nat. Clim. Change, 2, 167–171, doi:10.1038/NCLIMATE1372, 2012.
Geilfus, N. X., Pind, M. L., Else, B. G. T., Galley, R. J., Miller, L. A., Thomas, H., Gosselin, M., Rysgaard, S., Wang, F., and Papakyriakou, T. N.: Spatial and temporal variability of seawater pCO2 within the Canadian Arctic Archipelago and Baffin Bay during the summer and autumn 2011, Cont. Shelf Res., 156, 1–10, doi:10.1016/j.csr.2018.01.006, 2018.
Giesbrecht, K. E., Miller, L. A., Davelaar, M., Zimmermann, S., Carmack, E., Johnson, W. K., Macdonald, R. W., McLaughlin, F., Mucci, A., Williams, W. J., Wong, C. S., and Yamamoto-Kawai, M.: Measurements of the dissolved inorganic carbon system and associated biogeochemical parameters in the Canadian Arctic, 1974–2009, Earth Syst. Sci. Data, 6, 91–104, https://doi.org/10.5194/essd-6-91-2014, 2014.
González-Dávila, M., Santana-Casiano, J. M., Rueda, M. J., and Llinás, O.: The water column distribution of carbonate system variables at the ESTOC site from 1995 to 2004, Biogeosciences, 7, 3067–3081, https://doi.org/10.5194/bg-7-3067-2010, 2010.
Hawkins, E. and Sutton, R.: Time of emergence of climate signals, Geophys. Res. Lett., 39, L01702, doi:10.1029/2011GL050087, 2012.
Jiang, L., Cai, W., and Wang, Y.: A comparative study of carbon dioxide degassing in river- and marine-dominated estuaries, Limnol. Oceanogr., 53, 2603–2615, doi:10.4319/lo.2008.53.6.2603, 2008.
Johnson, K., Wills, K., Butler, D., Johnson, W., and Wong, C.: Coulometric total carbon-dioxide analysis for marine studies – maximizing the performance of an automated gas extraction system and coulometric detector, Mar. Chem., 44, 167–187, doi:10.1016/0304-4203(93)90201-X, 1993.
Jones, E., Anderson, L., and Swift, J.: Distribution of Atlantic and Pacific waters in the upper Arctic Ocean: Implications for circulation, Geophys. Res. Lett., 25, 765–768, doi:10.1029/98GL00464, 1998.
Jones, E., Swift, J., Anderson, L., Lipizer, M., Civitarese, G., Falkner, K., Kattner, G., and McLaughlin, F.: Tracing Pacific water in the North Atlantic Ocean, J. Geophys. Res.-Ocean., 108, 3116, doi:10.1029/2001JC001141, 2003.
Keller, K. M., Joos, F., and Raible, C. C.: Time of emergence of trends in ocean biogeochemistry, Biogeosciences, 11, 3647–3659, https://doi.org/10.5194/bg-11-3647-2014, 2014.
Lansard, B., Mucci, A., Miller, L. A., Macdonald, R. W., and Gratton, Y.: Seasonal variability of water mass distribution in the southeastern Beaufort Sea determined by total alkalinity and delta O-18, J. Geophys. Res., 117, C03003, https://doi.org/10.1029/2011JC007299, 2012.
Le Quéré, C., Andrew, R. M., Friedlingstein, P., Sitch, S., Pongratz, J., Manning, A. C., Korsbakken, J. I., Peters, G. P., Canadell, J. G., Jackson, R. B., Boden, T. A., Tans, P. P., Andrews, O. D., Arora, V. K., Bakker, D. C. E., Barbero, L., Becker, M., Betts, R. A., Bopp, L., Chevallier, F., Chini, L. P., Ciais, P., Cosca, C. E., Cross, J., Currie, K., Gasser, T., Harris, I., Hauck, J., Haverd, V., Houghton, R. A., Hunt, C. W., Hurtt, G., Ilyina, T., Jain, A. K., Kato, E., Kautz, M., Keeling, R. F., Klein Goldewijk, K., Körtzinger, A., Landschützer, P., Lefèvre, N., Lenton, A., Lienert, S., Lima, I., Lombardozzi, D., Metzl, N., Millero, F., Monteiro, P. M. S., Munro, D. R., Nabel, J. E. M. S., Nakaoka, S., Nojiri, Y., Padin, X. A., Peregon, A., Pfeil, B., Pierrot, D., Poulter, B., Rehder, G., Reimer, J., Rödenbeck, C., Schwinger, J., Séférian, R., Skjelvan, I., Stocker, B. D., Tian, H., Tilbrook, B., Tubiello, F. N., van der Laan-Luijkx, I. T., van der Werf, G. R., van Heuven, S., Viovy, N., Vuichard, N., Walker, A. P., Watson, A. J., Wiltshire, A. J., Zaehle, S., and Zhu, D.: Global Carbon Budget 2017, Earth Syst. Sci. Data, 10, 405–448, https://doi.org/10.5194/essd-10-405-2018, 2018.
Lewis, E. and Wallace, D. W. R.: Program developed for CO2 system calculations, Carbon Dioxide Information Analysis Center, Oak Ridge National Laboratory, US Department of Energy, Oak Ridge, Tennessee, 1998.
Luo, Y., Boudreau, B. P., and Mucci, A.: Disparate acidification and calcium carbonate desaturation of deep and shallow waters of the Arctic Ocean, Nat. Commun., 7, 12821, doi:10.1038/ncomms12821, 2016.
Macdonald, R. W., Carmack, E., McLaughlin, F., Iseki, K., and Macdonald, D.: Composition and modification of water masses in the Mackenzie Shelf estuary, J. Geophys. Res.-Ocean., 94, 18057–18070, 1989.
Macdonald, R. and Yu, Y.: The Mackenzie estuary of the Arctic Ocean, in: The Handbook of Environmental Chemistry, vol. 5H, Springer, Berlin/Heidelberg, 91–120, 2006.
McLaughlin, F. A., Carmack, E. C., Ingram, R. G., Williams, W. J., and Michel, C.: Oceanography of the Northwest Passage, in: The Sea, Vol. 14, Wiley, New York, 1121–1242, 2004.
Mehrbach, C., Culberson, C. H., Hawley, J. E., and Pytkowicz, R. M.: Measurement of the apparent dissociation constants of carbonic acid in seawater at atmospheric pressure, Limnol. Oceanogr. 18, 897–907, 1973.
Melling, H., Gratton, Y., and Ingram, G.: Ocean circulation within the North Water Polynya of Baffin Bay, Atmos. Ocean, 39, 301–325, doi:10.1080/07055900.2001.9649683, 2001.
Miller, L. A., Papakyriakou, T. N., Collins, R. E., Deming, J. W., Ehn, J. K., Macdonald, R. W., Mucci, A., Owens, O., Raudsepp, M., and Sutherland, N.: Carbon dynamics in sea ice: A winter flux time series, J. Geophys. Res.-Ocean., 116, C02028, doi:10.1029/2009JC006058, 2011.
Millero, F. J.: Chemical Oceanography, 3rd Edn., CRC Press, Boca Raton, Florida, 2005.
Mostofa, K. M. G., Liu, C.-Q., Zhai, W., Minella, M., Vione, D., Gao, K., Minakata, D., Arakaki, T., Yoshioka, T., Hayakawa, K., Konohira, E., Tanoue, E., Akhand, A., Chanda, A., Wang, B., and Sakugawa, H.: Reviews and Syntheses: Ocean acidification and its potential impacts on marine ecosystems, Biogeosciences, 13, 1767–1786, https://doi.org/10.5194/bg-13-1767-2016, 2016.
Mucci, A.: The Solubility of calcite and aragonite in seawater at various salinities, temperatures, and one atmosphere total pressure, Am. J. Sci., 283, 780–799, doi:10.2475/ajs.283.7.780, 1983.
Mucci, A., Lansard, B., Miller, L. A., and Papakyriakou, T. N.: CO2 fluxes across the air-sea interface in the southeastern Beaufort Sea: Ice-free period, J. Geophys. Res.-Ocean., 115, C04003, doi:10.1029/2009JC005330, 2010.
Mucci, A.: Long-term Monitoring of pH, total alkalinity, the stable oxygen isotopic composition of water and the stable carbon isotopic composition of dissolved inorganic carbon in the Canadian Arctic, Canadian Cryospheric Information Network (CCIN), doi:10.5884/12733, 2017.
Mucci, A., Levasseur, M., Gratton, Y., Martias, C., Scarratt, M., Gilbert, D., Tremblay, J., Ferreyra, G., and Lansard, B.: Tidally induced variations of pH at the head of the Laurentian Channel, Can. J. Fish. Aquat. Sci., 75, 1128–1141, doi:10.1139/cjfas-2017-0007, 2018.
Muench, R. D.: The physical oceanography of the northern Baffin Bay Region – North Water Project Scientific Report No. 1, Arctic Institute of North America, 150 pp., 1971.
Münchow, A., Falkner, K. K., and Melling, H.: Baffin Island and West Greenland current systems in northern Baffin Bay, Prog. Oceanogr., 132, 305–317, 2015.
Orr, J. C., Epitalon, J., Dickson, A. G., and Gattuso, J.: Routine uncertainty propagation for the marine carbon dioxide system, Mar. Chem., 207, 84–107, doi:10.1016/j.marchem.2018.10.006, 2018.
Orr, J., Fabry, V., Aumont, O., Bopp, L., Doney, S., Feely, R., Gnanadesikan, A., Gruber, N., Ishida, A., Joos, F., Key, R., Lindsay, K., Maier-Reimer, E., Matear, R., Monfray, P., Mouchet, A., Najjar, R., Plattner, G., Rodgers, K., Sabine, C., Sarmiento, J., Schlitzer, R., Slater, R., Totterdell, I., Weirig, M., Yamanaka, Y., and Yool, A.: Anthropogenic ocean acidification over the twenty-first century and its impact on calcifying organisms, Nature, 437, 681–686, doi:10.1038/nature04095, 2005.
Papakyriakou, T., Miller, L. A., Thomas, H.,; Mucci, A., and Else, B.: Partial pressure of carbon dioxide, dissolved inorganic carbon, alkalinity, temperature, salinity and other variables collected from the surface underway observations and discrete bottle samples from CCGS Amundsen during the cruises in Baffin Bay, Nares Strait, and Lancaster Sound from 2013-08-11 to 2014-08-12, NOAA National Centers for Environmental Information, https://doi.org/10.7289/v5st7n3c, 2017.
Popova, E. E., Yool, A., Aksenov, Y., Coward, A. C., and Anderson, T. R.: Regional variability of acidification in the Arctic: a sea of contrasts, Biogeosciences, 11, 293–308, https://doi.org/10.5194/bg-11-293-2014, 2014.
Prinsenberg, S. and Bennett, E.: Mixing and transports in Barrow Strait, the central part of the Northwest Passage, Cont. Shelf Res., 7, 913–935, doi:10.1016/0278-4343(87)90006-9, 1987.
Proshutinsky, A., Krishfield, R., Timmermans, M., Toole, J., Carmack, E., McLaughlin, F., Williams, W. J., Zimmermann, S., Itoh, M., and Shimada, K.: Beaufort Gyre freshwater reservoir: State and variability from observations, J. Geophys. Res.-Ocean., 114, C00A10, doi:10.1029/2008JC005104, 2009.
Qi, D., Chen, L., Chen, B., Gao, Z., Zhong, W., Feely, R. A., Anderson, L. G., Sun, H., Chen, J., Chen, M., Zhan, L., Zhang, Y., and Cai, W.: Increase in acidifying water in the western Arctic Ocean, Nat. Clim. Change, 7, 195–199, doi:10.1038/NCLIMATE3228, 2017.
Robbins, L. L., Wynn, J. G., Lisle, J. T., Yates, K. K., Knorr, P. O., Byrne, R. H., Liu, X., Patsavas, M. C., Azetsu-Scott, K., and Takahashi, T.: Baseline monitoring of the Western Arctic Ocean estimates 20 % of Canadian Basin surface waters are undersaturated with respect to aragonite, PLOS One, 8, UNSP e73796, doi:10.1371/journal.pone.0073796, 2013.
Robert-Baldo, G., Morris, M., and Byrne, R.: Spectrophotometric determination of seawater pH using Phenol Red, Anal. Chem., 57, 2564–2567, doi:10.1021/ac00290a030, 1985.
Rodgers, K. B., Lin, J., and Frölicher, T. L.: Emergence of multiple ocean ecosystem drivers in a large ensemble suite with an Earth system model, Biogeosciences, 12, 3301–3320, https://doi.org/10.5194/bg-12-3301-2015, 2015.
Sabine, C., Feely, R., Gruber, N., Key, R., Lee, K., Bullister, J., Wanninkhof, R., Wong, C., Wallace, D., Tilbrook, B., Millero, F., Peng, T., Kozyr, A., Ono, T., and Rios, A.: The oceanic sink for anthropogenic CO2, Science, 305, 367–371, doi:10.1126/science.1097403, 2004.
Serreze, M. C. and Barry, R. G.: Processes and impacts of Arctic amplification: A research synthesis, Global Planet. Change, 77, 85–96, doi:10.1016/j.gloplacha.2011.03.004, 2011.
Shadwick, E. H., Thomas, H., Chierici, M., Else, B., Fransson, A., Michel, C., Miller, L. A., Mucci, A., Niemi, A., Papakyriakou, T. N., and Tremblay, J. -E.: Seasonal variability of the inorganic carbon system in the Amundsen Gulf region of the southeastern Beaufort Sea, Limnol. Oceanogr., 56, 303–322, doi:10.4319/lo.2011.56.1.0303, 2011.
Shadwick, E. H., Trull, T. W., Thomas, H., and Gibson, J. A. E.: Vulnerability of Polar Oceans to anthropogenic acidification: Comparison of Arctic and Antarctic seasonal cycles, Sci. Rep.-UK, 3, 2339, doi:10.1038/srep02339, 2013.
Schlitzer, R.: Ocean Data View, available at: http://odv.awi.de (last access: 28 July 2020), 2016.
Stigebrandt, A.: The North Pacific - a Global-Scale Estuary, J. Phys. Oceanogr., 14, 464–470, 1984.
Stroeve, J. C., Serreze, M. C., Holland, M. M., Kay, J. E., Malanik, J., and Barrett, A. P.: The Arctic's rapidly shrinking sea ice cover: a research synthesis, Climatic Change, 110, 1005–1027, doi:10.1007/s10584-011-0101-1, 2012.
Sutton, A. J., Sabine, C. L., Feely, R. A., Cai, W.-J., Cronin, M. F., McPhaden, M. J., Morell, J. M., Newton, J. A., Noh, J.-H., Ólafsdóttir, S. R., Salisbury, J. E., Send, U., Vandemark, D. C., and Weller, R. A.: Using present-day observations to detect when anthropogenic change forces surface ocean carbonate chemistry outside preindustrial bounds, Biogeosciences, 13, 5065–5083, https://doi.org/10.5194/bg-13-5065-2016, 2016.
Takahashi, T., Olafsson, J., Goddard, J., Chipman, D., and Sutherland, S.: Seasonal variation of CO2 and nutrients in the high-latitude surface oceans - a comparative study, Global Biogeochem. Cy., 7, 843–878, doi:10.1029/93GB02263, 1993.
Tang, C., Ross, C., Yao, T., Petrie, B., DeTracey, B., and Dunlap, E.: The circulation, water masses and sea-ice of Baffin Bay, Prog. Oceanogr., 63, 183–228, doi:10.1016/j.pocean.2004.09.005, 2004.
Tivy, A., Howell, S. E. L., Alt, B., McCourt, S., and Chagnon, R.: Trends and variability in summer sea ice cover in the Canadian Arctic based on the Canadian Ice Service Digital Archive, 1960–2008 and 1968–2008, J. Geophys. Res.-Ocean., 116, C03007, doi:10.1029/2009JC005855, 2011.
Tremblay, J.-E., Belanger, S., Barber, D. G., Asplin, M., Martin, J., Darnis, G., Fortier, L., Gratton, Y., Link, H., Archambault, P., Sallon, A., Michel, C., Williams, W. J., Philippe, B., and Gosselin, M.: Climate forcing multiplies biological productivity in the coastal Arctic Ocean, Geophys. Res. Lett., 38, L18604, doi:10.1029/2011GL048825, 2011.
Tremblay, J., Anderson, L. G., Matrai, P., Coupel, P., Belanger, S., Michel, C., and Reigstad, M.: Global and regional drivers of nutrient supply, primary production and CO2 drawdown in the changing Arctic Ocean, Prog. Oceanogr., 139, 171–196, doi:10.1016/j.pocean.2015.08.009, 2015.
Uppström, L. R.: The boron/chlorinity ratio of deep-sea water from the Pacific Ocean, Deep-Sea Res. Oceanogr. Abstr., 21, 161–162, 1974.
Wanninkhof, R., Park, G.-H., Takahashi, T., Sweeney, C., Feely, R., Nojiri, Y., Gruber, N., Doney, S. C., McKinley, G. A., Lenton, A., Le Quéré, C., Heinze, C., Schwinger, J., Graven, H., and Khatiwala, S.: Global ocean carbon uptake: magnitude, variability and trends, Biogeosciences, 10, 1983–2000, https://doi.org/10.5194/bg-10-1983-2013, 2013.
Wolf-Gladrow, D. A., Zeebe, R. E., Klaas, C., Koertzinger, A., and Dickson, A. G.: Total alkalinity: The explicit conservative expression and its application to biogeochemical processes, Mar. Chem., 106, 287–300, doi:10.1016/j.marchem.2007.01.006, 2007.
Wynn, J. G., Robbins, L. L., and Anderson, L. G.: Processes of multibathyal aragonite undersaturation in the Arctic Ocean, J. Geophys. Res.-Ocean., 121, 8248–8267, doi:10.1002/2016JC011696, 2016.
Yamamoto-Kawai, M., McLaughlin, F. A., and Carmack, E. C.: Effects of ocean acidification, warming and melting of sea ice on aragonite saturation of the Canada Basin surface water, Geophys. Res. Lett., 38, L03601, doi:10.1029/2010GL045501, 2011.
Yamamoto-Kawai, M., McLaughlin, F. A., Carmack, E. C., Nishino, S., Shimada, K., and Kurita, N.: Surface freshening of the Canada Basin, 2003–2007: River runoff versus sea ice meltwater, J. Geophys. Res.-Ocean., 114, C00A05, doi:10.1029/2008JC005000, 2009a.
Yamamoto-Kawai, M., McLaughlin, F. A., Carmack, E. C., Nishino, S., and Shimada, K.: Aragonite undersaturation in the Arctic Ocean: Effects of ocean acidification and sea ice melt, Science, 326, 1098–1100, doi:10.1126/science.1174190, 2009b.
Zeebe, R. E. and Wolf-Gladrow, D.: Equilibrium, in: CO2 in Seawater: Equilibrium, kinetics, isotopes, Elsevier Oceanography Series, Amsterdam, 2–22, 2001.
- Abstract
- Introduction
- Study area
- Methods
- Results and discussion
- Conclusions
- Appendix A: Time of emergence of ocean acidification signals
- Appendix B: Estimation of the freshwater sources in the Queen Maud Gulf
- Data availability
- Author contributions
- Competing interests
- Acknowledgements
- Financial support
- Review statement
- References