the Creative Commons Attribution 4.0 License.
the Creative Commons Attribution 4.0 License.
 | 28 Aug 2020
Denitrification and associated nitrous oxide and carbon dioxide emissions from the Amazonian wetlands
Ahmad Al Bitar
Sabine Sauvage
Marie Parrens
Jean-Michel Martinez
Gwenael Abril
Patricia Moreira-Turcq
José-Miguel Sánchez-Pérez
In this paper, we quantify the CO2 and N2O emissions from denitrification over the Amazonian wetlands. The study concerns the entire Amazonian wetland ecosystem with a specific focus on three floodplain (FP) locations: the Branco FP, the Madeira FP and the FP alongside the Amazon River. We adapted a simple denitrification model to the case of tropical wetlands and forced it by open water surface extent products from the Soil Moisture and Ocean Salinity (SMOS) satellite. A priori model parameters were provided by in situ observations and gauging stations from the HYBAM Observatory. Our results show that the denitrification and the trace gas emissions present a strong cyclic pattern linked to the inundation processes that can be divided into three distinct phases: activation, stabilization and deactivation. We quantify the average yearly denitrification and associated emissions of CO2 and N2O over the entire watershed at 17.8 kgN ha−1 yr−1, 0.37 gC-CO2 m−2 yr−1 and 0.18 gN-N2O m−2 yr−1 respectively for the period 2011–2015. When compared to local observations, it was found that the CO2 emissions accounted for 0.01 % of the integrated ecosystem, which emphasizes the fact that minor changes to the land cover may induce strong impacts on the Amazonian carbon budget. Our results are consistent with the state of the art of global nitrogen models with a positive bias of 28 %. When compared to other wetlands in different pedoclimatic environments we found that the Amazonian wetlands have similar emissions of N2O with the Congo tropical wetlands and lower emissions than the temperate and tropical anthropogenic wetlands of the Garonne (France), the Rhine (Europe) and south-eastern Asia rice paddies. In summary our paper shows that a data-model-based approach can be successfully applied to quantify N2O and CO2 fluxes associated with denitrification over the Amazon basin. In the future, the use of higher-resolution remote sensing products from sensor fusion or new sensors like the Surface Water and Ocean Topography (SWOT) mission will permit the transposition of the approach to other large-scale watersheds in tropical environments.
- Article
(1933 KB) - Full-text XML
- BibTeX
- EndNote


Inland waters play a crucial role in the carbon and nitrogen cycle. In particular, wetlands sequester atmospheric and fluvial carbon (Abril and Borges, 2019). This phenomenon is intimately linked to nitrous oxide (N2O; Wu et al., 2009) and carbon dioxide (CO2) emissions to the atmosphere (Borges et al., 2015). In wetlands, during inundation periods denitrification processes nitrates () into atmospheric dinitrogen (N2). These processes are controlled by biogeochemical reactions linked to microorganism activity and pedoclimatic conditions (soil characteristics, nutrient availability and water content). Moreover, the alternations between dry and wet periods in wetlands promote carbon and nitrogen mineralization and denitrification in soils (Koschorreck and Darwich, 2003). Our understanding and capacity to quantify the mechanisms involved in N2O and CO2 emissions over wetlands are limited and lead to uncertainties in estimating them at large scales.
During the last decade, process-based models have become key tools in estimating carbon and nitrogen budgets in the context of global multi-source changes. Recent studies presenting a review of existing models capable of quantifying N2O and CO2 fluxes over continental ecosystems (Tian et al., 2018; Lauerwald et al., 2017) show that they are mainly used to characterize the part of greenhouse gas (GHG) emissions due to natural and anthropogenic–agricultural activities at different spatio-temporal scales. The estimation of N2O emissions from natural sources is still subject to large uncertainties (Ciais et al., 2013), while N2O emissions from anthropogenic activities are under investigation. Assessing the N2O budget for wetlands at a large scale currently constitutes a knowledge gap. In terms of denitrification, the relatively sparse and short-term observations limit our capability to estimate the carbon and nitrogen recycling in terrestrial ecosystems, especially over wetlands. Since in situ measurements constitute the main source of data, few studies assess N2O and CO2 emissions from denitrification at a large scale and instead they are usually limited to field-scale or small-scale watersheds (Russell et al., 2019; Johnson et al., 2019; Korol et al., 2019).
In the case of the Amazon basin, the total amount of CO2 emissions reaches 0.3 PgC yr−1 for both natural and agricultural sources. Scofield et al. (2016) pointed out that over the Amazonian wetlands disproportionally high CO2 outgassing may be explained by the abundant amount of Podzols for the Negro basin. Podzols slow the organic matter decomposition and increase the leaching of humus. Over the Amazon basin, floodplain soils are mainly Gleysols (Legros, 2007) which are characterized by high microbiological activity. CO2 emissions from the river are mainly due to organic matter respiration as well as exports from the wetland system. In wetlands, root respiration and microbial activities are a major source of CO2 emissions (Abril et al., 2014). Ultimately CO2 outgassed from the Amazon River is about 145±40 TgC yr−1 (Rasera et al., 2008) and peaks at 470 TgC yr−1 when extrapolated to the whole basin (Richey et al., 2002). In regards to the carbon budget, some studies show that the Amazon basin is more or less in balance and even acts as a small sink of carbon at the amount of 1 GtC yr−1 (Lloyd et al., 2007).
Remote sensing has emerged as a major tool for GHG quantification, either via assimilation into physically based models (Engelen et al., 2009) or as a direct observation (Bréon and Ciais, 2010). For wetlands, the monitoring of water extents is crucial for the denitrification processes. Water surface monitoring has been carried out with a variety of spectral bands (Martinez and Le Toan, 2007; Pekel et al., 2016; Birkett et al., 2002) in active and passive remote sensing. Recently L-band microwave remote sensing showed advanced capabilities to monitor water surfaces in tropical environments because of all-weather capabilities, providing a soil signal under vegetation (Parrens et al., 2017).
This study aims to deliver an enhanced understanding and quantification of the denitrification process over the Amazonian wetlands with their associated fluxes of N2O and CO2 using modelling and microwave remote sensing. We constrained and adapted a denitrification process-based set of equations by L-band microwave water surface extents from the Soil Moisture and Ocean Salinity (SMOS) satellite and a priori in situ information. The specific objectives of the study are to highlight the main key factors controlling the denitrification and to identify the hot spots and hot moments of denitrification over wetlands. A hot spot represents an area that shows disproportionately high reaction rates relative to the surrounding, and a hot moment corresponds to a short period of time with disproportionately high reaction rates relative to longer intervening time periods (McClain et al., 2003).
2.1 Study area
The Amazon basin (Fig. 1) is the world's largest drainage basin with an area of 5.50×10⁶ km2 and an average water discharge of 208 000 m3 s−1 (Callode et al., 2010) representing 20 % of all surface fresh water transported to the ocean. The watershed spans Bolivia, Colombia, Ecuador, French Guiana, Peru, Suriname and Guyana, and 68 % of the basin pertains to Brazil.
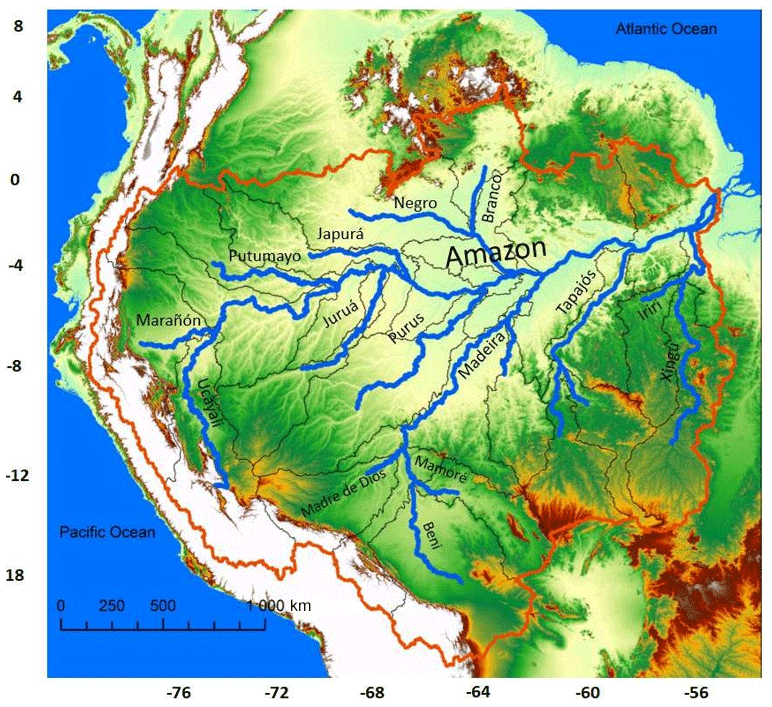
Figure 1The Amazon River basin and its main tributaries mapped over the SRTM (Shuttle Radar Topography Mission – 500 m) digital elevation model.
Devol et al. (1995) described the hydrology of the main stream as the aggregation of the water originating from Andean regions, from the main tributaries and from “local sources” corresponding to smaller streams draining local lowlands. The contribution of each water body differs in time. For example from November to May the contribution of Andean waters reaches 60 % and declines during the dry season to 30 %. Wetlands are essential in the watershed functioning: 30 % of the Amazon discharge has once passed through the floodplain distributed along a 2010 km reach between São Paulo de Olivença and Óbidos (Richey et al., 1990).
The Amazon basin contains several floodplains (FPs). Here we consider three main floodplains: the Branco FP in the northern part, the Madeira FP in the southern part, and the floodplain between Óbidos and Manaus which is called the Óbidos–Manaus floodplain (in the following O–M FP). The O–M FP covers an area of 2.50×10⁵ km2, whereas the Madeira FP covers 3.70×10⁵ km2. The Branco FP is the widest of the three floodplains with a covered area of 6.70×10⁵ km2.
2.2 Materials
2.2.1 In situ data from the HYBAM Observatory
In situ data were obtained from the Hidro-geoquímica da Bacia Amazônica (HYBAM) long-term monitoring network that has maintained, in collaboration with the national stakeholders and local universities, 13 gauging stations in the Amazon catchment basin since 2003. For the Brazilian part of the basin, a network of eight local stations is maintained by the French Research Institute for Development (IRD) and the Federal University of Amazonas (UFAM). Geochemical, sedimentary and hydrological data are available freely at https://www.so-hybam.org (last access: 25 May 2018) for each gauging station. River discharge records are available daily, while geochemical data, including dissolved organic carbon (DOC), are available monthly. In our study, we extracted both the daily river discharges and the monthly DOC concentrations.
2.2.2 Water surface extents from L-band microwave radiometry
The soil water fraction (SWAF) retrieved from L-band microwave radiometry is used to determine the open water surfaces (Parrens et al., 2017). The SWAF is obtained using a contextual model on the SMOS angle-binned brightness temperatures (MIRCLF3TA) data (Al Bitar et al., 2017). SMOS was launched in November 2009 by the European Space Agency (ESA) and is the first satellite dedicated to map soil moisture. SMOS is a passive microwave 2-D interferometric radiometer operating in the L-band (1.413 GHz, 21 cm wavelength; Kerr et al., 2010). SMOS orbits at a 757 km altitude and provides the brightness temperature (TB) emitted from Earth over a range of incidence angles (0 to 55∘) with a spatial resolution of 35 to 50 km. Parrens et al. (2017) showed the capability of SMOS to retrieve the water fraction under dense forests over the Amazon basin. One of the main upsides of SMOS is its sensitivity to the soil signal under vegetation in all-weather conditions thanks to the L-band frequency. The SWAF data were averaged each month over the sampling period (2011–2015) within the Amazon basin. The SMOS satellite observes the Earth surface at full polarization (horizontal – H, vertical – V and cross polarization – HV) at multi-incidence angles. In this paper, the SWAF product was generated from the SMOS TB data at 32.5∘ and V polarization. Figure 2 outlines the common hydrological patterns observed in the Amazon basin as well as the dynamic of the inundations for the different floodplains. The contrasted seasonal peaks in flooded areas between the northern and southern floodplains are well depicted.
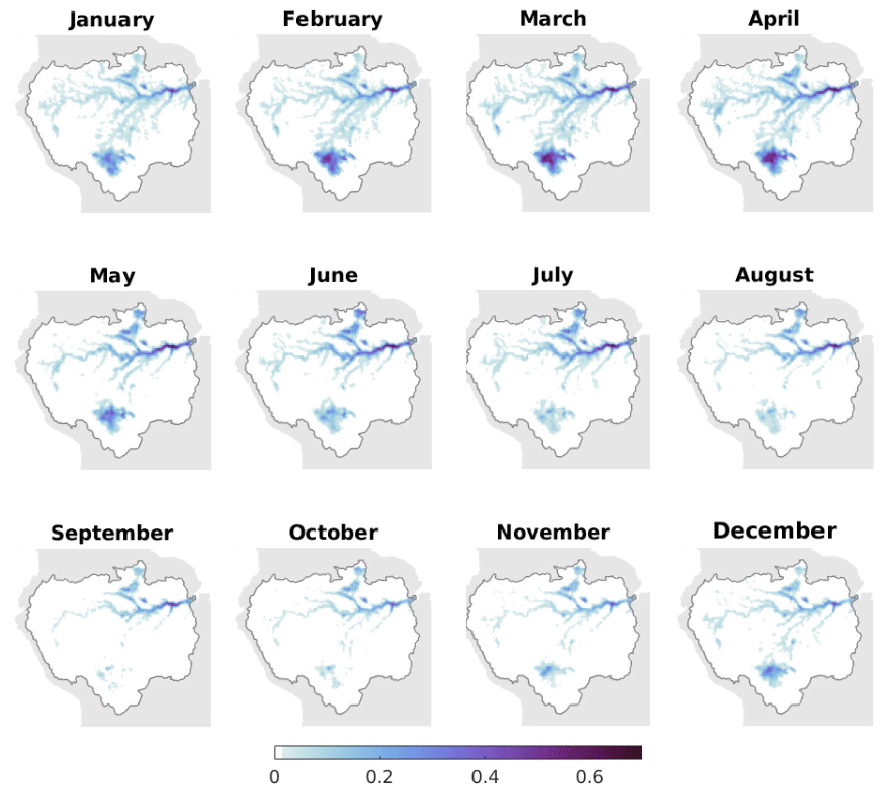
Figure 2Monthly averages from 2011 to 2015 of the SWAF surface water fractions over the Amazon basin based on vertical polarization brightness temperatures (TB V) at 32.5∘ incidence angle acquired by the SMOS satellite.
2.3 Methods
2.3.1 Assessing denitrification and emissions
In this study, we modified the denitrification rate proposed by Peyrard et al. (2010) to fit tropical wetland conditions. Denitrification is the consumption of DOC, particulate organic carbon (POC) and nitrate () in the soil. This process is limited by oxygen (O2) and ammonium () availability. Denitrification occurs during flood events when the soil has low O2 concentrations; thus O2 concentration is not a limiting factor (Dodla et al., 2008). Furthermore, as there is only one long flood pulse in the Amazon watershed, we consider that all the is processed into between two consecutive floods. We also consider that is not a limiting factor. The fact that stocks are reconstituted by nitrification under aerobic conditions, e.g when soils are no longer flooded, is a reasonable assumption in the case of the Amazon basin and more particularly for the wetland parts as shown by Sánchez-Pérez and Trémolières (2003) on the upper Rhine floodplain. In another work, on the groundwater of the alluvial floodplain of the Garonne, Iribar et al. (2015) showed that denitrification is the main process that produces N2 and quantified the nosZ involved in heterotrophic denitrification. Besides, many studies consider denitrification as a combined consumption of and carbon (Scofield et al., 2016; Dodla et al., 2008; Goldman et al., 2017). Taking into consideration the above statements, the denitrification rate is expressed as
where is the denitrification rate (µmol L−1 d−1), 0.8⋅α represents the stoichiometric proportion of consumed in denitrification compared to the organic matter used with α=5 as mentioned in Peyrard et al. (2010) , ρ is the dry sediment density (kg dm−3), ϕ is the sediment porosity, kPOC is the mineralization rate constant of POC (d−1), POC refers to the POC in the soil and the aquifer sediment (%), MC is the carbon molar mass (g mol−1), DOC refers to the DOC in the aquifer water (µmol L−1), kDOC is the mineralization rate constant of DOC (d−1), is the half-saturation constant for limitation (µmol L−1), and is the nitrate concentration in the aquifer (µmol L−1).
The estimation of CO2 emissions is based on the denitrification equation where gaseous CO2 is formed. We consider that neither nor organic matter is a limiting factor for the reaction which is considered total (Reaction R1; de Freitas et al., 2001). Abril and Frankignoulle (2001) showed that denitrification tends to raise the alkalinity. In order to take this phenomenon into account, the formation of from dissolved CO2 (Reaction R2) was coupled to the denitrification (Reaction R1).
Overall, in this study, denitrification was modelled using
The equation of the chemical reaction of denitrification (Reaction R3) is used to determine the generated amount of CO2 by relating it to the amount of denitrified. Finally, N2O production is indirectly estimated as a result of N2 formation. Production of N2O from N2 during denitrification commonly ranges from a factor of 0.05 to 0.2 (Pérez et al., 2000). Nevertheless, with no precise field measurements an average N2O∕N2 ratio of 0.1 (Weier et al., 1992) was applied in the study.
2.3.2 Parametrization of dissolved and particulate organic carbon and nitrate concentrations
The model's parameters for the denitrification are taken from reference studies and in situ measurements. The sediment porosity ϕ was set to 25 %. It is computed based on the soil texture from the Food and Agriculture Organization (FAO) database at 11 km resolution. The porosity is averaged over the computation nodes (25 km × 25 km) using a bilinear interpolation. kPOC, kDOC and were set to d−1, d−1 and 30 µmol L−1 respectively. They are adapted from Sun et al. (2017), who performed a study of denitrification over the Garonne catchment (temperate anthropogenic watershed). To our knowledge, these parameters were never measured over the Amazon basin and the values we used are the only published estimates that we have. According to the studies performed by Moreira-Turcq et al. (2013), the POC concentration was considered constant over the whole watershed and for the entire period of the simulation (2011–2015) at 10 %.
The daily discharge was extracted from the gauging stations used in the study (Fig. 3) from the HYBAM database (1983–2012). For each station, we calculated the mean monthly discharge from the daily observations. In terms of discharge, the marked seasonality of the Amazonian streams was demonstrated by prior studies (Paiva et al., 2013). For the DOC concentrations, we extracted the monthly measurements for the same stations over the same period. As the SWAF's period (2011–2015) and the DOC measurements are not concomitant, we calculated a mean average monthly DOC concentration for each station. When the information of DOC concentration was not available, our dataset was gap-filled using a linear relationship between DOC concentration and discharge (Ludwig et al., 1996), based on the discharge marked seasonality of the Amazonian streams. Finally, we extended the calculated values to the associated main sub-basin of the gauging station.
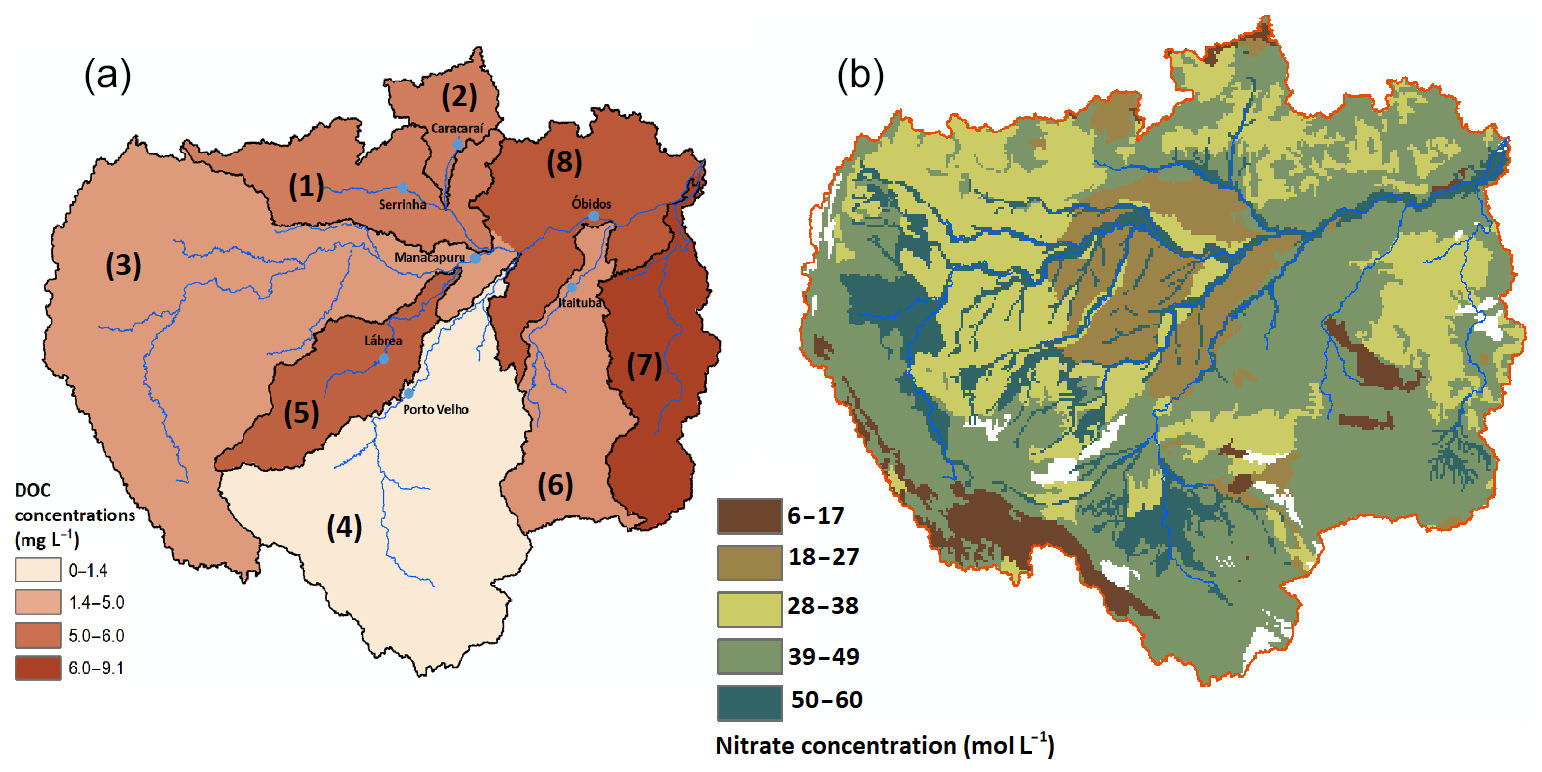
Figure 3Map of the spatial inputs of the denitrification model. DOC contents (mg L−1) mapped over each sub-basin of the main streams (January) with local observation gauging stations in blue circles (a). The Amazon watershed is divided into eight major sub-basins: (1) the Negro basin, (2) the Branco basin, (3) the Solimões River and its tributaries, (4) the Madeira basin, (5) the Purus basin, (6) the Tapajós basin, (7) the Xingu basin and (8) the section between Manaus and the mouth of the Amazon River. contents (mol L−1) of the watershed over FAO's types of soil (b).
concentrations were calculated for every type of soil given by the FAO's classification in the upper 30 cm layer (Fig. 3). Batjes and Dijkshoorn (1999) drew a complete description of the total nitrogen content of the soils of the Amazon region. Evaluating in the upper layer of the soils was executed adapting the mineralization rate which is based on the average temperature of the region and the proportion of both clay and limestone. For the most biologically active soils, such as Gleysols and Fluvisols, the mineralization rate was set at up to 7 % of the organic nitrogen amount, which is the maximum observed value in the region. On the contrary, Regosols are biologically less active soils with mineralization rates hardly reaching 2 % (Legros, 2007; Sumner, 1999). Finally, we determined the concentrations by combining the content in each type of soil with the water storage capacity for each type of soil, retrieved from the FAO soil database. concentrations were considered constant over the period. On the one hand, as the Amazon is one of the most active regions of the world (Legros, 2007) in terms of the microbial soil dynamic, during non-flooding periods, mineralization of nitrogen was sufficient to compensate for loss by plant assimilation and leaching. On the other hand, Sánchez-Perez et al. (1999) showed that when denitrification is active during flood events, the pool of wetlands is provided and sustained by content coming from streams, in the case of the forested Rhine floodplain.
2.3.3 Denitrification computation
The methodology focuses on modelling the denitrification process that occurs in the first 30 cm of water-saturated soils in wetlands. Thereby, only the included in that layer were considered to undergo denitrification. brought by streams is supposed not to modify significantly the amount of contained in the soil solution. Indeed, the concentration of in the river is negligible compared to the concentration in riverine aquifers (Sánchez-Pérez et al., 2003). We consider that the DOC in the soil is directly brought by streams, so the amount of DOC included in soils is set up to the values of the streams. Most of the organic carbon is transported from alluvial sediments or brought by streams during flooding events (Peter et al., 2012). Because of the supersaturation of in groundwater (Davidson et al., 2010), we consider that the gases produced during denitrification are entirely emitted to the atmosphere. Overall, denitrification was calculated as
where is the net denitrification in moles per month, is the denitrification rate in moles per month per litre, SWAF is the fraction of land covered with open waters and Qwa is the water storage capacity for each type of soil (L) retrieved from the FAO soil database. In summary, the model requires the inputs and parameters for (1) the concentration for each type of soil (mol L−1); (2) the DOC concentrations of the streams that overflow, extended to the associated sub-basin; and (3) the extent of inundated surfaces. The model simulations were applied over the Equal-Area Scalable Earth Grid version 2 (EASEv2) nodes at daily scale from 1 January 2011 to 31 December 2015, and monthly maps were then generated. Note that in order to assess the denitrification only occurring in wetlands, the minimum SWAF value recorded during the period (2011–2015) is subtracted to each month simulation, as it accounts as a residual artefact of streams.
3.1 Spatial and temporal patterns of denitrification over the Amazon basin
Denitrification and emissions of CO2 and N2O are simulated for each month from 2011 to 2015. Figure 4 shows the yearly average maps of denitrification and CO2 and N2O emissions over the Amazon basin. The three major hot spots which correspond to the major floodplains of the Amazon basin are identified.
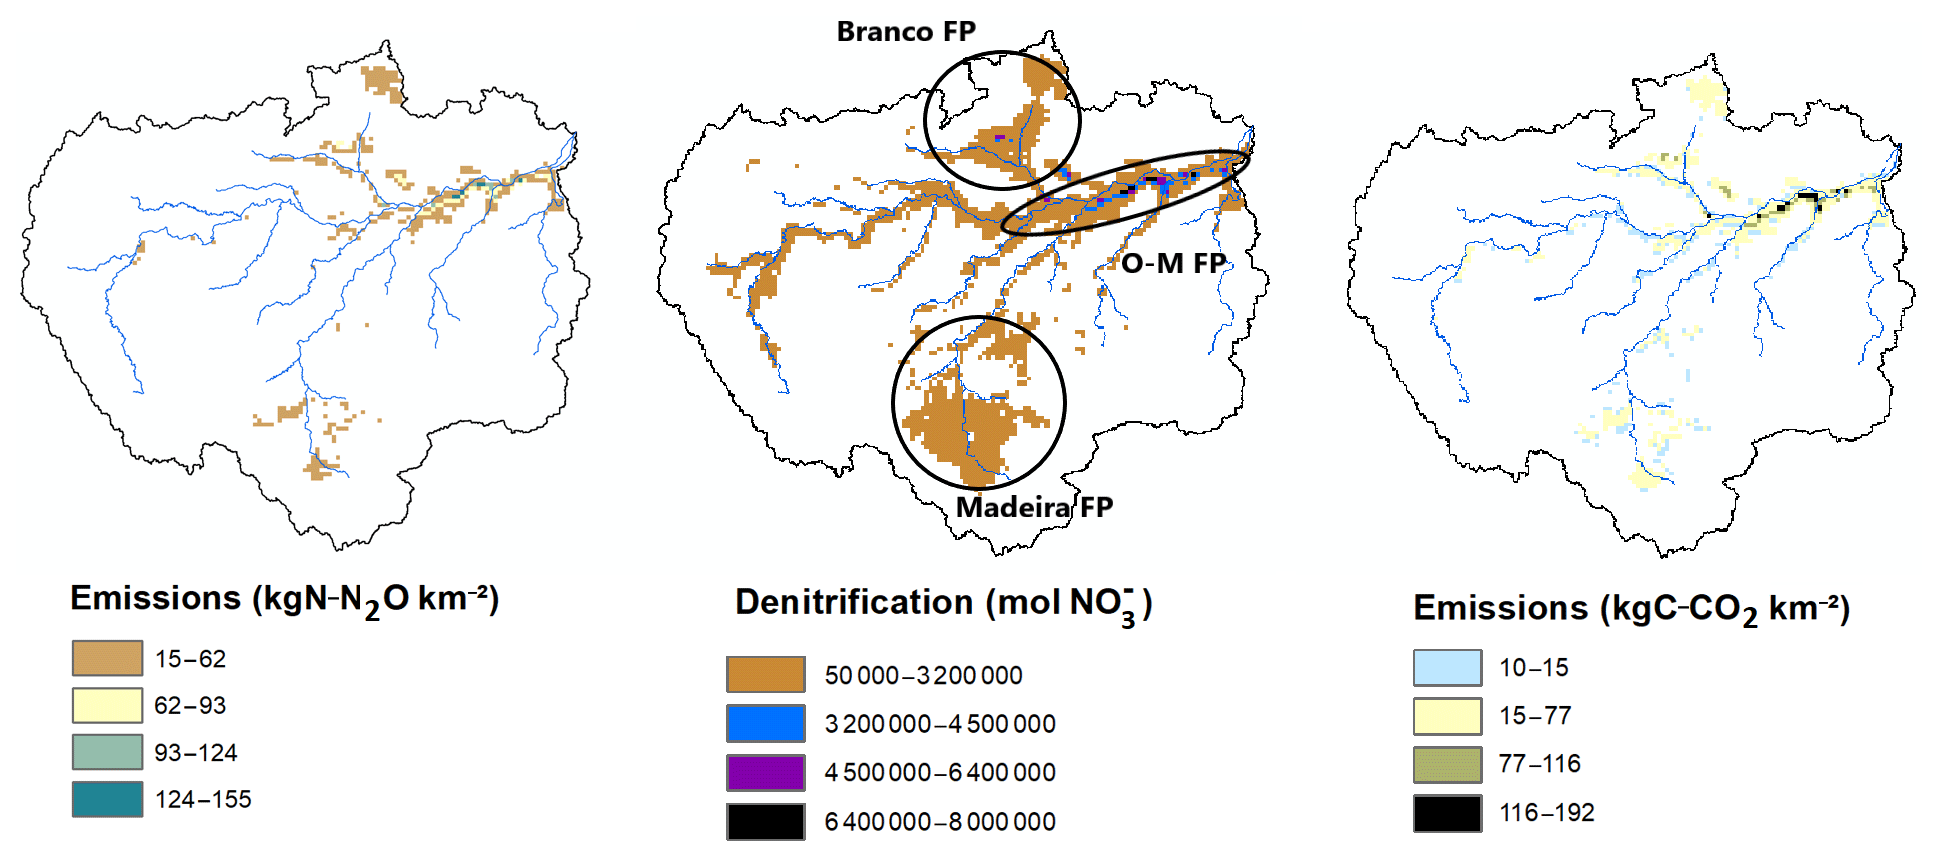
Figure 4Spatial representation of N2O emissions (kgN-N2O km−2), denitrification (mol) and CO2 emissions (kgC-CO2 km−2) summed over the year 2013. The locations of the main floodplains (hot spots) are outlined in the denitrification map.
Denitrification time series over the entire Amazon basin (Fig. 5) show that the denitrification process leads to similar temporal patterns of CO2 and N2O emissions at the basin scale. From November to March the denitrification and the emissions become active with the increase in denitrified in the basin. During the first months, until December, the activation is slow and mild. It then increases in the following months and peaks in March at 1.16×10⁹ kg of N- denitrified, 2.15×10⁸ kg of C-CO2 and 1.00×10⁸ kg of N-N2O. Between March and June, the denitrification and the emissions are steady and fluctuate respectively around 9.51×10⁸ kg of N- denitrified, 2.04×10⁸ kg of C-CO2 and 9.51×10⁷ kg of N-N2O. Finally, it is observed from June to October that the processes inactivate at a slower rate (−33 %) than activation. Subsequently, the decreasing trend shifts and tops in August. Values registered in September are lower than in August, and yet in the years 2011, 2012 and 2015, these were similar. The decreasing trend eventually reaches a minimum peak in November at 1.96×10⁸ kg of N- denitrified, 4.20×10⁷ kg of C-CO2 and 1.96×10⁷ kg of N-N2O.
The same pattern of denitrification repeats every year during the period of the study (2011–2015). We find that the denitrification process can be separated into three phases: first, an activation phase that is triggered by the increase in the flooded areas and the increase in the microbiological activities; second, a stabilization phase which corresponds to a maximum denitrification rate and a peak in microbiological activities; and third, a deactivation phase which corresponds to the retreat of the inundation which also reduced the microbiological processes of denitrification. Note that this conclusion is not independent of the selected model implementation and associated assumptions. Additionally, it shows more precisely three hot moments in March, June and August of each year. The first two hot moments, in March and June, are maximum area peaks. During these months, despite observing a low activity over the watershed (below 8.70×10⁵ kg of N- denitrified per pixel), the extent of surfaces undergoing denitrification is the highest. On the contrary, the August hot moment is mainly due to a particularly strong denitrification between Óbidos and Manaus with peaks of 6.16 and 7.20×10⁶ kg of N- denitrified. CO2 emissions average 1.75×10⁸ kg of C-CO2 per month over the basin. N2O emissions fluctuate around 6.52×10⁷ kg of N-N2O per month from the watershed.

Figure 5Monthly denitrification (kgN-NO3) and CO2 (kgC-CO2) and N2O (kgN-N2O) emissions over the entire Amazon watershed for the period 2011–2015.
3.2 Denitrification and CO2 and N2O emissions – focus on the three main Amazon floodplains
The temporal patterns of the processes over the entire basin and throughout the whole period are unique in each floodplain. In fact, the three floodplains do not become active or inactive at the same time and do not reach their maximum potential activity at the same moment either. Figure 6 shows the monthly behaviour of N2O emissions over the basin and for each floodplain together. The denitrification and the CO2 and N2O emissions follow the same patterns but in different proportions. The results of the model provide the following inferences:
-
The O–M FP follows the same pattern as the watershed trend and is mainly active between March and June, but it never becomes totally inactive during the October–December period. It undergoes an average denitrification of 2.20×10⁸ kg of N- and emissions of 4.78×10⁷ kg of C-CO2 and 2.23×10⁷ kg of N-N2O.
-
The Madeira FP follows the same pattern as the O–M FP. However, it becomes active in October and reaches on average its maximum emissions in March with 2.93×10⁸ kg of N- denitrified, 6.28×10⁷ kg of C-CO2 and 2.93×10⁷ kg of N-N2O. The intensity of the processes decreases rapidly afterwards. A maximum peak is usually observed afterwards in June with 3.03×10⁸ kg of denitrified, 6.49×10⁷ kg of C-CO2 and 3.03×10⁷ kg of N-N2O. The Madeira FP denitrification is almost inactive between July and October with emissions below 5.17×10⁷ kg of N- denitrified, 1.11×10⁷ kg of C-CO2 and 5.17×10⁶ kg of N-N2O.
-
The Branco FP emissions are the least constant of the three floodplains even though a general pattern can be observed. The floodplain becomes active in January, but the activation is slow and the denitrification is low until April (less than 1.70×10⁸ kg of N-) as are the emissions (4.00×10⁷ kg of C-CO2 and 1.70×10⁷ kg of N-N2O). Afterwards, the processes' intensity increases and peaks in May (2011, 2012, 2013), June (2014 and 2015) and September 2013 at 4.06×10⁸ kg of N-, 8.71×10⁷ kg of C-CO2 and 4.06×10⁷ kg of N-N2O. The floodplain is the least active from October to February–March with denitrification and emissions barely reaching 1.20×10⁸ kg of N- and 2.50×10⁷ kg of C-CO2 and 1.20×10⁷ kg of N-N2O respectively.
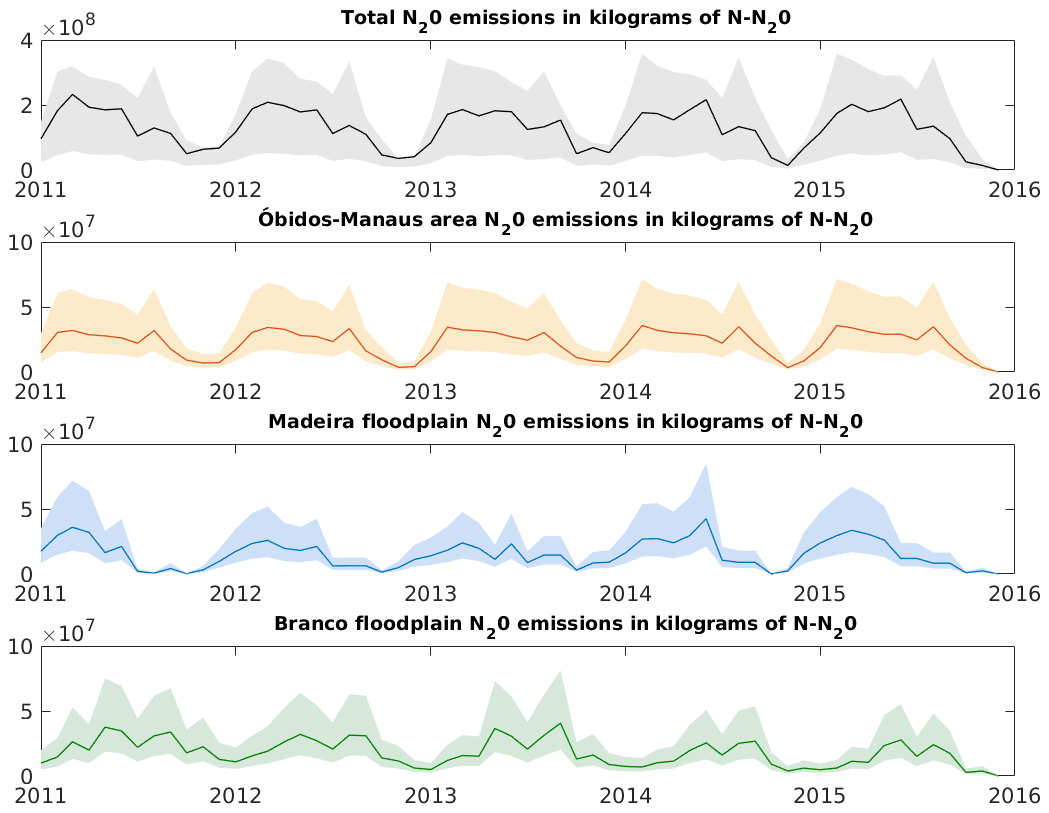
Figure 6Monthly time series of N2O emissions over the basin (black), for the O–M FP (orange), for the Madeira FP (blue) and for the Branco FP (green) over the period (2011–2015). The lines represent the emissions for a N2O∕N2 ratio of 0.1, whereas the coloured areas refer to the potential range of the ratio (0.05–0.2). Denitrification and CO2 emissions follow the same patterns but with a scale factor of times 10 for denitrification and times 2 for CO2.
The detailed functioning of each floodplain explains the general pattern observed for the processes. The O–M FP drives the general trends of the total denitrification, CO2 and N2O emissions of the watershed, and the three different phases: activation, stabilization and deactivation. The March peak is mainly due to the Madeira FP reaching a maximum of activity. The June peak is also attributed to the Madeira floodplain for the years 2011, 2012 and 2013. The peak in 2014 is due to the combined contributions of the Branco FP and the Madeira FP topping activities, whereas in 2015 only the Branco FP contributes. The August peak is again due to the rising of the O–M FP and the Branco FP activity.
Figure 7 shows the monthly contribution of each floodplain to the total denitrification as well as the average monthly denitrification over the basin for the period 2011–2015. Overall, the three floodplains contribute to 80 % of the basin denitrification. From January to March it is mainly supported by the O–M FP and the Madeira FP, whereas from July to November it is due to the O–M FP and the Branco FP activity. In April, May, June and December the involvement of the floodplains is similar. We ran an analysis of variance (ANOVA) and a post hoc analysis to determine the contribution of each floodplain to the basin denitrification. The results showed two different groups (p value = , α=5 %). The first group is constituted by the O–M FP which is the main source of denitrification for the basin and provides 38 % of the processes on average. The second group is constituted by the Branco FP and the Madeira FP. They contribute similarly to the processes (on average 25 % and 21 % respectively). The same conclusions can be made for the CO2 and N2O emissions.
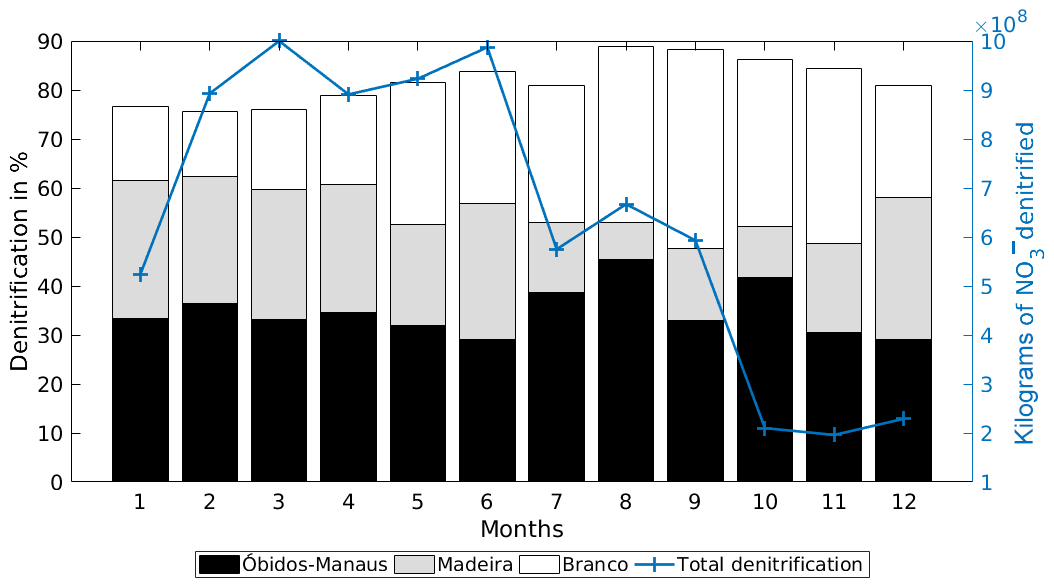
Figure 7Average monthly contribution of each floodplain – the O–M FP (black), the Madeira FP (grey) and Branco FP (white) – to the Amazon total denitrification. The residual contribution to make up 100 % is associated with the other wetlands in the basin. The blue line represents the average monthly denitrification for the period of the study, and it shows the main trend observed over the Amazonian watershed.
3.3 Greenhouse gases emissions from the Amazonian wetlands
Table 1 depicts the yearly emissions of CO2 and N2O over the Amazon basin and the three main floodplains. Emissions of CO2 from denitrification are twice as high as N2O emissions over the basin. The yearly emissions of CO2 from 2011 to 2015 over the Amazon basin show significant low interannual differences (Kruskal–Wallis p value = 0.9929). The same conclusion is drawn for the yearly N2O emissions. On average, flooded areas emit 2.20×10⁹ kgC-CO2 per year and 1.03×10⁹ kgN-N2O per year by denitrification from the natural pool of the watershed.
Table 1Average yearly CO2 emissions (kgC-CO2), N2O emissions (kgN-N2O) and N2 emissions (kgN) for the Amazon basin and the three main floodplains. The values are calculated for a N2O∕N2 ratio of 0.1.

During that period, the O–M FP is the floodplain which contributes the most to the emissions for the two gases. The dynamics of the Madeira FP and the Branco FP changed in 2014. Indeed from 2011 to 2013, the Branco FP roughly emitted twice as many gases as the Madeira FP. This trend shifted in 2014 with the involvement of the Madeira FP becoming more important in terms of emissions than the Branco FP. On a yearly basis, the whole Amazon basin undergoes a denitrification of about 1.03×10¹⁰ kgN ha−1 yr−1.
3.4 Denitrification and trace gas emissions anomalies
During the period of the study, major meteorological events were recorded over the Amazon basin. On the one hand, the year 2011 was a year influenced by La Niña (Moura et al., 2019). La Niña periods lead to wetter weather conditions in South America. From October 2013 to March 2014, heavy rainfall was documented in the Madeira region and caused extreme flooding in this region and nearby Óbidos. On the other hand, September 2015 marked the beginning of an El Niño episode. In South America and the Amazon, El Niño produces drier weather conditions.
Figure 8 shows the monthly anomalies of denitrification observed over the Amazon watershed from 2011 to 2015. Anomalies were determined by first calculating the mean value for each month across the period 2011–2015. This mean value was then subtracted from each corresponding month in the series. Positive anomalies show an intense denitrification, whereas negative anomalies show a denitrification lower than the average. Examining the anomalies of the watershed and the floodplains show that during the La Niña year and the heavy precipitation period, most of the anomalies are positive especially for the first months (66 % and 66 % for the basin denitrification, 16 % and 83 % for the O–M FP, 25 % and 33 % for the Madeira FP, and 100 % and 50 % for the Branco FP respectively). During the El Niño episode, all the anomalies are negative. Nevertheless, El Niño is the only meteorological event that has a significant effect on the processes (p value = ). Moreover it impacts the three floodplains (p value = ). Months undergoing the El Niño episode show a reduction of 27.7 % from the average values.

Figure 8Monthly anomalies at the basin and main floodplains scale for denitrification throughout the period (2011–2015).
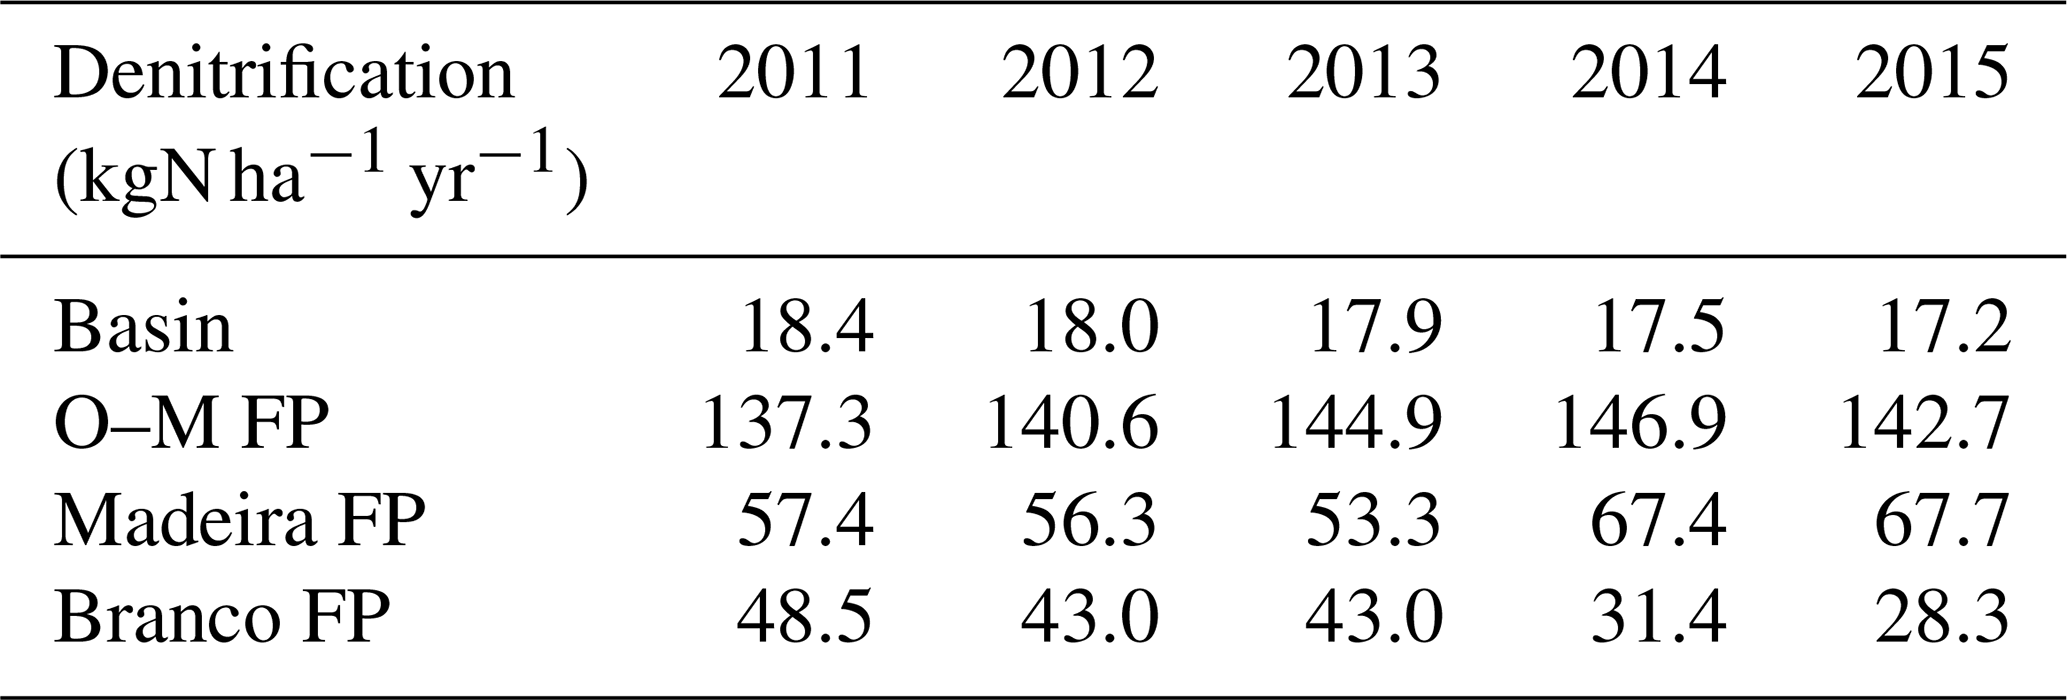
Extreme events do not have a consistent impact on the whole basin. Table 2 sums up the spatial denitrification for the Amazon basin and the three floodplains at a yearly scale. Extreme meteorological events do not impact the denitrification and trace gas emissions at the basin scale. The average yearly denitrification rates for the whole basin, the O–M FP and the Madeira FP show no clear trend between 2011 and 2015. For the Branco FP, a decreasing trend was identified during the study period. From 2011 to 2015 the simulated average yearly denitrification for the Branco FP drops by a factor of 2.
Table 2Yearly denitrification (kgN ha−1 yr−1) for the whole basin and the three major floodplains from 2011 to 2015.
4.1 Determining key factors of the denitrification
A sensitivity analysis of the parameters of the denitrification Eq. (1) was performed. kPOC can range from to which leads to a yearly denitrification 46 % lower and 18 % higher than the initial values respectively. kDOC range from to 1.22 which leads to values of denitrification 94 % lower and 130 000 % higher respectively. It follows that for the Amazon basin kDOC is evaluated as being more sensitive than kPOC. Also, the related part of the denitrification equation was analysed. is relatively abundant in the watershed's soils, and it is noticeable that is negligible compared to though . is a non-limiting factor of denitrification for the Amazon basin. Overall, the denitrification equation currently depends on four variables: POC, DOC, and SWAF. Overall, the main driving variables of the denitrification model are SWAF and DOC.
Table 3Overall denitrification (kgN ha−1 yr−1) and mean and standard deviation of the SWAF and DOC (mg L−1) values for the three floodplains.
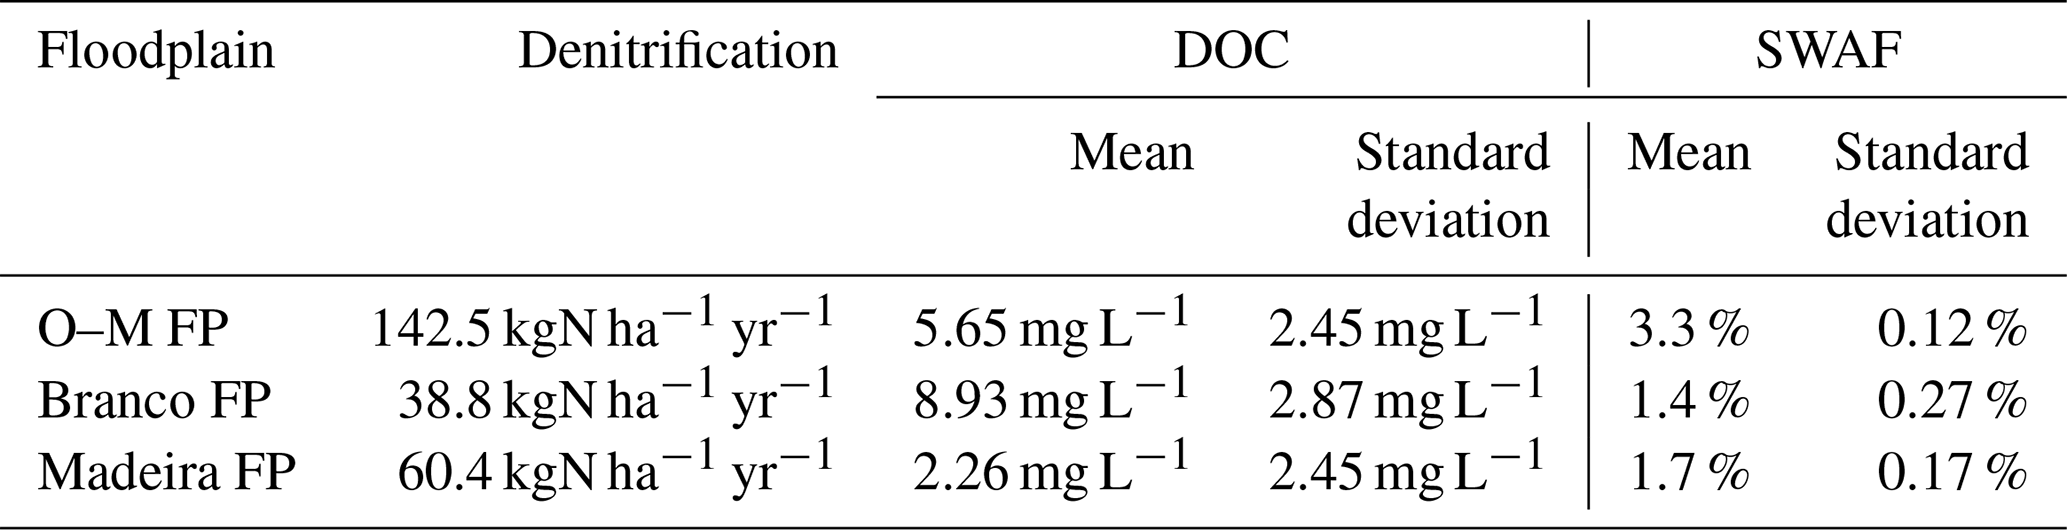
Table 3 depicts for the O–M FP, the Madeira FP and the Branco FP the effective denitrification over the 2011–2015 period in kilograms of nitrogen per hectare per year as well as the average and standard deviation values of DOC concentration in milligrams per litre and the SWAF index. The denitrification values show that all three floodplains are particularly active systems in terms of processing organic matter and . The O–M FP is an active floodplain in terms of denitrification potential with an average annual intensity of 142.5 kgN ha−1 yr−1. The DOC shows that the Branco FP is the highest floodplain in terms of DOC concentration with an average of 8.93±2.87 mg L−1, followed by the O–M FP with 5.65±2.45 mg L−1 and the Madeira FP with 2.26±2.45 mg L−1. Similarly to the DOC, the average and standard deviation of the SWAF values were extracted from the daily observations over the 2011–2015 period. The ranked order of the floodplains for the SWAF component is similar to the denitrification one. This result strengthens the importance of Earth-observation-based (EO-based) monitoring of water bodies for determining inundated-surface patterns and intensities and their impact on biochemical processes. Ultimately, the differences in denitrification intensity observed for the three floodplains are the combined effect of the variations in the DOC concentrations and the SWAF. As a matter of fact, DOC determines the average maximum denitrification rate of a floodplain, whereas the SWAF value is the main driving factor of the model which reveals the actual denitrification. Overall, the denitrification rate (Eq. 1) should be considered as a combination of a potential rate function (provided by DOC and POC) and limitation functions provided by the peculiar environmental conditions.
4.2 Comparing to physically based models
The N2O emissions at a large scale were compared to results of the N2O Model Inter-comparison Project (NMIP) project (Tian et al., 2018) model, more particularly the Dynamic Land Ecosystem Model (DLEM; Xu et al., 2017), the Vegetation Integrative SImulator for Trace gases (VISIT) model (Ito and Inatomi, 2012) and the Organising Carbon and Hydrology In Dynamic Ecosystems – Carbon Nitrogen (ORCHIDEE-CN) model (Zaehle and Friend, 2010). These models consider the N2O emissions from nitrification and denitrification, while in our case only denitrification during flooding is considered. In our case, kPOC and kDOC are the mineralization rate parameters. They describe the kinetic processing of organic matter into POC and DOC respectively. The organic matter processing is performed by microbial communities. Therefore, environmental conditions such as temperature and soil pH have a direct influence on bacterial activity and turnover. The cumulated impact of temperature, soil pH and microorganism activity is accounted for indirectly in our approach through the parameters kPOC and kDOC described in Eq. (1) (Peyrard et al., 2010; Sun et al., 2017).
During the period 2011–2015 those models evaluated emissions of N2O from the Amazon basin at about 0.14 gN m−2 yr−1. Our model simulates emissions of N2O at roughly gN m−2 yr−1 over the basin. The peculiar emission of the 1.3×10¹¹ m2 wetlands system represents 0.81±0.02 gN m−2 yr−1. We can observe that our model obtains a total higher estimation of the emissions of N2O at a rate of 28 % than the other models with 80 % of these emissions (0.14 gN m−2 yr−1) originating from the three main floodplains: the O–M FP, the Madeira FP and the Branco FP. In terms of input data, our model as well as DLEM, VISIT and O-CN uses climate data, soil types and inundated fractions or surfaces. A divergent point is how the nitrogen pool is calculated. We consider it as being produced by the organic matter mineralization and a maximum nitrification, whereas the other models compute it from nitrogen deposition. Moreover, they also take natural vegetation, swamps delineation (O-CN) and land cover as input data, while we only focus on wetland types. These models assess N2O emissions based on the processes of the nitrogen cycle such as denitrification. Our model apprehends denitrification as a function of carbon and nitrate contents (DOC, POC and ) and inundated surfaces (SWAF). As a result, these models do not fully distinguish the alluvial floodplain from other lands (Xu et al., 2017) and underestimate its effects (Ito and Inatomi, 2012). Thus our results bring us to conclude that current physically based N2O emissions models are likely to slightly underestimate the contribution of wetlands in the global budget.
4.3 Wetlands and integrated-ecosystem emissions
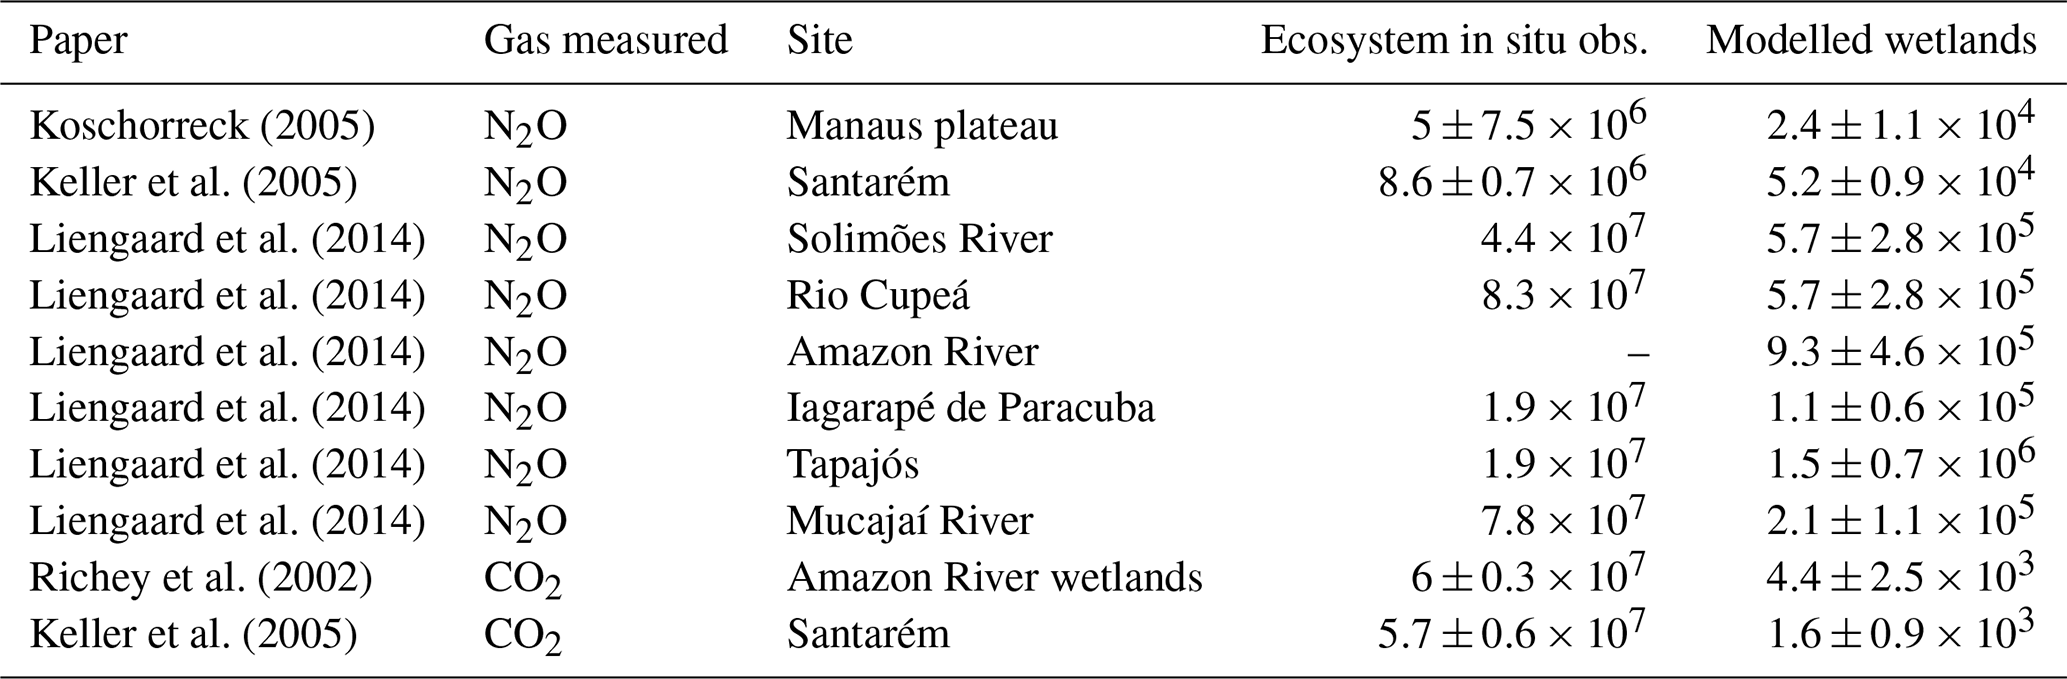
In this section, our model outputs for wetlands emissions are compared to local in situ measurements of the N2O and CO2 ecosystem emissions. Table 4 summarizes the different results from in situ measurements for N2O and CO2 and the closest simulation node from our simulation. We extracted the average simulated value of the period from the simulation node. When comparing the N2O with in situ campaigns performed by Koschorreck (2005), Keller et al. (2005) and Liengaard et al. (2014) at the different locations, the wetlands emissions from our study are roughly lower by a factor of 102 than the integrated-ecosystem-observed emissions. This difference comes from different spatial and temporal scales for both the in situ measurements and our model. To decrease the variability, we extracted the maximal pixel value simulated during the period of the study. On average, in situ measurements return emissions of about 4.9×10⁷ gN km−2 yr−1, while our highest simulation value estimated an emission of about gN km−2 yr−1.
CO2 emissions of local in situ measurements (Keller et al., 2005) as well as of broader measurements (Richey et al., 2002) are compared to our model's outputs. Our wetlands estimations are considerably lower (104) than the integrated-ecosystem observations. As expected, even though CO2 emissions from wetland denitrification are about 2.16×10⁹ kgC-CO2 yr−1 over the Amazon basin, these emissions are negligible when compared to the full ecosystem carbon emissions (Cole et al., 2007; Davidson et al., 2010). Overall, CO2 emissions from denitrification over the whole Amazon basin contribute with 0.01 % of the carbon emissions of the watershed. Most of the CO2 emissions over the Amazon are attributed to processes such as organic matter respiration from biomass and a few contributions from wetlands denitrification. Vicari et al. (2011) showed that the change from wetlands into forested area can increase the carbon emissions drastically. In this context and in the light of the results obtained in this paper one can conclude that in the case of very dry natural events or intense anthropogenic changes in the land cover, the carbon budget of the once wetland areas and now non-inundated surfaces will greatly increase.
Koschorreck (2005)Keller et al. (2005)Liengaard et al. (2014)Liengaard et al. (2014)Liengaard et al. (2014)Liengaard et al. (2014)Liengaard et al. (2014)Liengaard et al. (2014)Richey et al. (2002)Keller et al. (2005)Table 4Comparison of the values estimated by our study and the literature for emissions of CO2 (gC km−2 yr−1) and N2O (gN km−2 yr−1).
4.4 The Amazonian wetlands emissions versus tropical and temperate wetlands
We put in perspective the Amazonian wetlands emissions to a variety of wetland ecosystems such as the Congo basin, rice paddies of south-eastern Asia, and the Garonne (France) and the Rhine (Europe) rivers with each possessing peculiar features. The Congo basin can be considered, like the Amazon, a pristine ecosystem regarding agricultural nitrogen inputs. On the contrary, rice paddy regions are territories with intensive agricultural activities and high fertilization and undergo several flood events per year. Both the Congo basin and the rice paddy regions are part of the tropical region, like the Amazon basin. The N2O emissions from the Amazon and the Congo basins are comparable. Our results for the Amazon and the ones exposed in Tian et al. (2018) for the Congo show emissions of 0.18 gN m−2 yr−1. The two watersheds are pristine for agricultural nitrogen inputs and located toward the same latitudes, so relatively similar emissions of N2O are expected. On the contrary, rice paddies shoot up with emissions of about 0.28 gN m−2 yr−1. This is explained by the impacts of agricultural inputs and successive flooding on wetland ecosystems that increase the amount of greenhouse gas emitted. The Garonne and the Rhine catchments are in temperate regions under high agricultural pressures. The Garonne, one of the main fluvial systems in France, is 525 km long, draining a 55 000 km2 area into the Atlantic Ocean. The large range of altitudes and slopes within the watershed leads to a diversity of hydrological behaviours. The typical alluvial plain starts from its middle section and is about 4 km wide. The riparian forest and poplar plantations cover the first 50–200 m from the riverbank, beyond which lies agricultural land that accounts for 75 % of the total area. The Rhine, one of the main fluvial systems in Germany, is 1233 km long, draining a 198 000 km2 area from Switzerland to the North Sea. The average denitrification reaches 132.52±3.9 kgN ha−1 yr−1 (Sun et al., 2017) and 653 kgN ha−1 yr−1 (Sánchez-Perez et al., 1999) for the Garonne's and Rhine's floodplains respectively. The average rate of denitrification for the Amazon basin is 17.8±0.4 kgN ha−1 yr−1 which is far less than values observed in European catchments. As a comparison, the Òbidos–Manaus floodplain (Table 2) denitrification potential is equivalent to the Garonne. Overall, the Amazon wetland ecosystem can be regarded as a not very active greenhouse-gas-emitting system compared to other ecosystems of the tropical region. Moreover, our results show that the O–M FP possesses the same denitrification potential as a -polluted temperate ecosystem.
4.5 Limitations of the current approach
The findings of this study have to be seen in the light of some limitations. First, the sampling resolution of the input data can induce bias. The SWAF product tends to underestimate water surface extent variability and land cover identification due to the coarse resolution of 25 km × 25 km. Second, the use of uniform kPOC and kDOC values limits the capabilities of the model to fully consider the impact of the spatial variability in both geophysical and biological variables. Third, an average N2O∕N2 ratio of 0.1 was set up for the study. It varies depending on several conditions such as soil properties, land cover and temperature. Thus a precise and spatial estimation of the ratio was not relevant due to the low resolution of our input data and the lack of in-field measurements. Fourth, as highlighted by the present study, the lack of in situ measurements of N2O emissions over tropical wetlands specifically increases the uncertainties and equifinalities for the calibration of model parameters and validation. Fifth, considering the dynamics of the activation–stabilization–deactivation of the denitrification, they can be more precisely assessed if variables like water surface temperatures and water depth are added in the future. These variables can inform the speed at which the activation and deactivation of the microbiological process of denitrification are triggered. Future studies should concentrate on adding more remotely sensed geophysical variables at the adapted spatial resolution (Parrens et al., 2019), taking into account the fact that flooding actually sustains the different processes. Sixth, denitrification and dissimilatory nitrate reduction to ammonium (DNRA) are two natural processes for reduction. In their review, Rütting et al. (2011) stated that DNRA competition for should be considered for some ecosystems which do not include aquatic ecosystems. They added that more studies are needed for terrestrial aquatic ecosystems based on Burgin and Hamilton (2007). Tiedje et al. (1982) showed that under -limiting and strongly reducing conditions, DNRA has the advantage over denitrification: Sotta et al. (2008) estimated the reduction of from DNRA at 12 %–50 % in lowland Brazilian forest but in non-flooded periods. In our case, is non-limiting, thus we do not need to take into account the impact of loss from DNRA. Moreover, since estimates of the DNRA direct contribution to N2O emissions is about 1 % (Cole, 1988) and considering the uncertainty and errors linked to the modelling of denitrification in the wetlands of the whole Amazon basin the DNRA processes were not considered. Finally, in our study we focused solely on denitrification. In order to provide a complete nitrogen budget for the whole Amazon basin, future studies will need to complexify the proposed methodology by integrating additional biogeochemical processes (DNRA, nitrification, etc.) and physically relative datasets (soil temperature, soil moisture, etc.) in order to extend the approach to non-flooded periods and other ecosystems.
The main objective of the study is to quantify and assess CO2 and N2O emissions over the Amazonian wetlands during flooding periods. To achieve these goals we design a data-based methodology that relies on modelling and remote-sensing products. It aims to estimate emissions linked to denitrification at a large scale. The model parametrization was justified by results from several published papers. It appears that denitrification mainly relies on DOC contents in the watershed. The study also contributes to better understanding of the functioning of the major floodplains of the Amazon basin and their respective involvement in the Amazon carbon and nitrogen budget. It transpires that the most active floodplain is the Òbidos–Manaus, which is responsible for the majority of the processes. Each floodplain possesses its own functioning that depends on rainfall and the hydrology of the floodplain's river. Overall, the results appear quite like those of other large-scale models, especially for N2O emissions. CO2 emissions from denitrification account for 0.01 % of the Amazon carbon budget and represent a fraction of of the global CO2 emissions (natural and anthropogenic). When we compare our simulated N2O emissions from Amazonian wetlands to other estimations over the Amazon basin, we find that our estimations are higher (+28 %). For that reason, we emphasize the importance of distinguishing wetlands in nitrogen models as those areas are significant sources of N2O emissions. Key factors of the denitrification for the Amazon basin were identified in the study. From our model design perspective, we find that the denitrification for the Amazon wetlands is driven first by the extent of the flooded areas, which constrain the process, and second by the DOC content in the soil solution, which determines the maximum denitrification potential. Future studies will concentrate on extending the current approach to other tropical basins – it is needless to say that local observations will be essential for the validation of such exercises – preferably over the same period of analysis. Data from future missions like Surface Water and Ocean Topography (SWOT) will deliver water heights over 21 d of global coverage, which will improve the results of such studies through the integration of surfaces and volume information.
Data are available upon request to the corresponding author.
AAB, SS, MP, JMSP and JG conceived and designed the methodology and the algorithms. JG performed the analysis. JMM, GA and PMT provided the scientific expertise and corrections to the manuscript. JG and AAB wrote the first draft. MP made all the graphs. All authors wrote the final manuscript.
The authors declare that they have no conflict of interest.
The SWAF product was developed in the framework of the TOSCA SOLE and SWOT downstream programmes from CNES. We thank the HYBAM Observatory network for providing the data needed for this study. We thank the FUI (Fonds Unique Interministériel) HydroSIM project (2018–2021). We thank the reviewers for their comments and their help in improving our manuscript.
This work was funded by l'Observatoire Midi-Pyrénées (Axe transversal cycle du Carbone, de l'Azote et gaz à effet de serre).
This paper was edited by Carolin Löscher and reviewed by two anonymous referees.
Abril, G. and Borges, A. V.: Ideas and perspectives: Carbon leaks from flooded land: do we need to replumb the inland water active pipe?, Biogeosciences, 16, 769–784, https://doi.org/10.5194/bg-16-769-2019, 2019. a
Abril, G. and Frankignoulle, M.: Nitrogen–alkalinity interactions in the highly polluted scheldt basin (belgium), Water Res., 35, 844–850, https://doi.org/10.1016/S0043-1354(00)00310-9, 2001. a
Abril, G., Martinez, J.-M., Artigas, L. F., Moreira-Turcq, P., Benedetti, M. F., Vidal, L., Meziane, T., Kim, J.-H., Bernardes, M. C., Savoye, N., Deborde, J., Souza, E. L., Alboric, P., Landim de Souza, M. F., and Roland, F.: Amazon River carbon dioxide outgassing fuelled by wetlands, Nature, 505, 395–398, https://doi.org/10.1038/nature12797, 2014. a
Al Bitar, A., Mialon, A., Kerr, Y. H., Cabot, F., Richaume, P., Jacquette, E., Quesney, A., Mahmoodi, A., Tarot, S., Parrens, M., Al-Yaari, A., Pellarin, T., Rodriguez-Fernandez, N., and Wigneron, J.-P.: The global SMOS Level 3 daily soil moisture and brightness temperature maps, Earth Syst. Sci. Data, 9, 293–315, https://doi.org/10.5194/essd-9-293-2017, 2017. a
Batjes, N. H. and Dijkshoorn, J. A.: Carbon and nitrogen stocks in the soils of the Amazon Region, Geoderma, 89, 273–286, https://doi.org/10.1016/S0016-7061(98)00086-X, 1999. a
Birkett, C. M., Mertes, L., Dunne, T., Costa, M., and Jasinski, M.: Surface water dynamics in the Amazon Basin: Application of satellite radar altimetry, J. Geophys. Res.-Atmos., 107, LBA 26-1–LBA 26-21, https://doi.org/10.1029/2001JD000609, 2002. a
Borges, A. V., Abril, G., Darchambeau, F., Teodoru, C. R., Deborde, J., Vidal, L. O., Lambert, T., and Bouillon, S.: Divergent biophysical controls of aquatic CO2 and CH4 in the Worldos two largest rivers, Sci. Rep.-UK, 5, 15614, https://doi.org/10.1038/srep15614, 2015. a
Bréon, F.-M. and Ciais, P.: Spaceborne remote sensing of greenhouse gas concentrations, C.R. Geosci., 342, 412–424, https://doi.org/10.1016/j.crte.2009.09.012, 2010. a
Burgin, A. J. and Hamilton, S. K.: Have we overemphasized the role of denitrification in aquatic ecosystems? A review of nitrate removal pathways, Front. Ecol. Environ., 5, 89–96, https://doi.org/10.1890/1540-9295(2007)5[89:HWOTRO]2.0.CO;2, 2007. a
Callode, J., Cochonneau, G., Alves, F., Guyot, J.-L., Guimaroes, V., and De Oliveira, E.: Les apports en eau de l'Amazone o l'Ocoan Atlantique, Revue des sciences de l'eau, Revue des sciences de l'eau, 23, 247–273, https://doi.org/10.7202/044688ar, 2010. a
Ciais, P., Sabine., C., Bala, G., Bopp, L., Brovkin, V., Canadell, J., Chhabra, A., DeFries, R., Galloway, J., Heimann, M., Jones, C., Le Quéré, C., Myneni, R. B., Piao, S., and Thornton, P.: Carbon and Other Biogeochemical Cycles, in: Climate Change 2013: The Physical Science Basis. Contribution of Working Group I to the Fifth Assessment Report of the Intergovernmental Panel on Climate Change, edited by: Stocker, T. F., Qin, D., Plattner, G.-K., Tignor, M., Allen, S. K., Boschung, J., Nauels, A., Xia, Y., Bex, V., and Midgley, P. M., Cambridge University Press, Cambridge, United Kingdom and New York, NY, USA, 2013. a
Cole, J. A.: Assimilatory and dissimilatory reduction of nitrate to ammonia, in: The Nitrogen and Sulphur Cycles, edited by: Cole, J. A. and Ferguson, S. J., Cambridge University Press, Cambridge, 281–329, 1988. a
Cole, J. J., Prairie, Y. T., Caraco, N. F., McDowell, W. H., Tranvik, L. J., Striegl, R. G., Duarte, C. M., Kortelainen, P., Downing, J. A., Middelburg, J. J., and Melack, J.: Plumbing the Global Carbon Cycle: Integrating Inland Waters into the Terrestrial Carbon Budget, Ecosystems, 10, 172–185, https://doi.org/10.1007/s10021-006-9013-8, 2007. a
Davidson, E. A., Figueiredo, R. O., Markewitz, D., and Aufdenkampe, A. K.: Dissolved CO2 in small catchment streams of eastern Amazonia: A minor pathway of terrestrial carbon loss, J. Geophys. Res.-Biogeo., 115, G04005, https://doi.org/10.1029/2009JG001202, 2010. a, b
de Freitas, H. A., Pessenda, L. C. R., Aravena, R., Gouveia, S. E. M., de Souza Ribeiro, A., and Boulet, R.: Late Quaternary Vegetation Dynamics in the Southern Amazon Basin Inferred from Carbon Isotopes in Soil Organic Matter, Quaternary Res., 55, 39–46, https://doi.org/10.1006/qres.2000.2192, 2001. a
Devol, A. H., Forsberg, B. R., Richey, J. E., and Pimentel, T. P.: Seasonal variation in chemical distributions in the Amazon (Solimoes) River: A multiyear time series, Global Biogeochem. Cy., 9, 307–328, https://doi.org/10.1029/95GB01145, 1995. a
Dodla, S. K., Wang, J. J., DeLaune, R. D., and Cook, R. L.: Denitrification potential and its relation to organic carbon quality in three coastal wetland soils, Sci. Total Environ., 407, 471–480, https://doi.org/10.1016/j.scitotenv.2008.08.022, 2008. a, b
Engelen, R. J., Serrar, S., and Chevallier, F.: Four-dimensional data assimilation of atmospheric CO2 using AIRS observations, J. Geophys. Res.-Atmos., 114, D03303, https://doi.org/10.1029/2008JD010739, 2009. a
Goldman, A. E., Graham, E. B., Crump, A. R., Kennedy, D. W., Romero, E. B., Anderson, C. G., Dana, K. L., Resch, C. T., Fredrickson, J. K., and Stegen, J. C.: Biogeochemical cycling at the aquatic–terrestrial interface is linked to parafluvial hyporheic zone inundation history, Biogeosciences, 14, 4229–4241, https://doi.org/10.5194/bg-14-4229-2017, 2017. a
Iribar, A., Hallin, S., Pérez, J. M. S., Enwall, K., Poulet, N., and Garabétian, F.: Potential denitrification rates are spatially linked to colonization patterns of nosZ genotypes in an alluvial wetland, Ecol. Eng., 80, 191–197, https://doi.org/10.1016/j.ecoleng.2015.02.002, 2015. a
Ito, A. and Inatomi, M.: Use of a process-based model for assessing the methane budgets of global terrestrial ecosystems and evaluation of uncertainty, Biogeosciences, 9, 759–773, https://doi.org/10.5194/bg-9-759-2012, 2012. a, b
Johnson, K., Riser, S., and Ravichandran, M.: Oxygen Variability Controls Denitrification in the Bay of Bengal Oxygen Minimum Zone, Geophys. Res. Lett., 46, 804–811, https://doi.org/10.1029/2018GL079881, 2019. a
Keller, M., Varner, R., Dias, J. D., Silva, H., Crill, P., de Oliveira, R. C., and Asner, G. P.: SoiloAtmosphere Exchange of Nitrous Oxide, Nitric Oxide, Methane, and Carbon Dioxide in Logged and Undisturbed Forest in the Tapajos National Forest, Brazil, Earth Interact., 9, 1–28, https://doi.org/10.1175/EI125.1, 2005. a, b, c, d
Kerr, Y. H., Waldteufel, P., Wigneron, J. P., Delwart, S., Cabot, F., Boutin, J., Escorihuela, M. J., Font, J., Reul, N., Gruhier, C., Juglea, S. E., Drinkwater, M. R., Hahne, A., Martin-Neira, M., and Mecklenburg, S.: The SMOS Mission: New Tool for Monitoring Key Elements ofthe Global Water Cycle, P. IEEE, 98, 666–687, https://doi.org/10.1109/JPROC.2010.2043032, 2010. a
Korol, A., Noe, G., and Ahn, C.: Controls of the spatial variability of denitrification potential in nontidal floodplains of the Chesapeake Bay watershed, USA, Geoderma, 338, https://doi.org/10.1016/j.geoderma.2018.11.015, 2019. a
Koschorreck, M.: Nitrogen Turnover in Drying Sediments of an Amazon Floodplain Lake, Microb. Ecol., 49, 567–577, https://doi.org/10.1007/s00248-004-0087-6, 2005. a, b
Koschorreck, M. and Darwich, A.: Nitrogen dynamics in seasonally flooded soils in the Amazon floodplain, Wetl. Ecol. Manag., 11, 317–330, https://doi.org/10.1023/B:WETL.0000005536.39074.72, 2003. a
Lauerwald, R., Regnier, P., Camino-Serrano, M., Guenet, B., Guimberteau, M., Ducharne, A., Polcher, J., and Ciais, P.: ORCHILEAK (revision 3875): a new model branch to simulate carbon transfers along the terrestrial–aquatic continuum of the Amazon basin, Geosci. Model Dev., 10, 3821–3859, https://doi.org/10.5194/gmd-10-3821-2017, 2017. a
Legros, J.-P.: Les grands sols du monde, PPUR presses polytechniques, France, ISBN 978-2-88074-723-7, 2007. a, b, c
Liengaard, L., Figueiredo Souza, V., Markfoged, R., Revsbech, N., Nielsen, L. P., Enrich-Prast, A., and Kühl, M.: Hot moments of N2O transformation and emission in tropical soils from the Pantanal and the Amazon (Brazil), Soil Biol. Biochem., 75, 26–36, https://doi.org/10.1016/j.soilbio.2014.03.015, 2014. a, b, c, d, e, f, g
Lloyd, J., Kolle, O., Fritsch, H., de Freitas, S. R., Silva Dias, M. A. F., Artaxo, P., Nobre, A. D., de Araújo, A. C., Kruijt, B., Sogacheva, L., Fisch, G., Thielmann, A., Kuhn, U., and Andreae, M. O.: An airborne regional carbon balance for Central Amazonia, Biogeosciences, 4, 759–768, https://doi.org/10.5194/bg-4-759-2007, 2007. a
Ludwig, W., Probst, J.-L., and Kempe, S.: Predicting the oceanic input of organic carbon by continental erosion, Global Biogeochem. Cy., 10, 23–41, https://doi.org/10.1029/95GB02925, 1996. a
Martinez, J.-M. and Le Toan, T.: Mapping of flood dynamics and spatial distribution of vegetation in the Amazon floodplain using multitemporal SAR data, Remote Sens. Environ., 108, 209–223, 2007. a
McClain, M. E., Boyer, E. W., Dent, C. L., Gergel, S. E., Grimm, N. B., Groffman, P. M., Hart, S. C., Harvey, J. W., Johnston, C. A., Mayorga, E., McDowell, W. H., and Pinay, G.: Biogeochemical Hot Spots and Hot Moments at the Interface of Terrestrial and Aquatic Ecosystems, Ecosystems, 6, 301–312, 2003. a
Moreira-Turcq, P., Bonnet, M.-P., Amorim, M., Bernardes, M., Lagane, C., Maurice, L., Perez, M., and Seyler, P.: Seasonal variability in concentration, composition, age, and fluxes of particulate organic carbon exchanged between the floodplain and Amazon River, Global Biogeochem. Cy., 27, 119–130, https://doi.org/10.1002/gbc.20022, 2013. a
Moura, M., Rosa dos Santos, A., Pezzopane, J., Alexandre, R., Ferreira da Silva, S., Marques Pimentel, S., Santos de Andrade, M., Gimenes Rodrigues Silva, F., Figueira Branco, E., Rizzo Moreira, T., Gomes da Silva, R., and de Carvalho, J.: Relation of El Niño and La Niña phenomena to precipitation, evapotranspiration and temperature in the Amazon basin, Sci. Total Environ., 651, 1693–1651, https://doi.org/10.1016/j.scitotenv.2018.09.242, 2019. a
Paiva, R. C. D., Collischonn, W., and Buarque, D. C.: Validation of a full hydrodynamic model for large-scale hydrologic modelling in the Amazon, Hydrol. Process., 27, 333–346, https://doi.org/10.1002/hyp.8425, 2013. a
Parrens, M., Al Bitar, A., Frappart, F., Papa, F., Calmant, S., Crotaux, J.-F., Wigneron, J.-P., and Kerr, Y.: Mapping Dynamic Water Fraction under the Tropical Rain Forests of the Amazonian Basin from SMOS Brightness Temperatures, Water, 9, 350, https://doi.org/10.3390/w9050350, 2017. a, b, c
Parrens, M., Al Bitar, A., Frappart, F., Paiva, R., Wongchuig, S., Papa, F., Yamasaki, D., and Kerr, Y.: High resolution mapping of inundation area in the Amazon basin from a combination of L-band passive microwave, optical and radar datasets, Int. J. Appl. Earth Obs., 81, 58–71, https://doi.org/10.1016/j.jag.2019.04.011, 2019. a
Pekel, J.-F., Cottam, A., Gorelick, N., and Belward, A. S.: High-resolution mapping of global surface water and its long-term changes, Nature, 540, 418–422, https://doi.org/10.1038/nature20584, 2016. a
Pérez, T., Trumbore, S. E., Tyler, S. C., Davidson, E. A., Keller, M., and de Camargo, P. B.: Isotopic variability of N2O emissions from tropical forest soils, Global Biogeochem. Cy., 14, 525–535, https://doi.org/10.1029/1999GB001181, 2000. a
Peter, S., Koetzsch, S., Traber, J., Bernasconi, S., Wehrli, B., and Durisch-Kaiser, E.: Intensified organic carbon dynamics in the ground water of a restored riparian zone, Freshwater Biol., 57, 1603–1616, https://doi.org/10.1111/j.1365-2427.2012.02821.x, 2012. a
Peyrard, D., Delmotte, S., Sauvage, S., Namour, P., Gorino, M., Vervier, P., and Sanchez-Porez, J.-M.: Longitudinal transformation of nitrogen and carbon in the hyporheic zone of an N-rich stream: A combined modelling and field study, Phys. Chem. Earth, 36, 599–611, https://doi.org/10.1016/j.pce.2011.05.003, 2010. a, b, c
Rasera, M. d. F. F. L., Ballester, M. V. R., Krusche, A. V., Salimon, C., Montebelo, L. A., Alin, S. R., Victoria, R. L., and Richey, J. E.: Estimating the Surface Area of Small Rivers in the Southwestern Amazon and Their Role in CO2 Outgassing, Earth Interact., 12, 1–16, https://doi.org/10.1175/2008EI257.1, 2008. a
Richey, J. E., Hedges, J. I., Devol, A. H., Quay, P. D., Victoria, R., Martinelli, L., and Forsberg, B. R.: Biogeochemistry of carbon in the Amazon River, Limnol. Oceanogr., 35, 352–371, https://doi.org/10.4319/lo.1990.35.2.0352, 1990. a
Richey, J. E., Melack, J. M., Aufdenkampe, A. K., Ballester, V. M., and Hess, L. L.: Outgassing from Amazonian rivers and wetlands as a large tropical source of atmospheric CO2, Nature, 416, 617–620, https://doi.org/10.1038/416617a, 2002. a, b, c
Russell, M., Fulford, R., Murphy, K., Lane, C., Harvey, J., Dantin, D., Alvarez, F., Nestlerode, J., Teague, A., Harwell, M., and Almario, A.: Relative Importance of Landscape Versus Local Wetland Characteristics for Estimating Wetland Denitrification Potential, Wetlands, 39, 127–137, https://doi.org/10.1007/s13157-018-1078-6, 2019. a
Rütting, T., Boeckx, P., Müller, C., and Klemedtsson, L.: Assessment of the importance of dissimilatory nitrate reduction to ammonium for the terrestrial nitrogen cycle, Biogeosciences, 8, 1779–1791, https://doi.org/10.5194/bg-8-1779-2011, 2011. a
Sánchez-Pérez, J. and Trémolières, M.: Change in groundwater chemistry as a consequence of suppression of floods: the case of the Rhine floodplain, J. Hydrol., 270, 89–104, https://doi.org/10.1016/S0022-1694(02)00293-7, 2003. a
Sánchez-Perez, J., Tremolières, M., Takatert, N., Ackerer, P., Eichhorn, A., and Maire, G.: Quantification of nitrate removal by a flooded alluvial zone in the Ill floodplain (Eastern France), Hydrobiologia, 410, 185–193, https://doi.org/10.1023/A:1003834014908, 1999. a, b
Sánchez-Pérez, J. M., Vervier, P., Garabétian, F., Sauvage, S., Loubet, M., Rols, J. L., Bariac, T., and Weng, P.: Nitrogen dynamics in the shallow groundwater of a riparian wetland zone of the Garonne, SW France: nitrate inputs, bacterial densities, organic matter supply and denitrification measurements, Hydrol. Earth Syst. Sci., 7, 97–107, https://doi.org/10.5194/hess-7-97-2003, 2003. a
Scofield, V., Melack, J. M., Barbosa, P. M., Amaral, J. H. F., Forsberg, B. R., and Farjalla, V. F.: Carbon dioxide outgassing from Amazonian aquatic ecosystems in the Negro River basin, Biogeochemistry, 129, 77–91, https://doi.org/10.1007/s10533-016-0220-x, 2016. a, b
Sotta, E. D., Corre, M. D., and Veldkamp, E.: Differing N status and N retention processes of soils under old-growth lowland forest in Eastern Amazonia, Caxiuanã, Brazil, Soil Biol. Biochem., 40, 740–750, https://doi.org/10.1016/j.soilbio.2007.10.009, 2008. a
Sumner, M. E.: Handbook of Soil Science, CRC Press, ISBN 13 978-1439803059, 1999. a
Sun, X., Bernard-Jannin, L., Sauvage, S., Garneau, C., Arnold, J., Srinivasan, R., and Sánchez-Perez, J.: Assessment of the denitrification process in alluvial wetlands at floodplain scale using the SWAT model, Ecol. Eng., 103, 344–358, https://doi.org/10.1016/j.ecoleng.2016.06.098, 2017. a, b, c
Tian, H., Yang, J., Lu, C., Xu, R., Canadell, J., Jackson, R., Arneth, A., Chen, J., Chen, G., Ciais, P., Gerber, S., Ito, A., Huang, Y., Joos, F., Lienert, S., Messina, P., Olin, S., Pan, S., Peng, C., Saikawa, E., Thompson, R., Vuivhard, N., Winiwarter, W., Zaehle, S., Zhang, B., Zhang, K., and Zhu, Q.: The global N2O Model Intercomparison Project (NMIP): Objectives, Simulation Protocol and Expected Products, B. Am. Meteorol. Soc., 99, 1231–1251, https://doi.org/10.1175/BAMS-D-17-0212.1, 2018. a, b, c
Tiedje, J., Sexstone, A., Myrold, D., and Robinson, J.: Denitrification: ecological niches, competition and survival, Antonie van Leeuwenhoek, 48, 569–583, https://doi.org/10.1007/BF00399542, 1982. a
Vicari, R., Kandus, P., Pratolongo, P., and Burghi, M.: Carbon budget alteration due to landcover-landuse change in wetlands: the case of afforestation in the Lower Delta of the Parana River marshes (Argentina), Water Environ. J., 25, 378–386, https://doi.org/10.1111/j.1747-6593.2010.00233.x, 2011. a
Weier, K. L., Doran, J. W., Power, J. F., and Walters, D. T.: Denitrification and the Dinitrogen/Nitrous Oxide Ratio as Affected by Soil Water, Available Carbon, and Nitrate, Soil Sci. Soc. Am. J., 57, 66–72, https://doi.org/10.2136/sssaj1993.03615995005700010013x, 1992. a
Wu, J., Zhang, J. and, J. W., Xie, H., Gu, R., Li, C., and Gao, B.: Impact of COD∕N ratio on nitrous oxide emission from microcosm wetlands and their performance in removing nitrogen from wastewater, Bioresource Technol., 100, 2910–2917, https://doi.org/10.1016/j.biortech.2009.01.056, 2009. a
Xu, R., Tian, H., Lu, C., Pan, S., Chen, J., Yang, J., and Zhang, B.: Preindustrial nitrous oxide emissions from the land biosphere estimated by using a global biogeochemistry model, Clim. Past, 13, 977–990, https://doi.org/10.5194/cp-13-977-2017, 2017. a, b
Zaehle, S. and Friend, A.: Carbon and nitrogen cycle dynamics in the O-CN land surface model: 1. Model description, site-scale evaluation, and sensitivity to parameter estimates, Global Biogeochem. Cy., 24, GB1005, https://doi.org/10.1029/2009GB003521, 2010. a