the Creative Commons Attribution 4.0 License.
the Creative Commons Attribution 4.0 License.
 | 03 Jan 2020
The capacity of northern peatlands for long-term carbon sequestration
Georgii A. Alexandrov
Victor A. Brovkin
Thomas Kleinen
Zicheng Yu
Northern peatlands have been a persistent natural carbon sink since the Last Glacial Maximum. The continued growth and expansion of these carbon-rich ecosystems could offset a large portion of anthropogenic carbon emissions before the end of the present interglacial period. Here we used an impeded drainage model and gridded data on the depth to bedrock and the fraction of histosol-type soils to evaluate the limits to the growth of northern peatland carbon stocks. Our results show that the potential carbon stock in northern peatlands could reach a total of 875±125 Pg C before the end of the present interglacial, which could, as a result, remove 330±200 Pg C of carbon from the atmosphere. We argue that northern peatlands, together with the oceans, will potentially play an important role in reducing the atmospheric carbon dioxide concentration over the next 5000 years.
- Article
(1948 KB) - Full-text XML
-
Supplement
(257 KB) - BibTeX
- EndNote


The recent compilations of peatland data confirm that northern peatlands – distributed across the northern midlatitude and high-latitude regions north of 45∘ N – have been a large carbon sink since the Last Glacial Maximum (Loisel et al., 2014, 2017; Treat et al., 2019). Accordingly, northern peatlands were providing a persistent but variable impact on atmospheric carbon (Yu, 2011). Variations in the magnitude of this carbon sink are explained by changes in the rates of peatland expansion and of peat accumulation. In the early Holocene, both the rates of peatland expansion and of carbon accumulation appear to be higher (Yu et al., 2010) compared to the later Holocene periods. Since the area of peatlands remained relatively constant in the late Holocene (Adams and Faure, 1998; MacDonald et al., 2006; Yu et al., 2010), the major part of the carbon sink provided by northern peatlands during this period could be attributed to the growth in peat depth, rather than increase in the area occupied by the northern peatlands.
The average rate of carbon accumulation associated with peat growth is estimated at 18–28 g C m−2 yr−1 (Yu, 2011). This rate suggests that northern peatlands, occupying 2.4–4 million square kilometers (Yu, 2011), may, during the next 20 000 years, accumulate an amount of carbon comparable to the expected cumulative anthropogenic carbon emissions, corresponding to a 2.5 ∘C warming (Raupach et al., 2014), i.e., ranging from 864 (18 g C m−2 yr−1 × 2.4×1012 m2 × 2 × 104 years) to 2240 (28 g C m−2 yr−1 × 4 × 1012 m2 × 2 × 104 years) Pg C.
There has been little research, however, on the estimation of the potential magnitude of the cumulative carbon removal from the atmosphere associated with the natural development of peatland ecosystems. Individual peatland development may lead to reduction of the carbon sequestration potential under the assumptions of constant production and decomposition rates (Clymo, 1984). The closer the peatland ecosystem is to its steady state, i.e., to the equilibrium between organic matter production and decomposition, the lower the carbon sink magnitude is. Therefore, the amount of carbon that northern peatlands could remove from the atmosphere will be far less than that estimated through a simple calculation presented above.
The process of reaching equilibrium can be conceptualized as follows (see Clymo, 1984; Alexandrov et al., 2016). Peat is accumulated due to protection of organic matter in the catotelm, the lower layer of a peat deposit that is permanently saturated with water. Before entering the catotelm plant litters first go through the upper layer of the peat deposit, the acrotelm, which is not permanently saturated with water. Despite intense aerobic decomposition of organic matter in the acrotelm, at least a small portion of the organic matter that enters the acrotelm reaches the catotelm in an accumulating peatland. This is, of course, not true in the case of a degrading peatland, but degrading peatlands do not fall within the scope of this study.
In fact, the organic matter does not reach the catotelm, but it is instead “flooded” by the elevating water table and “buried” by accumulating acrotelm peat. The rise of the water table is caused by the rise of the peatland surface that in turn results from accumulation of organic matter. However, this interaction and feedback cannot elevate the water table infinitely. The maximum height of the water table, and thus the potential peat depth, is determined by the amount of effective rainfall, drainage system density (the length of draining streams per unit area), and the hydraulic conductivity of peat and mineral materials below the peat (Alexandrov et al., 2016; Ingram, 1982).
The purpose of our study is to evaluate the potential peat depth and carbon stocks over the land area north of 45∘ N and to estimate the amount of the cumulative removal of anthropogenic carbon associated with the natural development of northern peatlands by the end of the current interglacial. Although it is not completely clear how long the current interglacial will last, the recent attempts to estimate its possible duration lead to conclusion that a glacial inception is unlikely to happen within the next 50 000 years if cumulative carbon emissions exceed 1000 Pg C (Berger et al., 2016). Since the duration of the current interglacial depends on the cumulative carbon emissions, it should also depend on the cumulative carbon removal that may offset the effect of anthropogenic carbon emissions, and therefore our study also contributes to the discussion on whether the Earth System would remain in the present delicately balanced interglacial climate state for an unusually long time.
2.1 Model equations
To calculate the potential peat depth, we used an equation (see the Supplement) derived from the impeded drainage model used in our previous study (Alexandrov et al., 2016). This equation relates the maximum height of the water table above the level of the draining system, hmax, at a given watershed to the fraction of its area covered by peatland, fP,obs, and the average depth to bedrock, g:
This allows us to estimate, based on gridded data of soil properties (Batjes, 2016) and depth to bedrock (Hengl et al., 2014), the potential average peat depth, pd,max, in a grid cell as follows:
where d is the maximum depth of the acrotelm, in meters (m) (set at 0.4 m), and then to estimate the maximum carbon stock in the grid cell, pC,max, as follows:
where c is the carbon density of peat, in g C m−3 (set at 58 kg C m−3), and A is the area of the grid cell in m2.
2.2 Input data
The values of g at the geographic grid cells of (Fig. 1) were estimated from the data on depth to bedrock (Hengl et al., 2014). According to the data, the depth to bedrock does not exceed 10 m in 33 % of the land north of 45∘ N, and in 90 % of this region it is less than 40 m. In the subregion, where the mean annual temperature is below −2 ∘C, the shallow depth to bedrock is more widespread and less than 10 m in 58 % of the land.
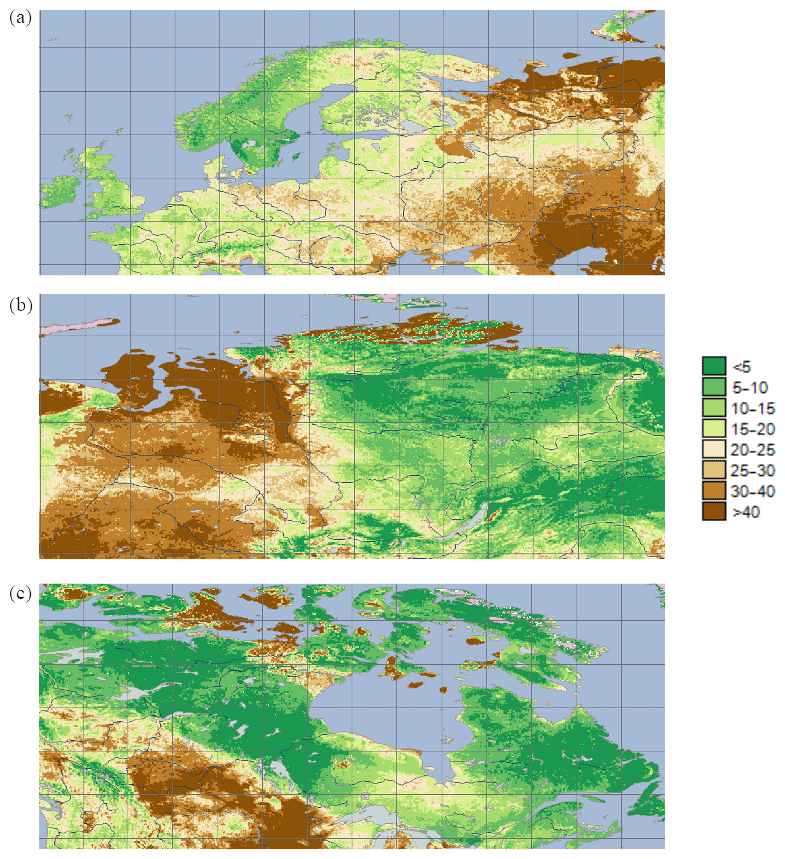
Figure 1The depth to bedrock, an estimate of g, in meters, in Europe (a), western Siberia (b), Canada (c).
The use of these data for estimating g on permafrost landscapes is somewhat challenging because the hydraulic conductivity of permafrost could be as low as that of bedrock under some conditions. Due to this reason, we find it more suitable to use the maximum depth of the active layer for estimating g on these landscapes, for example, by setting g at 2 m for the regions where mean annual temperature is below −2 ∘C, i.e., assuming that the southern boundary of permafrost could be approximated by the −2 ∘C isotherm of mean annual temperature (Riseborough et al., 2008) and that the active-layer thickness does not exceed 2 m. The latter is an ad hoc assumption based on the recent discussion of uncertainties in the methods for estimating active-layer thickness at a regional scale (Mishra et al., 2017).
To determine the present-day peatland extent, we relied on the WISE30sec data set (Batjes, 2016) of soil properties at a 30′′ resolution. The data set contains a classification of soil type for each mapping unit and to diagnose peatland extent we determined the fraction of each grid cell covered by soils of histosol type (soil code HS in FAO90 classification). These data allow us to estimate the fP,obs values at the cells of the geographic grid (Fig. 2), ranging from 10 to 30 % in 45 % of the total area north of 45∘ N covered by histosols. The grid cells where fP,obs exceeds 70 % occupy 11 % of the total area of this region.
Our calculations show that the total area that peatlands occupy in the land north of 45∘ N is equal to 2.86×10⁶ km2. This estimate of the peatland area is within the recent estimates of 2–4 million square kilometers (see review in Yu, 2012). The estimates of the actual peatland area may vary depending on the criteria, such as the minimal depth of the peat layer that is used to define peatland (Xu et al., 2018). Since our peatland extent is diagnosed by the extent of histosols, 2.86×10⁶ km2 should be interpreted as an estimate of the area of peatlands with peat depth exceeding 40 cm according to FAO definition of histosols.
2.3 Uncertainty associated with peatlands distribution over a grid cell
The gridded data on soil properties (Batjes, 2016) provide the fraction of a grid cell covered by peatlands. To estimate the fraction of a watershed covered by peatlands, fPW, which is needed for calculating hmax, one should make an assumption about the peatland distribution within the grid cell. This problem can be illustrated with the following example. The fact that 36 % of a grid cell is covered by peatlands () may mean that peatlands cover 36 % of each watershed within the grid cell (fPW=0.36) or that only 48 % of watersheds are occupied by peatlands (fWP=0.48) and peatlands cover 75 % of each of these watersheds (fPW=0.75; ).
We address this uncertainty by giving three estimates of the potential amount of carbon that could be accumulated in northern peatlands: the uniform estimate, the clumped estimate, and the conductivity-dependent estimate. The uniform estimate assumes a uniform distribution of peatlands over all grid cells (; fWP=1), the clumped estimate assumes a nonuniform distribution over all grid cells (fPW=0.75; ), and the conductivity-dependent estimate is derived using a rule-based algorithm categorizing the grid cells into those where peatland distribution is uniform, and those where peatland distribution is nonuniform. The value of the hydraulic conductivity coefficient, K, calculated from the amount of annual precipitation, potential evapotranspiration, fP,obs, and g (see the Supplement) is used in this algorithm as an indicator of nonuniform peatland distribution within a grid cell. If K is above the typical value, Kc, then it can be assumed that peatland occupy fraction of watersheds and cover fP,est fraction of area of each of these watersheds, where fP,est is set at the value that brings K to Kc.
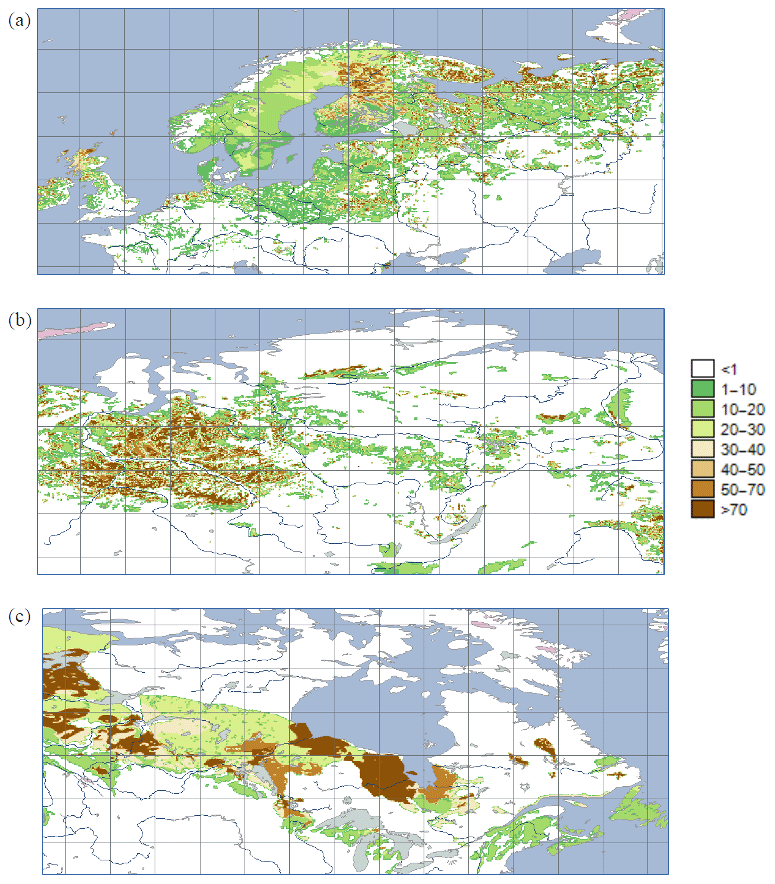
Figure 2The fraction of histosols ( %) in Europe (a), western Siberia (b), and Canada (c).
The typical values of hydraulic conductivity vary in a relatively wide range. Due to this reason, we set Kc at the value that leads the estimate of the potential carbon stocks in northern peatlands to that implied by the peat decomposition model employed by Yu (Yu, 2011). This model suggests that the growth of carbon stock in peatlands is limited by the ratio of annual carbon input to catotelm to the decay constant. Based on the data from peat cores, the annual carbon input to catotelm is estimated at 74.8 Tg C yr−1 and decay constant at 0.0000855 yr−1 (Yu, 2011). Thus, the potential carbon stock in northern peatlands could be estimated at 875 Pg C (i.e., 74.8 Tg C yr−1/0.0000855 yr−1), and due to uncertainty in the annual carbon input to catotelm and decay constant may range from 750 to 1000 Pg C (see the Supplement). Therefore, we set Kc at the value that makes the conductivity-dependent estimate of the potential carbon stocks in northern peatlands equal to 875 Pg C, namely at 157 m yr−1 ( m s−1),.
This approach to address uncertainty is illustrated in Table 1, where the estimates of potential peat carbon density in the central part of peatlands are compared to the values observed at 33 peatland sites (Billings, 1987; Borren et al., 2004; Jones et al., 2009; Robinson, 2006; Turunen et al., 2001; Yu et al., 2009). As it can be seen from Table 1, the estimates of the potential peat carbon density based on the uniform interpretation of fP,obs (; fWP=1) are often lower than the actual peat carbon density at the sites that fall within the cells where fP,obs is low. For example, the actual peat carbon density at a raised bog site in Finland (no. 30) – located in a cell that is 6 % covered by peatlands – is equal to 214 kg C m−2, whereas the estimate of the potential peat carbon density based on the uniform interpretation of fP,obs is equal to 65 kg C m−2. This example shows that in this case assuming a uniform distribution of peatlands could be wrong. The clumped interpretation of fP,obs (fPW=0.75; fWP=0.08) gives a much higher value of the potential peat carbon density, 1350 kg C m−2, that, in its turn, may overestimate the potential peat carbon density at this site if the bog covers less than 75 % of the watershed area. The conductivity-dependent interpretation of fP,obs (for Kc=157 m yr−1) suggests that the bog covers 53 % of the watershed area and its potential peat carbon density is equal to 636 kg C m−2.
Table 1Potential peat carbon density in the central part of peatland estimated under uniform (PCD1) and clumped (PCD2) interpretation of fP, obs, as compared to the observed peat carbon density (PCD0) at 33 peatland sites (Yu et al., 2009).
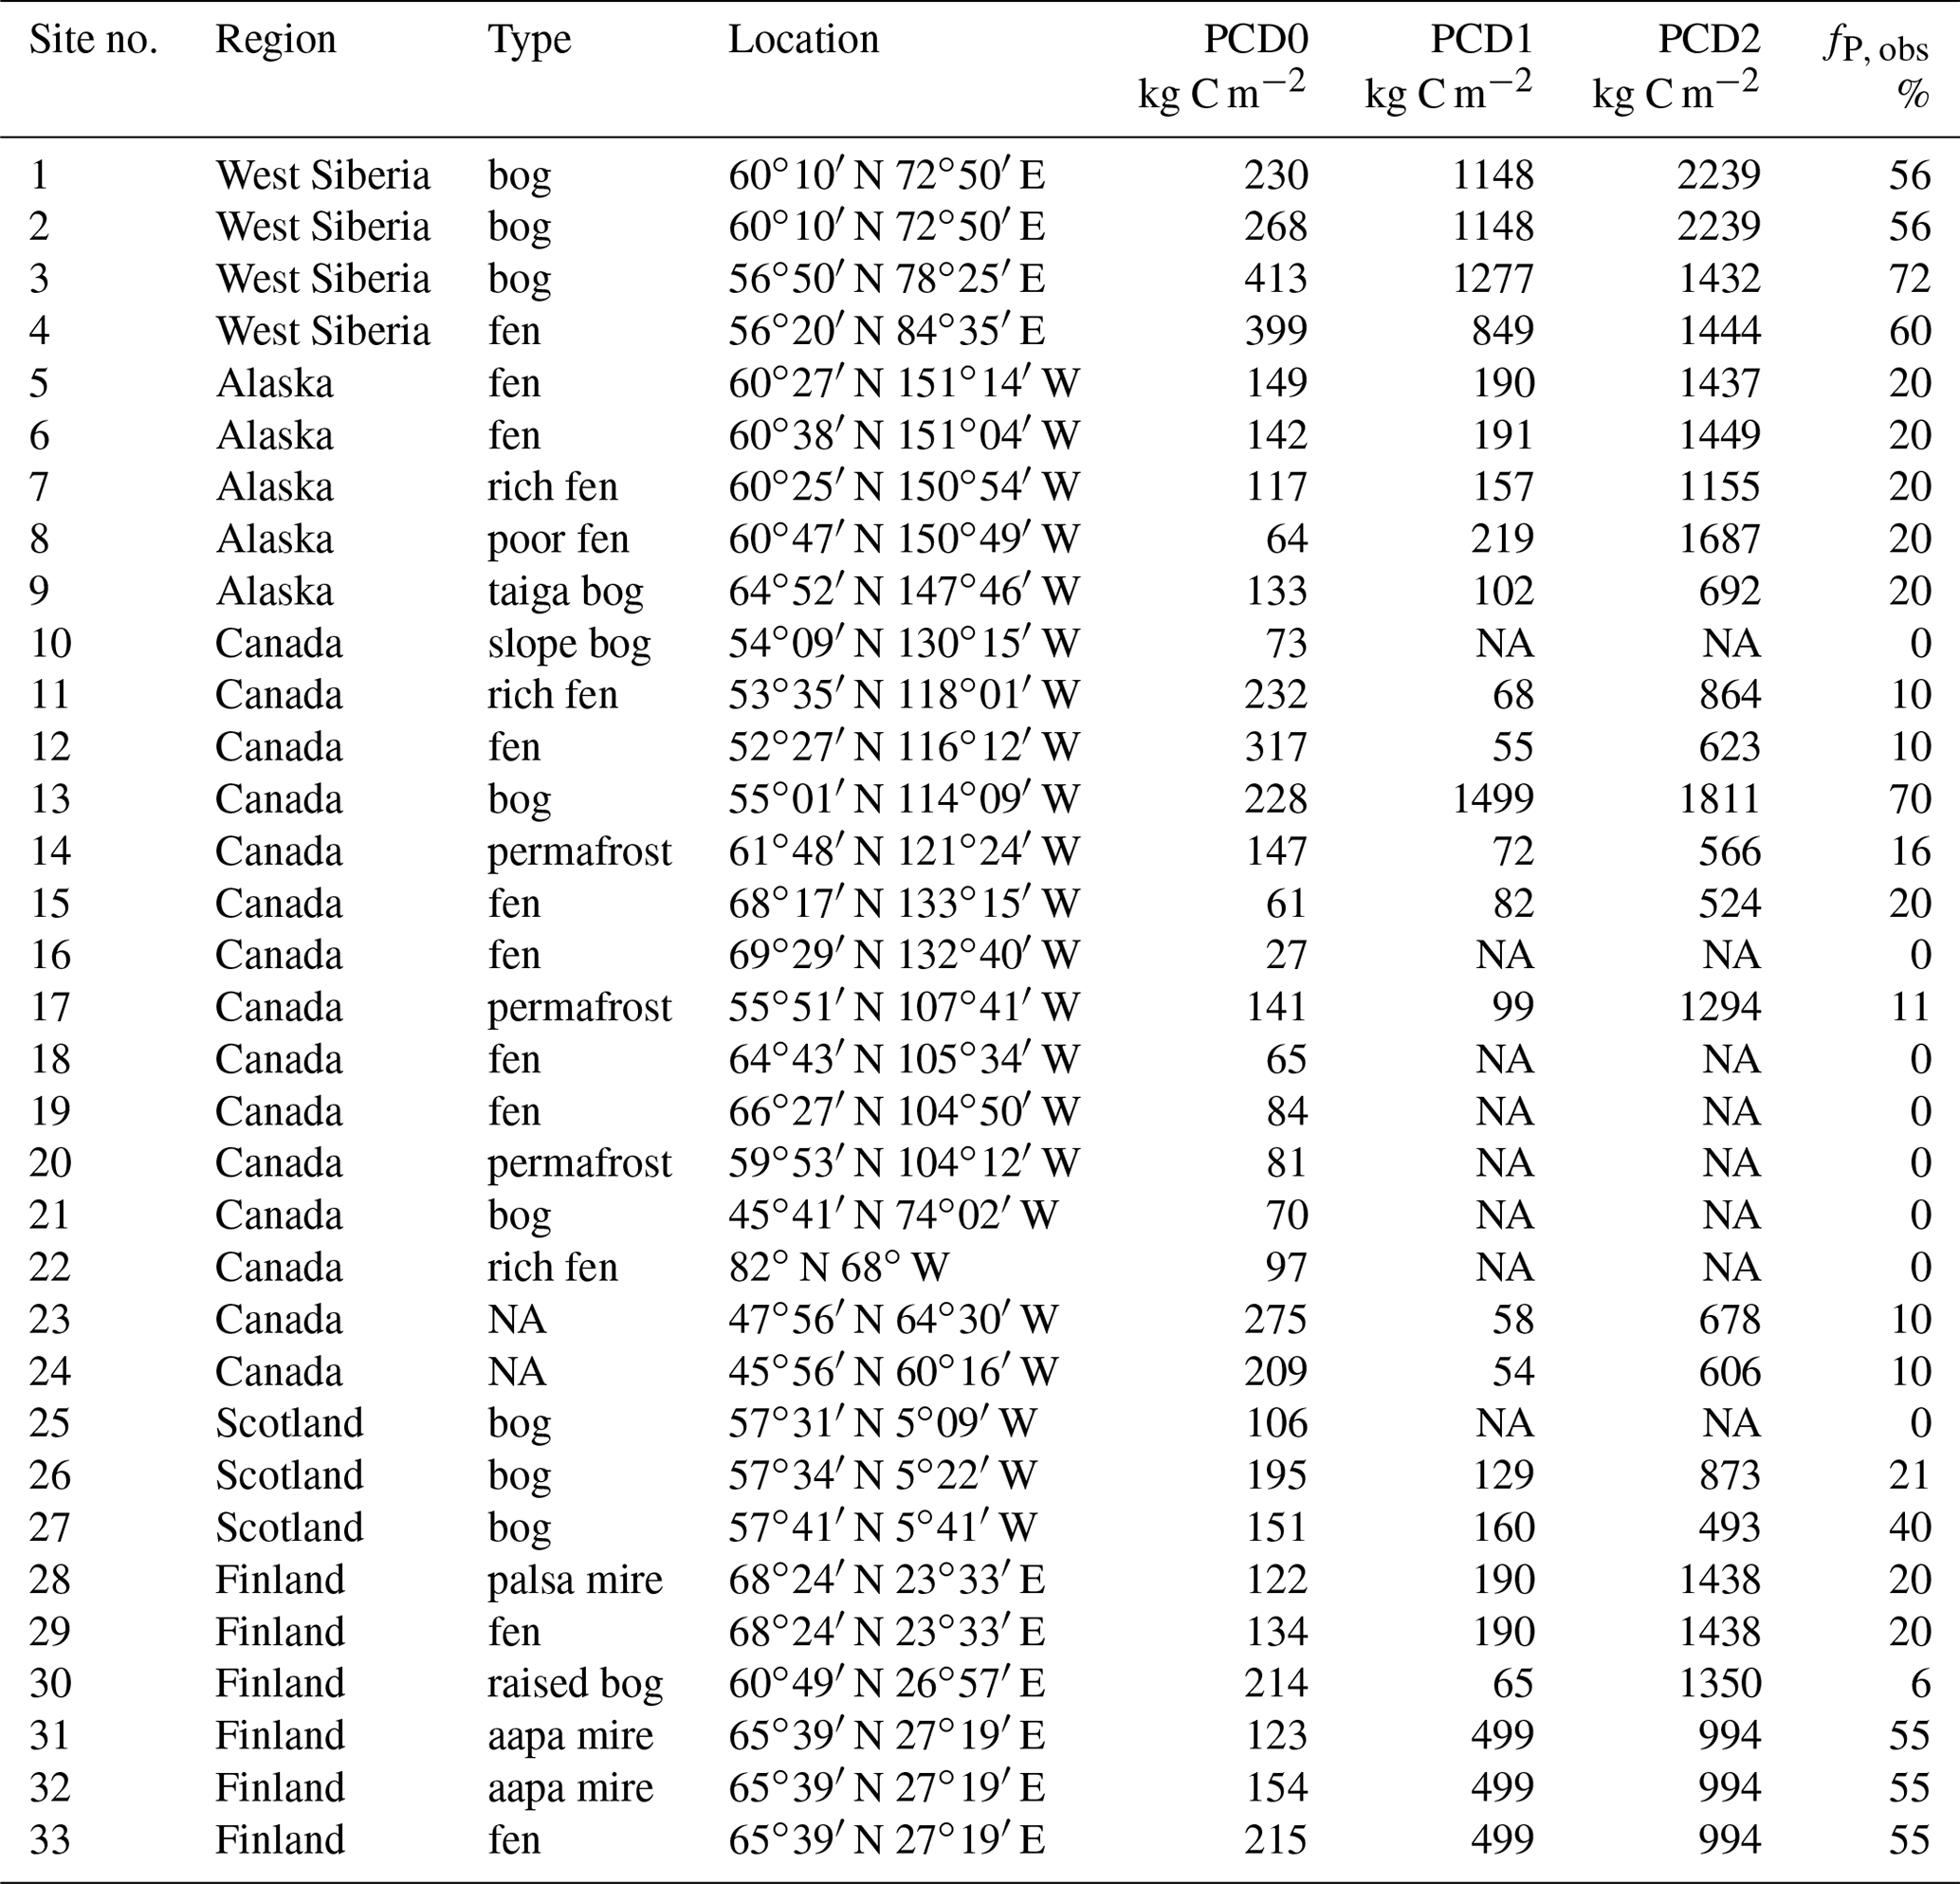
NA: not available.
The conductivity-dependent estimates of the potential carbon stocks in the cells of geographic grid for Kc=157 m yr−1 are shown in Fig. 3 (in kilotons of C per square kilometer of the cell area). They exceed 20 Kt C km−2 at 54 % of the total area of the region formed by the grid cells north of 45∘ N covered by peatlands. The grid cells where potential carbon stocks exceed 200 Kt C km−2 occupy 10 % of the total area of this region. In the subregion of this region, where the mean annual temperature is below −2 ∘C, the estimates of potential carbon stocks do not exceed 100 Kt C km−2. At 73 % of the total area of this subregion, they are lower than 20 Kt C km−2.
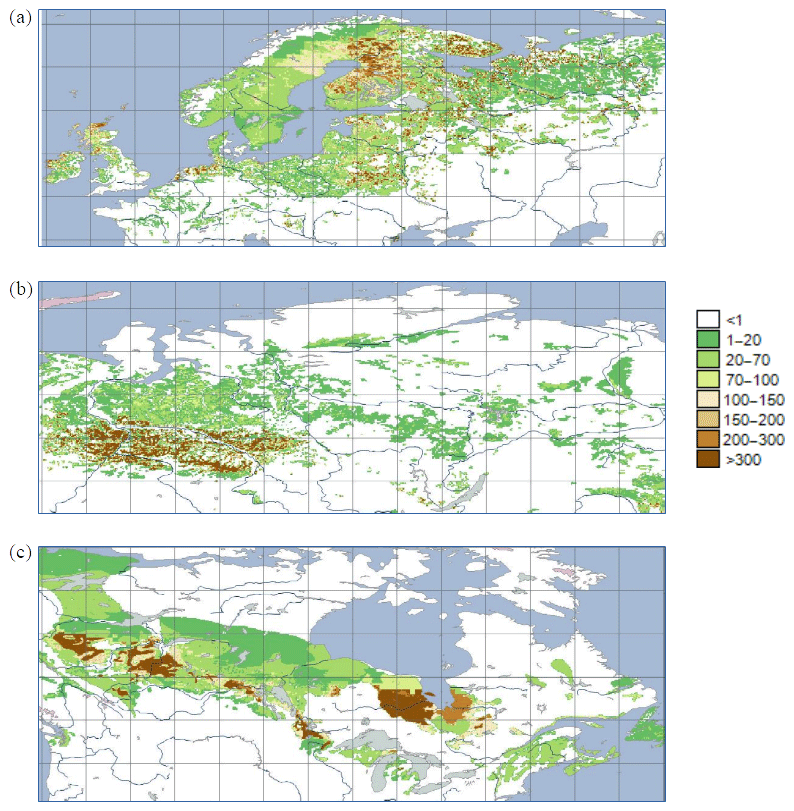
Figure 3The conductivity-dependent estimate of the potential carbon stocks in northern peatlands per area of a grid cell (×109 g C km−2) in Europe (a), western Siberia (b), and Canada (c).
The sum of the potential carbon stocks for all cells north of 45∘ N gives the conductivity-dependent estimate of the potential carbon stock in northern peatlands, which is equal to 875 Pg C.
Since northern peatlands have already accumulated 547±74 Pg C (Yu, 2011), the conductivity-dependent estimate of their potential carbon stock suggests that the total amount of carbon that they could remove from the atmosphere during the period from the present to the end of the current interglacial is limited to 328±74 Pg C.
The full range of uncertainty for the estimate of the amount of carbon that northern peatlands may accumulate from the start to the end of the current interglacial could be characterized by the uniform and clumped estimates. The former is equal to 665 Pg C, and the latter is equal to 1258 Pg C. However, our study shows that neither uniform interpretation nor clumped interpretation of the data on peatland extent is applicable everywhere, and hence the most likely range of uncertainty could be narrower than 665–1258 Pg C.
Thus, the information presented in the Table 1 casts some doubts on the validity of uniform interpretation of the data on peatland extent in the case of grid cells where fP,obs is less than 20 %. Actual peat carbon densities observed at the sites that fall within such cells are higher than uniform estimates. This could mean that there are a few large peatlands but not many small peatlands in these grid cells, and that clumped interpretation could be more appropriate in this case. The fact that clumped estimates are significantly higher than observed carbon densities suggests that the sites listed in the Table 1 are far from equilibrium and would accumulate a large amount of carbon by the end of the current interglacial.
The limits to northern peatlands carbon stock were estimated here for the first time, although the methodology for obtaining such estimates were developed more than 30 years ago by Clymo (1984). We adapted this methodology for use at the Earth System scale based on gridded data (Hengl et al., 2014) representing geomorphological aspects of peat bog growth.
We also characterized the uncertainty in the estimate of the limits to northern peatlands carbon stock induced by sub-grid distribution of peatlands. This uncertainty cannot be easily reduced by using a finer grid because it cannot be expected that each watershed falls within one grid cell. Therefore, we use an approach to reducing uncertainty in the spatial distribution of peatlands that allows us to obtain a most likely estimate of 875 Pg C.
Analyzing the uncertainty in the data on present-day peatland extent goes beyond the scope of this study. Improving the accuracy and representativeness of these input data sets used in this study is actively tackled by the International Soil Reference and Information Centre (Batjes, 2016; Hengl et al., 2014) and by networks of peatland researchers such as C-Peat (e.g., Treat et al., 2019) and PeatDataHub (Xu et al., 2018). Hence, it might be more important to update the estimates of potential carbon stocks on a regular basis to keep pace with improvements in the accuracy of the data on present-day peatland extent.
The results of our study suggest that even the uniform estimate of the potential carbon stocks (665 Pg C) is still higher than Gorham's (1991) estimate of 455 Pg C in the actual carbon stocks of northern peatlands. Gorham's estimate, based on peat-volume approach (Yu, 2012), is the product of the four numbers: mean depth of peatlands (2.3 m), mean bulk density of peat (112 kg m−3), carbon content of its dry mass (0.517), and the area of peatlands (3.42×10¹² m2). Our uniform estimate of potential carbon stocks implies that the potential mean depth of peat could be as high as 4 m for the same values of mean bulk density of peat and carbon content of its dry mass, and for smaller area of peatlands (2.86×10¹² m2). The uniform estimate is also higher than the Yu et al.'s (2010) estimate of actual carbon stocks of 547±74 Pg C, based on the time history approach (Yu, 2012), suggesting that northern peatlands in total would accumulate in the future more carbon than they store now.
The clumped estimate of 1258 Pg C is beyond the range of uncertainty of 760–1006 Pg C in the estimate of potential carbon stocks that could be derived using the Yu (2011) model of peat accumulation (see the Supplement). Hence, it is reasonable to argue that our estimate of 875±125 Pg C, as obtained from two independent methods, is the most expedient estimate of potential carbon stocks in northern peatlands. As such, the estimate of 330±200 Pg C is the most likely amount of carbon that peatlands would remove from the atmosphere during the period from the present to the end of the current interglacial.
The estimate of potential carbon stocks of 875±125 Pg C, corresponds to the present climate, assuming that the present climate is typical for the remainder of the present interglacial period. This assumption, however, might not be justified considering the scenarios of dramatic changes in the Earth System that may jeopardize peatlands development. The recent analysis of mitigation pathways compatible with global warming of 1.5 ∘C above pre-industrial levels (Rogelj et al., 2018) shows that holding the global average temperature increase to well below 2 ∘C is difficult but not impossible. To achieve this goal, cumulative CO2 emissions from the start of 2018 until the time of net zero global emissions must be kept well below 1430 Pg CO2 (i.e., 390 Pg C), which corresponds to 66th percentile of transient climate response to cumulative carbon emissions (Rogelj et al., 2018; their Table 2.2). Since cumulative anthropogenic CO2 emissions to the year 2017 are estimated at 610 Pg C (Le Quéré et al., 2018), and the future cumulative emissions compatible with the global average temperature increase to below 2 ∘C are estimated at 390 Pg C, 1000 Pg C (i.e., 610 Pg C + 390 Pg C) of cumulative carbon emissions could be considered a threshold for defining the range of validity of the most expedient estimate of potential carbon stocks in northern peatlands. In summary, if cumulative carbon emissions do not exceed 1000 Pg C, the northern peatlands could play an important role in global carbon cycle recovery.
The ultimate recovery of the global carbon cycle from anthropogenic perturbations is a long-term process (Archer, 2005). The current understanding of this process suggests that oceans absorb the majority of cumulative carbon dioxide emission within several centuries, the small portion within several thousand years, and the remaining part will be removed through weathering of silicate rocks that may take hundreds of thousands of years (Archer, 2005; Archer and Brovkin, 2008; Brault et al., 2017). In other words, the larger the perturbation of the Earth System, the smaller the chances that the pre-industrial state will be restored in course of the current interglacial.
Northern peatlands accumulate organic carbon and serve as a slow but persistent land carbon sink since the beginning of the current interglacial. If there were no limits to their growth in the absence of anthropogenic or natural CO2 sources to the atmosphere, they could eventually reduce the atmospheric carbon dioxide concentration to the level at which a next orbital-driven decline in the summer insolation in the high northern latitudes would trigger the onset of next glaciation.
Our study, however, shows that the cumulative carbon removal from the atmosphere associated with the natural development of peatland ecosystems is limited. The most likely estimate of the potential sink of 875±125 Pg C in northern peatlands was obtained under the assumption that the present climate is somewhat typical for the current interglacial period. Unless future scenarios of climate changes in the Earth System moved beyond the climate space for northern peatlands, northern peatlands would play an important role in global carbon cycle recovery from anthropogenic emissions. While studies of this recovery process are now mostly focused on the strength and capacity of the ocean carbon sink, our results offer a new perspective for the future research on global carbon cycle recovery and on the mitigation measures needed to protect northern peatlands as an important element of the Earth's climate system.
All data used in this study are available from public databases or literature, which are cited in the Methods section. The data produced in course of this work are available from Georgii A. Alexandrov (g.alexandrov@ifaran.ru) upon request.
The supplement related to this article is available online at: https://doi.org/10.5194/bg-17-47-2020-supplement.
All authors contributed to the conception of the work, data processing, and writing of the paper. GAA drafted the manuscript with input from VAB, TK, and ZY.
The authors declare that they have no conflict of interest.
Georgii A. Alexandrov acknowledges funding by the Russian Foundation for Basic Research under research project no. 19-05-00534. The paper was initiated during a visit of Georgii A. Alexandrov to the Land in the Earth System Department of the Max Planck Institute of Meteorology in 2017. The comments of anonymous reviewers helped us to improve the original manuscript.
This research has been supported by the Russian Foundation for Basic Research (RFBR grant no. 19-05-00534).
The article processing charges for this open-access
publication were covered by the Max Planck Society.
This paper was edited by Kirsten Thonicke and reviewed by three anonymous referees.
Adams, J. M. and Faure, H.: A new estimate of changing carbon storage on land since the last glacial maximum, based on global land ecosystem reconstruction, Glob. Planet. Change, 16/17, 3–24, https://doi.org/10.1016/S0921-8181(98)00003-4, 1998.
Alexandrov, G. A., Brovkin, V. A., and Kleinen, T.: The influence of climate on peatland extent in Western Siberia since the Last Glacial Maximum, Sci. Rep., 6, 24784, https://doi.org/10.1038/srep24784, 2016.
Archer, D.: Fate of fossil fuel CO2 in geologic time, J. Geophys. Res.-Ocean., 110, C09S05, https://doi.org/10.1029/2004JC002625, 2005.
Archer, D. and Brovkin, V.: The millennial atmospheric lifetime of anthropogenic CO2, Climatic Change, 90, 283–297, https://doi.org/10.1007/s10584-008-9413-1, 2008.
Batjes, N. H.: Harmonized soil property values for broad-scale modelling (WISE30sec) with estimates of global soil carbon stocks, Geoderma, 269, 61–68, https://doi.org/10.1016/j.geoderma.2016.01.034, 2016.
Berger, B., Crucifix, M., Hodell, D. A., Mangili, C., McManus, J. F., Otto-Bliesner, B., Pol, K., Raynaud, D., Skinner, L. C., Tzedakis, P. C., Wolff, E. W., Yin, Q. Z., Abe-Ouchi, A., Barbante, C., Brovkin, V., Cacho, I., Capron, E., Ferretti, P., Ganopolski, A., Grimalt, J. O., Hönisch, B., Kawamura, K. A., Landais, A., Margari, V., Martrat, B., Masson-Delmotte, V., Mokeddem, Z., Parrenin, F., Prokopenko, A. A., Rashid, H., Schulz, M., and Vazquez Riveiros, N.: Interglacials of the last 800,000 years, Rev. Geophys., 54, 162–219, https://doi.org/10.1002/2015RG000482, 2016.
Billings, W. D.: Carbon balance of Alaskan tundra and taiga ecosystems: past, present and future, Quaternary Sci. Rev., 6, 165–177, https://doi.org/10.1016/0277-3791(87)90032-1, 1987.
Borren, W., Bleuten, W., and Lapshina, E. D.: Holocene peat and carbon accumulation rates in the southern taiga of western Siberia, Quaternary Res., 61, 42–51, https://doi.org/10.1016/j.yqres.2003.09.002, 2004.
Brault, M.-O., Matthews, H. D., and Mysak, L. A.: The importance of terrestrial weathering changes in multimillennial recovery of the global carbon cycle: a two-dimensional perspective, Earth Syst. Dynam., 8, 455–475, https://doi.org/10.5194/esd-8-455-2017, 2017.
Clymo, R. S.: The Limits to Peat Bog Growth, Philos. T. R. Soc. B, 303, 605–654, https://doi.org/10.1098/rstb.1984.0002, 1984.
Gorham, E.: Northern peatlands: role in the carbon cycle and probable responses to climatic warming, Ecol. Appl., 1, 182–195, https://doi.org/10.2307/1941811, 1991.
Hengl, T., de Jesus, J. M., MacMillan, R. A., Batjes, N. H., Heuvelink, G. B. M., Ribeiro, E., Samuel-Rosa, A., Kempen, B., Leenaars, J. G. B., Walsh, M. G., and Gonzalez, M. R.: SoilGrids1km – Global Soil Information Based on Automated Mapping, PLoS One, 9, e105992, https://doi.org/10.1371/journal.pone.0105992, 2014.
Ingram, H. A. P.: Size and shape in raised mire ecosystems: a geophysical model, Nature, 297, 300–303, https://doi.org/10.1038/297300a0, 1982.
Jones, M. C., Peteet, D. M., Kurdyla, D., and Guilderson, T.: Climate and vegetation history from a 14,000-year peatland record, Kenai Peninsula, Alaska, Quaternary Res., 72, 207–217, https://doi.org/10.1016/j.yqres.2009.04.002, 2009.
Le Quéré, C., Andrew, R. M., Friedlingstein, P., Sitch, S., Pongratz, J., Manning, A. C., Korsbakken, J. I., Peters, G. P., Canadell, J. G., Jackson, R. B., Boden, T. A., Tans, P. P., Andrews, O. D., Arora, V. K., Bakker, D. C. E., Barbero, L., Becker, M., Betts, R. A., Bopp, L., Chevallier, F., Chini, L. P., Ciais, P., Cosca, C. E., Cross, J., Currie, K., Gasser, T., Harris, I., Hauck, J., Haverd, V., Houghton, R. A., Hunt, C. W., Hurtt, G., Ilyina, T., Jain, A. K., Kato, E., Kautz, M., Keeling, R. F., Klein Goldewijk, K., Körtzinger, A., Landschützer, P., Lefèvre, N., Lenton, A., Lienert, S., Lima, I., Lombardozzi, D., Metzl, N., Millero, F., Monteiro, P. M. S., Munro, D. R., Nabel, J. E. M. S., Nakaoka, S., Nojiri, Y., Padín, X. A., Peregon, A., Pfeil, B., Pierrot, D., Poulter, B., Rehder, G., Reimer, J., Rödenbeck, C., Schwinger, J., Séférian, R., Skjelvan, I., Stocker, B. D., Tian, H., Tilbrook, B., van der Laan-Luijkx, I. T., van der Werf, G. R., van Heuven, S., Viovy, N., Vuichard, N., Walker, A. P., Watson, A. J., Wiltshire, A. J., Zaehle, S., and Zhu, D.: Global Carbon Budget 2017, Earth Syst. Sci. Data, 10, 405–448, https://doi.org/10.5194/essd-10-405-2018, 2018.
Loisel, J., Yu, Z., Beilman, D. W., Camill, P., Alm, J., Amesbury, M. J., Anderson, D., Andersson, S., Bochicchio, C., Barber, K., Belyea, L. R., Bunbury, J., Chambers, F. M., Charman, D. J., De Vleeschouwer, F., Fiałkiewicz-Kozieł, B., Finkelstein, S. A., Gałka, M., Garneau, M., Hammarlund, D., Hinchcliffe, W., Holmquist, J., Hughes, P., Jones, M. C., Klein, E. S., Kokfelt, U., Korhola, A., Kuhry, P., Lamarre, A., Lamentowicz, M., Large, D., Lavoie, M., MacDonald, G., Magnan, G., Mäkilä, M., Mallon, G., Mathijssen, P., Mauquoy, D., McCarroll, J., Moore, T. R., Nichols, J., O’Reilly, B., Oksanen, P., Packalen, M., Peteet, D., Richard, P. J. H., Robinson, S., Ronkainen, T., Rundgren, M., Sannel, A. B. K., Tarnocai, C., Thom, T., Tuittila, E. S., Turetsky, M., Väliranta, M., van der Linden, M., van Geel, B., van Bellen, S., Vitt, D., Zhao, Y., and Zhou, W.: A database and synthesis of northern peatland soil properties and Holocene carbon and nitrogen accumulation, Holocene, 24, 1028–1042, https://doi.org/10.1177/0959683614538073, 2014.
Loisel, J., van Bellen, S., Pelletier, L., Talbot, J., Hugelius, G., Karran, D., Yu, Z., Nichols, J., and Holmquist, J.: Insights and issues with estimating northern peatland carbon stocks and fluxes since the Last Glacial Maximum, Earth-Sci. Rev., 165, 59–80, https://doi.org/10.1016/j.earscirev.2016.12.001, 2017.
MacDonald, G. M., Beilman, D. W., Kremenetski, K. V., Sheng, Y., Smith, L. C., and Velichko, A. A.: Rapid early development of circumarctic peatlands and atmospheric CH4 and CO2 variations, Science, 314, 285–288, https://doi.org/10.1126/science.1131722, 2006.
Mishra, U., Drewniak, B., Jastrow, J. D., Matamala, R. M., and Vitharana, U. W. A.: Spatial representation of organic carbon and active-layer thickness of high latitude soils in CMIP5 earth system models, Geoderma, 300, 55–63, https://doi.org/10.1016/j.geoderma.2016.04.017, 2017.
Raupach, M. R., Davis, S. J., Peters, G. P., Andrew, R. M., Canadell, J. G., Ciais, P., Friedlingstein, P., Jotzo, F., van Vuuren, D. P., and Le Quéré, C.: Sharing a quota on cumulative carbon emissions, Nat. Clim. Change, 4, 873–879, https://doi.org/10.1038/nclimate2384, 2014.
Riseborough, D., Shiklomanov, N., Etzelmüller, B., Gruber, S., and Marchenko, S.: Recent advances in permafrost modelling, Permafr. Periglac., 19, 137–156, https://doi.org/10.1002/ppp.615, 2008.
Robinson, S. D.: Carbon accumulation in peatlands, southwestern Northwest Territories, Canada, Can. J. Soil Sci., 86, 305–319, https://doi.org/10.4141/S05-086, 2006.
Rogelj, J., Shindell, D., Jiang, K., Fifita, S., Forster, P., Ginzburg, V., Handa, C., Kheshgi, H., Kobayashi, S., Kriegler, E., Mundaca, L., Seferian, R., and Vilarino, M. V.: Mitigation Pathways Compatible With 1.5 ∘C in the Context of Sustainable Development, in Global warming of 1.5 ∘C, IPCC Special Report, 93–174, available at: https://www.ipcc.ch/site/assets/uploads/sites/2/2019/02/SR15_Chapter2_Low_Res.pdf (last access: 8 August 2019), 2018.
Treat, C. C., Kleinen, T., Broothaerts, N., Dalton, A. S., Dommain, R., Douglas, T. A., Drexler, J. Z., Finkelstein, S. A., Grosse, G., Hope, G., Hutchings, J., Jones, M. C., Kuhry, P., Lacourse, T., Lähteenoja, O., Loisel, J., Notebaert, B., Payne, R. J., Peteet, D. M., Sannel, A. B. K., Stelling, J. M., Strauss, J., Swindles, G. T., Talbot, J., Tarnocai, C., Verstraeten, G., Williams, C. J., Xia, Z., Yu, Z., Väliranta, M., Hättestrand, M., Alexanderson, H., and Brovkin, V.: Widespread global peatland establishment and persistence over the last 130,000 year, P. Natl. Acad. Sci. USA, 116, 4822–4827, https://doi.org/10.1073/pnas.1813305116, 2019.
Turunen, J., Tahvanainen, T., Tolonen, K., and Pitkänen, A.: Carbon accumulation in West Siberian mires, Russia, Global Biogeochem. Cy., 15, 285–296, https://doi.org/10.1029/2000GB001312, 2001.
Xu, J., Morris, P. J., Liu, J., and Holden, J.: PEATMAP: Refining estimates of global peatland distribution based on a meta-analysis, Catena, 160, 134–140, https://doi.org/10.1016/j.catena.2017.09.010, 2018.
Yu, Z.: Holocene carbon flux histories of the world's peatlands: Global carbon-cycle implications, The Holocene, 21, 761–774, https://doi.org/10.1177/0959683610386982, 2011.
Yu, Z., Beilman, D. W., and Jones, M. C.: Sensitivity of Northern Peatland Carbon Dynamics to Holocene Climate Change, in: Carbon Cycling in Northern Peatlands, 55–69, 2009.
Yu, Z., Loisel, J., Brosseau, D. P., Beilman, D. W., and Hunt, S. J.: Global peatland dynamics since the Last Glacial Maximum, Geophys. Res. Lett., 37, L13402, https://doi.org/10.1029/2010GL043584, 2010.
Yu, Z. C.: Northern peatland carbon stocks and dynamics: A review, Biogeosciences, 9, 4071–4085, https://doi.org/10.5194/bg-9-4071-2012, 2012.